Zero-Liquid Discharge Treatment of Wastewater from a Fertilizer Factory

 ,
,  ,
,  ,
,
Abstract
:1. Introduction
2. Materials and Methods
2.1. Chemicals and Solutions
2.2. Analytical Methods
2.3. Flocculation Experiments
2.4. Precipitation Tests
3. Results and Discussion
3.1. Characterization of the Wastewater
3.2. Wastewater Treatment
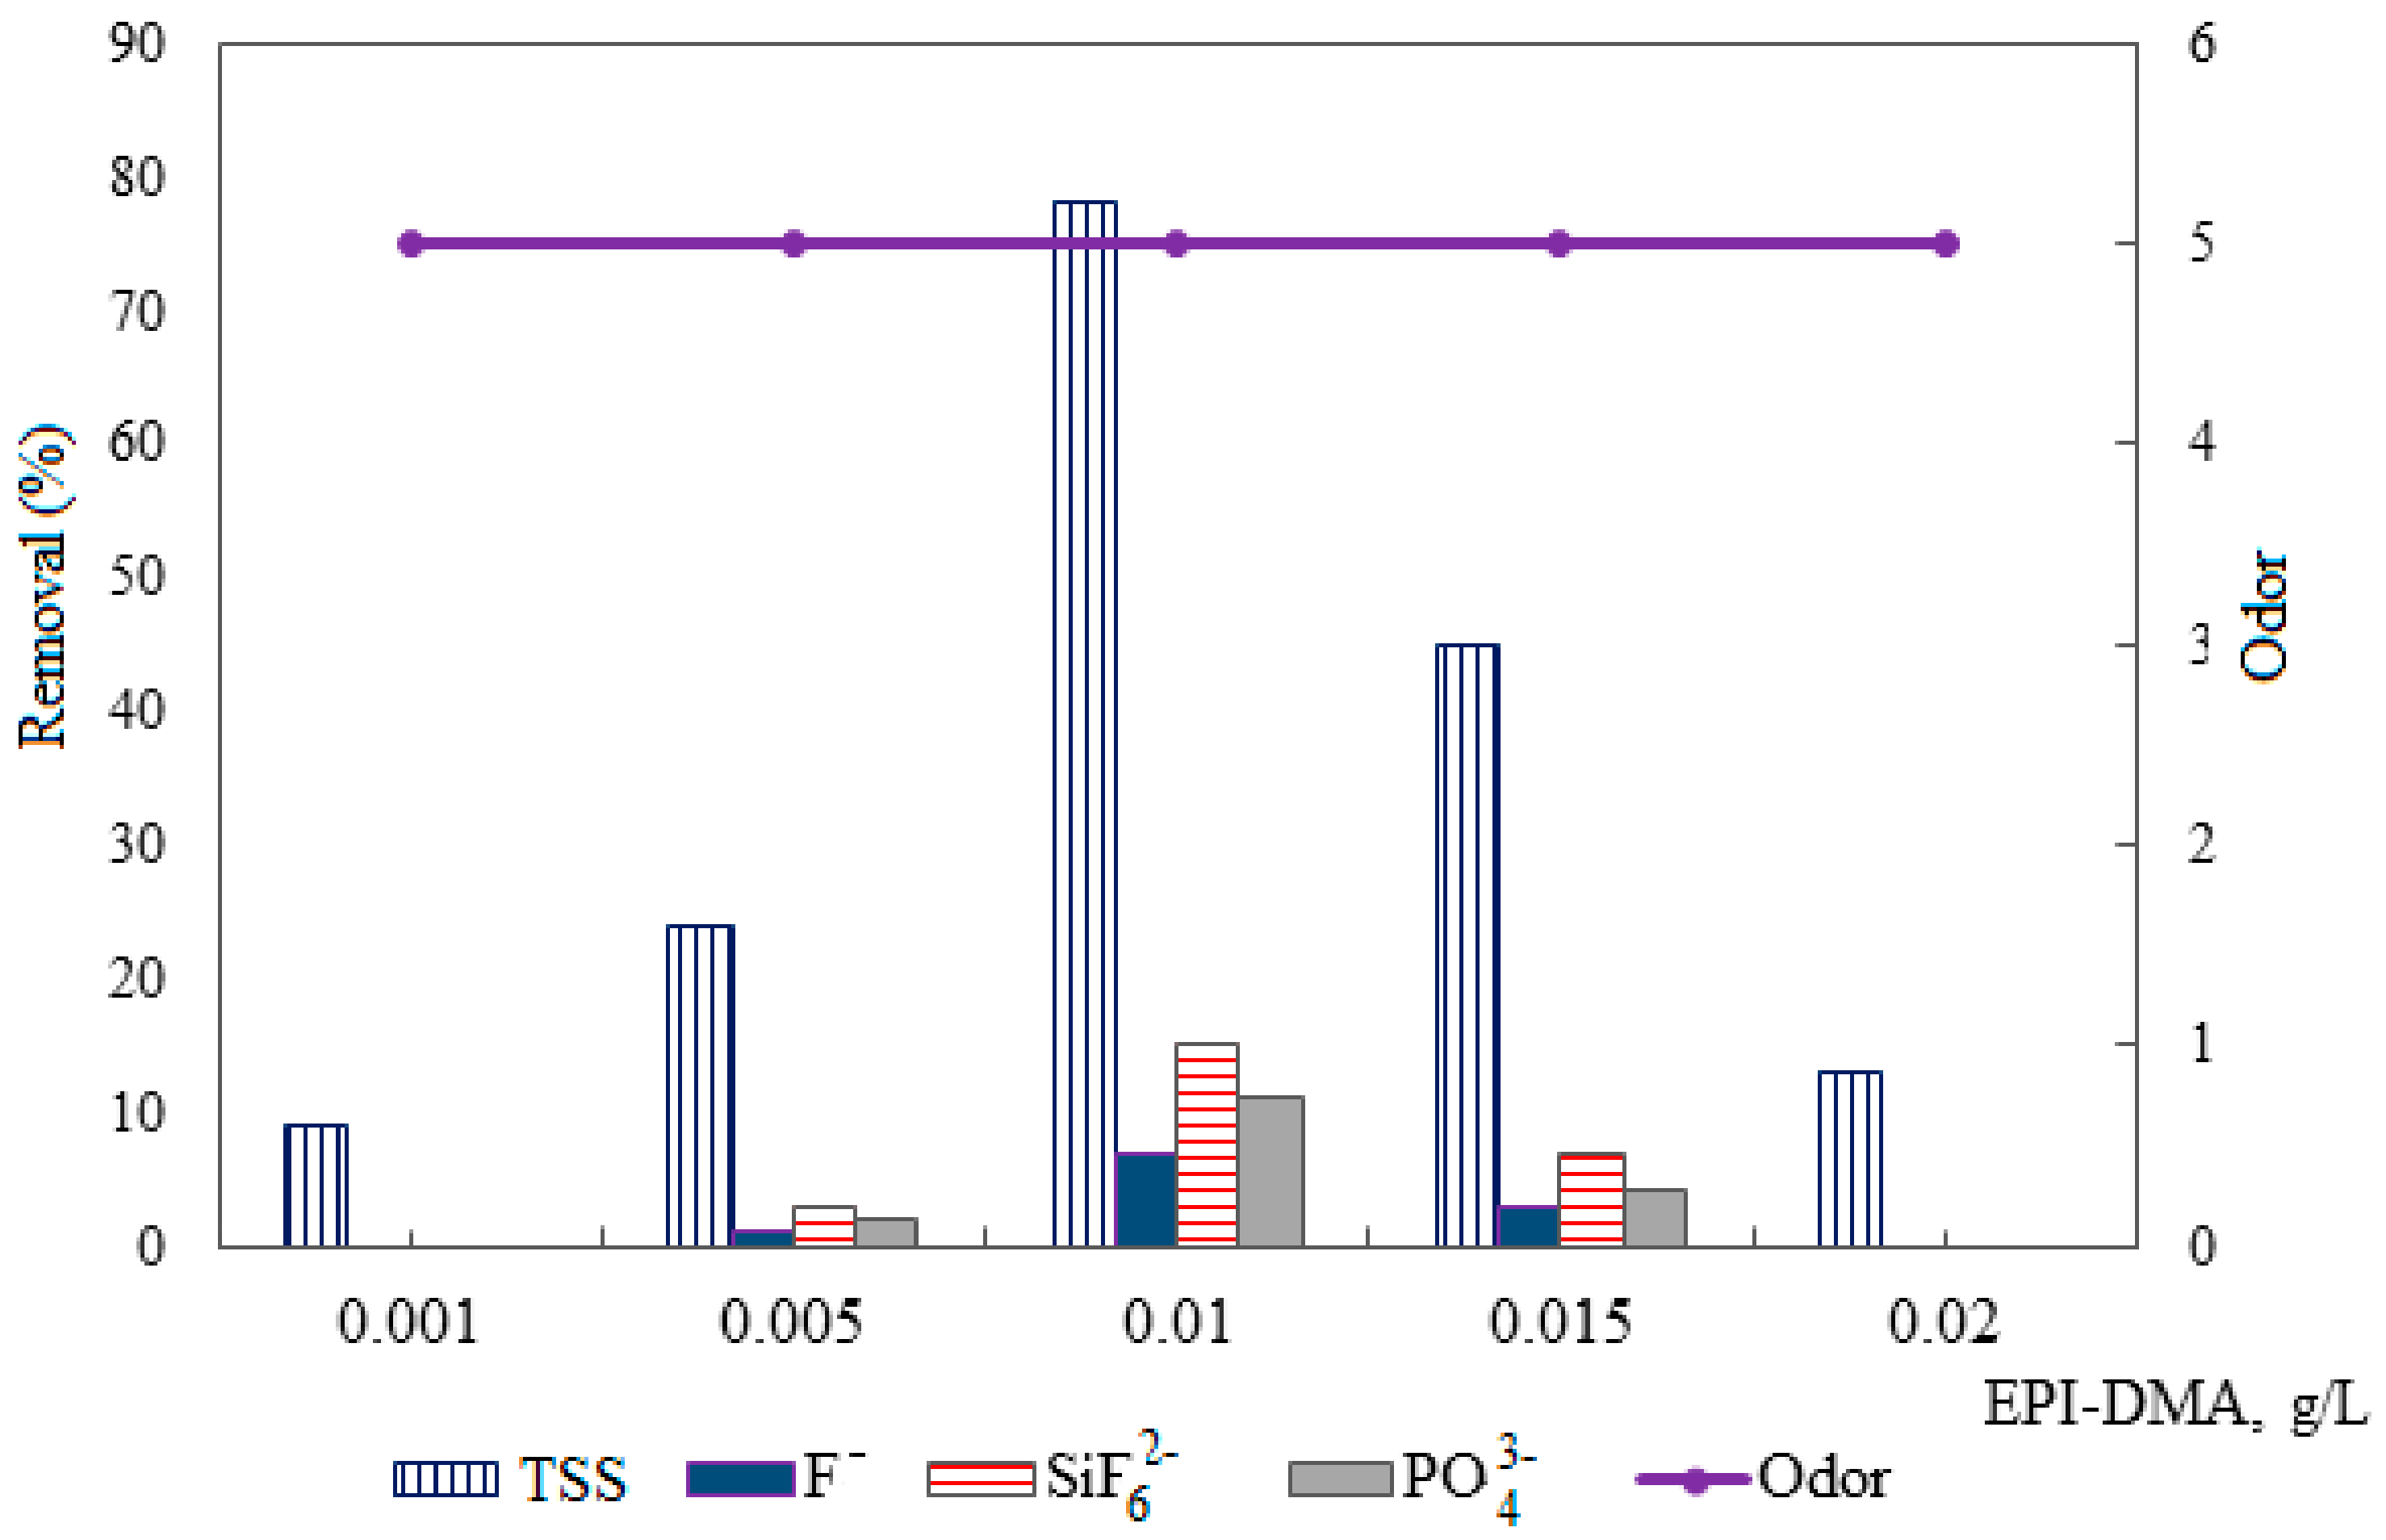
3.2.1. Effect of Flocculant
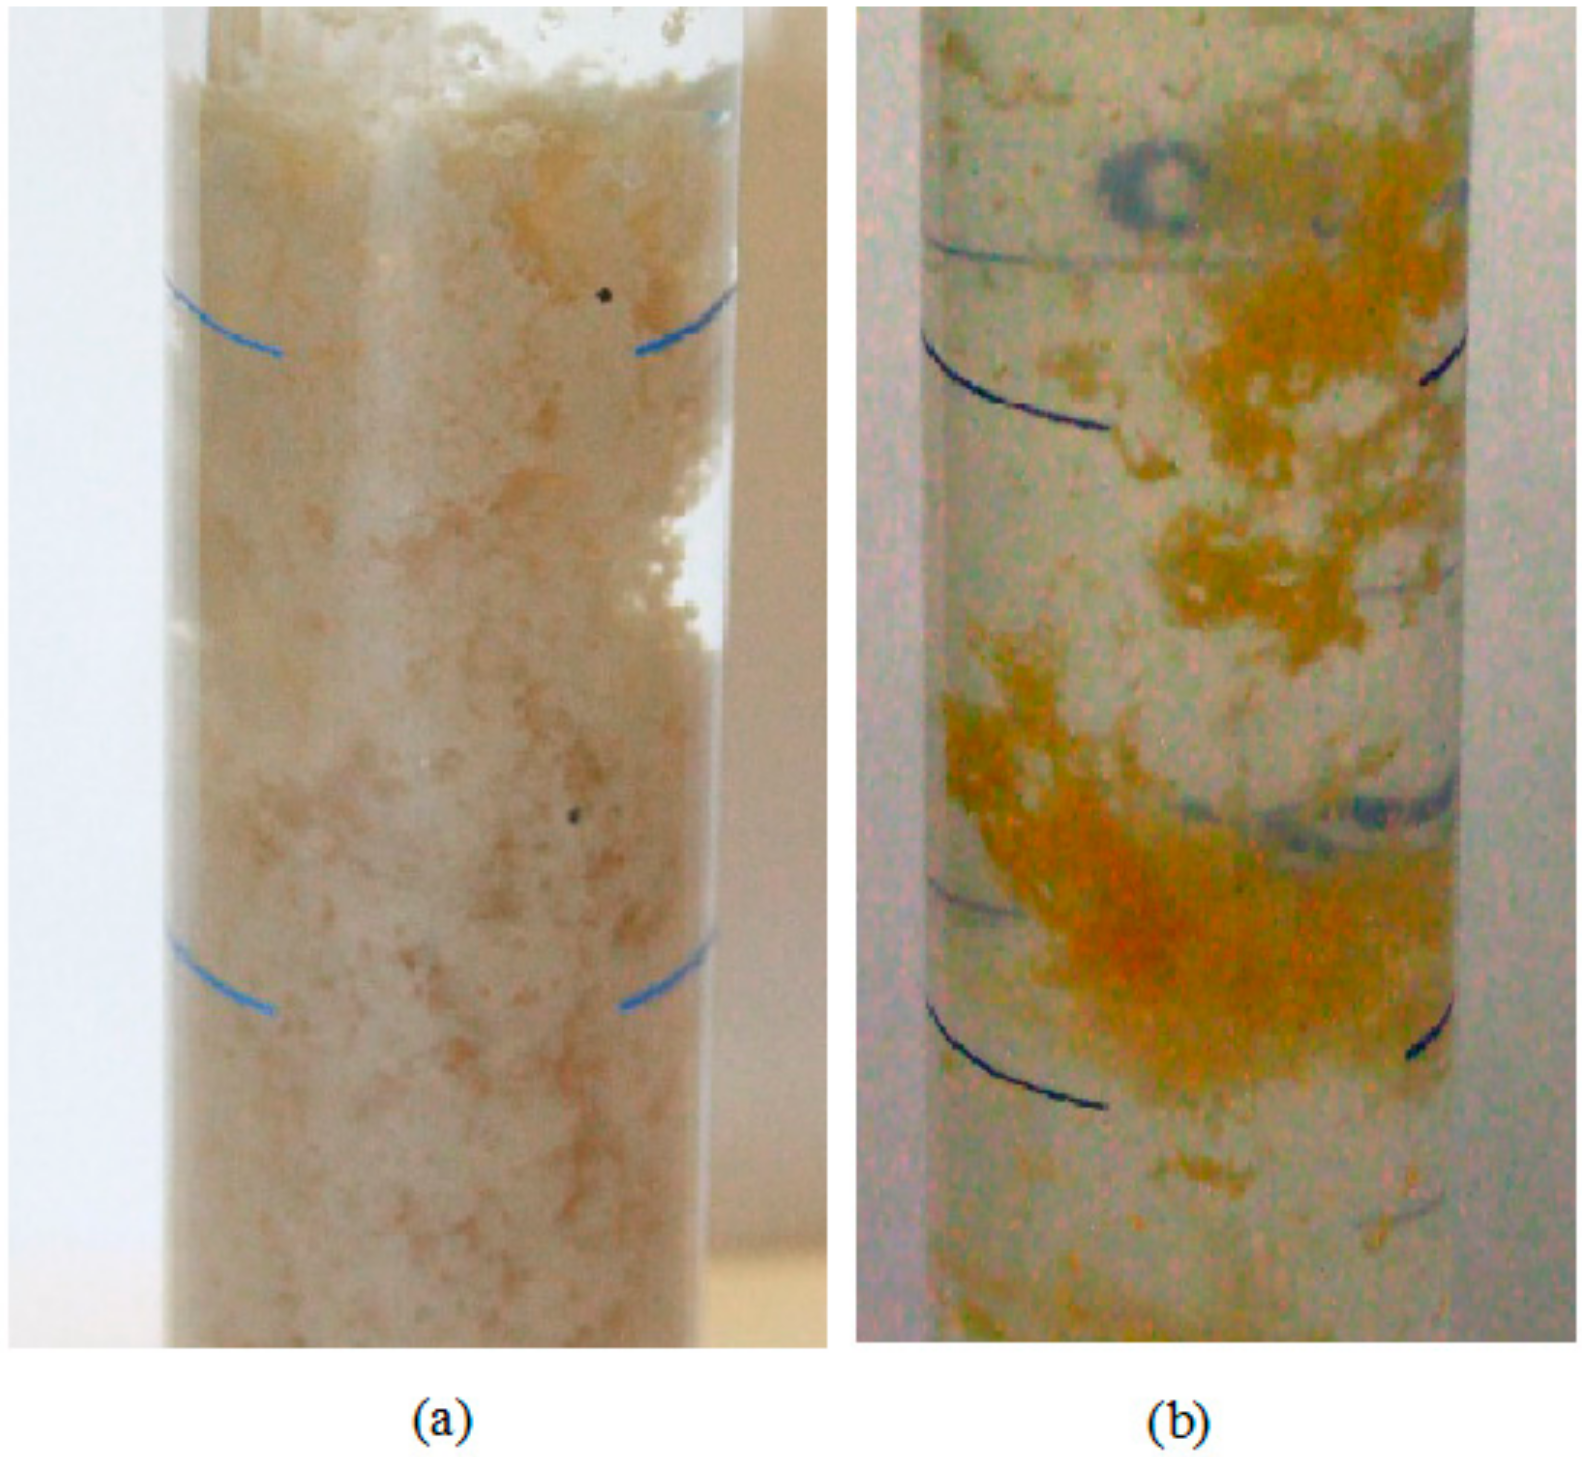
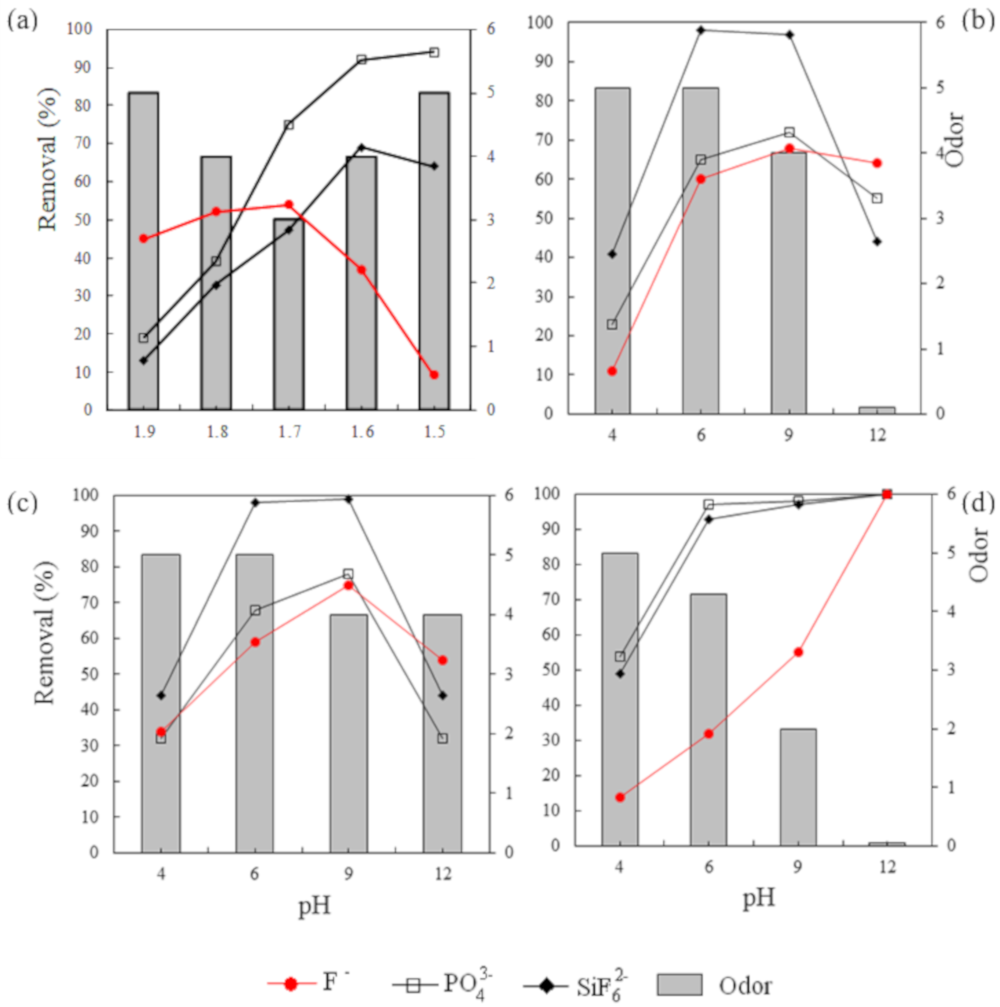
3.2.2. Effect of Sodium Salt
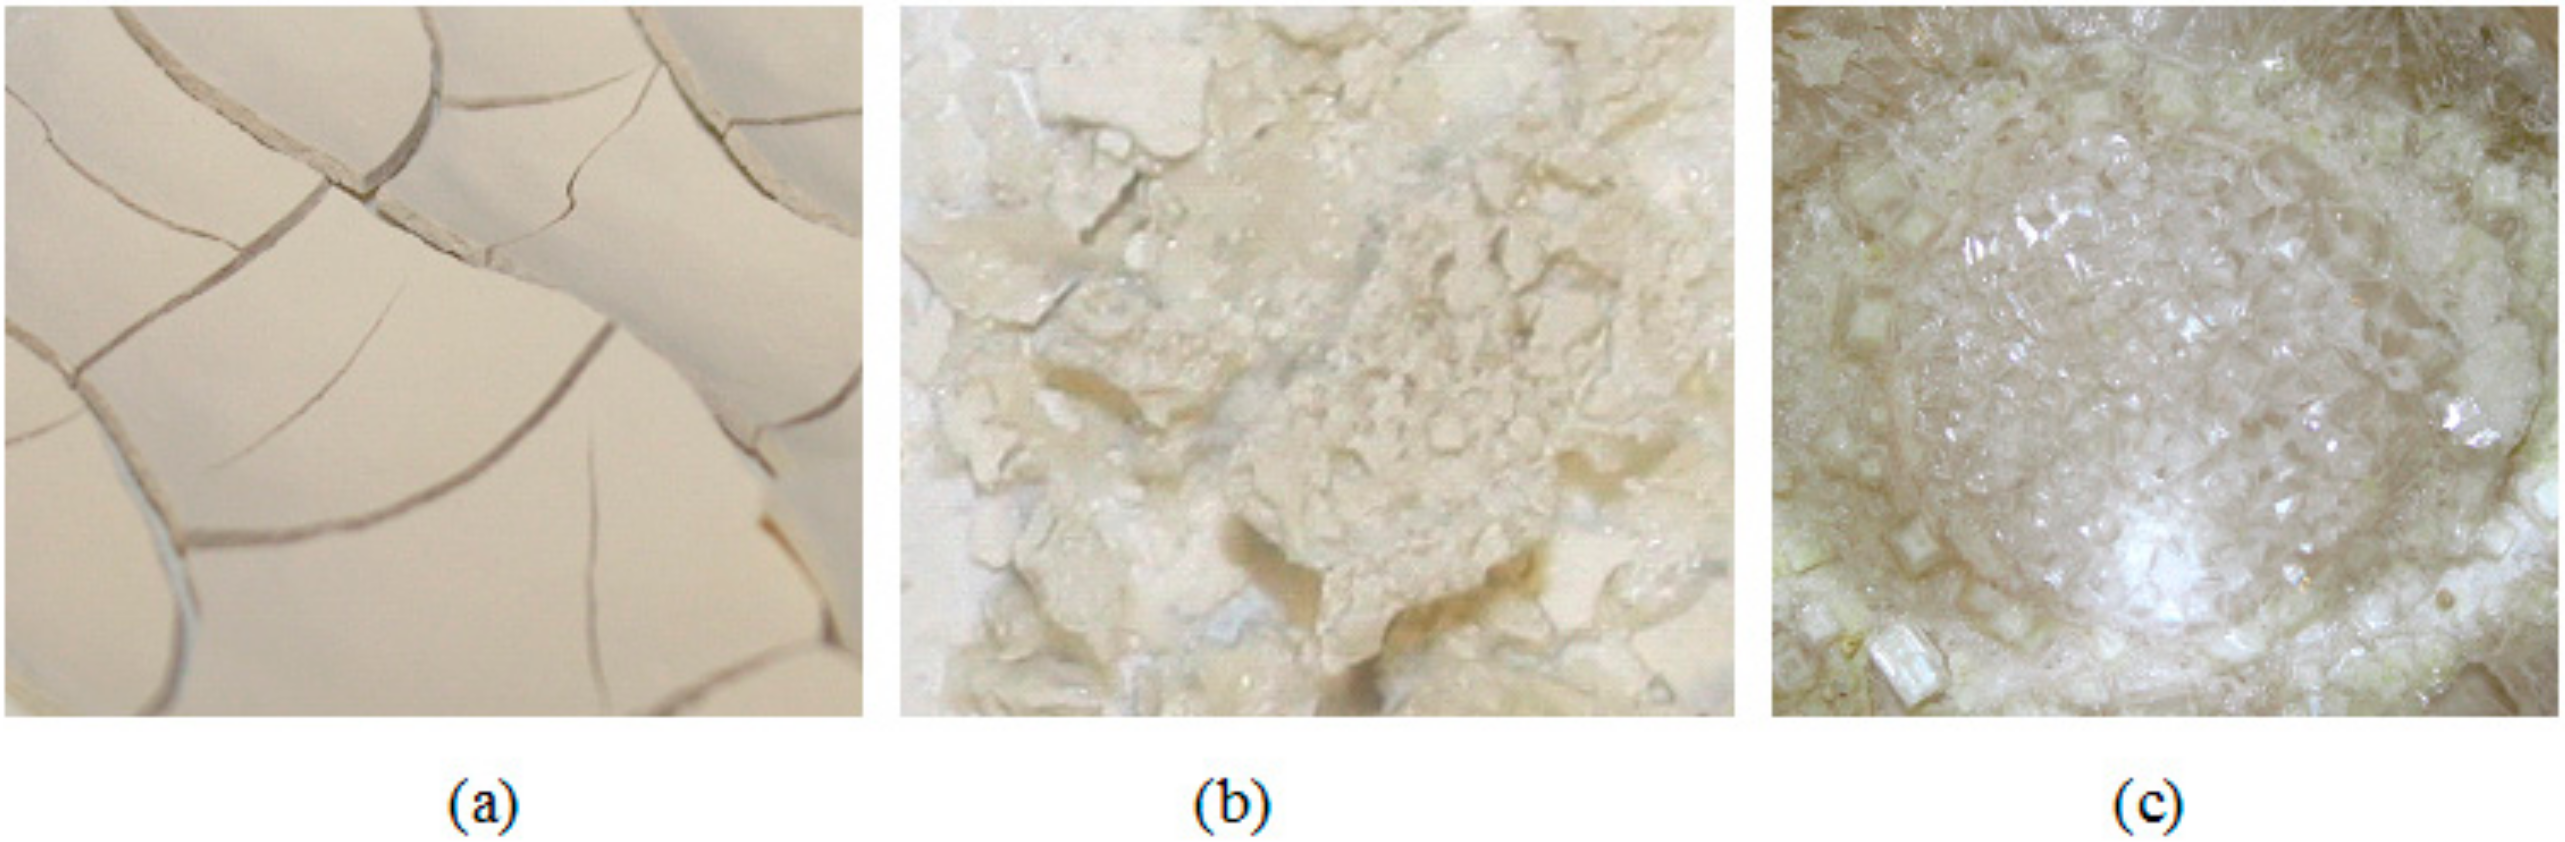
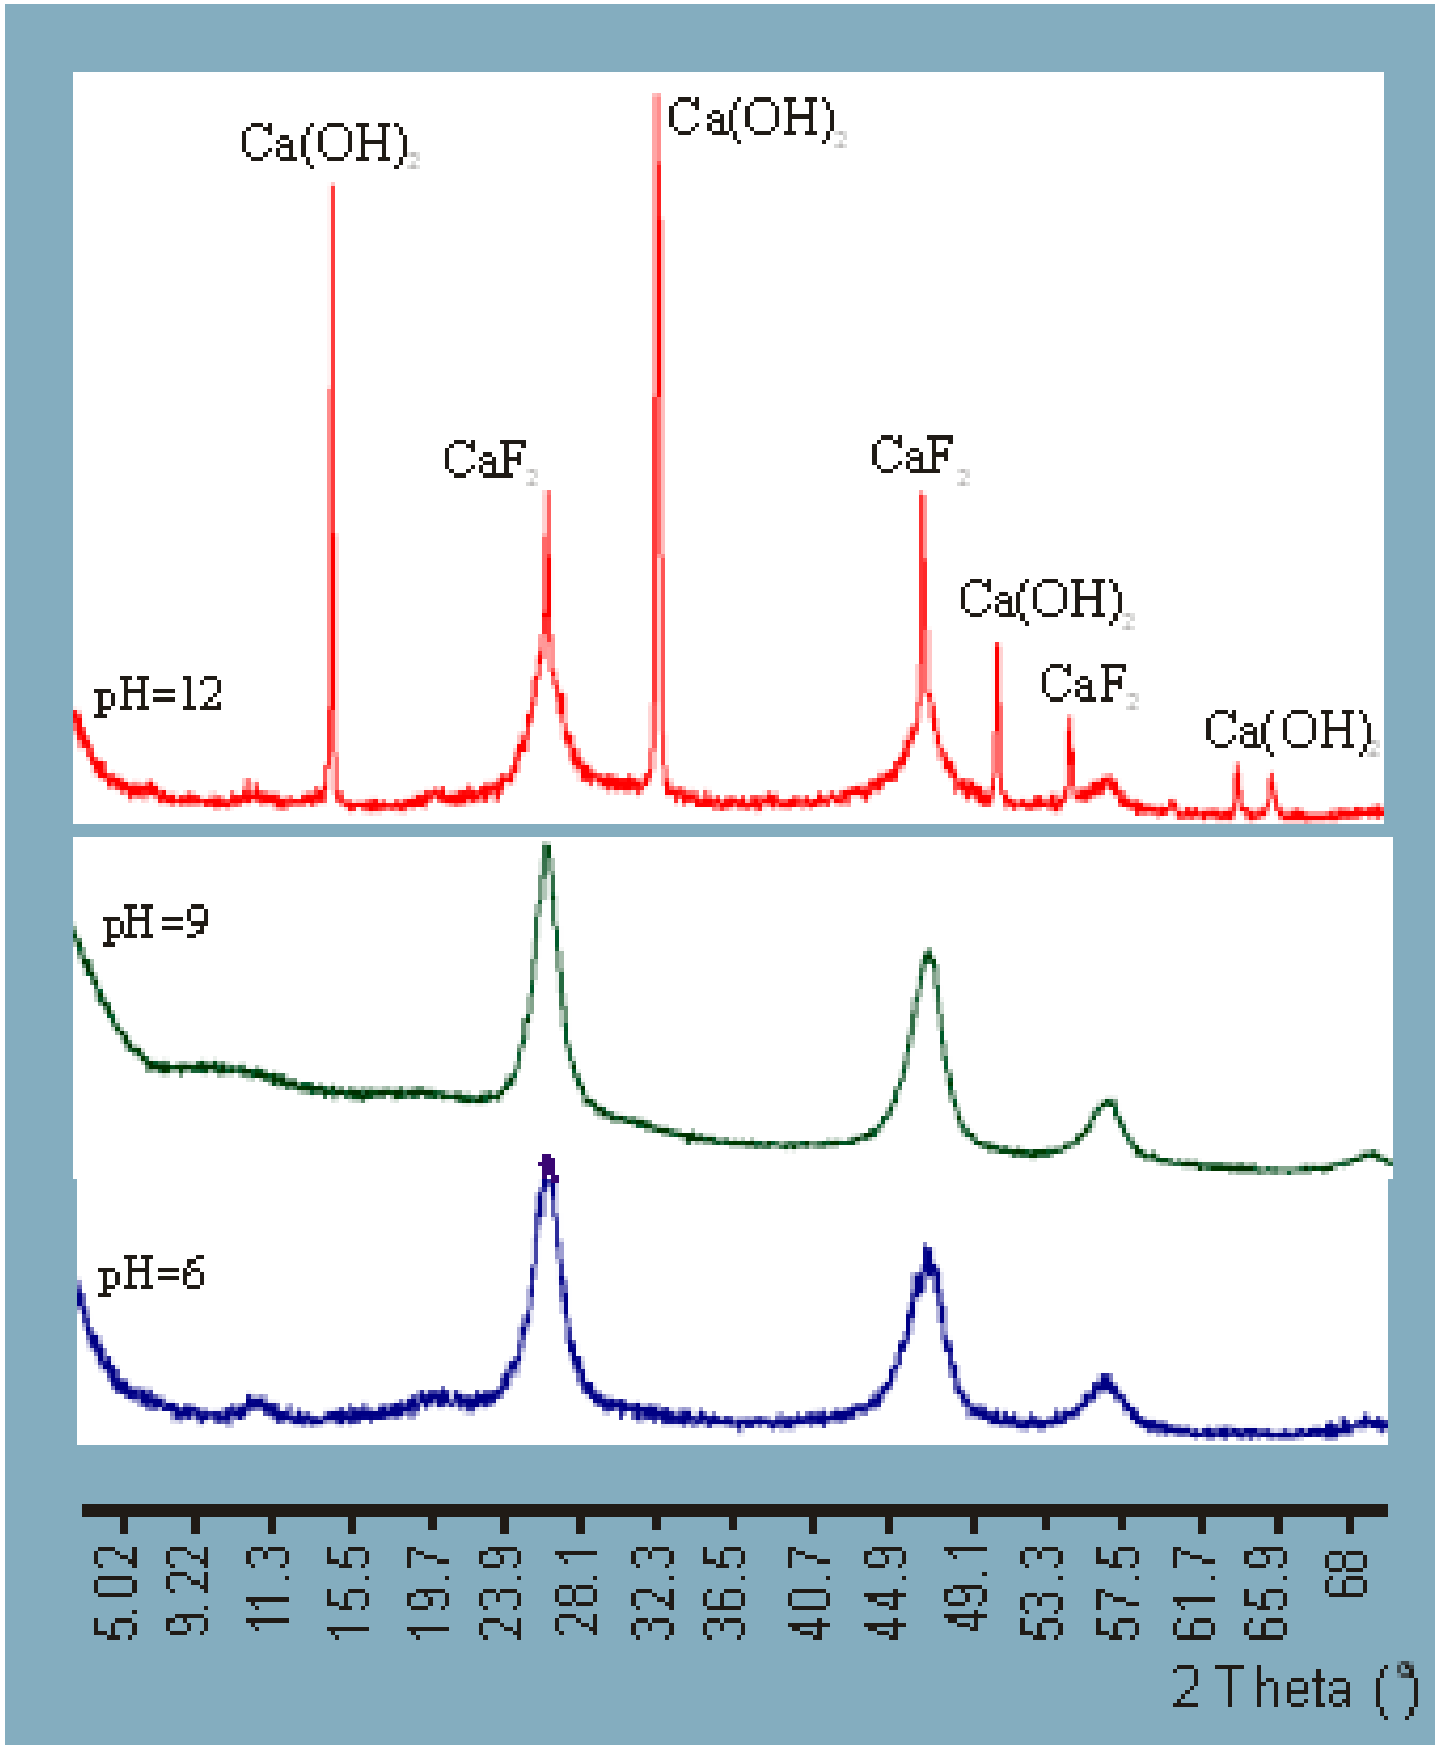
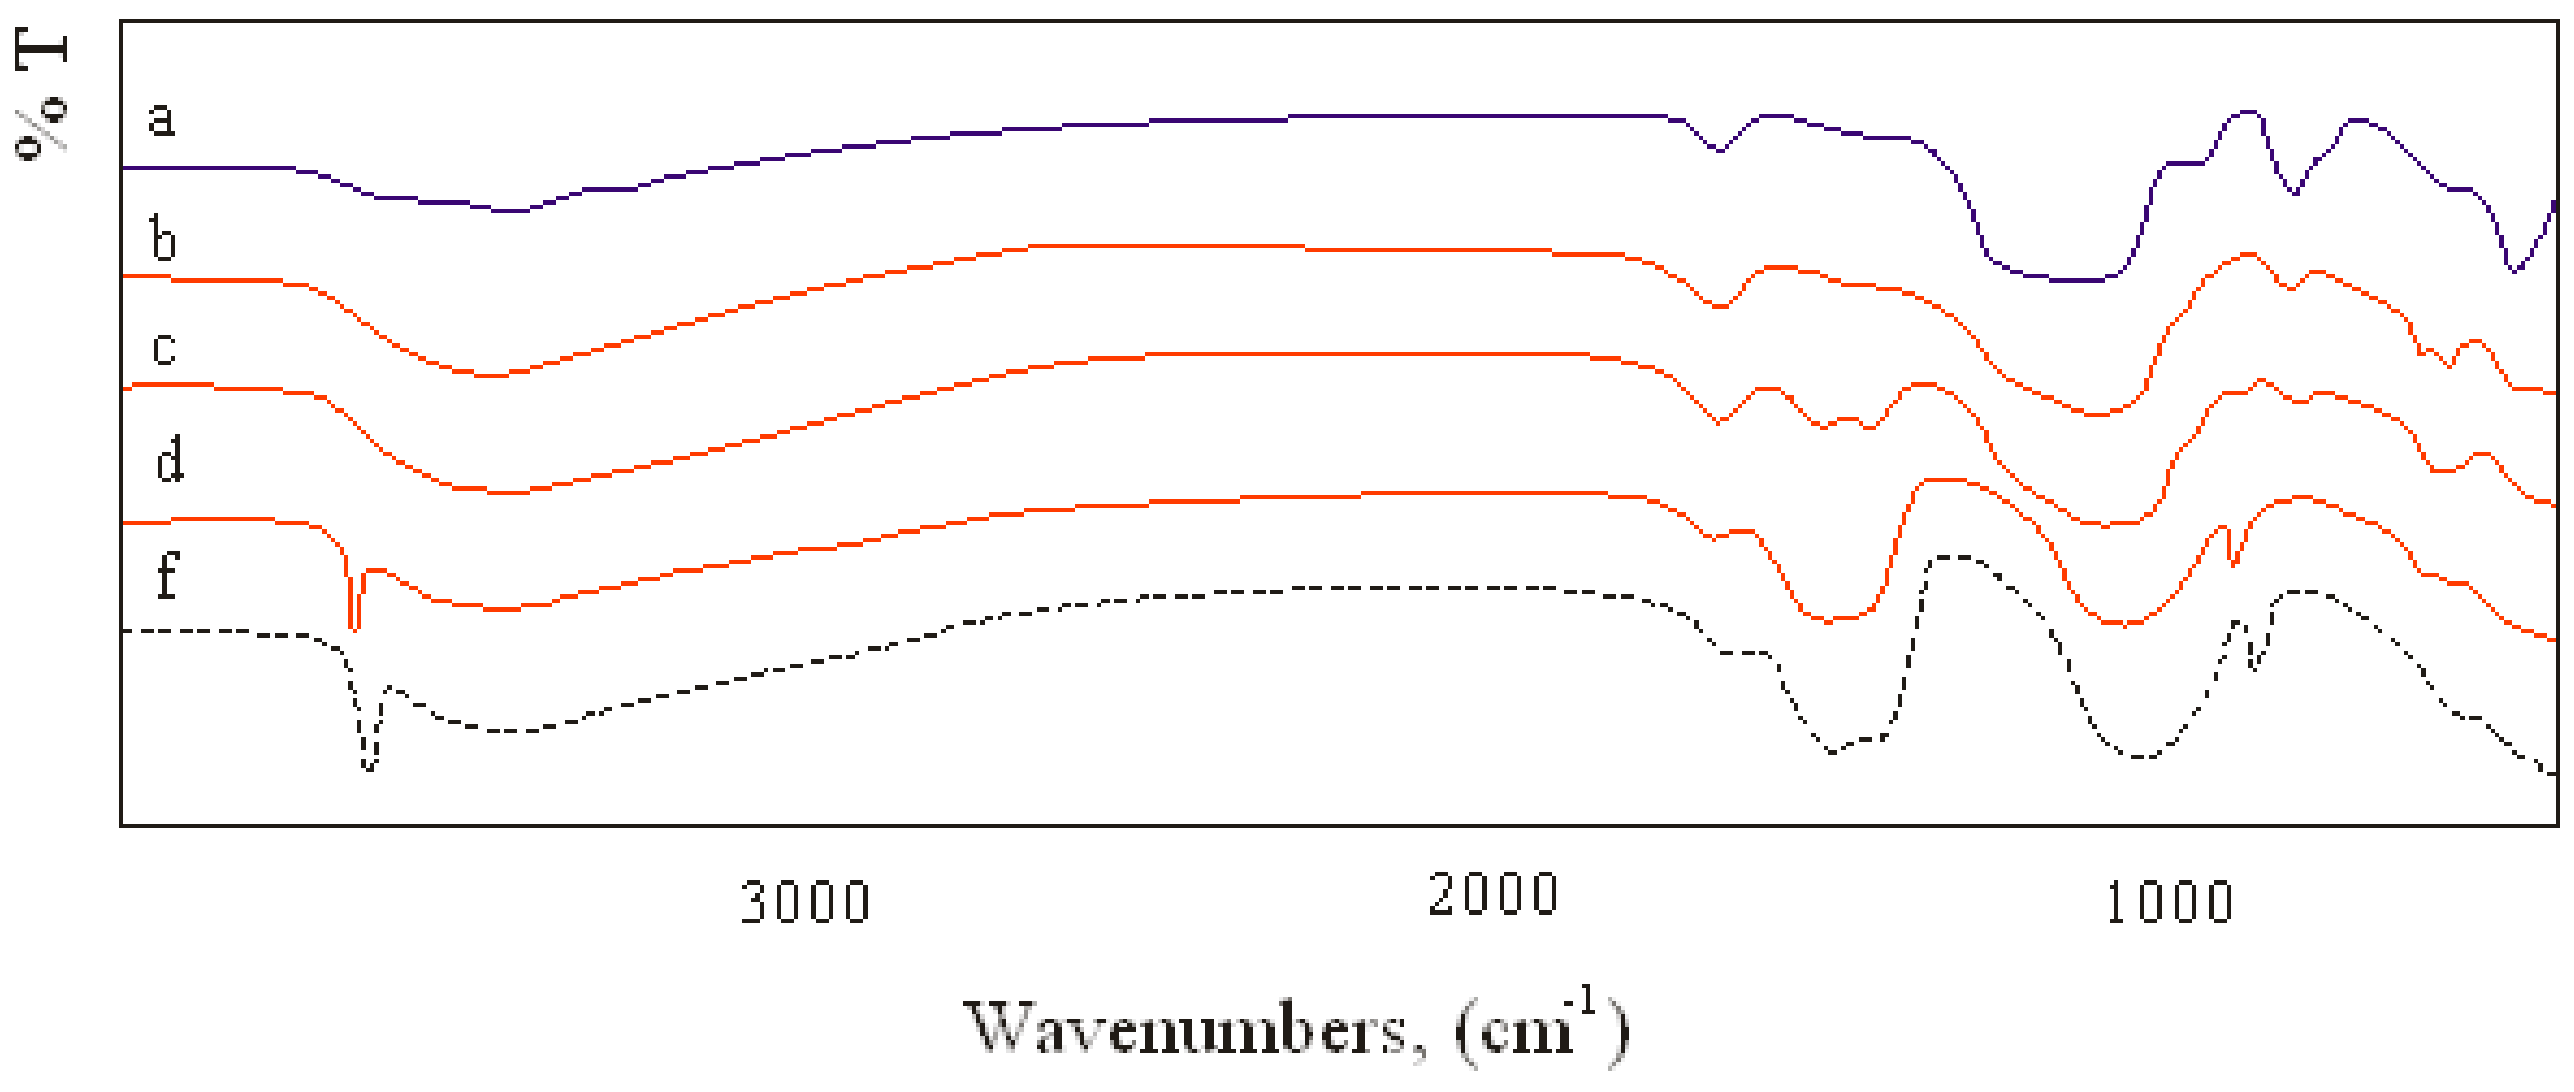
3.2.3. Effect of Metal Hydroxides
4. Conclusions
Author Contributions
Funding
Acknowledgments
Conflicts of Interest
References
- Sarawadea, P.B.; Jong-Kil, K.; Hilongaa, A.; Kima, H.T. Recovery of high surface area mesoporous silica from waste hexafluorosilicic acid (H2SiF6) of fertilizer industry. J. Hazard. Mater. 2010, 173, 576–580. [Google Scholar] [CrossRef] [PubMed]
- Elineema, G.; Kim, J.K.; Hilonga, A.; Shao, G.N.; Kim, Y.N.; Quang, D.V.; Sarawade, P.B.; Kim, H.T. Quantitative recovery of high purity nanoporous silica from waste products of the phosphate fertilizer industry. J. Ind. Eng. Chem. 2013, 19, 63–67. [Google Scholar] [CrossRef]
- Kumar, M.; Nani Babu, M.; Mankhand, T.R.; Pandey, B.D. Precipitation of sodium silicofluoride (Na2SiF6) and cryolite (Na3AlF6) from HF/HCl leach liquors of alumino-silicates. Hydrometallurgy 2010, 104, 304–307. [Google Scholar] [CrossRef]
- Lu, N.C.; Liu, J.C. Removal of phosphate and fluoride from wastewater by a hybrid precipitation–microfiltration process. Sep. Purif. Technol. 2010, 74, 329–335. [Google Scholar] [CrossRef]
- Khatibikamal, V.; Torabian, A.; Janpoor, F.; Hoshyaripour, G. Fluoride removal from industrial wastewater using electrocoagulation and its adsorption kinetics. J. Hazard. Mater. 2010, 179, 276–280. [Google Scholar] [CrossRef] [PubMed]
- Dolar, D.; Košutić, K.; Vučić, B. RO/NF treatment of wastewater from fertilizer factory—Removal of fluoriden and phosphate. Desalination 2011, 265, 237–241. [Google Scholar] [CrossRef]
- Liu, J.C. Recovery of phosphate and ammonia as struvite from semiconductor wastewater. Sep. Purif. Technol. 2009, 64, 368–373. [Google Scholar]
- Aldaco, R.; Garea, A.; Irabien, A. Calcium fluoride recovery from fluoride wastewater in a fluidized bed reactor. Water Res. 2007, 41, 810–818. [Google Scholar] [CrossRef] [PubMed]
- Batiha, M.; Al-Harahsheh, M. The effect of reaction conditions on the precipitation of sodium hexafluorosilicate produced from waste hexafluorosilicic acid. Pol. J. Chem. Tech. 2011, 13, 23–28. [Google Scholar] [CrossRef] [Green Version]
- Gouider, M.; Feki, M.; Sayadi, S. Separative recovery with lime of phosphate and fluoride from an acidic effluent containing H3PO4, HF and/or H2SiF6. J. Hazard. Mater. 2009, 170, 962–968. [Google Scholar] [CrossRef] [PubMed]
- Chimenos, J.M.; Fernandez, A.I.; Hernandez, A.; Haurie, L.; Espiell, F.; Ayora, C. Optimization of phosphate removal in anodizing aluminium wastewater. Water Res. 2006, 40, 137–143. [Google Scholar] [CrossRef] [PubMed]
- Nath, S.K.; Borodoloi, S.; Dutta, R.K. Effect of acid on morphology of calcite during acid enhanced defluoridation. J. Fluorine Chem. 2011, 132, 19–26. [Google Scholar] [CrossRef]
- Nath, S.K.; Dutta, R.K. Acid-enhanced limestone defluoridation in column reactor using oxalic acid. Process Saf. Environ. Prot. 2012, 90, 65–75. [Google Scholar] [CrossRef]
- Innocenzi, V.; Zueva, S.; Prisciandaro, M.; De Michelis, I.; Di Renzo, A.; Mazziotti di Celso, G.; Vegliò, F. Treatment of TMAH solutions from the microelectronics industry: A combined process scheme. J. Water Proc. Engin. 2019, 31, 100780. [Google Scholar] [CrossRef]
- Grzmil, B.; Wronkowski, J. Removal of phosphates and fluorides from industrial wastewater. Desalination 2006, 189, 261–268. [Google Scholar] [CrossRef]
- Aoudj, S.; Drouiche, N.; Hecini, M.; Ouslimane, T.; Palaouane, B. Coagulation as a Post-Treatment Method for the Defluoridation of Photovoltaic Cell Manufacturing. Procedia Eng. 2012, 33, 111–120. [Google Scholar] [CrossRef] [Green Version]
- Henβge, A.; Acker, J. Chemical analysis of acidic silicon etch solutions. Titrimetric determination of HNO3, HF, and H2SiF6. Talanta 2007, 73, 220–226. [Google Scholar]
- Henßge, A.; Acker, J.; Müller, C. Titrimetric determination of silicon dissolved in concentrated HF–HNO3 etching solutions. Talanta 2006, 68, 581–585. [Google Scholar] [CrossRef] [PubMed]
- Weinreich, W.; Acker, J.; Graber, I. Determination of total fluoride in HF/HNO3/H2SiF6 etch solutions by new potentiometric titration methods. Talanta 2007, 71, 1901–1905. [Google Scholar] [CrossRef] [PubMed]
- Odor Methodology Guideline, Department of Environmental Protection, Perth, Western Australia March. ISBN 0 7307 6672 1. Available online: https://www.der.wa.gov.au/images/documents/your-environment/air/publications/odour-methodology-guidelines.pdf (accessed on 4 November 2019).
- Zumdahl, S.S.; Zumdahl, S.A. Chemistry, 7th ed.; Houghton Mifflin Company: New York, NY, USA, 2007. [Google Scholar]
- De Luna, M.D.G.; Warmadewanthi; Liu, J.C. Combined treatment of polishing wastewater and fluoride-containing wastewater from a semiconductor manufacturer. Coll. Surf. A Physicochem. Eng. Aspects 2009, 347, 64–68. [Google Scholar] [CrossRef]


| Odor Strength | Intensity Level |
|---|---|
| Extremely strong | 6 |
| Very strong | 5 |
| Strong | 4 |
| Distinct | 3 |
| Weak | 2 |
| Very weak | 1 |
| Not perceptible | 0 |
| Wastewater Sample | Concentration (%wt) | ||||||
|---|---|---|---|---|---|---|---|
| Al | Si | Ca | Fe | S | Cl | P | |
| Solid Phase | |||||||
| I | 0.12 | 86.72 | 8.28 | 0.31 | 0.64 | 0.27 | 3.54 |
| II | 0.35 | 84.01 | 8.08 | 1.21 | 0.34 | 0.15 | 5.55 |
| Liquid Phase | |||||||
| I | 0.056 | 1.733 | 0.430 | 0.005 | 0.033 | 0.207 | 0.346 |
| II | 0.600 | 2.179 | 1.525 | 0.011 | 0.495 | 0.279 | 0.834 |
| Raw Material | Concentration (%wt) | ||||||
|---|---|---|---|---|---|---|---|
| Al | Si | Ca | Fe | S | Cl | P | |
| Morocco | 0.28 | 2.66 | 25.5 | 0.44 | 0.25 | 0.01 | 6.73 |
| Senegal | 0.96 | 1.45 | 24.44 | 1.28 | 0.14 | 0.004 | 9.63 |
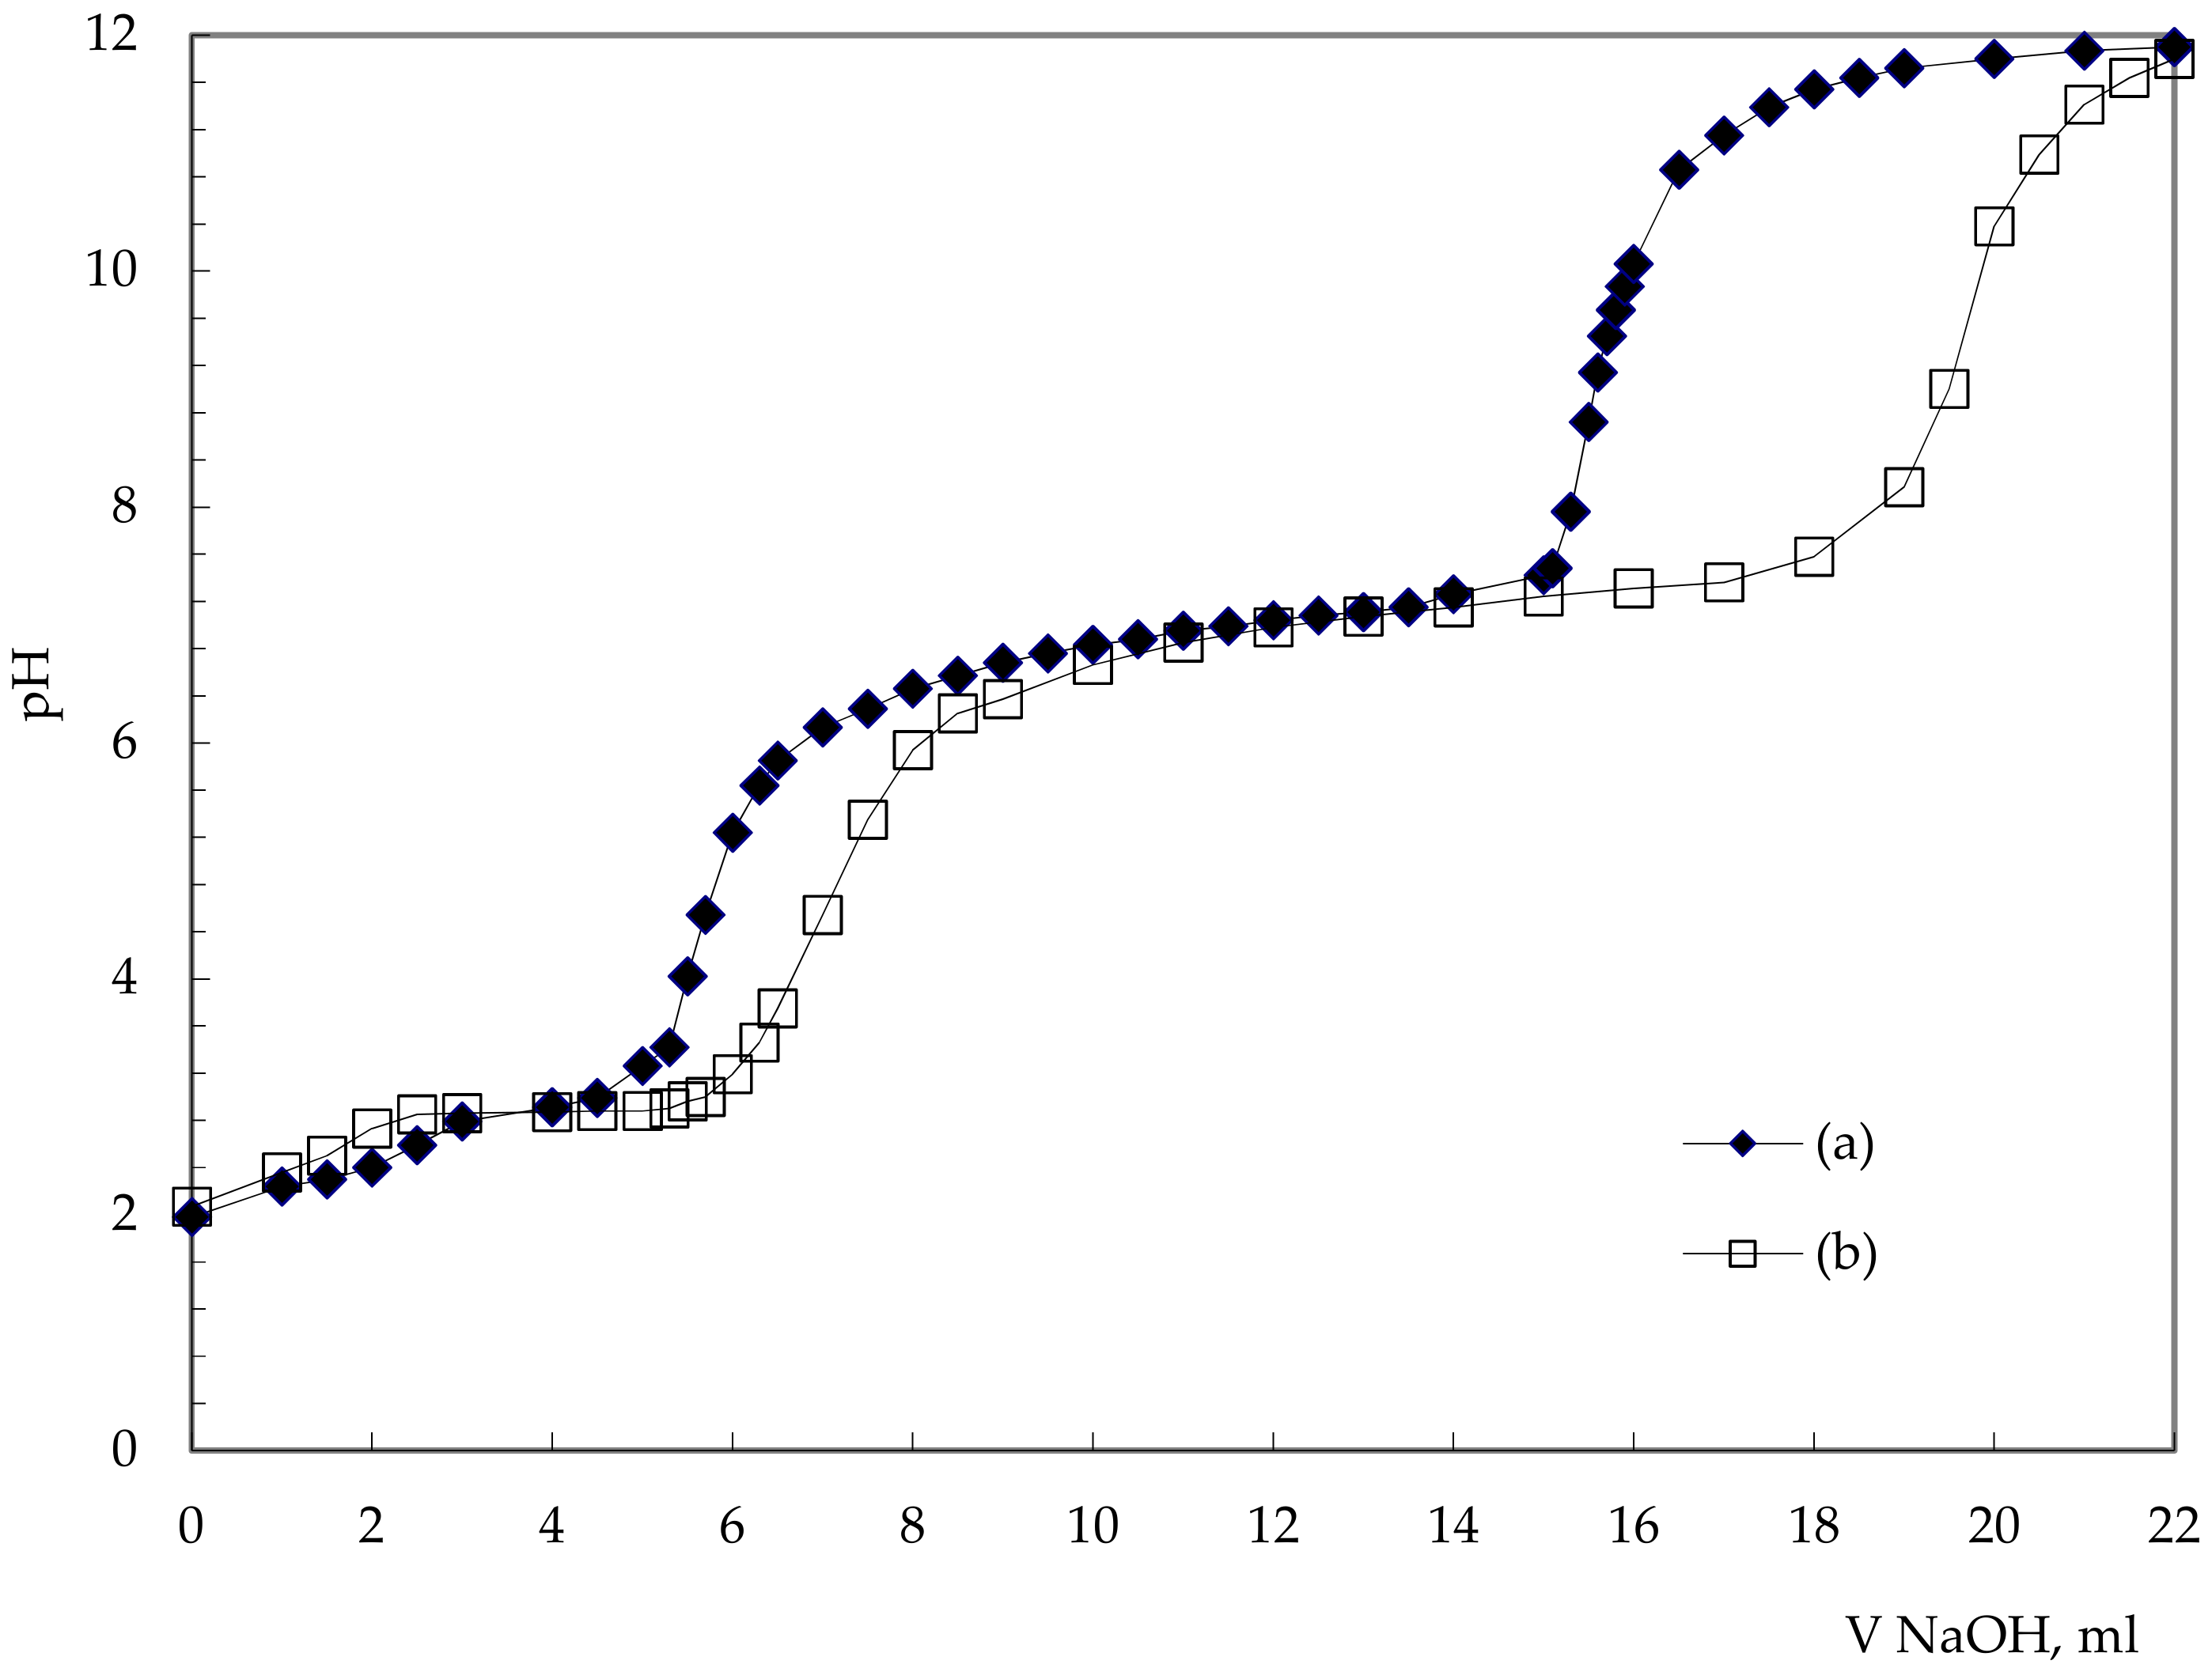
| pKa [21] | pH | Equilibrium Equations | P–F–Si–H2O System | |
|---|---|---|---|---|
| pH | Equivalence Point | |||
| 1.7 | 3.5 | H2SiF6 ↔ SiF62− + 2 H+ | 2.4 | first |
| 2.1 | 4.6 | H3PO4 ↔ H2PO4− + H+ | ||
| 3.1 | 7.0 | HF ↔ H+ + F− | ||
| 3.9 | 8.6 | SiF62− + 2 H2O ↔ 6 F− + 4 H+ + SiO2 | 4.3 | second |
| 7.4 | 9.6 | H2PO4− ↔ HPO42− + H+ | 9.4 | third |
| Wastewater Sample | pH | Concentration (g/L) | ||
|---|---|---|---|---|
| PO43− | SiF62− | F− | ||
| Sample I | 1.86 | 59.88 | 6.96 | 1.68 |
| Sample II | 1.97 | 76.83 | 13.76 | 0.58 |
| pH | P-F–Si–Na(K)–H2O System | P-F–Si–(Na–Cl)–Ca–H2O System |
|---|---|---|
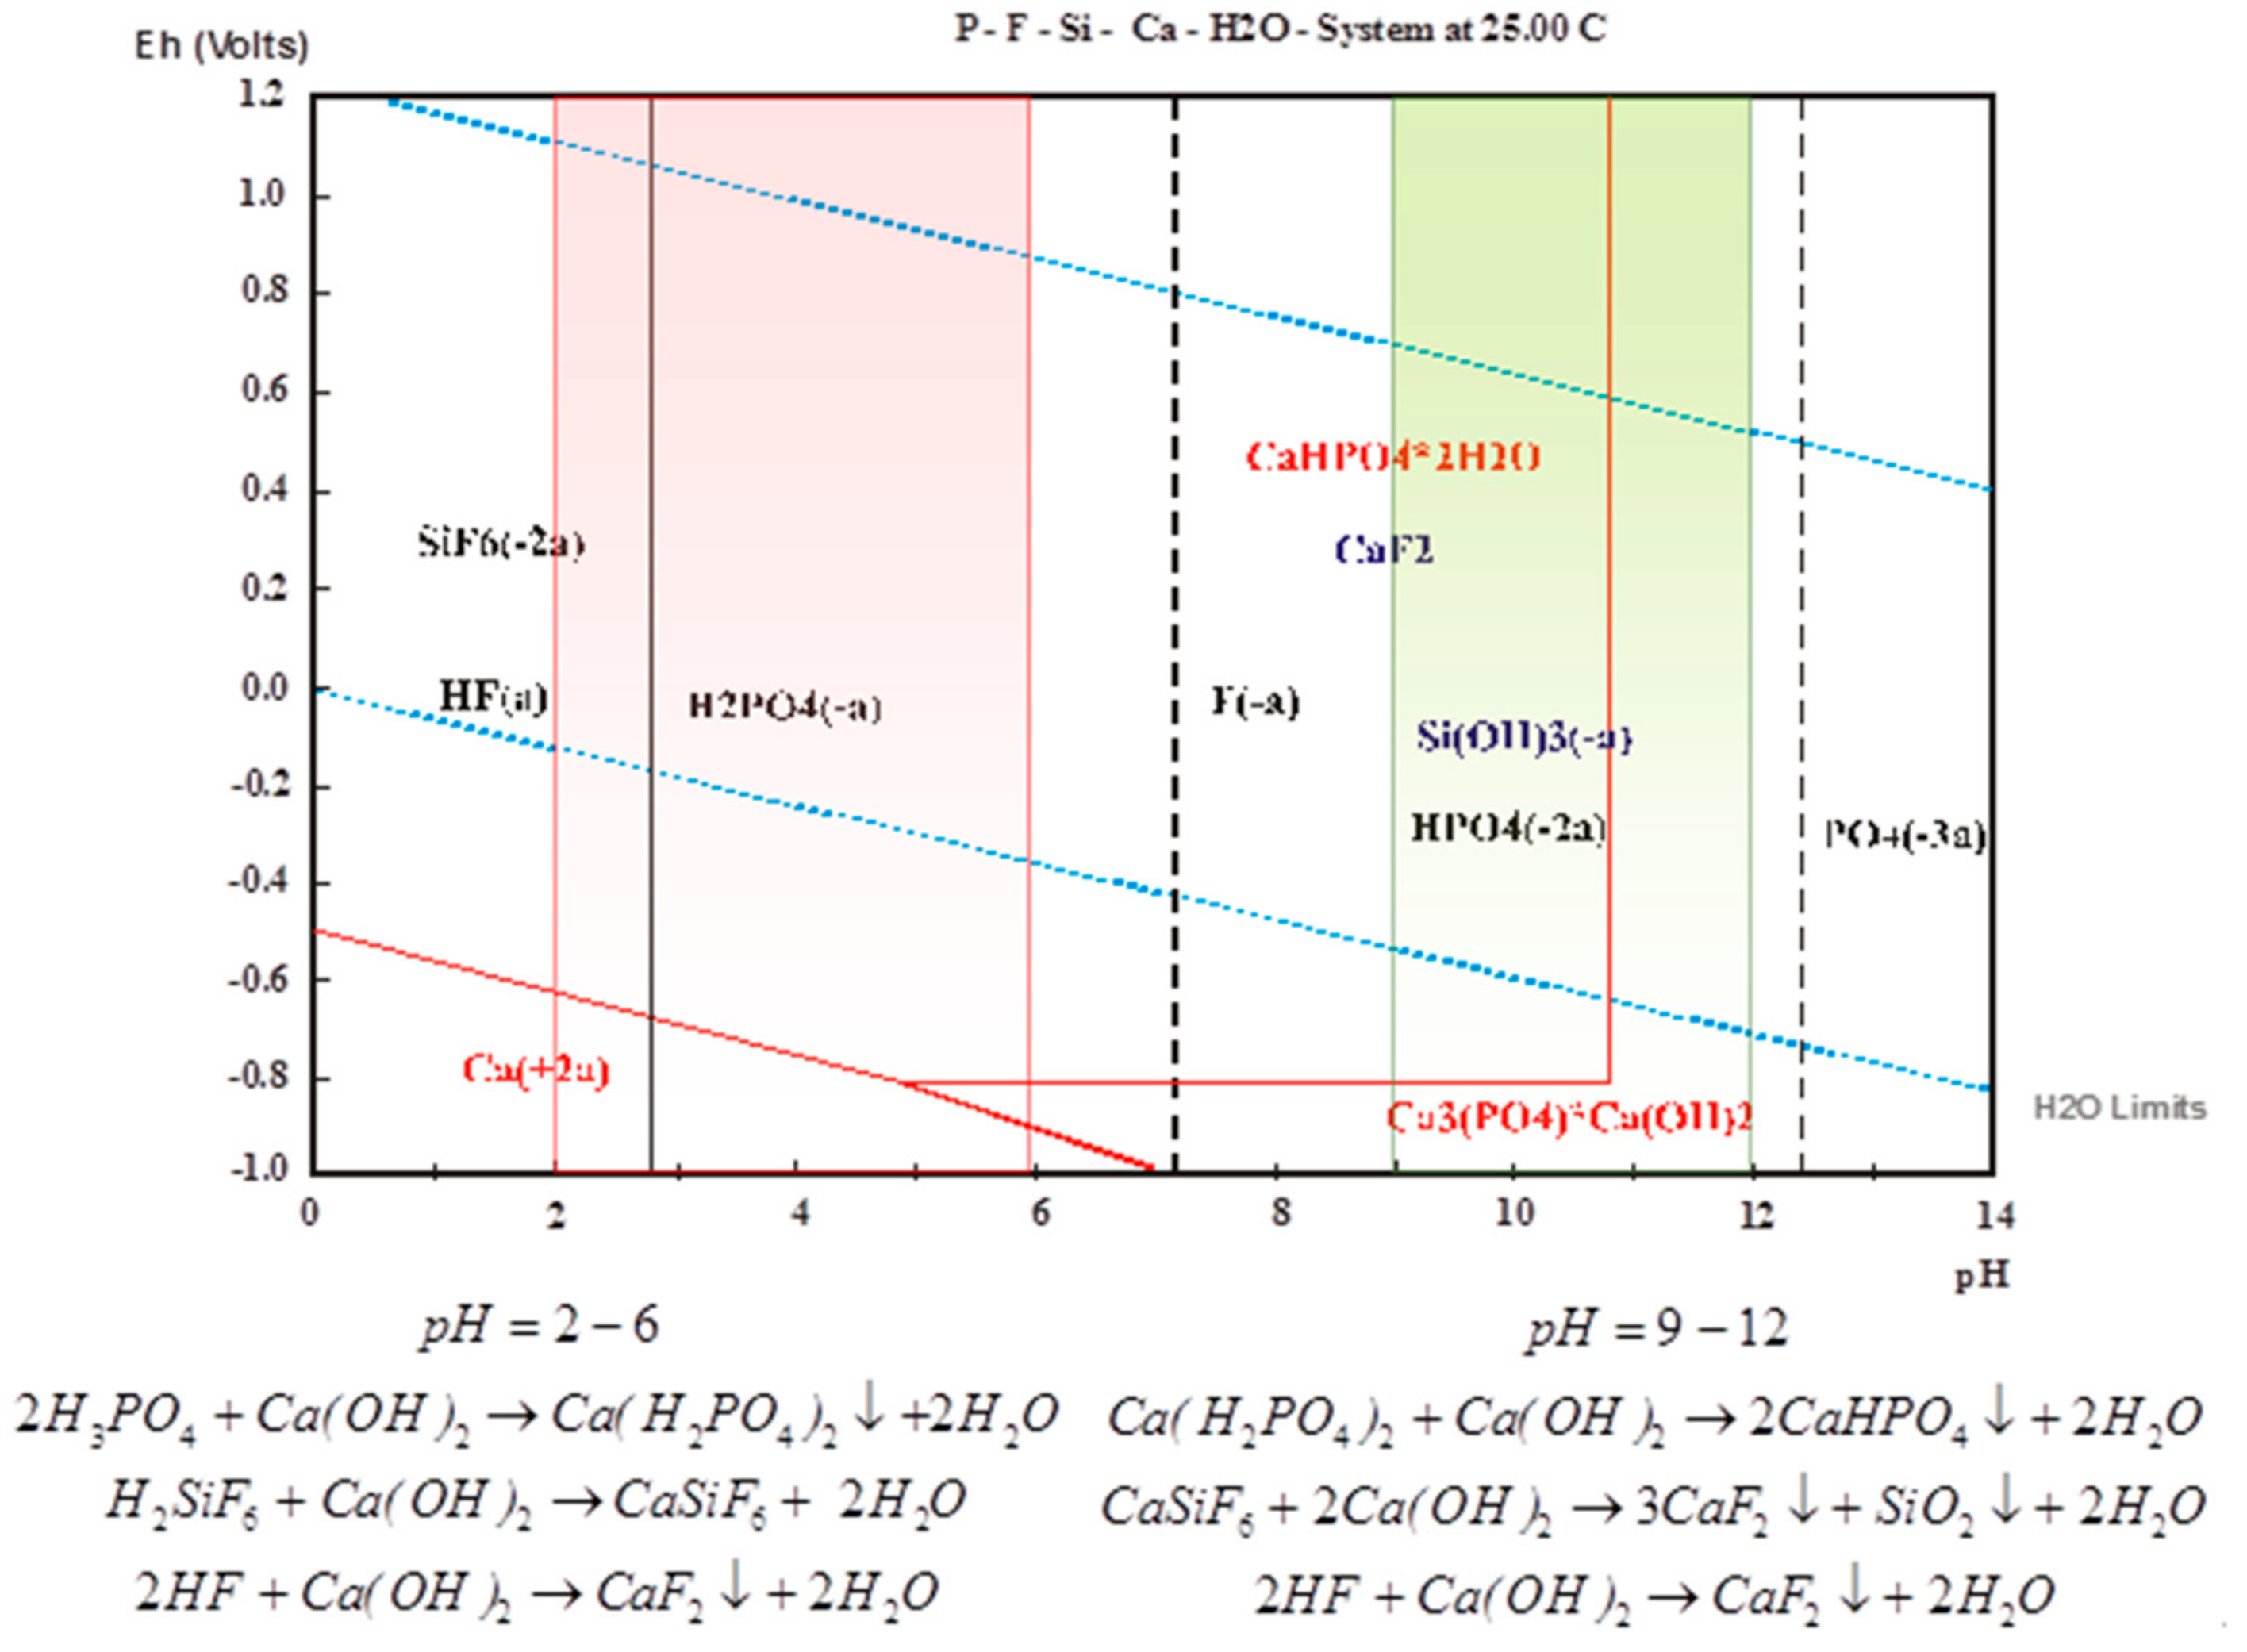
| 2–1.5 | - | H2SiF6 + 2 NaCl → Na2SiF6 + 2 HCl |
| 2–6 | H2SiF6 + 2 NaOH → Na2SiF6 + 2 H2O H3PO4 + NaOH → NaH2PO4 + H2O HF + NaOH → NaF + H2O | 2 H3PO4 + Ca(OH)2 → Ca(H2PO4)2 + 2 H2O H2SiF6 + Ca(OH)2 → CaSiF6 + 2 H2O 2 HF + Ca(OH)2 → CaF2 + 2 H2O |
| 6–9 | H2SiF6 + 6 NaOH → 6 NaF + SiO2·nH2O H3PO4 + 2 NaOH → Na2HPO4 + 2 H2O | Ca(H2PO4)2 + Ca(OH)2 → 2 CaHPO4 + 2 H2O CaSiF6 + Ca(OH)2 → CaF2 + SiO2·nH2O |
| 9–12 | SiO2·nH2O + 4 NaOH → Na4SiOH + (n+2)H2O | 2 CaHPO4 + Ca(OH)2 → Ca3(PO4)2 + 2 H2O |
| pH | Concentration (%wt) | ||||||
|---|---|---|---|---|---|---|---|
| Al | Si | Ca | Fe | S | Cl | P | |
| Solid Phase | |||||||
| 6 | 0.23 | 16.22 | 75.77 | 0.30 | 0.016 | 0.58 | 6.86 |
| 9 | 0.23 | 16.22 | 74.88 | 0.26 | 0.033 | 0.72 | 7.62 |
| 12 | 0.21 | 8.67 | 86.14 | 0.19 | 0.028 | 0.43 | 4.36 |
| Liquid Phase | |||||||
| 6 | 0.01 | 0.027 | 0.03 | 0.002 | 0.001 | 0.189 | 0.0009 |
| 9 | 0.02 | 0.019 | 0.04 | 0.001 | 0.047 | 0.046 | 0.0002 |
| 12 | 0.10 | 0.004 | 0.04 | 0.001 | 0.001 | 0.044 | 0.0001 |
© 2020 by the authors. Licensee MDPI, Basel, Switzerland. This article is an open access article distributed under the terms and conditions of the Creative Commons Attribution (CC BY) license (http://creativecommons.org/licenses/by/4.0/).
Share and Cite
Zueva, S.B.; Ferella, F.; Taglieri, G.; De Michelis, I.; Pugacheva, I.; Vegliò, F. Zero-Liquid Discharge Treatment of Wastewater from a Fertilizer Factory. Sustainability 2020, 12, 397. https://0-doi-org.brum.beds.ac.uk/10.3390/su12010397
Zueva SB, Ferella F, Taglieri G, De Michelis I, Pugacheva I, Vegliò F. Zero-Liquid Discharge Treatment of Wastewater from a Fertilizer Factory. Sustainability. 2020; 12(1):397. https://0-doi-org.brum.beds.ac.uk/10.3390/su12010397
Chicago/Turabian StyleZueva, Svetlana B., Francesco Ferella, Giuliana Taglieri, Ida De Michelis, Inna Pugacheva, and Francesco Vegliò. 2020. "Zero-Liquid Discharge Treatment of Wastewater from a Fertilizer Factory" Sustainability 12, no. 1: 397. https://0-doi-org.brum.beds.ac.uk/10.3390/su12010397