Factors Shaping Cow’s Milk Production in the EU


1
Department of Agrotechnology, Agricultural Production Management and Agribusiness, University of Warmia and Mazury in Olsztyn, 10-719 Olsztyn, Poland
2
Department of Economics and Organization of Enterprises, Warsaw University of Life Science—SGGW, 02-787 Warszawa, Poland
3
Department of Agricultural Economics, Sociology and Education, Pennsylvania State University, State College, PA 16802, USA
4
Department of Animal Science, Pennsylvania State University, State College, PA 16802, USA
*
Author to whom correspondence should be addressed.
Sustainability 2020, 12(1), 420; https://0-doi-org.brum.beds.ac.uk/10.3390/su12010420
Submission received: 18 December 2019
/
Accepted: 30 December 2019
/
Published: 6 January 2020
(This article belongs to the Section Economic and Business Aspects of Sustainability)
Abstract
:The milk market in the European Union (EU) is adjusting rapidly to the removal of dairy quotas. The most important changes include increased milk yield per cow, increased total milk production, decreased number of cows, and the decreased milk consumption. The main aim of the paper is to examine the milk production changes in the EU. We investigated the dynamics of changes in farm milk production during the period from 1998–2017 in the EU. Moreover, we investigated the impact of the removal of quotas on the production of milk on farms in the EU countries for the period from 2015–2017. Milk production in the EU increased from 151 million tons in 1998 to 165 million tons in 2017 (a 10% increase). A multi-variate regression model was to test which explanatory variables have an impact on milk production in the EU. The most important factors were a gross domestic product, final household consumption expenditure (current prices, million euro), and population (number).
1. Introduction
Dairy products are nutrient-dense foods in the overall human diet, and contain needed nutrients, such as calcium, potassium, protein, fat, and vitamin D which are critical in a balanced diet [1]. Milk and dairy products, may reduce the risk of osteoporosis and cardiovascular diseases and type 2 diabetes and are the best compliment for a healthy meal [2].
Dairy products are characterized by limited possibilities for the storage of their stocks which are unstable and difficult to store and transport. Milk is an unstable product which requires to be handled at an appropriately low temperature (up to 4 °C), transported as quickly as possible, and processed within 24 h. Over time, the count of bacteria increases, and milk metabolism intensifies. Tukker at al. [3] pointed out that dairy products are the second-highest within the food and drink consumption area.
The dairy sector is also very important for the economy of the EU. The EU is the largest producer of milk in the world, and it exports milk around the world. Moreover, the EU is focused on producing a safe product from healthy animals with strict limits on bacteria and somatic cell counts in raw milk [4].
The dairy sector is undergoing major structural changes in the EU, the USA, New Zealand, and in many other countries in the world. These changes include geographical shift and production intensification. According to Cabrera, et al. [5] current changes in the dairy sector “affect farm efficiency, profitability, and the long-term economic sustainability”. Dairy farmers need to invest to keeping their farms in good condition, maintain competitiveness in the market, increase the rate of technology adoption, and improve labor productivity [6,7]. According to Pietola and Heikkilä [8] “investments in dairy barns usually lead to an increase in capacity compared to the pre-investment situation and therefore allow dairy herds to grow”. Making investments in infrastructure results in improvements in animal welfare, but this process requires capital [9].
Investments realized in dairy farms enable the implementation of new technologies, and involve benefits associated with an increase in efficiency, a reduction in costs, an improvement in the quality of products and a reduction in the adverse impact on the environment, and an improvement in animal welfare [10].
Another important issue for an evolving milk market is the present state of the dairy industry and its overall impact on the economy. Wijnands, et al. [11] and Tacken, et al. [12] note the critical role of the dairy industry to the greater food industry of the EU. The Eurostat data indicates that “the EU dairy industry represents 4% from the whole food industry, it employs 8% of workers, it contributes by 10% to a creation of value added and by 13% to turnover” [13]. Labor productivity is 53,000 EUR per worker [13]. The dairy sector is also one of the most innovative and “in 2014, the dairy businesses participated by 6.9% in innovation of food industry, which takes them to second place in the sector” [14].
After 2004 and 2007, when new members joined the EU, significant changes in the milk market were observed. The food trade increased, particularly from EU-15. The factors impacting the situation for dairy included new economic and non-economic conditions impacting lifestyles, consumption, and land use [15,16].
The above-mentioned dairy trend in agricultural production was subject, as the only one, to production restrictions in the European Union under the so-called quota system [17,18]. The policy of guaranteed high prices for agricultural products, pursued in the 1970′s, which was supposed to encourage farmers to stay in the countryside, quickly led to high overproduction, mainly of butter. Hence, the need to introduce production limits that were imposed on the particular EU Member States in 1984.
The factors that limit investments in dairy farms in Poland include small amounts of loans, no land consolidation, and low profitability. Small dairy farms had poor access to capital, as well as limited opportunities to develop [19]. Small dairy farms are often supported by dairies which grant farmers loans to help farms develop rapidly or improve the hygiene conditions for milk production.
The expansion of the EU created possibilities for the development of additional milk markets and the expansion of the dairy sector as a whole. The first opportunities created by this expansion were access to the Common Market and abolition of barriers in trade. This enabled the main producers of milk to export milk and dairy products to new member states, where surplus production could now be easily sold. The expansion of the EU also had a positive impact on milk quality in the new member countries. The EU’s standards required many dairy processors to invest in improved production, storage, and logistics systems for their dairy products [20].
The global milk market is constantly evolving. One of the most important elements in the dairy marketing chain are consumers whose preferences for milk and processed dairy products are changing. Changing consumer demand has presented a challenge for the industry to expand its product range [21]. Increasing demand for dairy products in emerging economies has led to an increase in global dairy trade [22]. The milk production has increased globally through increased milk yields and improved production efficiency, the reduction in the number of small dairy farms, and expansion of in dairy herd size [23]. Complicating this situation is the rise in the number of consumers in the market who prefer soybean and nut-based options as an alternative to cow’s milk [2].
Another important problem for milk production is decreased fertility of cows resulting from rising production and larger numbers of animals per worker. New production technologies, including advances in genetics, nutrition, and herd management, are needed to boost dairy farm profitability [24]. The share of specialized dairy farms in the old EU member states is already very high, with a share of about 95% [25].
The main focus of this article is to investigate the factors which impact milk production in the EU and to determine those factors that are external to the farm, which has an impact on milk production. This involved the following steps:
- Elaboration of the impact of changes in milk production for particular countries of the EU during the period from 2018 to 2020;
- Identification of factors having an impact on milk production in the EU countries;
- Evaluation of the impact of various characteristics on milk production in the EU.
Bearing in mind the importance of milk production for the economy of the EU, we wanted to analyze the development of milk production in the EU. The objective of our analysis was to recognize the biggest milk producers in the EU. Moreover, we wanted to find which factors determine the milk production in the EU countries.
To accomplish this, we look at how the common agricultural policy and environmental issues have impacted milk production. A discussion of the methodology used for the analysis is followed by a consideration of the results and their implications for EU policy.
2. Impact of Common Agricultural Policy and Environmental Regulations on Milk Production
One of the most important issues within the Common Agricultural Policy (CAP) is the support of milk production. Reform of agricultural policy started in 1992, where the MacSharry reform reduced the intervention prices for butter and dairy products by 9% and 7.5%, respectively [26]. In 2003, the Fischler reform reduced the intervention price for butter by 10% [27]. Additionally, supply quotas were introduced for the first time, and the support prices were reduced [28]. According to Réquillart [29], the quota system accomplished its goal in maintaining high prices in milk and dairy product markets. Another result was that EU milk production increased and EU net exports to the world market increased, causing world market prices to decline [30]. Because the quota system guaranteed EU farmers that their milk would be purchased by milk processing enterprises for reasonable prices, farmers’ welfare increasingly depended largely on these regulations [31]. The planned elimination of milk quotas resulted in a loss of confidence by farmers, even in the biggest milk-producing countries like Germany. The changes had a negative impact on smaller dairy farms, while benefiting the larger ones [32].
On 1 April 2015 milk quotas were abolished in the EU [33], resulting in a more competitive global market and increasing world milk prices [34,35]. Initially, the abolition of milk quotas resulted in unstable prices, which dropped significantly to halt structural change [36,37]. It was closely linked with the ongoing structural change in the dairy industry. It created serious problems in the milk market in the EU countries.
The reforms introduced by the EU to stabilize the dairy market were not highly effective because they included payments for farmers to keep small numbers of cows [38]. These payments had mainly social implications because payments were focused on farms with 3–10 cows. Farms with more than 20 cows were entitled to direct payments for a maximum of 20 animals only, thereby discouraging farmers from expanding herd size [39]. In the next CAP programming period (2021–2027) these policies will likely be revised. Moreover, CAP measures can help countries with low milk production (Malta, Cyprus, Slovenia, Croatia), and such recommendations could be incorporated into future CAP plans from 2021 to 2027 [40].
Intensive milk production systems occur indoors, which may cause increased manure management issues [41]. Another issue is the welfare of animals which stay indoors and do not have fresh air, do not move much, and have limited access to sun, and thus, vitamin D. Another problem may be of course claw-health problems and the light problems can be solved by day-light lamp [42,43]. Additionally, large-scale dairy farming is not socially desirable in many regions of the world, and only small-scale family farming can enable sustainable development [44]. The problem of milk production and its impact on the environment has been studied extensively. Soltanali, et al. [45] found that environmentally friendly dairy production is an important issue, especially in intensive farms.
Olipra [46] analyzed price cycles in the milk market. He concluded that political, institutional, economic, and environmental factors determine the duration cycles in the dairy market. Dairy farm environmental sustainability requires looking at the production as a contributor to life cycle environmental impact from production to consumption and disposal [47]. The presence of cycles in the milk market creates volatility in milk prices that threaten the future development of dairy farms. Global integration in the dairy market also creates increased volatility because of various external factors [48].
One of the characteristics of milk production is the presence of economies of scale. Because of these small dairy farms are less competitive compared to larger farms and may not be able to survive in the market. Smaller dairy farms have higher unit production costs in comparison to larger farms and are inefficient. Smaller farms also have advantages, such as more attention for the individual animals, less competition, less different personal, etc. [49].
3. Materials and Methods
In the first part of this paper, the direction and dynamics of changes in milk production in the EU in the years 1998–2017 has been discussed and projections made for expected changes for 2018–2020. Historical data were used to estimate the development trend using multiple regression methods the dependent variable y (for example, EU milk production) based on the values of various independent variables x (prediction of a dependent variable on the basis of an independent variable, e.g., year). The development trend of the dynamic series was determined using a mathematical function:
where β0 and β1 are structural parameters of the regression function, and ξ is a random component. The β0 parameter in the linear regression equation means the so-called intercept, and the parameter β1 is the regression coefficient of the y variable relative to the x variable. It corresponds to the directional coefficient of the linear function, so it estimates how much the value of the dependent variable y changes when the independent variable x changes by one unit. In the construction of the regression model, the assumption of ceteris paribus was introduced. This limited the impact of the random component ξ. The determination coefficient (r2) is used to measure the extent to which the model explains the formation of the y variable. The closer it is to 1, the better the fit of the model.
y = β0 + β1x + ξ,
Next, we have used descriptive and graphical methods to present the changes in milk production in the EU countries. We also analyzed the descriptive statistics to measure the average, median, minimum, maximum, standard deviation, and coefficient of variation in milk production on farms in the EU countries in 2015–2017 and partly from 2018.
The direction of changes in milk production in individual EU countries is based on the analysis of data from milk delivered to processors. This time series included monthly data from January 1990 to July 2019. The analysis used the linear regression method (1), where the dependent variable was the volume of milk delivered, and the independent variable was the date.
Finally, an analysis of the relationship between the volume of milk production on farms in individual EU countries and selected variables was conducted for 2017. The literature lists many factors that may affect milk production. There are economic factors characterizing the economic situation of a given country. This is mainly due to dynamic changes taking place outside the farm. On the other hand, natural conditions are one of the important factors affecting the economic competitiveness of dairy farming in relation to other agricultural activities. The most important of these are climatic and soil conditions, primary the share of arable land and permanent grassland [50].
Based on a review of the literature and data availability, 10 potential explanatory variables were initially selected for each EU country that may affect milk production:
X1—share of permanent grassland in Utilized Agricultural Area (%);
X2—permanent grassland (ha);
X3—gross domestic product at market prices (current prices, million euro);
X4—final consumption expenditure of households (current prices, million euro);
X5—exports of goods (current prices, million euro);
X6—imports of goods (current prices, million euro);
X7—subsidies (current prices, million euro);
X8—gross domestic product at market prices (current prices, euro per capita);
X9—final consumption expenditure of households (current prices, euro per capita);
X10—population (number).
The sources of information were Eurostat data. We used the Statistica 13 program for data analysis. Malta was not included in the analysis because data on permanent grassland was not available for this country.
4. Results and Discussion
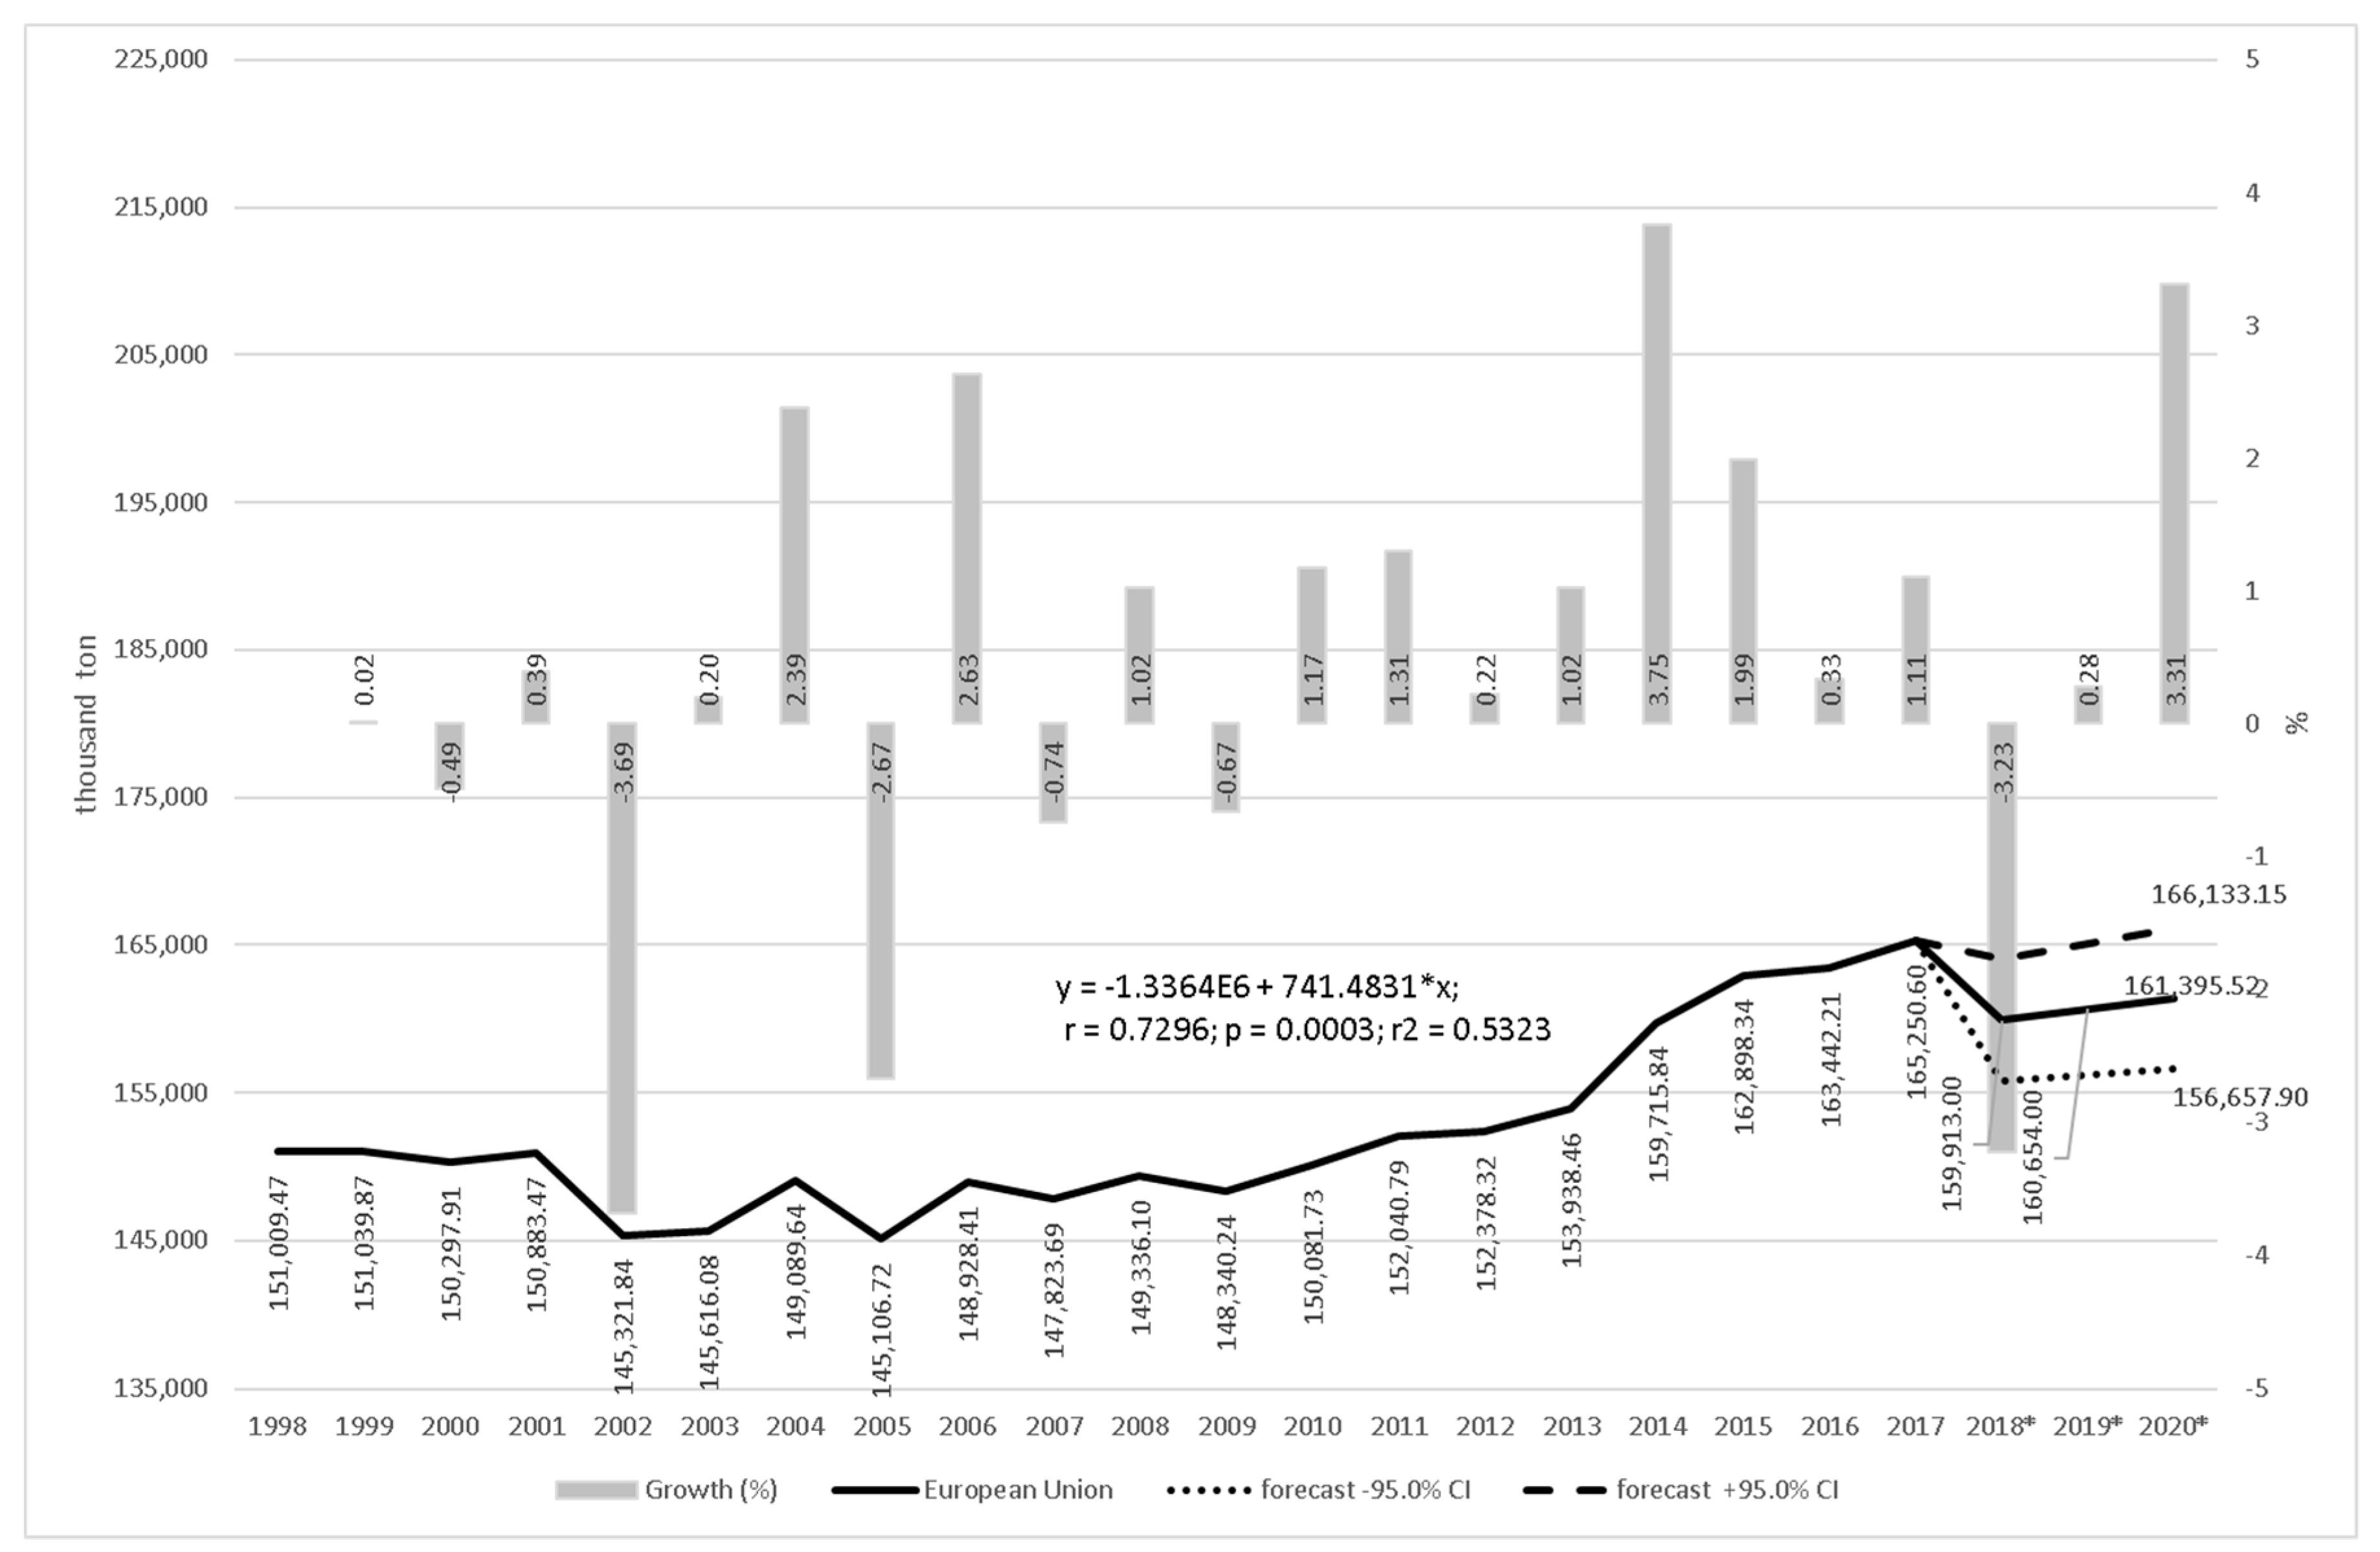
Over the past two decades, milk production in the EU has been steadily increasing. It increased from just over 151 million tons in 1998 to over 165 million tons in 2017 (an increase of almost 10%). The most likely explanation for this is that the quota system introduced in 1984 with the objective to bring increasing milk production under control was abandoned at the end of March 2015 [16]. According to the statistical analysis, the average annual increase was over 740 thousand tons (r2 = 0.53 at p <0.05 indicates that the explanatory value of the model is somewhat weak and the data is moderately correlated). It is also influenced by the large fluctuations in the volume of production during this period. During the period from 2002–2005 large declines in production were particularly noticeable. After 2009 production began to grow. The abolition of milk production quotas in 2015 resulted in an even faster increase in European milk production (Figure 1). However, it was mainly related to the increase in the number of cows, which grew faster than productivity. However, the increase in production/cow is also related to better roughage. Unfortunately, the problem of surplus manure also began to increase, which affected compliance with the obligations arising from limitations on the production of nitrates and phosphorus. Thus, in some countries, the trend of increasing cow population and milk production has changed direction (e.g., The Netherlands). Additionally, in 2015 and 2016 the dairy sector faced a serious crisis characterized by sharply falling prices in both the EU and most other parts of the world caused by a combination of factors, including the persistent increase in milk supply in several EU Member States (since the milk quotas were lifted in April 2015) and the embargo by Russia on European dairy products (mainly cheese). A significant share of exported dairy products in the EU had gone to Russia and developing countries. Reasons for these exports include the proximity of markets, low transport costs, increases in incomes of these countries, or lack of self-sufficiency by these countries in the production of dairy products [51]. It seems that these markets have been lost, due to the Russian embargo [52,53]. Thirdly, Chinese demand for whole-milk powder decreased. Fourth, the decline in imports by some oil-producing countries, weakened by the lower price of crude oil was observed [51]. Therefore, a slowdown in the growth rate of milk production during this period was observed. However, beginning in 2017, the rate of milk production in the EU has been increasing compared to the preceding period. Evaluation of the data confirms that increased milk production in the EU is possible by using divergent genetic selection choices [54].
Prediction of future changes indicates that milk production may fall compared to 2017. The main reason for this decrease is the cold and wet weather conditions, which delay the growth of permanent pasture in early spring. On the other hand, the summer drought is a very big problem, which has a serious impact on the growth of grassland and feed production in many dairy areas in Europe. Due to the lack of feed, some farmers accelerated the slaughter of cows and heifers. However, given the constant demand for dairy products in the EU, milk production is expected to increase [55]. Our analysis confirms this. A decrease in cow’s milk production can be observed in 2018, but in the following years, this value will increase. The decrease in average production related to a period of heat stress also increasing problem. However, a statistical error indicates that a further decrease in production cannot be excluded (Figure 1).
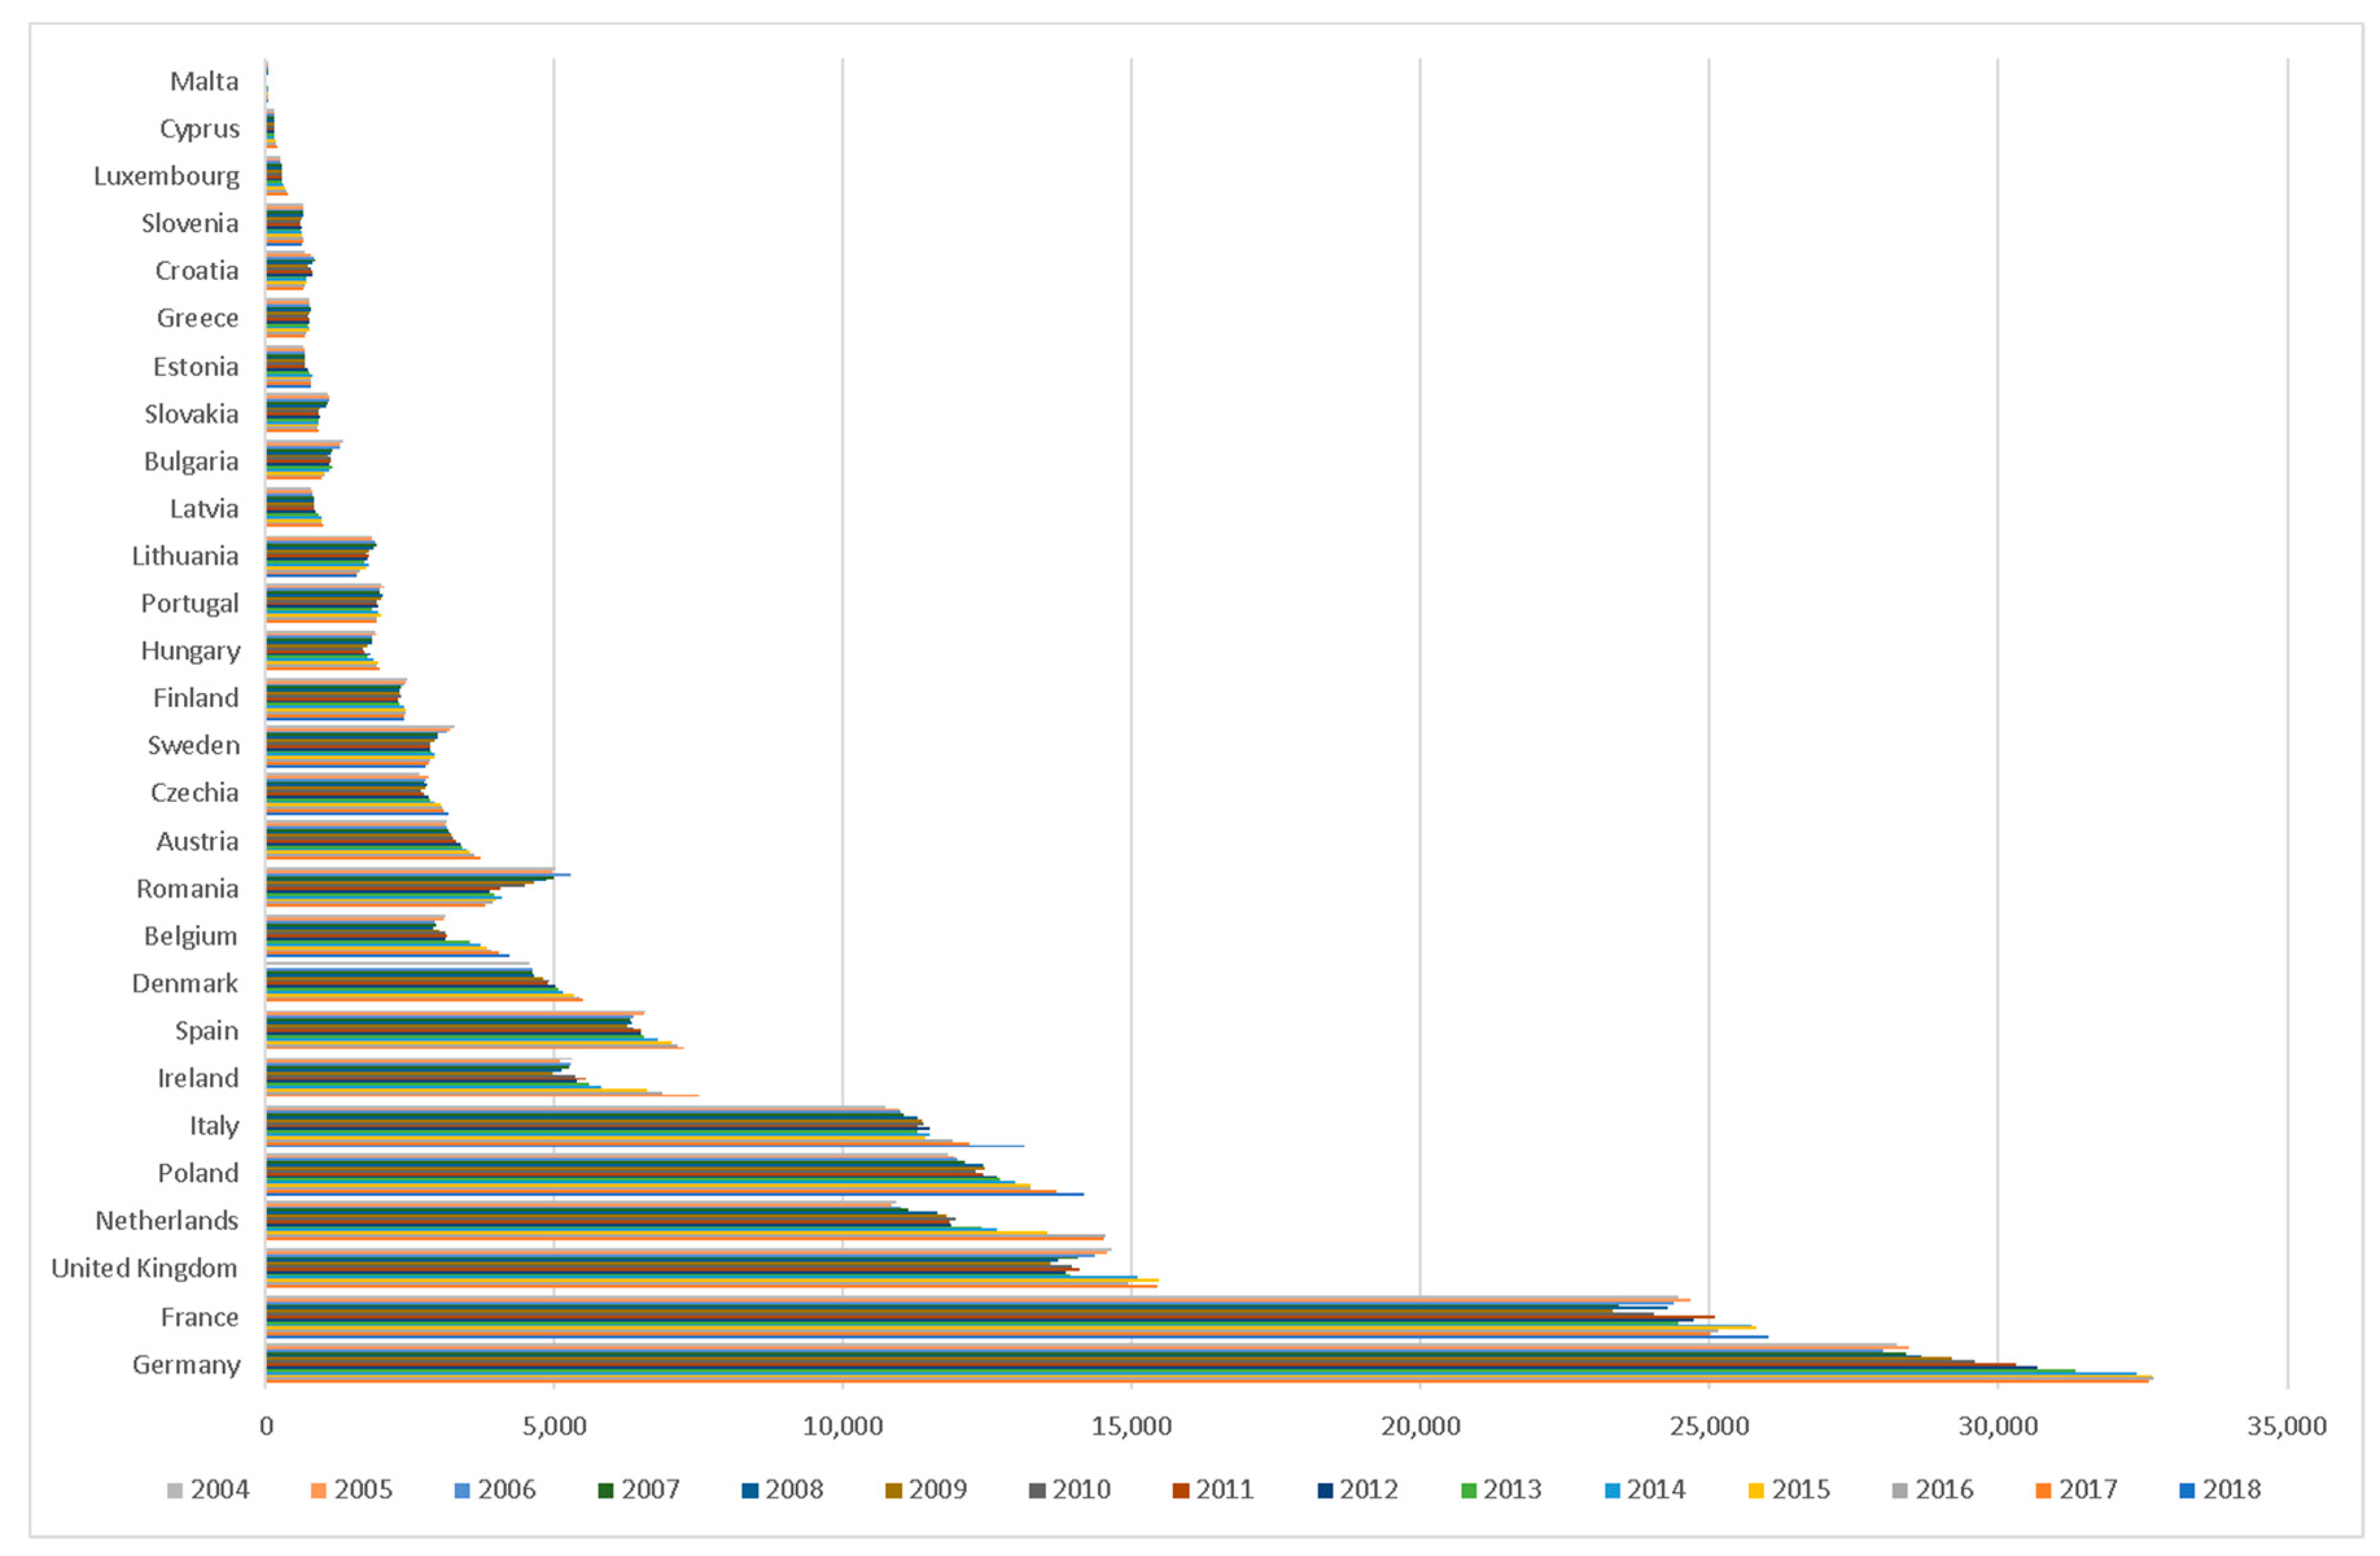
When analyzing the spatial diversity of milk production in the EU in 2015–2017, attention should be paid to high heterogeneity. This is indicated by the volatility coefficients, which vary from 135 to 137%. However, concentration analysis, with a large variation in production, indicates a lack of uniformity. The Gini coefficient in the years 2015–2017 was the same (0.691), which indicates a relatively high concentration (with simultaneous spatial differentiation) of production. In turn, the Herfindahl ratio in 2015 was (0.099) in 2016 and (0.100) in 2017, which also indicates intense competition, but with a dominant share of around 10 countries. Figure 2 shows that the leading EU countries for milk production are Germany and France. The next highest milk-producing countries are: United Kingdom, Netherlands, Poland and Italy, with the latter being less than 50% of Germany’s share. The next group, with a similar production levels, is: Ireland, Spain, and Denmark. Additionally, there are many EU countries produce very small amounts of milk, including Malta, Cyprus, Luxembourg, Slovenia, Croatia, Greece, Estonia, Slovakia, Bulgaria, and Latvia (Figure 2).
Not only do the changes in organization of supply chains result in an increase in requirements, but also create opportunities for gaining access to new markets and vertically organized supply chain systems. In addition, the liberalization of trade in the EU, and the privatization of milk processing enterprises have opened the dairy sector to greater foreign competition. These actions have contributed to an increase in investments in the dairy sector [56]. A study into changes in milk supply chains was conducted by Robinowitz and Liu [57]. Its results show that the processing and retail trade creates a need for investments in agricultural farms, and affect the retail price of milk.
Milk production worldwide has been on the increase, and is stimulated by the increase in demand, dietary changes, and enterprises which supply farms with production factors, feed, modern machinery, and services [58]. Milk producers need to face the increasing competition of producers both in Poland and abroad. In the constantly changing global environment, milk producers must be prepared to make use of the existing opportunities and to accept new technologies in order to remain competitive [59,60]. In order to be able to cope with the increasing competition, milk producers need to realize necessary investments to increase production and adjust it to standards. Investments improve technical efficiency of dairy farms and generate incomes [61].
The descriptive statistics of production of cow’s milk on farms in the EU countries for 2004–2017 can be found in Table 1.
The coefficient of variation (CV) informs about changes which were in the milk production in the years 2004–2017 in the EU countries. The highest coefficient of variation was found in 2015 (137.11%), and the highest average cow’s milk production on farms was found in 2017 (5901.81 thousand tons).
Standard deviation (SD) is a measure of the amount of variation or dispersion of a set of values. The highest was observed in 2017 (7979.57 thousand tons) and the lowest in 2004 (6988.74 thousand tons).
The highest production of cow’s milk on farms in the EU was in 2016 (32,672.34 thousand tons) and the lowest minimum was found in 2008 (39.91 thousand tons).
Investment decisions taken by farmers are a resultant of the impact of both exogenous and endogenous factors. The exogenous factors affecting farmers’ investment activity include factors related to the demand for produced raw materials, the expected and current price levels for agricultural products, the supply conditions and particularly the level of incurred costs, availability and cost of the factors of production, the economic condition—both the current and expected by farmers, system solutions (financial, economic, institutional), economic policy and particularly agricultural policy, fiscal policy, monetary policy, the inflation level and the market interest level determining the cost of receiving a loan, the degree of economy’s openness to international connections, regulations and others [62]. The endogenous factors arise from the production potential of agriculture, the degree of consumption of fixed assets, the level of modernity of the applied production techniques, the level of knowledge of agricultural farm managers, as well as their age, the economic and financial situation of agricultural farms, and particular the level of generated agricultural income [63,64]. The resultant of the impact of external and internal factors are the farmers’ decisions on the realization or abandonment of an investment.
In order to determine if there is any relationship between variables, a correlation analysis was conducted (Table 2). The analysis confirmed that milk production is mostly correlated with imports and exports of goods. Moreover, milk production is also strongly correlated with the gross domestic product at market prices and population. The share of permanent grassland in a utilized agricultural area, gross domestic product at market prices and final consumption expenditure of households are not strongly correlated with milk production.
Despite earlier information about the possibility of a decrease in milk production in the EU, an analysis of changes in the volume of milk supplied by farmers to dairies in the EU shows an average increase of over 14,000 tons per month. A statistically significant and growing trend can be seen in most EU countries, especially in Germany, Poland, and the Netherlands. Only a few countries had a falling trend. Among them were Croatia, Finland, Bulgaria, Slovakia, and Sweden. In turn, in Hungary and Romania are characterized by the lack of statistical dependence. The p value was low in all countries, which means that the model is valid and statistically important (Table 3).
The analysis of factors that may affect milk production on farms generated many interesting results (Table 3). After verification of independent variables, it can be observed that the adjusted R2 = 0.92, so the model explains the vast majority of the variation in milk production on farms in individual EU countries. The multiple regression coefficient R = 0.97 means that raw cows’ milk from farms is strongly correlated with the following variables: X3—gross domestic product at market prices (current prices, million euro); X4—final consumption expenditure of households (current prices, million euro), and X10—population (number). The standard error of estimation was 2222.5.
Based on the results of the regression analysis it can be concluded that the production of cow’s milk on farms is primarily influenced by the GDP in a given country, which means that with the increase of this measure in a given country by EUR 1 million, milk production on farms increased by 28.2 tons, i.e., countries with high GDP have high milk production. At the same time, an increase in household consumption expenditure for a given country by EUR 1 million will result in a decrease in milk production by 45 tonnes. This can be explained by the fact that as the consumer (household) income increases, food expenditure increases, but the share of total expenditure decreases, and consumers begin to purchase alternative products (e.g., soy or nut-based milk, which is more expensive and at the same time considered healthier by some consumers). Thirdly, the population increase in a given country by one person resulted in higher milk production on farms by 0.2 tons (Table 4). This relationship can be written as:
Raw cows’ milk from farm (1 000 t) = 0.0282*Gross domestic product at market prices (Current prices, million euro) − 0.045*Final consumption expenditure of households (Current prices, million euro) + 0.0002*Population (no) + 179.991
5. Implications for Common Agricultural Policy in Milk Market
The present experience with the CAP that was introduced into the milk market did not result in the anticipated effects. The price of milk is highly volatile, and the production is changing. The demand for milk has been changing with people consuming less milk per capita worldwide.
The success of any future policy affecting the milk market depends on communication between policy makers and farmers. It also should reflect local conditions because European agriculture (especially within the dairy sector), environment, and production areas are very diversified [36].
One of the biggest threats to milk production is the increase in demand for soymilk (soy drink) as an alternative to cow-based milk. Milk produced by other species like goats can also be a threat to the dairy market. Such countries as China are going to increase own milk production what will change the trade balance in the future.
Policy recommendation should consider a wide variety of diets for different consumers. This particularly concerns lactose intolerant consumers who should not be restricted to the soymilk only. The dairy industry should be helped to produce products which are alternative to traditional milk, such as yoghurt, kefir, and others, which help with digestion problems. “The promotion of these alternatives can be highly beneficial for creating healthy future generations” [65].
Milk production will not flourish without competitive dairy processing enterprises. It is essential to support milk production on the farm side, as well as the procession enterprises on the other side.
It is important to build good relationships with consumers and promote healthy dairy products in order to better position them in the “growing market of functionally enhanced milk products. Minority households are more likely to purchase these products since they view the specialty milk consumption as a necessity due to the health issues” [2].
The milk production should be adjusted to the requirements of demanding consumers. Organic and sustainable milk production is gaining more and more interests. However, organic milk production still constitutes too small to be an important segment of dairy production [66]. That is why education and advertisement should play an important role in delivering information about the benefits of organic dairy products.
One of the biggest problems in milk production is the contribution of GHG (greenhouse gas) emissions. Milk production contributes to 20% of total emissions, and it has increased by almost 40% during the last three decades. To eliminate this process, several actions should be undertaken. The EC (European Commission) has undertaken actions within CAP which aim is to decrease the GHG emissions [67]. This actions should be adjusted to environmental conditions of each EU member states.
Policy makers should be aware of the consequences of industrial milk production and negative consequences for the environment. Global and local environmental performance can be improved by higher environmental education, organic farming, larger farm size and lower intensity of cattle concentrates. Moreover, the use of more balanced rations, special new products, medications that may reduce NH3 emission can have an impact on milk production [47].
6. Conclusions
In recent years, the volume of milk production has constantly been growing, which indicates the growing importance of this agri-food sector in the EU market. Milk and dairy products constitute the largest agricultural sector and one of the more important industries in the EU.
The biggest milk producers in the EU are Germany, France, the United Kingdom, the Netherlands, Poland, and Italy. The smallest milk producers are Malta, Cyprus, Luxembourg, Slovenia, Croatia, Greece, Estonia, Slovakia, Bulgaria, and Latvia. These demonstrate the spatial differentiation of milk production in the EU. The biggest milk producers are self-sufficient in milk production and represent the largest milk and dairy, product exporters.
The regression analysis showed that the production of raw cow’s milk in the EU depended on the gross domestic product at market prices (current prices, million euro), final consumption expenditure of households (current prices, million euro), and population. The gross domestic market prices and their increase impacted milk production in the EU is the factor shaping the supply side of the market. The final consumption expenditure had a negative impact on milk production. Population growth had a positive impact on milk production in the EU. These results help to explain the increase in milk consumption from population increases.
Author Contributions
Conceptualization, P.B.; methodology, A.P. (Adam Pawlewicz); formal analysis, P.B., A.P. (Adam Pawlewicz); editing A.P. (Andrzej Parzonko); J.K.H., L.H. All authors have read and agreed to the published version of the manuscript.
Funding
This paper was funded by the project financed by the National Science Center (NCN) in Poland, 2018/29/B/HS4/00392.
Conflicts of Interest
The authors declare no conflict of interest. The funders had no role in the design of the study, in the collection, analyses, or interpretation of data, in the writing of the manuscript, or in the decision to publish the results.
References
- Simo, D.; Mura, L.; Buleca, J. Assessment of milk production competitiveness of the Slovak Republic within the EU-27 countries. Agric. Econ. Czech Repub. 2016, 62, 482–492. [Google Scholar] [CrossRef] [Green Version]
- Gulseven, O.; Wohlgenant, M. What are the factors affecting the consumers’ milk choices? Agric. Econ. Czech Repub. 2017, 63, 271–282. [Google Scholar] [CrossRef] [Green Version]
- Tukker, A.; Huppes, G.; Guinée, J.B.; Heijungs, R.; de Koning, A.; van Oers, L.; Suh, S.; Geerken, T.; van Holderbeke, M.; Jansen, B.; et al. Environmental Impact of Products (EIPRO)—Analysis of the Life Cycle Environmental Impacts Related to the Final Consumption of the EU-25; Main Report, IPTS/ESTO Project; European Commission, Directorate-General, Joint Research Centre: Brussels, Belgium, 2006; p. 139. Available online: http://ec.europa.eu/environment/ipp/pdf/eipro_report.pdf (accessed on 1 August 2018).
- Hillerton, J.E.; Berry, E.A. Quality of the Milk Supply: European Regulations Versus Practice. In Proceedings of the NMC 43rd Annual Meeting, 1–4 February 2004. [Google Scholar]
- Cabrera, V.E.; Solis, D.; Del Corral, J. Determinants of technical efficiency among dairy farms in Wisconsin. J. Dairy Sci. 2010, 93, 387–393. [Google Scholar] [CrossRef] [PubMed] [Green Version]
- Schick, M.; Hartmann, W. Arbeitszeitbedarfswerte in der Milchviehhaltung. Landtechnik 2005, 60, 226–227. [Google Scholar] [CrossRef]
- Pouch, T.; Trouvé, A. Deregulation and the crisis of dairy markets in Europe: facts for economic interpretation. Stud. Political Econ. 2018, 99, 194–212. [Google Scholar] [CrossRef]
- Pietola, K.; Heikkilä, A.M. Switching toward capital-intensive technologies in Finnish dairy farms. Agric. Econ. 2005, 33, 381–387. [Google Scholar] [CrossRef]
- Kramer, B.; Schorr, A.; Doluschitz, R.; Lips, M. Short and medium-term impact of dairy barn investment on profitability and herd size in Switzerland. Agric. Econ. Czech Repub. 2019, 65, 270–277. [Google Scholar] [CrossRef] [Green Version]
- Bewley, J. Precision dairy farming: Advanced analysis solutions for future profitability. In Proceedings of the First North American Conference on Precision Dairy Management, Toronto, ON, Canada, 2–5 March 2010. [Google Scholar]
- Wijnands, J.H.M.; van der Meulen, B.M.J.; Poppe, K.J. Competitiveness of the European Food Industry: An Economic and Legal Assessment 2007; Office for Official Publications of the European Communities: Luxemburg, 2007. [Google Scholar]
- Tacken, G.M.L.; Banse, M.A.H.; Batowska, A.; Gardebroek, C.; Turi, K.N.; Wijnands, J.H.M.; Poppe, K. Competitiveness of the EU Dairy Industry; LEI Wageningen UR: The Hague, The Netherlands, 2009. [Google Scholar]
- Naglova, Z.; Boberova, B.; Horakova, T.; Smutka, L. Statistical analysis of factors influencing the results of enterprises in dairy industry. Agric. Econ. Czech Repub. 2017, 63, 259–270. [Google Scholar] [CrossRef] [Green Version]
- FoodDrinkEurope. European Food and Drink Industry 2014–2015. 2014. Available online: https://www.fooddrinkeurope.eu/publication/data-trends-of-the-european-food-and-drink-industry-2013-2014/ (accessed on 27 July 2019).
- Gołębiewski, J. Economic performance of sectors along the food supply chain–comparative study of the European Union countries. Acta Sci. Pol. Oecon. 2018, 17, 69–78. [Google Scholar] [CrossRef]
- Pietrzak, M.; Roman, M. The problem of geographical delimitation of agri-food markets: Evidence from the butter market in European Union. Acta Sci. Pol. Oecon. 2018, 17, 85–95. [Google Scholar] [CrossRef]
- Zimmermann, A.; Heckelei, T. Structural change of European dairy farms-a case regional analysis. J. Agric. Econ. 2012, 63, 576–603. [Google Scholar] [CrossRef] [Green Version]
- Huettel, S.; Jongeneel, R. How has the EU milk quota affected patterns of herd-size change? Eur. Rev. Agric. Econ. 2011, 38, 497–527. [Google Scholar] [CrossRef]
- Dries, L.; Swinnen, J.F.M. The impact of interfirm relationship on investment: Evidence from the Polish dairy sector. Food Policy 2010, 35, 121–129. [Google Scholar] [CrossRef]
- Bórawski, P.; Pawlewicz, A.; Harper, J.K.; Dunn, J.W. The Intra-European Union Trade of Milk and Dairy Products. Acta Sci. Pol. Oecon. 2019, 18, 13–23. [Google Scholar] [CrossRef]
- Zuba-Ciszewska, M. The Role of Dairy Cooperatives in Reducing Waste of Dairy Products in the Lubelskie Voivodeship. J. Agribus. Rural Dev. 2018, 1, 97–105. [Google Scholar] [CrossRef]
- Von Keyserlingk, M.A.G.; Martin, N.P.; Kebreab, E.; Knowlton, K.F.; Grant, R.J.; Stephenson, M.W.; Sniffen, C.J.; Harner, J.P., III; Wright, A.D.; Smith, S.I. Invited review: Sustainability of the US dairy industry. J. Dairy Sci. 2013, 96, 5405–5425. [Google Scholar] [CrossRef] [Green Version]
- Krpalkova, L.; Cabrera, V.E.; Kvapilik, J.; Burdych, J. Dairy farm profit according to the herd size, milk yield, and number of cows per worker. Agric. Econ. Czech Repub. 2016, 62, 225–234. [Google Scholar] [CrossRef] [Green Version]
- Stelwagen, K.; Phyn, C.V.C.; Davis, S.R.; Guinard-Flament, J.; Pomies, D.; Roche, J.R.; Kay, J.K. Invited review: Reduced milking frequency: Milk production and management implications. J. Dairy Sci. 2013, 96, 3401–3413. [Google Scholar] [CrossRef] [PubMed]
- Zakova Kroupova, Z. Profitability development of Czech dairy farms. Agric. Econ. Czech Repub. 2016, 62, 269–279. [Google Scholar] [CrossRef] [Green Version]
- Folmer, C.; Keyzer, M.A.; Merbis, M.D.; Stolwijk, H.J.J.; Veenendaal, P.J.J. The Common Agricultural Policy Beyond the MacSharry Reform; Tinbergen, J., Ed.; Elsevier: Amsterdam, The Netherlands, 2013. [Google Scholar]
- Zhu, X.; Demeter, R.M.; Oude Lansink, A.G.J.M. Competitiveness of Dairy Farms in Three Countries: The Role of CAP Subsidies. In Proceedings of the 12th Congress of the European Association of Agricultural Economists—EAAE, Ghent, Belgium, 26–29 August 2008. [Google Scholar]
- Groeneveld, A.; Peerlings, J.; Bakker, M.; Heijman, W. The effect of milk quota abolishment on farm intensity: Shifts and stability. NJAS-Wagening. J. Life Sci. 2016, 77, 25–37. [Google Scholar] [CrossRef]
- Réquillart, V.; Bouamra-Mechemache, Z.; Jongeneel, R.; Penel, C. Economic Analysis of the Effects of the Expiry of the EU Milk Quota System. 2008. Available online: https://ec.europa.eu/agriculture/external-studies/milk_en (accessed on 19 September 2019).
- Bouamra-Mechemache, Z.; Jogeneel, R.; Réquillart, V. Removing EU Milk Quotas, Soft Landing Versus Hard Landing. In Proceedings of the 12th Congress of the European Association of Agricultural Economists, Ghent, Belgium, 26–29 August 2008. [Google Scholar]
- Boulanger, P.; Philippidis, G. The EU budget battle: Assessing the trade and welfare impacts of CAP budgetary reform. Food Policy 2015, 51, 119–130. [Google Scholar] [CrossRef] [Green Version]
- Lobley, M.; Butler, A. The impact of CAP reform on farmers’ plans for the future: Some evidence from South West England. Food Policy 2010, 35, 341–348. [Google Scholar] [CrossRef]
- EUROSTAT. Archive: Milk and Milk Products—30 Years of Quotas. 2015. Available online: https://ec.europa.eu/eurostat/statistics-explained/index.php/Archive:Milk_and_milk_products_-_30_years_of_quotas (accessed on 27 July 2019).
- Van Kampen, A.; Versepu, S. Zo gaat de afschaffing van het melkquotum de markt veranderen [This is How the Milk Quota Abolishment Will Change the Market]. 2014. Available online: https://www.nrc.nl/nieuws/2014/11/12/zo-gaat-de-afschaffing-van-het-melkquotum-de-markt-veranderen-a1499052 (accessed on 12 October 2019).
- Szajner, P. Price transmission on milk market in Poland between 2004 and 2017. Probl. Agric. Econ. 2017, 4, 3–23. [Google Scholar] [CrossRef] [Green Version]
- Alpmann, J.; Bitsch, V. Dynamics of asymmetric conflict: The case of the German Milk Conflict. Food Policy 2017, 66, 62–72. [Google Scholar] [CrossRef]
- BMEL. Ein Paradigmenwechsel am Milchmarkt—von der Milchquotenregelung zu mehr Verantwortung der Marktakteure [A Paradigm Shift in the Milk Market—From the Milk Quota Regime to Greater Responsibility of the Market Players]. 2015. Available online: https://www.bmel.de/DE/Landwirtschaft/Agrarpolitik/1_EU-Marktregelungen/_Texte/Auswirkungen-Ende-Milchquote.html (accessed on 12 October 2019).
- RegulationEU. No 261/2012 of the European Parliament and of the Council of 14 March 2012 amending Council Regulation (EC) No 1234/2007 as Regards Contractual Relations in the Milk and Milk Products Sector. Available online: https://eur-lex.europa.eu/legal-content/PL/TXT/?uri=uriserv%3AOJ.L_.2012.094.01.0038.01.ENG&toc=OJ%3AL%3A2012%3A094%3ATOC (accessed on 7 September 2019).
- Parzonko, A. The role of subsidies for cows and other cattle in the polish system direct payments in the development of the dairy sector. Ann. Pol. Assoc. Agric. Agribus. Econ. 2017, 19, 144–150. [Google Scholar] [CrossRef]
- Wąs, A.; Malak-Rawlikowska, A.; Majewski, E. The new delivery model of the Common Agricultural Policy after 2020-challenges for Poland. Probl. Agric. Econ./Zag. Ekon. Rolnej 2018, 4, 33–59. [Google Scholar] [CrossRef]
- Yarwood, R.; Evans, N. Livestock, locality and landscape: EU regulations and the new geography of Welsh farm animals. Appl. Geogr. 2003, 23, 137–157. [Google Scholar] [CrossRef] [Green Version]
- Shum, L.W.C.; McConnel, C.S.; Gunn, A.A.; House, J.K. Environmental mastitis in intensive high-producing dairy herds in New South Wales. Aust. Vet. J. 2009, 87, 469–475. [Google Scholar] [CrossRef]
- Stafford, K.J.; Gregory, N.G. Implications of intensification of pastoral animal production on animal welfare. N. Z. Vet. J. 2008, 56, 274–280. [Google Scholar] [CrossRef]
- Lagane, J. When students run AMAPs: Towards a French model of CSA. Agric. Hum. Values 2015, 32, 133–141. [Google Scholar] [CrossRef]
- Soltanali, H.; Emadi, B.; Rohani, A.; Khojastehpour, M.; Nikkhah, A. Life cycle assessment modeling of milk production in Iran. Inf. Process. Agric. 2015, 2, 101–108. [Google Scholar] [CrossRef] [Green Version]
- Olipra, J. Cycles in the Global Milk Market. J. Agribus. Rural Dev. 2019, 52, 165–172. [Google Scholar] [CrossRef]
- Repar, N.; Pierrick, J.; Nemecek, T.; Dunja Dux, D.; Reiner Doluschitz, R. Factors Affecting Global versus Local Environmental and Economic Performance of Dairying: A Case Study of Swiss Mountain Farms. Sustainability 2018, 10, 2940. [Google Scholar] [CrossRef] [Green Version]
- Hunt, T.; Kern, M. The End of the Old US Dairy Price Cycle. 2012. Available online: https://www.progressivedairy.com/topics/management/the-end-of-the-old-us-dairy-price-cycle (accessed on 12 October 2019).
- Tauer, L.W. Efficiency and competitiveness of the small New York dairy farm. J. Dairy Sci. 2001, 84, 2573–2576. [Google Scholar] [CrossRef]
- Parzonko, A. Global and region al conditions for milk production development. Rozprawy Naukowe i Monografie. Szkoła Główna Gospodarstwa Wiejskiego w Warszawie 2013, 426, 210. [Google Scholar]
- Chatellier, V. International, European and French Trade in Dairy Products: Trends and Competitive Dynamics. In Working Paper SMART—LERECO; INRA UMR SMART-LERECO: Rennes, France, 2017; Volume 17, p. 49. [Google Scholar]
- Bórawski, P.; Bełdycka-Bórawska, A. Polish international trade of agri food productsand its prognosis. Probl. World Agric./Probl. Rol. Świat. 2016, 16, 48–59. [Google Scholar]
- Pawlak, K. Changes in Polish foreign trade in agri-food products after accession to the European Union. Probl. World Agric. 2014, 14, 170–184. [Google Scholar]
- Windig, J.J.; Calus, M.P.L.; Beerda, B.; Veerkamp, R.F. Genetic correlations between milk production and health and fertility depending on herd environment. J. Dairy Sci. 2006, 89, 1765–1775. [Google Scholar] [CrossRef]
- EC. EU Agricultural Outlook for Markets and Income, 2018–2030. 2018. Available online: https://euagenda.eu/publications/eu-agricultural-outlook-for-markets-and-income-2018-2030 (accessed on 27 July 2019).
- Dries, L.; Germenji, E.; Noev, N.; Swinnen, J.F.M. Farmers, vertical coordination, and the restructuring of Polish supply chains in Central and Eastern Europe. World Dev. 2009, 37, 1742–1758. [Google Scholar] [CrossRef]
- Rabinowitz, A.N.; Liu, Y. The impact of regulations change on retail pricing: The New York state milk price gouging law. Agric. Resour. Econ. 2014, 43, 178–192. [Google Scholar] [CrossRef]
- Bernard, J.; LeGal, P.Y.; Triophe, B.; Hoostiou, N.; Moulin, C.H. Involvement of small-scale dairy farms in an industrial supply chain: When production standards meet farm diversity. Animal 2011, 5, 961–971. [Google Scholar] [CrossRef] [PubMed] [Green Version]
- Moreira, A.; Bravo-Ureta, B. Technical efficiency and meta technology ratios for dairy farms in three southern cone countries: A stochastic meta-frontier model. J. Prod. Anal. 2010, 33, 33–45. [Google Scholar] [CrossRef]
- Blayney, D.P.; Gehlhar, M.J. U.S. dairy at a new crossroads in a global setting. Amber Waves 2005, 3, 1–6. [Google Scholar]
- Van Asseldonk, M.A.P.M.; Huirne, R.B.M.; Dijkhuizeb, A.A.; Beulens, A.J.M. Dynamic programming to determine optimum investments in information technology on dairy farms. Agric. Syst. 1999, 62, 17–28. [Google Scholar] [CrossRef]
- Thijssen, G. Farmers’ Investment Behavior: An Empirical Assessment of Two Specifications of Expectations. Am. J. Agric. Econ. 1996, 78, 166–174. [Google Scholar] [CrossRef]
- Gallerani, V.; Gomez y Paloma, S.; Raggi, M.; Viaggi, D. Investment Behaviour in Conventional and Emerging Farming Systems under Different Policy Scenarios; JRC Scientific and Technical Report Institute for Prospective Technological Studies; European Commission: Brussels, Belgium, 2008; p. 170. [Google Scholar]
- Kataria, K.; Curtiss, J.; Balmann, A. Drivers of Agricultural Physical Capital Development, Theoretical Framework and Hypotheses; Working Papers 122842; Factor Markets, Centre for European Policy Studies: Brussels, Belgium, 2012. [Google Scholar]
- Waldman, K.B.; Kerr, J.M. Is Food and Drug Administration policy governing artisan cheese consistent with consumers’ preferences? Food Policy 2015, 55, 71–80. [Google Scholar] [CrossRef]
- Hafla, A.N.; MacAdam, J.W.; Soder, K.J. Sustainability of US organic beef and dairy production sustems: Soil, plant and cattle interactions. Sustainability 2013, 5, 3009–3034. [Google Scholar] [CrossRef] [Green Version]
- Morais, T.G.; Teixeira, R.M.; Rodrigues, N.R.; Domingos, T. Carbon footprint of milk from pastyre-based dairy farms in Azores, Portugal. Sustainability 2018, 10, 3658. [Google Scholar] [CrossRef] [Green Version]
Figure 1.
Cow milk production in farms and change dynamics in 1998–2017 in the EU and forecast in 2018–2020 (thousand tons, %, CI—confidence interval). Note: Own studies based on Eurostat data (Production and utilization of milk on the farm—annual data [apro_mk_farm]; last update 12 September 2019, extracted on 13 September 2019).

Figure 2.
Production of cow’s milk on farms in the EU countries in 2015–2018 in thousand tons (2018 data available only for selected countries). Note: Own studies based on Eurostat data (Production and utilization of milk on the farm—annual data [apro_mk_farm]; last update 12 September 2019, extracted on 13 September 2019).


Table 1.
Descriptive statistics production of cow’s milk on farms in the EU countries in 2004–2017.
| Years | N | Average | Median | Minimum | Maximum | SD | CV |
|---|---|---|---|---|---|---|---|
| Number | Thousand Tons | Thousand Tons | Thousand Tons | Thousand Tons | Thousand Tons | % | |
| 2004 | 28 | 5324.63 | 2561.95 | 41.99 | 28,244.73 | 6988.74 | 131.25 |
| 2005 | 28 | 5374.32 | 2433.20 | 41.47 | 28,452.95 | 7163.35 | 133.29 |
| 2006 | 28 | 5318.87 | 2590.07 | 41.02 | 27,994.97 | 6950.36 | 130.67 |
| 2007 | 28 | 5279.42 | 2555.80 | 40.59 | 28,402.77 | 6909.23 | 130.87 |
| 2008 | 28 | 5333.43 | 2556.11 | 39.91 | 28,656.26 | 7039.72 | 131.99 |
| 2009 | 27 * | 5492.60 | 2780.66 | 152.10 | 29,198.68 | 7084.71 | 128.97 |
| 2010 | 27 * | 5557.10 | 2682.52 | 151.02 | 29,593.88 | 7218.02 | 129.89 |
| 2011 | 27 * | 5629.66 | 2735.93 | 156.02 | 30,301.36 | 7410.42 | 131.63 |
| 2012 | 27 * | 5642.16 | 2814.68 | 153.74 | 30,672.15 | 7422.50 | 131.55 |
| 2013 | 28 | 5497.80 | 2588.62 | 40.92 | 31,324.24 | 7432.63 | 135.19 |
| 2014 | 28 | 5704.14 | 2665.83 | 42.77 | 32,381.06 | 7737.39 | 135.65 |
| 2015 | 28 | 5817.80 | 2684.96 | 41.57 | 32,670.88 | 7976.87 | 137.11 |
| 2016 | 28 | 5837.22 | 2645.91 | 43.13 | 32,672.34 | 7949.36 | 136.18 |
| 2017 | 28 | 5901.81 | 2611.21 | 41.03 | 32,598.20 | 7979.57 | 135.21 |
* In the years 2009–2012 there is Lack of data for Malta; SD—standard deviation; CV—coefficient of variation. Source: Own studies based on Eurostat data (Production and utilization of milk on the farm—annual data [apro_mk_farm]; last update 12 September 2019, extracted on 13 September 2019).
Table 2.
Correlation analysis between dependable variable raw cows’ milk production in a farm and explanatory variables (p = 0.100, n = 27).
Table 2.
Correlation analysis between dependable variable raw cows’ milk production in a farm and explanatory variables (p = 0.100, n = 27).
| Variable | Average | S D. | Raw Cows’ Milk from Farm (1000 t) |
|---|---|---|---|
| Raw cows’ milk from farm (1000 t) | 6119 | 8047 | 1 |
| Gross domestic product at market prices (Current prices, million euro) | 568,508 | 845,857 | 0.922137 * |
| Final consumption expenditure of households (Current prices, million euro) | 306,163 | 467,620 | 0.885822 * |
| Exports of goods (Current prices, million euro) | 185,587 | 261,299 | 0.929326 * |
| Imports of goods (Current prices, million euro) | 175,888 | 227,895 | 0.944257 * |
| Subsidies (Current prices, million euro) | 9300 | 14,317 | 0.817275 * |
| Gross domestic product at market prices (Current prices, euro per capita) | 29,378 | 19,225 | 0.183248 |
| Final consumption expenditure of households (Current prices, euro per capita) | 14,211 | 6461 | 0.346923 |
| Population (no) | 18,922,703 | 23,886,027 | 0.892247 * |
| Permanent grassland (ha) | 2,190,073 | 2,788,274 | 0.660394 * |
| Share of permanent grassland in Utilised Agricultural Area (%) | 33 | 19 | 0.067514 |
* Correlation coefficient significant at 0.01; n = 27 without Malta because there is no data. Note: Own studies based on Eurostat data (Cows’milk collection and products obtained from January 1990 to July 2019—monthly data [apro_mk_colm], January 1990 last update 10 September 2019, extracted on 13.
Table 3.
Results of the linear regression of raw cows’ milk delivered to dairies (2017) in thousand tons.
Table 3.
Results of the linear regression of raw cows’ milk delivered to dairies (2017) in thousand tons.
| Specification | Valid N | r | r2 | p | SE | Regression Equation | ↑⁄↓ |
|---|---|---|---|---|---|---|---|
| European Union (28) | 79 | 0.6729 | 0.4528 | 0.0000 | 761.03 | y = 8201.0273 + 14.375 *x | ↑ |
| European Union 15 (1995–2004) | 211 | 0.6783 | 0.4601 | 0.0000 | 701.59 | y = 8655.6546 + 6.8003 *x | ↑ |
| Germany | 355 | 0.7710 | 0.5945 | 0.0000 | 152.6 | y = 2013.3107 + 1.7979 *x | ↑ |
| Poland | 183 | 0.8177 | 0.6686 | 0.0000 | 66.923 | y = 356.5388 + 1.7894 *x | ↑ |
| The Netherlands | 355 | 0.7359 | 0.5415 | 0.0000 | 75.906 | y = 805.9958 + 0.8027 *x | ↑ |
| Ireland | 355 | 0.1998 | 0.0399 | 0.0002 | 229.73 | y = 385.1576 + 0.4558 *x | ↑ |
| Spain | 354 | 0.7532 | 0.5673 | 0.0000 | 39.622 | y = 411.0429 + 0.4427 *x | ↑ |
| France | 354 | 0.2182 | 0.0476 | 0.0000 | 182.97 | y = 1900.0505 + 0.3992 *x | ↑ |
| Italy | 354 | 0.5594 | 0.3129 | 0.0000 | 59.769 | y = 789.2863 + 0.3936 *x | ↑ |
| Denmark | 355 | 0.7217 | 0.5208 | 0.0000 | 25.079 | y = 347.6452 + 0.2544 *x | ↑ |
| Belgium | 355 | 0.6185 | 0.3825 | 0.0000 | 32.782 | y = 227.682 + 0.2511 *x | ↑ |
| Austria | 294 | 0.7959 | 0.6335 | 0.0000 | 16.025 | y = 178.1701 + 0.2474 *x | ↑ |
| Czechia | 187 | 0.5714 | 0.3265 | 0.0000 | 18.331 | y = 151.1571 + 0.2352 *x | ↑ |
| Lithuania | 235 | 0.4652 | 0.2164 | 0.0000 | 22.729 | y = 63.3998 + 0.1753 *x | ↑ |
| Latvia | 199 | 0.7496 | 0.5620 | 0.0000 | 8.6849 | y = 12.0155 + 0.1704 *x | ↑ |
| Estonia | 234 | 0.8934 | 0.7982 | 0.0000 | 4.1717 | y = 22.1291 + 0.1215 *x | ↑ |
| United Kingdom | 355 | 0.1284 | 0.0165 | 0.0155 | 87.525 | y = 1163.8126 + 0.1103 *x | ↑ |
| Portugal | 355 | 0.5466 | 0.2987 | 0.0000 | 15.191 | y = 129.8008 + 0.0965 *x | ↑ |
| Slovenia | 234 | 0.7289 | 0.5314 | 0.0000 | 2.3518 | y = 34.8294 + 0.0369 *x | ↑ |
| Greece | 354 | 0.4810 | 0.2314 | 0.0000 | 5.7533 | y = 45.5566 + 0.0308 *x | ↑ |
| Cyprus | 235 | 0.7924 | 0.6280 | 0.0000 | 1.5237 | y = 6.4896 + 0.0291 *x | ↑ |
| Luxembourg | 355 | 0.6698 | 0.4487 | 0.0000 | 2.9187 | y = 18.8402 + 0.0256 *x | ↑ |
| Malta | 116 | 0.1749 | 0.0306 | 0.0603 | 0.19849 | y = 3.3357 + 0.0005 *x | ↑ |
| Hungary | 199 | −0.0523 | 0.0027 | 0.4630* | 10.628 | y = 125.4752 − 0.0096 *x | ↓ |
| Romania | 187 | −0.0417 | 0.0017 | 0.5713* | 14.776 | y = 86.2107 − 0.0114 *x | ↓ |
| Croatia | 234 | −0.1307 | 0.0171 | 0.0457 | 7.2021 | y = 49.4579 − 0.014 *x | ↓ |
| Finland | 295 | −0.1722 | 0.0297 | 0.0030 | 9.9303 | y = 200.176 − 0.0203 *x | ↓ |
| Bulgaria | 163 | 0.3470 | 0.1204 | 0.0000 | 9.5838 | y = 69.7304 − 0.0749 *x | ↓ |
| Slovakia | 211 | −0.6821 | 0.4653 | 0.0000 | 5.2388 | y = 93.7112 − 0.0799 *x | ↓ |
| Sweden | 294 | −0.7501 | 0.5627 | 0.0000 | 12.945 | y = 290.3685 − 0.1724 *x | ↓ |
Valid N—number of available monthly data included in the regression analysis; SE—standard error—the average difference between the actual values of the dependent variable and the predicted values by the model; * p > 0.05. Note: Own studies based on Eurostat data (Cows’ milk collection and products obtained from January 1990 to July 2019—monthly data [apro_mk_colm], January 1990 last update 10 September 2019, extracted on 13 September 2019).
Table 4.
Summary of dependent variable regression.
| N = 27 | R = 0.96567124 R^2 = 0.93252094 Corrected. R2 = 0.92371932 F (3, 23) = 105.95 p < 0.00000 std. Error: 2222.5 | |||||
|---|---|---|---|---|---|---|
| B * | SE with b * | b | SE with b | T (23) | p | |
| Intersept | 179.991 | 586.9733 | 0.30664 | 0.761874 | ||
| Gross domestic product at market prices (Current prices, million euro) | 2.96181 | 0.448553 | 0.0282 | 0.0043 | 6.60304 | 0.000001 |
| Final consumption expenditure of households (Current prices, million euro) | −2.61334 | 0.496457 | −0.045 | 0.0085 | −5.26399 | 0.000024 |
| Population (no) | 0.57863 | 0.20998 | 0.0002 | 0.0001 | 2.75565 | 0.011258 |
Note: Own studies based on Eurostat data.
© 2020 by the authors. Licensee MDPI, Basel, Switzerland. This article is an open access article distributed under the terms and conditions of the Creative Commons Attribution (CC BY) license (http://creativecommons.org/licenses/by/4.0/).
Share and Cite
MDPI and ACS Style
Bórawski, P.; Pawlewicz, A.; Parzonko, A.; Harper, J.K.; Holden, L. Factors Shaping Cow’s Milk Production in the EU. Sustainability 2020, 12, 420. https://0-doi-org.brum.beds.ac.uk/10.3390/su12010420
AMA Style
Bórawski P, Pawlewicz A, Parzonko A, Harper JK, Holden L. Factors Shaping Cow’s Milk Production in the EU. Sustainability. 2020; 12(1):420. https://0-doi-org.brum.beds.ac.uk/10.3390/su12010420
Chicago/Turabian StyleBórawski, Piotr, Adam Pawlewicz, Andrzej Parzonko, Jayson, K. Harper, and Lisa Holden. 2020. "Factors Shaping Cow’s Milk Production in the EU" Sustainability 12, no. 1: 420. https://0-doi-org.brum.beds.ac.uk/10.3390/su12010420
Note that from the first issue of 2016, this journal uses article numbers instead of page numbers. See further details here.