A Time-Efficiency Study of Medium-Duty Trucks Delivering in Urban Environments
by
Ivan Sanchez-Diaz
1,*, 
Laura Palacios-Argüello
2,
Anders Levandi
1,
Jimmy Mardberg
1 and
Rafael Basso
3 1
Department of Technology Management and Economics, Chalmers University of Technology, 41296 Göteborg, Sweden
2
LVMT Laboratoire Ville, Transport et Mobilité, 77455 Marne-la-Vallée CEDEX 2, France
3
Volvo Technology, 41296 Göteborg, Sweden
*
Author to whom correspondence should be addressed.
Sustainability 2020, 12(1), 425; https://0-doi-org.brum.beds.ac.uk/10.3390/su12010425
Submission received: 14 November 2019
/
Revised: 19 December 2019
/
Accepted: 27 December 2019
/
Published: 6 January 2020
(This article belongs to the Special Issue City Logistics)
Abstract
:This paper uses data from a major logistics service provider in Gothenburg (Sweden) to (i) identify the different activities in a typical urban distribution tour, (ii) quantify the time required by drivers to perform each of these activities, and (iii) identify potential initiatives to improve time efficiency. To do so, the authors collected GPS data, conducted a time-study of the activities performed by the drivers for a week, conducted a focus group with the drivers, and a set of interviews with managers. The results show that driving represents only 30% of the time, another 15% is spent on breaks, and the remaining 55% is used to perform activities related to customer service, freight handling, and planning. The latter are subdivided into multiple activities, each taking a small amount of time. A focus group with the drivers and some interviews revealed several initiatives to improve time efficiency. Most initiatives can bring small gains, but when aggregating all potential time savings there is a big potential to improve overall time efficiency. Initiatives with highest potential and low cost are: providing better pre-advice on upcoming customers, improving route planning, having hand-free cell phone use, and enhancing handling equipment.
1. Introduction
Transport operators, and particularly parcel delivery companies, are facing increasingly complex challenges to deliver in urban areas. Not only traffic conditions have deteriorated due to an increasing urban population and scarce space resources, but innovations in business models and supply chain management strategies have imposed additional constraints to transport companies. New supply chain management strategies including centralized inventory control and just-in-time practices have led to smaller consignment sizes delivered more frequently and a need to ensure short and reliable delivery times [1]. Simultaneously, the rise of e-commerce tied to fast home deliveries has also contributed to having more and smaller parcels delivered to scattered destinations in a race against time [1]. All this happens in urban environments where vehicles are frequently trapped in congestion and where regulation aiming at having more livable cities often impose restrictions on transport operators.
Although larger vehicles allow economies of scale and opportunities to increase efficiency by having more volume delivered per truck in a single tour, using medium-duty vehicles for parcel delivery can lead to capacity sub-utilization. The main reason is that time—and not weight or volume—is the most common limiting factor for less-than-truckload (LTL) companies operating in congested urban environments [2]. Transport operators have found different ways to face these challenges: (i) adapting vehicle size to avoid unused capacity and meet vehicle restrictions, (ii) finding innovative strategies for the last-mile, often relying on transshipment to smaller vehicles, (iii) increasing the efficiency of operations using existing vehicles, and (iv) collaborating with the public sector to design new policy that increases efficiency and reduces externalities.
Companies with integrated transport and transport operators with higher margins can react with a renovation of their fleet, i.e., replacing each large truck with several small vehicles [3]. This type of solution allows to meet customers’ expectations but hinders operators’ efficiency as more resources (fleet, staff, and operational costs) are required to deliver the same number of parcels. Other operators—often with smaller margins—are pushed to look for innovative ways to increase the efficiency of their operations. Along with last-mile innovations (e.g., delivery lockers, crowd-sourcing) and public sector programs (e.g., off-hour deliveries, consolidation centers), efficiency improvements can come from small incremental gains produced within transport operators, e.g., United Parcel Service (UPS) increased by 350,000 the number of packages delivered per year with the same fleet by eliminating left-hand turns [4].
Gains in time efficiency are crucial for medium-duty trucks in the less-than-truckload business because a better use of capacity opens opportunities to increase revenue (more stops per tour, fewer kms/delivery, lower cost/delivery) and decrease externalities (e.g., fewer kms and congestion). The purpose of this paper is to identify initiatives with potential to increase time efficiency of LTL medium-duty vehicles delivering in urban environments. To fulfil this purpose, the authors study distribution activities from a driver point of view. As drivers are on the front line of delivery operations, they have a privileged position to identify sources of inefficiencies. The scope of this study is thus limited to initiatives with potential to decrease the time used for distribution activities, assuming that this would lead to a larger number of deliveries per tour. Demand and tactical strategies were not studied. This paper is based on the results from a master thesis assessing the future development of medium-duty electric vehicles [5]. This paper has four sections in addition to this introduction. Section 2 presents a literature review about efficiency in urban freight distribution. Section 3 presents the method and data. Section 4 presents the results; Section 5 the analysis and discussion; while Section 6 presents the conclusions.
2. Literature Review
The concept of transport efficiency is vastly investigated in city logistics [6]. It can be evaluated from a service provider perspective, from a customer point of view, or from a public sector and sustainability perspective [7]. Arvidsson [8] identified different definitions depending on the discipline studying this concept. In economics, efficiency is defined as performing an activity at the lowest possible cost; in operations research, efficiency is considered as a tool to improve productivity; operations management defines it as the degree of fulfilment of a certain goal; while in logistics performance research the focus is on measuring the results obtained given a certain resource utilization.
Markovits-Somogyi [7] defines efficiency as a ratio between the outputs and the inputs of the given activity. While, Zhang and Zhang [9] define efficient logistics development as a situation where “the combination of various input elements is optimal, and its output will be maximum value under certain input”. Arvidsson, et al. [10] define efficiency as producing a service with less resource consumption without reducing the logistics performance in terms of costs and delivery service. According to Moen [11], the efficiency of a transport system depends on how resources are utilized within a system, these resources include business models, vehicles, drivers, information technology, and infrastructure. Arvidsson [8] highlights that transport efficiency is not exclusively about technical improvements, as behavioral and operational aspects are very relevant. For instance, driving behavior can significantly affect the efficiency of transport operators.
In this paper, time efficiency is defined as distributing daily deliveries using the shortest possible time. Some key aspects to improve transport efficiency are identifying indicators to measure it, collecting the right data, analyzing the data to assess efficiency, and when possible benchmarking.
2.1. Transport Efficiency Indicators
Efficiency can be evaluated via different approaches [12], using indexes (e.g., total factor productivity), parametric approaches (e.g., stochastic frontier analysis), and nonparametric approaches (e.g., data envelopment analysis). These approaches have been used to evaluate the efficiency of logistics systems, analyze the efficiency of whole supply chain systems, and to assess cities’ input-output effectiveness [13]. In the case of transport efficiency, indexes are the most common approach.
Different indicators have been proposed to evaluate the transport efficiency. As described by Arvidsson [8], Samuelsson [14] formulate efficiency dimensions in terms of time, distance, speed, and capacity. The authors of [15] suggest to use (i) utilization measures, such as, vehicle loading, empty running, fuel efficiency, vehicle time utilization, and deviations from schedule; (ii) productivity measures under the form of output/input ratio; (iii) the effectiveness of delivery operations focused on quality. In [16] the authors identify two aspects to include when defining transport efficiency (i) measures of how smart, economically, and environmentally sustainable or appropriate use of resources, and (ii) trade-offs. The authors of [17] focus on measuring load factor to assess transport efficiency, as higher load factor leads to less distance driven to deliver the same amount of goods. The authors of [18] discuss the most common operational efficiency indicators, which are often assessed through input/output ratios where inputs include number of branches, employees, fleet size, and fuel consumption, and outputs are total cargo transported (e.g., tons per year) and distance travelled (e.g., kilometers per year). In [19] the authors propose total number of rounds, time per round, shares of delivery, and stationary time from total round time, distance per round, vehicle operating cost, and emissions as indicators to assess transport operations. The authors of [20] suggest a broader measure, such as a road freight transport intensity ratio that measures the tonne.km per output. Once transport efficiency indicators are defined and measured, it is easier to identify measures aiming at improving efficiency. Some other authors focus on cost analyses which include operational costs, environmental costs, fines, insurance, repairs, salaries, and depreciation among others [21].
2.2. Measures to Improve the Efficiency
Arvidsson, et al. [10] propose three groups of measures to improve transport efficiency (i) internal transport efficiency measures including driver and vehicle efficiency; (ii) joint transport efficiency measures in collaboration with customers; and (iii) joint transport efficiency measures in collaboration with the public sector.
2.2.1. Internal Transport Efficiency Measures
Driver efficiency: providing eco-driving training can improve fuel economy and reduce the environmental impact per vehicle and driver significantly. Other measures to support driving efficiency include ensuring the vehicle’s technical standards, using the right tire pressure, maintaining suitable speeds and minimizing vehicle idling.
Vehicle efficiency (Fuel efficiency): increasing load factor and decreasing the number of empty kms related to the back-haul problem are the main means to increase vehicle efficiency. Savings in fuel consumption can improve economic efficiency. Fuel consumption represents a higher share of total costs for long-distance road haulage than for urban transport where stops per tour and driver costs are preponderant.
2.2.2. Joint Transport Efficiency Measures with the Customers
Intelligent transport systems and route efficiency: implementing Intelligent Transport Systems (ITS) can enhance route planning and control. ITS offer real-time information and planning required hardware and software is now more affordable and can lead to significant cost and environmental impacts reductions. [22] conducted a thorough study using data from dairy notes for 343 working days and 20 motor carriers. The authors found that ITS have a potential to save 6.8 to 8.0% of the working time, with administration activities having the largest saving potentials.
Utilization efficiency—the back-haul effect: asymmetric demand and unbalanced flows lead to empty running which hampers efficiency. Common measures include price differentiation to attract goods and create a balance, increase reverse logistics, and use load matching agencies. However, some measures to eliminate the back-haul effect which would potentially benefit transport operators may lower the frequency and increase lead time for shippers, which could impact the supply chain downstream. Additionally, there are limitations to balance flows related to commodity types and vehicle characteristics [23].
Utilization efficiency—load factor: higher consolidation/load factor can lead to significant gains both from a cost and an environmental perspective. Measures to increase load factor have been widely studied from a supply management perspective for long-haul transportation [24]. In urban distribution load factor is mainly determined by the maximum number of stops that can be done in a tour and by shipments size. The number of stops is often affected by delivery time windows/restrictions and other time inefficiencies (e.g., congestion and lack of parking).
Packaging efficiency: the volume and weight of goods transported are a result of the choice of product packaging, and the size and amount of products in a shipment [10]. Thus, packaging efficiency can have a positive effect on the tonne-kilometer. In urban distribution, this has taken more relevance in e-commerce deliveries where packages often use more space than products.
Delivery efficiency: time windows and time restrictions are getting stricter in urban distribution [10]. Just in time strategies and e-commerce deliveries with short lead time expectations lead to tighter time-windows from receivers. While, public sector efforts to reduce congestion during peak hours and increase livability have led to stricter time regulations. Shippers/receivers flexibility for delivery times and relaxed time restrictions can allow transport operators to achieve higher levels of efficiency. Improving access in the last 30 feet can also lead to higher delivery efficiency [25].
Mode efficiency: large shipments transported over longer distances are more likely to be transferred to more efficient modes (e.g., rail, waterways) than parceled goods distributed in urban environments [10]. Mode shift in cities are often driven by size or time restrictions and environmental reasons. However, there are multiple efforts to increase the use of urban waterways and cargo bikes for the last mile by showing potential gains in efficiency as well.
2.2.3. Joint Transport Efficiency Measures with the Public Sector
Regulatory and incentive-based measures: policy in urban freight transport is frequently implemented by local authorities. For instance, access-time restrictions might result in more vehicles and drivers, and vehicle-type restrictions (e.g., dimension, weight, engine, or fuel type) may increase fleet size and increase renewal rate [3,26]. Traffic regulations concerning access to loading places and fiscal policies may increase transport costs and decrease load factors [10].
Coordinated distribution: own-account transport is often less efficient than third party logistics transport, because the latter consolidate goods having similar geographic destination and has a better use of economies of scale. Consolidation and collaborative distribution schemes can have a positive impact in city distribution by increasing the number of stops per tour and the density of delivery drops, which can foster modal shifts. However, business interests (e.g., brand positioning, contact with customer) and transshipment costs have deterred multiple initiatives aiming at joint last mile initiatives to be successful in the long term [27].
3. Case Study
This research is based on a case study with a less-than-truckload (pallets and parcel) transport company operating in Gothenburg, Sweden. The company requested to avoid disclosing their name. Although the objective of this study is to identify initiatives with potential to improve time-efficiency in a way that benefits the company, the focus is on drivers and the activities they perform. The selection of this company for the case study is based on a “critical case” criterion [28]. As the company serves a significant share of the parcel delivery market in Sweden and uses mainly medium-duty trucks for parcel distribution, it was deemed suitable to fulfill the purpose of this research. It is worth noting that this approach favors depth on one case over variability among cases, which means better insight is captured at the expense of generalization of the results.
3.1. Case Study Description
The company has about 25,000 employees and 18 terminals in Sweden. The terminals are divided into two categories based on the handled goods. The first category handles part loads, general cargo, and parcels and the second handles light goods, such as letters and unaddressed advertising flyers. Out of the 18 terminals, seven are of the first type while the remaining 11 belong to the second. The company uses semi-trailer trucks, rigid trucks, postman cars, club cars, electric mopeds, and electric bikes to serve terminals. This study is limited to pallet and parcel distribution in Gothenburg, only rigid trucks departing from the pallet terminal are included.
In the Gothenburg area, the company has one pallet terminal that handles approximately 900 outbound pallets a day. Roughly 10% of those are dedicated to customers in the city center. Deliveries include B2C and B2C. The company has assigned the task to three drivers, all of them drive Mercedes at ego with a capacity of 18 pallets. Drivers have an eight-hour work day and deliver goods in two distribution tours, one in the morning mainly focusing on deliveries and one in the afternoon combining deliveries and pick-ups. As trucks usually return to the terminals before starting the second tour at noon, the trucks are seldom fully loaded.
3.2. Data Collection
The time-study used GPS data from two Garmin eTrex 10 devices to gain knowledge about the spatial aspect of the tour (e.g., distances, duration, elevation, scope, location of customers) and speed. The devices were placed in the truck throughout the entire distribution tour. Due to the level of detail needed, the recording interval was set to level four, i.e., the devices recorded location of the vehicle after every 10 s or 50 m had passed.
Additional data were collected via a time-study of drivers’ activities between 29 February and 4 March 2016. These dates were selected for practical reasons. Freight data statistics were later analyzed to see how these dates compare with overall freight flows throughout the whole year 2016. A closer look to domestic goods transportation in Sweden in 2016 [29] reveals some seasonality effects with Q1 (January to Mars) being close to the average tonnes moved within Sweden during 2016 (1.5% lower), and kilometers driven domestically being below average (6.2% lower).
Time-studies are common in industrial operations and can be defined as “a work measurement technique for recording the times and rates of working for the elements of specified job carried out under specific conditions and for analyzing the data so as to obtain the time necessary for carrying out the job at a defined level of performance” [30]. It is noteworthy that the purpose of this study is not to evaluate the performance of the drivers as could be the case in other applications, but to identify causes of inefficiencies and initiatives with potential to reduce these inefficiencies.
One researcher was assigned to each of the two trucks covering distribution routes in the city centre. During five consecutive days, researchers shadowed the truck drivers throughout the entire workday registering and timing all their activities. One truck was driven by the same driver the whole week, while the second truck was driven by two different drivers during the week. Activities were predefined before starting the time-study and a spreadsheet template was prepared so that activity code and start and end time could be easily registered in real-time to minimize distractions during the time-study.
Additional insight was gained in a focus group in which 11 truck drivers were asked about activities that consumed most time and how time used in those activities could be minimized. Six additional semi-structured interviews were conducted with managers in the company to understand the operations and identify additional initiatives that could enhance time efficiency. Each interview lasted for about 45 min.
4. Results
4.1. Tour Routes and Speed Data
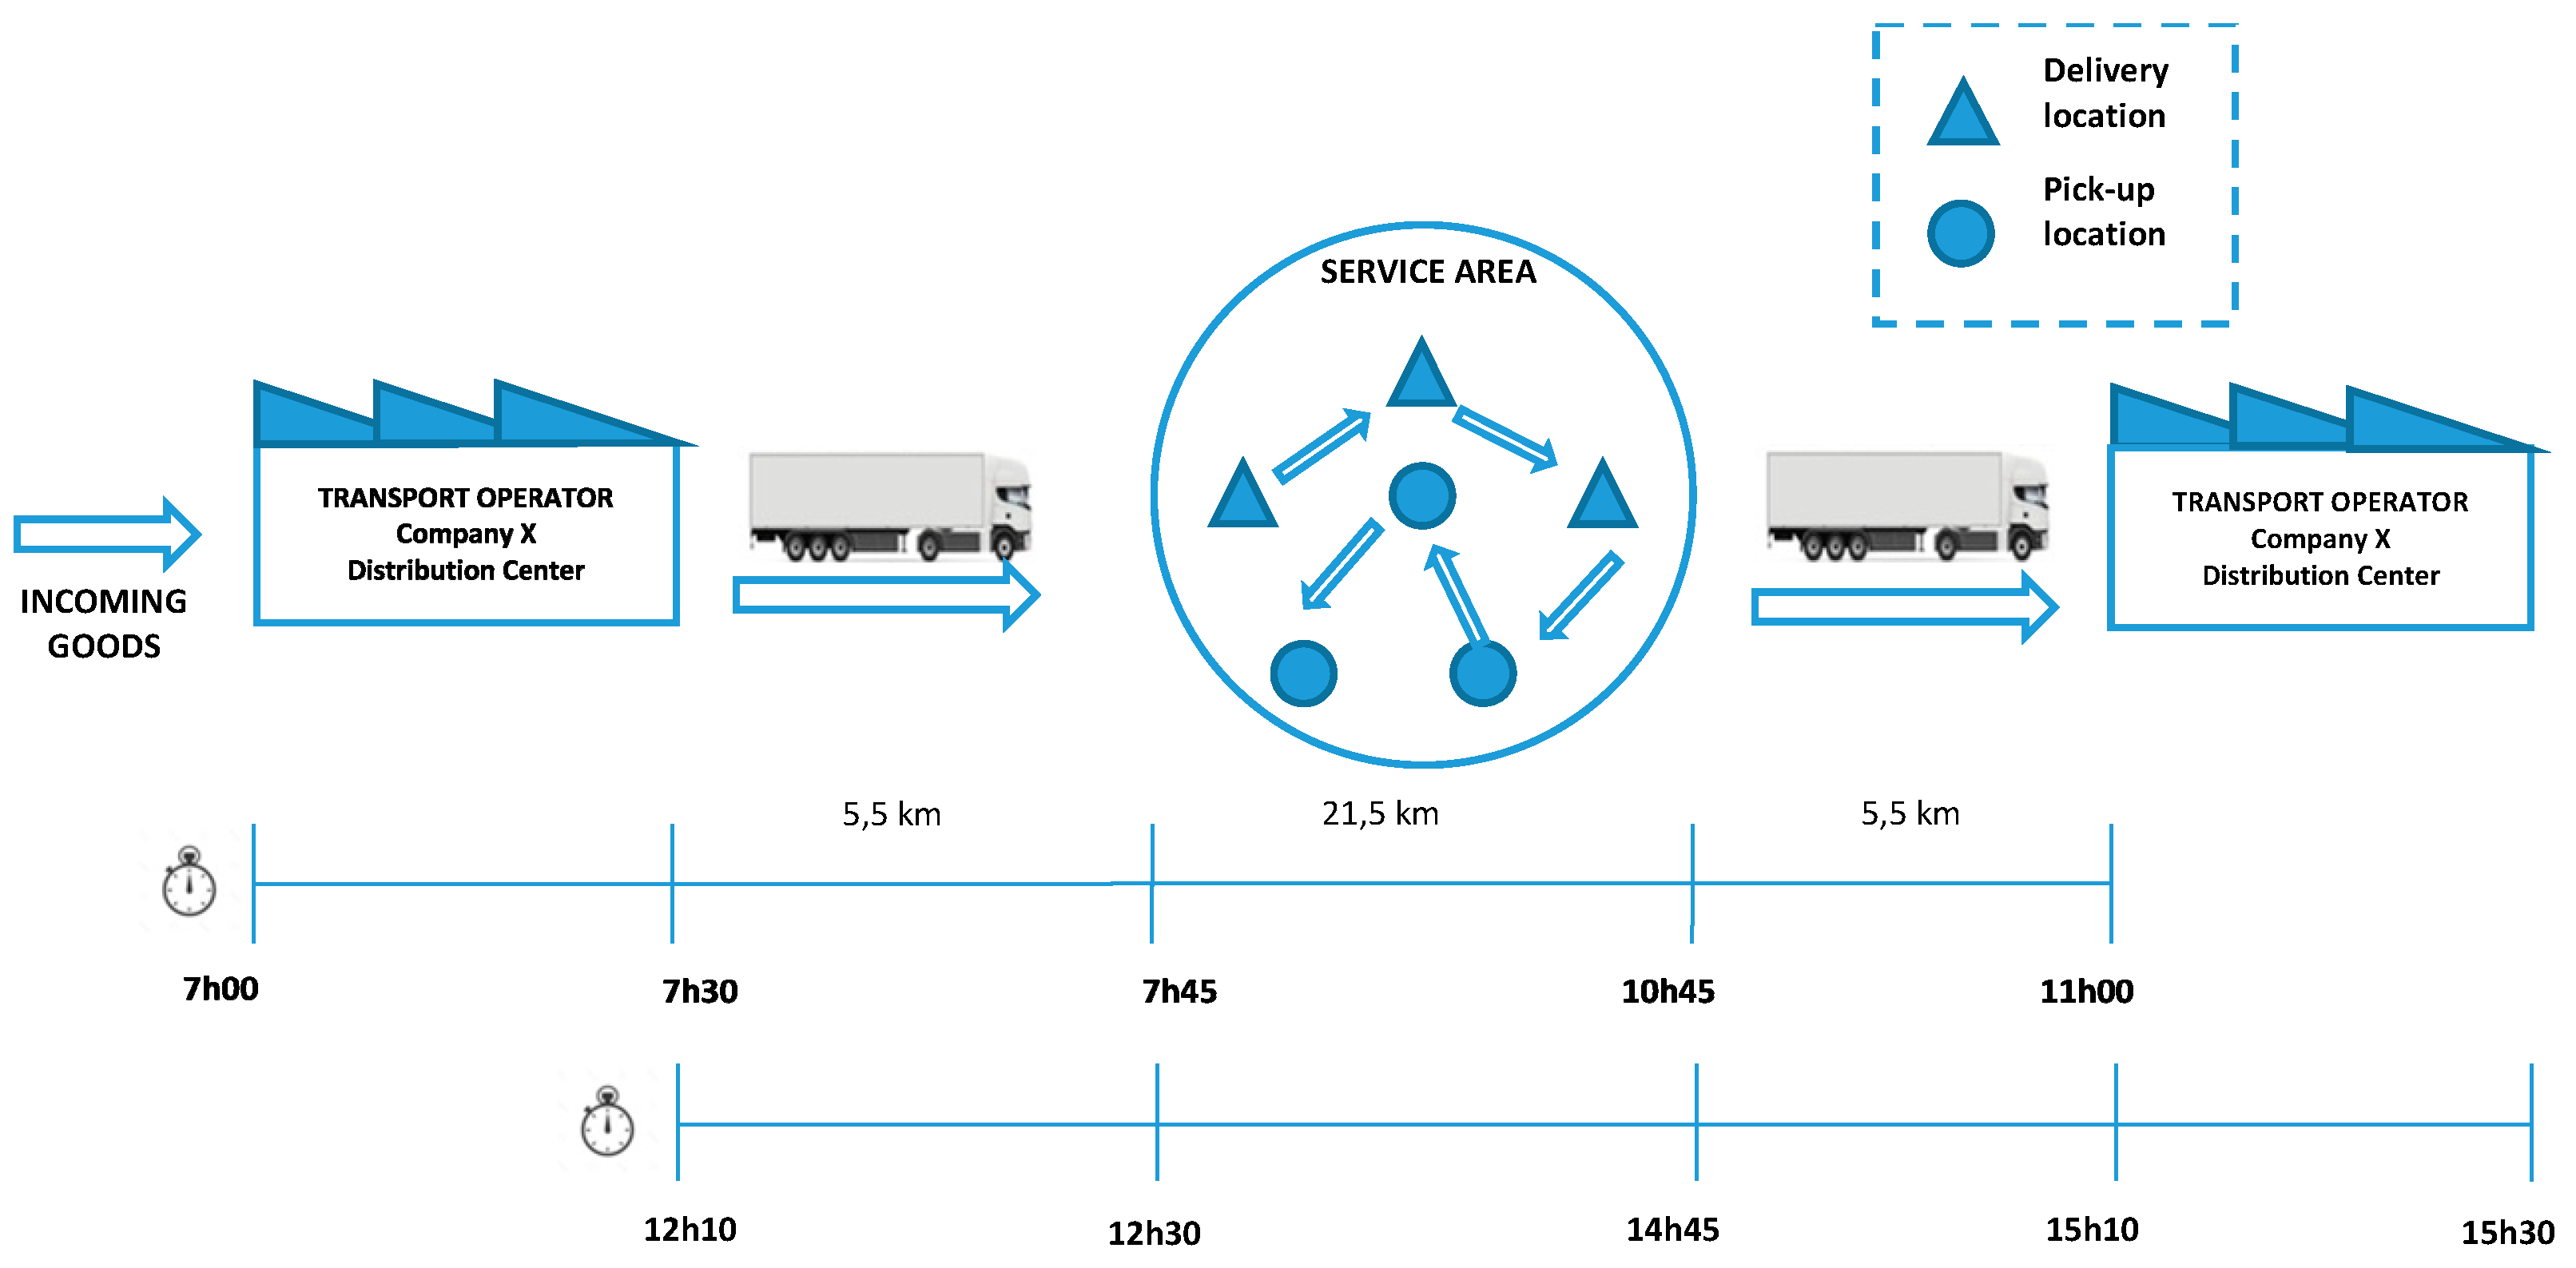
Daily routes are split into two tours, both starting at the terminal. Figure 1 shows the typical distribution route. The morning tour (top timeline), starts around 07:30 after the truck has been loaded with goods. The distance to the city center is approximately 5.5 km with a driving time of 15 min. The average driving distance within the service area is 21.5 km before returning to the terminal. In comparison to these figures, the afternoon route (bottom timeline) starts around 12:10 and due to higher level of congestion at that time of day the connecting link takes 20–25 min.
The morning route focuses mainly on goods delivery, while the afternoon route has an even division between deliveries and pick-ups. The average number of pallets delivered per day is 27, but as parcel deliveries are also delivered the average number of stops is 40 per day. Distance and delivery time vary depending on the spread of customers. Vehicles distance driven per day, and driving speed are obtained from GPS tracks. Distance driven varies between 46 and 95 km, with an average of 64 km per truck in a day. The mean driving speed for a vehicle in a day was between 24 and 34 km/h. Despite having a similar number of deliveries per day, tours where customers were widely spread in the city could lead to twice the distance driven.
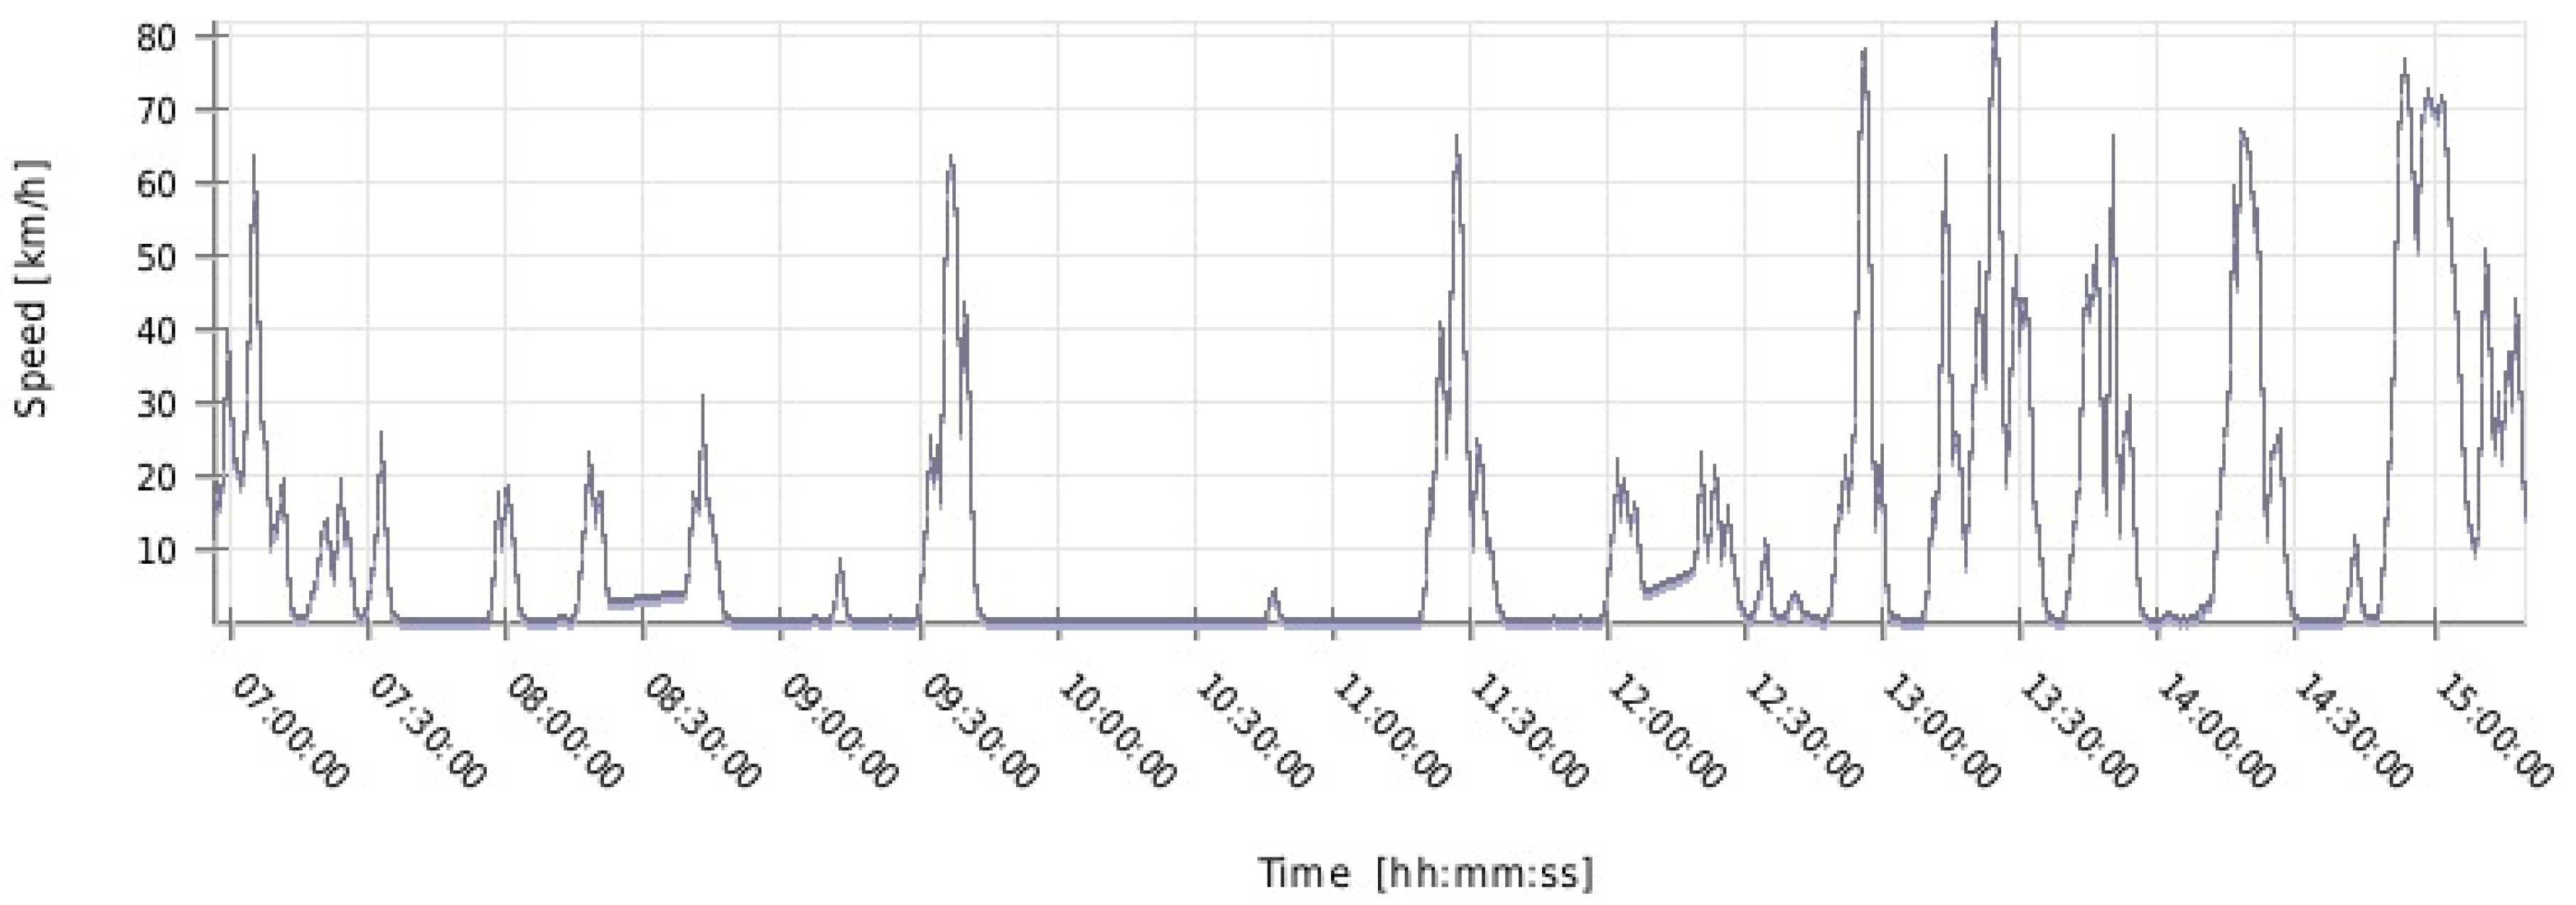
Figure 2 shows the speed profile for one day of work. As shown, speeds are high during the first and last leg of the morning tour which are done in the highway, and very low in-between stops. During the afternoon tour there are several speed picks, revealing some travel in major roads in-between stops when deliveries are made in the suburbs. The speed profile does not show major issues with congestion as speeds of 60 km/hour are often reached. However, vehicle speed only accounts for a small part of time-efficiency as about half of the time the vehicle is not moving. The data from the time-study provides better knowledge of time-efficiency during this standing time.
4.2. Time Study and Activities
According to the employment contract, the work day of a driver is eight hours long plus a 45 min unpaid lunch break. This is in line with the results of the time study that revealed that the average work day (lunch included) was near 8 h 45 min.
The daily routine of truck drivers comprises several distinguishable activities related to freight distribution. The key criteria to classify the activities was the location where the event took place. Categorizing the activities allowed to pinpoint the most time-consuming tasks, to identify private and public resources needed for each activity, and to highlight areas with the biggest improvement potential regarding time efficiency. The actions performed by the drivers were classified within 31 different activities. Four activities took place inside the cabin, 10 around the vehicle, seven at the terminal, and seven inside the body of the truck. The latter also includes activities executed on the tail lift. Additionally, two activities are related to personal time, i.e., breaks and conversing, these activities are categorized as Breaks. Lastly, activities which were unique and did not have a repetitive pattern are grouped in Other. The time study data is summarized in Table 1. The first column is color coded according to the category and comprises all the activities. Cab activities (red), (un)loading (green), around the vehicle (purple), breaks (blue), terminal (orange), and other (black). The second and third columns represent daily averages for activities per driver, followed by the combined average and the share of total time. Weekly duration of activities is shown in column six.
As shown in Table 1, driving represents only 30% of the time, another 15% of the time is spent on breaks, and the remaining 55% of the time drivers is used to perform activities not related to driving but to customer service and freight handling. The latter are subdivided in multiple activities, each taking a small amount of time. Besides driving and breaks, the activities that take more time are walking to customer with goods and route planning (4% each). If all walking is considered as a single activity, it requires 13.3% of a driver’s work day. This use of time is similar to what was found in other studies [22,31], but time spent driving is a little lower than in those studies. For instance, [31] found that vehicles distributing parcels in London were parked during 62% of the time; and [22] found that drivers doing LTL regional and local distribution in Germany, Sweden and Switzerland spent 45% of their time driving.
Some activities have a smaller coefficient of variation (CV), while others have a large one exceeding 100%. Higher variance in duration affects planning reliability, which means that route planning and delivery schedules have to include slack time in case one of these activities require a longer time. Activities with higher duration CV are terminal driving (364%), customer predelivery contact (234%), waiting for customer to accept delivery (207%), pallet jack handling (161%), and administration work inside the cabin (148%). Together, these activities represent 11% of a typical week, but the time to perform them can take much longer than the average time. In essence, this variation makes it more complicated to anticipate time required per delivery and formulate a time-efficient plan where truck capacity is completely used.
5. Discussion
5.1. Overall Insights from Observations and Interviews
In the recent past, the company has experienced an increase in demand for parcel deliveries. According to the interviewed managers, this trend is connected to the amplified e-commerce business. The first quarter in 2016 showed an increase of 16% in parcel deliveries, while pallet distribution has declined by 8%. This trend has raised the idea among managers that medium duty vehicles will not be the most appropriate size soon, and a shift towards using smaller vehicles in urban freight distribution will be necessary.
During the focus groups, drivers mentioned different problems affecting both time-efficiency and the quality of their job. According to the drivers, the main challenge in the city center is the lack of oversight around the vehicle when driving. Drivers point out the risk of operating close to pedestrians and cyclists, which increases stress and time used for each maneuver. Drivers also think that a better handling equipment can improve time-efficiency and job quality. Current investments are done on a minimum requirement basis and equipment investments are thought to continue daily operations but not to enhance them. For instance, the company has mainly invested in non-electric pallet jacks which are cheaper but have worse ergonomic features than electric pallet jacks; handheld computers are very slow, and customers often must wait, this affects service level and decreases time efficiency. Based on the focus groups, the interviews, and observations, the authors identified several initiatives that can lead to incremental gains in time efficiency. These initiatives are summarized next.
5.2. Initiatives
Several of the initiative identified cannot be implemented by the company alone and require collaboration with other companies (e.g., manufacturing, IT companies) or with public authorities which is in line with the findings from the literature. These initiatives can lead not only to more time efficient distribution but also to better economic performance, increased safety levels, and better working conditions for truck drivers. Table 2 provides an overview of these initiatives classified as vehicle, handling equipment, navigation, or regulation and guidelines initiatives.
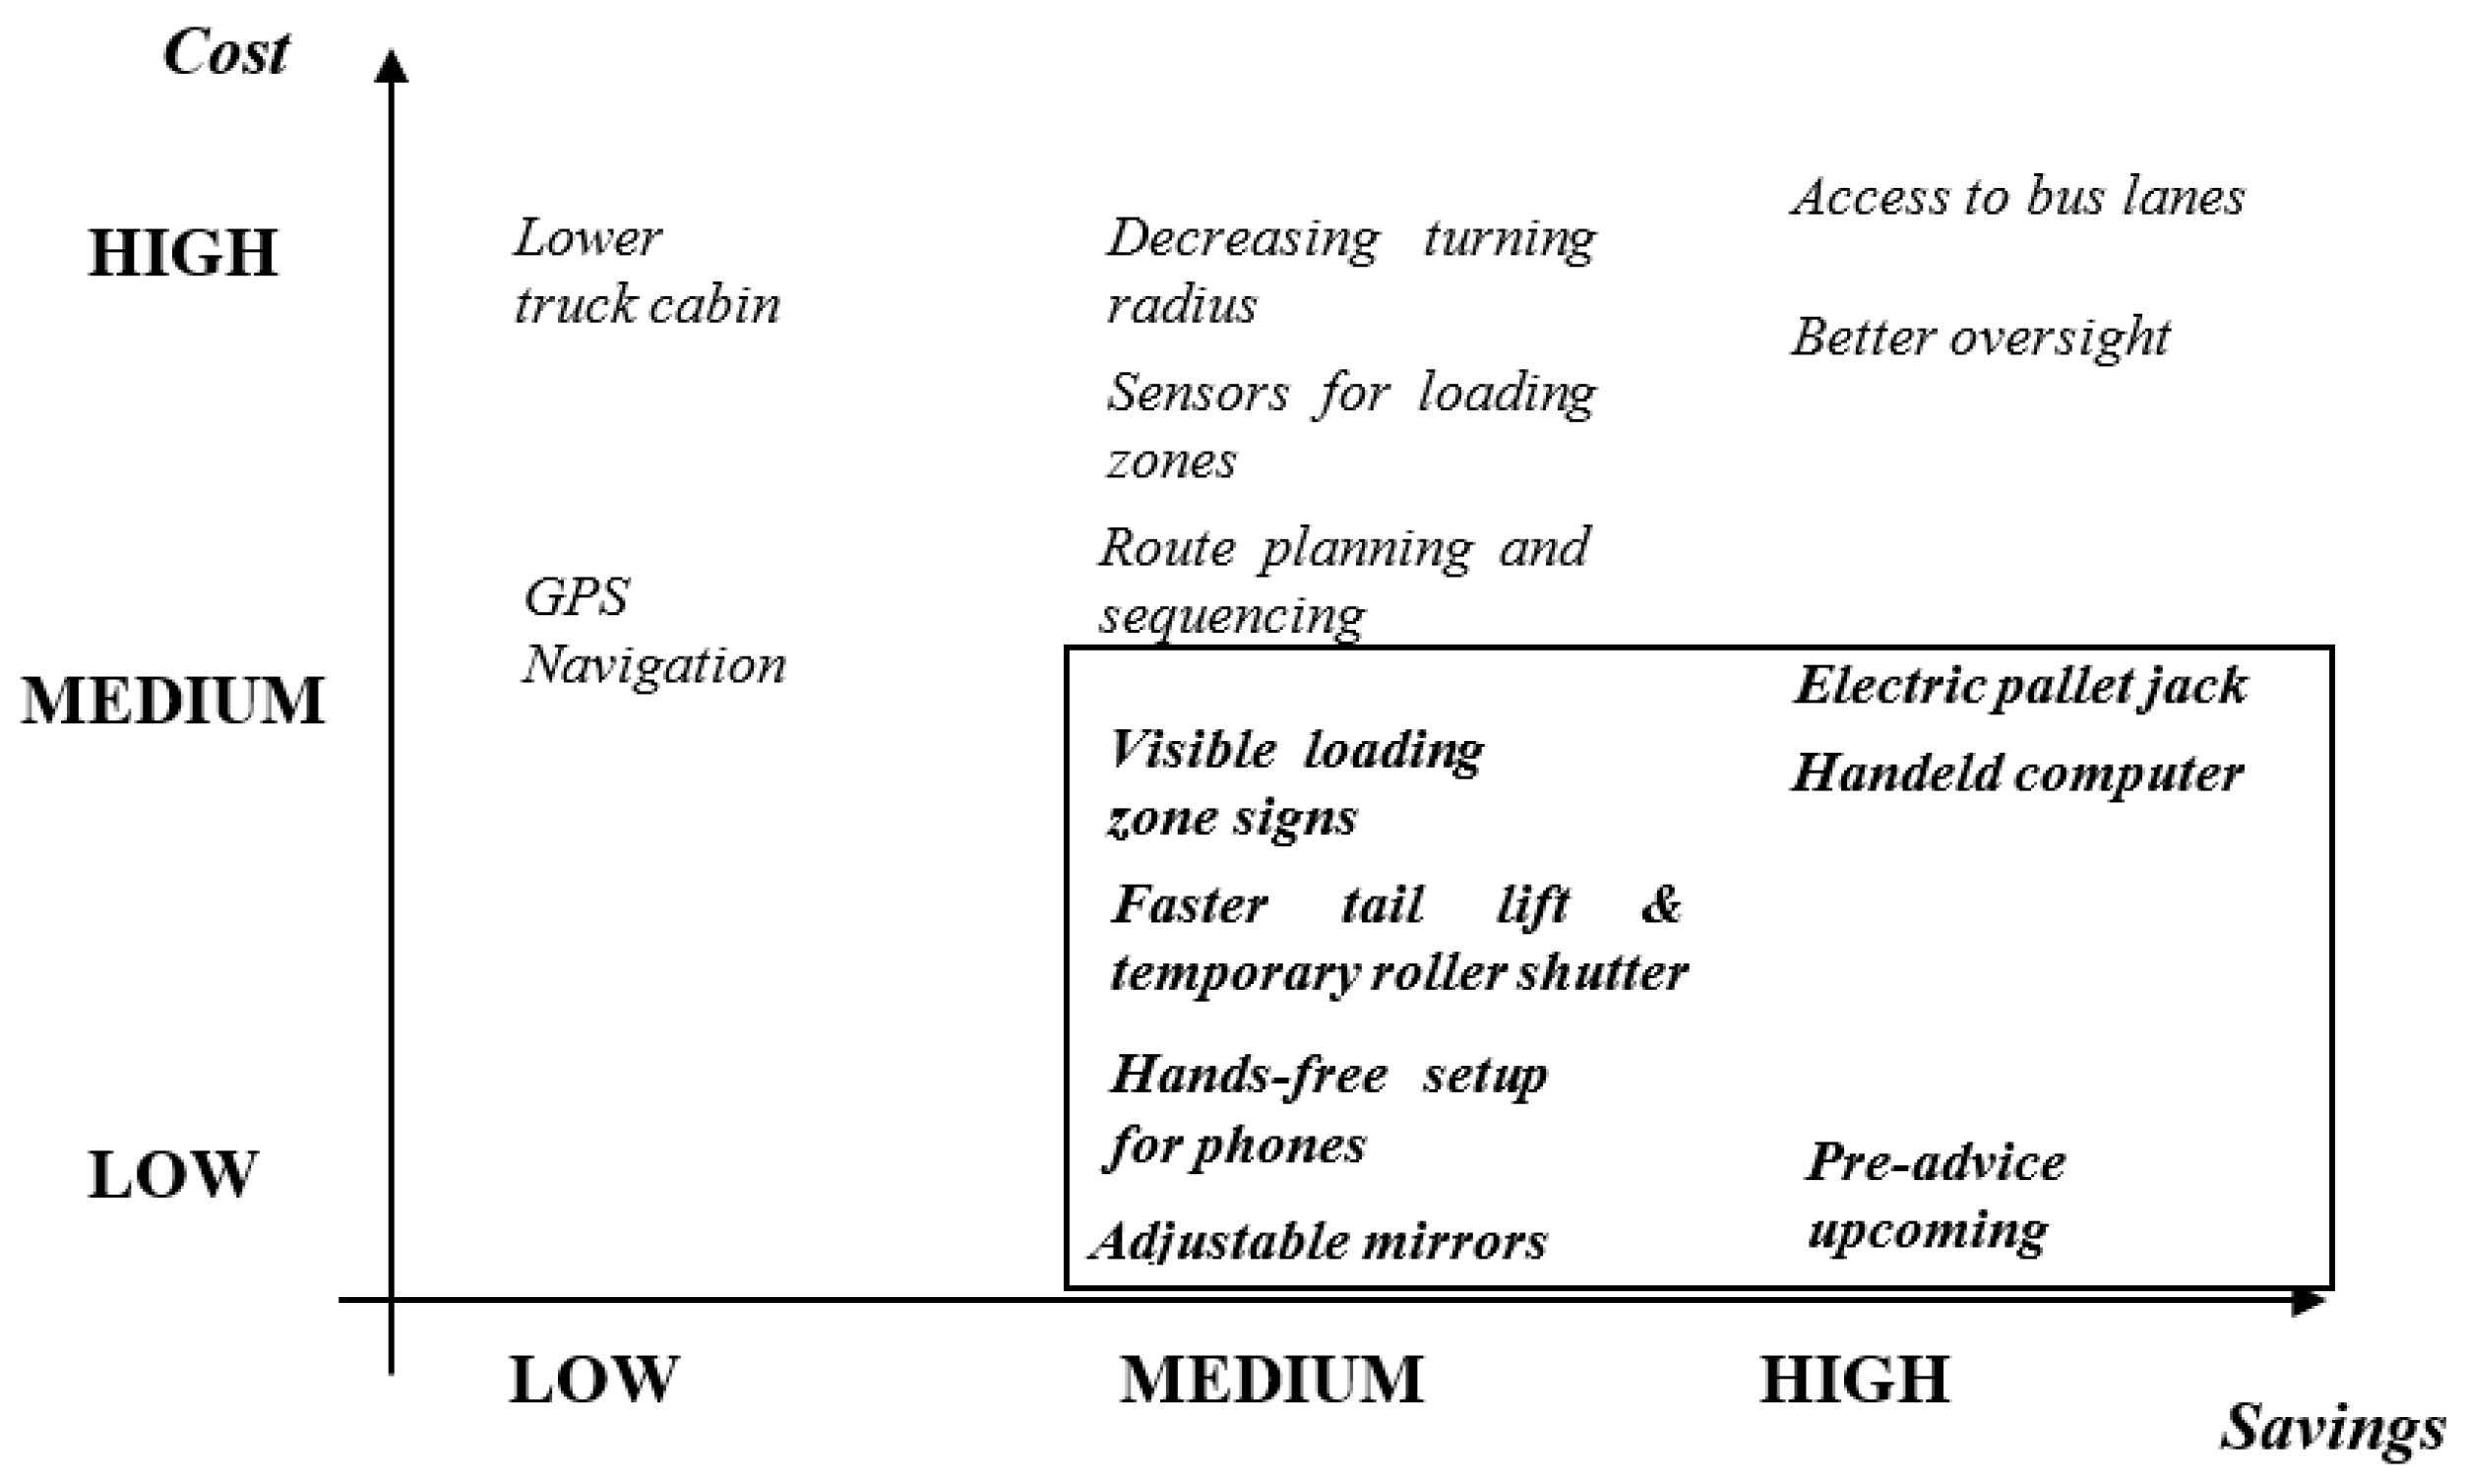
Figure 3 provides the relationship between potential costs and savings per initiative. Details on calculations for potential savings are based on the value of time for these vehicles and can be found in [5], cost estimates were inferred from the interviews and some desk research. As costs depend on various considerations and only an approximation was possible, costs are classified as low (i.e., between 100 and 1000 euros per vehicles), medium (between 1000 and 10,000 euros per vehicle) and high (above 1000 euros per vehicle). The figure highlights initiatives that tend to have medium to low costs and medium to high benefits (i.e., handheld computers, pre-advice on upcoming customers, visible loading zones signs, faster tail lift and temporarily roller shutter, hands-free setup for phones, adjustable mirrors, and electric pallet jacks).
During the interviews, managers mentioned the importance of sensors around the entire chassis. The sensors would allow the driver to have a 360-degree visualization of the surroundings. This will become especially useful during parking in tight conditions. Often both drivers must maneuver underground malls. These areas are confined by narrow passages and strict maneuverability. Saving only 5% on driving and parking activities, the company can save about 42 min per week. The challenge of implementing these initiatives is mostly monetary. Companies usually opt for vehicles with basic interior design without special accessories.
Drivers also mentioned that adjustments to the cab height could improve time efficiency, while increasing driver safety and ergonomics. One of the activities that are repeated several times during the day is ascending to or descending from the truck’s cabin, which can be as high as 1.5 m. The authors observed during the time study that climbing into the cab took an unnecessarily high effort and time. Having trucks with lower cab or having foldable stairs could improve working conditions and slightly decrease access time.
Drivers suggested that decreasing turning radius of the vehicle would ameliorate the central city driving experience, thus improving both driving and parking. A suggestion to address maneuverability issues was to modify wing mirrors design. Observations during the time study confirm that mirrors often decreased the turning radius. Implementing foldable mirrors was proposed to decrease by 4.5% the turning radius required, this would make a difference for narrow streets in the city center. Mirrors would only be folded when required and sensors would offset visibility loss when mirrors are folded.
Drivers often need to make calls to customers or answer the phone when driving. In most cases, drivers must stop to talk on the phone (otherwise they use the phone while driving although this is forbidden) which affects time-efficiency. Implementing available low-cost Bluetooth hands-free systems will improve time-efficiency and decrease safety risks. Having this system will also allow them to have better communication with other drivers and share traffic conditions and incidents in real-time so that drivers can use alternative roads to save time.
According to the time study, tail lifting takes 3.8% of work time, i.e., 1 h 38 min per week, thus reducing time related to this activity could bring some time efficiency gains. Speed is seen as the biggest drawback, especially during morning hours and winters when the apparatus is still cold. Lowering/rising the tail lift takes about 15 s and this can be repeated 40 times per day as the tail lift has to be closed every time the driver moves away from the truck (except in malls). As lowering/rising speed is constrained by safety standards to avoid getting the hand or head stuck, moving the buttons farther from the back end of the truck or having a remote control could prevent accidents and allow an increase in speed. Alternatively, it was suggested to implement temporary automatic security roller shutters, as the shutter are thin and light closing them will take less time.
5.2.1. Handling Equipment
Investing in improving handling equipment has also been identified as a means to improve time efficiency. The time spend on the handheld computer accounts for 7% of the work time, i.e., 3 h 1 min per week. In drivers focus groups, through observations, and during interviews with managers, the speed of handheld computers was a common point of discussion. A significant amount of time can be saved with a faster and simpler system for the handheld computer, and service level will also improve. The tasks done in the handheld computer could also be completed via a smartphone app.
The time study shows that 10% of drivers’ work time is spent walking to and from the customer, i.e., 4 h 22 min per week. The drivers highlighted the need for electric pallet jacks (ET) with rubber wheels. Only one of the drivers was using an ET with plastic tires, which is not suitable for cobblestone streets and uneven surfaces in the city center of Gothenburg. In these circumstances, the ET was extremely noisy and unstable. Proper equipment would improve working conditions and reduce handling time. Results from the time study also show an additional 1.5% of the time, i.e., 39 min per week, spent on pallet jack handling inside the body of the truck. This time is used to secure the PJs. Using electric alternatives, this time could be eliminated entirely as the automatic break in the electric motor prevents the ET from moving when not in use. Alternatively, it instead of striping pallet jacks (PJ) to the wall on the back of the truck as done now, a magnet in the PJ’s handle could save time.
5.2.2. Navigation
Navigation initiatives address operations and delivery sequencing. These improvements focus on better time utilization, smarter driving, and route planning. They can often be implemented internally by the company. None of the drivers in the company uses a GPS navigation system. Drivers undergo training by job shadowing a colleague over a course of a few weeks. This allows the new employee to understand the basics of the profession, but also provides him an opportunity to get acquainted with reoccurring customers. The company has dedicated three drivers for goods distribution to the city center, some of the destinations are reoccurring but with the increase of home deliveries there are is an increasing number of new destinations. The drivers do not have any real time information except the communication with other drivers and dispatchers. During the time study a road incident that was not anticipated caused a delay of more than 20 min.
An enhanced navigation system could also decrease time to find the exact location of the customers’ goods receipt area. During the focus group several drivers mentioned that access to loading bays is often impeded or difficult to locate. Less time is wasted on searching for the loading zone as the drivers could constantly update customers’ location in the system. During the time study both researchers experienced several occasions when the drivers did not find the correct location. Therefore, they had to pull over to call the customer for supplementary instructions on how to reach them. Some drivers admitted that they often had to use navigation applications on their personal cellphones to pinpoint the location of the customer. Ideally, the system could involve an application through which the information could be shared by multiple 3PLs and receivers, further increasing the accuracy of the information. This also provides an incentive for the receivers as the delivery accuracy is increased and the goods are delivered on time.
Almost all the early morning deliveries during the field study took longer because drivers arrived before opening hours or the customer was late. In some cases, this caused the drivers to wait outside the store up to 21 min. Waiting time represented 5.7% of the working time, i.e., 2 h 27 min per week. If drivers know that receivers are not available beforehand, they can modify the order of deliveries. To offset these time losses, a touchscreen monitor could include pre-advice information on the imminent customer. This involves being able to send the customer a signal prior to arrival but also the aforesaid information regarding the exact location of the goods receipt area. Signaling the customer beforehand will smoothen the process and allow the customer to be prepared for the delivery.
Route planning is currently done by drivers and takes 4% of work time, i.e., 1 h 43 min per week. Drivers receive an entire list of deliveries from the dispatcher when arriving at the terminal. Thereafter, they walk to the assigned loading bay and checks the goods adjacent to it. Only after scanning and confirming that all the goods are in a correct state, they create the loading sequence based on how to distribute the deliveries. The sequencing is based primarily on their existing knowledge on where customers are located and their respective opening hours. Preliminary routes could be preplanned by the dispatcher assisted by a software.
Current route planning has two tours and a stop at the terminal at lunch time. When inquiring for the planning, the main reasons reported were that (i) in some cases the truck capacity is not sufficient for all the deliveries of the day (but unused capacity was also observed in some tours), and (ii) drivers prefer having lunch at the terminal because there are no parking facilities available in the city center, which mean they can combine their lunch break with the terminal stopover in between tours. As drivers have their lunch break around 11:00, if they do not manage to deliver some of the goods from the morning tour they bring them back to the terminal. Thus, unnecessary weight is sometimes transported leading to economic inefficiencies and unnecessary environmental impacts.
In terms of demand and capacity, the data shows that 27 pallets are delivered on average on a typical day by each of the two trucks (18-pallets capacity). Thus, delivering the daily demand of 54 pallets would take three tours with 18 pallets if there were not time constraints. This could save one full tour and a big part of the operational costs associated with it (e.g., fuel, truck wages). However, this change can only be considered if the 18 pallets could be distributed during the morning shift, or if parking space for medium-duty trucks was provided in the city center.
5.2.3. Regulation and guidelines
Regulation initiatives address features which would lead to more efficient city logistics. These improvements focus on developing guidelines for loading zone signs, considering access to bus lanes, and improving loading zones.
The visibility of the signs indicating the location of loading zones at customers sites was a common issue stated by the drivers. Currently, 57 min are spent weekly on finding the loading zones and getting in contact with customers. Drivers believe that authorities could encourage companies to have more visible signs or provide some guidelines. Ideally, this would minimize the total time spent on driving. This is especially relevant when new customers are served, and the exact location of their goods receipt area is unknown. It would also be beneficial when the destination comprises many loading bays. These settings are very common with larger shopping centers. As of today, there is no specific information shared with the drivers on which loading bay should be used. Finding the correct loading bay is time consuming and stressful due to the narrow passages in the goods receipt area. This is also beneficial for receivers as the time spent at malls is decreased, resulting in better use of space and higher capacity of the receiving area.
Another suggestion stated by the drivers involves changes in legislation. The drivers stressed that allowing trucks to use bus lanes could lead to significant time savings. This is confirmed with the GPS traces where several inefficient detours are caused by areas where only public transportation was allowed. If trucks get access to the bus lanes, congestion could be reduced for all users. There have been some national efforts to study this initiative.
The field study shows that time spent on searching for a vacant loading zone and parking consumed 3% of work time, i.e., 1 h 20 min per week. During the focus group, the drivers suggested to implement sensors at loading zones in the city center. As loading zones in the city center are often occupied by other vehicles, drivers are forced to change their delivery sequence losing significant time and driving more kms. During the time study, both drivers experienced such an occurrence at least once a day. An extension of this initiative could be to implement a timetable where trucks pre-book a time slot in advance.
Overall, these results show that most initiatives can bring small gains, but when aggregating all potential time savings there is a big potential to improve urban distribution time efficiency. It is also important to consider price, although some initiatives can bring big time savings, their prices are prohibitive and will not make sense from a financial perspective. Initiatives with highest potential and low cost were the better pre-advice on upcoming customers, improved route planning, hand-free cell phone use, and enhanced handling equipment. For some of the initiatives, time spent is not the most relevant aspect, but instead bigger benefits can come from improving drivers’ working conditions and other societal benefits.
6. Conclusions
This study focused on the time efficiency of urban distribution activities. All activities and their purpose were identified and then classified into different categories. Each activity was analyzed to explore the potential for time savings that do not affect output (number of on-time deliveries). The time study indicated that the biggest share of activities took place in the cabin (34%) with driving as the major contributor (30%), followed by time spent on activities around the vehicle (23%), breaks (17%), terminal activities (15%), loading and unloading activities (11%), and other activities (1%).
Interviews and focus groups with managers and drivers were conducted to explore initiatives that could reduce time spent per activity and increase time efficiency. The method implemented for this study combining hard data, interviews, and focus groups with drivers allowed a better understanding of the constraints and solutions related to time efficiency. Focus groups with drivers are rarely available in freight studies; however, the insights gained from this exercise were very valuable. The authors recommend incorporating interviews and focus groups with drivers in future urban freight studies.
Most initiatives studied require a major role of different actors. The initiatives with lower cost but high efficiency gains potential included a coordination with receivers (e.g., pre-advice on upcoming customers, private loading zones signals), better planning (e.g., routing software, tour structure avoiding coming back to the terminal at noon) and equipment upgrades. Further research could be done to study potential gains of some of these initiatives together with a planning software using real-time information.
Although being one of the largest companies delivering parcels in the country, the company’s use of technology, data analytics, and modern equipment is rather limited. This is a consequence of the low margins of the company compared to transport operators in the express parcels business, or transport operators requiring special equipment (e.g., construction, perishable goods). This shows that despite the rise in technological developments (e.g., automation, electrified vehicles, big data, dynamic routing software), the penetration of these technologies will be very slow in certain industry sectors.
The market share of e-commerce and home deliveries in Sweden is still small compared to other countries (e.g., U.S.A., U.K., China). An increase in home deliveries will lead to more parcels delivered to more scattered locations, thus reinforcing the importance of time-efficient distribution. As mentioned during the interviews, if time constraints continue limiting the payload factor of medium-duty vehicles the natural direction will be to invest in smaller vehicles, even though this means more kms driven to deliver the same volume of goods.
This paper is based on a single case study at a point in time (March 2016) which allows a more in-depth study but at the same time limits the generalization of the results to other companies. Further research could include collecting new data at different points in time for this same company to capture differences over time, and compare to data from other companies for comparison. The identification of potential initiatives to improve time-efficiency is based on interviews and focus groups. Further research could focus on conducting a cost benefit analysis of the more promising initiatives using detailed data and models.
One interesting conclusion is that drivers are involved in numerous activities related to customer service, paperwork, (un)loading of goods, handling of pallet jacks, and securing cargo. However, ongoing developments on automation focus mainly on driving and very few studies are conducted on how to replace these other activities in a fully automated delivery system. The latter represents a promising and necessary avenue for further research.
Author Contributions
Conceptualization, I.S.-D. and R.B.; Data curation, A.L. and J.M.; Formal analysis, I.S.-D. and J.M.; Investigation, L.P.-A., A.L. and J.M.; Methodology, I.S.-D., L.P.-A. and R.B.; Supervision, R.B.; Visualization, A.L. and J.M.; Writing—original draft, I.S.-D., L.P.-A., A.L. and J.M. All authors have read and agreed to the published version of the manuscript.
Funding
This research was funded by Volvo Research and Educational Foundations (EP-2014-09).
Conflicts of Interest
The authors declare no conflict of interest.
References
- Ruesca, M.; Petz, C. E-Commerce and Urban Freight Distribution (Home Shopping), in Best Practice Update (Bestufs II), RAPP Trans AG 2008. Available online: http://www.bestufs.net/download/BESTUFS_II/key_issuesII/BESTUFS_II_D2_4_I_E_Commerce_2008.pdf (accessed on 3 November 2019).
- Manzano dos Santos, E.; Sánchez-Díaz, I. Exploring Carriers’ Perception about City Logistics initiatives. Transp. Res. Rec. J. Transp. Res. Board 2016, 2547, 66–73. [Google Scholar] [CrossRef]
- Junior, W.G. A ZMRC e o transporte urbano de cargas na cidade de São Paulo. Rev. Eletrôn. Gest. Serv. 2011, 2, 205–227. [Google Scholar] [CrossRef]
- Alyson, S. Why UPS Is So Efficient: “Our Trucks Never Turn Left”. Available online: https://www.businessinsider.com/ups-efficiency-secret-our-trucks-never-turn-left-2011-3?r=US&IR=T (accessed on 10 September 2017).
- Levandi, A.; Mårdberg, J. Urban Freight Distribution: Assessing Time Efficiency of Daily Activities for Future Development of Medium-Duty Electric Vehicles. Master’s Thesis, Technology Management and Economics, Report No. E2016:045. Chalmers University of Technology, Gothenburg, Sweden, 2018. [Google Scholar]
- De Marco, A.; Mangano, G.; Michelucci, F.V.; Zenezini, G. Using the private finance initiative for energy efficiency projects at the urban scale. Int. J. Energy Sect. Manag. 2016, 10, 99–117. [Google Scholar] [CrossRef] [Green Version]
- Markovits-Somogyi, R. Measuring efficiency in transport: The state of the art of applying data envelopment analysis. Transport 2011, 26, 11–19. [Google Scholar] [CrossRef] [Green Version]
- Arvidsson, N. Essays on Operational Freight Transport Efficiency and Sustainability. Ph.D. Thesis, Gothenburg University, Gothenburg, Sweden, 2013. [Google Scholar]
- Zhang, Z.; Zhang, B. Evaluation about Regional Logistics Efficiency—A Case Study of 31 Regions in Eastern China. In ICLEM 2010: Logistics for Sustained Economic Development: Infrastructure, Information, Integration; ASCE Publications: Chengdu, China, 2010; pp. 843–849. [Google Scholar]
- Arvidsson, N.; Woxenius, J.; Lammgård, C. Review of road hauliers’ measures for increasing transport efficiency and sustainability in urban freight distribution. Transp. Rev. 2013, 33, 107–127. [Google Scholar] [CrossRef]
- Moen, O. The Five-step Model—Procurement to Increase Transport Efficiency for an Urban Distribution of Goods. Transp. Res. Procedia 2016, 12, 861–873. [Google Scholar] [CrossRef] [Green Version]
- Markovits-Somogyi, R.; Bokor, Z. Assessing the Logistics Efficiency of European Countries by Using the Dea-Pc Methodology. Transport 2014, 29, 137–145. [Google Scholar] [CrossRef] [Green Version]
- Lu, X.; Xiong, F. An evaluation of urban logistics efficiency in Jiangxi province based on DEA-Malmquist index. In Proceedings of the 2011 International Conference Business Management and Electronic Information (BMEI), Guangzhou, China, 13–15 May 2011; pp. 792–795. [Google Scholar]
- Samuelsson, A.; Tilanus, B. A framework efficiency model for goods transportation, with an application to regional less-than-truckload distribution. Transp. Logist. 1997, 1, 139–151. [Google Scholar] [CrossRef] [Green Version]
- McKinnon, A.C.; Ge, Y. Use of a synchronised vehicle audit to determine opportunities for improving transport efficiency in a supply chain. Int. J. Logist. Res. Appl. 2004, 7, 219–238. [Google Scholar] [CrossRef]
- Santén, V.; Arvidsson, N. Road freight transport efficiency and less environmental impact-the perspectives of transport buyers and operators. In Proceedings of the NOFOMA Conference, Harstad, Norway, 9–10 June 2011. [Google Scholar]
- Santén, V. Exploring Logistics Actions Enabling Environmentally Sustainable Freight Transport. Licentiate Thesis, Technical Report Technology Management and Economics, No. L2013:063. Chalmers University of Technology, Gothenburg, Sweden, 2013. Available online: http://publications.lib.chalmers.se/records/fulltext/172690/172690.pdf (accessed on 6 January 2020).
- Cagliano, A.C.; de Marco, A.; Mustafa, M.S.; Zenezini, G. Analysing the Determinants of Logistics Service Provider Efficiency in Urban Distribution. In Proceedings of the Conference: XIX Summer School, “Francesco Turco” Industrial Mechanical Plants-SSD ING-IND/17, Senigallia, Italy, 9 September 2014. [Google Scholar]
- De Marco, A.; Cagliano, A.C.; Mangano, G.; Perfetti, F. Factor Influencing Logistics Service Providers Efficiency’ in Urban Distribution Systems. Transp. Res. Procedia 2014, 3, 499–507. [Google Scholar] [CrossRef] [Green Version]
- Alises, A.; Vassallo, J.M. Comparison of road freight transport trends in Europe. Coupling and decoupling factors from an Input–Output structural decomposition analysis. Transp. Res. Part A Policy Pract. 2015, 82, 141–157. [Google Scholar] [CrossRef]
- Kot, S. Cost structure in relation to the size of road transport enterprises. Promet Traffic Transp. 2015, 27, 387–394. [Google Scholar] [CrossRef] [Green Version]
- Sternberg, H.; Prockl, G.; Holmström, J. ICT in road transport operations: Analyzing potential effects on individual activity level. In Proceedings of the 23rd NOFOMA Conference 2011, Harstad, Norway, 9–10 June 2011; pp. 1243–1258. [Google Scholar]
- Gonzalez-Calderon, C.; Holguín-Veras, J.; Amaya-Leal, J.; Sánchez-Díaz, I.; Sarmiento-Ordosgoitia, I. Generalized Noortman and Van Es’ Empty Trips Model. 2019; under review. [Google Scholar]
- Santén, V.; Rogerson, S. Influencing load factor in transport operations: A literature review. In Proceedings of the LRN Logistics Research Network conference, Huddersfield, UK, 3–5 September 2014. [Google Scholar]
- Ivanov, B.; Goodchild, A. The Final 50 Feet of the Urban Goods Delivery System. In Proceedings of the Transportation Research Board 97th Annual Meeting, Washington, DC, USA, 7–11 January 2018. [Google Scholar]
- Holguín-Veras, J.; Leal, J.A.; Sánchez-Diaz, I.; Browne, M.; Wojtowicz, J. State of the art and practice of urban freight management: Part I: Infrastructure, vehicle-related, and traffic operations. Transp. Res. Part. A Policy Pract. 2018, in press. [Google Scholar]
- Holguín-Veras, J.; Leal, J.A.; Sanchez-Diaz, I.; Browne, M.; Wojtowicz, J. State of the art and practice of urban freight management Part II: Financial approaches, logistics, and demand management. Transp. Res. Part. A Policy Pract. 2018, in press. [Google Scholar]
- Bell, E.; Bryman, A.; Harley, B. Business Research Methods; Oxford University Press: Oxford, UK, 2018. [Google Scholar]
- Analys, T. Swedish National and International Road Goods Transport, 2016th ed.; Trafikanalys: Stockholm, Sweden, 2017. [Google Scholar]
- Salvendy, G. Stop watch time study and most: Work measurement techniques. In Handbook of Industrial Engineering: Technology and Operations Management; John Wiley & Sons: Hoboken, NJ, USA, 2001. [Google Scholar]
- Allen, J.; Bektas, T.; Cherrett, T.; Bates, O.; Friday, A.; McLeod, F.; Piecyk, M.; Piotrowska, M.; Nguyen, T.; Wise, S. The scope for pavement porters: addressing the challenges of last-mile parcel delivery in London. Transp. Res. Record 2018, 2672, 184–193. [Google Scholar] [CrossRef] [Green Version]
Figure 1.
Typical urban distribution route.

Figure 2.
Speed profile of a distribution route.

Figure 3.
Analysis of relationship between cost vs. savings per initiative.


Table 1.
Summary of daily and weekly duration of activities.
| Activity Location | Activity | Mean | CV (%) | Daily Average | Weekly Share (%) | Weekly Total |
|---|---|---|---|---|---|---|
| Cabin | Driving | 00:07:19 | 87.2 | 02:35:26 | 29.9 | 12:57:11 |
| Park/reverse truck | 00:00:43 | 116.1 | 00:14:58 | 2.9 | 01:14:48 | |
| Administration inside the cabin | 00:00:37 | 148.3 | 00:07:04 | 1.4 | 00:35:19 | |
| Parking spot search | 00:00:31 | 68.7 | 00:01:01 | 0.2 | 00:05:07 | |
| Around vehicle | To customer with goods | 00:00:40 | 110.2 | 00:21:02 | 4 | 01:45:09 |
| Waiting for customer | 00:01:04 | 207.0 | 00:19:01 | 3.7 | 01:35:04 | |
| Walking to/from the cab | 00:00:21 | 115.8 | 00:16:53 | 3.2 | 01:24:23 | |
| From customer without goods | 00:00:28 | 118.2 | 00:13:54 | 2.7 | 01:09:28 | |
| Contact customer | 00:01:45 | 234.7 | 00:10:28 | 2 | 00:52:19 | |
| Signature | 00:00:38 | 67.2 | 00:09:10 | 1.8 | 00:45:52 | |
| To customer without goods | 00:00:28 | 110.9 | 00:09:09 | 1.8 | 00:45:43 | |
| From customer with goods | 00:00:31 | 83.4 | 00:08:28 | 1.6 | 00:42:19 | |
| Scan documents | 00:00:32 | 105.3 | 00:06:23 | 1.2 | 00:31:55 | |
| (Un)loading at the customer site | 00:01:06 | 123.0 | 00:02:35 | 0.5 | 00:12:53 | |
| Break | Break | 00:21:23 | 118.2 | 01:16:01 | 14.6 | 06:20:06 |
| Conversing | 00:00:40 | 103.3 | 00:12:37 | 2.4 | 01:03:06 | |
| Terminal | Route planning | 00:01:15 | 140.2 | 00:20:44 | 4 | 01:43:41 |
| Load goods with pallet jack | 00:01:28 | 107.6 | 00:15:34 | 3 | 01:17:49 | |
| Terminal driving | 00:01:11 | 364.0 | 00:13:07 | 2.5 | 01:05:35 | |
| Load goods w/ electric pallet jack | 00:02:34 | 119.1 | 00:10:51 | 2.1 | 00:54:14 | |
| Unload goods with pallet jack | 00:02:55 | 146.0 | 00:07:48 | 1.5 | 00:38:59 | |
| Unload goods with electric pallet jack | 00:03:00 | 132.7 | 00:05:20 | 1 | 00:26:41 | |
| Close/open the terminal gate | 00:00:25 | 57.8 | 00:03:26 | 0.7 | 00:17:08 | |
| Unloading | Unload truck | 00:00:28 | 83.4 | 00:11:34 | 2.2 | 00:57:51 |
| Tail lift down | 00:00:16 | 53.5 | 00:10:59 | 2.1 | 00:54:53 | |
| Tail lift u | 00:00:14 | 36.9 | 00:08:44 | 1.7 | 00:43:42 | |
| Pallet jack handling | 00:00:16 | 160.6 | 00:07:49 | 1.5 | 00:39:03 | |
| Pick-up/loading | 00:00:24 | 53.4 | 00:06:23 | 1.2 | 00:31:57 | |
| Secure cargo | 00:00:20 | 57.7 | 00:05:08 | 1 | 00:25:42 | |
| Moving other goods | 00:00:21 | 82.3 | 00:04:34 | 0.9 | 00:22:52 | |
| Other | Other | 00:02:47 | 64.5 | 00:04:20 | 0.8 | 00:21:40 |
Notes: CV = standard deviation/mean.
Table 2.
Summary table for the initiatives.
| Type | Classification | Fulfiller | Initiative |
|---|---|---|---|
| Engineering design | Vehicle | Truck manufacturer | Better oversight and sensors |
| Decreased turning radius | |||
| Adjustable mirrors | |||
| Lower truck cabin | |||
| Hands-free setup for phones | |||
| Faster tail lift and temporary roller shutter | |||
| Operational | Handling equipment | Operator | Handheld computer |
| Electric pallet jack | |||
| Navigation | GPS navigation | ||
| Route planning and sequencing | |||
| Operator and receivers | Pre-advice on upcoming customers | ||
| Traffic engineering | Regulation and guidelines | Public authority | Access to bus lanes |
| Sensors for loading zones | |||
| Public authority and receivers | Visible loading zone signs |
© 2020 by the authors. Licensee MDPI, Basel, Switzerland. This article is an open access article distributed under the terms and conditions of the Creative Commons Attribution (CC BY) license (http://creativecommons.org/licenses/by/4.0/).
Share and Cite
MDPI and ACS Style
Sanchez-Diaz, I.; Palacios-Argüello, L.; Levandi, A.; Mardberg, J.; Basso, R. A Time-Efficiency Study of Medium-Duty Trucks Delivering in Urban Environments. Sustainability 2020, 12, 425. https://0-doi-org.brum.beds.ac.uk/10.3390/su12010425
AMA Style
Sanchez-Diaz I, Palacios-Argüello L, Levandi A, Mardberg J, Basso R. A Time-Efficiency Study of Medium-Duty Trucks Delivering in Urban Environments. Sustainability. 2020; 12(1):425. https://0-doi-org.brum.beds.ac.uk/10.3390/su12010425
Chicago/Turabian StyleSanchez-Diaz, Ivan, Laura Palacios-Argüello, Anders Levandi, Jimmy Mardberg, and Rafael Basso. 2020. "A Time-Efficiency Study of Medium-Duty Trucks Delivering in Urban Environments" Sustainability 12, no. 1: 425. https://0-doi-org.brum.beds.ac.uk/10.3390/su12010425
Note that from the first issue of 2016, this journal uses article numbers instead of page numbers. See further details here.