Article

The Responses of the Ecosystems in the Tianshan North Slope under Multiple Representative Concentration Pathway Scenarios in the Middle of the 21st Century

1
State Key Laboratory of Desert and Oasis Ecology, Xinjiang Institute of Ecology and Geography, Chinese Academy of Sciences, Urumqi 830011, China
2
Department of Geography, Ghent University, 9000 Gent, Belgium
3
University of Chinese Academy of Science, Beijing 100094, China
4
Sino-Belgian Joint Laboratory of Geo-information, Urumqi China and Gent Belgium, Urumqi 830011, China
5
Collaborative Innovation Center on Forecast and Evaluation of Meteorological Disaster, School of Geographic Sciences, Nanjing University of Information Science and Technology, Nanjing 210044, China
6
Research Center for Ecology and Environment of Central Asia, Chinese Academy of Sciences, Urumqi 830011, China
7
Shandong Provincial Key Laboratory of Water and Soil Conservation and Environmental Protection, College of Resources and Environment, Linyi University, Linyi 276000, China
8
Royal Meteorological Institute, 1180 Brussels, Belgium
9
Department of Physics and Astronomy, Ghent University, 9000 Ghent, Belgium
*
Authors to whom correspondence should be addressed.
Sustainability 2020, 12(1), 427; https://0-doi-org.brum.beds.ac.uk/10.3390/su12010427
Submission received: 6 December 2019 / Revised: 22 December 2019 / Accepted: 3 January 2020 / Published: 6 January 2020
(This article belongs to the Section Social Ecology and Sustainability)

Abstract

:
The arid ecosystem is fragile and sensitive to the changes in climate and CO2 concentration. Exploring the responses of the arid ecosystem to the changes under different representative concentration pathways (RCPs) is of particular significance for the sustainable development of the ecosystem. In this study, the dynamics of net primary productivity (NPP), evapotranspiration (ET), and water use efficiency (WUE) for arid ecosystems in Tianshan North Slope are explored by running the arid ecosystem model at 25 km resolution under RCP2.6, RCP4.5, and RCP8.5. The climate in Tianshan North Slope presents a wet-warming trend during 2006–2055 under each RCP scenario with temporal and spatial heterogeneity. In response to the changes in climate and CO2, the regional annual NPP and ET increased during 2006–2055 by a respectively maximum rate of 2.15 g C m−2 year−1 and 0.52 mm year−1 under RCP8.5. Both the NPP and ET share a similar temporal and spatial heterogeneity with climate change. Different vegetation types respond differently to the changes under different RCP scenarios with increasing WUE. Under each RCP, the non-phreatophyte, phreatophyte, and grass are more sensitive to the changes than in the others, and the broadleaf forest and cropland are less sensitive to the changes.

1. Introduction

Arid areas, including hyper-arid, arid, and semiarid regions, are of particular importance to humans since they support more than one-fifth of the global population [1]. The ecosystems in the arid area are fragile and sensitive to climate change and anthropogenic activities [2,3,4,5] and play a dominant role in the interannual variability of global net primary productivity (NPP) [6]. The Tianshan North Slope in Xinjiang province of China, located in the inland of Eurasia and far away from the oceans, is one of the driest regions in the world. This region has experienced a faster warming trend with a rate of 0.40 °C warming per decade [7], which is much higher than the global mean rate of 0.27 °C per decade [8]. A wetter trend is also detected by observations during the last several decades [9,10]. These climate changes play a very important role in the carbon and water flux dynamics of the arid ecosystems [11,12,13,14], and have drawn great concern about the sustainable development of the arid ecosystems. Due to the development of the industry and the intensive human activities, the observations from Mauna Loa show that the atmospheric CO2 concentration has increased by 29.3% since 1959 and exceeded 400 ppm in 2015 [15]. Moreover, previous experimental and modeling studies have shown that arid ecosystems benefit from the increase of atmospheric CO2 concentration, which is called the CO2 fertilization effect [2,16,17]. However, different vegetation types have different responses to these changes resulting from the temporal and spatial heterogeneity of the climate change and the unique characteristics of each vegetation type [12,18]. Therefore, the dominant factor differs for each vegetation type. For example, by scenario simulations, Zhang et al. [17] quantitatively explored the responses of the arid ecosystems in Central Asia to the changes in climate and CO2 concentrations by scenario simulations, and they found that the NPP of the natural ecosystems was sensitive to precipitation change, while the NPP of cropland was sensitive to the CO2 fertilization effect.
The carbon and water fluxes are key functions of the ecosystem, and are widely used to measure the status of the ecosystem [19,20,21,22,23,24]. The carbon flux, NPP, which is the net carbon retained by the vegetation in the ecosystem, is a balance between the carbon uptake from the photosynthetic function and the carbon losses caused by the plant respiration. The water flux, evapotranspiration (ET), is the sum of the evaporation of the soil, evaporation of the canopy interception, and the transpiration of vegetation. The NPP is the key component in the global carbon cycle while the ET is the major component of the global hydrological cycle [21,23]. On one hand, both NPP and ET are vulnerable to the changes in the climate and the atmospheric CO2 concentration and the anthropogenic activities. Based on model simulations, Han et al. [12] found that the annual NPP of grassland in arid Central Asia followed a decreasing trend (−0.21 g C m−2 year−1) from 1979 to 2011, resulting from the increase of annual mean temperature and the decline of precipitation. During the same period, the ET of grassland experienced significant declines of 1.47–2.72 mm per decade due to the climate change [25]. On the other hand, the two indicators coexist in the photosynthesis and respiration processes and are controlled by the status of the stomas [26,27,28]. It is therefore necessary to explore the responses of the ecosystem to the climate change and CO2 fertilization effect simultaneously, especially for the future projections. Additionally, it is of significant importance for the sustainable development of the arid ecosystems and the policy making for climate adaption and mitigation to study the NPP and ET dynamics of different arid ecosystems under multiple representative concentration pathway (RCP) scenarios.
For an ecosystem, the water use efficiency (WUE) is defined by the ratio between carbon sequestration and water consumption, and it can be used to describe the tight link between carbon and water cycles within the ecosystem. Compared to NPP and ET, WUE is more sensitive to the ambient changes such as changes in precipitation, temperature, and CO2 concentration. So it has been widely used to detect the responses of the ecosystems to historical changes in climate and CO2 concentration. Under the global climate change, the annual WUE shows an increasing trend over middle and high northern latitudes [6,29]. Previous studies showed that the increasing CO2 contributes to the increase of WUE by influencing the stomatal closure [30]. In addition, the climate change can enhance the effects of CO2 on WUE [29]. Moreover, the WUEs of different ecosystems respond differently in climate change [31,32]. However, previous studies mainly focused on the WUE responses to historical changes in climate and CO2. So it is very urgent for us to know about the WUE dynamics of the ecosystems in the arid area where the ecosystems are sensitive to the ambient changes.
The ecosystem process-based modelling is one of the best choices for predicting the carbon and water dynamics in global carbon and water cycles [33,34]. The arid ecosystem model (AEM) is selected to explore the dynamics of the NPP and ET in the Tianshan North Slope under multiple RCP scenarios at a horizontal resolution of 25 km. Compared to the popular ecosystem models, the AEM model can represent the unique root and canopy structure of the xeric vegetation and ecophysiological processes [35]. Additionally, it has been well validated and successfully applied to study the impacts of the climate change and CO2 fertilization effect on the carbon and water cycles of the arid ecosystems in Central Asia, including the Tianshan North Slope area [3,4,14,17,36,37]. The AEM model is forced by dynamically downscaled data from the RCP2.6, RCP4.5, and RCP8.5 at 25 km resolution from 2006 to 2055 during which significant climate change has been detected [38]. These three RCP scenarios (RCP2.6, RCP4.5, and RCP8.5), which were predicted to lead to radiative forcing levels of 2.6, 4.5, and 8.5 W/m2 by the end of the 21st century, present the low, medium, and high greenhouse gas emissions, respectively [39]. The CO2 concentration reaches the maximum around 2052 and keeps at a high level from 2053 to 2055 under RCP2.6, while it increases continuously from 2006 to 2055 under RCP4.5 and RCP8.5. These three RCP scenarios are widely used to study future climate change and its ecological effects [40,41,42].
Previous studies mainly focused on the historical effects of changes in climate and/or CO2 concentration on one or two elements (NPP, ET, and WUE) at a large scale [12,17,18,25,36]. How the fragile ecosystems in the arid area will respond to the future changes in climate and CO2 concentration remains unclear. In this study, we take the arid area in Tianshan North Slope as our study area to explore the dynamics of NPP, ET, and WUE for different arid ecosystems under multiple RCP scenarios (RCP2.6, RCP4.5, and RCP8.5) in the near future. The Tianshan North Slope, one of the economic centers in the northwest China, is an important region in the Silk Road. It is an ideal region to explore the climate change and CO2 fertilization effects for it contains various vegetation types, changing from the desert to the mountains, and is sensitive to the climate change [43,44]. Therefore, it is of particular importance to study the response of the arid ecosystem in Tianshan North Slope to the near future changes in climate and CO2 concentration. In this study, we first analyzed the temporal and spatial patterns of the climate change in the Tianshan North Slope region under different RCP scenarios. Then, the spatial and temporal dynamics in NPP and ET of the region are detected. Finally, we focus on the NPP, ET, and WUE temporal dynamics of different vegetation types, and compare the different responses among different vegetation types. Thus, the forthcoming results should enhance our understanding of the climate change and CO2 fertilization effects on the arid ecosystems and provide scientific guidance for the decision makers to take proper actions to maintain the sustainable development of the arid ecosystem in the future.

2. Materials and Methods
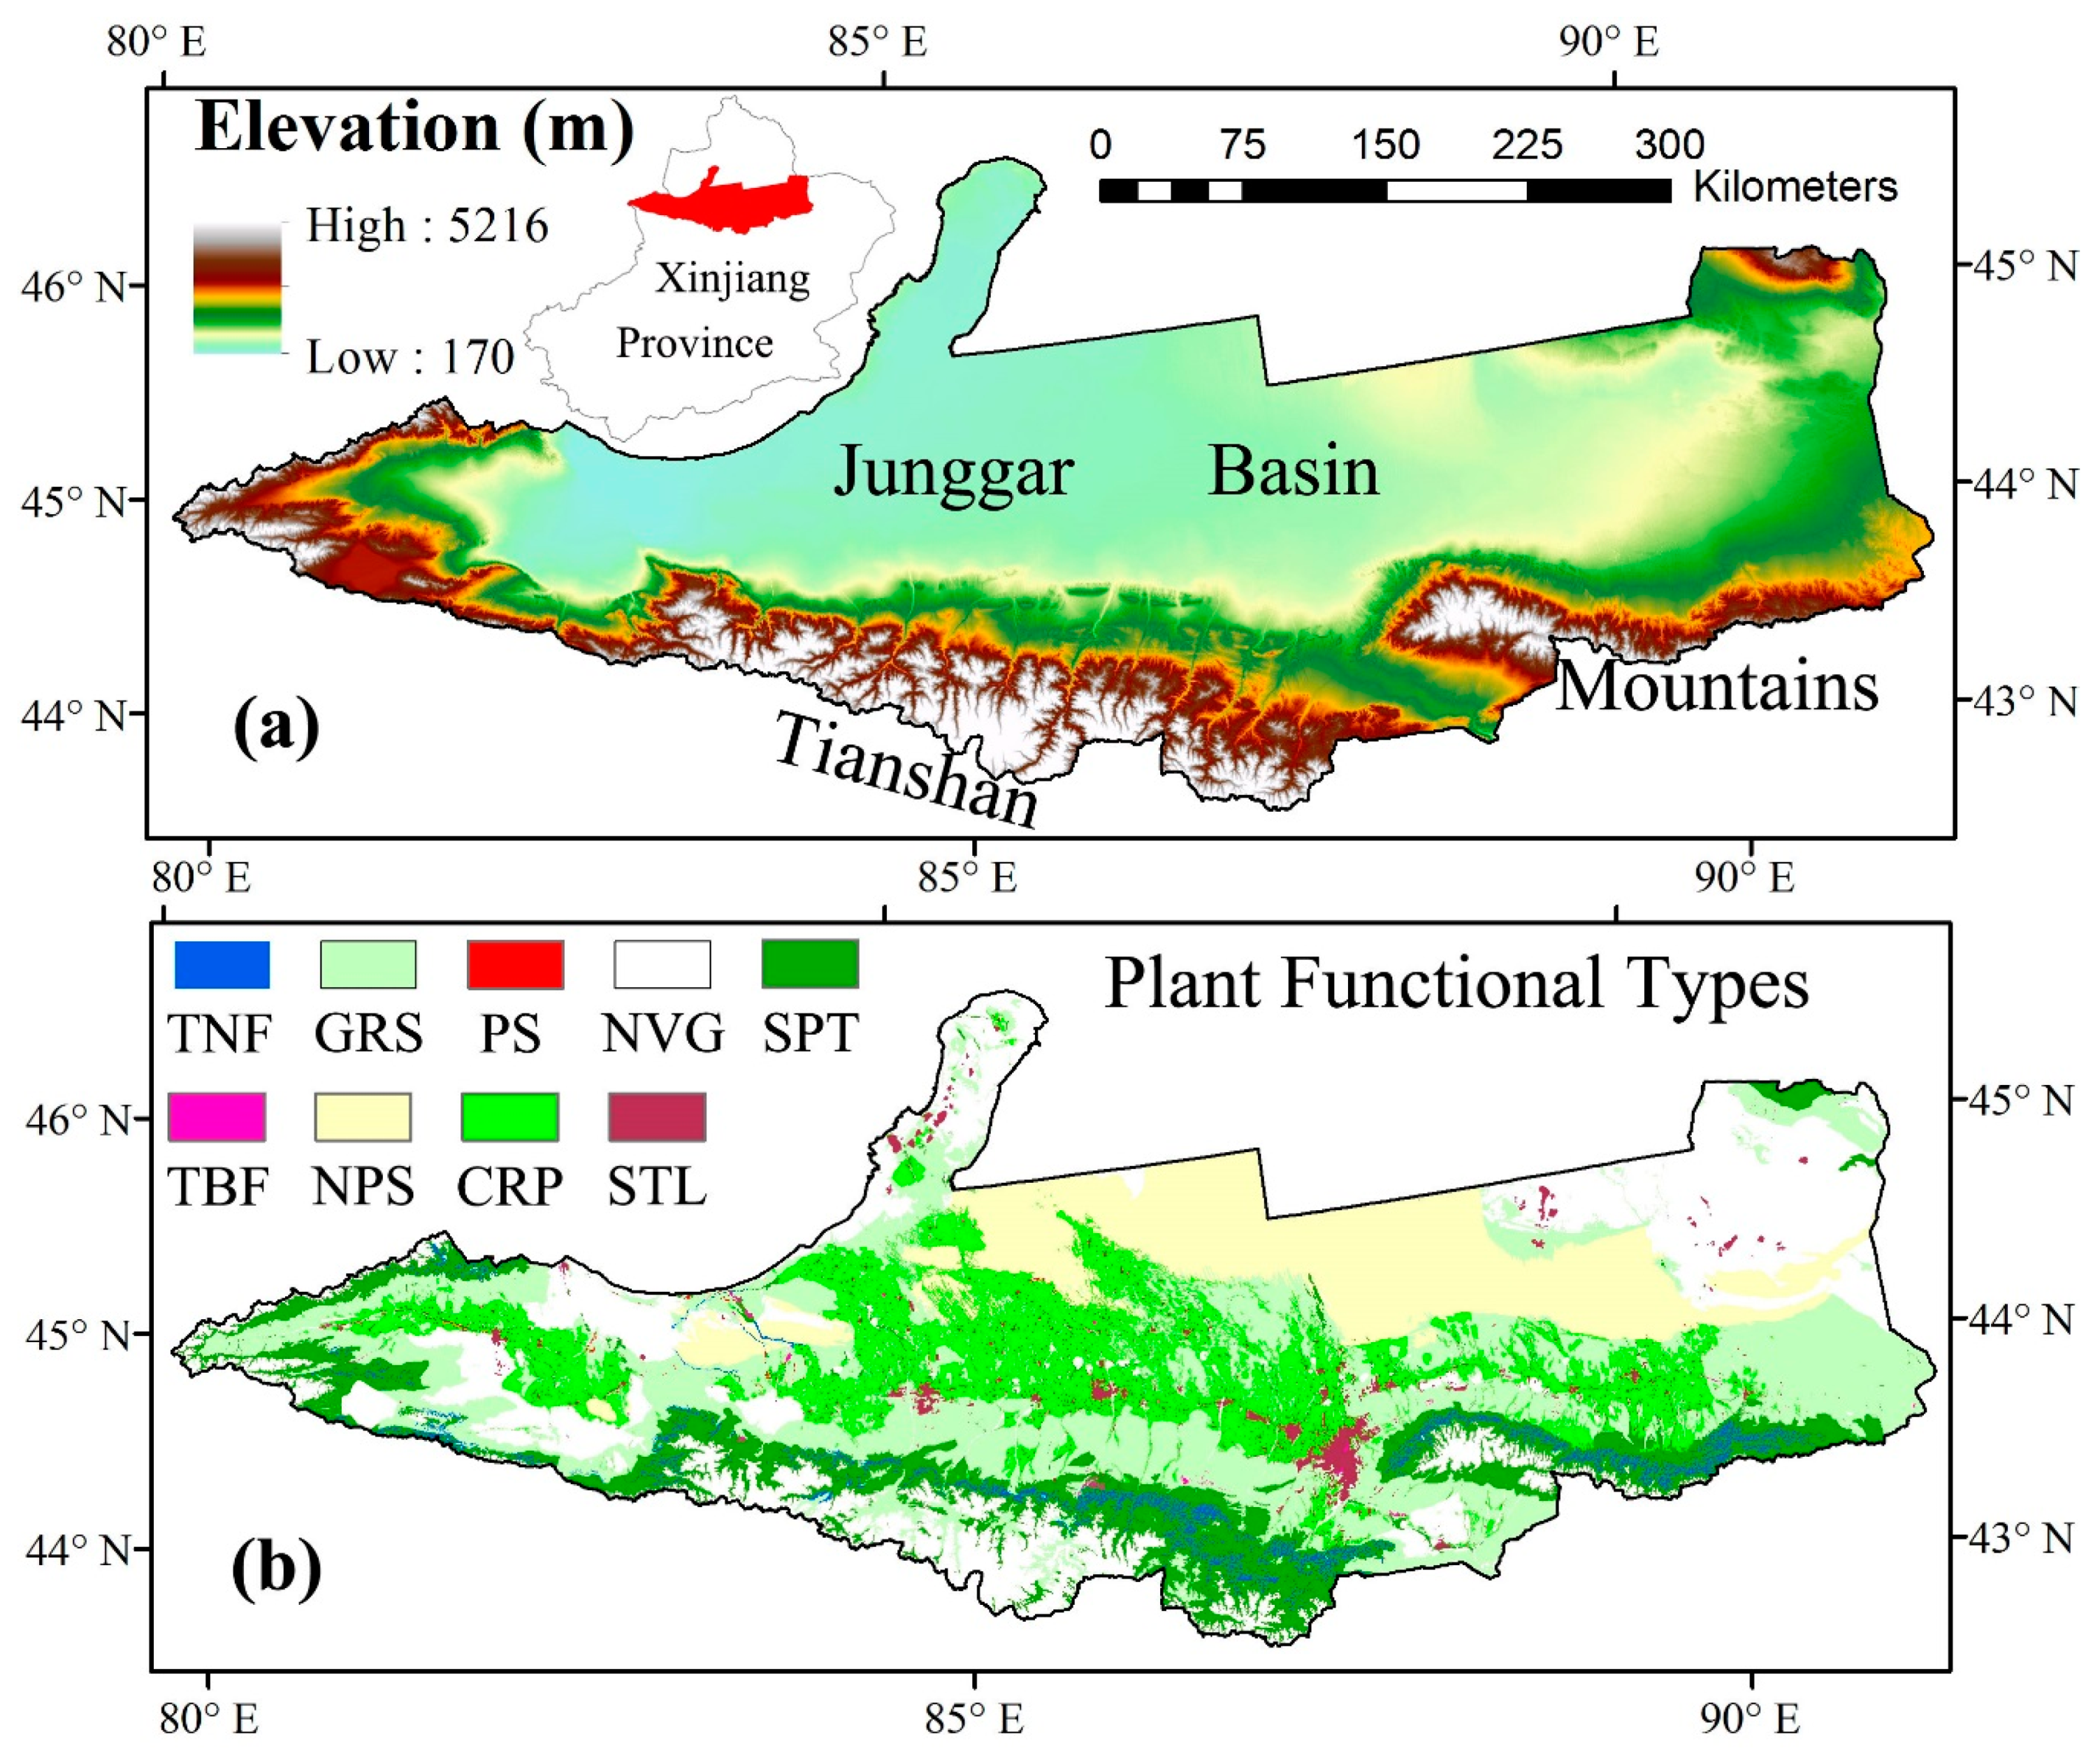
2.1. Study Area

The Tianshan North Slope, located in the Xinjiang province, China, is a typical arid area covering 148.8 × 10³ km2 (43.0° N/79.8° E–46.2° N/91.6° E). It has a typical arid landscape that contains mountains and deserts and covers the major vegetation types of the arid Central Asia. The topography is very complex, with an elevation varying from 170 m in the Junggar Basin to 5216 m in the mountainous region (Figure 1a). It has an annual mean temperature of 2 °C and annual potential water surface evaporation around 2000 mm. From the basin to the mountains, the annual precipitation increases from 100 mm in the desert to 500 mm in the mountains, while the annual mean temperature has an opposite relationship, decreasing from 5 °C in the desert to −5 °C in the mountains [43]. Following this water and heat distribution, the spatial pattern of the vegetation from the desert to the mountains is desert xeric shrubs, crops, grassland, coniferous forest, and alpine meadows.
In order to detect the responses of different vegetation types to the future climate change and CO2 fertilization effect, we divided the vegetation into eight types, namely, temperate needle-leaf forest (TNF), temperate broadleaf forest (TBF), grass (GRS), non-phreatophyte shrub (NPS), phreatophyte shrub (PS), crop (CRP), summer pasture (SPT), and settlement (STL) (Figure 1b). In our study area, the dominant vegetation type is GRS, which is widely spread in the low mountainous area and covers 28.0% of the total area. The CRP is widely distributed on alluvial fans between the desert and mountains, and covers 16.4% of the total area. The third vegetation type, the NPS (mainly dominated by Haloxylon ammodendron) is widely distributed in the desert and covers 15.5% of the total area. The SPT is widely spread in the mountainous area with an elevation higher than 1600 m and covers the 12.9% of the total area. The other four types, namely, TNF, TBF, PS, and STL cover only 4.1% of the total area. The other 23.1% of the total area is not covered by any vegetation. It includes bare soil, rocks, glaciers, and water bodies, and is excluded from this study.

2.2. AEM Model

The process-based ecosystem model used in this study, AEM, couples the biogeochemical (carbon and water processes) and biophysical processes (energy balance) and is a spatially explicit ecosystem model [2,35]. Based on the field studies, the vertical root distribution and the plant structure of the xeric vegetation are well addressed in AEM. It uses a detailed mechanistic submodel to describe the water movement along the groundwater–soil–root–leaf continuum. The Farquhar biochemical model was coupled to AEM to calculate the gross primary production (GPP) [45]. For a single plant, the daily NPP is estimated as the balance of the GPP and the autotrophic respiration (Ra) shown in Equation (1):
NPP = GPP − Ra
where NPP (g C/(plant day)) is the net primary productivity, GPP (g C/(plant day)) is the gross primary production and Ra (g C/(plant day)) is the auto respiration that can be calculated by Equation (2):
Ra = Rm + Rg
where Rm (g C/(plant day)) is the daily maintenance respiration and Rg (g C/(plant day)) is the growth respiration. The Rm is calculated by the ambient temperature while the Rg is calculated by a constant ratio of 25% of the residual between GPP and Rm [35,46].
The ET in AEM was calculated from the plant transpiration, soil evaporation and canopy interception evaporation as shown in Equation (3):
ET = Tran + Es + Ec
where Tran (mm/(plant day)) is the plant’s daily transpiration that is controlled by the water availability from the soil and the potential transpiration determined by the weather conditions [35]. Es (mm/(plant day)) is the soil evaporation that is assumed to only take place in the top 5 cm soil layer. Ec (mm/(plant day)) is the canopy interception evaporation. More details about AEM can be found in the literature [35].
The WUE is defined as a ratio of photosynthetic carbon taken up to water consumed [47], and it is a very important parameter to measure the health of the ecosystem and check the influence of the environmental changes on the ecosystem, since it is more sensitive to the ambient changes than NPP or ET [25,48]. Here we calculate the WUE as the ratio of GPP to ET as shown in Equation (4):
WUE = GPP/ET.
The AEM model has been validated by field observations for daily ET, NPP, vegetation, and soil carbon storage in Central Asia [2,3,35]. Recently, Zhang et al. [17] validated the performance of AEM in predicting NPP dynamics under manipulated climate and CO2 concentration by using 28 experimental sites. These validation results show that AEM could correctly simulate the carbon and water fluxes and pools of the arid ecosystem in Central Asia. Therefore, AEM has been widely used to study the biogeochemical processes of the arid ecosystem in Central Asia and China, including the vegetation and soil carbon storage dynamics, and NPP, GPP, and ET responses to climate change and CO2 fertilization effects for different vegetation types, such as GRS, xeric shrubs, and forests [3,4,14,17,18,37].

2.3. Model Inputs

The plant functional type map of the Tianshan North Slope was derived from the land-use map which was extracted from Landsat Enhanced Thematic Mapper (2015) and provided by the Xinjiang and Central Asia scientific data sharing platform [49]. The terrain data including the elevation, aspect, and slope were derived from the 30 m spatial resolution Advanced Spaceborne Thermal Emission and Reflection Radiometer (ASTER) Global Digital Elevation Model Version 2 data set [50]. The soil information such as pH and soil texture was extracted from the data set of soil properties for land surface modeling [51]. The predefined annual CO2 concentration dynamical data under RCP2.6, RCP4.5, and RCP8.5 was given as input to AEM [39].
The climate data used to force AEM consist of daily 2 m mean, maximum, and minimum temperature, relative humidity, precipitation, and short wave radiation. The climate data under the RCPs from the global circulation models (GCMs) are too coarse to be used to study the climate change effects at regional or local scales [52,53,54,55]. To solve this problem, the international CORDEX (Coordinated Regional Climate Downscaling Experiment) project provides smaller limited domains for different regions to do the downscaling and provide high-resolution climate information. The climate data we used were extracted from climate runs at 25 km resolution of the regional climate model ALARO-0 driven by the GCM CNMR-CM5 over the Central Asia domain. This dynamical downscaling was conducted at the Royal Meteorological Institute of Belgium.
In this study, the AEM was forced by the climate data and the corresponding dynamical CO2 under RCP2.6, RCP4.5, and RCP8.5 from 2006 and 2055. The input data sets are summarized in Table 1.

3. Results

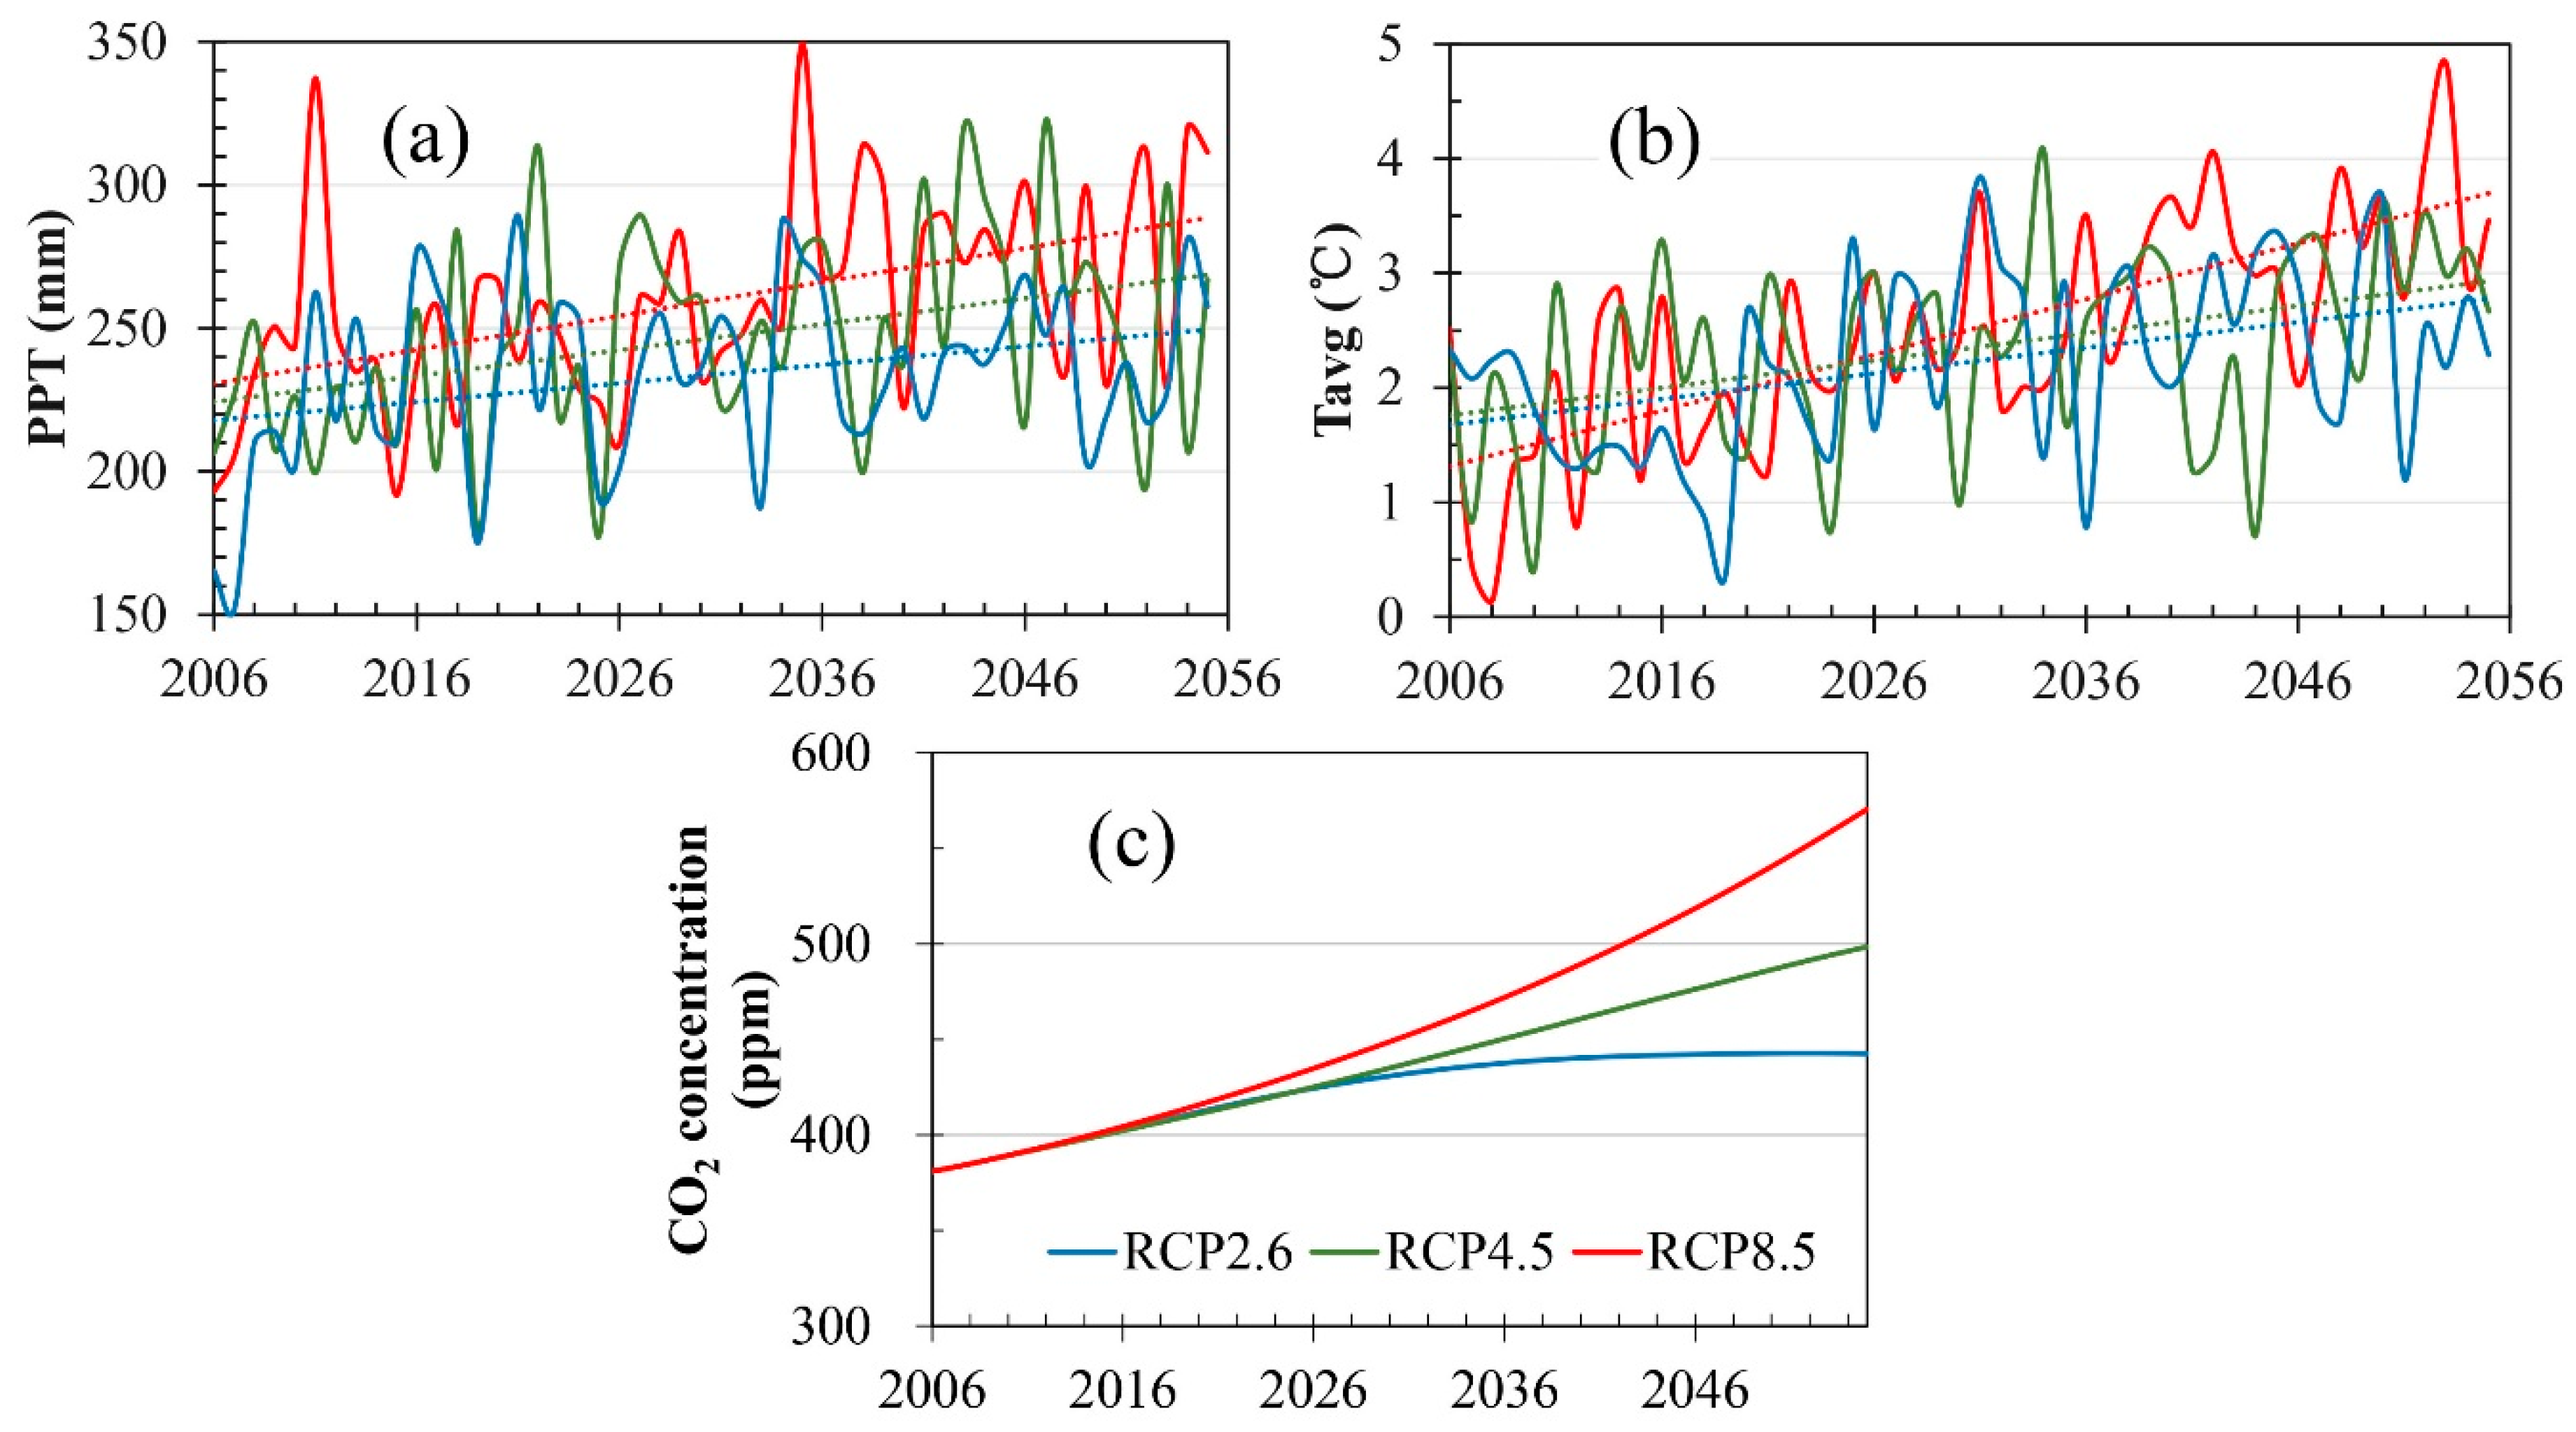
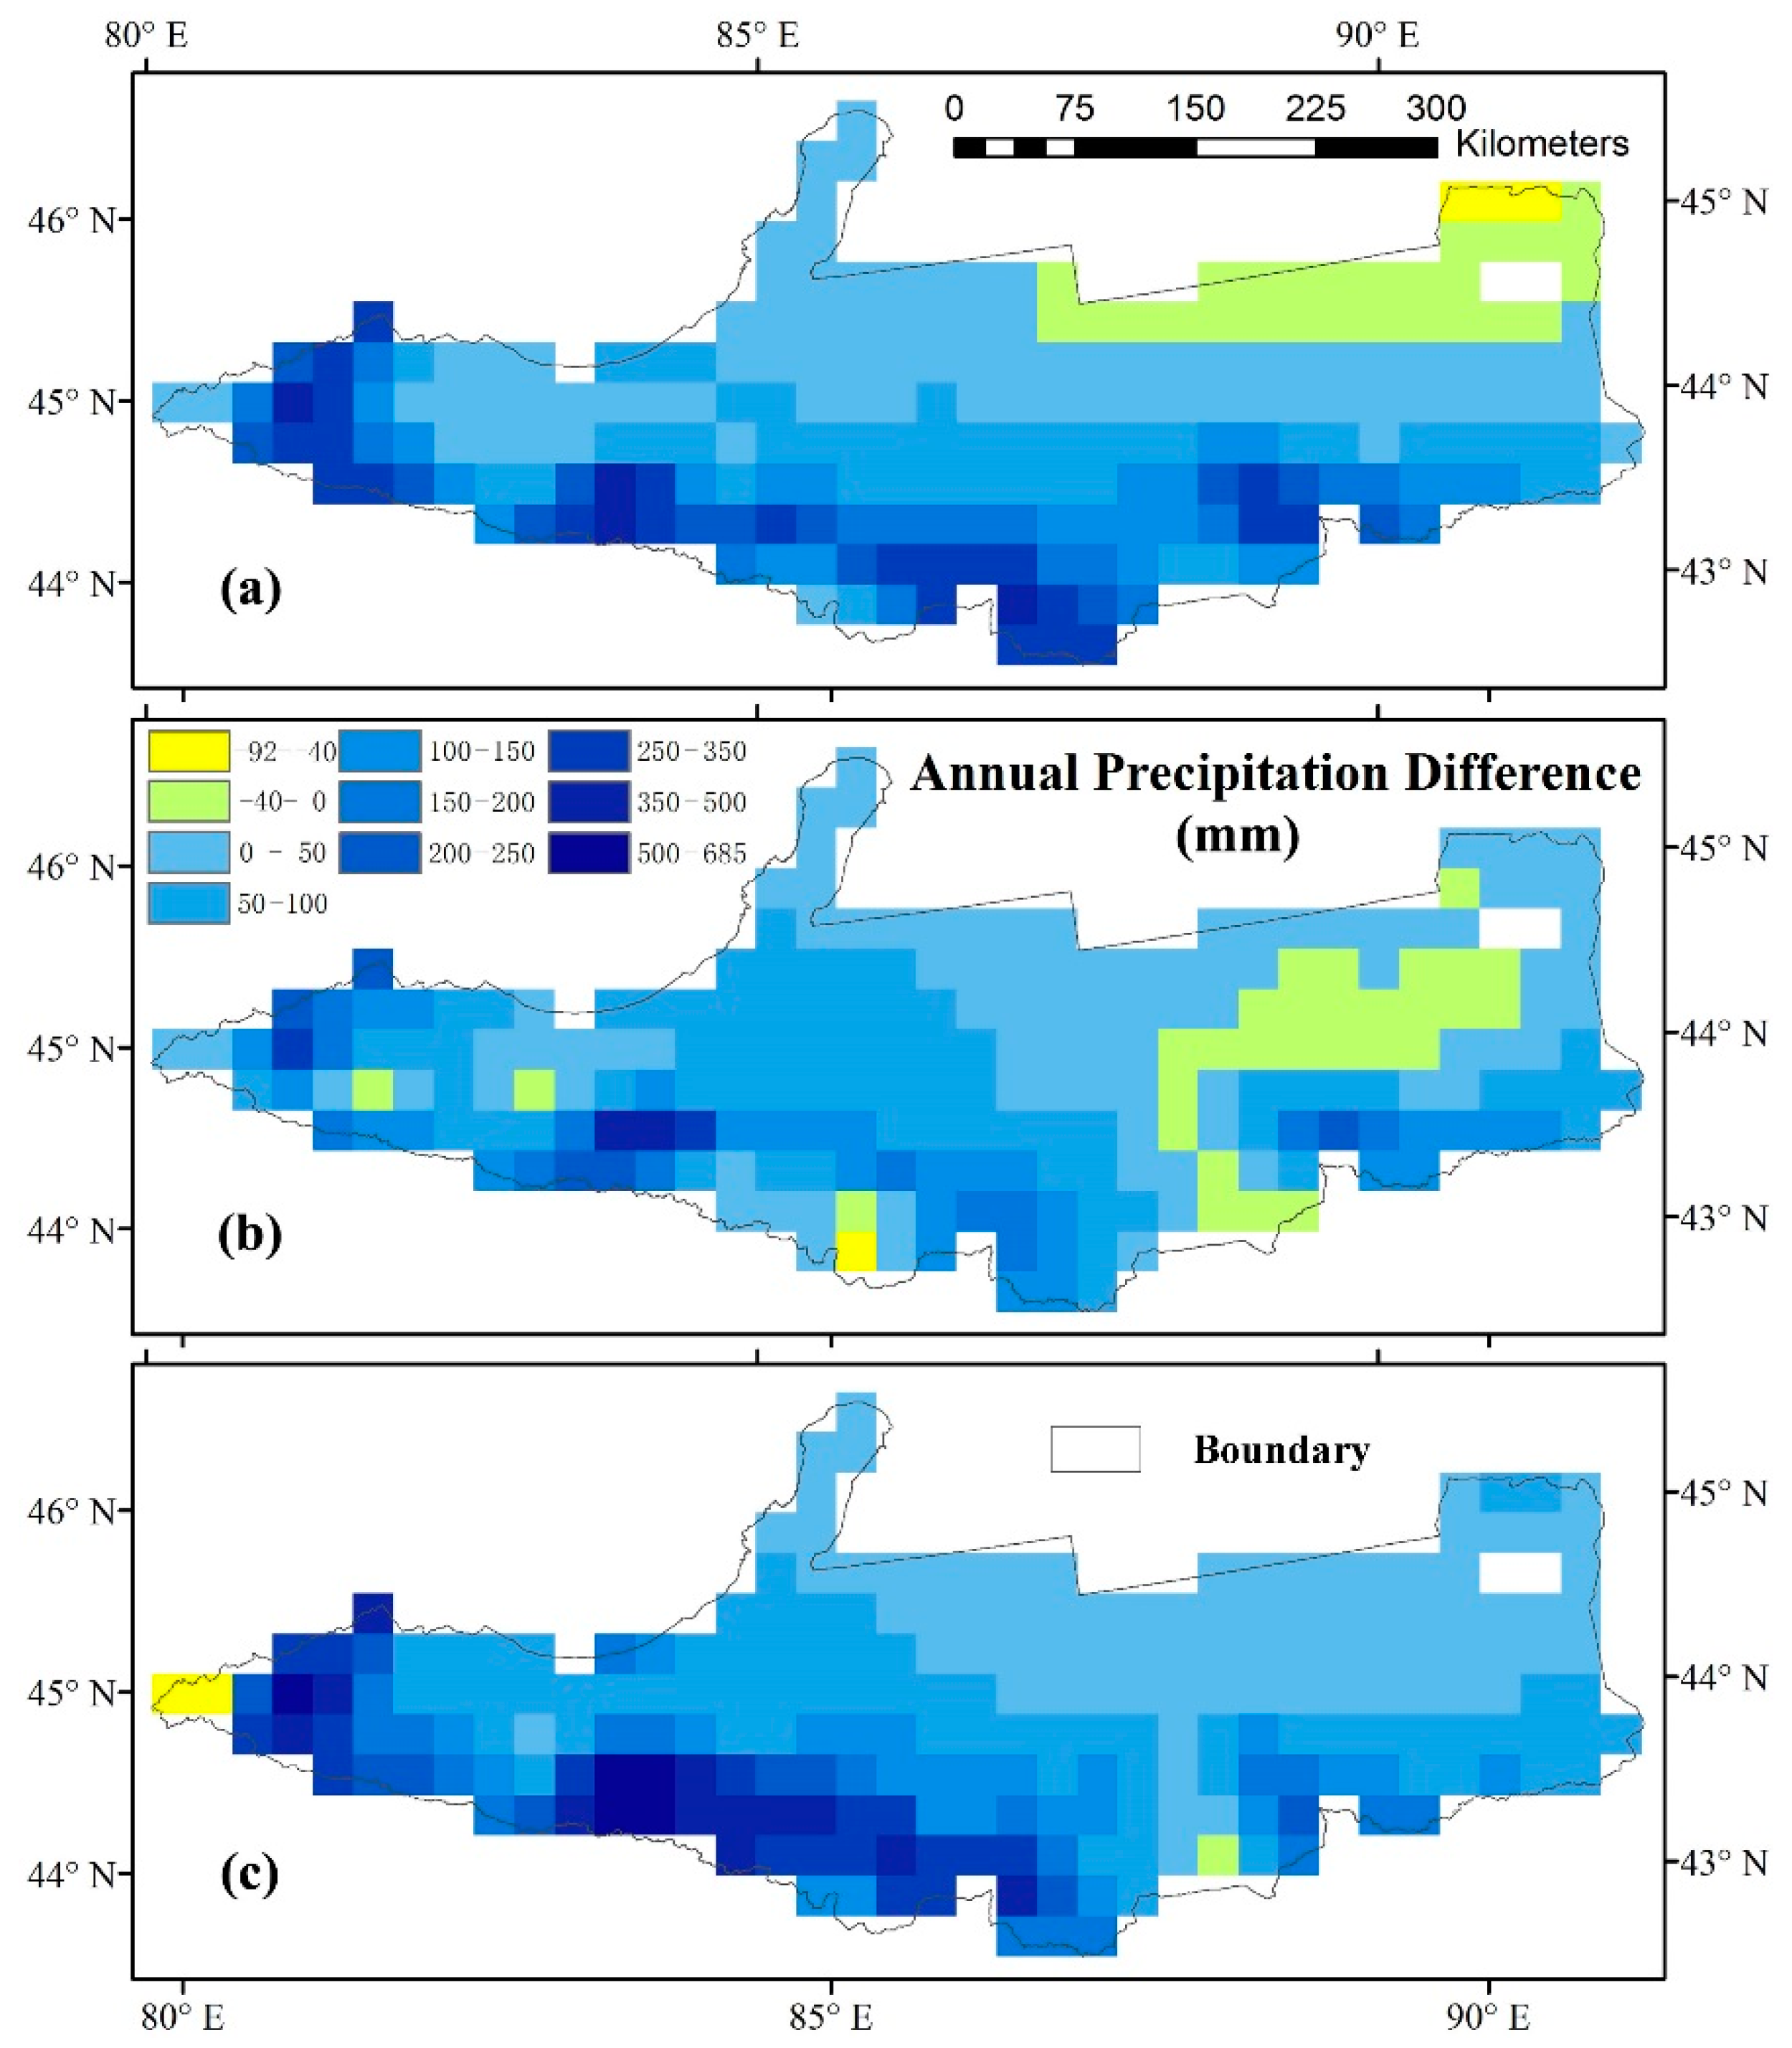
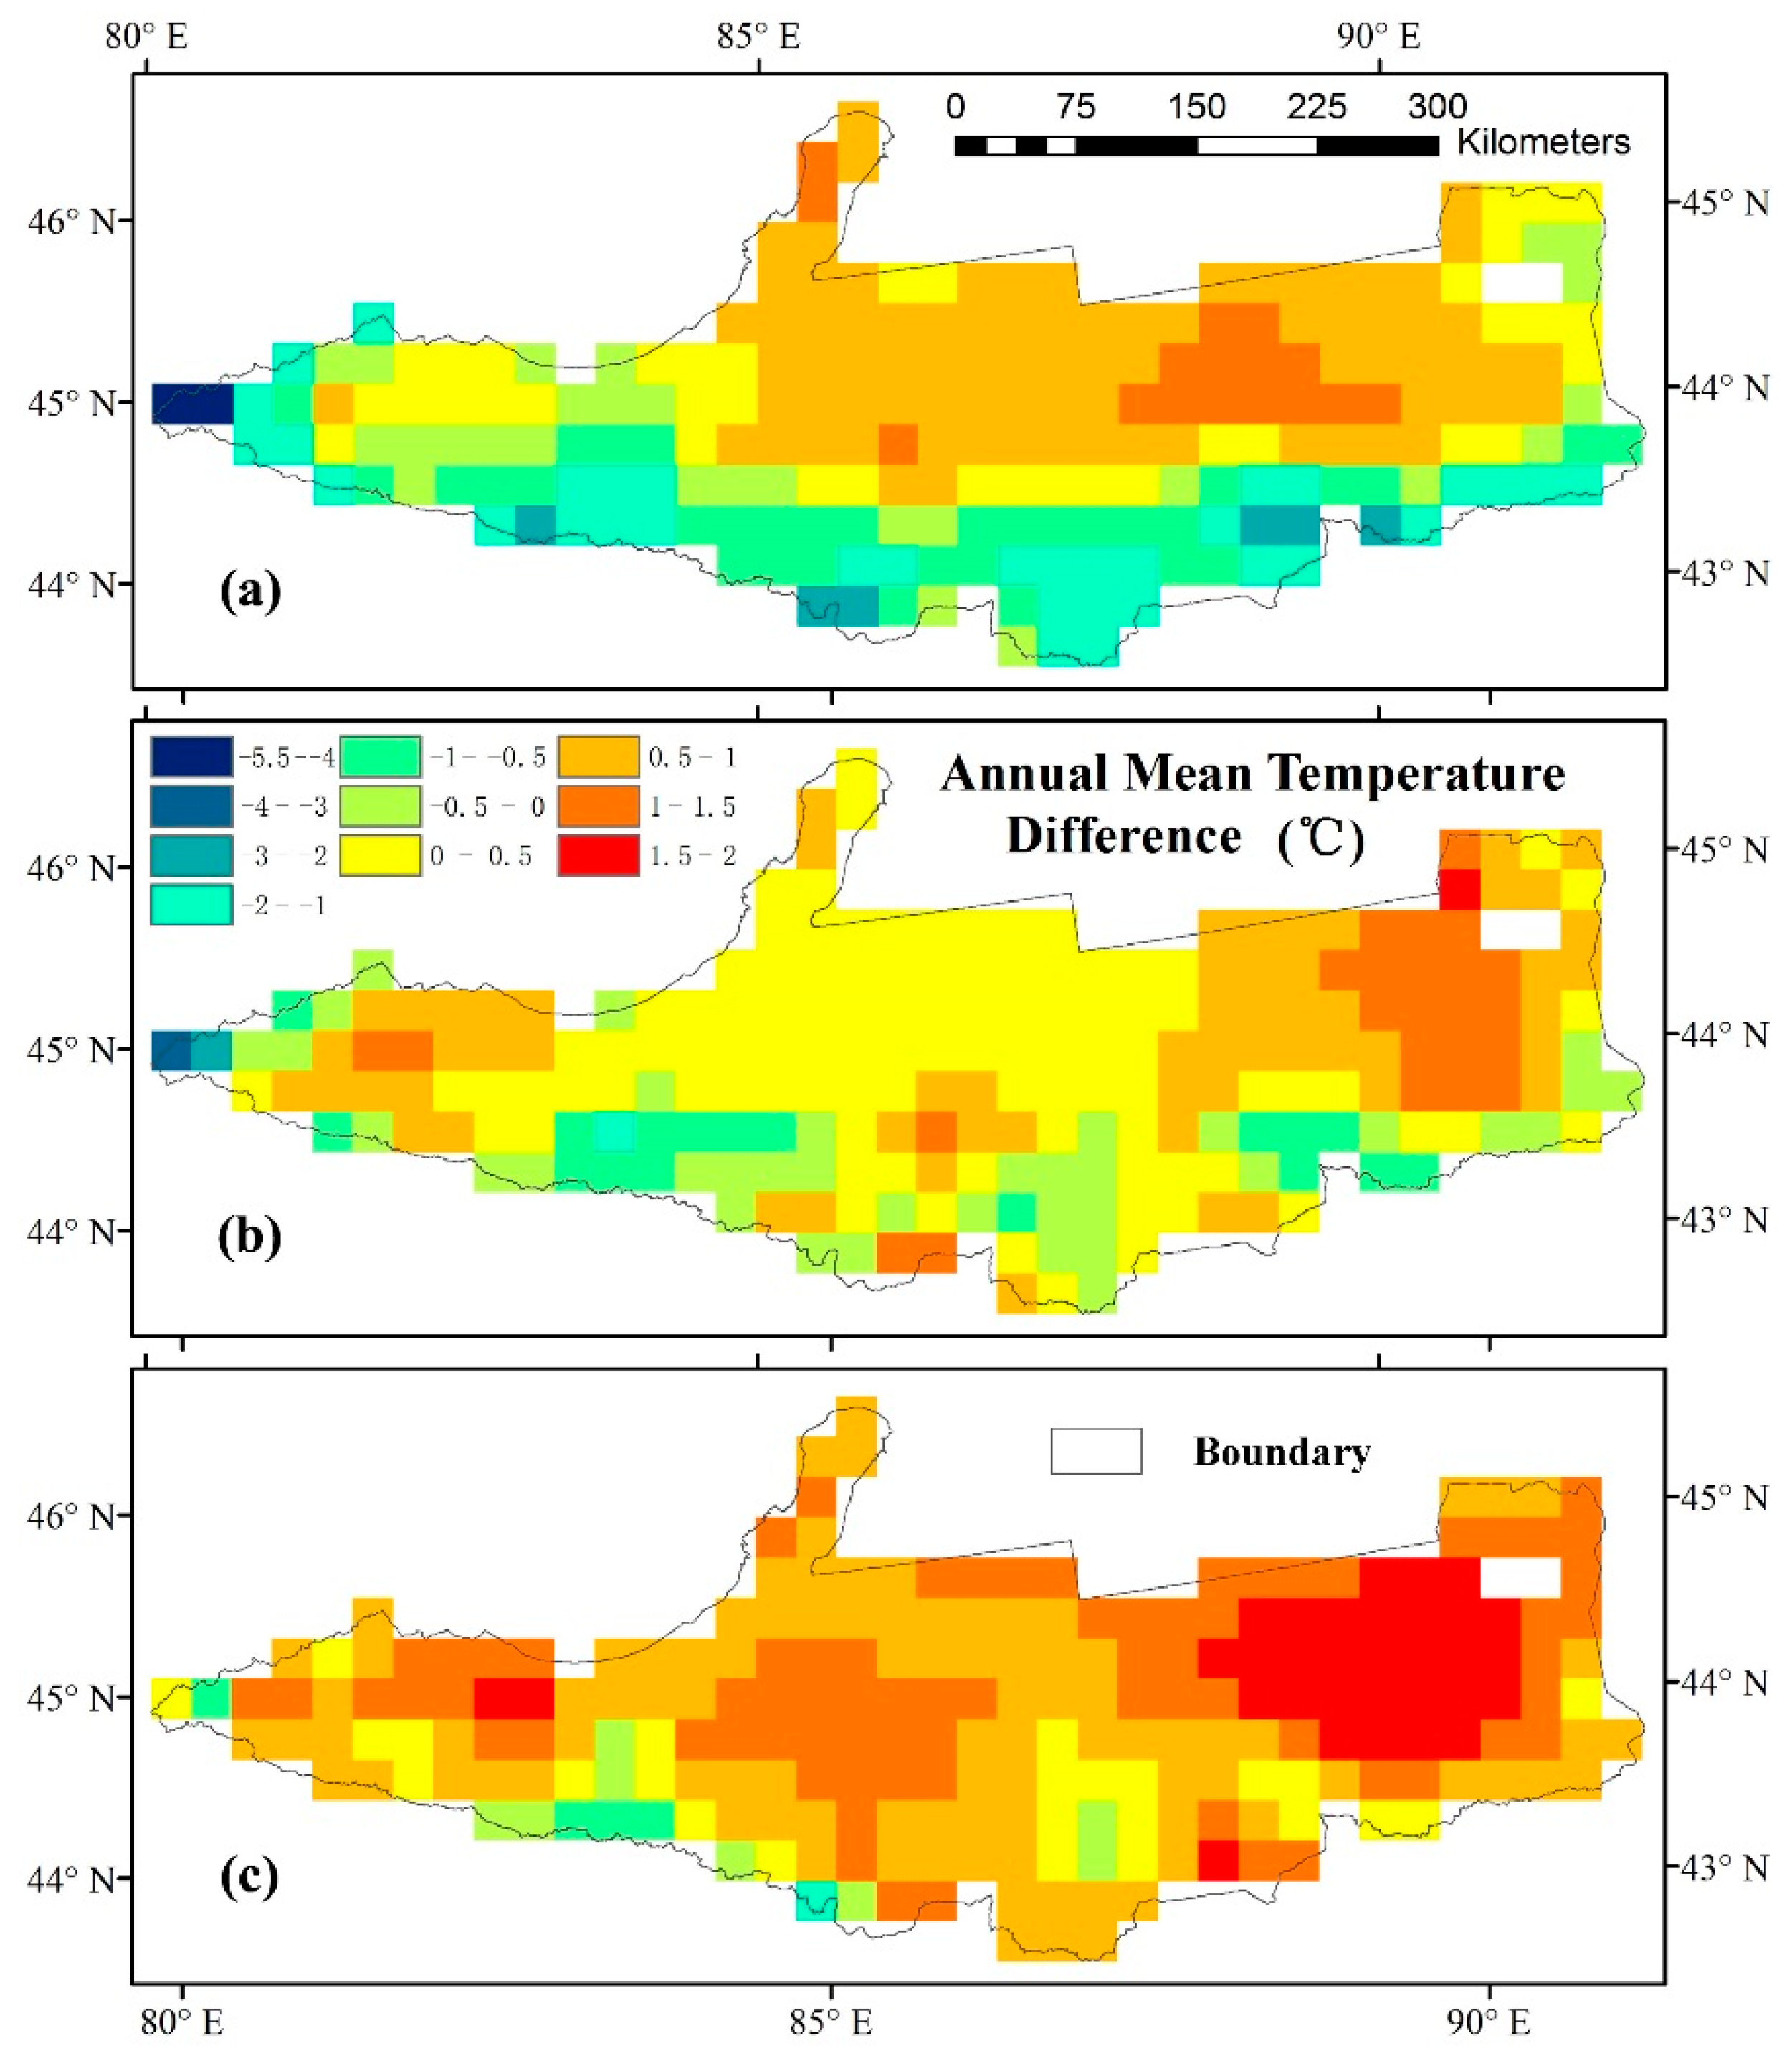
3.1. Future Climate Changes under Different RCP Scenarios

The downscaled climate data indicate that the climate in Tianshan North Slope will experience a wetter and warmer trend under the three different RCPs (Figure 2a,b). The linear fitting shows that the regional annual precipitation will increase with a predicted maximum rate of 11.8 mm per decade under the RCP8.5 scenario, a medium rate of 9.0 mm per decade under the RCP4.5 scenario, and a minimum rate of 6.5 mm per decade under the RCP2.6 scenario in 2006–2055 (Figure 2a). Similar to the precipitation temporal patterns, the regional annual mean temperature will increase with a predicted maximum rate of 0.49 °C per decade under the RCP8.5 scenario and minimum rate of 0.22 °C per decade under the RCP2.6 scenario from 2006 to 2055 (Figure 2b). A noteworthy feature is that the temperature increase rate under RCP4.5 (0.24 °C per decade) is very close to the one under RCP2.6 during 2006–2055 period (Figure 2b). In addition, there is temporal heterogeneity in the climate patterns. During the first 30 years (2006–2035), the regional annual precipitation and mean temperature increase at a higher rate than in the next 20 years (2036–2055) (Table 2) under the three different RCPs. The climate changes under the three RCPs are positive, except for the precipitation change under RCP4.5 from 2036 to 2055 (Table 2). The CO2 concentration change from 2006 to 2055 is presented in Figure 2c. It shows that the CO2 concentration will reach 442.55 ppm, 498.47 ppm, and 570.52 ppm under RCP2.6, RCP4.5, and RCP8.5 by 2055, respectively. The CO2 concentration is predicted to reach the maximum (442.76 ppm) in 2052 under RCP2.6, and keeps almost a linear increasing rate (2.44 ppm year−1) under RCP4.5 and has an accelerated increasing rate under RCP8.5 (Figure 2c).
Figure 3 presents the spatial pattern of the annual precipitation change between 2006 and 2055. It clearly shows that the largest precipitation increase happens in the mountainous area under all three RCPs. However, the precipitation decreases in the northeastern and eastern part of the study area under RCP2.6 and RCP4.5, respectively. Moreover, the precipitation differences are less than 50 mm in the desert, while they are higher than 100 mm in the mountains. This indicates that the precipitation will increase much more in the mountains than in the basin. For the spatial temperature difference, the temperature increases in the basin, especially in the northeastern part, while it decreases in the mountains (Figure 4). The intensity of the positive temperature difference increases from RCP2.6 to RCP8.5, while the intensity of the negative temperature difference decreases from RCP2.6 to RCP8.5. Under the RCP2.6 scenario, the temperature declines in almost the entire mountainous region (Figure 4a). The temperature-declined area over the mountains decreases under RCP4.5 (Figure 4b) and only a small area is found with a negative temperature difference in the mountains under RCP8.5 (Figure 4c). Compared to 2006, the regional mean annual temperature in 2055 is slight lower with a difference of −0.05 °C under RCP2.6, higher with a difference of 0.30 °C under RCP4.5, and significantly higher with a difference of 0.944 °C under RCP8.5.
By combining the spatial differences of precipitation and temperature, we can conclude that for the 2006–2055 period, the climate will become warm and dry in the northeast of Tianshan North Slope, while it will become wet and cold in the mountains under the RCP2.6 scenario. Under RCP8.5, the climate will get hot and wet in almost the entire study area. Furthermore, the climate change pattern under RCP4.5 is more complex than the other two RCPs.

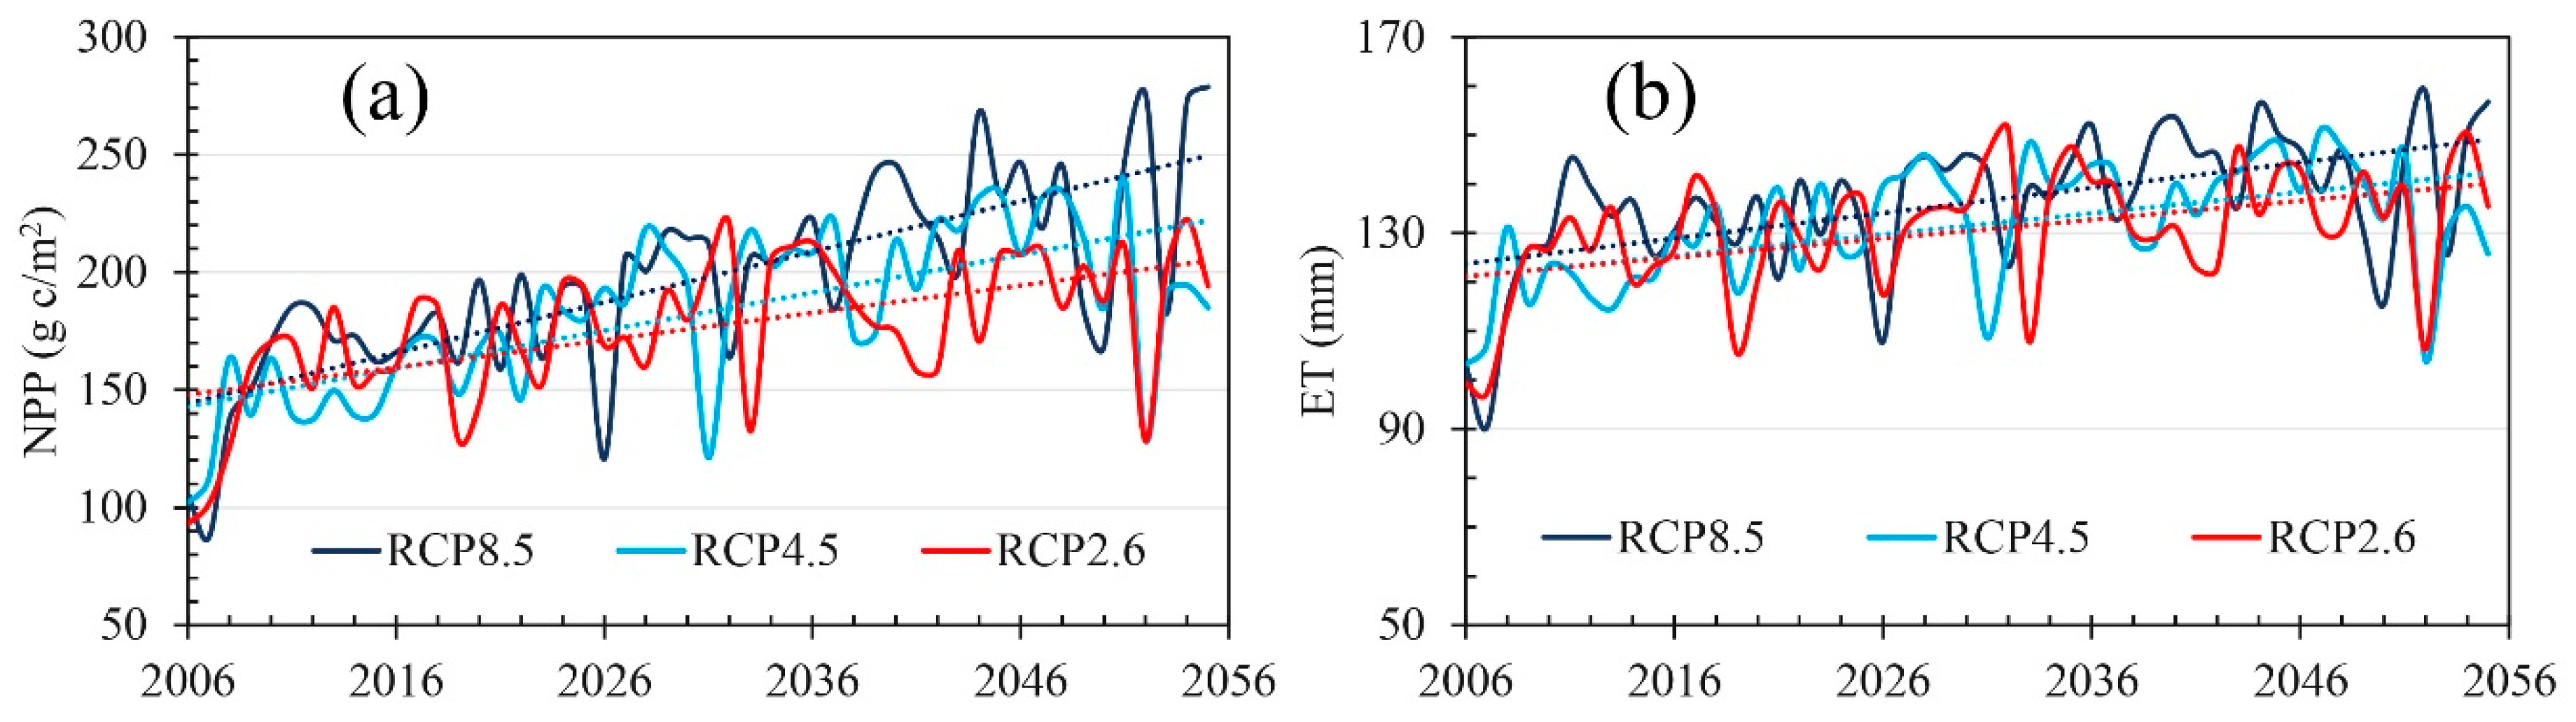
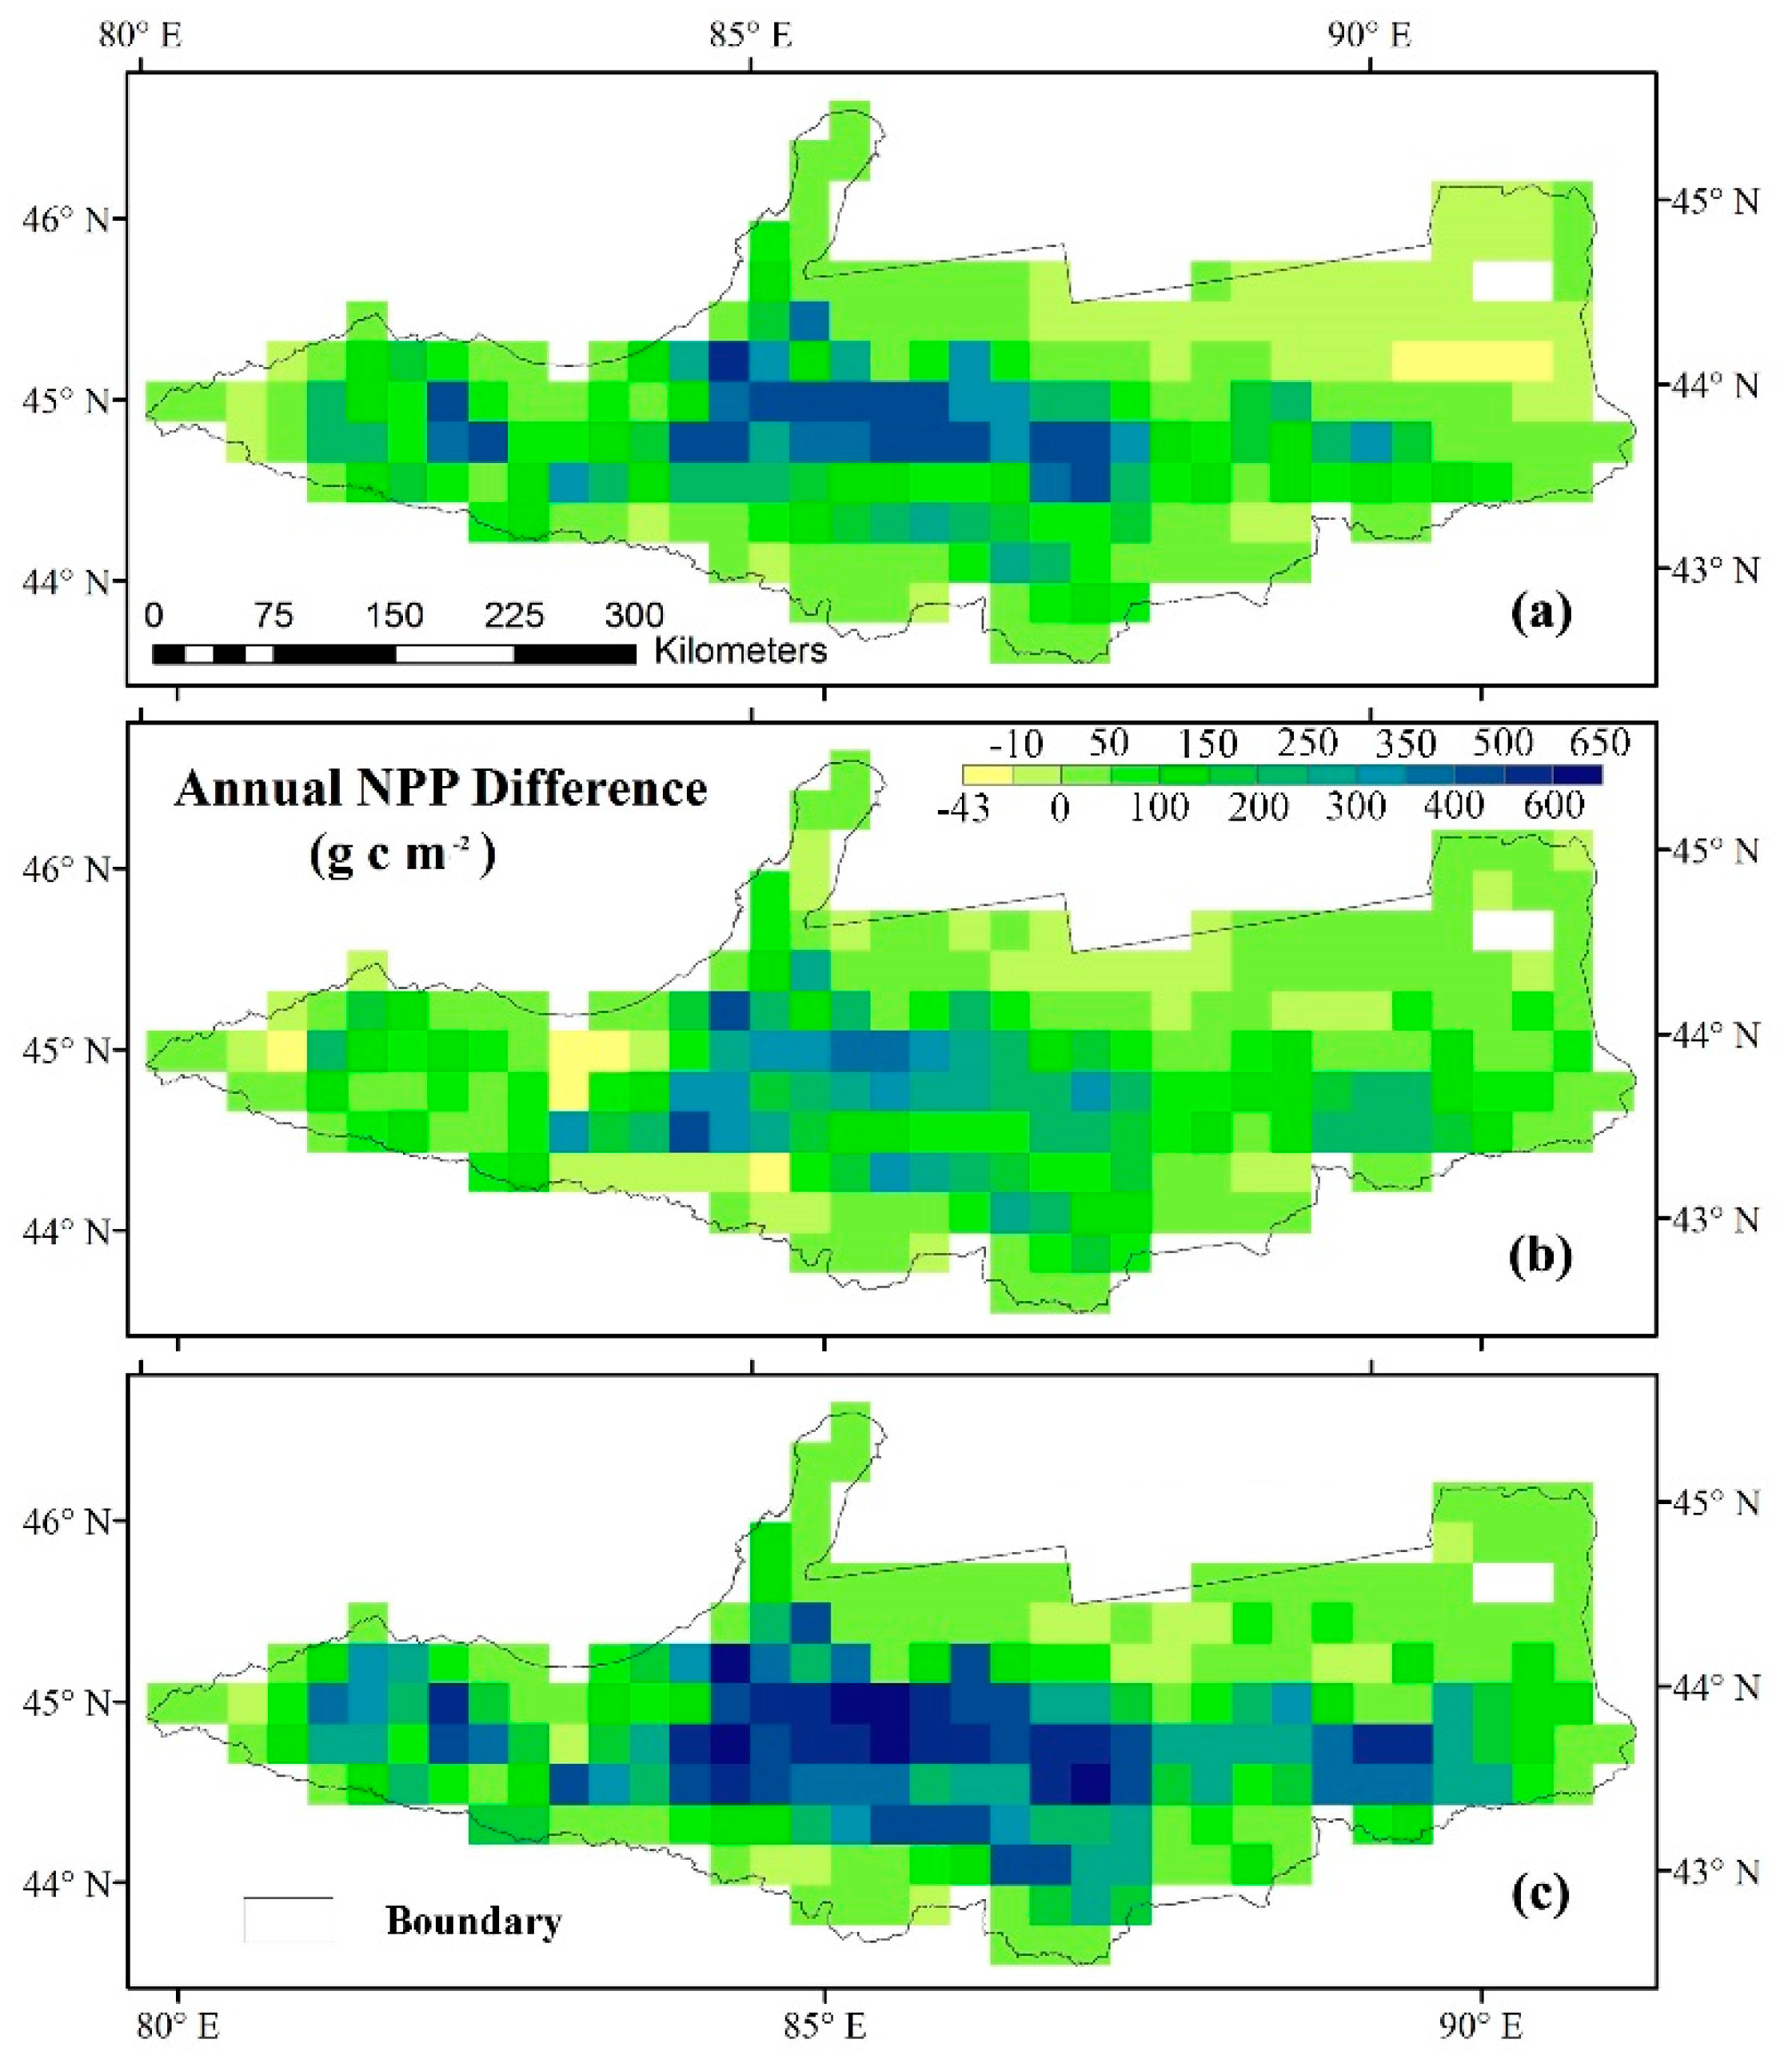
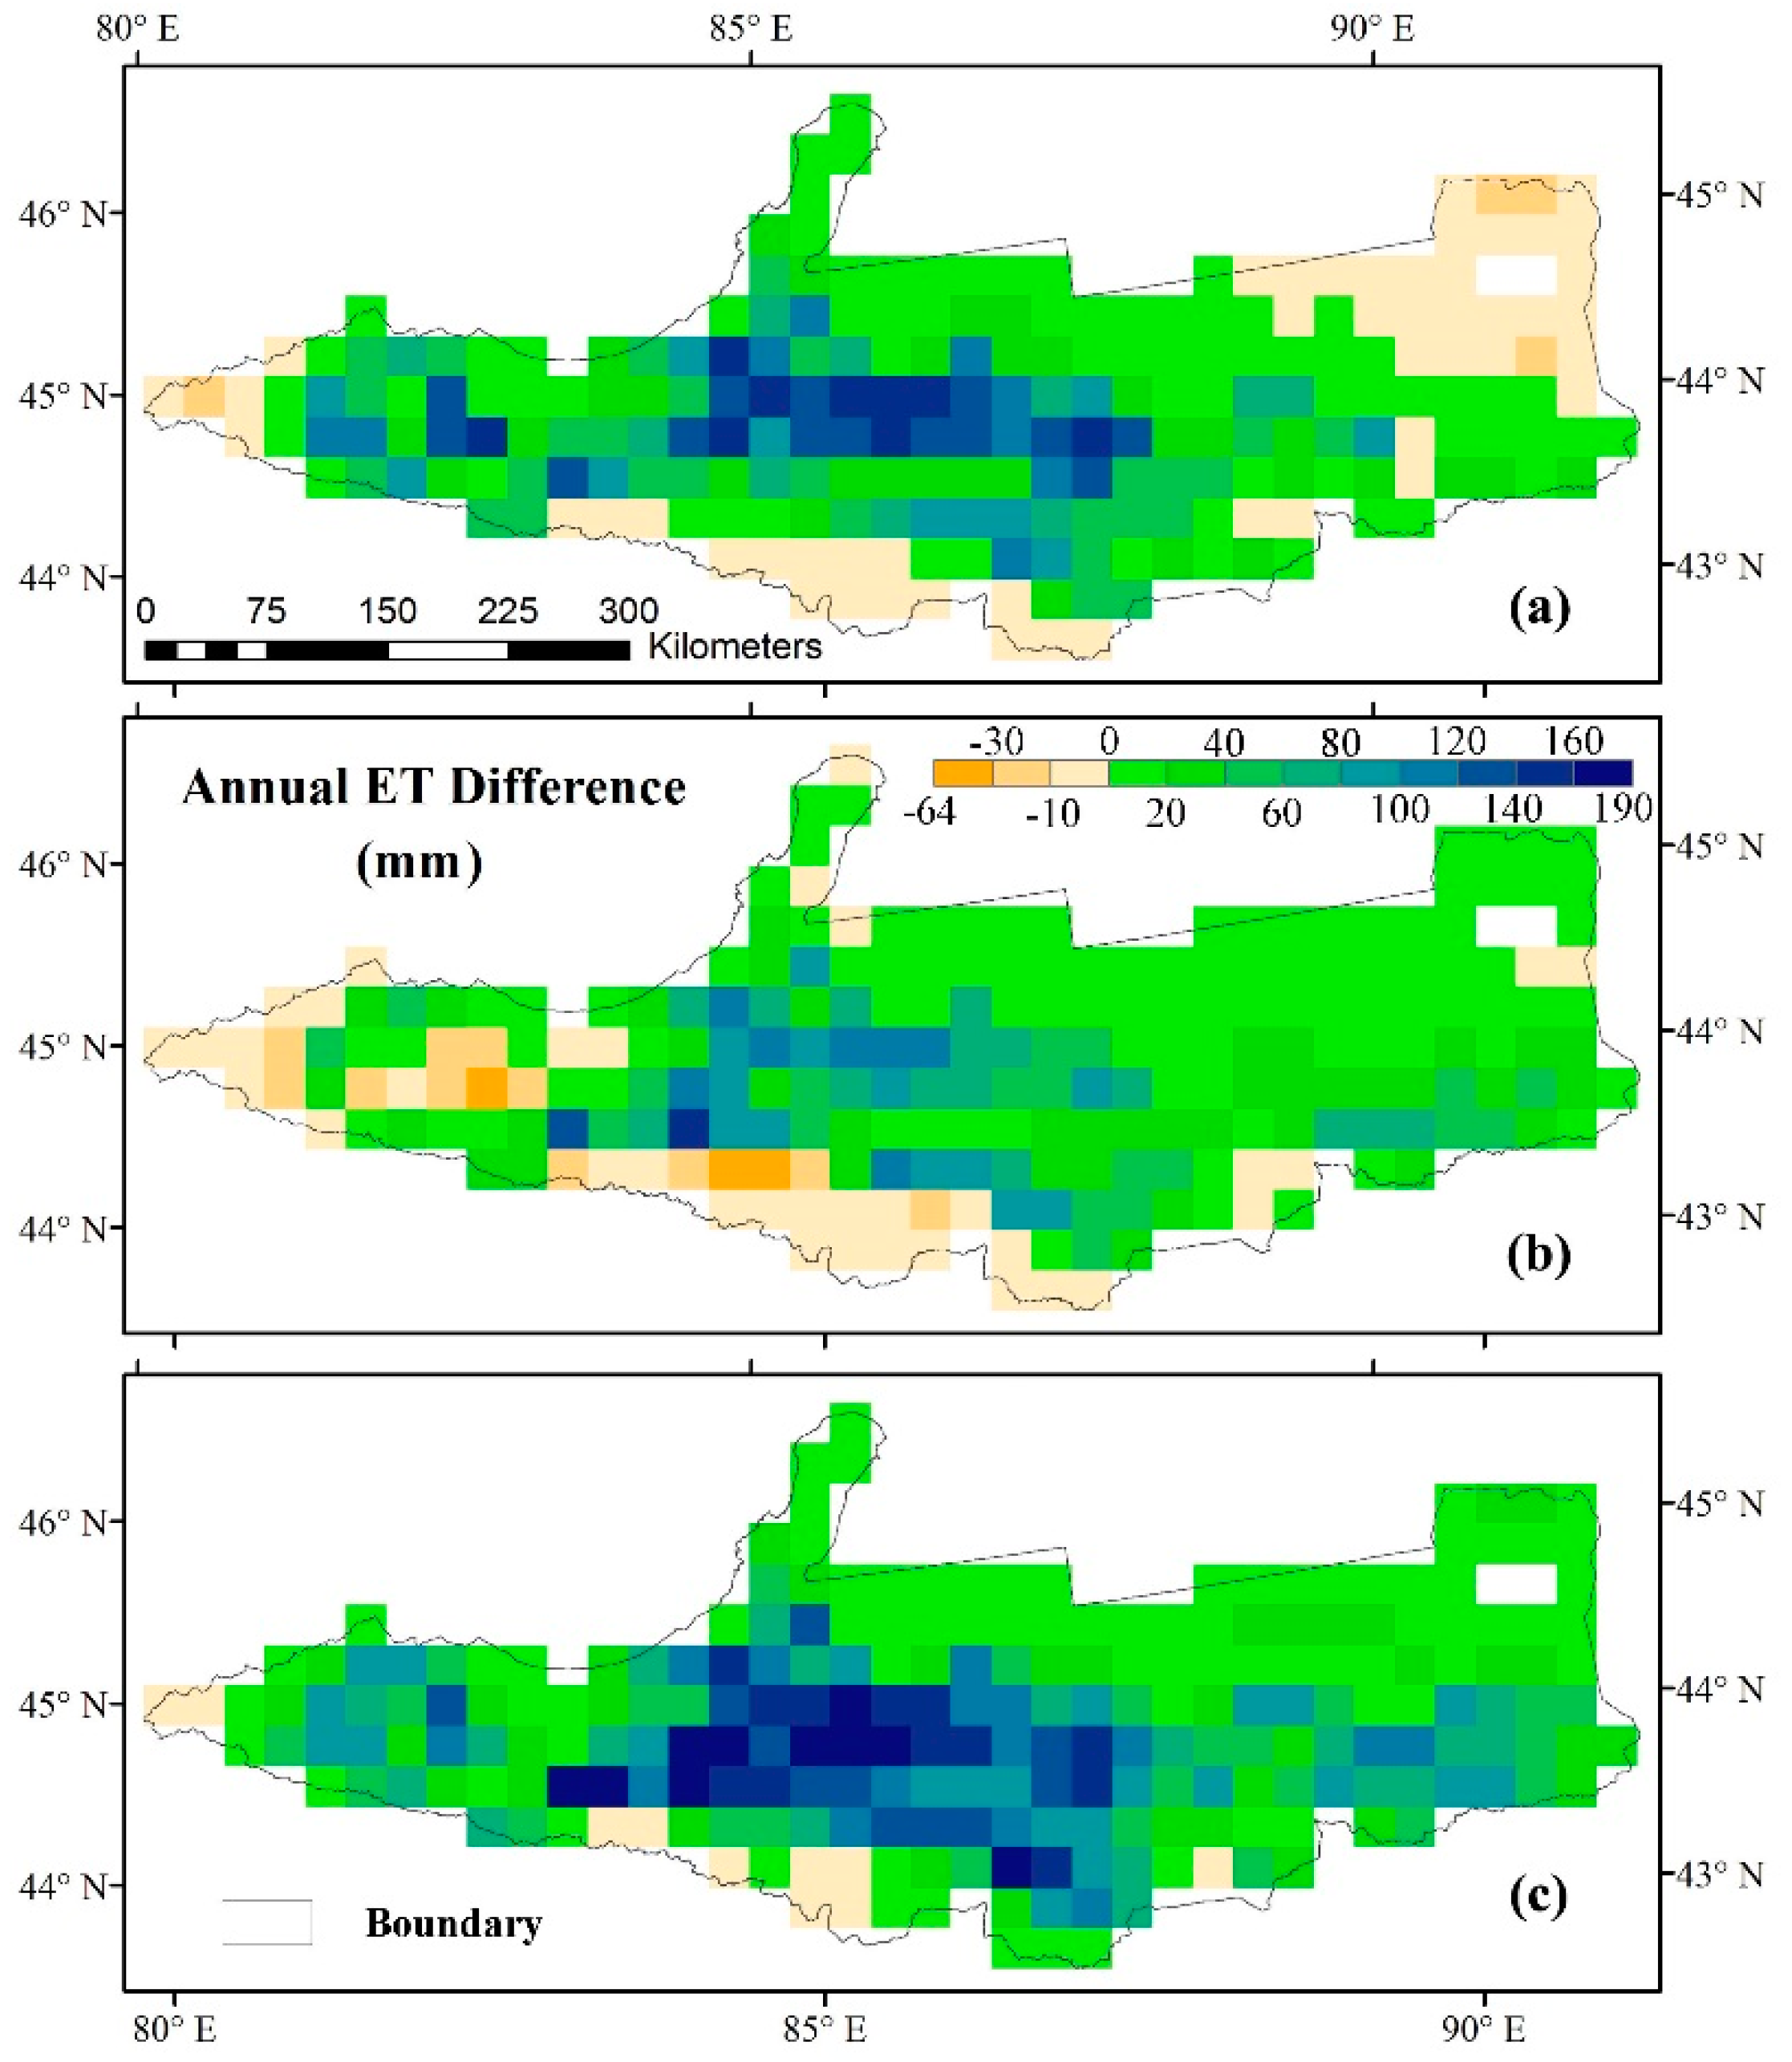
3.2. Temporal and Spatial Patterns of the Regional NPP and ET

Similar to the temporal patterns of the climate change, the regional annual NPP and ET show an increasing trend from 2006 to 2055 under all three RCPs (Figure 5). The mean NPP for Tianshan North Slope during 2006–2055 is 176.4 g C m−2 under RCP2.6, 182.4 g C m−2 under RCP4.5 and 196.9 g C m−2 under RCP8.5. The regional mean NPP of Tianshan North Slope shows an increasing trend with the rate of 1.16, 1.62, and 2.15 g C m−2 year−1 under RCP2.6, RCP4.5, and RCP8.5, respectively (Figure 5a). The regional mean ETs for Tianshan North Slope during 2006–2055 under RCP2.6, RCP4.5, and RCP8.5 are 130.6, 131.7, and 136.3 mm, respectively. The regional mean ET presents an increasing trend with a rate of 0.38 mm year−1 under RCP2.6, 0.43 mm year−1 under RCP4.5, and 0.52 mm year−1 under RCP8.5 (Figure 5b). Moreover, in response to climate change, the NPP and ET dynamics in the first 30 years (2006–2035) are different from those in the next 20 years (2036–2055) (Table 3). The NPP change rates in different periods under the three RCPs share the similar pattern with that of regional precipitation (Table 2 and Table 3). It can be seen in Table 3 that the regional mean NPP of Tianshan North Slope shows a decreasing trend during 2036–2055 under the RCP4.5 scenario. In the first 30 years, the ET increases fastest with 0.87 mm year−1 under RCP4.5 and slowest with 0.77 mm year−1 under RCP8.5, which is different from the change in precipitation during the same period. In the next 20 years (2036–2055), the ET in Tianshan North Slope presents an increasing trend under RCP2.6 and declining trends under RCP4.5 and RCP8.5 (Table 3). The regional ET increasing rate under the RCP8.5 scenario is less steep compared to the other two RCPs during the first 30 years and during the next 20 years, however, the increasing rates of the corresponding NPP under RCP8.5 are the largest, even the ET shows a decreasing trend during the next 20 years under RCP8.5. This may result from the difference of CO2 fertilization effects induced by the CO2 concentration differences under different RCPs. Compared to the first 30 years, as the difference of CO2 concentration increases, this CO2 fertilization effect is much clearer during the next 20 years.
The spatial patterns of the NPP differences between 2006 and 2055 under the three RCPs indicate that the annual NPP shows an increasing trend in most parts of Tianshan North Slope, especially in the central and western area, where the CRP is widely distributed (Figure 1b and Figure 6). In response to the climate change, the annual NPP decreases slightly in the northeastern part of Tianshan North Slope under RCP2.6 (Figure 6a). Compared to RCP2.6 and RCP4.5, the increase of NPP under RCP8.5 is the largest both in intensity and area (Figure 6). Similar to the spatial patterns of the NPP differences, the strong ET increase mainly occurs in the central and western part of the Tianshan North Slope (Figure 7). Under RCP2.6, the ET decreases in the northeastern part and the high mountains of Tianshan North Slope, which could be induced by the decline of precipitation in the northeastern part and the decline of the temperature in the high mountains. Moreover, the decline of ET in the high mountains under RCP4.5 and RCP8.5 shares the same pattern of the decline in temperature (Figure 7b,c). SPT is mainly present in the high mountains, and its growth is limited by temperature. Thus, its growth is surpassed by the decline in temperature, resulting in a decline of the ET, even if the precipitation has a noticeable increase in this region.

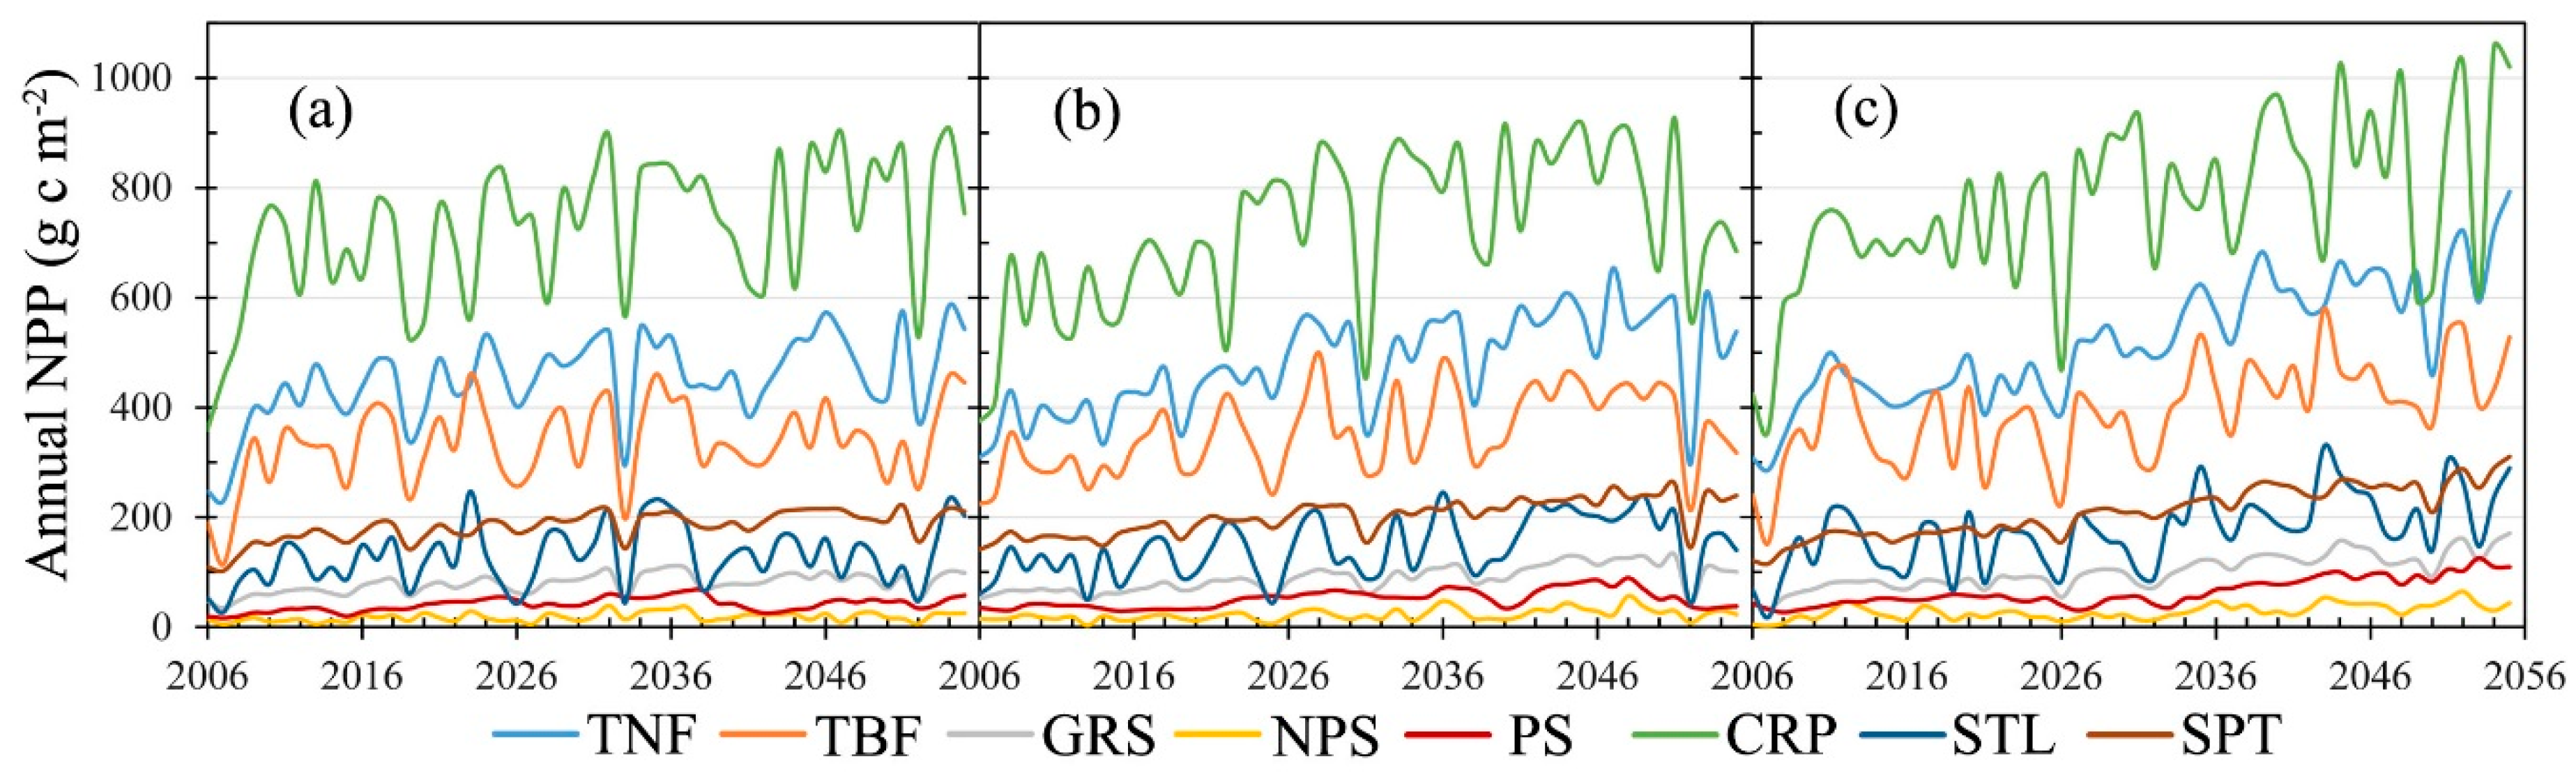
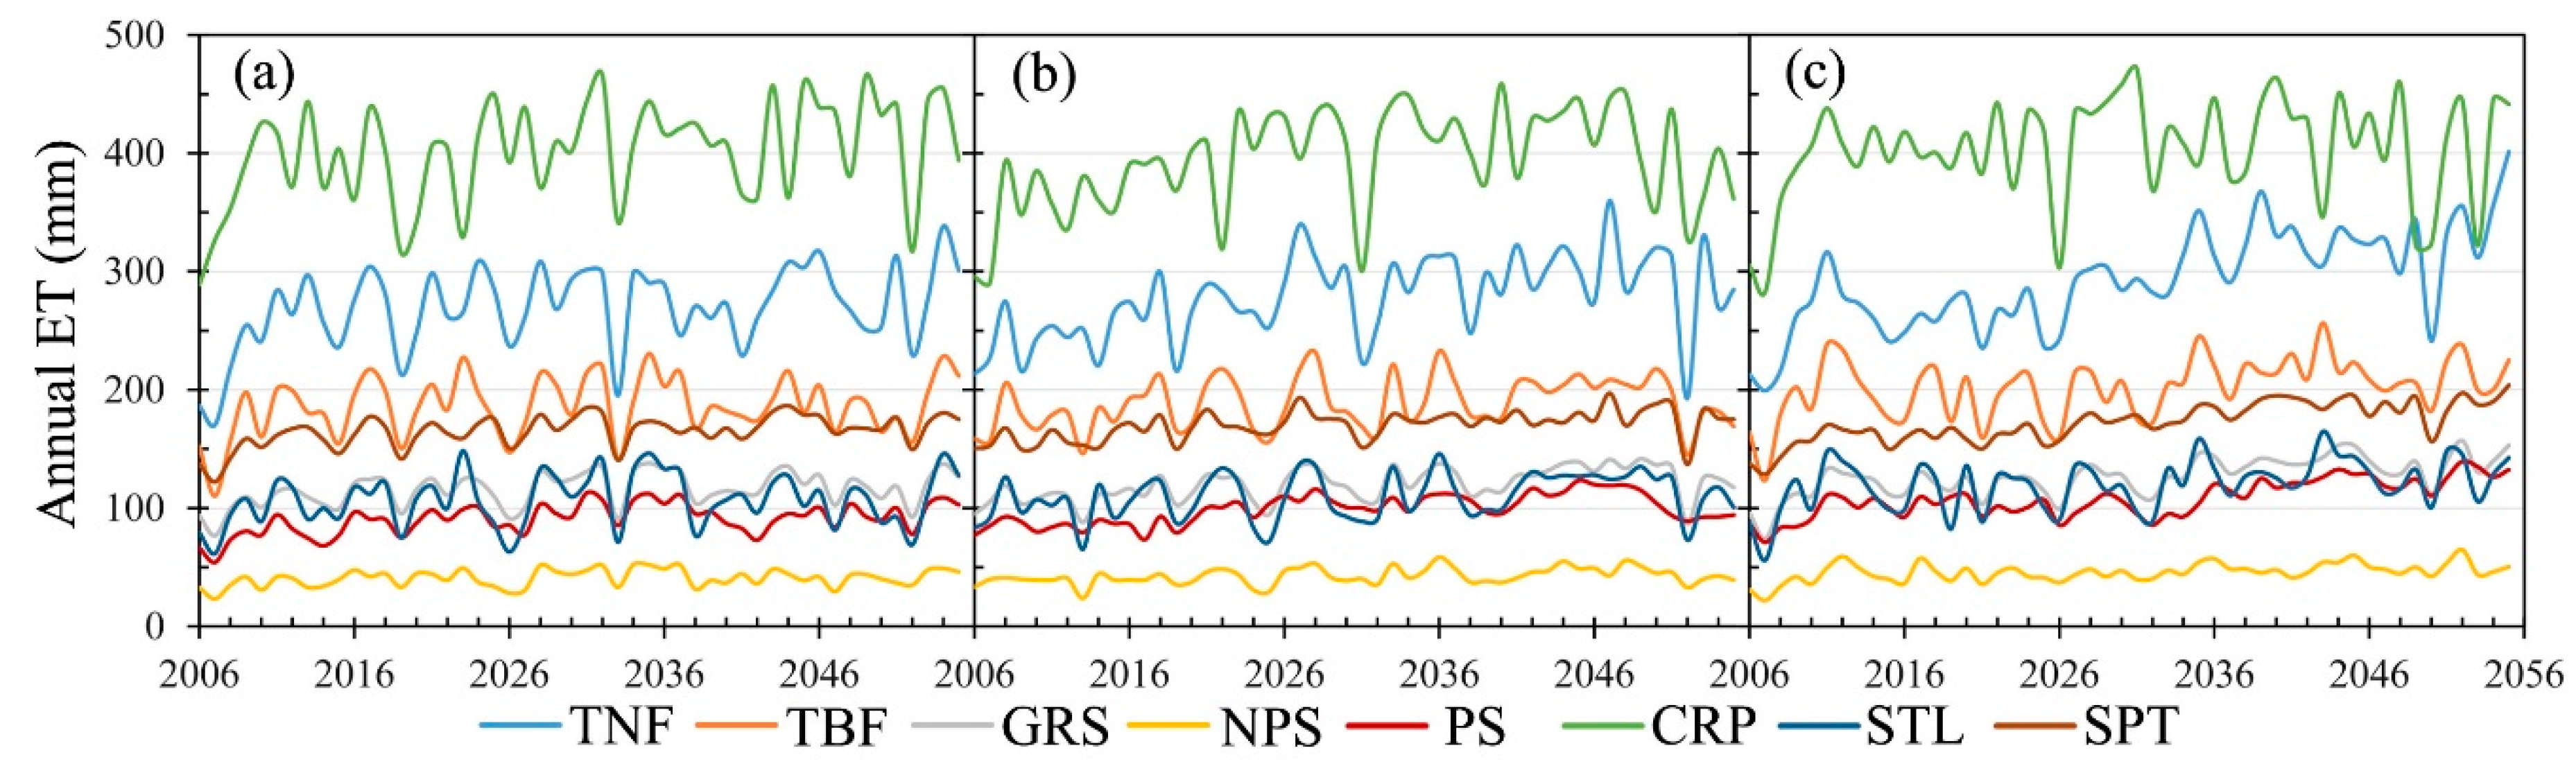
3.3. Temporal Dynamics of NPP and ET for Different Vegetation Types

Generally, the NPP and ET of the vegetation in Tianshan North Slope region show both an increasing trend in response to the changes in climate and CO2 concentration under all three RCP scenarios during 2006–2055 (Figure 8 and Figure 9). In order to compare the sensitivities of different vegetation types to the changes under the three RCPs, we used the normalized rate. By doing so, the linear fitting rate of change is divided by the mean annual value (Table 4).
Figure 8 shows that there is a clear pattern in the NPP of different vegetation types during the study period. Under all three RCPs, the CRP has the highest NPP in Tianshan North Slope while the NPS has the lowest NPP. The NPP of each vegetation type in Tianshan North Slope shows an increasing trend with various rates under each RCP scenario. The changing rate of NPP for each vegetation type increases from RCP2.6 to RCP4.5 to RCP8.5 (Figure 8). Under each RCP, the annual NPPs of NPS, PS, and GRS are more sensitive to the changes in climate and CO2 concentration than the other vegetation types, while those of the TBF and CRP are less sensitive to the changes. The NPP of NPS is the most sensitive to changes in climate and CO2 concentration with an increasing rate of 1.16% and 1.52% under RCP2.6 and RCP4.5 respectively (Table 4). Among the eight vegetation types, the NPP of TBF is the least sensitive to the changes in climate and CO2 concentration with an increasing rate of 0.50% and 0.69% under RCP2.6 and RCP4.5, respectively. Under RCP8.5, the most and the least sensitive vegetation types are PS and CRP with respectively an NPP increasing rate of 2.33% and 0.80%.
For the ET, CRP has the highest annual value and NPS has the lowest value under each RCP scenario (Figure 9). Considering the fact that the CRP and NPS are distributed in the basin with similar climate conditions, therefore, the considerable difference in ET between CRP and NPS is induced by the irrigation for CRP. Similar to the dynamics of NPP, the ET of each vegetation type presents an increasing trend under all RCP scenarios (Figure 9). Different from the NPP dynamic, the ET of PS is most sensitive to the changes in climate and CO2 concentration. Among the eight vegetation types, the ET of TBF is least sensitive to those changes under RCP2.6 and RCP4.5 with a rate of 0.22% and 0.21%, respectively. Under RCP8.5, the ET of CRP is much less sensitive to the changes with a rate of 0.16%. Moreover, the ET increase rates of TBF, CRP, and SPT do not increase from the RCP2.6 to RCP4.5 to RCP8.5. The maximum increase rates of ET for TBF, CRP and SPT occur under RCP8.5, RCP4.5, and RCP8.5, respectively. Thus, the responses of ET for different vegetation types are more complex than those of NPP (Table 4).
Similar to the temporal pattern of climate change, the vegetation types respond differently to the changes of climate and CO2 concentration in different periods (Table 4). Here, we mainly analyzed the trends of NPP and ET for each vegetation type under different RCP scenarios. During the first 30 years, as the increase of the precipitation and temperature, the NPP and ET of each vegetation type show an increasing trend under each RCP scenario. However, in the next 20 years, the vegetation responds differently under different RCP scenarios. For NPP, the GRS, NPS, and PS show a declining trend under RCP2.6. Only GRS and SPT show an increasing trend under RCP4.5 while all vegetation types present an increasing trend under RCP8.5. For ET, the GRS and STL show a declining trend under RCP2.6, and the TBF and CRP present a declining trend under RCP4.5. All vegetation types present a declining trend under RCP4.5.

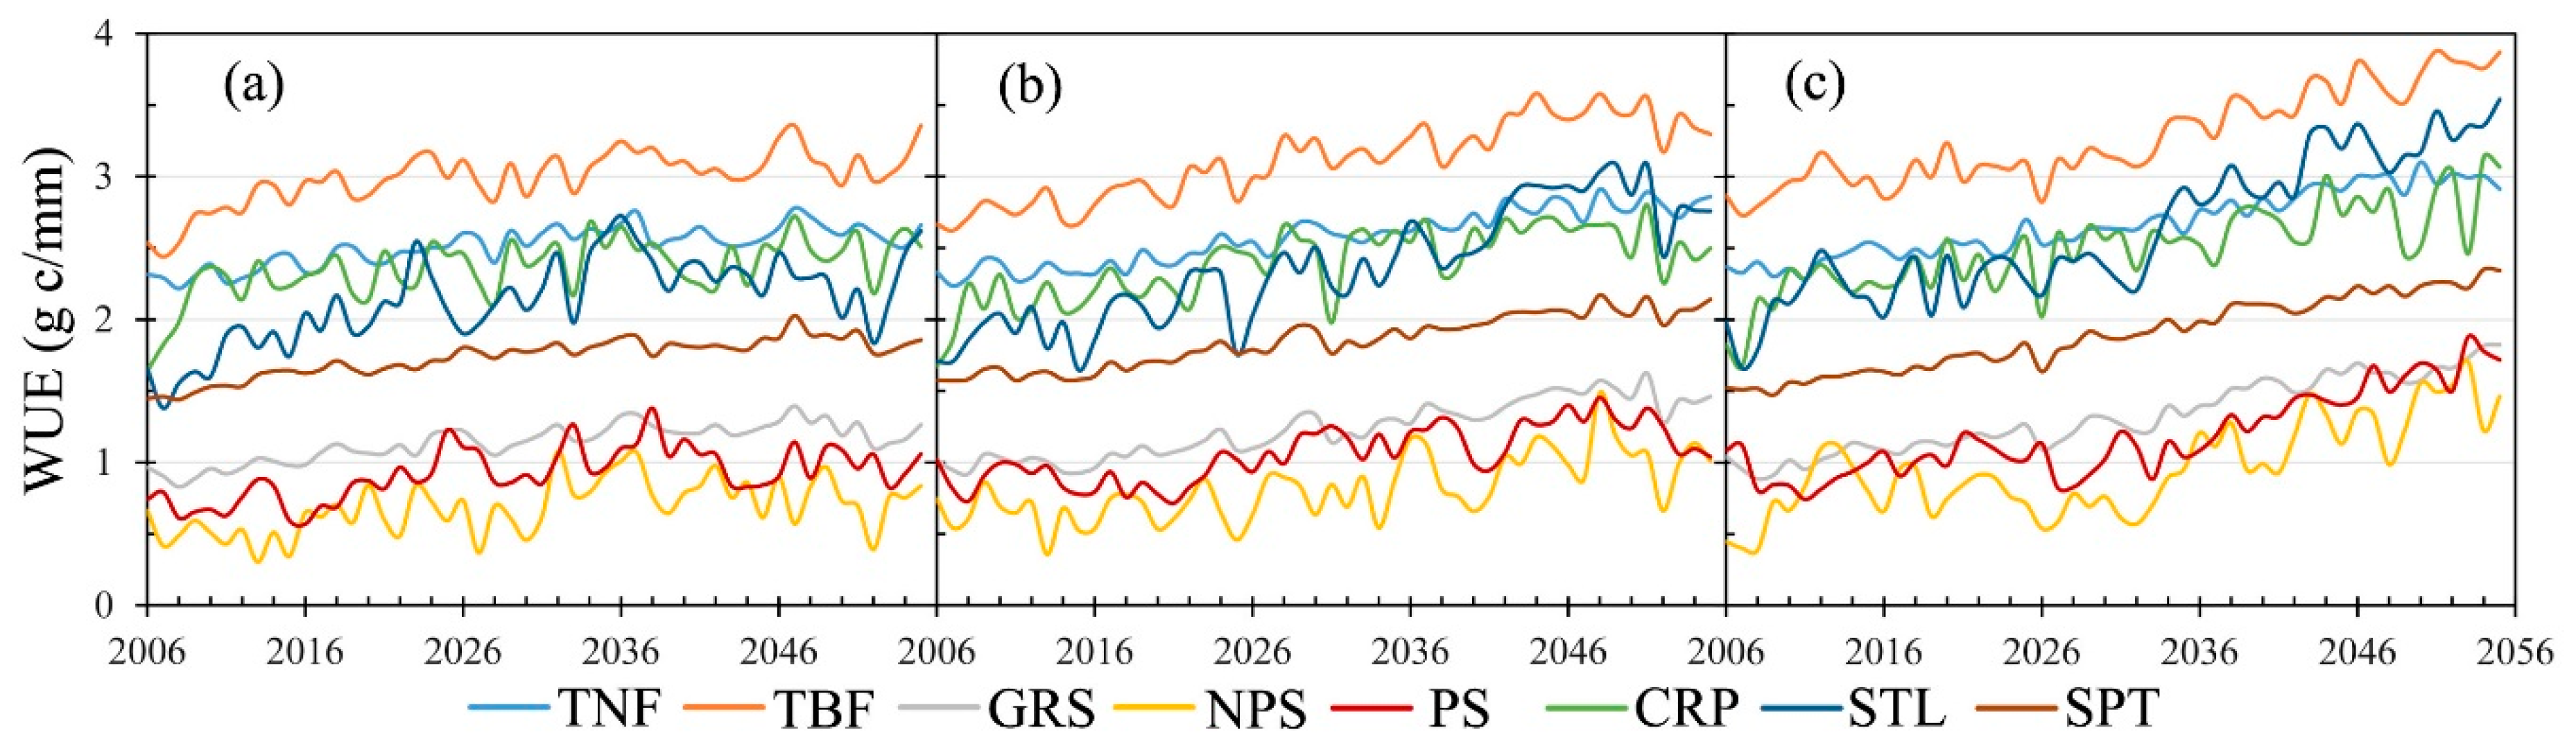
3.4. Temporal Dynamics of the Water Use Efficiency

The dynamics of NPP and ET indicate that the vegetation in Tianshan North Slope region is sensitive to the changes in climate and CO2 concentration and responds differently under different RCP scenarios. To better understand the responses of the vegetation under different RCP scenarios, we further analyze the WUE that is defined as a ratio of photosynthetic carbon taken up to water consumed [47].
The result shows that, similar to the climate change, the WUE presents an increase trend under each RCP scenario (Figure 10). For the same vegetation type, the mean WUE increases from RCP2.6 to RCP4.5 to RCP8.5. Generally, the WUE would increase when the ambient condition turns to severe conditions [25,56]. Our analysis shows that the precipitation will increase in Tianshan North Slope, which will be of benefit to the arid ecosystems and result in the decline of WUE. Contrary, the CO2 fertilization effect will enhance the photosynthesis and increase the WUE by increasing the GPP [14,17]. Hence, the increase of the WUE could be induced by the CO2 fertilization effect or the combination effect of climate change and CO2 fertilization.

4. Discussion

4.1. Comparison with Historical Climate Change Effects

Our study results show that Tianshan North Slope will become wet and warm in the future, and the ecosystem will benefit from this change under each RCP scenario with increasing NPP during 2006–2055. The NPP increasing rate during 2006–2055 is 1.16, 1.62, and 2.15 g C m−2 year−1 under RCP2.6, RCP4.5, and RCP8.5, respectively. Different from the climate change under the RCP scenarios, Central Asia (including our study area) has experienced a “warm–dry” climate with a CO2 concentration increase of 18% from 1980 to 2014 [17]. In response to these changes, Central Asia presented as a carbon source with a declining rate of 0.82 g C m−2 year−1. However, they [17] also found that the NPP in Tianshan North Slope showed an increasing trend due to the increase of the annual precipitation. Fang et al. [37] found that the regional NPP in Xinjiang province presented an increasing trend from 2008 to 2011, and decreasing trend during 2005–2006 and 2013–2014 by using three reanalysis data sets. Taking climate change, CO2 fertilization effect, and grazing into consideration, Han et al. [12] found that the four vegetation types in Central Asia presented similar responses to the climate changes from 1979 to 2011, during which the NPP for GRS, forest, shrub land, and CRP decreased with a rate of 0.58 g C m−2 year−1, 1.58 g C m−2 year−1, 0.51 g C m−2 year−1, and 1.10 g C m−2 year−1, respectively.
For the ET, our results show that the regional mean ET presents an increasing trend with a rate of 0.38 mm year−1 under RCP2.6, 0.43 mm year−1 under RCP4.5, and 0.52 mm year−1 under RCP8.5. By using an ecosystem model, Han et al. [25] explored the dynamics of ET for different GRS types, and found that the Central Asia region experienced significant declines of 1.47–2.72 mm per decade from 1979 to 2011. Based on remotely sensed data, Zou et al. [57] found that the ET of arid Central Asia presented a decline trend by 0.44 mm year−1 from 2000 to 2014. During the same study period, Cui et al. [58] found that the GLEAM ET data set showed that the ET for Tianshan North Slope presented a decreased trend, while the MODIS ET product showed an opposite trend.
The WUE is influenced by climate factors, GPP, CO2 concentration, and growing season length. The dominant factor for WUE varies in different ecosystems [31,59]. For example, temperature plays an important role in the WUE dynamic of shrub ecosystems, while the precipitation is more important for grassland and forest ecosystems [32,60]. Under the warm and wet trend and increasing CO2, each vegetation type presents an increasing trend from 2006 to 2055 under all RCP scenarios. For the desert vegetation (NPS, GRS, and PS), the increasing WUE may be induced by the enhanced precipitation [61]. While, for the TNF, the increasing WUE could be enhanced by the increasing temperature. For the others, such as CRP, may benefit from all the changes in climate and CO2 concentration [29].
Previous studies and this study have proved that the arid ecosystem is very sensitive to the changes of climate and CO2 concentration, as well as to human activities, although there are lots of uncertainties caused by the forcing data sets and methods. The ecosystems in the arid area are fragile and the development of the economy is limited by the water resource. So, exploring the possible responses of the arid ecosystems to the changes in climate and CO2 in the near future is very necessary for realizing the primary goal of the Sustainable Development Goals (SDGs). The climate action is one of the most important goals in SDGs, and it asks people to take urgent actions to deal with climate change and the effects of climate change. Therefore, our study provides some useful information for people to take different actions for different ecosystems to keep the sustainability of the arid ecosystem.

4.2. Uncertainties and Future Works

The input climate data for AEM are of critical importance for the simulation results. Fang et al. [37] found that the NPP of the ecosystem in Xinjiang had different spatial and temporal patterns under three reanalysis data sets. Under the same RCP scenario, different global circulation models perform differently. To minimize these uncertainties, more GCM results with better performance in the study area are needed to force the regional climate model or outcomes of different regional climate models could be used. However, we only used one data set to force the AEM under each RCP scenario. In addition to the changes in climate and CO2 concentration, the human activities, such as grazing and farmland management activities, have an important impact on the arid ecosystem [5,11,12,18,25,62]. However, these human activities are not considered in this study.
However, we take several measures to reduce uncertainties. First of all, our team improved the structure of the AEM model, such as the vertical root distribution and water movement from groundwater to the canopy. This was necessary to allow the AEM to better reproduce the biogeochemical and biophysical processes of the arid ecosystem than other ecosystem models [3,14,17,35]. Then, the parameterization of the AEM has been improved and the corresponding simulation results have been well validated in the arid areas of central Asia and China, which will enhance the robustness of AEM and reduce the uncertainties of the simulations [2,4,14,17,18]. Moreover, the high resolution climate forcing data were produced by dynamic downscaling, which could reduce some uncertainties from the original outputs of GCM [52].
Moreover, the Tianshan North Slope is the core area for the Belt and Road Initiative, and is expected to experience significant urbanization and oasisization. So, in the future, we should run the model by more climate forcing data sets from different GCMs or regional climate models, and take the human activities into consideration to quantify the effects of climate change, CO2 fertilization, and human activities.

5. Conclusions

In this study, we explored the NPP and ET dynamics of the arid ecosystem in Tianshan North Slope under RCP2.6, RCP4.5, and RCP8.5 by using AEM. The climate in Tianshan North Slope will experience a wetter and warming trend from 2006 to 2055 under each RCP scenario. In response to the changes in climate and CO2 concentration, the regional mean annual NPP increases by a rate of 1.16, 1.62, and 2.15 g C m−2 year−1 under RCP2.6, RCP4.5, and RCP8.5, respectively. Similar to the regional mean annual NPP, the regional annual ET presents an increasing trend with the rate of 0.38 mm year−1 under RCP2.6, 0.43 mm year−1 under RCP4.5, and 0.52 mm year−1 under RCP8.5. Hence, for the entire region, the Tianshan North Slope will benefit from the changes during 2006–2055.
The spatial pattern of the climate change indicates that the temperature in the basin increases while it decreases in the mountains from 2006 to 2055, although the decreased area in the mountains region decreases from RCP2.6 to RCP8.5. The annual precipitation in the northeastern part of the study area presents a declining trend under RCP2.6 and RCP4.5, and the precipitation in the mountains increases much more than in the other regions. However, the spatial patterns of regional annual NPP difference under different RCP scenarios show that the increase of NPP mainly occurs in the central and western part where the CRP is abundant. The decline in regional annual NPP mainly occurs in the northeastern part under RCP2.6. The spatial patterns of regional ET difference indicate that the increase of ET mainly occurs in the central and western part, which is similar to those of the NPP difference. However, the ET decreases in the high mountains, which is mainly caused by the decline in temperature. The decline of ET in the northeast part is mainly induced by the decline in precipitation under the RCP2.6 scenario.
There is temporal heterogeneity in the climate patterns, in which the climate changes more rapidly in the first 30 years (2006–2035) than in the next 20 years (2036–2055) under each RCP scenario. Except the declining trend of precipitation in the next 20 years under RCP4.5, the increasing trends are found for precipitation and temperature in each study period under all three RCP scenarios. In response to the heterogeneity of the climate change, the increase rates of NPP and ET in the first 30 years are higher than those in the next 20 years under each RCP scenario. Moreover, the ET decreases in the next 20 year under RCP4.5 and RCP8.5, and the NPP decreases by a rate of 0.75 g C m−2 year−1 in the next 20 years under RCP4.5.
The sensitivity of different vegetation types is well analyzed in this study. We find that different vegetation types respond differently to the changes in climate and CO2 concentration under different RCP scenarios. All vegetation types in Tianshan North Slope experience increased NPP and ET with various rates under each RCP scenario. Under each RCP, the NPS, PS, and GRS are more sensitive to the changes in climate and CO2 concentration compared to the other vegetation types, while those of the TBF and CRP are less sensitive to the changes. The sensitivity of the different vegetation types varies during different study periods and under different RCP scenarios. However, the WUE of each vegetation type shows an increasing trend under all RCP scenarios. For each vegetation type, the increasing rate of WUE increases from RCP2.6 to RCP8.5, resulting from the warm and wet climate change and increasing CO2 concentration.

Author Contributions

Conceptualization, C.L., G.L. and P.C.; methodology, C.Z. and P.C.; software, C.Z.; validation, C.Z., C.L. and G.L.; formal analysis, P.C.; investigation, P.C.; resources, S.C., L.D.C., R.D.T., S.T. and P.C.; data curation, S.C., L.D.C., R.D.T., S.T. and P.C.; writing—original draft preparation, P.C.; writing—review and editing, P.C., C.L., S.T. and F.U.O.; visualization, P.C.; supervision, G.L., P.T. and P.D.M.; project administration, G.L.; funding acquisition, G.L. All authors have read and agreed to the published version of the manuscript.

Funding

This research was funded by the National Natural Science Foundation of China, grant number 41671108. Friday U. Ochege is supported by the Chinese Academy of Sciences–The World Academy of Sciences (CAS-TWAS) President’s Fellowship Program (2017A8010210001).

Acknowledgments

The computational resources and services for the ALARO-0 regional climate simulations were provided by the VSC (Flemish Supercomputer Center), funded by the Research Foundation-Flanders (FWO) and the Flemish Government Department EWI. The climate data of the regional climate model ALARO-0 over the Central Asia CORDEX domain were produced by the Royal Meteorological Institute of Belgium and Ghent University in the context of the AFTER project, which is granted by the ERA.Net RUS Plus Initiative, ID 166.

Conflicts of Interest

The authors declare no conflict of interest.

References

  1. Safriel, U.; Adeel, Z. Ecosystems and human well-being: current state and trends, chapter 22: dryland systems. In Ecosystems and Human Well-Being: Current State and Trends: Findings of the Condition and Trends Working Group; Island Press: Washington, DC, USA, 2005; pp. 625–662. [Google Scholar]
  2. Li, C.; Zhang, C.; Luo, G.; Chen, X. Modeling the carbon dynamics of the dryland ecosystems in Xinjiang, China from 1981 to 2007—The spatiotemporal patterns and climate controls. Ecol. Model. 2013, 267, 148–157. [Google Scholar] [CrossRef]
  3. Li, C.; Zhang, C.; Luo, G.; Chen, X.; Maisupova, B.; Abdullo A, M.; Han, Q.; Bekmamat M, D. Carbon stock and its responses to climate change in Central Asia. Glob. Chang. Biol. 2015, 21, 1951–1967. [Google Scholar] [CrossRef] [PubMed]
  4. Li, C.; Han, Q.; Luo, G.; Zhao, C.; Li, S.; Wang, Y.; Yu, D. Effects of Cropland Conversion and Climate Change on Agrosystem Carbon Balance of China’s Dryland: A Typical Watershed Study. Sustainability 2018, 10, 4508. [Google Scholar] [CrossRef] [Green Version]
  5. Han, Q.; Luo, G.; Li, C.; Shakir, A.; Wu, M.; Saidov, A. Simulated grazing effects on carbon emission in Central Asia. Agric. For. Meteorol. 2016, 216, 203–214. [Google Scholar] [CrossRef]
  6. Huang, L.; He, B.; Chen, A.; Wang, H.; Liu, J.; Lű, A.; Chen, Z. Drought dominates the interannual variability in global terrestrial net primary production by controlling semi-arid ecosystems. Sci. Rep. 2016, 6, 24639. [Google Scholar] [CrossRef] [Green Version]
  7. Hu, Z.; Zhang, C.; Hu, Q.; Tian, H. Temperature changes in Central Asia from 1979 to 2011 based on multiple datasets. J. Clim. 2014, 27, 1143–1167. [Google Scholar] [CrossRef]
  8. IPCC. Summary for Policymakers of the Synthesis Report of the IPCC Fourth Assessment Report; Cambridge University Press: Cambridge, UK, 2007. [Google Scholar]
  9. Li, Q.; Chen, Y.; Shen, Y.; Li, X.; Xu, J. Spatial and temporal trends of climate change in Xinjiang, China. J. Geogr. Sci. 2011, 21, 1007. [Google Scholar] [CrossRef]
  10. Hu, Z.; Zhou, Q.; Chen, X.; Qian, C.; Wang, S.; Li, J. Variations and changes of annual precipitation in Central Asia over the last century. Int. J. Climatol. 2017, 37, 157–170. [Google Scholar] [CrossRef]
  11. Han, Q.; Luo, G.; Li, C.; Xu, W. Modeling the grazing effect on dry grassland carbon cycling with Biome-BGC model. Ecol. Complex. 2014, 17, 149–157. [Google Scholar] [CrossRef]
  12. Han, Q.; Luo, G.; Li, C.; Li, S. Response of Carbon Dynamics to Climate Change Varied among Different Vegetation Types in Central Asia. Sustainability 2018, 10, 3288. [Google Scholar] [CrossRef] [Green Version]
  13. Ahlström, A.; Raupach, M.R.; Schurgers, G.; Smith, B.; Arneth, A.; Jung, M.; Reichstein, M.; Canadell, J.G.; Friedlingstein, P.; Jain, A.K. The dominant role of semi-arid ecosystems in the trend and variability of the land CO2 sink. Science 2015, 348, 895–899. [Google Scholar] [CrossRef] [PubMed] [Green Version]
  14. Fang, X.; Zhang, C.; Wang, Q.; Chen, X.; Ding, J.; Karamage, F. Isolating and quantifying the effects of climate and CO2 changes (1980–2014) on the net primary productivity in arid and semiarid China. Forests 2017, 8, 60. [Google Scholar] [CrossRef] [Green Version]
  15. Earth’s CO2 Home Page. Available online: https://www.co2.earth/ (accessed on 1 December 2019).
  16. Mikkelsen, T.N.; Beier, C.; Jonasson, S.; Holmstrup, M.; Schmidt, I.K.; Ambus, P.; Pilegaard, K.; Michelsen, A.; Albert, K.; Andresen, L.C. Experimental design of multifactor climate change experiments with elevated CO2, warming and drought: the CLIMAITE project. Funct. Ecol. 2008, 22, 185–195. [Google Scholar] [CrossRef]
  17. Zhang, C.; Ren, W. Complex climatic and CO2 controls on net primary productivity of temperate dryland ecosystems over central Asia during 1980–2014. J. Geophys. Res.-Biogeosci. 2017, 122, 2356–2374. [Google Scholar] [CrossRef]
  18. Zhu, S.; Li, C.; Shao, H.; Ju, W.; Lv, N. The response of carbon stocks of drylands in Central Asia to changes of CO2 and climate during past 35 years. Sci. Total Environ. 2019, 687, 330–340. [Google Scholar] [CrossRef]
  19. Fang, J.; Piao, S.; Tang, Z.; Peng, C.; Ji, W. Interannual variability in net primary production and precipitation. Science 2001, 293, 1723. [Google Scholar] [CrossRef] [Green Version]
  20. Mohamed, M.; Babiker, I.S.; Chen, Z.; Ikeda, K.; Ohta, K.; Kato, K. The role of climate variability in the inter-annual variation of terrestrial net primary production (NPP). Sci. Total Environ. 2004, 332, 123–137. [Google Scholar] [CrossRef]
  21. Zhao, M.; Running, S.W. Drought-induced reduction in global terrestrial net primary production from 2000 through 2009. Science 2010, 329, 940–943. [Google Scholar] [CrossRef] [Green Version]
  22. Zhang, Y.; Peña-Arancibia, J.L.; McVicar, T.R.; Chiew, F.H.; Vaze, J.; Liu, C.; Lu, X.; Zheng, H.; Wang, Y.; Liu, Y.Y. Multi-decadal trends in global terrestrial evapotranspiration and its components. Sci. Rep. 2016, 6, 19124. [Google Scholar] [CrossRef] [Green Version]
  23. Wei, Z.; Yoshimura, K.; Wang, L.; Miralles, D.G.; Jasechko, S.; Lee, X. Revisiting the contribution of transpiration to global terrestrial evapotranspiration. Geophys. Res. Lett. 2017, 44, 2792–2801. [Google Scholar] [CrossRef] [Green Version]
  24. Fisher, J.B.; Melton, F.; Middleton, E.; Hain, C.; Anderson, M.; Allen, R.; McCabe, M.F.; Hook, S.; Baldocchi, D.; Townsend, P.A. The future of evapotranspiration: Global requirements for ecosystem functioning, carbon and climate feedbacks, agricultural management, and water resources. Water Resour. Res. 2017, 53, 2618–2626. [Google Scholar] [CrossRef]
  25. Han, Q.; Li, C.; Zhao, C.; Zhang, Y.; Li, S. Grazing decreased water use efficiency in Central Asia from 1979 to 2011. Ecol. Model. 2018, 388, 72–79. [Google Scholar] [CrossRef]
  26. Beadle, C.; Neilson, R.; Talbot, H.; Jarvis, P. Stomatal conductance and photosynthesis in a mature Scots pine forest. I. Diurnal, seasonal and spatial variation in shoots. J. Appl. Ecol. 1985, 22, 557–571. [Google Scholar] [CrossRef]
  27. Gadi, V.K.; Bordoloi, S.; Garg, A.; Sahoo, L.; Berretta, C.; Sekharan, S. Effect of shoot parameters on cracking in vegetated soil. Environ. Geotech. 2017, 5, 123–130. [Google Scholar] [CrossRef] [Green Version]
  28. Gadi, V.K.; Hussain, R.; Bordoloi, S.; Hossain, S.; Singh, S.R.; Garg, A.; Sekharan, S.; Karangat, R.; Lingaraj, S. Relating stomatal conductance and surface area with evapotranspiration induced suction in a heterogeneous grass cover. J. Hydrol. 2019, 568, 867–876. [Google Scholar] [CrossRef]
  29. Huang, M.; Piao, S.; Zeng, Z.; Peng, S.; Ciais, P.; Cheng, L.; Mao, J.; Poulter, B.; Shi, X.; Yao, Y. Seasonal responses of terrestrial ecosystem water-use efficiency to climate change. Glob. Chang. Biol. 2016, 22, 2165–2177. [Google Scholar] [CrossRef]
  30. Van Der Sleen, P.; Groenendijk, P.; Vlam, M.; Anten, N.P.; Boom, A.; Bongers, F.; Pons, T.L.; Terburg, G.; Zuidema, P.A. No growth stimulation of tropical trees by 150 years of CO2 fertilization but water-use efficiency increased. Nat. Geosci. 2015, 8, 24. [Google Scholar] [CrossRef]
  31. Xiao, J.; Sun, G.; Chen, J.; Chen, H.; Chen, S.; Dong, G.; Gao, S.; Guo, H.; Guo, J.; Han, S. Carbon fluxes, evapotranspiration, and water use efficiency of terrestrial ecosystems in China. Agric. Meteorol. 2013, 182, 76–90. [Google Scholar] [CrossRef]
  32. Zhang, T.; Peng, J.; Liang, W.; Yang, Y.; Liu, Y. Spatial–temporal patterns of water use efficiency and climate controls in China’s Loess Plateau during 2000–2010. Sci. Total Environ. 2016, 565, 105–122. [Google Scholar] [CrossRef]
  33. Ren, W.; Tian, H.; Tao, B.; Huang, Y.; Pan, S. C hina’s crop productivity and soil carbon storage as influenced by multifactor global change. Glob. Chang. Biol. 2012, 18, 2945–2957. [Google Scholar] [CrossRef] [PubMed]
  34. Sitch, S.; Friedlingstein, P.; Gruber, N.; Jones, S.D.; Murray-Tortarolo, G.; Ahlström, A.; Doney, S.C.; Graven, H.; Heinze, C.; Huntingford, C. Recent trends and drivers of regional sources and sinks of carbon dioxide. Biogeosciences 2015, 12, 653–679. [Google Scholar] [CrossRef] [Green Version]
  35. Zhang, C.; Li, C.; Luo, G.; Chen, X. Modeling plant structure and its impacts on carbon and water cycles of the Central Asian arid ecosystem in the context of climate change. Ecol. Model. 2013, 267, 158–179. [Google Scholar] [CrossRef]
  36. Fang, X.; Chen, Z.; Guo, X.; Zhu, S.; Liu, T.; Li, C.; He, B. Impacts and uncertainties of climate/CO2 change on net primary productivity in Xinjiang, China (2000–2014): A modelling approach. Ecol. Model. 2019, 408, 108742. [Google Scholar] [CrossRef]
  37. Fang, X.; Guo, X.; Zhang, C.; Shao, H.; Zhu, S.; Li, Z.; Feng, X.; He, B. Contributions of climate change to the terrestrial carbon stock of the arid region of China: A multi-dataset analysis. Sci. Total Environ. 2019, 668, 631–644. [Google Scholar] [CrossRef] [PubMed]
  38. Luo, M.; Liu, T.; Frankl, A.; Duan, Y.; Meng, F.; Bao, A.; Kurban, A.; De Maeyer, P. Defining spatiotemporal characteristics of climate change trends from downscaled GCMs ensembles: how climate change reacts in Xinjiang, China. Int. J. Climatol. 2018, 38, 2538–2553. [Google Scholar] [CrossRef]
  39. Meinshausen, M.; Smith, S.J.; Calvin, K.; Daniel, J.S.; Kainuma, M.L.T.; Lamarque, J.-F.; Matsumoto, K.; Montzka, S.A.; Raper, S.C.B.; Riahi, K.; et al. The RCP greenhouse gas concentrations and their extensions from 1765 to 2300. Clim. Chang. 2011, 109, 213. [Google Scholar] [CrossRef] [Green Version]
  40. Gang, C.; Zhang, Y.; Wang, Z.; Chen, Y.; Yang, Y.; Li, J.; Cheng, J.; Qi, J.; Odeh, I. Modeling the dynamics of distribution, extent, and NPP of global terrestrial ecosystems in response to future climate change. Glob. Planet. Chang. 2017, 148, 153–165. [Google Scholar] [CrossRef]
  41. Yu, M.; Wang, G.; Parr, D.; Ahmed, K.F. Future changes of the terrestrial ecosystem based on a dynamic vegetation model driven with RCP8.5 climate projections from 19 GCMs. Clim. Chang. 2014, 127, 257–271. [Google Scholar] [CrossRef]
  42. Arora, V.K.; Boer, G.J. Terrestrial ecosystems response to future changes in climate and atmospheric CO2 concentration. Biogeosciences 2014, 11, 4157–4171. [Google Scholar] [CrossRef] [Green Version]
  43. Hu, R. Physical Geography of the Tianshan Mountains in China; China Environmental Science Press: Beijing, China, 2004. [Google Scholar]
  44. Chen, X.; Luo, G. Carbon Cycle in Dryland Ecosystems of Central Asia; China Environmental Press: Beijing, China, 2015. [Google Scholar]
  45. Farquhar, G.D.; Von Caemmerer, S.V.; Berry, J.A. A biochemical model of photosynthetic CO2 assimilation in leaves of C 3 species. Planta 1980, 149, 78–90. [Google Scholar] [CrossRef] [Green Version]
  46. Ryan, M.G. Effects of climate change on plant respiration. Ecol. Appl. 1991, 1, 157–167. [Google Scholar] [CrossRef]
  47. Sinclair, T.R.; Tanner, C.; Bennett, J. Water-use efficiency in crop production. Bioscience 1984, 34, 36–40. [Google Scholar] [CrossRef]
  48. Hao, X.; Ma, H.; Hua, D.; Qin, J.; Zhang, Y. Response of ecosystem water use efficiency to climate change in the Tianshan Mountains, Central Asia. Environ. Monit. Assess. 2019, 191, 561. [Google Scholar] [CrossRef]
  49. Xinjiang and Central Asia Data Center. Available online: http://midasia.geodata.cn/Portal/index.jsp (accessed on 12 June 2018).
  50. ASTER GDEM V.2. Available online: http://gdem.ersdac.jspacesystems.or.jp/ (accessed on 2 June 2018).
  51. Cold and Arid Regions Sciences Data Center at Lanzhou. Available online: http://westdc.westgis.ac.cn (accessed on 6 June 2018).
  52. Termonia, P.; Van Schaeybroeck, B.; De Cruz, L.; De Troch, R.; Caluwaerts, S.; Giot, O.; Hamdi, R.; Vannitsem, S.; Duchêne, F.; Willems, P.; et al. The CORDEX.be initiative as a foundation for climate services in Belgium. Clim. Serv. 2018, 11, 49–61. [Google Scholar] [CrossRef]
  53. Giorgi, F.; Jones, C.; Asrar, G.R. Addressing climate information needs at the regional level: the CORDEX framework. World Meteorol. Organ. (WMO) Bull. 2009, 58, 175–183. [Google Scholar]
  54. Hamdi, R.; Giot, O.; De Troch, R.; Deckmyn, A.; Termonia, P. Future climate of Brussels and Paris for the 2050s under the A1B scenario. Urban Clim. 2015, 12, 160–182. [Google Scholar] [CrossRef]
  55. Hamdi, R.; Van de Vyver, H.; De Troch, R.; Termonia, P. Assessment of three dynamical urban climate downscaling methods: Brussels’s future urban heat island under an A1B emission scenario. Int. J. Climatol. 2014, 34, 978–999. [Google Scholar] [CrossRef]
  56. Mårtensson, L.-M.; Carlsson, G.; Prade, T.; Kørup, K.; Lærke, P.E.; Jensen, E.S. Water use efficiency and shoot biomass production under water limitation is negatively correlated to the discrimination against 13C in the C3 grasses Dactylis glomerata, Festuca arundinacea and Phalaris arundinacea. Plant Physiol. Biochem. 2017, 113, 1–5. [Google Scholar] [CrossRef]
  57. Zou, J.; Ding, J.; Yang, S. Spatial and temporal variation analysis of ecosystem water use efficiency in Central Asia and Xinjiang in recent 15 years. Geogr. Res 2017, 36, 1742–1745. [Google Scholar] [CrossRef]
  58. Cui, J.; Bai, J.; Zheng, L.; Li, Y.; Zhao, H.; Yuan, X.; Li, L. Uncertainty of Evapotranspiration Products Based on Fusion of Multi-source Remote Sensing Data and Land Surface Modes in Xinjiang. Arid Zone Res. 2018, 35, 597–605. [Google Scholar] [CrossRef]
  59. Wang, B.; Li Liu, D.; Asseng, S.; Macadam, I.; Yang, X.; Yu, Q. Spatiotemporal changes in wheat phenology, yield and water use efficiency under the CMIP5 multimodel ensemble projections in eastern Australia. Clim. Res. 2017, 72, 83–99. [Google Scholar] [CrossRef]
  60. Zhang, X.; Moran, M.S.; Zhao, X.; Liu, S.; Zhou, T.; Ponce-Campos, G.E.; Liu, F. Impact of prolonged drought on rainfall use efficiency using MODIS data across China in the early 21st century. Remote Sens. Environ. 2014, 150, 188–197. [Google Scholar] [CrossRef]
  61. Liu, C.; He, N.; Zhang, J.; Li, Y.; Wang, Q.; Sack, L.; Yu, G. Variation of stomatal traits from cold temperate to tropical forests and association with water use efficiency. Funct. Ecol. 2018, 32, 20–28. [Google Scholar] [CrossRef] [Green Version]
  62. Luo, G.; Han, Q.; Zhou, D.; Li, L.; Chen, X.; Li, Y.; Hu, Y.; Li, B.L. Moderate grazing can promote aboveground primary production of grassland under water stress. Ecol. Complex. 2012, 11, 126–136. [Google Scholar] [CrossRef]
Figure 1. Study area (a) and the plant functional type distribution (b). TNF: temperate needle-leaf forest; TBF: temperate broadleaf forest; GRS: grass; NPS: non-phreatophyte shrub; PS: phreatophyte shrub; CRP: crop; NVG: No vegetation; STL: settlement; SPT: Summer pasture.
Sustainability 12 00427 g001
Figure 2. Temporal variation of regional mean annual precipitation (a), temperature (b), and CO2 concentration (c) from 2006 to 2055 under RCP2.6, RCP4.5, and RCP8.5.
Sustainability 12 00427 g002
Figure 3. The spatial patterns of annual precipitation difference between 2006 and 2055 under RCP2.6 (a), RCP4.5 (b), and RCP8.5 (c).
Sustainability 12 00427 g003
Figure 4. The spatial patterns of annual mean temperature difference between 2006 and 2055 under RCP2.6 (a), RCP4.5 (b), and RCP8.5 (c).
Sustainability 12 00427 g004
Figure 5. Temporal variation of regional mean annual NPP (a) and ET (b) from 2006 to 2055 under RCP2.6, RCP4.5 and RCP8.5.
Sustainability 12 00427 g005
Figure 6. The spatial patterns of annual NPP difference between 2006 and 2055 under RCP2.6 (a), RCP4.5 (b), and RCP8.5 (c).
Sustainability 12 00427 g006
Figure 7. The spatial patterns of annual ET difference between 2006 and 2055 under RCP2.6 (a), RCP4.5 (b), and RCP8.5 (c).
Sustainability 12 00427 g007
Figure 8. The temporal variation of annual NPP for different vegetation types from 2006 to 2055 under RCP2.6 (a), RCP4.5 (b) and RCP8.5 (c). TNF: temperate needle-leaf forest; TBF: temperate broadleaf forest; GRS: grass; NPS: non-phreatophyte shrub; PS: phreatophyte shrub; CRP: crop; STL: settlement; SPT: Summer pasture.
Sustainability 12 00427 g008
Figure 9. The temporal variation of annual ET for different vegetation types from 2006 to 2055 under RCP2.6 (a), RCP4.5 (b), and RCP8.5 (c). TNF: temperate needle-leaf forest; TBF: temperate broadleaf forest; GRS: grass; NPS: non-phreatophyte shrub; PS: phreatophyte shrub; CRP: crop; STL: settlement; SPT: Summer pasture.
Sustainability 12 00427 g009
Figure 10. The temporal variation of annual WUE for different vegetation types from 2006 to 2055 under RCP2.6 (a), RCP4.5 (b), and RCP8.5 (c). TNF: temperate needle-leaf forest; TBF: temperate broadleaf forest; GRS: grass; NPS: non-phreatophyte shrub; PS: phreatophyte shrub; CRP: crop; STL: settlement; SPT: Summer pasture.
Sustainability 12 00427 g010
Table 1. Input Data Sets for AEM.
InputsUnitMethods and Sources
Base maps
ElevationmAggregated from 30 m Advanced Spaceborne Thermal Emission and Reflection Radiometer (ASTER) Global Digital Elevation Model Version 2 data set (http://gdem.ersdac.jspacesystems.or.jp/)
AspectDegree
SlopeDegree
Soil texture%Extracted from the data set of soil properties for land surface modeling (http://westdc.westgis.ac.cn)
Soil pH
Soil bulk densityg cm−3
Vegetation Xinjiang and Central Asia scientific data sharing platform (http://midasia.geodata.cn/Portal/index.jsp)
Transient data
Groundwater levelmCold and Arid Regions Science Data Center at Lanzhou (http://westdc.westgis.ac.cn)
CO2ppmvPredefined CO2 concentration under RCP2.6, RCP4.5, and RCP8.5 [39]
PrecipitationmmDynamic downscaled daily climate data set
Solar radiationW m−2
Relative humidity%
Maximum, minimum and average temperature°C
Table 2. The Mean Rate of Change for Precipitation and Temperature during Different Periods.
RatePrecipitation (mm/Decade)Temperature (°C/Decade)
Period2006–20352036–20552006–20552006–20352036–20552006–2055
RCP2.616.26.46.50.300.120.22
RCP4.514.1−4.59.00.400.350.24
RCP8.512.24.211.80.420.300.49
Table 3. The Mean Rate of Change for NPP and ET during Different Periods under Each RCP Scenario.
RateNPP (g C m−2 year−1)ET (mm year−1)
Period2006–20352036–20552006–20552006–20352036–20552006–2055
RCP2.62.160.431.160.820.140.38
RCP4.52.67−0.751.620.87−0.500.43
RCP8.52.441.422.150.77−0.130.52
Table 4. The Normalized Rate for NPP and ET during Different Periods under Each RCP Scenario (%).
ScenarioRCP2.6RCP4.5RCP8.5
Period2006–20352036–20552006–20552006–20352036–20552006–20552006–20352036–20552006–2055
NPPTNF1.300.590.621.35−0.080.871.400.881.29
TBF1.240.300.501.02−0.770.690.890.430.94
GRS1.91−0.210.921.700.181.371.851.071.84
NPS2.93−1.171.161.37−0.521.520.701.272.06
PS3.13−0.591.082.41−1.911.180.722.212.33
CRP1.110.310.591.70−0.650.771.280.400.80
STL2.470.020.821.32−0.421.271.630.881.56
SPT1.340.280.721.140.340.871.610.861.43
ETTNF0.750.520.350.82−0.240.460.850.410.76
TBF0.670.100.220.35−0.640.210.37−0.160.35
GRS0.83−0.040.330.59−0.120.420.630.070.60
NPS1.110.060.340.62−0.560.390.650.070.55
PS1.340.160.501.04−0.660.530.270.570.77
CRP0.510.140.280.82−0.590.290.53−0.310.16
STL0.99−0.100.260.33−0.370.350.600.080.49
SPT0.560.140.280.42−0.020.260.630.100.55

