Impact of Global Value Chains on Export Technology Content of China’s Manufacturing Industry

School of Economics & Trade, Hunan University, Changsha 410006, China
*
Author to whom correspondence should be addressed.
Sustainability 2020, 12(1), 432; https://0-doi-org.brum.beds.ac.uk/10.3390/su12010432
Submission received: 28 November 2019
/
Revised: 23 December 2019
/
Accepted: 27 December 2019
/
Published: 6 January 2020
Abstract
:With the deepening development of global value chains (GVC), a large number of foreign intermediate inputs have been integrated in the products production process of one country, thus the technology content of export products may not completely come from the home country. According to the new measurement based on production process, this paper calculates the domestic technology content of China’s manufacturing industry from 2000 to 2014 by using the data of World Input–Output Database (WIOD). Furthermore, it has an empirical analysis of the effect of GVC position on domestic technology content using the panel data of China’s 18 manufacturing industries. The results showed that: the technology content of the China’s manufacturing exports are increasing, and the domestic technology content grows faster than overall technology content, which indicats that China’s manufacturing industry has been upgraded and optimized in a certain way; However, there is still a certain gap between China’s manufacturing technology content and the corresponding indicators of major developed countries; And the upgrading of GVC position of Chinese manufacturing industry can significantly improve the domestic technology content of manufacturing exports.
1. Introduction
The global value chains (GVCs) has gradually developed into a new and prominent feature of economic globalization and international division of labor. China’s manufacturing industry actively participates in the division of labor in global value chains, and has already taken a big lead over other developing countries and even most developed countries in terms of industrial added value and total trade volume. Since 2013, China has surpassed the United States to become the world’s largest country in the field of goods trade. China’s total exports increased from 2.49 trillion US dollars in 2000 to 23.43 trillion US dollars in 2014, with an average annual growth rate of 17.36%. China has become a veritable manufacturing exporter, but a large exporter is not corresponding to a strong exporter. Chinese enterprises continue to expand their domestic and foreign markets and give full play to the comparative advantages of low-cost labor, most of which are embedded in the low-end position of the value chain in the form of processing trade [1]. Lamy pointed out that in the context of the division of labor in the global value chains, “Made in China” does not reflect the its core nature, because there are many intermediate inputs such as raw materials and components imported from other countries or regions in China’s export products, many of these intermediate products are actually made globally, assembled in China, which means China’s export value added is not entirely created by China [2]. In 2015, the Chinese government put forward the national strategy of "Made in China 2025", and strived to make China transform from a large industrial power to a strong industrial power in 2025. "Made in China 2025" proposes that China’s innovation capacity will be significantly enhanced by 2025, with some key areas of technology ranking at the forefront of the world, and its position in the global industrial division of labor and value chain will increase significantly. The report of the 19th CPC National Congress put forward a series of goals, including strengthening applied basic research; highlighting key common technologies, cutting-edge leading technologies, and modern engineering technologies; disruptive technological innovations; enhancing the construction of national innovation systems, and increasing technology content.
Therefore, the controversial topic about the technology content and structural upgrading of China’s exports has been widely concerned by scholars. Some of them believe that China’s export technology content has increased significantly, and some even believe that it has reached the level of developed countries. Rodrik and Schott grouped countries in the world according to the per capita GDP level, they found that China’s export technology sophistication level is much higher than the world average, and their research conclusions have caused extensive discussion, known as “Rodrik Paradox” [3,4]. Du Chuanzhong and Zhang Li calculated the complexity of export technology based on the vertical specialization division. The results show that the domestic technical complexity of China’s exports has shown a steady growth trend [5]. Liu Lin and Sheng Bin measured the export domestic technological sophistication based on domestic value added, and found that China’s export technological sophistication has steadily increased [6]. Other scholars believe that although the overall export technology content of China has improved in general, the upward trend is not obvious and even lower than the world average. There is still a significant gap compared with the developed countries in the same period. Xu thinks that the increase in the export technology sophistication of China is subtle. The reason for the serious mismatch between export sophistication and income level is that the export sophistication is generally overestimated [7]. Dai Xiang and Zhang Er-zhen analyzed the change trend of China’s export technology level. The research pointed out that the export sophistication of China did not catch up with that of developed countries, and there was still a certain gap between the two, especially in the term of high-tech intensive export products [8]. Zhu Shujin and Zhang Penghui replaced the export sophistication by the standardization index of its absolute value, and calculated the domestic technology content and its contribution index of China’s manufacturing export during the period of 1992–2010. The results show that the domestic technology content of China’s manufacturing export showed the tendency of drop-rise, while the contribution index of the domestic technology contents tended to decrease during the sample period, which indicates that the contribution of domestic production technology level has not increased but decreased [9].
2. Materials and Methods
The main reason for the above controversy is that different scholars use different measurement for technical content indicators.
2.1. Literature Review
Traditionally, analysis of the exports technology content has often been done in two ways: the first one is product (sector) classification method, that is, classifying the technical level of products according to internationally accepted standard classifications or product feature intensity characteristics. Pavitt originally used this method to study the technological evolution of the British industrial model, which divides products into labor-intensive, scale-intensive and resource-intensive [10]. Lall divides the standard international trade classification (SITC) three-digit products into resource-based, low-tech, medium-tech and high-tech products according to the technical content of the products (generally based on the parent company’s R&D, patents, etc.) [11]. Ferrantino et al reclassifies the products according to the technical composition on the basis of the classification of six-digit products [12]. The other one is technological sophistication and improvement method. Technical complexity is an analytical indicator based on international trade product and national (regional) income (or production) data, and is currently the primary method to measure changes in a country’s export technology structure. The export technology complexity index was first proposed by Michaely. He used the technology complexity index (TSI) to measure the level of trade specialization. This index assumes that the export technology level is related to the per capita GDP of the exporting country [13]. Therefore, the ratio of the export value of each country’s products to the total exports of the world’s products is used as the weight. The per capita GDP of each country is weighted to measure the level of export technology. On this basis, Lall et al. further elaborated on the method of “product technical complexity” and systematically analyzed its influencing factors and deficiencies [14]. Subsequently, a large number of studies focus on the selection of per capita income and weight variables in "technical complexity". Rodrik, and Hausmann et al. calculated the export technology complexity index by using the comparative advantage RCA index of export products of various countries instead of the export share of products as the weight of per capita income, and carries on the standardization processing [3,15]. Fan Gang et al. introduced the comparative advantage index of products as the weight to construct the technical height index of China’s export trade and import trade in 1995 and 2003 [16]. Du Xiuli and Wang Weiguo used the production share of products instead of export share as the weight to measure the technical structure of export trade [17]. Yao Yang and Zhang Wei took the influence of foreign intermediate investment into account, constructed the domestic technical content index of Chinese exports, and adopted the import ratio of China’s input–output tables and intermediate products to eliminate the technical content of imported intermediate products for the final products [18].
However, with the deepening of the integration of the world economy, great changes have taken place in the production process under the division of labor system in the global value chains. At present, most of the indicators for measuring the technology content do not consider the factors of the global value chains. Many scholars study the impact of participation in global value chains on the technological level of Chinese exports based on vertical specialization or GVCs embedding. Some scholars believe that GVCs embedding plays an essential role in pushing forward comparative advantage in developing countries and can promote its technological progress. Qiu Bin, and Ye Longfeng et al. used vertical specialization index to represent the global production network. The research shows that the global production network promoted the complexity of China’s manufacturing exports, and there were significant industry differences in the degree of influence [19]. Liu Lin used the foreign additional value rate as the proxy variable for countries to participate in the global value chains. The results show that the global value chains had a significant positive impact on the technology content of exports [20]. Liu Weilin, and Li Lanbing et al. used the foreign value added rate of the industry to express the degree of industry embedding into the global value chains, and study its impact on the technical complexity of manufacturing export. The research shows that the foreign intermediate investment obtained by Chinese manufacturing industry through participating in the division of labor in global value chains promoted the complexity of export technology [21]. Wang Yuyan, and Lin Hanchuan et al. showed that GVCs embedding could promote technological progress and had an inverted U-shaped nonlinear relationship with technological progress. In the initial stage of embedding GVCs, Chinese enterprises can obtain technology spillovers and learning opportunities through process upgrades and product upgrades. Therefore, deepening the embedding degree of GVCs can promote the development of enterprises; once the enterprise has experienced more advanced functional upgrades and GVCs upgrades, it will touch the core interests of certain developed countries and suffer from blockades and suppression [22].
In the background of the global value chains division system, only the technology content included in the domestic production link is the effective index to measure the actual technology content of a country’s export product. This paper draws on Ni Hongfu based on the measurement method of production process [23], removes the technical content of imported intermediate products from all technical content, and thus obtains the true domestic technical content. but the difference between this article and the Ni Hongfu is that: firstly, the total factor productivity (TFP) is used to replace the labor productivity to represent the technology content of the last production process. Because the production process involves the input of various production factors, labor is only a part of it, and labor productivity cannot fully represent the efficiency of production. Therefore, it is more scientific to use the total factor productivity to reflect the level of production technology. Secondly, the world input-output table data released by WIOD is used. The newly released WIOD data in 2016 provide input–output data from 2000 to 2014, covering more countries and departments. Based on this, the influence of GVC position on the technology content of China’s manufacturing industry is explored.
2.2. Method for Technology Content Measurement
Ni Hongfu considered that the technology content of a product should be the sum of the technology content of the intermediate inputs in the production process and the final production process [23]. Thus, under the framework of the global input-output table, the total technology content of product i manufactured by country c should be the sum of the technology content of all intermediate inputs and the technology content of the final production process of country c, in which the technology content of the final process itself is expressed by the productivity of the production process. We use total factor productivity instead of labor productivity to represent the technology content of the final production process. The definition and calculation method of all technical content, domestic technical content and its index are as follows:
According to classic input–output model, it is generally assumed that the production function of various sectors in an economy is in Leontief form,
where , present country or region, , refer the production sector. is product output of country from sector . is the demand of sector in country for intermediate inputs from sector of country in order to manufacture its products, and is the direct consumption of output from sector in country for country to manufacture one unit of output from sector . is factor payment (labor and capital factor input). is the share of factor payment in total output, i.e., value-added ratio coefficient.
Assume that the total technical content of a production sector is the weighted sum of the technical content of the intermediate inputs and the final production process, and the weights are the value of the intermediate inputs and the value added by the final production process as a percentage of the total output. Thus, we have:
where is the total technology content of unit output of sector in country . is the direct consumption of output from sector in country for country to manufacture one unit of output from sector (direct consumption coefficient of world input-output table), and is total factor productivity of sector in country , that is technology content of final production process.
Then, we may obtain the following equation expressed in the form of matrix:
where V is the column vector of total technology content, namely total technology content of products in various sectors of each country. TFP is the column vector of technology content of final production process. VT is the column vector of value-added ratio coefficient. # is the multiplication of corresponding element. I is identity matrix. A is the direct consumption coefficient matrix in world input-output table. is Leontief inverse matrix, which is usually expressed as B. Element of column in line is .
We denoted or convenience, Equation (3) is transformed into .
Take two countries and two departments as an example, thus we obtain:
The technology content from the domestic production process is defined as the domestic technology content of the product, so the domestic technology content of the sector in country can be defined as:
Next, export from a country’s manufacturing industry (manufacturing industry export/total manufacturing export) is used as weight to define overall export technology content (MTV), domestic technology content (MTDV), and its index (MDTC) of manufacturing in country c, the calculation formulas are as follows:
where, is export share of product from sector in country , sector belongs to manufacturing industry of country , and there are .
This paper uses the methods of Lai and Zhu and Cheng Dazhong to calculate the total factor productivity (TFP) [24,25].We defined , , , as the real value-added, labor input, capital input and labor share of sector i of country c in year t. is the number of sample countries. We defined , , , . Therefore, the TFP of sector i of country c in year t is equal to:
3. Results of Export Technology Content
This paper measures the export technology contents of China’s manufacturing industry during 2000–2014, which is based on the world input–output tables (WIOTs) released in 2016 and employment-related satellite account data, using the aforesaid new method for the technology content measurement, so as to offer a systematic analysis of Chinese manufacturing’s export technology level and its changes from 2000 to 2014.
3.1. Overall Technology Content of China’s Manufacturing Exports
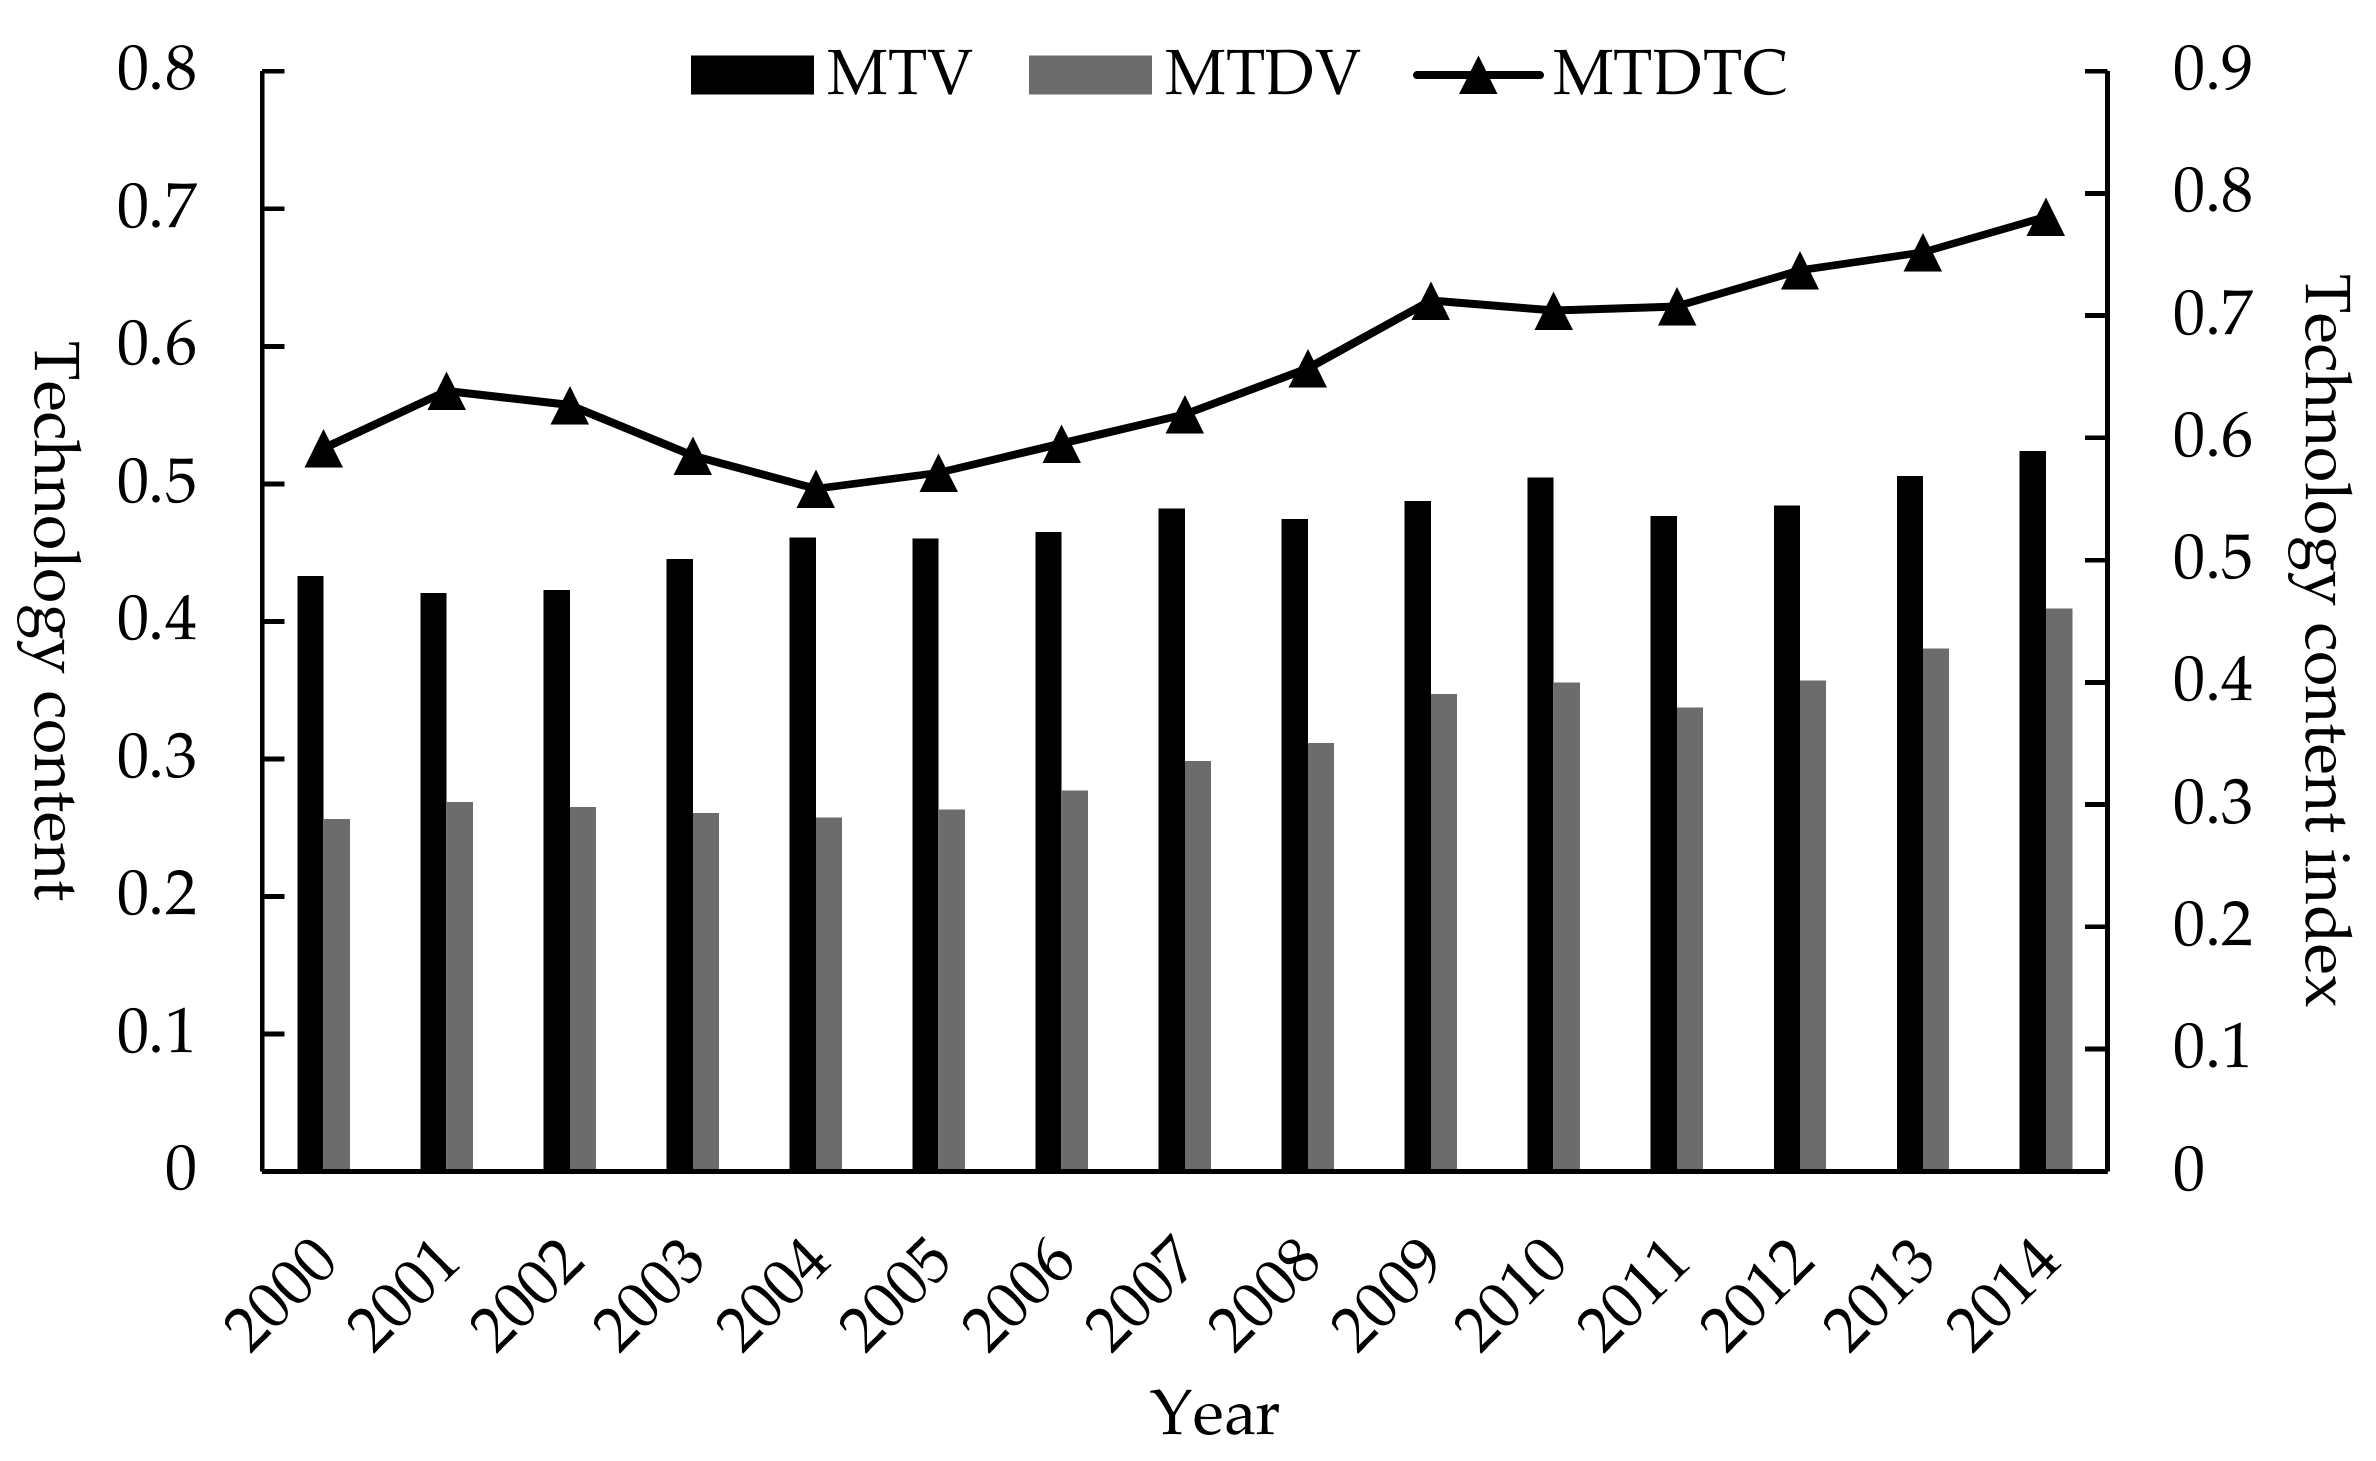
Figure 1 shows the overall technology content (MTV), domestic technology content (MTDV) and domestic technology content index (MTDTC) of Chines manufacturing.
From 2000 to 2014, the overall technology content of China’s manufacturing exports has shown a slow growth trend. From 2000 to 2014, it rose from 0.433 to 0.524, with an average annual growth rate of 1.37%. In particular, after China’s entry into WTO, the growth of overall technology content of manufacturing industry accelerated, from 0.423 to 0.461 during the period of 2002 to 2004, an increase of 9%. It decreased in 2011, then continued to grow, and increased by 21 percentage point in 2014 compared with 2000.
The domestic technology content of China’s manufacturing industry shows an upward trend in fluctuation. In 2000–2002, it grew slowly from 0.256 to 0.265, an increase of 3.5%. From 2002 to 2004, due to the imports of foreign intermediate products and advanced technology, the domestic technology content decreased. From 2005 to 2014, the domestic technology content showed an upward trend, which increased to 0.409 in 2014, 59.8 percentage points higher than in 2000. As mentioned by Du Chuanzhong and Zhang Li, the significant increase in the domestic technology level in China is due to the rapid improvement of China’s economic development level (GDP per capita) and the gradual improvement of export trade structure [5]. In particular, the proportion of exports of medium and high-tech products has been rising, and the proportion of low-tech products exports has declined rapidly. By comparing the changes of the overall technology content and domestic technology content in China’s manufacturing industry, it can be found that the growth rate of domestic technology content is faster than that of overall technology content, and this makes the gap between the two continue to decrease, which is also reflected by the trend of domestic technology content index. The domestic technology content index of China’s manufacturing industry first decreased and then increased rapidly. From 2002 to 2004, the index decreased obviously, from 0.627 in 2002 to 0.558 in 2004, a decrease of 11 percentage points. The main reason is that after China joined the WTO in 2002, a large number of imported intermediate goods began to infiltrate into the domestic production process. In the early stage of integration into the division of labor system in global value chains. At that time, China’s own technological innovation and creativity were still relatively weak. Therefore, the impact of foreign advanced technology has caused a sharp decline in the domestic technological content of China’s manufacturing industry. However, in the following years, China’s manufacturing industry has made unremitting efforts in many aspects, including learning, digesting and absorbing foreign advanced technologies, transforming domestically backward production technologies, and actively carrying out independent innovations, which have led to continuous upgrading of domestic production technologies, and domestic technical content index has shown a clear upward trend, from 0. 592 in 2000 to 0.781 in 2014, the growth rate reached about 32%. It shows that China’s manufacturing industry has achieved its own technology upgrade.
3.2. International Comparison of the Overall Technology Content of China’s Manufacturing Exports
In this section, 10 countries were selected and compared horizontally with the technological content of Chinese manufacturing exports. These countries are: the major developed countries (US, Germany, UK, France, Japan), BRICS countries (Russia, India, Brazil) and typical Asian countries (Korea, Taiwan). Due to the limitation of the length of the article, we only selected 2000, 2008, and 2014 as the years of study.
Table 1 shows the total technological content of the manufacturing industry in China and other representative countries, the domestic technological content, and their corresponding indexes. Countries with high levels of domestic technology exports in manufacturing are concentrated in developed ones. According to the MTDV of domestic manufacturing exports in 2014, the highest one is Germany, followed by the United States and Japan. This shows that countries with higher levels of economic development own relatively high technological content in their manufacturing exports Compared with other countries, the technological content of China’s manufacturing industry in 2000 was at a relatively low level, only higher than Russia and India. In recent years, at the same time that China’s economy has achieved leapfrog development, the domestic technological content of the manufacturing industry has also brought about development and catching up, rising from 31st in 2000 to 22nd in 2014.
Comparing the technological content of manufacturing in China and developed countries, it can be found that China is far lower than the United States, Japan, Germany and other countries, both in terms of total technological content and domestic technological content. For example, in 2014, the overall technical content and domestic technical content of the U.S. manufacturing exports were 1.009 and 0.903, while China’s corresponding indicators were 0.524 and 0.409. These two indicators of the United States are 1.926 and 2.208 times that of China, respectively. From the perspective of the domestic technology content index, developed countries such as the United States, Japan, and Germany are still much higher than China. Taking the 2014 domestic technology content index of the manufacturing industry as an example, the United States, Japan, Germany, and the United Kingdom are 0.896, 0.830, 0.746, and 0.755, respectively. The changes in the domestic technology content index of the manufacturing industries in these countries are relatively stable. The United States is basically stable at about 0.9, and Germany and the United Kingdom are basically stable at about 0.75. The domestic technology content index of China’s manufacturing industry has increased significantly. By 2014, the index of China’s was 0.781, surpassing Germany and the United Kingdom. Even so, there is still a certain gap between the total technological content and domestic technological content of China’s manufacturing industry and the major developed countries. The main reason may be that China has actively participated in the international division of labor and gradually embedded in the global value chain through its low-cost advantages in land and labor. However, China is mainly engaged in the production of processing and assembly technology at a low-end position in the global value chain, and most of the intermediate inputs used in the production process of export products are imported from abroad.
3.3. Exports Technology Content of Chinese Manufacturing Subdivision Industry
We have further measured the overall technological content (V) and the domestic technical content (DV) of China’s manufacturing exports from the industry level. For the ease of analysis, this paper refers to Dietzenbacher et al. classification method [26] to compare International Industry Classification Standard (ISIC) rev 4 and ISIC rev 3, and divides 19 manufacturing industries into three categories—labor-intensive, capital-intensive, tech-intensive manufacturing—according to factor density. See Table 2 for details.
In the WIOD data, the statistical value of the 19th sub-industry (mechanical equipment repair manufacturing industry) of China’s manufacturing industry is blank, so this paper uses the first 18 manufacturing industries for analysis. Table 3 shows the overall technology content (V) and domestic technology content (DV) of various manufacturing industries in China from 2000 to 2014.
On the whole, between 2000 and 2014, the domestic technology content of China’s overall industry showed a rapid growth trend. However, the total technology content of various industries showed different trends. However, in general, the gap between the total technology content of domestic exports and the domestic technology content gradually narrowed. It indicates that the export products of various manufacturing industries in China upgraded their own technology to varying degrees. From the average value of domestic technology content in various industries from 2000 to 2014, it can be seen that the top five industries with the highest technology content in China were the manufacture of basic metals (0.514), manufacture of motor vehicles, trailers, and semi-trailers (0.467), manufacture of other non-metallic mineral products (0.455), manufacture of other transport equipment (0.440), and manufacture of fabricated metal products (0.439); while the five industries with the lowest domestic technology content in China were: manufacture of computer, electronic, and optical products (0.347), manufacture of textiles, wearing apparel, and leather products (0.348), manufacture of furniture other manufacturing (0.353), manufacture of rubber and plastic products (0.373), and manufacture of food, beverages, and tobacco products (0.396).
The technology content of labor-intensive industries basically showed a wave-rising pattern. Among them, the fastest growing technical content was the manufacture of wood straw products, the overall technology content and domestic technology content increased by 27.10% and 50.32% respectively from 2000 to 2014. The technology content of capital-intensive industries and technology-intensive industries increased by a large margin. Only the total technology content of computer, electronic, and optical products manufacturing industry slowly decreased. From 2000 to 2014, the total technology content decreased by 7.41 percentage points, but its domestic technology content increased by 44 percentage points. The technology content of coke and refined petroleum manufacturing is the fastest growing in capital-intensive industries, from 2000 to 2014, the overall technology content and domestic technology content increased by 59.09% and 75.87%, respectively. When it comes to technology-intensive industries, the automotive, trailer, and semi-trailer manufacturing industries had the fastest growth rate in terms of total technology content, while the domestic technology content of other transportation equipment manufacturing industries had the fastest growth rate, with an increase of 65.76 percentage points.
By comparing the average value of the overall technology content and domestic technology content of the above three types industries, we can see that the overall technology content of tech-intensive manufacturing exports was the highest, followed by capital-intensive manufacturing industry, and labor-intensive manufacturing industry was the lowest. However, when it comes to the gap between the total technical content and the domestic technical content, the gap between the two was the largest among the exports of technology-intensive manufacturing, and the smallest among the labor-intensive manufacturing. This shows that the export products of technology-intensive industries added relatively high-tech foreign intermediate inputs in the process of integration into the international production division, so they were in a lower production position in the international industrial chain. After China’s accession to the WTO, these three types of industries experienced varying degrees of decline. During the period of 2002–2004, the average overall technology content and domestic technology content of the labor-intensive industry decreased by 10.7% and 18.3% respectively. In the capital-intensive industry, the mean value of the overall technology content and the domestic technology content fell by 3.7% and 12.8%, respectively. These two indicators for technology-intensive industries are reduced by 0.7% and 11%, respectively. After 2005, the total technology content and domestic technology content of the three major industries have increased significantly.
4. Econometric Model
In this section, we build an empirical model framework and explain the variables used by the model, as well as the source of the data.
4.1. Econometric Model
In order to study the influence of global value chain position on the domestic technology content of manufacturing export, this paper constructs the following measurement model:
where, is explained variable, which represent the domestic technology content of China’s manufacturing industry export. The explanatory variable, GVC, is GVC position index. is a set of vectors that will be added to other control variables: (1) R&D intensity (2) human capital (3) capital intensity (4) export volume (5) industry concentration (6) marketization level. The subscript i represents the industry, t represents the year, is the constant vector, is the coefficient, represents the coefficient vector, and is the random interference term.
Since participation in the global value chains can not only directly improve the technical level of export through the input of imports, but can also strengthen the absorptive capacity of imported technology through the combination with the R&D activities of domestic enterprises. To this end, the interaction between R&D and GVC is introduced to test this mechanism. So the econometric model is further extended as follows:
If is not significant, it shows that the R&D absorption capacity of domestic manufacturing industry export is weak, and it is unable to effectively absorb the advanced technology included in the value-added of imports through the R&D to promote the growth of export technology. Therefore, the result indicates that the technology diffusion of imported products is inconspicuous; If is significantly positive, it indicates that the export manufacturing industry has strong R&D absorption capacity, and it successfully absorbs the advanced technology contained in the imported products, thus promoting the growth of export technology complexity, which indicates that the diffusion effect of imported products is obvious. If it is significantly negative, it indicates that the R&D absorption capacity of export manufacturing industry is very weak, which not only fails to effectively absorb the advanced technology contained in import investors, but also produces the diffusion of reverse technology, excessive dependence on import investment and brain drain, etc., forming the "low-end locking" of the value chain.
4.2. Variable Selection
The explained variable, domestic technology content, is calculated according to the above part.
4.2.1. The Explaining Variable
The GVC position index in this paper proposed by Wang et al. is used to calculate the global value chain position of the manufacturing industry in China [27]. Specifically, first of all, according to the definition of Wang et al., the length of production is the average number of production stages between the primary inputs in a country-sector to final products in another country/sector: The numerical value can be expressed as the average number of times that the added value of the initial input in the production process is included in the total output of the final product. Then, on the basis of the decomposition model, the forward or backward sectors of a certain department are summed to obtain the forward contact production length (PLv_GVC) and the backward contact production length (PLy_GVC). PLv_GVC measures the average production length of domestic value-added embodied in intermediate products s from its first use as a primary input until its final absorption in final goods and services. PLy_GVC measures the average production length of foreign value-added embodied in intermediate imports from their first use as primary inputs until their final absorption into a certain country’s production of final products (for its domestic use or exports). The average production line position in a global value chains can be defined as the ratio of the two production lengths:
where GVCPs is GVC position index, the value is near 1. The greater the value of the index, the more upstream is the country-sector. This index combines the concepts of upstreamness and downstreamness, and can accurately measure the relative position of the global value chains at the country-sector level. If country-sector A is more upstream than country-sector B, then country-sector B must be more downstream than country-sector A. In other words, the relative rankings of the country-sectors by these two measures are consistent with each other. This can solve the consistency problem of the production position indexes used in the current literature, such as the indexes proposed by Fally and the Down measure proposed by Antras and Chor [28,29].
4.2.2. Control Variables
The way in which the global value chains affect the technical structure of export products is mainly processing trade and FDI. If the variable FDI is introduced into the empirical model, it is very likely to cover up the impact of global value chains on the export technology content. Therefore, this article refers to Qiu Bin et al.: FDI will not be included in the model [19].
Research and development intensity (RD). The scale of research and development (R&D) activities shows the extent of a country’s investment in scientific research and technological development, which is an important indicator of a country’s scientific and technological strength and core competitiveness. A large amount of R&D expenditure can not only promote the development of science and technology in a country, accelerate the continuous upgrading of technology and products, optimize the industrial structure and improve the economic growth model; it can also promote technological innovation, accelerate the diffusion of new technologies, and improve the technical level and competitiveness of various industries within the country. Thereby improve the overall strength of the national economy. Typically, the technological progress of the industry with high R&D intensity is faster and the export technology content is higher. This paper uses the proportion of R&D expenditures in various industries in its main business to express the R&D intensity.
Considering the lag of R&D, R&D investment in various industries cannot be immediately transformed into productivity. The process from the R&D investment to the development of new technologies to the final application of new technologies is long, that is to say, the role of intellectual capital is lagging [30]; therefore, this paper will adopt the first-order lag form of R&D intensity in the regression equation.
Human capital (HU): Human capital is one of the important elements that promote technological progress. Human capital can improve the skills of workers and improve the absorption of advanced technology “technical spillovers”, which in turn will increase the export technology content. On the one hand, the growth of human capital can improve the efficiency of capital utilization. On the other hand, the growth of human capital is itself a manifestation of technological progress. Both capital utilization efficiency improvement and technological progress are important driving forces for promoting the quality of manufacturing supply. At present, there are many indicators of human capital and the standards of these indicators are not uniform, such as wage levels, education years, and the proportion of scientific and technical personnel. Combined with the research in this paper, and considering the price distortion in China’s factor market, the wage level cannot accurately reflect the human capital situation of various industries. This paper refers to the practice of Li Xiaoping and uses the proportion of scientific and technological personnel to the employees [31].
Capital intensity (KL): In general, capital-intensive industries own a larger number of machinery and more advanced technology. But is the higher capital-intensive industry better? Lin Yifu and Zhang Pengfei put forward the problem of suitable technology [32]. They believe that the most appropriate (excellent) technical structure of a country should be determined by the country’s factor endowment structure. For developing countries, capital-intensive industries may not adopt the country’s most appropriate technology and will not bring higher profit levels to the country. According to the classic comparative advantage theory, based on China’s current labor endowment characteristics, China should have a significant export comparative advantage in labor-intensive industries. However, due to the stimulation of GDP growth competition, local governments in China may prefer to implement various preferential policies for capital-intensive industries, which will lead to distortion of the export advantages of capital-intensive industrial enterprises and impact on the complexity of their export technologies [21]. Therefore, this paper uses the ratio of the net value of the fixed assets after the deflator to the number of employees at the end of the year to express the capital intensity.
Export scale (EX). In international trade, in order to obtain cheap products from developing countries, developed countries often provide corresponding technologies and production equipment, which indirectly promotes the upgrading of product technology in developing countries. Therefore, as the scale of trade expands, the links between enterprises in developing countries and developed countries will be further strengthened, and the technological upgrading process of enterprises will be further accelerated. However, expanding the opening of the industry is a "double-edged sword" for developing countries. On the one hand, they can obtain technical support from abroad, on the other hand, developing countries may suffer technological advances in their domestic industries due to the squeeze and blockade of developed countries. This paper uses the ratio of industry export delivery value to total industry output value to represent the export scale of a country.
Industry concentration (CON). Industry agglomeration is a potential driving factor for technology upgrades. The concentration of the industry can play a role in improving the competitiveness of the industry and help to form an external scale economy; however, excessive industry concentration may hinder innovation and create monopoly, which makes the industry less competitive and therefore not conducive to technological progress. This paper uses the prime operating revenue of large and medium-scale industrial enterprises to account for the proportion of the prime operating revenue of the industry.
Marketization level (MA). The reform of the property rights system and the development of the private economy are conducive to the improvement of the market economy system. The higher the level of marketization, the less the government’s intervention in the industry, that is, the less institutional constraints, which will break the monopoly of state-owned enterprises and promoting technological progress. Therefore, this paper uses the marketization level of the industry to measure the quality of the industry system, and the total output value of state-owned and state holding industrial enterprises accounts for the proportion of total industrial output value.
4.3. Data Sources
The data used in this paper are from WIOD, China’s Industrial Statistics Yearbook and China statistical yearbook on science and technology. Specifically, the calculation of domestic technology content and the GVC position index are from WIOD data, and the data used are from the 2016 world input–output table and socio-economic account table newly released by WIOD. The WIOD 2016 edition database provides data on transnational input-output tables for 15 consecutive years from 2000 to 2014. It covers 44 economies (43 countries and regions and the rest of the world ROW), including all 28 member states of the European Union and 15 other major economies: Australia, Brazil, Canada, China, India, Indonesia, Japan, Mexico, Norway, Russia, South Korea, Switzerland, Taiwan, Turkey, and the United States. These countries cover more than 85% of the world’s GDP. In addition, the remaining uncovered parts of the world economy are grouped under one umbrella, called the "rest of the world" (ROW). The new version contains input-output data for 56 industries (including 18 manufacturing industries) divided by the latest International Industry Classification Standard (ISIC Rev4). The data of R&D expenditure and scientific technological activities come from the China Statistical Yearbook on Science and Technology. The data of other control variables are from China’s Industrial Statistics Yearbook. Sample period from 2000 to 2014.
The industry classification standards used by WIOD are not the same as those used in China Statistical Yearbook. WIOD input–output table adopts ISIC Rev4.0 industry classification standard, while in the period of 2000–2014, China’s industry classification method has formulated and revised three standards—GB/T 4754-1994, GB/T 4754-2002 and GB/T 4754-2011—among which the manufacturing industry includes 13–43 categories. In order to ensure the continuity of the statistical caliber, and considering the availability and integrity of the data, this article will exclude the following two industries from the manufacturing industry: "crafts and other manufacturing" and "disused resources and waste materials recycling industry". Then, according to the name of each industry and its subdirectory, the manufacturing industry of each statistical yearbook in China is matched to the WIOD industry classification. Considering that there may be heteroscedasticity, all variables are presented in logarithmic form. All statistics of major variables see Table 4.
5. Empirical Analysis and Results
The Ordinary Least Squares regressions, namely OLS, estimation method of panel data usually faces some problems, such as disturbance autocorrelation, and some regression variables are not strictly exogenous. In addition, enterprises’ exports often have a characteristic called sustainability. This is still the case from the perspective of changes in export technology content. Therefore, the current domestic export of technical content may be affected by the export of domestic technology in the previous period. Therefore, the lag term of the export technology content is included as one of the explanatory variables into the measurement model. Since the explanatory variable contains the first-order lag term of the interpreted variable, it is related to the disturbance term; at the same time, there may be a reverse causal relationship between the export technology content and other variables. The existence of endogenous problems may cause the general least squares method to produce poor results of "dynamic panel estimation errors". In order to solve this problem, we usually introduce instrumental variables, which can effectively overcome the endogeneity of variables to a certain extent, but it depends largely on the choice of instrumental variables. Typically, the choice of instrumental variables in empirical research is a very difficult problem. While the Gaussian Mixture Model, namely GMM, can effectively solve this problem, especially when the econometric term of the explained variable is included in the econometric model. Therefore, this paper uses a first-order differential GMM estimation method to avoid endogeneity problems.
The consistency of GMM estimates depends on the validity of the instrumental variables. There are two test methods in the GMM estimation to test the validity of the instrumental variables. The first one is an over-identified constraint test, also known as the Sargan test or the Hansen test, which tests the validity of the instrumental variables used. The null hypothesis is that all instrumental variables are not related to the error term. The second test is the autoregressive (AR) test, which assumes that there is no second-order sequence correlation in the error term of the first-order difference equation. In the process of building the model, the difference term of the error term allows first-order sequence correlation, but prohibits second-order sequence correlation. At the same time, in order to solve the possible heteroscedasticity, the standard error of the parameter estimates uses a robust estimator.
Table 5 gives the full sample regression results. All estimates are one-step robust estimators. Among them, the last three rows of Table 5 list the main model setting test results: Arellano–Bond AR (2) statistic were not significant, indicating that there was no sequence correlation problem in these models, The P value calculated by the Hansen test fell in the range of 0.1 to 0.25, indicating that the instrumental variable selection was valid.
From the regression results reported in Table 5, it can be seen that the coefficient of the first order lag of domestic technology content was positive. All of them passed the significance test, which indicates that the domestic technology content of export in the early stage had a significant impact on the current period, and the domestic technology content of China’s manufacturing industry had the characteristics of "persistence". The coefficient of GVC position was positive, all of which passed the significance test. The results show that GVC position had a significant positive impact on the domestic technology content of manufacturing exports, and the improvement of global value chain position could significantly improve the domestic technology content of manufacturing industry. This is mainly due to two reasons: on the one hand, the participation of Chinese companies in the global value division of labor can learn, imitate and absorb the existing technologies of developed countries at a lower cost; on the other hand, it can accept the technology spillovers of high-demand and high-standard multinational companies, so as to achieve the purpose of improving their own technical level and management level.
The RD coefficient was significantly negative, indicating that there was a negative correlation between R&D intensity and domestic technology content, and the results are contrary to expectations, but consistent with Yao Yang and Zhang Qi, Li Xiaoping, and Zhu Zhongdi, Wang Yuyan, which may be related to the imperfect market environment in China at present. As China has not yet established a sound market economy system, coupled with the inappropriate investment and structure of enterprises, many companies are unable to effectively allocate RD inputs and utility among various industries. This phenomenon is particularly evident in the highly competitive international market. Under such circumstances, the dynamic allocation effect of resources will be distorted, resulting in inefficient use of resources, which may lead to the negative impact of domestic R&D expenditure on technology content. However, the coefficient of the first order lag variable of RD was significantly positive, and the R&D investment had a lag effect on the improvement of domestic technology content in the export industry.
The HU coefficient of human capital was significantly positive. Areas rich in human capital were more likely to attract the inflow of advanced technology. The promotion of human capital was easier to promote the emergence of technological progress as well, which led to the improvement of the quality of manufacturing supply. In addition, increasing the proportion of R&D personnel was also one of the important factors to enhance the domestic technology content of China’s manufacturing exports.
The export scale EX and industry concentration CON coefficient were significantly negative, indicating that the expansion of export scale and increase of industry concentration were negatively related to the increase in domestic technological content. The possible reasons are as follows: most of China’s exports are labor-intensive or low-tech products. The technological change of these products is slow. However, China has the advantage of labor cost, and most companies that export labor-intensive products have no incentive to improve their technology. Therefore, exports are not conducive to the improvement of technological content. The higher the concentration of the industry, the more market tends to monopolize, and the resulting lower industry competition will not be conducive to technological progress, ultimately, the domestic technical content of China’s products cannot be improved.
The capital intensity and market coefficient were negative, but not significant, which indicates that the increase in capital density may have hindered the improvement of domestic technological content in China’s manufacturing industry. The reason that may lead to this result is that due to excessive investment and competition, the company’s technology choices show problems such as the deviation of capital substitution labor, which leads to sustained and significant deterioration of investment returns. That is to say, the deepening of capital reduces the technical efficiency, which in turn hinders the improvement of the domestic technological content of the domestic manufacturing industry. This is consistent with Zhang Jun’s view that capital deepening delays technological progress. The reform of the property rights system can promote technological progress, but the market mechanism based on large state-owned enterprises is not conducive to the formation of effective market competition, because large state-owned enterprises generally lack innovation due to their monopolistic advantages. In addition, there exists strict requirements for technology introduction in state-owned enterprises, so it is difficult to efficiently absorb technology spillovers from foreign companies.
Model (7) added the intersection of GVC and R&D, but the coefficient of this item was not significant. It shows that the R&D absorption capacity of domestic manufacturing industry was weak, and the advanced technology embedded in the added value of imports through the R&D channel was not realized, so as to achieve the purpose of promoting the growth of export technology. Therefore, the technology diffusion effect of imported products was not obvious; it also shows that the coefficient symbols and significance of other control variables did not change substantially, indicating that the previous regression results are robust and reliable.
6. Conclusions and Recommendations
Based on the measurement method of production process, this paper calculates the overall technology content, domestic technology content, and domestic technology content index of manufacturing exports in China. The research results show that the overall technical level of China’s manufacturing industry is constantly improving. Specifically, the total export technology content and domestic technology content of China’s manufacturing industry have shown a continuous growing trend, and the gap between the two is constantly shrinking. Meanwhile, the total technical content and domestic technical content of various industries in the manufacturing industry have shown a growth trend. It can be seen that China’s manufacturing industry has reflected its own technological improvement to a certain extent. As for the difference of factor density, the technology content of technology-intensive manufacturing industry is relatively high, but its gap between the overall technology content and the domestic technology content is the largest among all the industries. This reflects the problem that technology-intensive manufacturing is highly dependent on intermediates and therefore has the lowest contribution to domestic technological progress.
Furthermore, using panel data from 18 manufacturing industries in China from 2000 to 2014, this paper empirically examines the impact of global value chain position on domestic technology content of manufacturing exports. The results show that the upgrading of the position of Chinese manufacturing industry in the global value chains can significantly improve the domestic technology content of manufacturing exports. In addition, the empirical study also finds that the use of traditional factors such as human capital can promote the domestic technology content of exports, while the expansion of export scale and the increase of industry concentration will hinder the improvement of domestic technology content of manufacturing exports. Other variables such as capital intensity and marketization did not show significant impact on export technology content.
Based on the above results, China should actively participate in global production and enhance the level of production technology in China by upgrading the position of global value chains. It is also necessary to create a positive environment for manufacturing enterprises to participate in the global production value chain, and provide external conditions for manufacturing enterprises to improve the division of labor in the industrial chain. Local enterprises should also be encouraged to further integrate into the international division of labor system, obtain effective technology spillovers through “learning by doing”, and gradually improve the domestic technology content of exports.
Additionally, we should increase the innovation and R&D investment in the development of manufacturing industry in our country, adjust the investment structure distribution mechanism of R&D in our country. At the same time, it is necessary to increase investment in basic R&D to improve R&D investment efficiency, and promote R&D investment and effective allocation of resources. In addition, multi-channel incubation centers should be established to promote the transformation of existing scientific research results. What is more indispensable is to stimulate the vitality of human capital and innovative talents to ensure the technological progress and international competitiveness of China’s manufacturing industry.
Moreover, enterprises should attach importance to the training of human resources, increase the intensity of staff training, encourage education, and introduce highly educated talents. In addition, we also need to learn the advanced production methods and management experience of foreign-funded enterprises, and obtain technological advancement through the technology spillover effects of foreign-funded enterprises. On this basis, we should actively explore and forge ahead, form Chinese-style innovation, actively develop our core technologies, and improve our core competitiveness.
Author Contributions
Conceptualization, J.P. and Y.-B.Z.; methodology, J.P. and Y.-B.Z.; validation, J.P.; formal analysis J.P..; data curation, J.P.; writing—original draft preparation, J.P.; writing—review and editing, J.P. and Y.-B.Z.; funding acquisition, Y.-B.Z. All authors have read and agreed to the published version of the manuscript.
Funding
This research received no external funding.
Acknowledgments
The authors are grateful to anonymous reviewers and editors for their comments and suggestions on this article.
Conflicts of Interest
The authors declare no conflict of interest.
References
- Dai, X.; Jin, B. Intra-product specialization, institution quality and export sophistication. Econ. Res. J. 2014, 7, 4–17. [Google Scholar]
- Lamy, P. ‘Made in China’ tells us little about global trade. Financ. Times 2011, 24, 11. [Google Scholar]
- Rodrik, D. What’s so special about China’s exports? Chin. World Econ. 2006, 14, 1–19. [Google Scholar] [CrossRef] [Green Version]
- Schott, P.K. The relative sophistication of Chinese exports. Econ. Policy 2008, 23, 5–49. [Google Scholar] [CrossRef]
- Chuan-Zhong, D.; Li, Z. Measuring upgrading and the domestic technological sophistication of China’s manufactured exports based on the perspective of vertical specialization. Chin. Ind. Econ. 2013, 52–64. [Google Scholar]
- Lin, L.; Bin, S. Global value chain and export domestic technological sophistication—An empirical study based on China’s manufacturing industry data. J. Int. Trade 2017, 3, 3–13. [Google Scholar]
- Xu, B. The sophistication of exports: Is China special? Chin. Econ. Rev. 2010, 21, 482–493. [Google Scholar] [CrossRef]
- Xiang, D.; Erzhen, Z. Does China’s export sophistication reach level in developed countries? J. Int. Trade 2011, 7, 3–16. [Google Scholar]
- Shujun, Z.; Penghui, Z. The domestic technical content of China’s manufacturing exports and its determinants. Stat. Res. 2013, 30, 58–66. [Google Scholar]
- Pavitt, K. Sectoral patterns of technical change: Towards a taxonomy and a theory. Res. Policy 1984, 13, 343–373. [Google Scholar] [CrossRef]
- Lall, S. The technological structure and performance of developing country manufactured exports, 1985–1998. Oxford Dev. Stud. 2000, 28, 337–369. [Google Scholar] [CrossRef] [Green Version]
- Ferrantino, M.J.; Koopman, R.; Wang, Z.; Yinug, F.; Chen, L.; Qu, F.J.; Wang, H.F. Classification and Statistical Reconciliation of Trade in Advanced Technology Products: The Case of China and the United States. SSRN Electron. J. 2008, 13, 78. [Google Scholar] [CrossRef] [Green Version]
- Michaely, M. Trade, Income Levels, and Dependence; Amsterdam: North-Holland, The Netherlands, 1984. [Google Scholar]
- Lall, S.; Weiss, J.; Zhang, J. The “sophistication” of exports: A new trade measure. World Dev. 2006, 34, 222–237. [Google Scholar] [CrossRef]
- Hausmann, R.; Hwang, J.; Rodrik, D. What you export matters. J. Econ. Growth 2007, 12, 1–25. [Google Scholar] [CrossRef]
- Gang, F.; Kwan, C.H.; Zhizhong, Y. Analyzing the foreign trade structure based on technologies of traded goods. Econ. Res. J. 2006, 8, 70–80. [Google Scholar]
- Xiuli, D.; Weiguo, W. Technology structures of China’s exports and their changes: 1980–2003. Econ. Res. J. 2007, 7, 137–151. [Google Scholar]
- Yang, Y.; Ye, Z. Upgrading the domestic technological contents of China’s exports:Evidence from jiangsu and guangdong provinces and China as a whole. Soc. Sci. Chin. 2008, 2, 67–82. [Google Scholar]
- Bin, Q.; Longfeng, Y.; Shaoqin, S. An empirical study on the impact of GPNs on China’s manufacturing industries’ upgrading in global value chains--An analysis from the perspective of ESI. Chin. Ind. Econ. 2012, 1, 57–67. [Google Scholar]
- Lin, L. Global value chain, institutional quality and technological contentof exports: An empirical analysis based on transnational panel data. J. Int. Trade 2015, 10, 37–47. [Google Scholar]
- Weilin, L.; Lanbing, L.; Yuhai, L. The impact of global value chain embeddedness on technological sophistication of China’s export. Chin. Ind. Econ. 2015, 10, 58–72. [Google Scholar]
- Yuyan, W.; Hanchuan, L.; Chen, L. The effect of global value chain embeddedness on technical progress--An empirical study on panel data of China’s industries. Chin. Ind. Econ. 2014, 9, 65–77. [Google Scholar]
- Hongfu, N. Dynamic changes to the technological content of China’s exports and an international comparison. Econ. Res. J. 2017, 1, 44–57. [Google Scholar]
- Lai, H.; Zhu, S.C. Technology, endowments, and the factor content of bilateral trade. J. Int. Econ. 2007, 71, 389–409. [Google Scholar] [CrossRef]
- Dazhong, C. Factor flow distortions embodied in China’s trade in value-added. Econ. Res. J. 2014, 9, 105–120. [Google Scholar]
- Dietzenbacher, E.; Los, B.; Stehrer, R.; Timmer, M.; Vries, G.D. The construction of world input-output tables in the wiod project. Econ. Syst. Res. 2013, 25, 71–98. [Google Scholar] [CrossRef]
- Wang, Z.; Wei, S.J.; Yu, X.; Zhu, K.F. Characterizing Global Value Chains: Production Length and Upstreamness. NBER Working Paper No. 23261. 2017. Available online: https://www.nber.org/papers/w23261 (accessed on 27 December 2019).
- Fally, T. Production Staging: Measurement and Facts; University of Colorado: Boulder, CO, USA, 2012. [Google Scholar]
- Antras, P.; Chor, D.; Fally, T.; Hillberry, R. Measuring the Upstreamness of Production and Trade Flows. Am. Econ. Rev. 2012, 102, 412–416. [Google Scholar] [CrossRef]
- Griliches, Z. Productivity, R&D, and the basic research at the firm level in the 1970’s. Am. Econ. Rev. 1986, 76, 141–154. [Google Scholar]
- Xiaoping, L.; Zhongdi, Z. International trade, R&D spillovers and productivity development. Econ. Res. J. 2006, 2, 31–43. [Google Scholar]
- Yifu, L.; Pengfei, Z. Appropriate technology, technology selection, and economic growth in developing countries. Chin. Econ. Q. 2006, 5, 985–1006. [Google Scholar]
Figure 1.
The export technology content of China’s manufacturing.


Table 1.
Technology content of Chinese manufacturing and other major economics.
| 2000 | 2008 | 2014 | 2000 | 2008 | 2014 | ||||||||||
|---|---|---|---|---|---|---|---|---|---|---|---|---|---|---|---|
| Indicator | Ranking | Indicator | Ranking | Indicator | Ranking | Indicator | Ranking | Indicator | Ranking | Indicator | Ranking | ||||
| USA | MTV | 1.438 | 6 | 0.894 | 12 | 1.009 | 6 | CHN | MTV | 0.433 | 34 | 0.475 | 33 | 0.524 | 32 |
| MTDV | 1.314 | 2 | 0.790 | 7 | 0.903 | 3 | MTDV | 0.254 | 31 | 0.312 | 30 | 0.409 | 22 | ||
| MDTC | 0.913 | 2 | 0.885 | 2 | 0.896 | 1 | MDTC | 0.592 | 25 | 0.657 | 21 | 0.781 | 9 | ||
| DEU | MTV | 1.415 | 7 | 1.244 | 2 | 1.242 | 2 | TWN | MTV | 1.041 | 15 | 0.586 | 29 | 0.629 | 29 |
| MTDV | 1.088 | 7 | 0.928 | 2 | 0.926 | 2 | MTDV | 0.514 | 22 | 0.259 | 34 | 0.317 | 30 | ||
| MDTC | 0.769 | 12 | 0.746 | 12 | 0.746 | 11 | MDTC | 0.494 | 35 | 0.443 | 36 | 0.505 | 35 | ||
| JPN | MTV | 2.014 | 3 | 0.893 | 13 | 0.937 | 12 | BRA | MTV | 0.549 | 31 | 0.499 | 32 | 0.391 | 37 |
| MTDV | 1.924 | 1 | 0.766 | 8 | 0.778 | 6 | MTDV | 0.427 | 25 | 0.405 | 23 | 0.307 | 31 | ||
| MDTC | 0.955 | 1 | 0.858 | 5 | 0.830 | 6 | MDTC | 0.776 | 9 | 0.811 | 6 | 0.785 | 8 | ||
| FRA | MTV | 1.388 | 8 | 1.146 | 5 | 0.991 | 8 | RUS | MTV | 0.205 | 43 | 0.237 | 39 | 0.312 | 39 |
| MTDV | 1.042 | 10 | 0.845 | 4 | 0.711 | 8 | MTDV | 0.159 | 38 | 0.215 | 37 | 0.277 | 33 | ||
| MDTC | 0.751 | 14 | 0.738 | 13 | 0.717 | 15 | MDTC | 0.775 | 10 | 0.906 | 1 | 0.887 | 3 | ||
| GBR | MTV | 1.673 | 13 | 0.867 | 16 | 0.709 | 24 | IND | MTV | 0.238 | 42 | 0.201 | 41 | 0.248 | 40 |
| MTDV | 0.934 | 10 | 0.650 | 14 | 0.536 | 17 | MTDV | 0.134 | 42 | 0.106 | 40 | 0.139 | 40 | ||
| MDTC | 0.800 | 6 | 0.750 | 10 | 0.755 | 10 | MDTC | 0.564 | 31 | 0.525 | 31 | 0.560 | 30 | ||
| KOR | MTV | 1.165 | 14 | 0.806 | 20 | 0.876 | 13 | ||||||||
| MTDV | 0.762 | 14 | 0.522 | 18 | 0.623 | 13 | |||||||||
| MDTC | 0.634 | 23 | 0.648 | 23 | 0.711 | 16 | |||||||||
Note: USA denotes United States, DEU denotes Germany, JPN denotes Japan, FRA denotes France, GBR denotes United Kingdom, KOR denotes Korea, CHN denotes China, TWN denotes Chinese Taiwan, RUS denotes Russia, and IND denotes India.
Table 2.
Industries classification and world input–output tables (WIOTs) sector.
| Labor-Intensive Manufacturing | Capital-Intensive Manufacturing | Tech-Intensive Manufacturing | |||
|---|---|---|---|---|---|
| WIOTs Code | Sector | WIOTs Code | Sector | WIOTs Code | Sector |
| r6 | Textiles, wearing apparel and leather | r5 | Food, beverages and tobacco | r11 | Chemicals and chemical products |
| r7 | Wood, articles of straw and plaiting materials | r8 | Paper and paper products | r12 | Basic pharmaceutical and pharmaceutical preparations |
| r22 | Furniture, other manufacturing | r9 | Printing and reproduction of recorded media | r17 | Computer, electronic and optical |
| r23 | Repair and installation of machinery and equipment | r10 | Coke and refined petroleum | r18 | Electrical equipment |
| r13 | Rubber and plastic | r19 | Machinery and equipment | ||
| r14 | Other non-metallic mineral | r20 | Motor vehicles, trailers and semi-trailers | ||
| r15 | Basic metals | r21 | Other transport equipment | ||
| r16 | Fabricated metal | ||||
Table 3.
Technology content of manufacturing industries.
| 2000 | 2002 | 2004 | 2006 | 2008 | 2010 | 2012 | Mean | ||
|---|---|---|---|---|---|---|---|---|---|
| Textiles, wearing apparel and leather | V | 0.505 | 0.480 | 0.453 | 0.448 | 0.463 | 0.506 | 0.510 | 0.487 |
| DV | 0.315 | 0.307 | 0.271 | 0.295 | 0.341 | 0.390 | 0.412 | 0.348 | |
| Wood, articles of straw and plaiting materials | V | 0.482 | 0.510 | 0.459 | 0.449 | 0.475 | 0.538 | 0.569 | 0.510 |
| DV | 0.347 | 0.391 | 0.327 | 0.325 | 0.367 | 0.428 | 0.471 | 0.396 | |
| Furniture, other manufacturing | V | 0.488 | 0.466 | 0.387 | 0.463 | 0.442 | 0.450 | 0.467 | 0.461 |
| DV | 0.351 | 0.350 | 0.258 | 0.351 | 0.340 | 0.349 | 0.377 | 0.353 | |
| Average of Labor-intensive Manufacturing | V | 0.491 | 0.485 | 0.433 | 0.454 | 0.460 | 0.498 | 0.515 | 0.486 |
| DV | 0.338 | 0.349 | 0.285 | 0.324 | 0.349 | 0.389 | 0.420 | 0.366 | |
| Food, beverages and tobacco | V | 0.438 | 0.444 | 0.423 | 0.418 | 0.472 | 0.534 | 0.567 | 0.483 |
| DV | 0.351 | 0.363 | 0.318 | 0.323 | 0.385 | 0.444 | 0.484 | 0.396 | |
| Paper and paper products | V | 0.561 | 0.588 | 0.535 | 0.507 | 0.527 | 0.574 | 0.576 | 0.557 |
| DV | 0.396 | 0.445 | 0.357 | 0.343 | 0.376 | 0.421 | 0.436 | 0.406 | |
| Printing and reproduction of recorded media | V | 0.536 | 0.566 | 0.521 | 0.492 | 0.511 | 0.563 | 0.564 | 0.542 |
| DV | 0.383 | 0.439 | 0.358 | 0.336 | 0.372 | 0.423 | 0.440 | 0.403 | |
| Coke and refined petroleum | V | 0.453 | 0.517 | 0.477 | 0.516 | 0.588 | 0.736 | 0.661 | 0.583 |
| DV | 0.329 | 0.381 | 0.314 | 0.349 | 0.426 | 0.554 | 0.482 | 0.424 | |
| Rubber and plastic | V | 0.536 | 0.548 | 0.538 | 0.531 | 0.550 | 0.595 | 0.580 | 0.560 |
| DV | 0.329 | 0.363 | 0.306 | 0.309 | 0.362 | 0.414 | 0.427 | 0.373 | |
| Other non-metallic mineral | V | 0.523 | 0.493 | 0.492 | 0.532 | 0.596 | 0.683 | 0.667 | 0.586 |
| DV | 0.381 | 0.369 | 0.341 | 0.390 | 0.466 | 0.549 | 0.545 | 0.455 | |
| Basic metals | V | 0.583 | 0.633 | 0.641 | 0.638 | 0.689 | 0.740 | 0.709 | 0.674 |
| DV | 0.408 | 0.487 | 0.464 | 0.471 | 0.533 | 0.574 | 0.554 | 0.514 | |
| Fabricated metal | V | 0.555 | 0.564 | 0.562 | 0.560 | 0.599 | 0.651 | 0.632 | 0.599 |
| DV | 0.357 | 0.403 | 0.373 | 0.391 | 0.447 | 0.495 | 0.495 | 0.439 | |
| Average of Capital-intensive Manufacturing | V | 0.523 | 0.544 | 0.524 | 0.524 | 0.566 | 0.634 | 0.619 | 0.573 |
| DV | 0.367 | 0.406 | 0.354 | 0.364 | 0.421 | 0.484 | 0.483 | 0.426 | |
| Chemicals and chemical products | V | 0.583 | 0.582 | 0.568 | 0.565 | 0.605 | 0.659 | 0.642 | 0.610 |
| DV | 0.381 | 0.400 | 0.348 | 0.361 | 0.426 | 0.480 | 0.480 | 0.426 | |
| Basic pharmaceutical and pharmaceutical preparations | V | 0.521 | 0.512 | 0.498 | 0.493 | 0.536 | 0.565 | 0.573 | 0.538 |
| DV | 0.400 | 0.407 | 0.367 | 0.367 | 0.423 | 0.458 | 0.476 | 0.427 | |
| Computer, electronic and optical | V | 0.703 | 0.669 | 0.659 | 0.623 | 0.641 | 0.653 | 0.625 | 0.649 |
| DV | 0.313 | 0.323 | 0.286 | 0.290 | 0.332 | 0.399 | 0.405 | 0.347 | |
| Electrical equipment | V | 0.583 | 0.570 | 0.585 | 0.577 | 0.607 | 0.644 | 0.619 | 0.604 |
| DV | 0.351 | 0.378 | 0.346 | 0.359 | 0.411 | 0.455 | 0.457 | 0.407 | |
| Machinery and equipment | V | 0.545 | 0.568 | 0.579 | 0.567 | 0.585 | 0.635 | 0.605 | 0.589 |
| DV | 0.348 | 0.398 | 0.363 | 0.370 | 0.405 | 0.458 | 0.454 | 0.411 | |
| Motor vehicles, trailers and semi-trailers | V | 0.564 | 0.606 | 0.602 | 0.596 | 0.630 | 0.744 | 0.702 | 0.647 |
| DV | 0.370 | 0.440 | 0.374 | 0.380 | 0.449 | 0.576 | 0.555 | 0.467 | |
| Other transport equipment | V | 0.587 | 0.609 | 0.599 | 0.600 | 0.633 | 0.726 | 0.691 | 0.645 |
| DV | 0.347 | 0.394 | 0.353 | 0.369 | 0.429 | 0.535 | 0.524 | 0.440 | |
| Average of Tech-intensive Manufacturing | V | 0.584 | 0.588 | 0.584 | 0.574 | 0.605 | 0.661 | 0.637 | 0.611 |
| DV | 0.359 | 0.391 | 0.348 | 0.357 | 0.411 | 0.480 | 0.479 | 0.418 | |
Table 4.
Descriptive statistics of major variables.
| Variable | Obs | Mean | Std.Dev. | Min | Max |
|---|---|---|---|---|---|
| DV | 270 | −0.901 | 0.179 | −1.353 | −0.502 |
| GVC | 270 | −0.084 | 0.234 | −0.669 | 0.420 |
| RD | 270 | −4.893 | 0.755 | −7.150 | −3.260 |
| HU | 270 | −3.842 | 0.818 | −6.410 | −2.197 |
| KL | 270 | −0.166 | 0.605 | −1.283 | 1.437 |
| EX | 270 | −2.094 | 0.879 | −4.643 | −0.432 |
| CON | 270 | −0.616 | 0.346 | −1.836 | −0.090 |
| MA | 270 | −1.877 | 0.963 | −4.335 | −0.095 |
Table 5.
The estimation results.
| (1) | (2) | (3) | (4) | (5) | (6) | (7) | |
|---|---|---|---|---|---|---|---|
| L.DV | 0.119 * | 0.131 ** | 0.400 *** | 0.281 ** | 0.384 *** | 0.316 ** | 0.300 ** |
| (0.070) | (0.066) | (0.110) | (0.112) | (0.135) | (0.129) | (0.124) | |
| GVC | 1.102 ** | 1.122 ** | 0.836 * | 0.701 ** | 0.560 | 0.756 ** | 0.725 * |
| (0.548) | (0.483) | (0.503) | (0.329) | (0.362) | (0.374) | (0.427) | |
| RD | −0.523 *** | −0.539 *** | −0.542 *** | −0.309 ** | −0.323 ** | −0.238 *** | −0.257 * |
| (0.056) | (0.102) | (0.091) | (0.121) | (0.141) | (0.091) | (0.135) | |
| HU | 0.421 *** | 0.442 *** | 0.439 *** | 0.248 ** | 0.313 ** | 0.216 *** | 0.224 ** |
| (0.051) | (0.101) | (0.088) | (0.103) | (0.123) | (0.075) | (0.101) | |
| KL | −0.068 | −0.133 | −0.150 | −0.321 | −0.123 | −0.146 | |
| (0.223) | (0.198) | (0.187) | (0.208) | (0.102) | (0.143) | ||
| L.RD | 0.172 *** | 0.150 *** | 0.147 *** | 0.117 *** | 0.119 *** | ||
| (0.032) | (0.034) | (0.044) | (0.032) | (0.038) | |||
| EX | −0.268 *** | −0.258 *** | −0.219 *** | −0.231 *** | |||
| (0.099) | (0.094) | (0.081) | (0.082) | ||||
| CON | −0.395 *** | −0.393 *** | −0.392 *** | ||||
| (0.142) | (0.127) | (0.133) | |||||
| MA | −0.066 | −0.077 | |||||
| (0.070) | (0.057) | ||||||
| GVC*RD | 0.457 | ||||||
| (0.843) | |||||||
| Observations | 234 | 234 | 234 | 234 | 234 | 234 | 234 |
| AR(1) test(P) | 0.215 | 0.267 | 0.076 | 0.132 | 0.211 | 0.367 | 0.260 |
| AR(2) test(P) | 0.523 | 0.603 | 0.230 | 0.346 | 0.771 | 0.930 | 0.642 |
| Hansen test(P) | 0.166 | 0.167 | 0.165 | 0.113 | 0.132 | 0.175 | 0.108 |
Note: Robust standard errors are in parentheses. *, ** and *** indicate significance at the 10%, 5%, and 1% levels, respectively.
© 2020 by the authors. Licensee MDPI, Basel, Switzerland. This article is an open access article distributed under the terms and conditions of the Creative Commons Attribution (CC BY) license (http://creativecommons.org/licenses/by/4.0/).
Share and Cite
MDPI and ACS Style
Peng, J.; Zhang, Y. Impact of Global Value Chains on Export Technology Content of China’s Manufacturing Industry. Sustainability 2020, 12, 432. https://0-doi-org.brum.beds.ac.uk/10.3390/su12010432
AMA Style
Peng J, Zhang Y. Impact of Global Value Chains on Export Technology Content of China’s Manufacturing Industry. Sustainability. 2020; 12(1):432. https://0-doi-org.brum.beds.ac.uk/10.3390/su12010432
Chicago/Turabian StylePeng, Jing, and Yabin Zhang. 2020. "Impact of Global Value Chains on Export Technology Content of China’s Manufacturing Industry" Sustainability 12, no. 1: 432. https://0-doi-org.brum.beds.ac.uk/10.3390/su12010432
Note that from the first issue of 2016, this journal uses article numbers instead of page numbers. See further details here.