Evaluation of the Efficiency of Sustainable Development Policy Implementation in Selected EU Member States Using DEA. The Ecological Dimension


Department of Econometrics, Institute of Informatics and Quantitative Economics, Poznań University of Economics and Business, 61-875 Poznań, Poland
Sustainability 2020, 12(1), 435; https://0-doi-org.brum.beds.ac.uk/10.3390/su12010435
Submission received: 4 December 2019
/
Revised: 28 December 2019
/
Accepted: 3 January 2020
/
Published: 6 January 2020
(This article belongs to the Section Economic and Business Aspects of Sustainability)
Abstract
:Since the ‘Earth Summit’ in 1992 in Rio de Janeiro, the concept of sustainable development has been widely discussed and implemented globally. This paper proposes a quantitative tool, Data Envelopment Analysis (DEA), that can support decision makers in assessing the efficiency of implementation of the sustainable development policy. The example of such analysis is presented by assessing the efficiency of implementation of the sustainable development policy of twenty two European Union Member States in 2005–2015. DEA (and more specifically the Slack-Based Measure) showed an improvement in the efficiency of most of the Member States in 2015 as compared to the results achieved in 2005. This outcome sent a positive and motivating signal for the continuation of activities in the area of sustainable development implementation. The method used in the study also has determined the weak areas that still exist in inefficient countries and indicated the action that should be taken to improve their efficiency. DEA enables an objective comparison of the results measured using this method and may therefore be considered by EU Member States as well as other organizations, including local governments responsible for the implementation of a sustainable development policy as a useful tool facilitating an objective assessment of the effects of their work.
1. Introduction
The intense human impact on our planet and the resulting negative effects on the environment that were increasingly observed in the 1970s led countries affiliated with the United Nations to take action to protect the Earth.
The United Nations Conference on the human environment held in Stockholm in 1972 initiated the United Nations Environment Programme (UNEP) whose aim was to carry out activities for the protection and monitoring of the environment. In 1973, the European Community announced the first European program of action for environmental protection.
Established by the UN, the World Commission on Environment and Development (WCED) released in 1987 a report titled Our Common Future, known as the ‘Brundtland Report,’ after Gro Harlem Brundtland, the Committee Chair. The report contained the concept of sustainable development and initiated the organization of a conference in Rio de Janeiro in 1992. This was The United Nations Conference on Environment and Development (UNCED), known as the ‘Earth Summit.’ At the summit, the international community announced that sustainable development was going to be the new motto for humanity. The result of the conference was, among others, ‘Agenda 21’—a document that defined the sustainable development program for countries participating in the conference.
Since then, more and more attention has been paid to the concept of sustainable development, as evidenced by the number of conferences that take place every year all over the world (e.g., the recent crucial one—the United Nations Sustainable Development Summit in New York in September 2015). Also, many entities and organizations have placed the idea of sustainable development in their most important normative acts, among them the Treaty Establishing the European Union.
The definition of sustainable development has evolved over time. According to the Brundtland Commission [1]: ‘Sustainable development is development that meets the needs of the present without compromising the ability of future generations to meet their own needs.’ This definition is still valid and invoked, but recently the economic and socio-cultural dimension has also been highlighted [2] (p. 26). The current definition of sustainable development, according to new environmental economics, states that sustainable development aims to ensure that all people living today as well as the future generations enjoy sufficiently high ecological, economic and socio-cultural standards within the limits of the Earth’s natural endurance (also known as the limits of the ecosystem capacity), applying the principle of justice between and within generations [2] (p. 44). This definition emphasizes that sustainable development is not only a concern regarding ecological aspects but also the economic and socio-cultural ones, and all of this must be done within the tolerance of nature.
Holling [3] (p. 399) made an interesting observation that, as it seems, there may be a contrast between the words ‘sustainable’ and ‘development’ and then clarified the meaning of the term sustainable development: ‘Sustainability is the capacity to create, test, and maintain adaptive capability. Development is the process of creating, testing, and maintaining opportunity.’ It means that the phrase ‘sustainable development’ refers to the goal of supporting adaptation abilities and building opportunities. Holling [3] (p. 399) therefore concluded that the term sustainable development is ‘not an oxymoron but a term that describes a logical partnership’.
The policy of sustainable development is being carried out or implemented by many developed and developing countries. During the United Nations Sustainable Development Summit in New York in September 2015, associated countries adopted the ‘2030 Agenda for Sustainable Development’ that has 17 goals on the list to which the countries have committed to strive until the year 2030. These goals cover the three dimensions of sustainable development mentioned above (ecological, economic and socio-cultural).
The EU and its Member States are also aiming at transforming their economies to ensure that they are developing in a sustainable way. The European Union coordinates the implementation of internationally agreed development goals by conducting special development programs. Currently, the European Union is implementing the ‘Europe 2020’ program (launched in 2010), which is the EU’s growth strategy for the decade 2010–2020 (the strategy is described in detail in [4]). Recently, the European Union has also declared actions aimed at implementing the 17 goals indicated in the above-mentioned ‘Agenda 2030’.
It should, however, be noted that Quaddus and Siddique [5] (p. 4) pointed out a huge discrepancy between the delineation of the objectives to be achieved by individual countries and the real action directed at achieving them (and checking the level of achievement of these goals). The authors called this a gap between theory and reality, and suggested that it was due to the fact that the definitions of sustainable development are too general. In the paper, a need for a more accurate approach to planning sustainable development paths and their modeling is proposed, since modeling brings about objectivity [5] (p. 5). Consequently, quantitative tools can be helpful as they allow maintaining objectivity. These tools can support the decision-makers of the EU countries in planning strategies of implementing the goals set by the European Union. Obviously, they should also facilitate objective assessments of the current state of the implementation of the goals set for individual country, and further identification of the actions that should be taken to achieve them.
The aim of the paper is to propose the use of Data Envelopment Analysis (DEA) in assessing the efficiency with which EU countries implement the principles of sustainable development in the ecological dimension and to indicate the pathways for inefficient countries to help them improve their efficiency. The application of DEA allows an objective comparison of countries, so it may be a response to the need for modeling as indicated by Quaddus and Siddique [5] and a significant support for the decision making process.
Literature Review
In the very extensive literature on sustainable development, there are relatively few publications that have used Data Envelopment Analysis. Emrouznejad and Yang [6] carried out a large literature review and indicate only 151 articles published in journals between 1978 and 2016 associated simultaneously with DEA and sustainable development. Zhou et al. [7], in turn, listed 320 articles published between 1996 and 2016 that cover the use of DEA in various subject areas including corporate sustainability assessment, sustainability composite indicators construction, sustainability performance analysis, and regional sustainability development assessment.
Research that applies DEA in sustainable development measurements is in the vast majority related to sustainable development in a selected and narrow field, e.g., eco-efficiency evaluation of electric utility plants [8], energy-efficiency evaluation of selected countries [9,10] or employment-efficiency in terms of the three dimensions of sustainable development [11]. DEA is also applied to assess the sustainability of cities or urban regions [12,13,14] or the sustainable agriculture in selected countries and agricultural regions [15,16,17], to assess the sustainability of industrial parks [18] or the sustainable performance of the real estate industry [19]. Moreover, DEA proves to be helpful in evaluating the sustainability of the production of biofuels [20] or even the sustainability of products, such as the construction materials [21].
In the literature, there is a lack of in-depth analysis that comprehensively incorporates the dimensions of sustainable development. There are reports on research that combines in one study elements from various dimensions of sustainable development, for example from the ecological and economic [22,23], or that cover simultaneously all three dimensions of sustainable development for a selected group of countries [24,25]. However, with such a wide approach (estimation of the efficiency in all three dimensions measured by DEA) it is not possible to characterize each dimension of sustainable development with a large number of indicators (due to the limited discriminatory power of DEA). Research divided into sub-studies strictly related to a given dimension (as assumed in this paper) allows to use of a larger number of indicators and hence a more thorough look at the implementation of the sustainable development policy within a given dimension.
2. Materials and Methods
Data Envelopment Analysis (DEA) was used to evaluate the efficiency of implementing the sustainable development policy in selected EU countries. DEA is a nonparametric method proposed by Charnes et al. [26] for evaluating the efficiency of the input to output conversion of a given unit called a decision-making unit (DMU). The evaluation of the DMU’s efficiency is carried out by measuring the distance of this unit from the efficiency frontier created on the basis of the best (i.e., efficient) units in the group, serving as benchmarks.
Currently, there are a number of more or less sophisticated models that allow efficiency evaluations of various DMUs, hiding under the name ‘DEA’. In the study presented here, a non-radial input-oriented SBM model with super-efficiency was used [27] (p. 316):
subject to:
where:
- n—number of DMUs
- j—the index of n DMUs,
- m—number of inputs
- i—the index of m inputs,
- s—number of outputs
- r—the index of s outputs,
- —SBM super-efficiency score of o-th unit (DMU under evaluation is denoted by the subscript ’o‘, DMUo), can take values from 0 to 1.0 (1.0 means that a given DMU is considered efficient) or above 1.0 (for a super-efficient DMU)
- —i-th input of j-th DMU (j = 1, …, n)
- —r-th output of j-th DMU (j = 1, …, n)
- —percentage reduction of i-th input required in order to improve the efficiency of an inefficient DMUo, i.e., results from the average of recommended input reductions
- —intensity factor designated for the analyzed DMUo related to the j-th DMU (j = 1, …, n); a weighted (by intensity factors ) sum of i-th inputs of all DMUs that are benchmarks for the ineffcient DMUo is called a projection, i.e., it indicates the recommended value of i-th input at which DMUo becomes efficient.
This model belongs to the group of SBM (Slack-Based Measure) models which measure the distance of a given unit from the efficiency frontier in a non-radial way, as opposed to the basic DEA models (CCR and BCC) which measure this distance in a radial way. A non-radial measurement of the DMU’s distance from the efficiency frontier can assess its efficiency more accurately (and assess the source of this efficiency more precisely.) This is because it does not force a proportional reduction of all inputs (for the input-oriented model) or the proportional increase of all outputs (the output-oriented model), which in turn eliminates the risk of weak efficiency—for more details concerning the concept of weak efficiency, see, e.g., [27] (p. 57). For this reason, the SBM-type model was used in this study.
The SBM model used in the study indicates the paths of improving the efficiency of inefficient DMUs (here: the countries). SBM models can be input-oriented, output-oriented or non-oriented. The input-oriented model indicates how much a given DMU (a country) should reduce its inputs (without changing the outputs) to become efficient. In turn, the output-oriented model indicates how much a given country should increase its outputs (without changing inputs) to become efficient. Here, an input-oriented model was selected because the purpose of the study was to obtain guidelines that would help inefficient countries improve their efficiency. In other words, the aim was to identify pathways of efficiency improvement. The variables used to describe the countries were divided into inputs and outputs (such a division is necessary for assessing the units’ efficiency using DEA). Due to the variables (inputs and outputs) describing the countries in this study, the input-oriented model was adopted as it would be easier for a given country to reduce its inputs than to increase its outputs. As can be seen below, the inputs adopted in the study are variables, the value of which can be more easily influenced by a given country. On the other hand, outputs describing countries are variables on which a given country has much less impact. According to the control theory, inputs adopted in the study served as control variables and the outputs served as controlled variables. According to Bubnicki [28] (p. 4), the control is a purposeful interaction (or a goal-oriented action) involving a certain object, the activity of which is affected by the subject taking the action. The object is called the controlled entity (here: a country) and the subject is called the controller (here these are the appropriate variables by which a country can follow the indicated path of efficiency improvement). The control consists in the use of control (or controlling) variables that may be changed and which have an impact on the controlled variables describing the condition of the controlled entity.
The overriding aim was therefore to build such a model that would indicate to inefficient countries the most realizable (i.e., feasible) paths to improve their efficiency.
The decision to use a model with super-efficiency was dictated by the fact that models without super-efficiency do not allow to discriminate the efficient DMUs (i.e., the efficiency scores are equal to 1.0 for all efficient units). In the case of super-efficiency models, the efficient DMU can achieve efficiency scores greater than 1.0. Efficiency scores that exceed 1.0 are obtained by DMUs that are efficient and additionally have a certain ‘reserve’ of inputs or outputs which means that even if they deteriorated their outputs to inputs ratio (within this ‘reserve’ of course) they would still be efficient. If a DMU with efficiency score equal to 1.0 deteriorated its relation between outputs and inputs, it would no longer be efficient (its efficiency score would become lower than 1.0).
To complete this study, the Malmquist index was calculated for each country in order to analyze the changes in efficiency over time. The Malmquist productivity change index was developed by Caves et al. [29] inspired by Malmquist [30] to whom Caves et al. [29] referred (in their paper) and after whom they named it. The links to DEA were made by Fare et al. [31].
The Malmquist index consists of the Catch-up effect and the Frontier-shift effect [27] (p. 330):
where:
and indicate the analyzed DMUo (i.e., the analyzed country) in period t and t+1, respectively.
The catch-up term relates to the degree to which a DMU improves (or worsens) its efficiency (this effect is sometimes called a recovery), while the frontier-shift term reflects the change in the efficient frontiers between two time periods (this effect is called an innovation).
3. Results and Discussion
The results presented below refer to the first part of the research which will eventually cover all three of the above-mentioned dimensions of sustainable development: ecological, economic and socio-cultural. This study analyzes the SBM-efficiency of the implementation of the sustainable development policy in the ecological dimension in 22 European Union countries in years 2005, 2010 and 2015 (5-year intervals were chosen because most of the variables adopted in the study did not change rapidly from year to year). The Malmquist index was calculated for the following periods: t = 2005 and t + 1 = 2015.
Data gaps were the reason for not covering all EU countries. Where possible, missing values were estimated: interpolation was used when sufficiently long time series were available, and if data were available only for the year preceding or following the analyzed year, the available value was taken as the best approximation of the missing one. In other cases, the countries were not taken into account (sufficient data were not available for Croatia, Cyprus, France, Italy, Latvia and Malta).
Due to the relative nature of DEA results, the study was conducted separately for each year.
DMUs (EU countries) were described by eight variables: 4 inputs (xi) and 4 outputs (yr), as shown in Table 1. The inputs and outputs were selected following the recommendations of the European Commission [32] based mainly on Sustainable Development Indicators (SDIs, available in the Eurostat database) that cover 17 goals indicated by UN in ‘2030 Agenda for Sustainable Development’. The variables that best reflected the implementation of the policy of sustainable development in the ecological dimension were used. Due to the data gaps, only selected variables related to the ecological dimension were used.
It should be noted that y1, y2 and y4 were undesirable outputs and for this reason their values were transformed in such a way that the higher value of the transformed output means the lower value of the original output. For example an output y4: PM2.5 is calculated as ’35—Mean population exposure to air pollutant PM2.5‘ where 35 µg/m3 is the Interim target-1 defined by WHO as a level that has been shown to be associated with significant mortality in the developed world [33] (p. 11). Although the problem of presence of undesirable outputs is not just a matter of assessing ecological efficiency, it is particularly important in such studies because undesirable outputs occur very often then. The description and proper approach to this issue is comprehensively discussed in [34,35].
3.1. SBM-Efficiency of EU Countries in 2005, 2010 and 2015
According to the proposed methodology, the study was conducted separately for each of the studied periods (2005, 2010 and 2015). Table 2 shows the results of the efficiency analysis of 22 EU countries (called in the study a country, a unit or a DMU). Each country presented in Table 2 has a ranking position according to the efficiency score obtained separately in each of the studied periods. The result obtained by each country indicates to what extent a country is efficient. The efficiency score that is equal to 1.0 means efficiency, lower than 1.0 means inefficiency and if exceeds 1.0 it means super-efficiency of the DMU.
All three studies demonstrated a similar number of efficient countries (efficiency scores equal or greater than 1.0)—nine in 2005 and eight both in 2010 and 2015.
It should be noted, however, that the efficiency score of each DMU was obtained in relation to other countries in the same year (more precisely—in relation to the reference units, i.e., benchmarks, established for a given DMU). The evaluation of efficiency would be different with different units (benchmarks) on the basis of which the ranking was built. Therefore, the efficiency analysis should rather address the ranking position than the efficiency score itself.
When comparing the results, quite a broad convergence in the rankings can be observed for each country in 2005, 2010 and 2015. Yet, several objects significantly changed their ranking positions, e.g., Greece showed a growth and a transition from inefficient in 2005 and 2010 to efficient in 2015, the Netherlands—a decrease in efficiency and a loss of efficiency status in 2015 or Portugal—a considerable increase in the ranking position in 2010 and 2015.
The efficiency scores obtained by Sweden and the United Kingdom are also noteworthy since they indicate a significant advantage over other countries in the study. Both countries were found super-efficient in all three analyzed years. In the case of Sweden, its high efficiency is mainly due to the highest share of energy from renewable sources (the lowest value of the input ‘Share_nonrenewable_energy’ in each year) compared to the other countries. Sweden was also characterized by the highest value of the output ‘Clean_energy’ (which is the quotient of primary energy consumption and greenhouse gas emissions) and the lowest degree of air pollution with PM2.5 particles (the highest value of the output ‘PM2.5’) in 2005, 2010 and 2015. As for the United Kingdom, its super-efficiency is primarily the result of the input ‘Popul_unconnect_watertreatment’ (the percentage of the population that is not connected to advanced wastewater treatment systems) which had the lowest value compared to other countries in all three analyzed years.
Moreover, the results of the efficiency analysis show an interesting geographical distribution. Table 3 presents average efficiency scores for each year, taking into account the geographical location of the countries.
Highly developed countries from Northern and Western Europe are the most efficient countries. There is, however, one exception, Slovenia, which reached a high third place in the rankings. The average efficiency in both groups of countries exceeds 1.0 in each of the analyzed years. These are the countries in which great importance is attached to the protection of the environment. The inefficient countries are usually those of Central and Eastern Europe (the probable reason is the lower level of wealth of these countries), the exceptions being Belgium and Ireland whose outputs to inputs ratio turns out to be poorer compared to the efficient countries.
The results presented in Table 2 and Table 3 also seem to indicate a very desirable tendency of the efficiency increasing over time. However, the comparison of the scores over the analyzed years should be made with prudence because of the relativity of DEA-efficiency. A lower efficiency of a given DMU in 2015 compared to, e.g., 2005 may result from a real deterioration of its outputs to inputs ratio, but may also result from a shift in the efficiency frontier thus from improving the efficiency of the DMUs forming this frontier (i.e., benchmarks or reference set in DEA terminology).
To confirm this apparent efficiency improvement over time, the Malmquist index for the period between 2005 and 2015 was calculated for each country. The results are provided in Table 4.
The Malmquist Index (MI) as a product of the Catch-up and Frontier-shift effects shows changes in the total productivity of a DMU between period t and t + 1. MI > 1 indicates a progress, while MI = 1 and MI < 1 indicate no change and a regress, respectively.
The Catch-up effect shows changes in the relative efficiency of a DMU between period t and t + 1. Catch-up > 1 means progress in relative SBM-efficiency, while Catch-up = 1 and Catch-up < 1 mean the status quo and a regress, respectively. The Frontier-shift effect in turn indicates changes in the frontier technology around this DMU between period t and t+1. Frontier-shift > 1 means a progress in the frontier technology (i.e., shifting up the frontier), while Frontier-shift = 1 and Frontier-shift < 1 mean no change and a regress, respectively.
The Malmquist index values presented in Table 4 indicate an increase in efficiency in 20 out of 22 countries that could be observed in the period between t = 2005 and t + 1 = 2015. Only Germany and Spain showed deteriorated total productivity during this period (MI < 1), although it should be noted that Germany remained an efficient country. Moreover, significant progress in the frontier technology (Frontier-shift effect > 1) was observed in all 22 countries. These results are promising and mean that almost all analyzed countries implement, to a higher or lesser degree, a sustainable development policy recommended by the United Nations and the European Commission.
A Catch-up effect of less than 1.0 observed only for 8 countries means a regress in the relative SBM-efficiency of these units. It may indicate a deterioration of the outputs to inputs ratio of these countries or a situation in which this ratio has not changed but other DMUs in the group, and particularly the benchmarks that form the efficiency frontier have improved their efficiency. The latter case means moving the efficiency frontier up (i.e., a frontier shift) and the Frontier-shift effect values > 1 (see Table 4) seem to confirm this finding. An in-depth analysis of the raw data describing these eight countries reveals that both inputs and outputs did not deteriorate significantly between 2005 and 2015. Only in the case of Spain the outputs to inputs ratio deteriorated considerably. The level of non-afforestation in Spain significantly increased between 2005 and 2015 (input ‘Non_forest’ increased from 44.2% in 2005 to 60.8% in 2015) which seems to be the main reason for the decrease in its efficiency score.
The Malmquist index MI = 3.65 for the United Kingdom is also noteworthy. The values for both the Catch-up and Frontier-shift effects are exceptionally high (2.07 and 1.76, respectively) and indicate a considerable improvement in its efficiency. As previously mentioned, the United Kingdom is the country with the lowest level of the population that is not connected to advanced wastewater treatment systems (input x2). Furthermore, between 2005 and 2015 it reduced the level of input ‘Share_nonrenewable_energy’ by almost 20 percentage points (from 95.9% to 77.7%). This gave it the prevailing position in all three rankings. The question arises whether the United Kingdom will maintain such an extraordinary progress after the announced exit from the European Union.
3.2. Analysis of the Sources of Super-Efficiency and Inefficiency
For countries with an efficiency score exceeding 1.0, a super-efficiency analysis can be performed. A closer look at the efficiency of a given country may highlight those factors, the deterioration of which does not result in a loss of the efficiency status. For inefficient countries, in turn, it may identify areas in which improvement can lead to efficiency.
Such an analysis of the sources of super-efficiency and inefficiency provides detailed guidance on how to improve the efficiency of implementing the sustainable development policy and thus enables a faster way to achieve efficiency by inefficient objects. Because such analyses are generally quite similar for each DMU, a sample analysis for selected countries will be presented below. Each country belongs to a different geographical group and has different characteristics and efficiency scores. The analysis of the sources of super-efficiency and inefficiency is illustrated in detail for three selected countries: Poland, Portugal (inefficient countries) and the United Kingdom (a super-efficient country). The results of the entire analysis of the sources of super-efficiency and inefficiency are included in the Appendix B.
Figure 1, Figure 2 and Figure 3 (each for a different year analyzed) contain the suggested changes of the input and/or output values in order to achieve efficiency or, if the country is efficient, the figures show (for a given input or output) the surplus (the aforementioned ‘reserve’) over the value of the variable that is needed to obtain the status of an efficient object (e.g., a surplus in a given input means that even if a country has increased this input value, it will retain its status of an efficiency country). Each country is characterized by eight variables listed in Table 1 which are illustrated by four columns of inputs and four columns of outputs.
The columns illustrate the changes (expressed as a percentage) in the inputs and outputs. A positive value of the input column indicates a possible increase in the input without losing the status of an efficient unit (hence positive values of the input columns relate only to super-efficient countries). A negative value of the input column indicates the required reduction of the input in order to gain the status of an efficient object (hence the negative values of the input columns relate only to inefficient countries).
The interpretation is reversed for the output columns. A positive value indicates the required increase of the output by which a country achieves the efficiency status. For the efficient countries (because of the model’s input orientation), the output changes are always equal to zero.
It is important to note that an inefficient country needs to reduce all inputs for which the method implies a change in order to become efficient (assuming that all its outputs do not change). It is not enough to improve the value of only one input. On the other hand, it is enough for an efficient (or super-efficient) unit to exceed the range of changes in one area (relative to one input) to lose its status of being efficient.
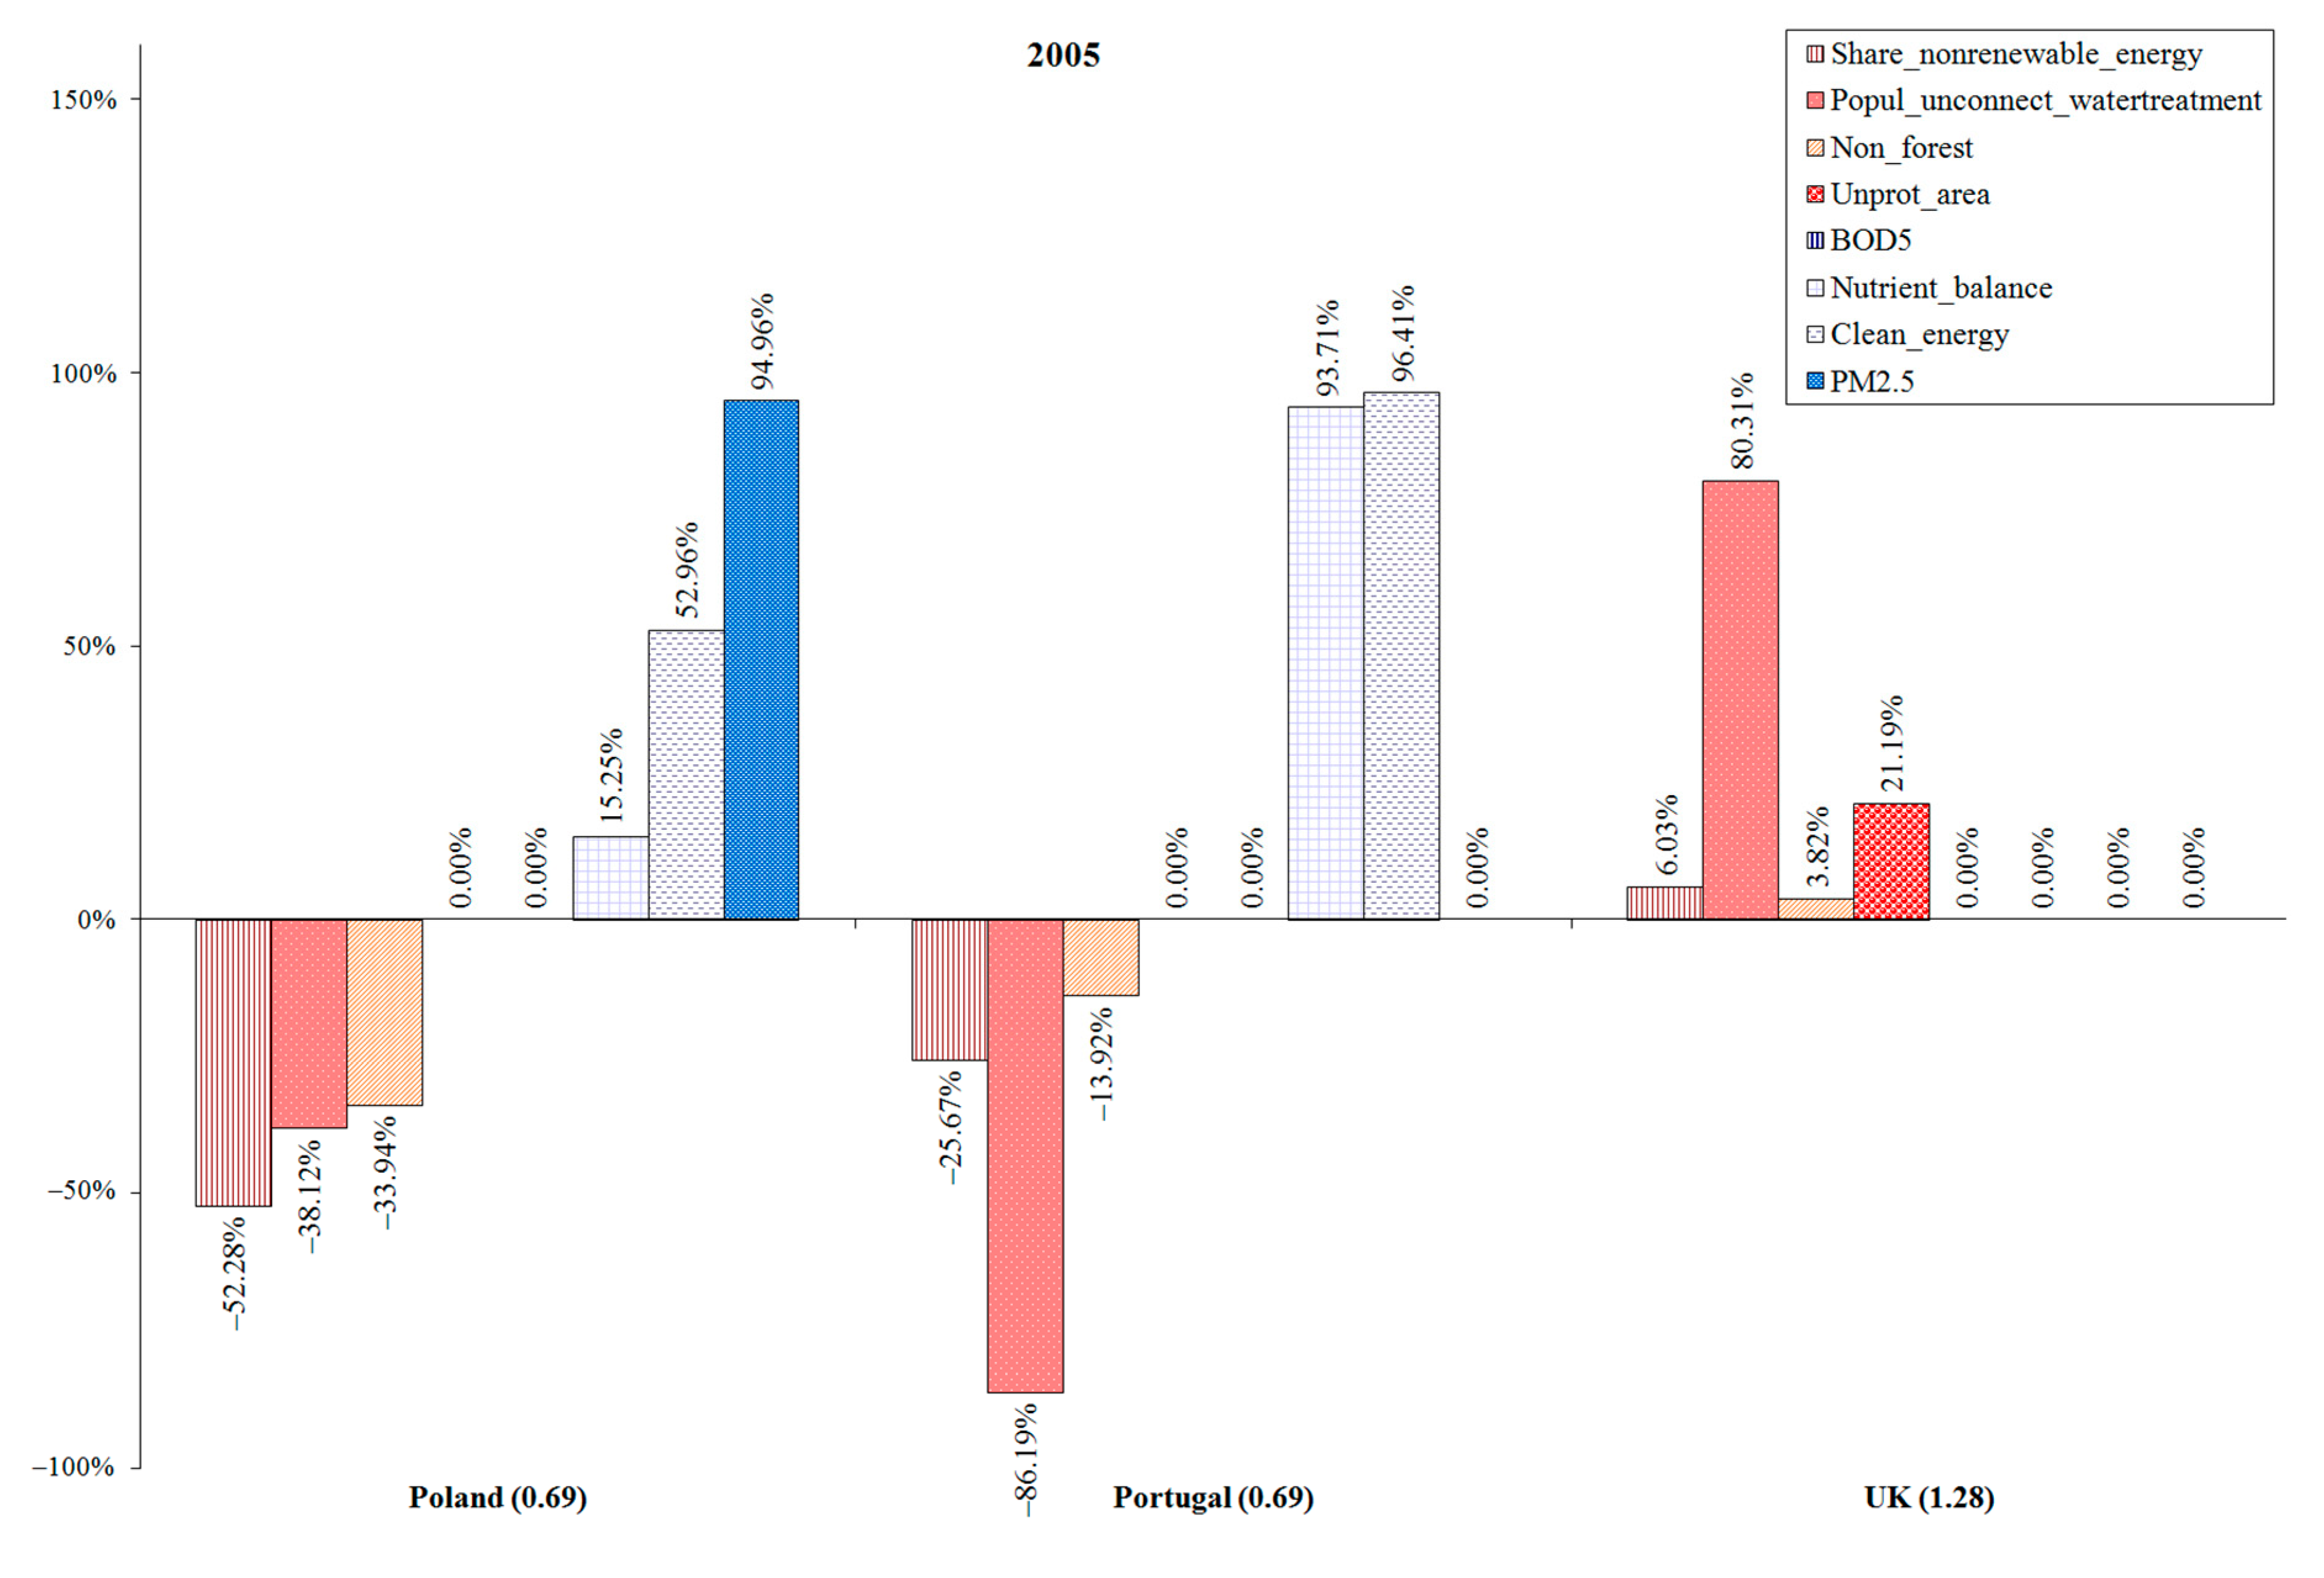
Figure 1 illustrates the results of the analysis of the sources of super-efficiency and inefficiency in 2005 for the selected three countries.
The numbers in brackets that stand next to the name of each country in Figure 1 are the efficiency scores obtained by these countries in 2005 (see Table 2).
In 2005, the United Kingdom was an efficient country. For this reason, as mentioned earlier, the suggested output changes equal zero. The high value of the ‘Popul_unconnect_watertreatment’ indicates that the country has a high “reserve” of this input which means that even if this input was 80.31% larger in 2005 the United Kingdom would still remain on the efficiency frontier (assuming that all other variables would not change).
In the case of Poland’s and Portugal’s inputs, the first four columns indicate the recommended reduction in inputs in order to achieve efficiency, e.g., the input ‘Share_nonrenewable_energy’ in the case of Poland should be 52.28% lower and in the case of Portugal 25.67% lower. Thus, these two countries should, among other things, increase the percentage of electricity generated by renewable sources in relation to the total use of electricity. Then Poland and Portugal could be assessed as efficient in this group of countries in 2005 (assuming that all their outputs do not change).
The suggested changes in the outputs are illustrated by the last four columns in Figure 2. For Poland, high values for outputs ‘Clean_energy’ and ‘PM2.5’ are visible. This means that in these areas the country is very far from the efficiency frontier and requires a significant increase in the outputs. In order to become efficient, Poland should improve the relation between energy consumption and greenhouse gas emissions (output ‘Clean_energy’) by 53% and increase the output ‘PM2.5’ by 95% (which means a serious reduction of air pollutant PM2.5 from 26 to 17.5 µg/m3).
As regards Portugal, an increase by more than 90% in outputs ‘Nutrient balance’ and ‘Clean_energy’ is recommended to improve efficiency. It is worth noting that the output ‘Nutrient balance’ for Portugal in 2005 was poor in comparison with other countries. Only the Netherlands and Lithuania recorded worse values of this factor.
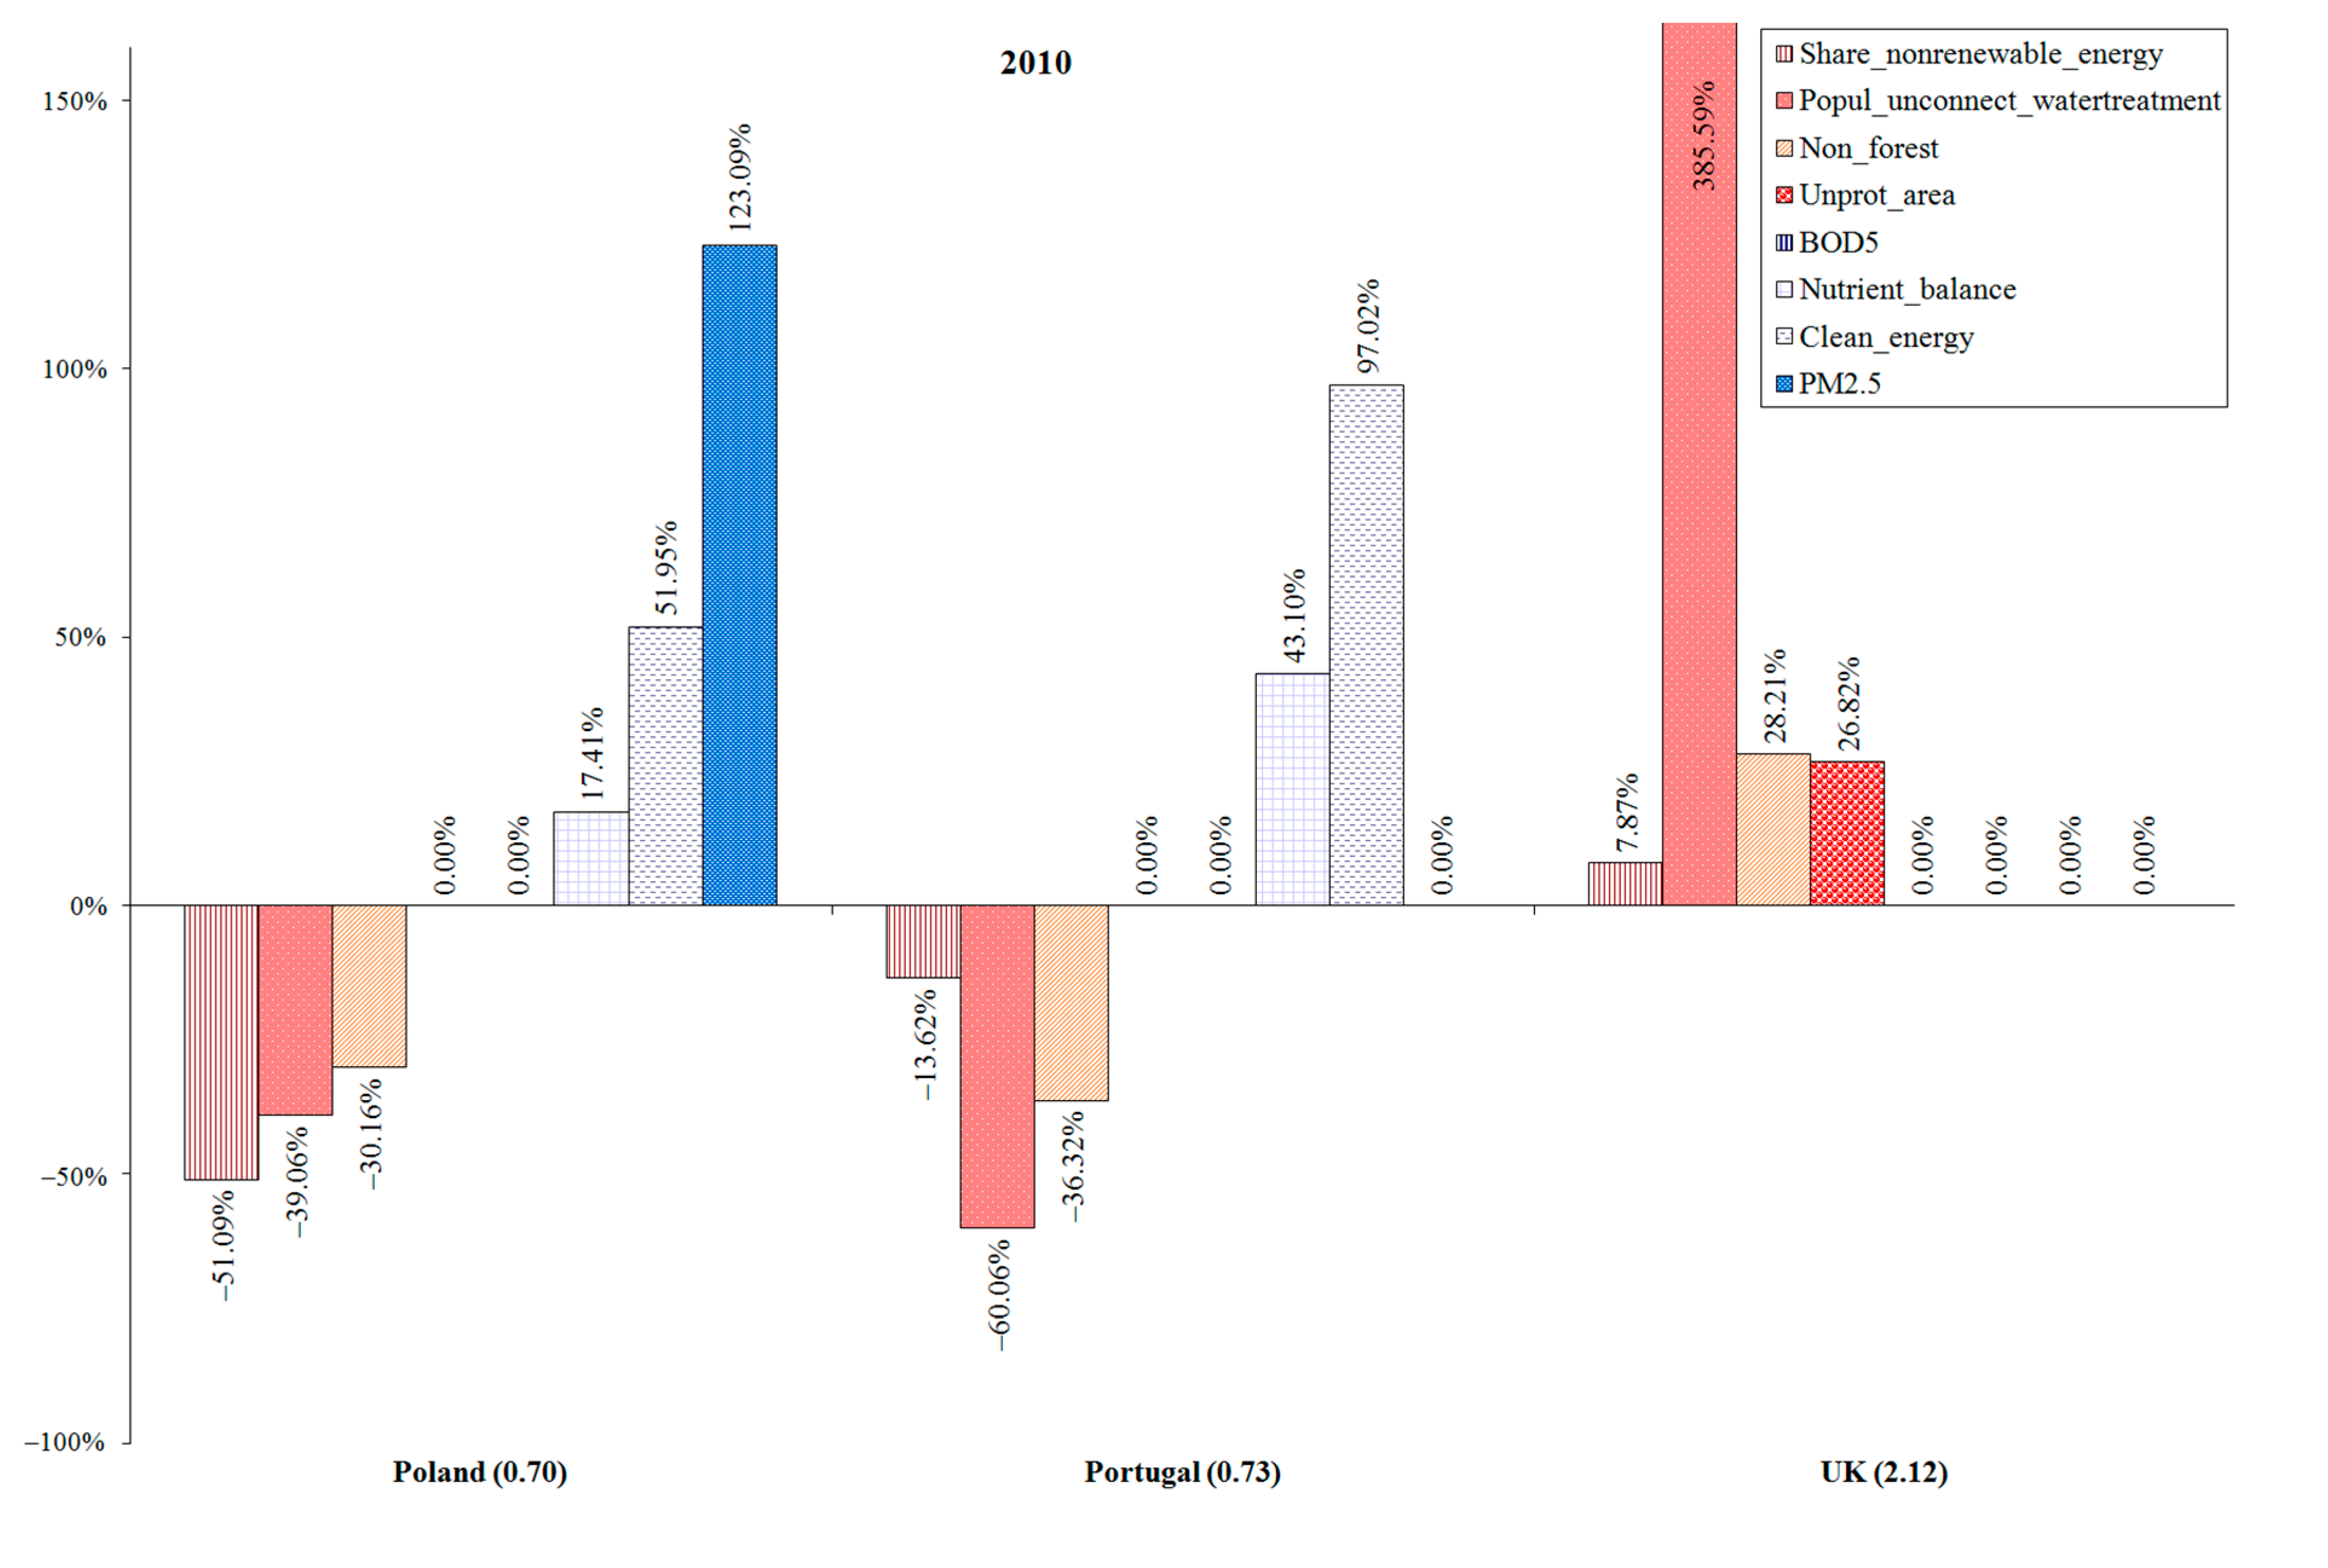
The second study involved data from 2010. Figure 2 illustrates the results of the analysis for the same 3 out of 22 countries.
When comparing the ranking positions of all three countries in these two periods, an efficiency increase can be seen in the case of Portugal and The United Kingdom (see Table 2). The United Kingdom has increased its super-efficiency by a further reduction in the level of population that was not connected to an advanced wastewater treatment system.
The areas in which Portugal should improve its activities are still: the input ‘Popul_unconnect_watertreatment’ (60% reduction indicated), the quality of energy (output ‘Clean_energy’ with a 97% improvement recommended) and the balance of nutrients in agricultural land (output ‘Nutrient_balance’ with only a 43% recommended improvement). When analyzing the raw data, it can be seen that Portugal actually improved the output ‘Nutrient_balance’ by 55% in 2010.
In the case of Poland, the main problem that its government has to solve can be clearly seen in the results of the analysis in 2010. In order to reach the efficiency frontier, Poland should increase the percentage of electricity generated by renewable sources in relation to the total use of electricity (input ‘Share_nonrenewable_energy’ should be 51% lower), increase the quality of energy (output ‘Clean_energy’ ought to be improved by 52%) and reduce the mean population exposure to air pollutant PM2.5 (123% improvement of output ‘PM2.5’ is recommended).
Generally speaking, recommendations regarding both inputs and outputs clearly show that Poland must address the issue of energy sources and air quality, which primarily means rethinking the coal-based economy.
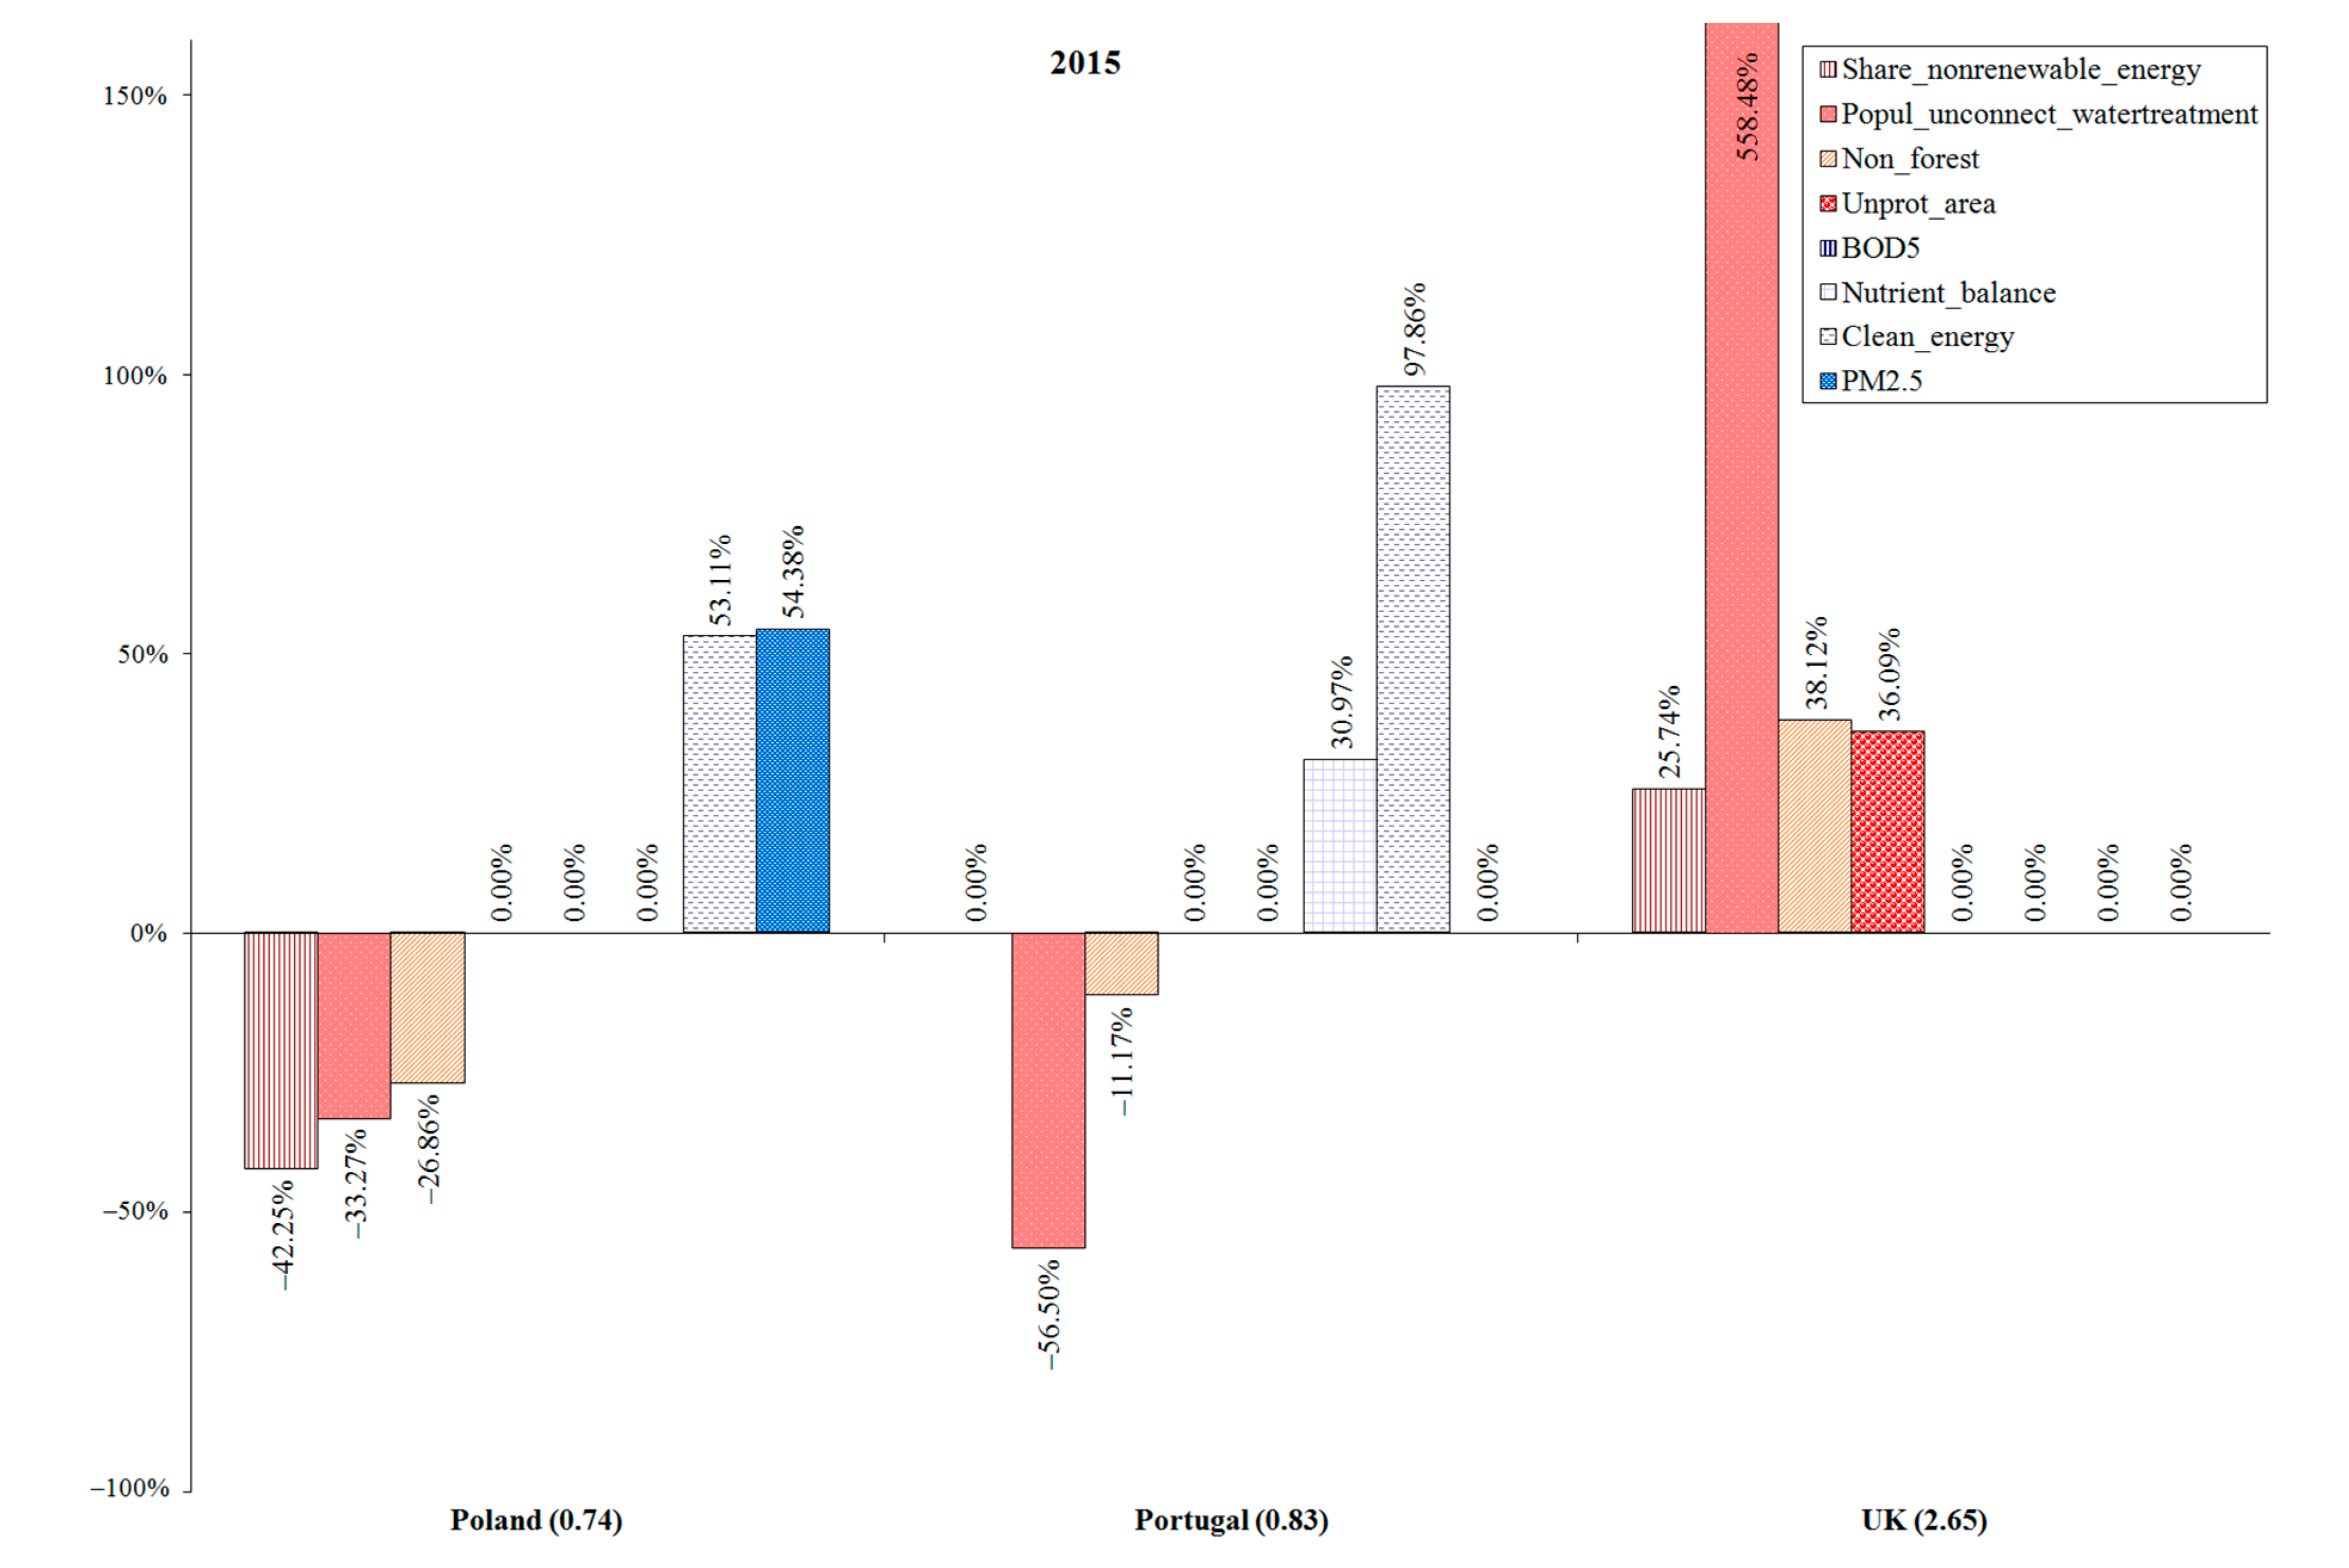
The last part of the study involved the analysis of the sources of super-efficiency and inefficiency in 2015. Figure 3 illustrates the results of this study for the same three countries.
The United Kingdom increased its super-efficiency further—again due to the improvement of input ‘Popul_unconnect_watertreatment.’ In 2015, the percentage of population that was not connected to an advanced wastewater treatment system was close to zero while the average value of this input for other countries was almost 20%.
In the case of Poland, in 2015 there was an improvement in efficiency. The recommended changes for both inputs and outputs were lower. The improvement of output ‘PM2.5’ compared to 2010 is worth noting (from 27.1 µg/m3 in 2010 to 22.7 µg/m3 in 2015). However, it is still the worst value of this output compared to other countries—in each of these three years, Poland was regretfully the worst country among those analyzed in terms of the mean population exposure to air pollutant PM2.5. For comparison, in the Scandinavian countries (Finland and Sweden) this value in 2015 was below 6.5 µg/m3.
Turning to the results of Portugal, there is a visible improvement of the percentage of electricity generated by renewable sources in relation to the total use of electricity. The input ‘Share_nonrenewable_energy’ in 2015 did not require any reduction (see Figure 3). It should be emphasized that Portugal managed to reduce the share of non-renewable energy from 72% in 2005 (through 59% in 2010) to 47% in 2015.
It should be emphasized that the recommendations formulated above relate closely to the group of 22 European Union countries in a given year. Thus, on the basis of such comparisons one cannot determine whether the examined countries generally improved their performance over time unless the Malmquist index is calculated.
It should also be clearly stated that the above considerations refer to the results obtained from the use of DEA to assess the efficiency of EU countries. A specific set of variables (inputs and outputs) describing the countries were used and conclusions from the above study strictly refer to the results obtained under the DEA application. However, a full analysis of the efficiency of implementation of the sustainable development policy should also take into account a wide set of factors and conditions that particular countries have to face and which are not included in this study, e.g., the tyranny of geography, the involvement of citizens, the government policies, the degree of economic development, the availability of resources, the historical factors, the demographic weight, etc. The presented quantitative tool, as mentioned earlier, aims to support decision makers involved in implementing a sustainable development policy.
4. Conclusions
To meet the demand for the quantitative methods that may be helpful in the management of the sustainable development policy, the use of Data Envelopment Analysis (DEA) was proposed. DEA turned out to be a tool with which the efficiency of implementation of the sustainable development policy of individual countries may be assessed, and which indicates the desirable directions of this efficiency improvement. The results identified weak areas in inefficient countries and seem to indicate correctly the action that should be taken to improve their efficiency.
The study presented in this paper allowed to observe the improvement of the efficiency of most countries in 2015 as compared to 2005. As can be seen, the actions taken by the countries within the framework of the sustainable development policy in the ecological dimension have brought about positive effects. This is also a good and motivating signal for the continuation of activities undertaken not only at the national level but also at the level of the European Union. This means that development programs led by the EU and UN, such as ‘Europe 2020’ and ‘Agenda 2030’ serve their purpose.
The resulting rankings appear to be reliable. They also confirm that the highly developed countries are more efficient in implementing the policy of sustainable development in the ecological dimension. The highest efficiency scores were obtained by countries in which great importance is attached to the protection of the environment dictated by economic reasons and environmental consciousness (Austria, Finland, Sweden) and tourism (e.g., Greece, Slovenia). However, keeping in mind that the environment creates a system of “communicating” vessels, an improvement of the efficiency of countries with worse values of the examined variables (inputs and/or outputs) should be proposed. The results of this study allow such countries to identify pathways of improving their sustainable development policies aimed not only at increasing economic efficiency but also at environmental protection.
Further research should focus primarily on the analysis of the efficiency of the implementation of the sustainable development policy in the economic and socio-cultural dimensions also outside the European Union. Thus, it should enable the inclusion in the study of a larger number of variables (inputs and outputs), provided, however, that a homogeneous global database, such as Eurostat for EU countries, has been developed.
Funding
This research received no external funding.
Conflicts of Interest
The authors declare no conflict of interest.
Appendix A
The sources of data used in the study are openly available on the:
- −
- Eurostat website at: https://ec.europa.eu/eurostat/data/database, reference numbers: sdg_07_40, sdg_06_20, sdg_15_10, sdg_06_30, sdg_02_50, sdg_07_10, sdg_13_10, demo_gind;
- −
- −
Appendix B
The Appendix B supplements Section 3.2. Analysis of the sources of super-efficiency and inefficiency. In Table A1, Table A2 and Table A3 (Appendix B), the recommended change is indicated for all inefficient countries in order to improve their efficiency and for super-efficient countries the tables present the ‘reserve’ of inputs or outputs (a ‘reserve’ means that even if super-efficient countries deteriorated their outputs to inputs ratio within this ‘reserve’ they would still be efficient). In each table, there is an indication to which countries are illustrated in Figure 1 (F 1), Figure 2 (F 2) and Figure 3 (F 3) in the main text.

Table A1.
Analysis of the sources of super-efficiency and inefficiency in 2005—recommended change or a ‘reserve’.
Table A1.
Analysis of the sources of super-efficiency and inefficiency in 2005—recommended change or a ‘reserve’.
| Inputs | Outputs | |||||||
|---|---|---|---|---|---|---|---|---|
| Country (DMU) | Share Nonrenewable Energy | Popul Unconnect Watertreatment | Non Forest | Unprot Area | BOD5 | Nutrient Balance | Clean Energy | PM2.5 |
| Austria | −61.04% | −79.46% | −33.46% | −5.72% | 0.00% | 108.26% | 1.77% | 0.00% |
| Belgium | −59.82% | −85.12% | −24.80% | −9.04% | 0.00% | 0.92% | 10.09% | 72.68% |
| Bulgaria | −56.51% | −64.35% | −20.66% | 0.00% | 8.27% | 0.00% | 45.25% | 50.35% |
| Czechia | −42.90% | −21.79% | −44.83% | −3.84% | 0.00% | 115.70% | 68.18% | 0.00% |
| Denmark | 0.00% | 97.26% | 0.00% | 57.55% | 0.00% | 0.00% | 0.00% | 0.00% |
| Estonia | −26.97% | −55.23% | 0.00% | 0.00% | 0.00% | 29.32% | 100.08% | 0.00% |
| Finland | −49.96% | −84.78% | −49.44% | −3.34% | 0.00% | 53.19% | 168.18% | 0.00% |
| Germany | −51.82% | −13.30% | 0.00% | 0.00% | 0.00% | 0.00% | 58.79% | 25.73% |
| Greece | 0.00% | 0.00% | 0.00% | 8.32% | 0.00% | 0.00% | 0.00% | 0.00% |
| Hungary | −58.87% | −87.56% | −26.37% | −11.02% | 0.00% | 167.80% | 13.41% | 0.00% |
| Ireland | 0.00% | 0.00% | 0.00% | 18.20% | 0.00% | 0.00% | 0.00% | 0.00% |
| Lithuania | −61.05% | −84.23% | −36.11% | −8.92% | 0.00% | 2.06% | 0.00% | 23.64% |
| Luxembourg | 3.33% | 0.98% | 0.00% | 0.00% | 0.00% | 0.00% | 0.00% | 0.00% |
| Netherlands | 50.59% | 0.00% | 0.00% | 34.00% | 0.00% | 0.00% | 0.00% | 0.00% |
| Poland (F 1) | −52.28% | −38.12% | −33.94% | 0.00% | 0.00% | 15.25% | 52.96% | 94.96% |
| Portugal (F 1) | −25.67% | −86.19% | −13.92% | 0.00% | 0.00% | 93.71% | 96.41% | 0.00% |
| Romania | −47.87% | −88.45% | −26.69% | −21.57% | 4.41% | 0.00% | 44.61% | 9.55% |
| Slovakia | 0.00% | 0.00% | 0.00% | 73.14% | 0.00% | 0.00% | 0.00% | 0.00% |
| Slovenia | −46.48% | −47.58% | −20.66% | 0.00% | 0.00% | 4.64% | 0.00% | 42.36% |
| Spain | 0.00% | 0.00% | 11.31% | 2.10% | 0.00% | 0.00% | 0.00% | 0.00% |
| Sweden | 127.66% | 384.52% | 57.98% | 51.11% | 0.00% | 0.00% | 0.00% | 0.00% |
| United Kingdom (F 1) | 6.03% | 80.31% | 3.82% | 21.19% | 0.00% | 0.00% | 0.00% | 0.00% |
Table A2.
Analysis of the sources of super-efficiency and inefficiency in 2010—recommended change or a ‘reserve’.
Table A2.
Analysis of the sources of super-efficiency and inefficiency in 2010—recommended change or a ‘reserve’.
| Inputs | Outputs | |||||||
|---|---|---|---|---|---|---|---|---|
| Country (DMU) | Share Nonrenewable Energy | Popul Unconnect Watertreatment | Non Forest | Unprot Area | BOD5 | Nutrient Balance | Clean Energy | PM2.5 |
| Austria | −62.81% | −76.08% | −33.29% | −6.17% | 0.00% | 24.85% | 0.00% | 6.11% |
| Belgium | −46.11% | −57.49% | −25.66% | 0.00% | 0.00% | 17.14% | 24.79% | 53.87% |
| Bulgaria | −63.58% | −74.14% | −14.83% | −9.99% | 0.00% | 3.36% | 20.95% | 35.20% |
| Czechia | −43.06% | −48.13% | −41.95% | −5.00% | 0.00% | 64.99% | 61.78% | 0.00% |
| Denmark | 0.00% | 0.00% | 0.00% | 25.12% | 0.00% | 0.00% | 0.00% | 0.00% |
| Estonia | −35.62% | −45.53% | 0.00% | 0.00% | 0.00% | 42.66% | 141.71% | 0.00% |
| Finland | −51.09% | −82.85% | −44.10% | −3.09% | 0.00% | 13.74% | 150.35% | 0.00% |
| Germany | −39.73% | −59.90% | −5.81% | 0.00% | 1.63% | 0.00% | 48.78% | 17.24% |
| Greece | 0.00% | −2.69% | −11.23% | 0.00% | 0.00% | 5.29% | 30.66% | 0.00% |
| Hungary | −62.53% | −83.73% | −17.70% | −13.01% | 0.00% | 34.37% | 33.45% | 0.00% |
| Ireland | 0.00% | 0.00% | 0.00% | 12.71% | 0.00% | 0.00% | 0.00% | 0.00% |
| Lithuania | −63.55% | −80.46% | −31.94% | −8.53% | 0.00% | 3.31% | 0.00% | 25.14% |
| Luxembourg | 0.74% | 0.00% | 0.00% | 0.00% | 0.00% | 0.00% | 0.00% | 0.00% |
| Netherlands | 39.14% | 6.97% | 0.00% | 29.52% | 0.00% | 0.00% | 0.00% | 0.00% |
| Poland (F 2) | −51.09% | −39.06% | −30.16% | 0.00% | 0.00% | 17.41% | 51.95% | 123.09% |
| Portugal (F 2) | −13.62% | −60.06% | −36.32% | 0.00% | 0.00% | 43.10% | 97.02% | 0.00% |
| Romania | −47.34% | −92.27% | −31.91% | −6.22% | 0.00% | 0.00% | 76.26% | 23.08% |
| Slovakia | 0.00% | 0.00% | 0.00% | 79.78% | 0.00% | 0.00% | 0.00% | 0.00% |
| Slovenia | −49.75% | −60.88% | −8.13% | 0.00% | 0.00% | 6.75% | 0.51% | 41.38% |
| Spain | 0.00% | 0.00% | 21.62% | 0.21% | 0.00% | 0.00% | 0.00% | 0.00% |
| Sweden | 53.03% | 99.05% | 203.08% | 64.39% | 0.00% | 0.00% | 0.00% | 0.00% |
| United Kingdom (F 2) | 7.87% | 385.59% | 28.21% | 26.82% | 0.00% | 0.00% | 0.00% | 0.00% |
Table A3.
Analysis of the sources of super-efficiency and inefficiency in 2015—recommended change or a ‘reserve’.
Table A3.
Analysis of the sources of super-efficiency and inefficiency in 2015—recommended change or a ‘reserve’.
| Inputs | Outputs | |||||||
|---|---|---|---|---|---|---|---|---|
| Country (DMU) | Share Nonrenewable Energy | Popul Unconnect Watertreatment | Non Forest | Unprot Area | BOD5 | Nutrient Balance | Clean Energy | PM2.5 |
| Austria | −65.88% | −41.40% | −33.95% | −6.40% | 0.00% | 17.45% | 5.75% | 0.00% |
| Belgium | −46.04% | −50.69% | −18.45% | 0.00% | 0.00% | 24.86% | 28.98% | 44.24% |
| Bulgaria | −63.17% | −73.68% | −26.35% | −0.16% | 0.00% | 0.00% | 83.24% | 41.66% |
| Czechia | −35.23% | −43.25% | −42.72% | −6.09% | 0.00% | 46.19% | 57.20% | 0.00% |
| Denmark | 0.00% | 0.00% | 0.00% | 3.89% | 0.00% | 0.00% | 0.00% | 0.00% |
| Estonia | −42.82% | −43.08% | 0.00% | 0.00% | 0.00% | 56.09% | 143.31% | 0.00% |
| Finland | −55.17% | −84.98% | −40.88% | −3.83% | 0.00% | 33.05% | 175.78% | 0.00% |
| Germany | 0.00% | 0.00% | 0.00% | 16.11% | 0.00% | 0.00% | 0.00% | 0.00% |
| Greece | −28.89% | −35.33% | −21.09% | 0.00% | 0.00% | 12.86% | 56.13% | 0.00% |
| Hungary | −62.66% | −81.62% | −22.90% | −6.60% | 0.00% | 0.00% | 88.53% | 7.78% |
| Ireland | 0.00% | 0.00% | 0.00% | 29.43% | 0.00% | 0.00% | 0.00% | 0.00% |
| Lithuania | −65.09% | −77.96% | −36.77% | 0.00% | 0.00% | 0.00% | 40.52% | 37.39% |
| Luxembourg | −1.08% | −81.11% | −9.95% | −8.60% | 11.72% | 0.00% | 24.38% | 24.27% |
| Netherlands | 42.22% | 0.00% | 0.00% | 29.46% | 0.00% | 0.00% | 0.00% | 0.00% |
| Poland (F 3) | −42.25% | −33.27% | −26.86% | 0.00% | 0.00% | 0.00% | 53.11% | 54.38% |
| Portugal (F 3) | 0.00% | −56.50% | −11.17% | 0.00% | 0.00% | 30.97% | 97.86% | 0.00% |
| Romania | −34.63% | −83.03% | −36.08% | 0.00% | 0.00% | 0.00% | 120.46% | 24.49% |
| Slovakia | 0.00% | 0.00% | 0.00% | 81.47% | 0.00% | 0.00% | 0.00% | 0.00% |
| Slovenia | −49.08% | −56.69% | −7.68% | 0.00% | 0.00% | 17.24% | 2.94% | 25.08% |
| Spain | 0.00% | 0.00% | 27.72% | 0.20% | 0.00% | 0.00% | 0.00% | 0.00% |
| Sweden | 78.30% | 107.98% | 230.91% | 73.41% | 0.00% | 0.00% | 0.00% | 0.00% |
| United Kingdom (F 3) | 25.74% | 558.48% | 38.12% | 36.09% | 0.00% | 0.00% | 0.00% | 0.00% |
References
- UN. ‘Brundtland Report’: Our Common Future. World Comission on Environment and Development, 1987. Available online: http://www.un-documents.net/wced-ocf.htm (accessed on 12 September 2019).
- Rogall, H. Ekonomia Zrównoważonego Rozwoju. Teoria i Praktyka [Economics of Sustainable Development. Theory and Practice]; Zysk i S-ka: Poznań, Poland, 2010. [Google Scholar]
- Holling, C.S. Understanding the Complexity of Economic, Ecological, and Social Systems. Ecosystems 2001, 4, 390–405. [Google Scholar] [CrossRef]
- EEA. Europe 2020—A Strategy for Smart, Sustainable and Inclusive Growth; European Commission: Brussels, Belgium, 2010; Available online: https://www.eea.europa.eu/policy-documents/com-2010–2020-europe-2020 (accessed on 12 September 2019).
- Quaddus, M.A.; Siddique, M.A.B. Application of decision support tools in sustainable development planning: Review and analysis. In Handbook of Sustainable Development Planning: Studies in Modelling and Decision Support; Quaddus, M.A., Siddique, M.A.B., Eds.; Edward Elgar Publishing Limited: Cheltenham, UK; Northampton, MA, USA, 2013; pp. 3–16. [Google Scholar]
- Emrouznejad, A.; Yang, G.L. A survey and analysis of the first 40 years of scholarly literature in DEA: 1978–2016. Socio-Econ. Plan. Sci. 2017, 61, 4–8. [Google Scholar] [CrossRef]
- Zhou, H.; Yang, Y.; Chen, Y.; Zhu, J. Data envelopment analysis application in sustainability: The origins, development and future directions. Eur. J. Oper. Res. 2018, 264, 1–16. [Google Scholar] [CrossRef]
- Sarkis, J.; Talluri, S. Using data envelopment analysis for ecoefficiency evaluation. In Handbook of Sustainable Development Planning: Studies in Modelling and Decision Support; Quaddus, M.A., Siddique, M.A.B., Eds.; Edward Elgar Publishing Limited: Cheltenham, UK; Northampton, MA, USA, 2013; pp. 141–158. [Google Scholar]
- Woo, C.; Chung, Y.; Chun, D.; Seo, H.; Hong, S. The static and dynamic environmental efficiency of renewable energy: A Malmquist index analysis of OECD countries. Renew. Sustain. Energy Rev. 2015, 47, 367–376. [Google Scholar] [CrossRef]
- Jalali, M.S.; Haeri, A.; Ghousi, R. A cross-country evaluation of energy efficiency from the sustainable development perspective. Int. J. Energy Sect. Manag. 2019, 13, 991–1019. [Google Scholar] [CrossRef]
- Cyrek, M.; Fura, B. Employment for Sustainable Development: Sectoral Efficiencies in EU Countries. Soc. Indic. Res. 2019, 143, 277–318. [Google Scholar] [CrossRef] [Green Version]
- Yang, W.-C.; Lee, Y.-M.; Hu, J.-L. Urban sustainability assessment of Taiwan based on data envelopment analysis. Renew. Sustain. Energy Rev. 2016, 61, 341–353. [Google Scholar] [CrossRef]
- Li, L.; Lei, Y.; Pan, D.; Si, C. Research on Sustainable Development of Resource-Based Cities Based on the DEA Approach: A Case Study of Jiaozuo, China. Math. Probl. Eng. 2016, 2016, 1–10. [Google Scholar] [CrossRef] [Green Version]
- Zhao, L.; Zha, Y.; Zhuang, Y.; Liang, L. Data envelopment analysis for sustainability evaluation in China: Tackling the economic, environmental, and social dimensions. Eur. J. Oper. Res. 2019, 275, 1083–1095. [Google Scholar] [CrossRef]
- Mihci, H.; Mollavelioglu, S. An Assessment of Sustainable Agriculture in the OECD Countries with Special Reference to Turkey. New Medit 2011, 10, 4–17. [Google Scholar]
- Gerdessen, J.C.; Pascucci, S. Data Envelopment Analysis of sustainability indicators of European agricultural systems at regional level. Agric. Syst. 2013, 118, 78–90. [Google Scholar] [CrossRef]
- Martinho, V.J.P.D. Efficiency, total factor productivity and returns to scale in a sustainable perspective: An analysis in the European Union at farm and regional level. Land Use Policy 2017, 68, 232–245. [Google Scholar] [CrossRef]
- Khodakarami, M.; Shabani, A.; Farzipoor Saen, R. A new look at measuring sustainability of industrial parks: A two-stage data envelopment analysis approach. Clean. Technol. Environ. Policy 2014, 16, 1577–1596. [Google Scholar] [CrossRef]
- Yang, G.; Fukuyama, H.; Chen, K. Investigating the regional sustainable performance of the Chinese real estate industry: A slack-based DEA approach. Omega 2019, 84, 141–159. [Google Scholar] [CrossRef]
- Costa, A.O.; Oliveira, L.B.; Lins, M.P.E.; Silva, A.C.M.; Araujo, M.S.M.; Pereira, A.O., Jr.; Rosa, L.P. Sustainability analysis of biodiesel production: A review on different resources in Brazil. Renew. Sustain. Energy Rev. 2013, 27, 407–412. [Google Scholar] [CrossRef]
- Tatari, O.; Kucukvar, M. Eco-Efficiency of Construction Materials: Data Envelopment Analysis. J. Constr. Eng. Manag. 2012, 138, 733–741. [Google Scholar] [CrossRef]
- Knox Lovell, C.A.; Pastor, J.T.; Turner, J.A. Measuring macroeconomic performance in the OECD: A comparison of European and non-European countries. Eur. J. Oper. Res. 1995, 87, 507–518. [Google Scholar] [CrossRef]
- Bampatsou, C.; Hadjiconstantinou, G. The use of the DEA method for simultaneous analysis of the interrelationships among economic growth, environmental pollution and energy consumption. Int. J. Econ. Sci. Appl. Res. 2009, 2, 65–86. [Google Scholar]
- Santana, N.B.; Aparecida do Nascimento Rebelatto, D.; Périco, A.E.; Mariano, E.B. Sustainable development in the BRICS countries: An efficiency analysis by data envelopment. Int. J. Sustain. Dev. World Ecol. 2014, 21, 259–272. [Google Scholar] [CrossRef]
- Cucchiella, F.; D’Adamo, I.; Gastaldi, M.; Miliacca, M. Efficiency and allocation of emission allowances and energy consumption over more sustainable European economies. J. Clean. Prod. 2018, 182, 805–817. [Google Scholar] [CrossRef]
- Charnes, A.; Cooper, W.W.; Rhodes, E. Measuring the Efficiency of Decision Making Units. Eur. J. Oper Res. 1978, 2, 429–444. [Google Scholar] [CrossRef]
- Cooper, W.W.; Seiford, L.M.; Tone, K. Data Envelopment Analysis. A Comprehensive Text. with Models, Applications, References and DEA-Solver Software, 2nd ed.; Springer: New York, NY, USA, 2007. [Google Scholar]
- Bubnicki, Z. Modern Control. Theory; Springer: Berlin/Heidelberg, Germany, 2005. [Google Scholar]
- Caves, D.; Christensen, L.; Diewert, W.E. The economic theory of index numbers and the measurement of input, output, and productivity. Econometrica 1982, 50, 1393–1414. [Google Scholar] [CrossRef]
- Malmquist, S. Index Numbers and Indifference Surfaces. Trab. Estad. 1953, 4, 209–242. [Google Scholar] [CrossRef]
- Färe, R.; Grosskopf, S.; Lindgren, B.; Roos, P. Productivity Developments in Swedish Hospitals: A Malmquist Output Index Approach. In Data Envelopment Analysis: Theory, Methodology, and Applications; Charnes, A., Cooper, W.W., Lewin, A.Y., Seiford, L.M., Eds.; Springer: Haarlem, The Netherlands, 1994; pp. 253–272. [Google Scholar]
- EC. Communication from the Commission to the European Parliament, the Council, the European Economic and Social Committee and the Committee of the Regions. European Comission, 2016. Available online: https://ec.europa.eu/europeaid/commission-communication-next-steps-sustainable-european-future_en (accessed on 20 December 2019).
- WHO. WHO Air Quality Guidelines for Particulate Matter, Ozone, Nitrogen Dioxide and Sulfur Dioxide: Global Update 2005: Summary of Risk Assessment. Occupational and Environmental Health Team (World Health Organization), 2006. Available online: https://apps.who.int/iris/handle/10665/69477 (accessed on 12 September 2019).
- Allen, K. DEA in the ecological context—An overview. In Data Envelopment Analysis in the Service Sector; Westermann, G., Ed.; Springer Fachmedien Wiesbaden: Wiesbaden, Germany, 1999; pp. 203–235. [Google Scholar]
- Dyckhoff, H.; Allen, K. Measuring ecological efficiency with data envelopment analysis (DEA). Eur. J. Oper Res. 2001, 132, 312–325. [Google Scholar] [CrossRef]
Figure 1.
Analysis of the sources of super-efficiency and inefficiency—2005.

Figure 2.
Analysis of the sources of super-efficiency and inefficiency—2010.

Figure 3.
Analysis of the sources of super-efficiency and inefficiency—2015.

Table 1.
Inputs and outputs—variables describing EU countries in the study.
| Symbol | Description | Abbreviation | |
|---|---|---|---|
| Control variables in DEA terminology—inputs | x1 | Share of non-renewable energy consumption in gross final energy consumption (electricity sector), % | Share_nonrenewable_energy |
| x2 | Percentage of the population that is not connected to advanced wastewater treatment systems, % | Popul_unconnect_watertreatment | |
| x3 | Level of ‘non-afforestation’, % | Non_forest | |
| x4 | Unprotected area (terrestrial) in relation to the area of the country, % | Unprot_area | |
| Controlled variables in DEA terminology—outputs | y1 | Biochemical oxygen demand—the amount of oxygen required by aerobic microorganisms to decompose organic substances in a water sample over a period of five days in the dark at 20 °C, measured as milligrams of oxygen per litre | BOD5 |
| y2 | Balance of nutrients (phosphorus) in agricultural land—gross nutrient balance estimates the potential surplus of phosphorus on agricultural land and shows the balance between phosphorus added to an agricultural system and phosphorus removed from the system per hectare of agricultural land | Nutrient_balance | |
| y3 | Index of clean energy—energy consumption in relation to greenhouse gas emissions from power plants | Clean_energy | |
| y4 | Mean population exposure to air pollutant PM2.5 (airborne particulate matter with a diameter of 2.5 μm or less), annual average concentration, µg/m3 | PM2.5 |
The data were obtained from the Eurostat database, the OECD database, and the European Environment Agency website (data sources are provided in Appendix A).
Table 2.
EU Countries’ Efficiency Scores and Ranking Positions (2005, 2010 and 2015).
| Country (DMU) | 2005 | 2010 | 2015 | |||
|---|---|---|---|---|---|---|
| Score | Rank | Score | Rank | Score | Rank | |
| Austria | 1.21 | 4 | 1.19 | 4 | 1.18 | 4 |
| Belgium | 0.55 | 18 | 0.55 | 20 | 0.63 | 17 |
| Bulgaria | 0.55 | 17 | 0.68 | 15 | 0.71 | 15 |
| Czechia | 0.65 | 16 | 0.59 | 17 | 0.59 | 19 |
| Denmark | 0.72 | 12 | 0.65 | 16 | 0.68 | 16 |
| Estonia | 0.79 | 11 | 0.80 | 10 | 0.79 | 11 |
| Finland | 1.03 | 7 | 1.05 | 6 | 1.07 | 6 |
| Germany | 1.39 | 2 | 1.06 | 5 | 1.01 | 8 |
| Greece | 0.84 | 10 | 0.74 | 11 | 1.04 | 7 |
| Hungary | 0.52 | 22 | 0.54 | 22 | 0.55 | 21 |
| Ireland | 0.53 | 21 | 0.55 | 21 | 0.54 | 22 |
| Lithuania | 0.54 | 19 | 0.56 | 18 | 0.57 | 20 |
| Luxembourg | 1.05 | 6 | 1.03 | 7 | 1.07 | 5 |
| Netherlands | 1.01 | 9 | 1.00 | 8 | 0.75 | 12 |
| Poland | 0.69 | 14 | 0.70 | 14 | 0.74 | 13 |
| Portugal | 0.69 | 15 | 0.73 | 12 | 0.83 | 9 |
| Romania | 0.54 | 20 | 0.56 | 19 | 0.62 | 18 |
| Slovakia | 0.71 | 13 | 0.70 | 13 | 0.72 | 14 |
| Slovenia | 1.18 | 5 | 1.20 | 3 | 1.20 | 3 |
| Spain | 1.02 | 8 | 0.97 | 9 | 0.79 | 10 |
| Sweden | 2.55 | 1 | 2.05 | 2 | 2.23 | 2 |
| United Kingdom | 1.28 | 3 | 2.12 | 1 | 2.65 | 1 |
Table 3.
Average Efficiency in 2005–2015 According to the Geographical Breakdown.
| Northern Europe | Western Europe | Southern Europe | Central and Eastern Europe | |
|---|---|---|---|---|
| Geographical breakdown | Denmark | Austria | Greece | Bulgaria |
| Finland | Belgium | Portugal | Czechia | |
| Sweden | Germany | Spain | Estonia | |
| Ireland | Hungary | |||
| Luxembourg | Lithuania | |||
| Netherlands | Poland | |||
| United Kingdom | Romania | |||
| Slovakia | ||||
| Slovenia | ||||
| Average efficiency in 2005–2015 according to the geographical breakdown | ||||
| 2005 | 1.43 | 1.00 | 0.85 | 0.69 |
| 2010 | 1.25 | 1.07 | 0.81 | 0.70 |
| 2015 | 1.33 | 1.12 | 0.89 | 0.72 |
Table 4.
Efficiency Analysis over Time—the Malmquist Index 2005–2015.
| Country (DMU) | Catch-Up Effect (Recovery) | Frontier-Shift Effect (Innovation) | Malmquist Index (MI) (Catch-Up)⋅(Frontier-Shift) |
|---|---|---|---|
| Belgium | 1.15 | 1.17 | 1.34 |
| Bulgaria | 1.29 | 1.13 | 1.45 |
| Czechia | 0.92 | 1.11 | 1.02 |
| Denmark | 0.95 | 1.24 | 1.18 |
| Germany | 0.73 | 1.21 | 0.88 |
| Estonia | 0.99 | 1.24 | 1.23 |
| Ireland | 1.01 | 1.15 | 1.17 |
| Greece | 1.24 | 1.09 | 1.35 |
| Spain | 0.77 | 1.24 | 0.95 |
| Lithuania | 1.05 | 1.11 | 1.16 |
| Luxembourg | 1.03 | 1.03 | 1.06 |
| Hungary | 1.05 | 1.10 | 1.15 |
| Netherlands | 0.74 | 1.86 | 1.38 |
| Austria | 0.97 | 1.17 | 1.13 |
| Poland | 1.08 | 1.21 | 1.30 |
| Portugal | 1.21 | 1.21 | 1.47 |
| Romania | 1.14 | 1.08 | 1.23 |
| Slovenia | 1.02 | 1.03 | 1.04 |
| Slovakia | 1.00 | 1.19 | 1.19 |
| Finland | 1.04 | 1.00 | 1.03 |
| Sweden | 0.87 | 1.40 | 1.22 |
| United Kingdom | 2.07 | 1.76 | 3.65 |
© 2020 by the author. Licensee MDPI, Basel, Switzerland. This article is an open access article distributed under the terms and conditions of the Creative Commons Attribution (CC BY) license (http://creativecommons.org/licenses/by/4.0/).
Share and Cite
MDPI and ACS Style
Łozowicka, A. Evaluation of the Efficiency of Sustainable Development Policy Implementation in Selected EU Member States Using DEA. The Ecological Dimension. Sustainability 2020, 12, 435. https://0-doi-org.brum.beds.ac.uk/10.3390/su12010435
AMA Style
Łozowicka A. Evaluation of the Efficiency of Sustainable Development Policy Implementation in Selected EU Member States Using DEA. The Ecological Dimension. Sustainability. 2020; 12(1):435. https://0-doi-org.brum.beds.ac.uk/10.3390/su12010435
Chicago/Turabian StyleŁozowicka, Anna. 2020. "Evaluation of the Efficiency of Sustainable Development Policy Implementation in Selected EU Member States Using DEA. The Ecological Dimension" Sustainability 12, no. 1: 435. https://0-doi-org.brum.beds.ac.uk/10.3390/su12010435
Note that from the first issue of 2016, this journal uses article numbers instead of page numbers. See further details here.