Quantitative Analysis and Multi-Index Evaluation of the Green Building Envelope Performance in the Cold Area of China

School of Environmental Science and Engineering, Tianjin University, Tianjin 300350, China
*
Author to whom correspondence should be addressed.
Sustainability 2020, 12(1), 437; https://0-doi-org.brum.beds.ac.uk/10.3390/su12010437
Submission received: 29 November 2019
/
Revised: 29 December 2019
/
Accepted: 1 January 2020
/
Published: 6 January 2020
(This article belongs to the Special Issue Sustainable Building Retrofit and Energy Optimization)
Abstract
:In China, relevant standards about building energy efficiency and green buildings have resulted in corresponding requirements for the envelope thermal performance. However, improvement of the thermal performance of the envelope is accompanied by an increase of the environmental impact and cost. This study quantitatively analyzed the thermal performance, environmental impact, and cost of the green building envelope in cold areas and established a common practice database, as well as a multi-index evaluation model. The results show that the best thermal performance improvements are 40% in residential buildings and 30% in public buildings, respectively, based on the relevant standards. The exterior walls and windows have the greatest impact on building heat consumption. There is no significant correlation between the heat consumption and the comprehensive heat transfer coefficient of 10 green buildings. Therefore, the comprehensive heat loss coefficient is corrected. The verification results show that all errors except project 10 are within 15%. Additionally, the projects with balanced thermal performance improvement of exterior walls and windows showed a better performance. Finally, the best combination of residential building envelopes in the cold area was selected, using the evaluation model and quantitative database to calculate the comprehensive score.
1. Introduction
In recent years, energy and environmental issues have attracted worldwide attention. The construction industry accounts for 30% of the global primary energy consumption and also contributes to approximately one-third of global carbon emissions [1,2]. Global building energy consumption has been growing steadily due to rapid urbanization, climate change, and other drivers [3,4]. From 2000 to 2016, China’s urbanization rate increased from 36% to 58%, resulting in considerable energy consumption and carbon emissions [5]. China’s total CO2 emissions in 2015 accounted for 30% of the world’s total, and the country has thus become the world’s largest CO2 emitter [6]. In the same year, China submitted to United Nations Framework Convention on Climate Change (UNFCCC) an intention document determined by the state, promising to reach peak carbon dioxide emissions by 2030, which also posed a challenge to the construction sector. China’s building energy consumption accounts for 21% of the total energy consumption [7], with significant potential for energy conservation and emission reductions. About two-thirds of China’s regions are located in severely cold and cold regions with high heating demands in winter. The heating energy consumption of northern cities accounts for 40% of the total building energy consumption [8,9].
With the rapid development of China’s building energy efficiency, relevant standards and specifications are also being constantly updated and developed. Based on the heating energy consumption in 1980, the first step of the residential building energy efficiency target of 1986 was to reduce the energy consumption by 30% [10], which has been developed to the fourth step of the energy efficiency target, with the aim of reducing energy consumption by 75% [11]. The latest standard (JGJ 26-2018) was officially implemented on 1 August 2019. The current standard of public buildings is the Design Standard for Energy Efficiency of Public Buildings (GB 50189-2015) [12]. The first Assessment Standard for Green Building (GB/T 50378-2006) of China was implemented in 2006. The GB/T 50378-2019 [13] is the latest version, which was implemented on 1 August 2019. The thermal performance of a building envelope is the key factor influencing building energy consumption. Building energy efficiency standards [11,12] require the finite value of the heat transfer coefficient of the building envelope. The three levels in the Assessment Standard for Green Building [13] require the thermal performance of an enclosure to be improved by 5%, 10%, and 20%, respectively, based on the building energy efficiency standards [11,12].
Research on the improving thermal performance of the building envelope primarily focuses on optimization of the thermal insulation performance of exterior walls, exterior windows, and roofs. Life cycle assessment (LCA) is widely used in the optimal design of the building envelope [14,15]. Kaynakli [16] used the theory of LCA to optimize the thickness of external wall insulation under different heating modes. Dylewski [17] used the life cycle method to analyze the thickness of the economic insulation layer of external walls under the influence of different insulation materials and heat sources in Poland. Additionally, Daouas [18] considered the influence of sky radiation on the heat transfer of the roof, calculated the energy consumption of the roof by numerical simulation, and determined the economic thickness of different insulation materials of typical roofs in Turkey with the minimum life cycle cost as the optimization goal. Furthermore, Hee et al. [19] compared the building energy consumption of windows for different window-to-wall ratios. The result showed no significant difference in building energy consumption between 34% and 41% of the window-to-wall ratio. Single objective optimization usually takes the minimum life cycle cost or carbon emission as the optimization objective. Song et al. [20] used the economic net present value (NPV) method to evaluate different envelope modification methods. Zhang et al. [21] used energy consumption simulation software and the calculation model of life cycle cost analysis to analyze the influence rule of different material types and thicknesses of the thermal insulation layer on building energy consumption and conducted an economic analysis to optimize the thermal insulation layer of a university building envelope in Chengdu. Moreover, Dodoo et al. [22] analyzed the lowest comprehensive cost envelope in the life cycle of multistory buildings in southern Sweden, which can reduce the heating energy consumption of buildings by 28–43%. Additionally, Rahman Azari et al. [23] studied the influence of different thermal insulation materials, window types, and window-to-wall ratios (WWR) on the life cycle environment of an office building. Saafi et al. [24] comprehensively considered the roof structure, type of thermal insulation material, aging of thermal insulation materials, and roof reflectivity; used Energy Plus to simulate energy consumption; and determined the thickness of the economic thermal insulation layer of different forms of roofs in Tunisia. Li et al. [25] developed an assessment framework to analyze the impact of specific carbon on residential buildings. Furthermore, Fayez et al. [26] selected 13 cities in Australia and calculated the energy efficiency and carbon footprint of 15 kinds of wall insulation materials through simulation to obtain economic and reasonable insulation materials. Adamczyk et al. [27] proposed a method to evaluate the environmental and economic benefits and analyzed the selection of thermal insulation materials and thicknesses of the external walls of residential buildings. Azari et al. [28] used the multi-objective optimization algorithm to optimize the Seattle office building envelope. Global warming, acidification, eutrophication, smog formation, and ozone depletion were selected as indicators of the environmental impact. Kosareo and Ries [29] compared the effects of large green roofs and traditional roofs on ozone depletion, global warming, acidification, and eutrophication. Wu et al. [30] proposed a multi-objective optimization and transformation method to optimize the envelope and energy system to reduce the greenhouse gas emissions of the entire community by 76%. In recent years, building simulation software and intelligent algorithms have been often used in the research of multi-objective optimization [31]. Maria Ferrara [32] used Transient System Simulation Tool (TRNSYS) to simulate the energy consumption of green buildings and considered it as the evaluation index to optimize the design of the enclosure through GenOpt. Ascione [33] used a genetic algorithm to carry out multi-objective optimization for building envelope design, proposed different optimization objectives for different private and public stakeholders, and formulated the best design strategy. Additionally, Ciulla et al. [34] used TRNSYS to simulate the energy consumption of non-residential buildings in Europe, and combined with a neural network, developed a building energy consumption prediction tool. Wu et al. [35] established the multi-objective optimization model of zero energy consumption buildings by combining multi-objective optimization technology with a comprehensive evaluation method. They used NSGA-II (non-dominated sorting genetic algorithm II) to optimize the enclosure with the goal of cost and energy consumption. Therefore, before selecting the optimization parameters, sensitivity analysis should be performed to select the parameters that have a greater impact on the optimization [36,37,38].
With the development of the Assessment Standard for Green Building and building energy efficiency standards, the requirements for thermal performances of the building envelope have gradually improved. However, only considering the thermal performance is against the concept of green building, the relevant standards pay too much attention to the improvement of thermal performance, and there are a lack of corresponding regulations and suggestions on the selection of enclosure materials. Whether improvement of the thermal performance of the building envelope can achieve good energy savings and economic and environmental benefits remains to be studied and analyzed. Many researchers have used building simulation software and optimization selection tools to optimize the specific building envelope structure with the thermal performance, cost, and environmental impact as objectives [31,32,33,34,35]. However, there is a lack of summary research on the practices of the green building envelope in different climate regions of China, and a corresponding multi-index evaluation system has not yet been formed. The thermal performance of the building envelope specified in relevant standards often corresponds to various methods. The application of multi-index evaluation tools can guide the formulation of building envelope schemes. Additionally, although the thermal performance of the green building envelope has been improved on the basis of ordinary buildings, the actual heat consumption in operation is affected by many factors, such as personnel operating habits, actual outdoor temperature changes, the matching of performance improvement between envelope structures, etc., which results in significant deviation between the actual heat consumption and the simulation calculation value. The entire thermal performance of an enclosure often deviates from the expectation. Therefore, this paper uses simulation, project measurement, quantitative analysis, and sensitivity analysis to study the relationship between the thermal performance and heat consumption of the green building envelope in cold areas and establishes a multi-index evaluation system, including a multi-index evaluation model and database of an envelope scheme, to guide the design and evaluation of the green building envelope.
2. Materials and Methods
This study presents a comprehensive analysis of the envelope of green buildings in cold areas and establishes a multi-index evaluation model. The method is divided into four parts. In the first part, typical public buildings and residential buildings are modeled to simulate the heating load and analyze the thermal performance of the envelope. The second part involves investigating the green building envelope in cold areas of China and performing a quantitative analysis of the thermal performance, environmental impact, and cost of different building envelope practices. The third part tests the heat consumption of green buildings in the cold area, analyzes the relationship between the thermal performance of the envelope and heat consumption, and corrects the comprehensive heat loss coefficient. The fourth part establishes the multi-index evaluation model and proposes a decision-making method of envelope design.
2.1. Simulation of Building Heat Load
2.1.1. Energy Simulation Software
Energy Plus is a building energy consumption simulation software developed by the U.S. Department of Energy. It is a new generation of computing core without a user graphical interface. It inherits the features and functions of Blast and DOE-2 and optimizes the computing methods and program structure. Energy Plus uses a conduction transfer function (CTF) to calculate heat transfer, and the calculation result is more accurate. Moreover, it uses a modular system simulation method with a variable time step, and it is widely used in the field of building energy. Design Builder is a building energy consumption simulation software developed with Energy Plus as the core. It has a visual graphic interface which is more convenient to operate so it was selected as the simulation tool.
2.1.2. Building Model
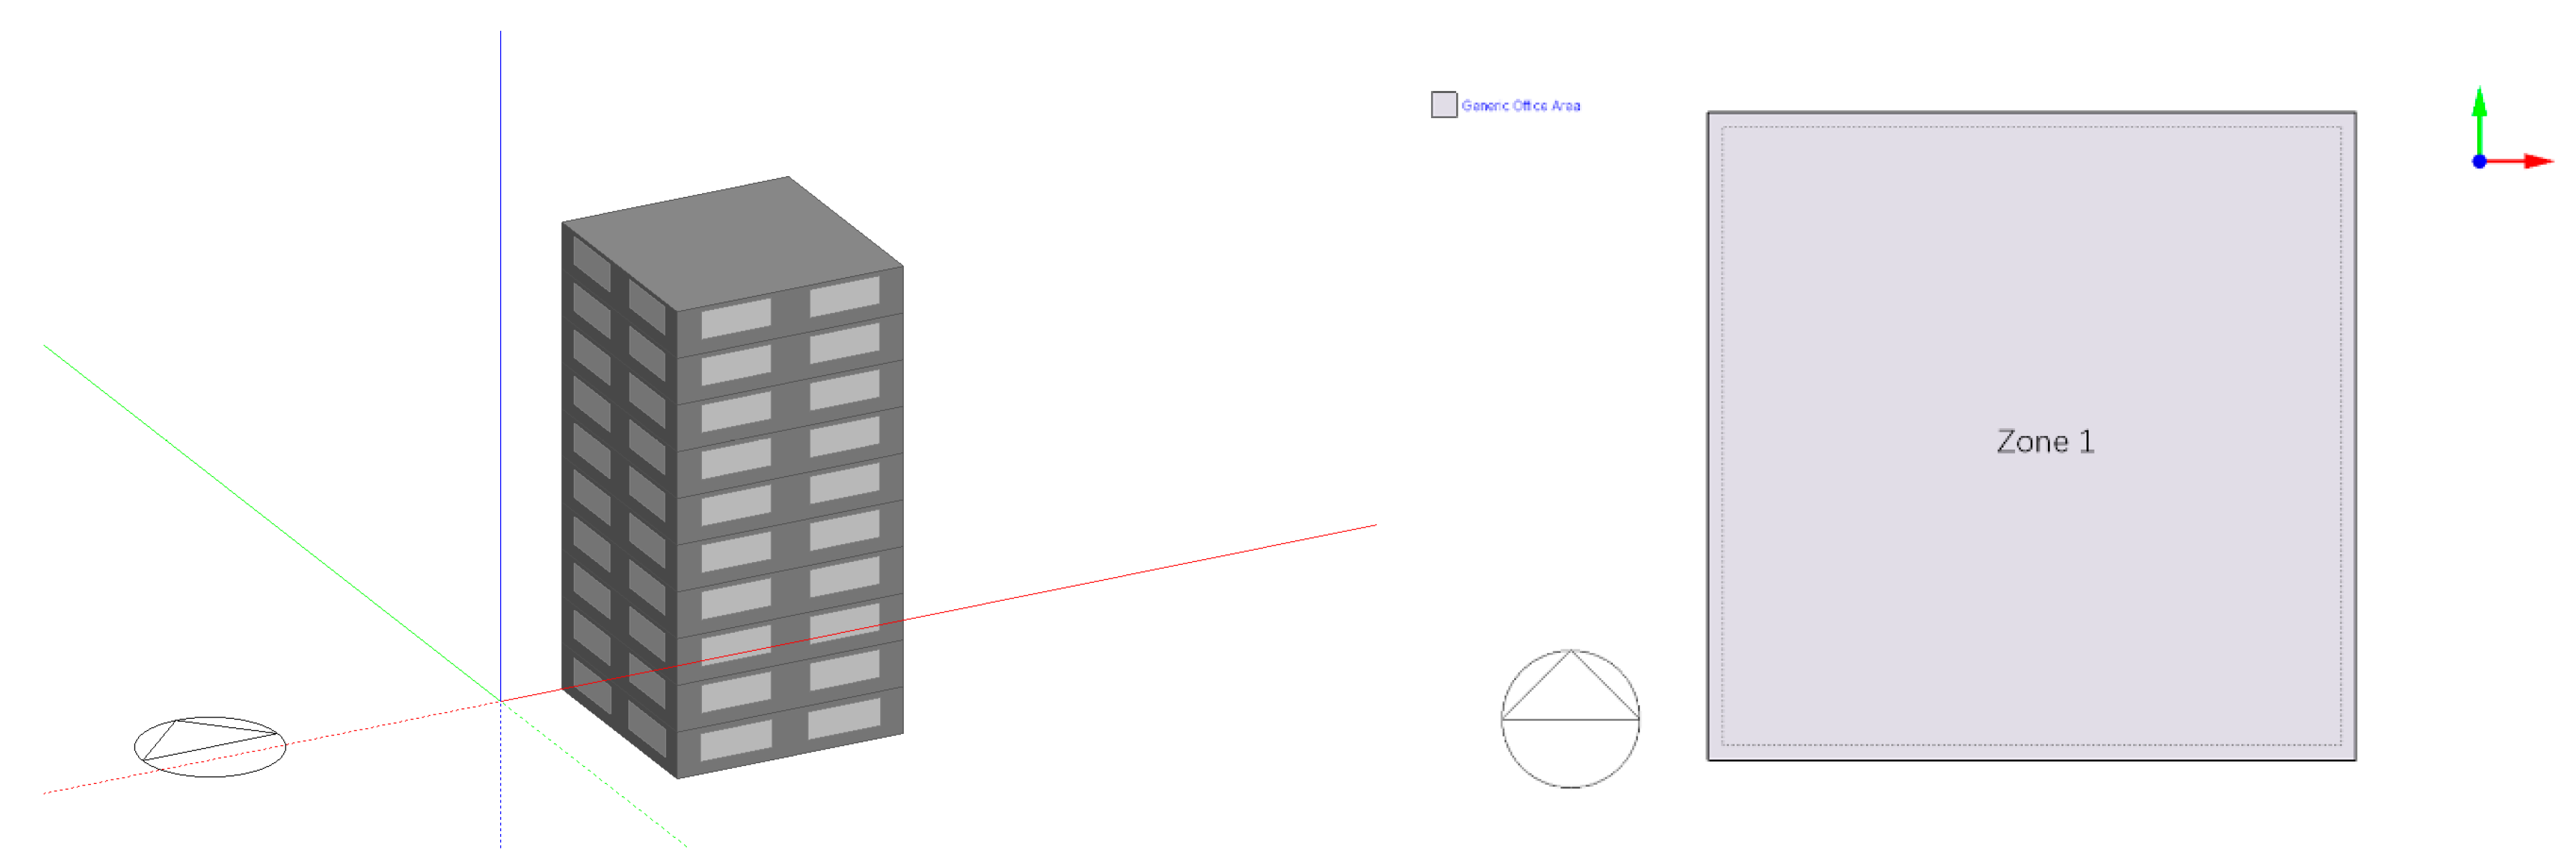
The parameters of building models were determined according to the requirements of the Design Standard for Energy Efficiency of Public Buildings (GB 50189-2015) [12]. The parameters of residential buildings were determined according to the Design Standard for Energy Efficiency of Residential Buildings in Severe Cold and Cold Zones (JGJ 26-2010) [39]. In order to simplify the modeling work, the two types of buildings adopt the same appearance and internal structure, as shown in Figure 1. The difference is in the building size and enclosure parameters, as shown in Table 1. And the building models are added in the Appendix A.
2.1.3. Quantification of the Thermal Performance of the Envelope
The heat transfer coefficient is calculated by setting the window type in Design Builder to quantify the thermal performance of the outer window, but the heat transfer coefficient of the outer window and roof is calculated using Equations (1)–(3):
where is the thermal resistance of each layer of material, (m2·K)/W; δ is the thickness of each layer of material, m; λ is the thermal conductivity of each layer of material, W/(m·K); is the heat transfer resistance of the envelope, (m2·K)/W; is the heat transfer resistance of the inner surface, (m2·K)/W; is the heat transfer resistance of the outer surface, (m2·K)/W; and is the heat transfer coefficient of the envelope, W/(m2·K).
2.2. Measurement and Analysis of Building Heat Consumption
2.2.1. Investigation of the Envelope of Green Buildings
This part describes the investigation and analysis of materials and practices of the envelope structure of 20 green buildings in a cold area and presents a quantitative analysis of the thermal performance of typical building envelope practices.
2.2.2. Heat Consumption Test of Green Building Projects
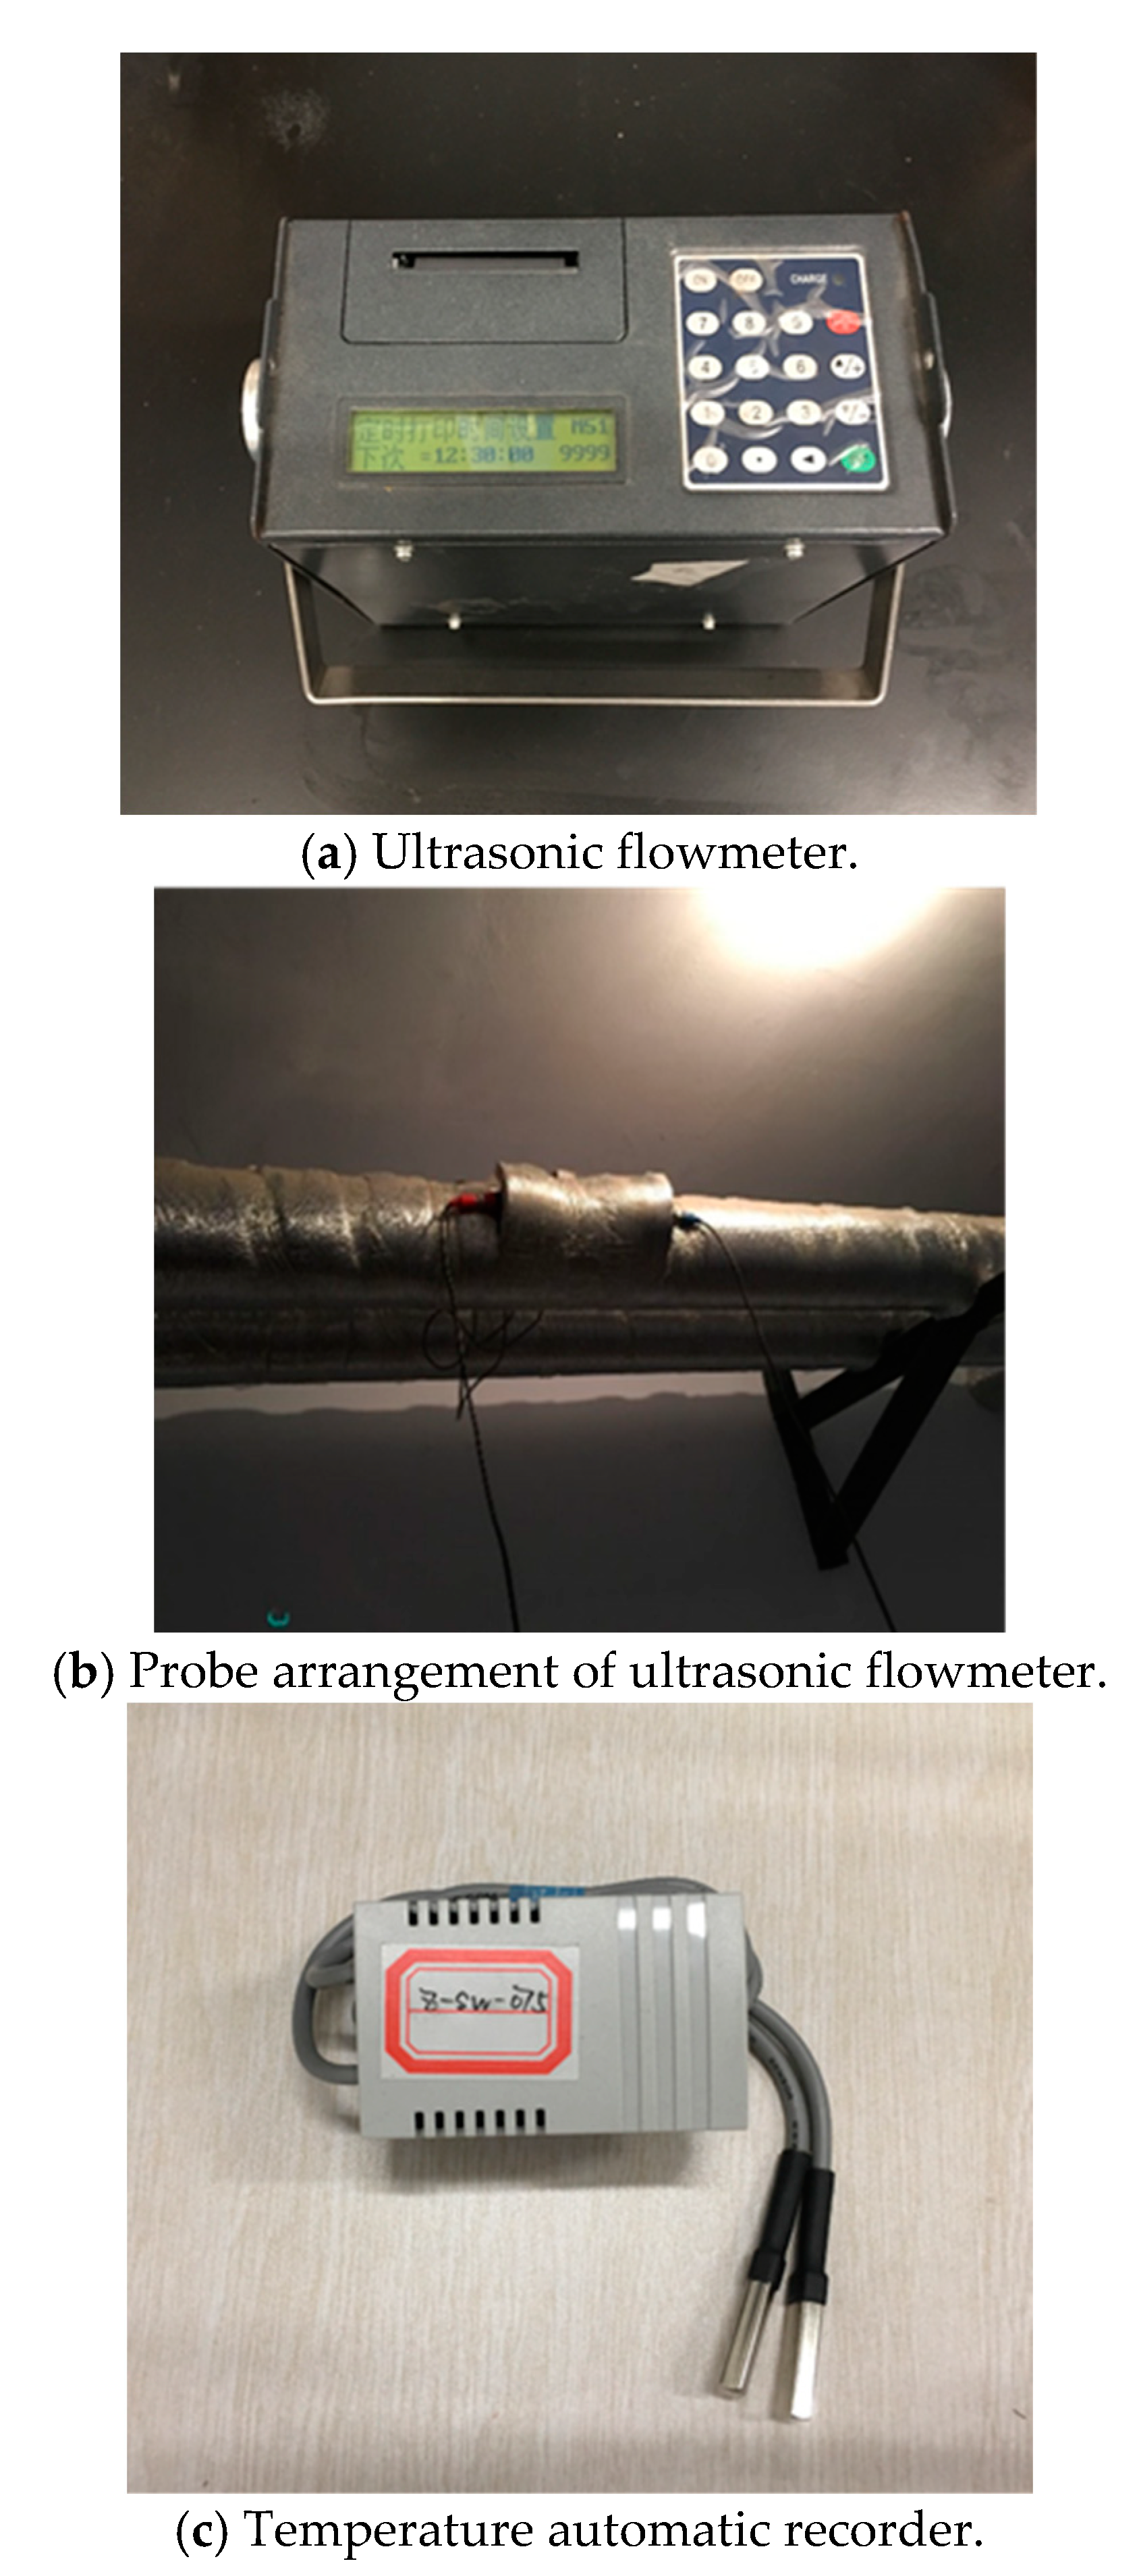
The basic information of ten green buildings in the tested cold area is shown in Table 2. In order to test the heat consumption of these buildings, we installed corresponding test instruments in the machine room. The electromagnetic flowmeter in Figure 2a was used to measure the total flow of a building’s heating system. When selecting the test pipeline, the principle of stable flow and full pipe flow should be followed. Therefore, the backwater pipeline should be selected first, and the vertical trunk pipe should be selected as far as possible. When the length of the vertical trunk pipe is less than 1.5 meters, the horizontal trunk pipe can be selected, and the probes are arranged in a continuous straight place without an elbow, as shown in Figure 2b. After the probe is installed, adhesive tape is used to paste the insulation layer to reduce heat loss. Finally, parameters are set on the operating interface of the instrument, including the data recording duration, collection start time, data collection type, etc. There should be a stable power supply to ensure continuous power for the instrument during the test.
The automatic temperature recorder in Figure 2c was used to measure the temperature of the water supply and return of the building heating system. First, parameters were set on the computer through the client-side to adjust the start and end recording time. The start time was consistent with the collection time of the above flow data, and the collection interval was set to once every 10 min. Thereafter, the two probes were placed inside the insulation layer of the supply and return water pipeline and fixed with tape. Based on the data of the aforementioned tests, the heat consumption of the building can be calculated according to Equations (1) and (2).
where 4.19 is the specific heat capacity of water; is the heat consumption in 10 min, GJ; ν is the speed of water flow, m3/h; is the temperature of the inlet water, °C; is the temperature of the outlet water, °C; and is the heat consumption of the entire heating season, GJ.
2.2.3. Comprehensive Heat Transfer Coefficient of the Envelope
The comprehensive heat transfer coefficient [40] represents the comprehensive thermal performance of the building envelope, and it can be seen from Equation (3) that it is only related to the heat transfer coefficient and area of the exterior wall, exterior window, and roof. The comprehensive heat transfer coefficient is introduced to explore the relationship between the actual heat consumption of green buildings and the performance of the envelope structure and whether the theoretical overall thermal performance of envelope can represent the actual thermal performance of the building envelope.
where is the comprehensive heat transfer coefficient, W/(m2·K); is the heat transfer coefficient of the external wall, W/(m2·K); is the heat transfer coefficient of the external window, W/(m2·K); is the heat transfer coefficient of the roof, W/(m2·K); is the area of the external wall, m2; and is the area of the external window, m2.
2.2.4. Comprehensive Heat Loss Coefficient of the Envelope
The building heat loss coefficient [41] is defined as the heat loss of the unit building area when the temperature difference between indoors and outdoors Δ t = 1 K. The comprehensive heat loss coefficient adopted in this study is different from the previous concept in definition. It is related to the actual building heat consumption and building envelope area. It is defined according to Equations (7)–(9). The comprehensive heat loss coefficient calculated by the actual heat consumption and envelope area of the building implies the ultimate influence of the thermal performance, area, window-wall ratio, operation mode, and other factors on the heat consumption of the building envelope. The concept of the comprehensive heat loss coefficient of the envelope is introduced to represent the actual heat consumption of buildings, and the comprehensive heat loss coefficient is then optimized based on the measured data of building heat consumption and the heat transfer coefficient of external windows, external walls, and roofs, so as to establish a closer relationship between the thermal performance of the envelope and the actual heat consumption of buildings.
where is the average building heat consumption, W; is the total heat consumption of the building heating season, GJ/a; represents the heating days in winter; and is the area of the external wall, m2.
2.3. Sensitivity Analysis
Sensitivity analysis primarily studies the contribution of one variable change to another variable change. In the process of the study, other parameters are fixed and only independent variables are changed to observe their influence on dependent variables. Relevant research shows that the change of energy consumption of building calculation after changing some design parameters is significantly larger than other parameters. Therefore, it is said that the sensitivity of these parameters is higher, so more attention should be paid to the design process and specifications. In order to accurately describe the sensitivity of a single variable to another variable, the sensitivity coefficient has been used as an evaluation index in this study, which is calculated according to Equation (10). We used the dimensionless form of change of the input and output variables in the formula.
where is the sensitivity coefficient, is the input variable, and is the output variable.
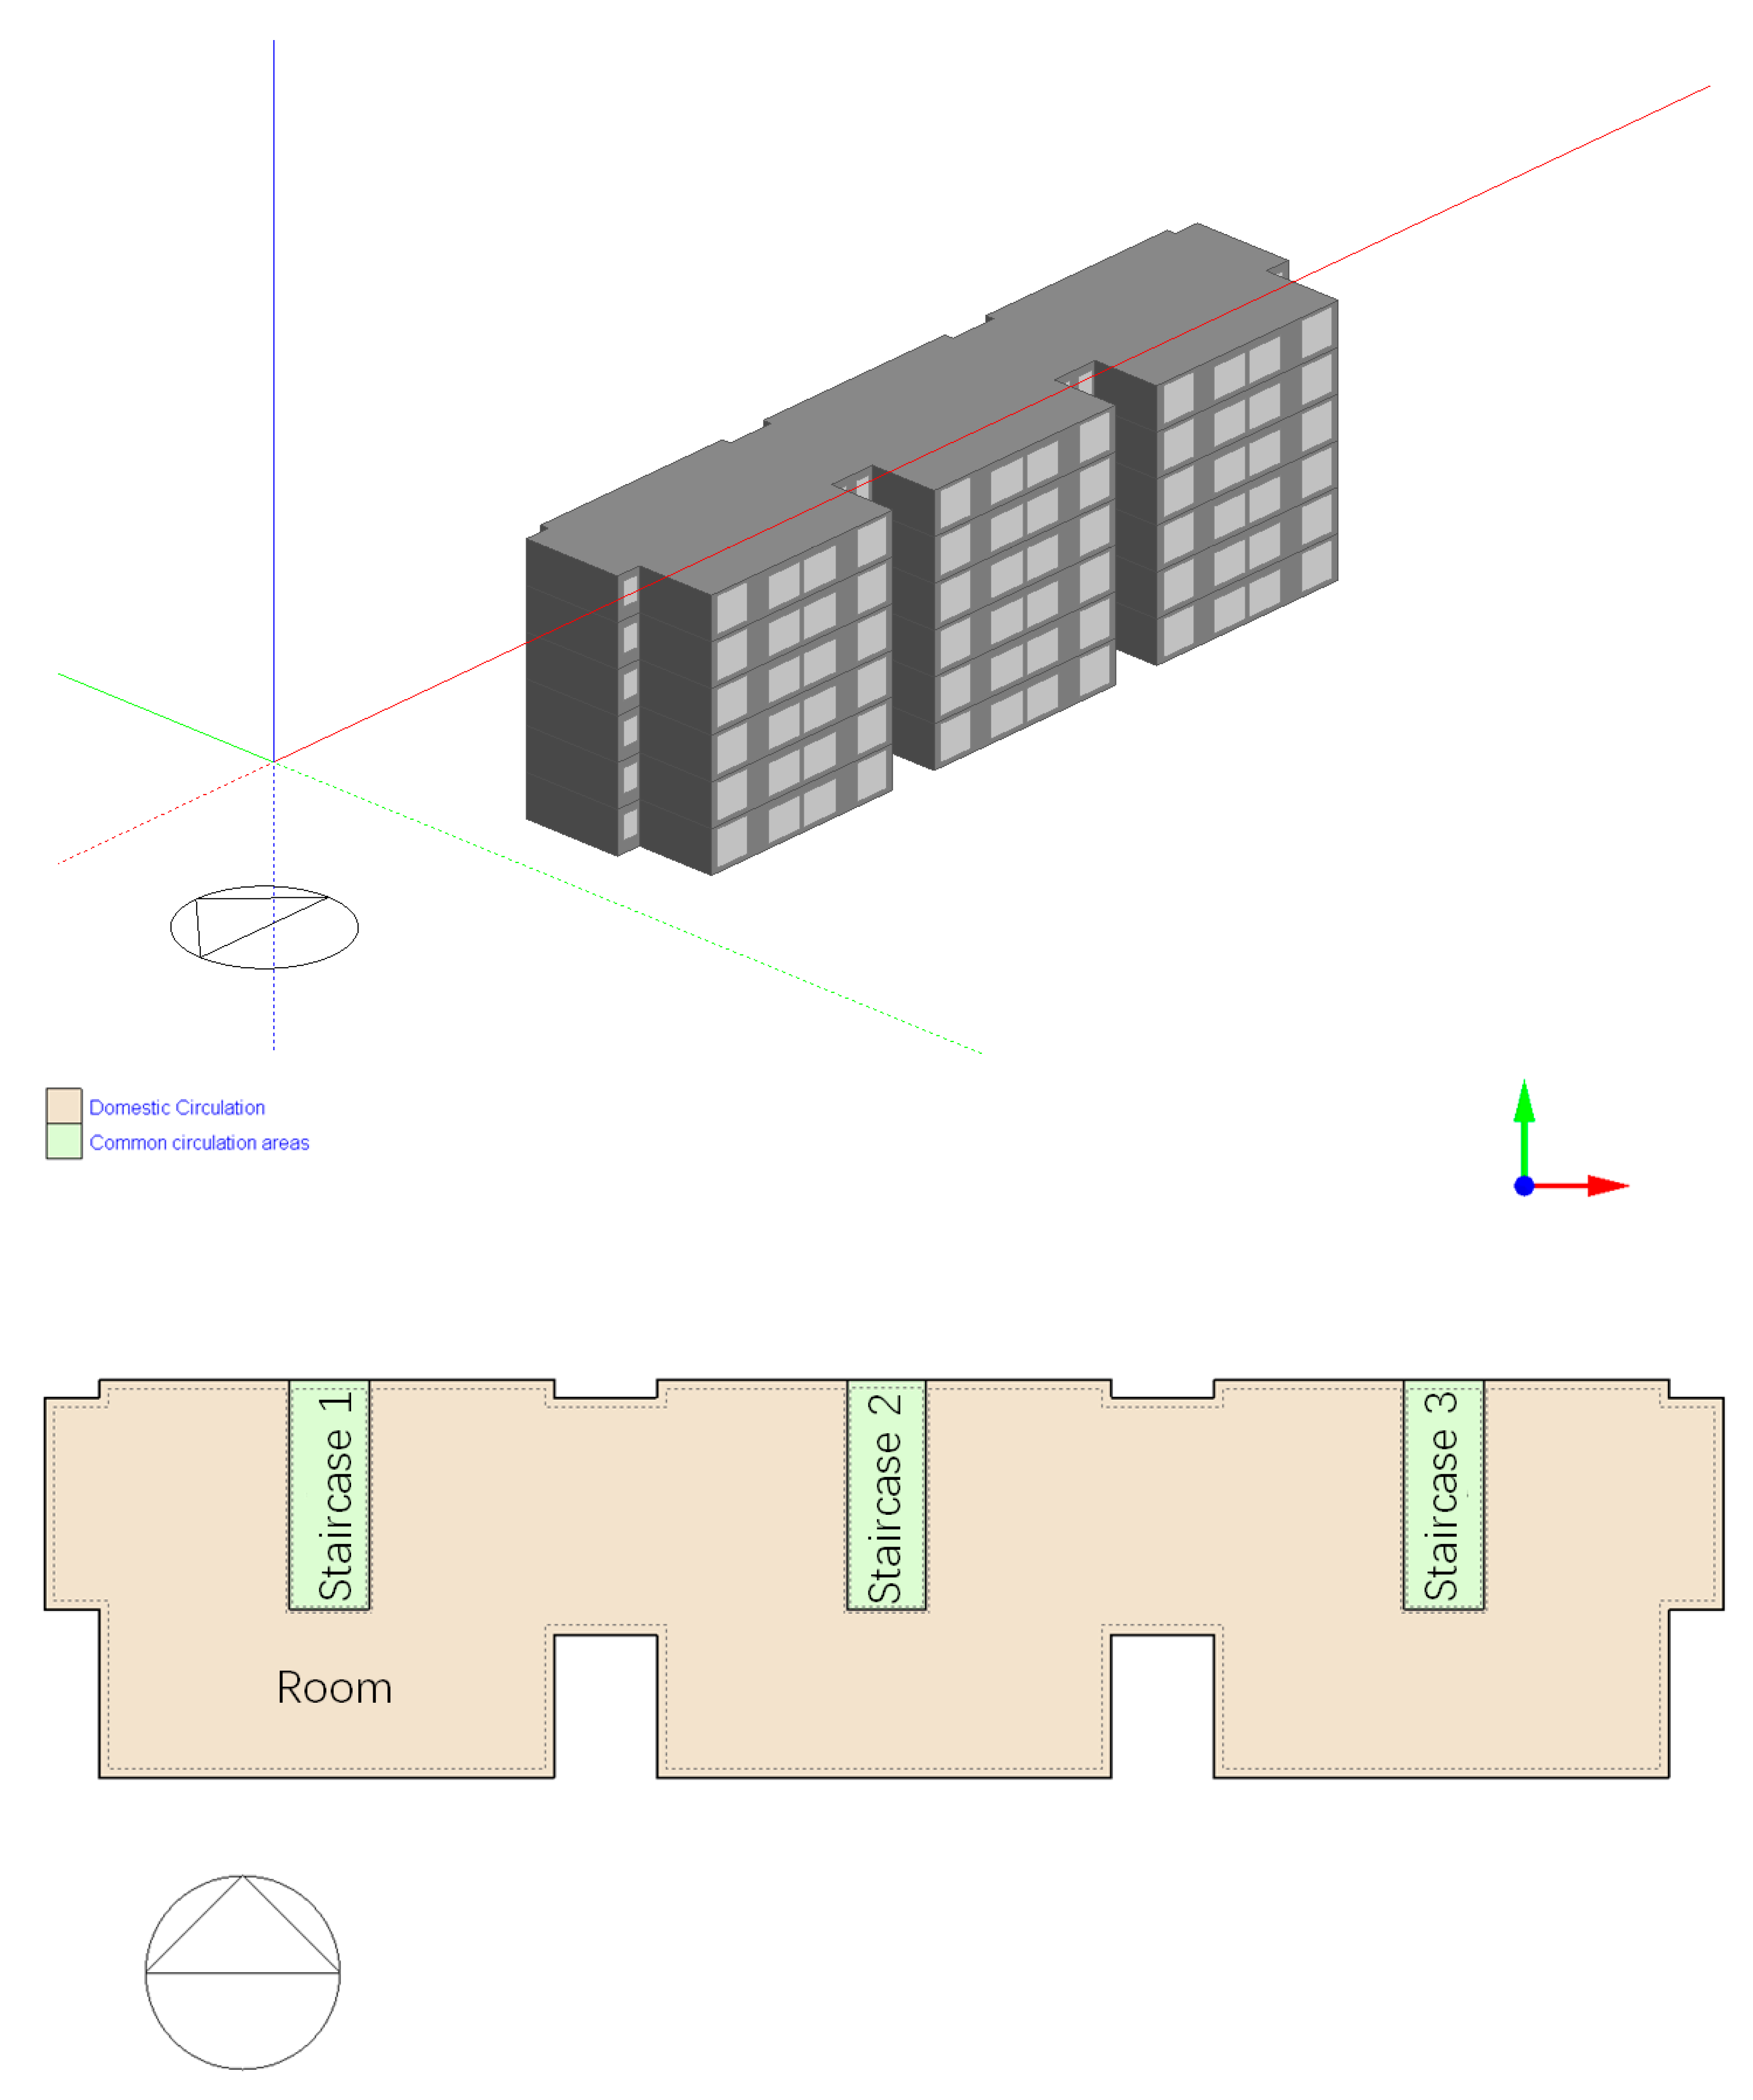
The relationship between the factors influencing the comprehensive heat loss coefficient of the envelope is complex, and the existing analysis theory is not sufficient to establish the analytic function relation model in line with the actual situation. Therefore, we took the field measurement project in the cold region as an example and used the Design Builder for simulation, analyzing the change of comprehensive heat loss coefficient by changing the input quantity of envelope parameters. The energy consumption model is based on projects 1 and 10, as shown in Figure 3 and Figure 4. And the building models are added in the Appendix A.
2.4. Life Cycle Assessment (LCA) and Cost Analysis
2.4.1. Life Cycle Assessment (LCA)
LCA is used to study the energy consumption and environmental impact of the building’s life cycle. There are five common types of environmental impacts of building materials: non-renewable resource consumption (ADP), non-renewable energy consumption (PED), greenhouse effect (GWP), acidification effect (AP), and eutrophication (EP). This study focuses on energy consumption and the resulting carbon dioxide emissions. Therefore, PED and GWP were selected as environmental impact assessment indicators for green building envelope materials, and a quantitative analysis of different building envelopes was conducted. Table 3 and Table 4 present the unit environmental impact equivalents of different types of insulation layer and external window with a 50-year cycle, respectively. According to the data, the environmental impacts of different building envelope practices were quantified.
2.4.2. Cost Analysis
In addition to improving the thermal performance and reducing the environmental impact, the design of the green building envelope needs to pay attention to reducing the economic costs. We obtained the material prices from the China Building Material Online Website [43]. Table 5 and Table 6 summarize the unit prices of the insulation layer and window types, respectively. According to the data, the costs of different building envelope practices can be quantified.
2.5. Multi-Index Evaluation
The method of using multiple indexes to evaluate an object is known as multi-index evaluation. The basic idea is to transform multiple indicators into one indicator that can reflect the comprehensive situation for evaluation. Improvement of the thermal performance of the building envelope is often accompanied by an increase of the cost and environmental load. To measure the quality of the building envelope, we should not only focus on the thermal performance, but also evaluate the practice of the building envelope from multiple perspectives. Therefore, this study established a multi-index evaluation model, Equation (11), and selected the heat transfer coefficient, cost, non-renewable energy consumption (PED), and greenhouse effect (GWP) as indicators from the aspects of the environment, cost, and thermal performance, to evaluate the green building envelope in a cold area. The indexes of different enclosures are quantized and dimensionless and the corresponding database was obtained. The multi-index evaluation model combined with the database was used to evaluate and select the best green building envelope.
where Z is the comprehensive score, is the weight value of each index, is the dimensionless index of the Heat Transfer Coefficient, is the dimensionless index of non-renewable energy consumption, is the dimensionless index of the greenhouse effect, and is the dimensionless index of cost.
3. Analysis
3.1. Heat Consumption Simulation
3.1.1. Residential Building
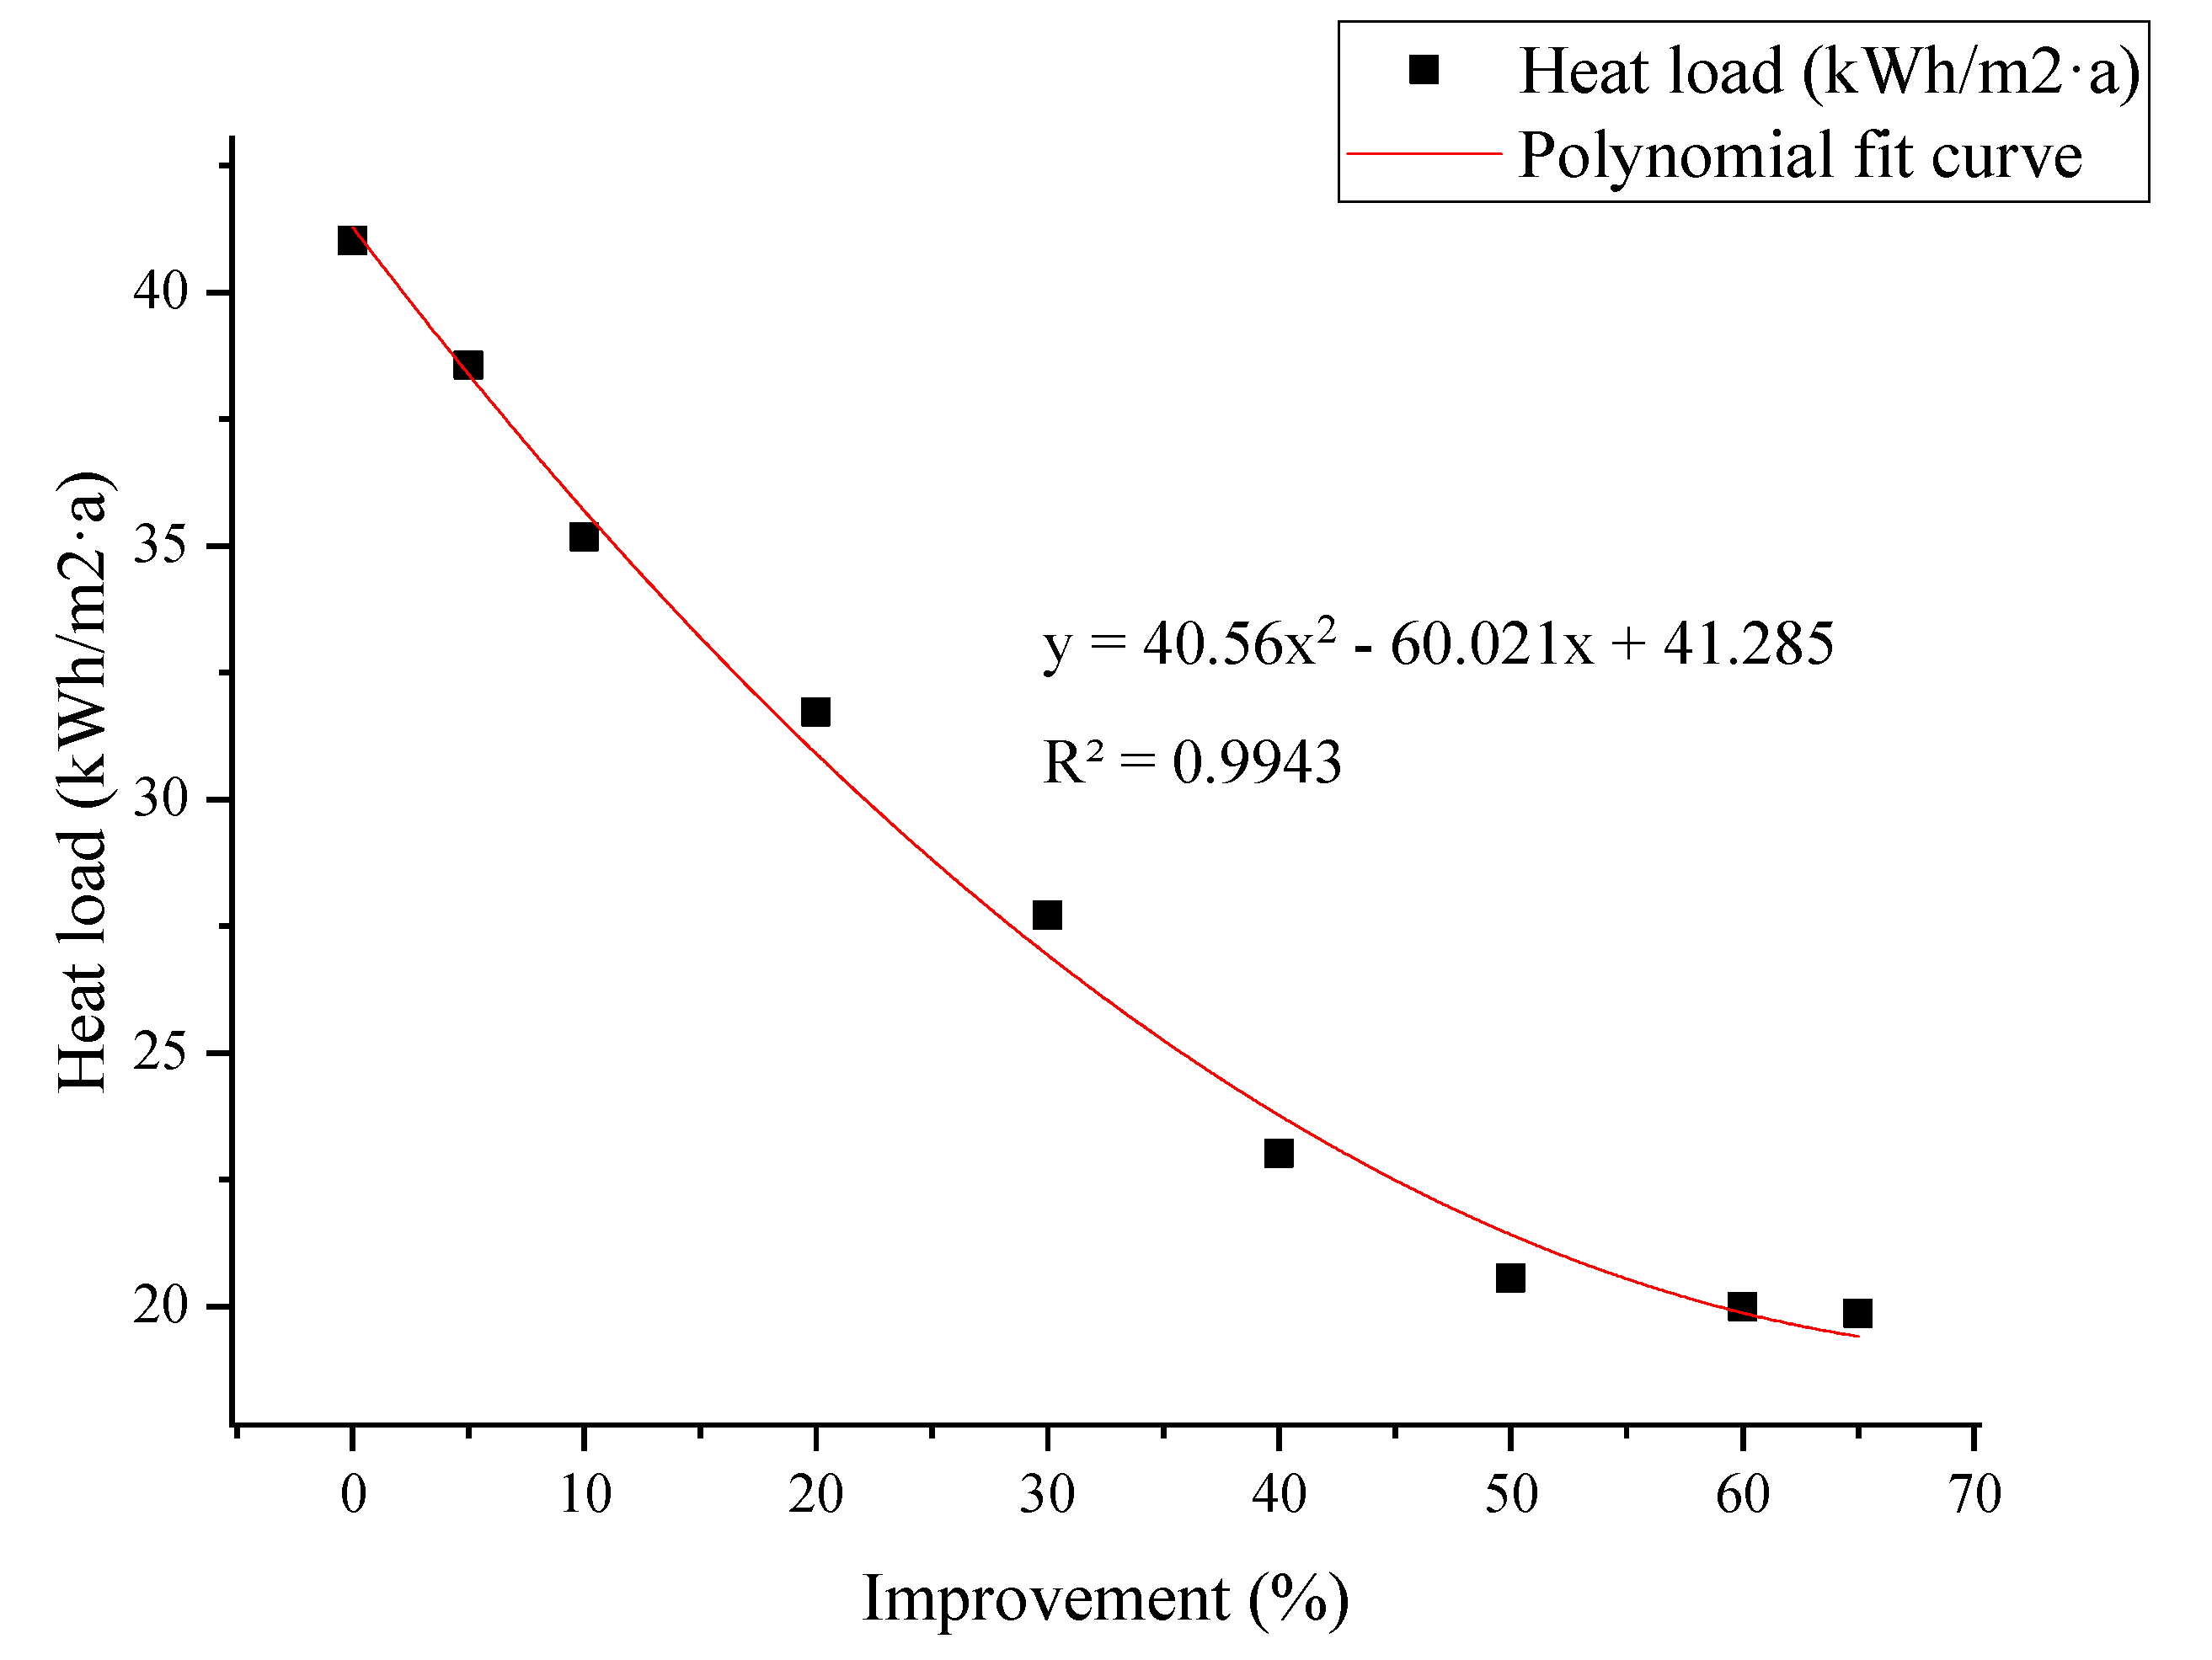
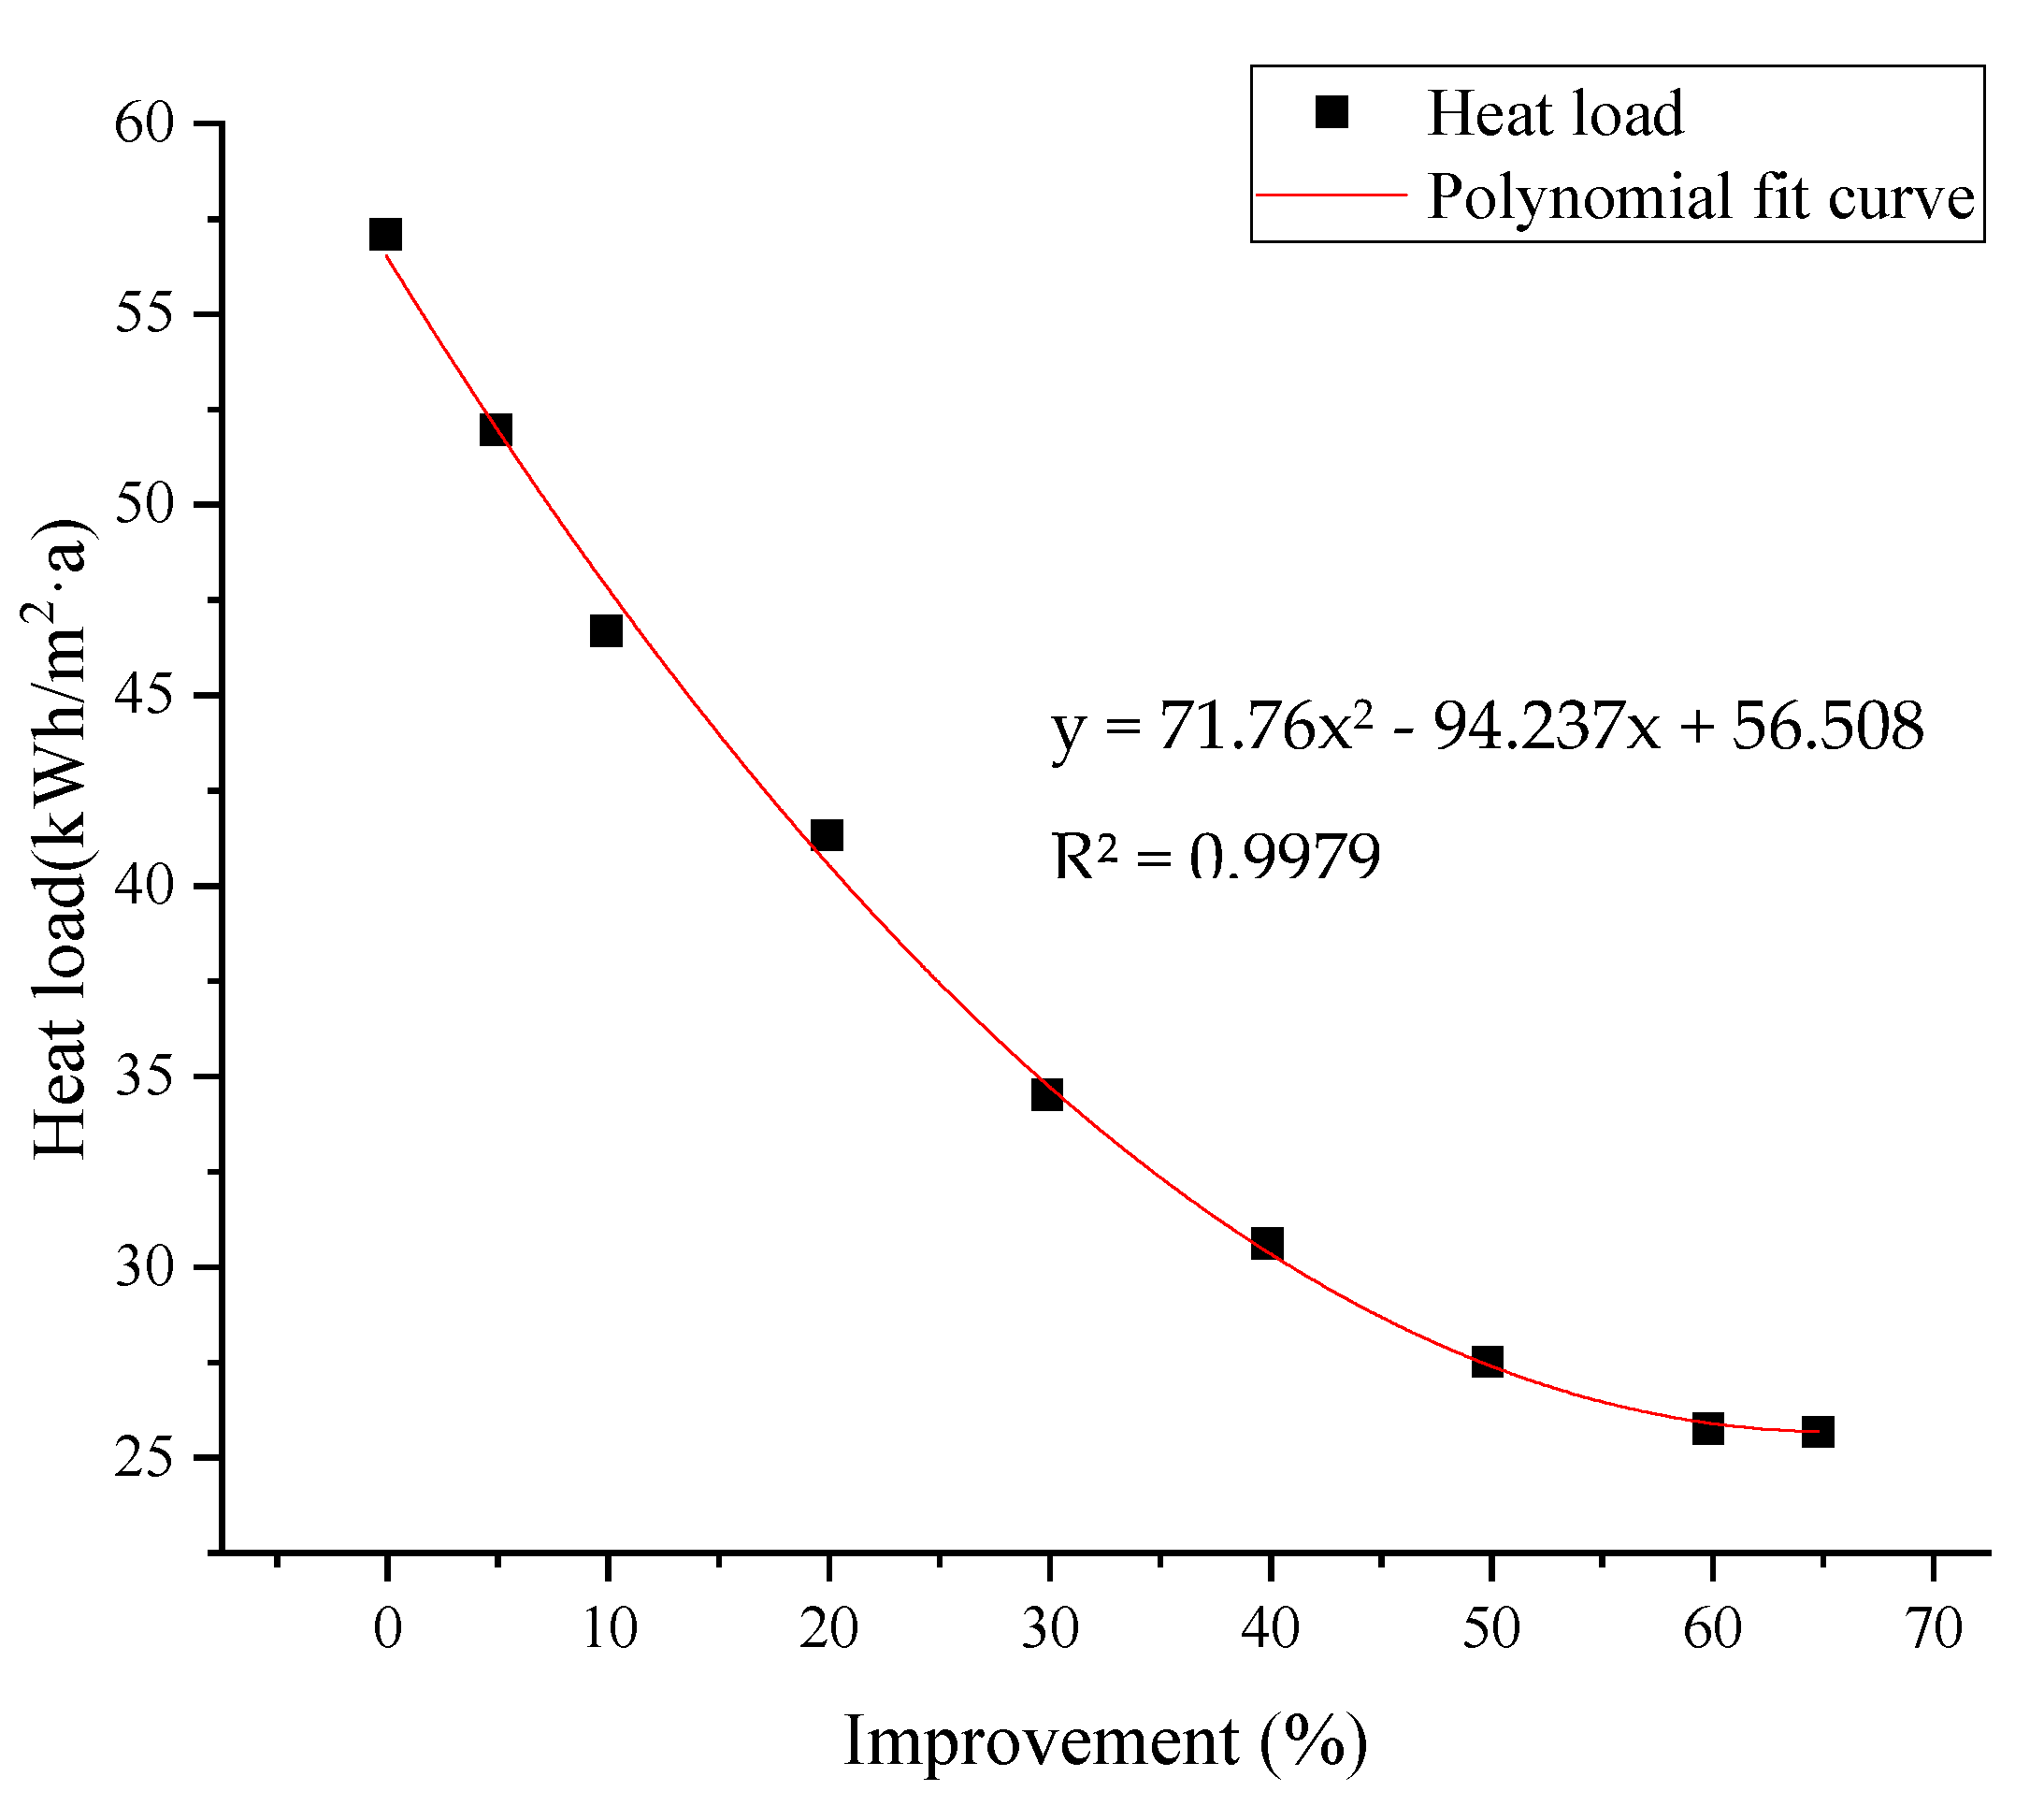
The simulation results of the winter heat consumption of residential buildings in cold regions are shown in Table 7. When the thermal performance of the building envelope is improved by 65%, close to the nZEB level, the heat load per unit area decreases by 22.23 kWh/m2. Figure 5, drawn from Table 7, reflects the relationship between the thermal performance and heat consumption of residential buildings in cold regions, which can be expressed by a polynomial equation. It can be seen that when the thermal performance of the enclosure is improved by less than 40%, the building energy consumption decreases significantly; when the lifting range is more than 40%, the decreasing rate of the thermal load slows down significantly.
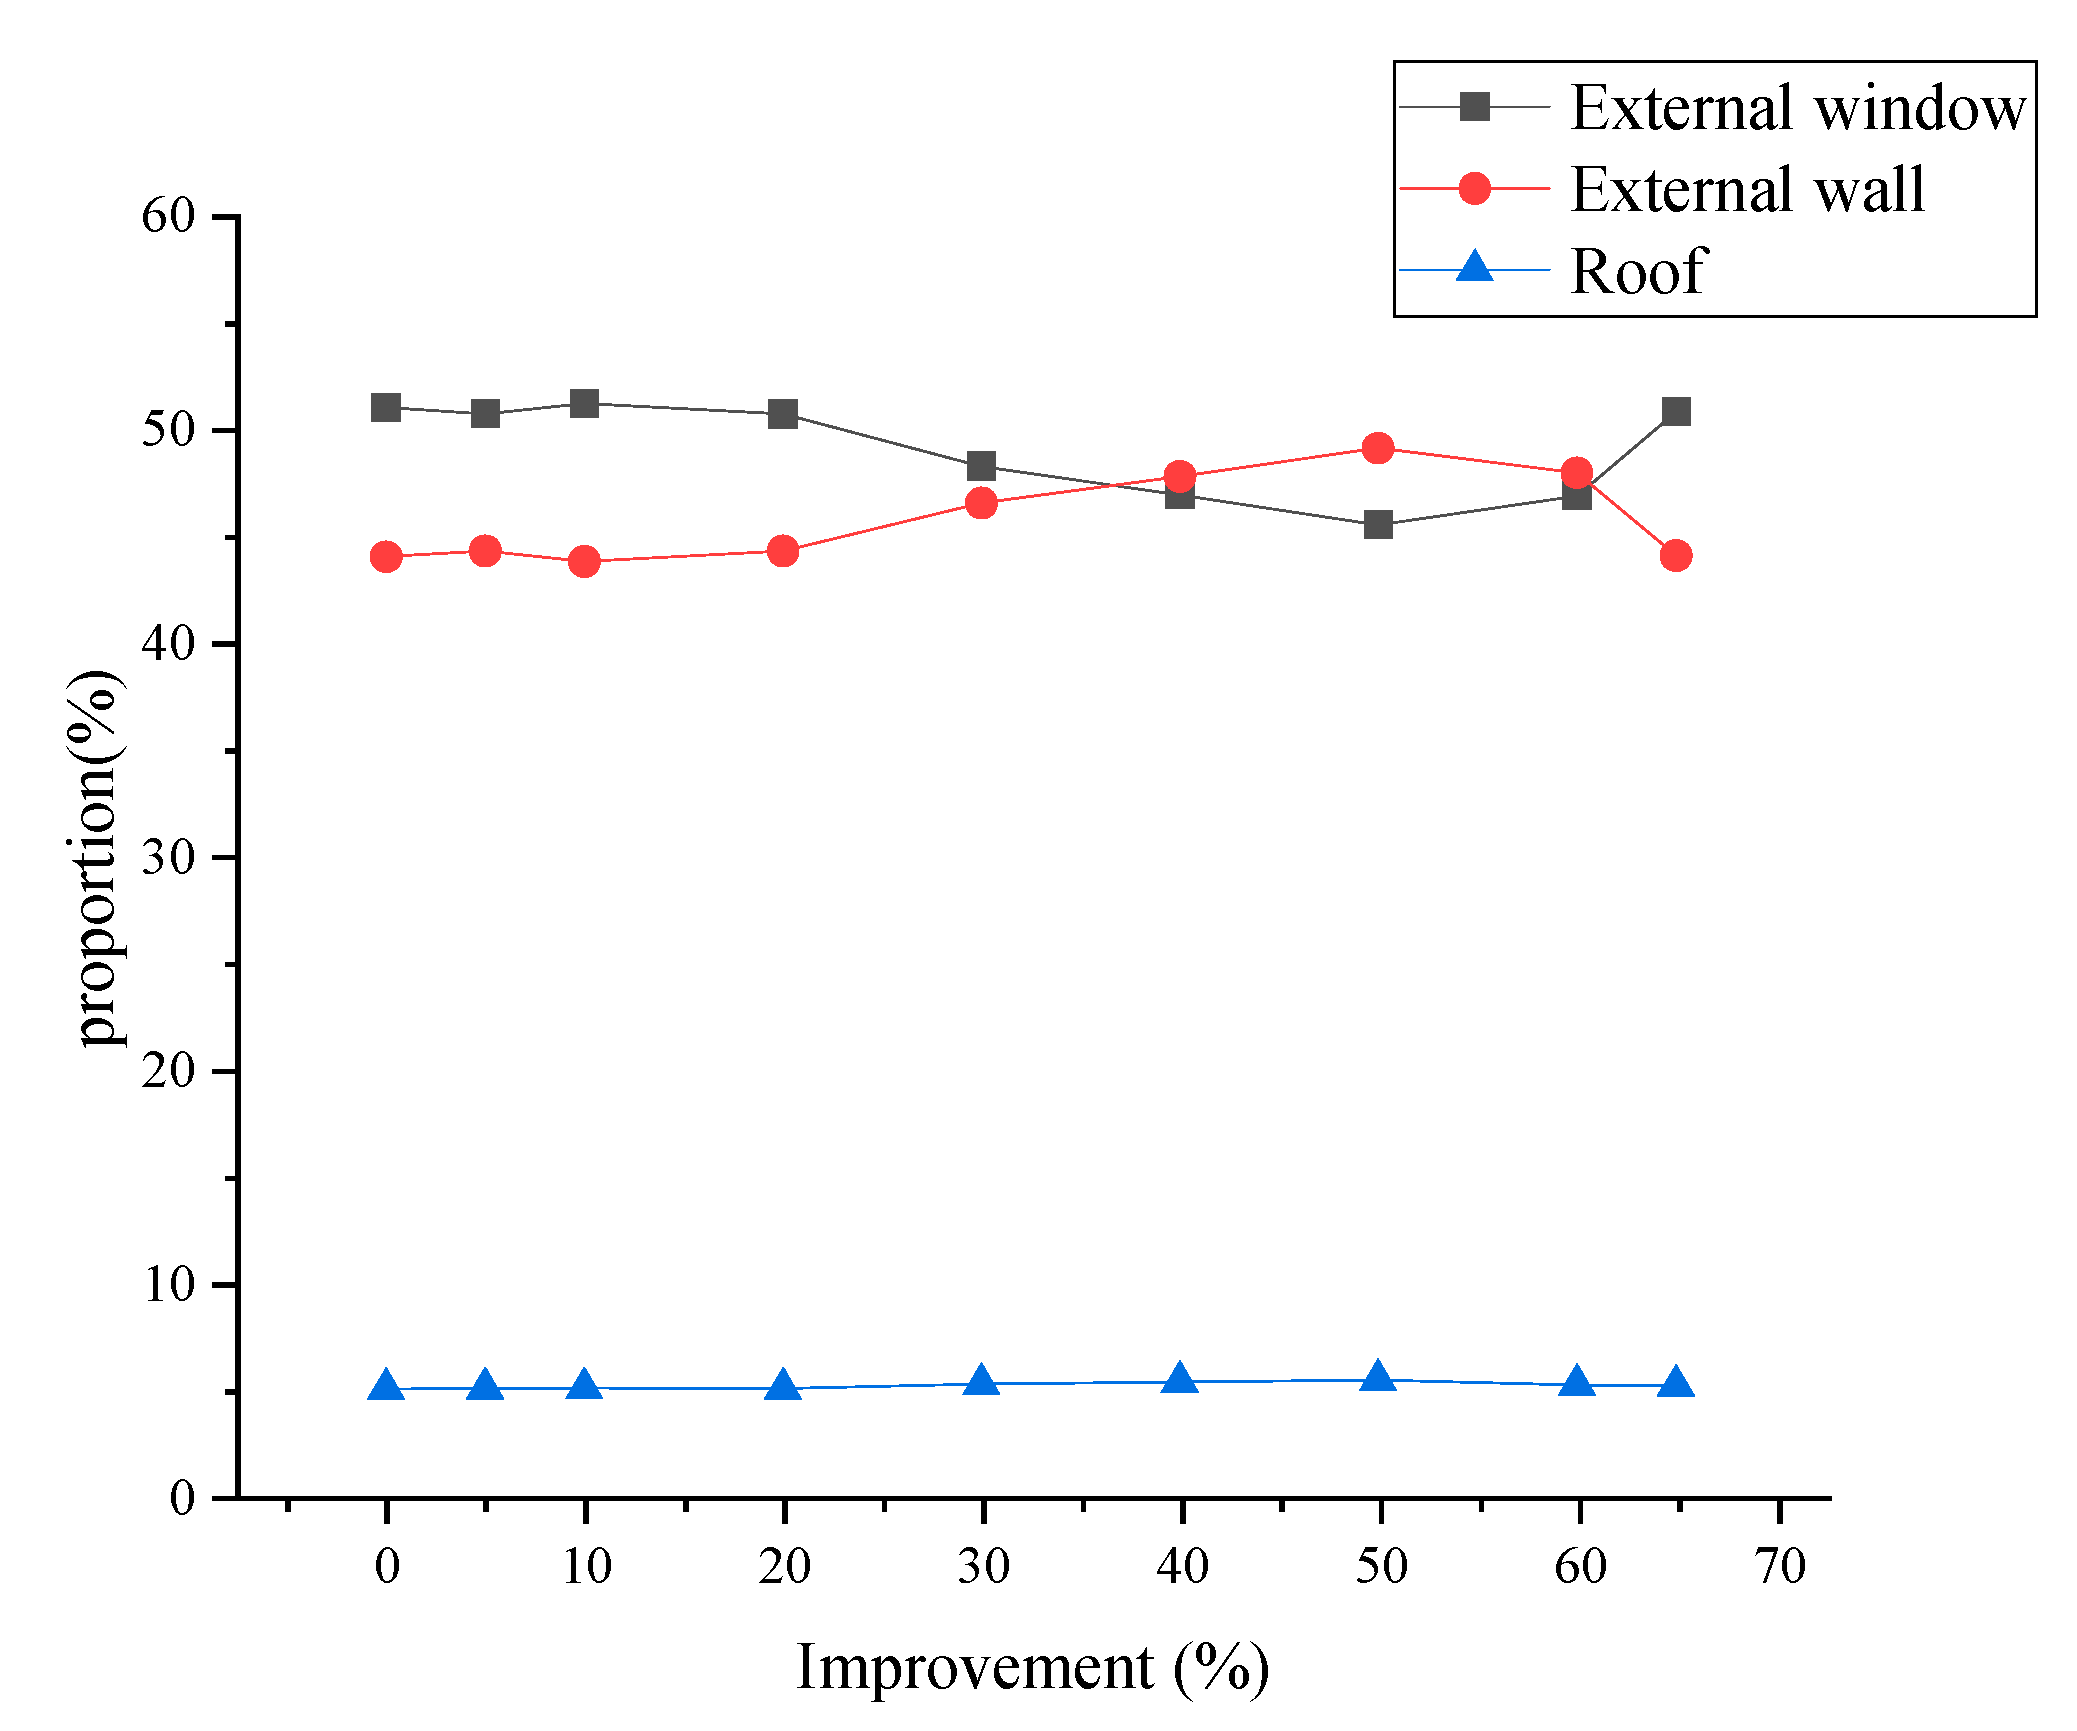
Table 8 and Figure 6 show the proportion of heat load in each part of the residential building envelope in the cold area. The heat load formed by the external window was the highest at the beginning, accounting for 51.02%. With the gradual improvement of the thermal performance of the external window, its proportion began to decline, and the proportion of the outer wall began to increase. When the thermal performance is improved by 40%, the proportion of heat load of the external wall reaches the highest value of 47.8% and that of the external window is 46.92%. When the thermal performance reaches the standard of nZEB, the proportion of external window is 50.81% and that of the external wall is 44.08%. The proportion of heat load on the roof fluctuates from 4.95% to 5.38%. The average values were 49.12%, 45.77%, and 5.11%, respectively.
3.1.2. Public Buildings
The calculation results of the heat transfer coefficient and heat load of the public building envelope in a cold area are shown in Table 9. When the thermal performance is increased by 65%, the heat load per unit area decreases by 31.51 kWh/m2. Compared to residential buildings, public buildings have greater energy saving potential. It can be seen from Figure 7 that the change trend of heat load with the improvement of thermal performance is consistent with that of residential buildings. When the thermal performance of the enclosure is improved by less than 30%, the building energy consumption is significantly reduced. When the lifting range is more than 30%, the decreasing rate of the thermal load slows down significantly. When the lifting range is more than 50%, the thermal performance of the envelope has little effect on the heat load.
Table 10 and Figure 8 show the proportion of heat load in each part of the public building envelope in a cold area. The proportion of load in the three parts fluctuates within a certain range. The proportion of load in the outer window is 64.11–72.18%, the outer wall is 24.14–31.26%, and the roof is 3.68–4.87%. The average values are 69.10%, 26.80%, and 4.10%, respectively.
The range of thermal performance improvement of the enclosure structure should be kept reasonable. If blindly meeting the requirements of the nZEB standard, the building energy efficiency is not the best. In all the simulated prototype buildings, the proportion of heat load in each part of the building envelope is the external window > external wall > roof. It is evident that the external window and the external wall can be used as the key research objects of energy saving work, while the energy saving potential of the roof is low.
3.2. Building Envelope
3.2.1. Investigation of Envelope Practices of Green Buildings in Cold Areas
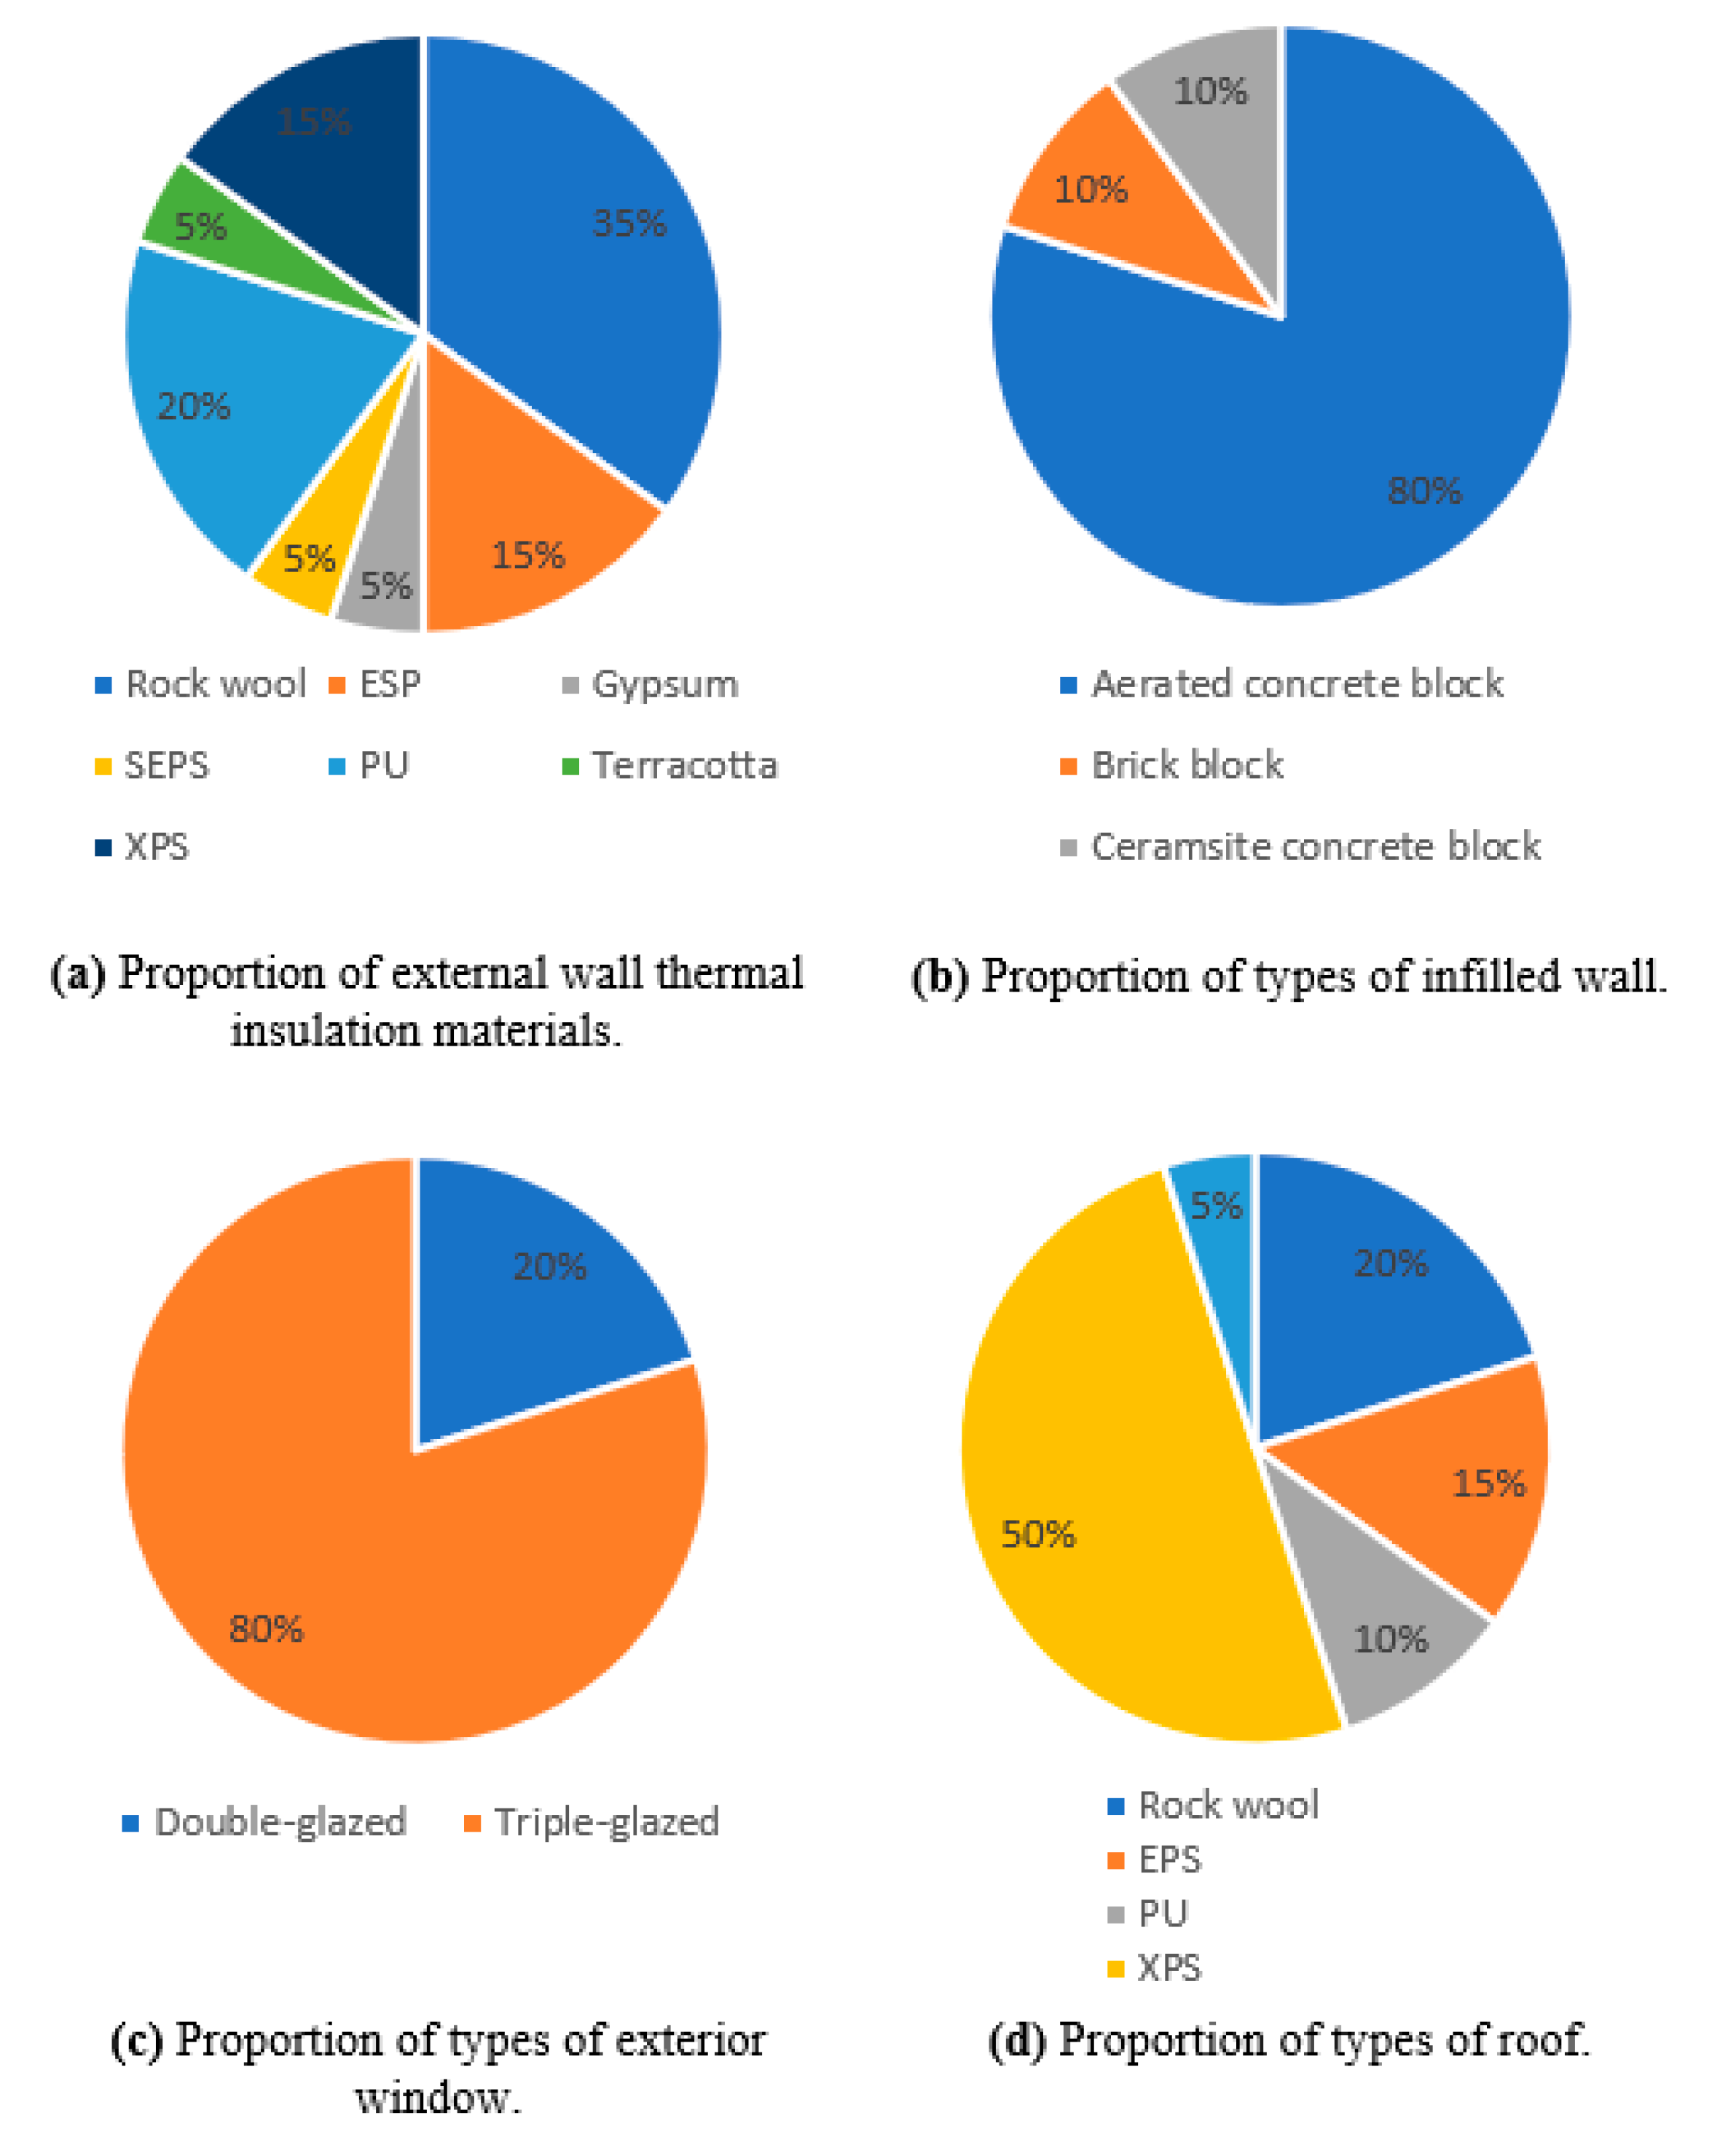
From an investigation of the enclosure structure of 20 green buildings in cold areas, the common practices of exterior walls, roofs, and windows were summarized. Their respective proportions are shown in Figure 9. Among the exterior wall construction materials, rock wool is the main choice of insulation layer, accounting for 35%, followed by PU board, accounting for 20%; XPS board and EPS board represent 15% of the materials. Aerated concrete block is the primary foundation material of green building exterior walls in cold areas, accounting for 80%. The primary choice of thermal insulation materials for roofing construction is XPS board, with a proportion of 35%, and the secondary type is rock wool, accounting for 20%. The outer window type is always a hollow glass type, with double-glazed windows accounting for 80% and triple-glazed windows accounting for 20%. The commonly used thickness of filled walls in green buildings is 200 mm. The average thickness of the external wall insulation layer is 85 mm. The minimum thickness of the roof insulation layer is 60 mm, the maximum is 300 mm, and the average thickness is 110 mm.
Rock wool, PU slab, EPS slab, and XPS slab are commonly used as thermal insulation materials for green buildings in cold regions; aerated concrete block is used as outer wall foundation material; and reinforced concrete is used as floor foundation material. Common practices are shown in Table 11.
3.2.2. Quantitative Analysis of the Thermal Performance of an Envelope
Based on the aerated concrete wall with a thickness of 200 mm and reinforced concrete floor with a thickness of 100 mm, the thermal performance of a non-transparent envelope structure was quantified and the corresponding heat transfer coefficient was obtained. Table 12 and Table 13 present the quantitative results of the thermal performance of exterior walls and roofs with rock wool as insulation material, respectively.
Taking residential buildings in cold areas as an example, a quantitative study of the thermal performance improvement of an envelope structure was carried out. The initial U-values of the exterior wall and roof were 0.7 W/m2·k and 0.45 W/m2·k, respectively.
Table 14 and Table 15 show the level of thermal performance improvement for different insulation exterior walls and roofs. The thermal insulation layer with a 10 mm thickness can significantly improve the thermal performance of the external wall, with an increase of more than 20%. However, the roof needs a PU board of at least a 60 mm thickness to improve thermal performance.
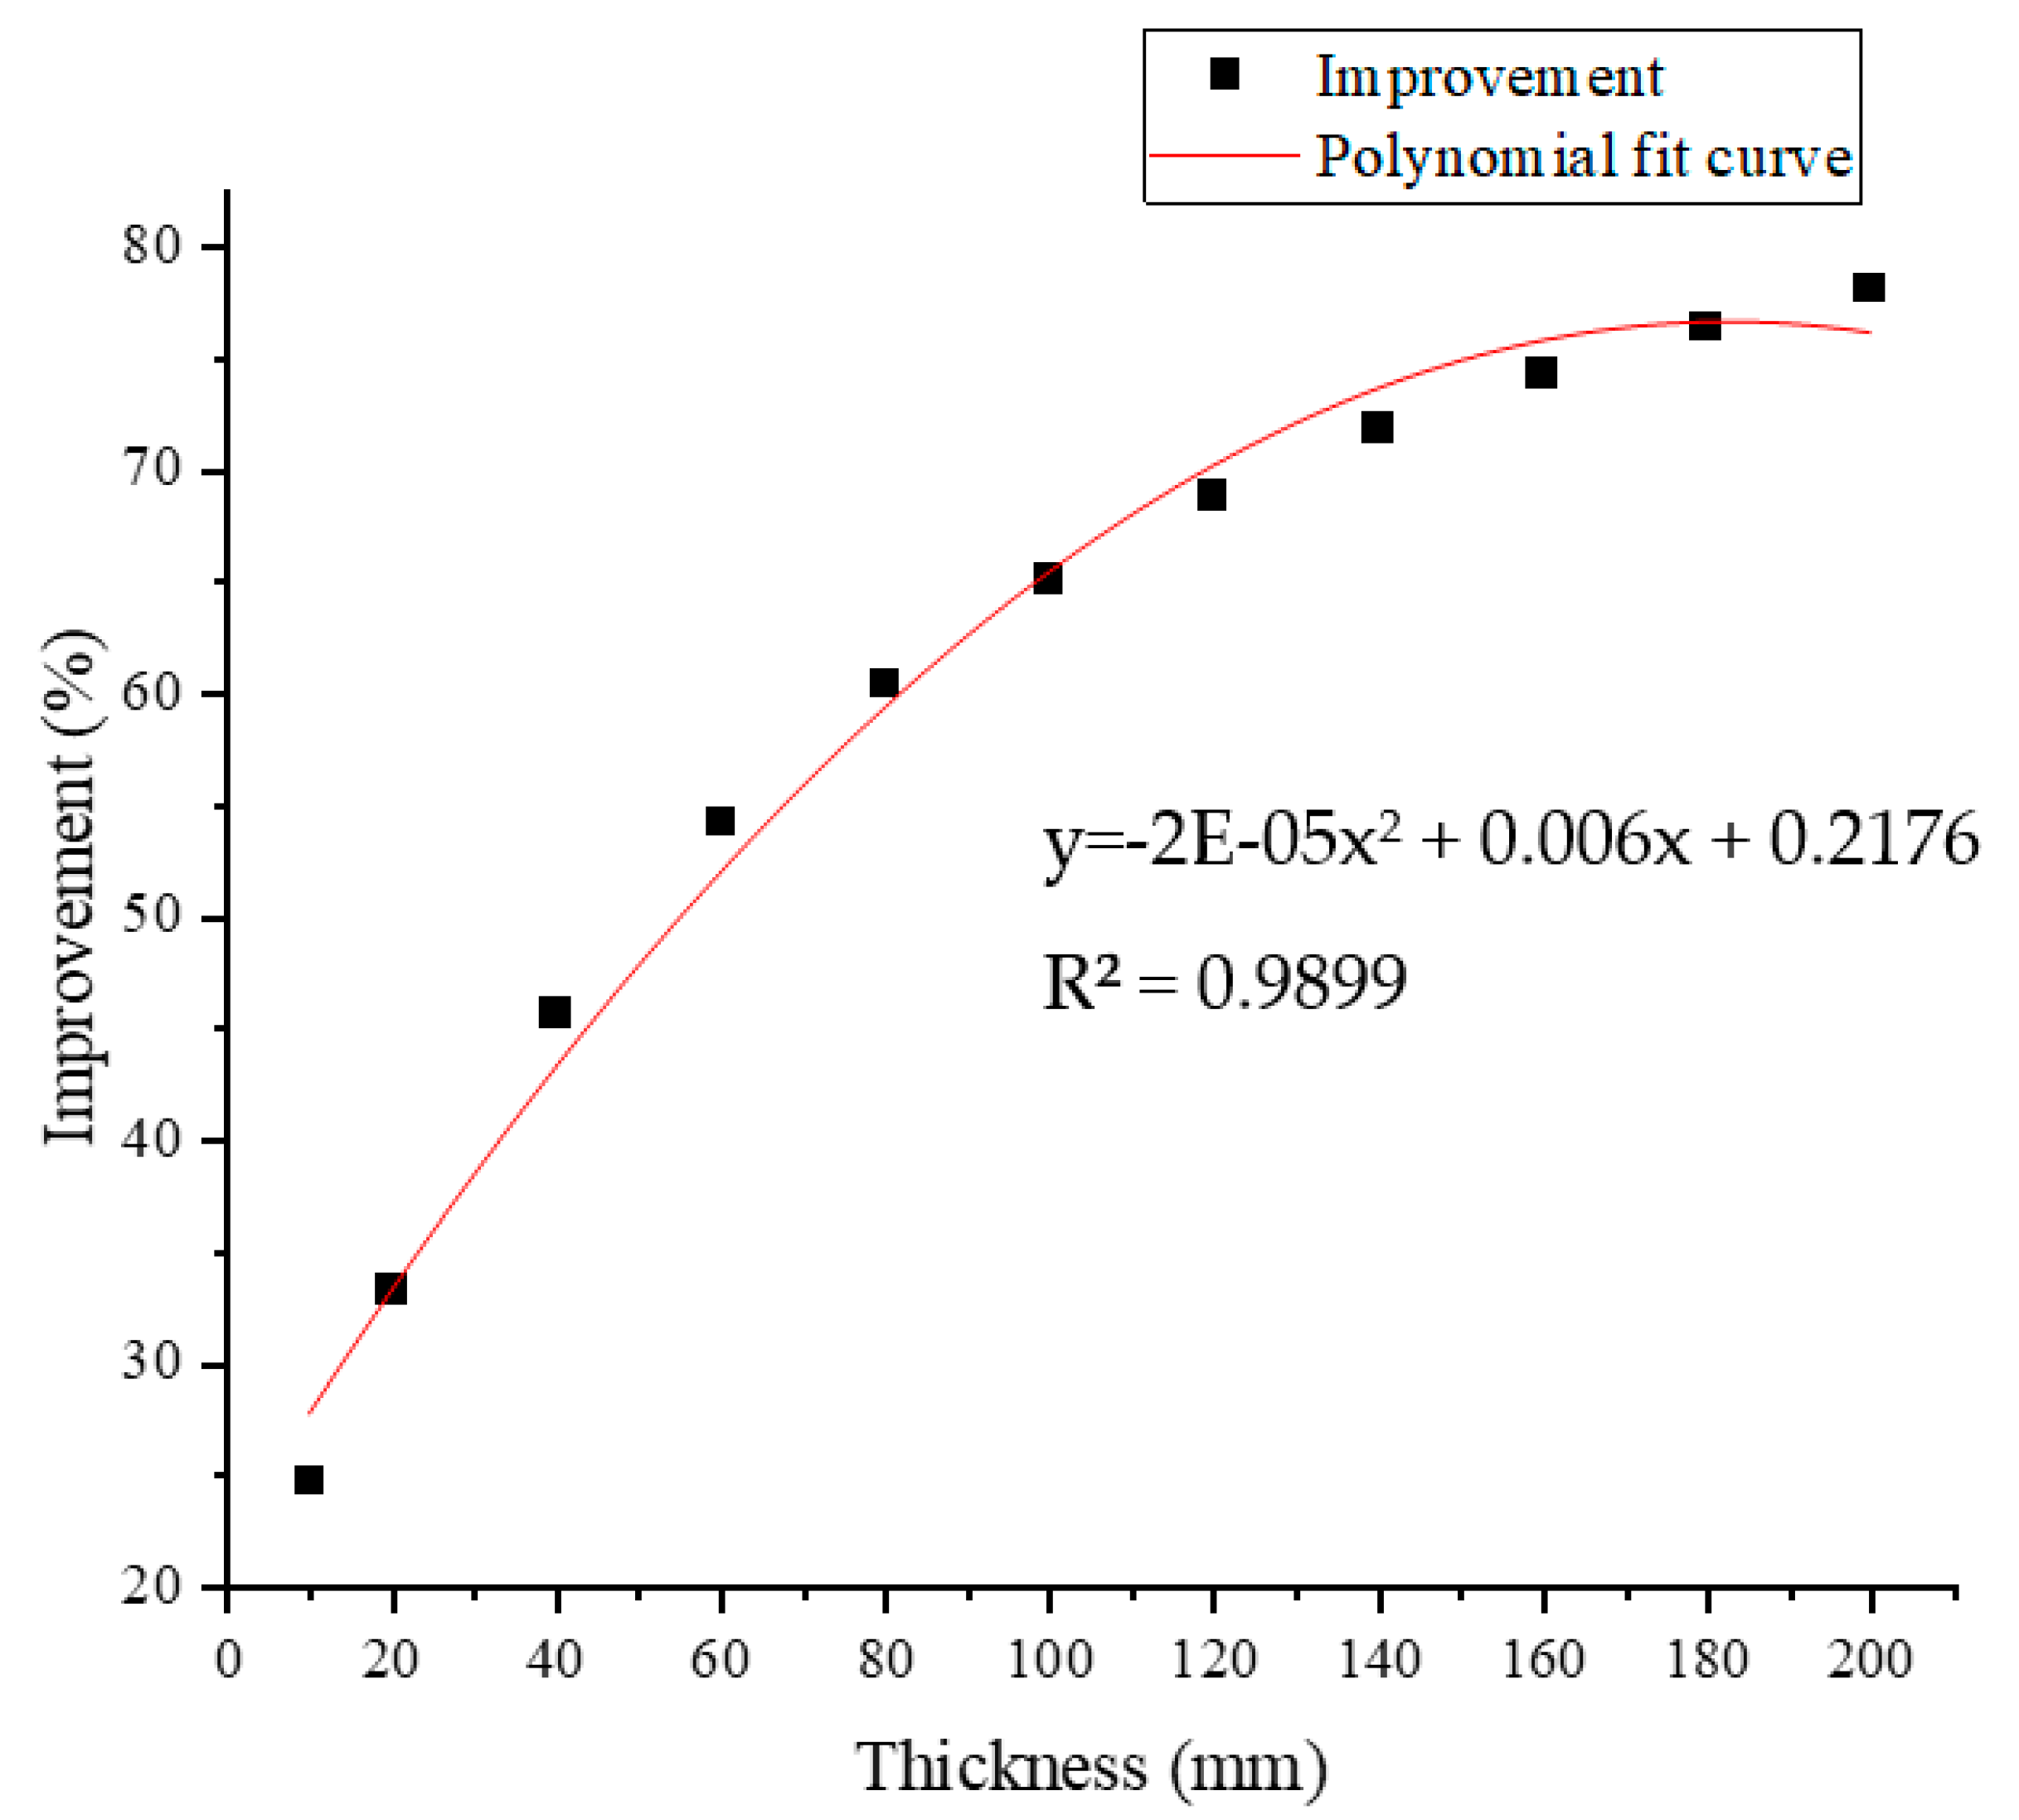
As shown in Figure 10, the thermal performance of a rock wool exterior wall and the thickness of the insulation layer present a quadratic polynomial function relationship. It is apparent that when the thickness of rock wool reaches 140 mm, the thermal performance improvement rate of the external wall begins to slow down.
Figure 11 shows the relationship between the thermal performance of rock wool roofing and the thickness of the insulation layer. From the trend of curve change, it is evident that when the rock wool thickness reaches 230 mm, the thermal performance improvement rate of the roof begins to stabilize.
The thermal performance of a transparent enclosure is not only related to window frame materials, glass types, and other components, but is also affected by the structure of the window frame, filling gas, hollow thickness, and other factors. The common window frames of green buildings are usually PVC or heat broke aluminium alloy. Additionally, 5 mm thick transparent glass and 5 mm thick Low-E thin film glass are usually used. The filling gas is primarily air and argon and the interlayer thickness range is 6–13 mm. In this study, the heat transfer coefficient of the outer window was calculated using the calculation function of the design Builder software and the different parameter combinations which affect the thermal performance of the outer window were input; the heat transfer coefficients of each combination were calculated. Taking a prototype residential building in a cold area as an example, the initial heat transfer coefficient of the outer window is 2.7 W/m2·k. The thermal performance improvement of each type of outer window was calculated, and the results are shown in Table 16.
3.2.3. Quantitative Analysis of the Environmental Impact and Costs of an Envelope
According to the environmental impact of the thermal insulation materials of the envelope in Table 3, the environmental impact of the four thermal insulation layers with different thicknesses was quantified. The results are shown in Table 17 and Table 18. Quantitative indicators of the environmental impact of different types of windows are summarized in Table 4.
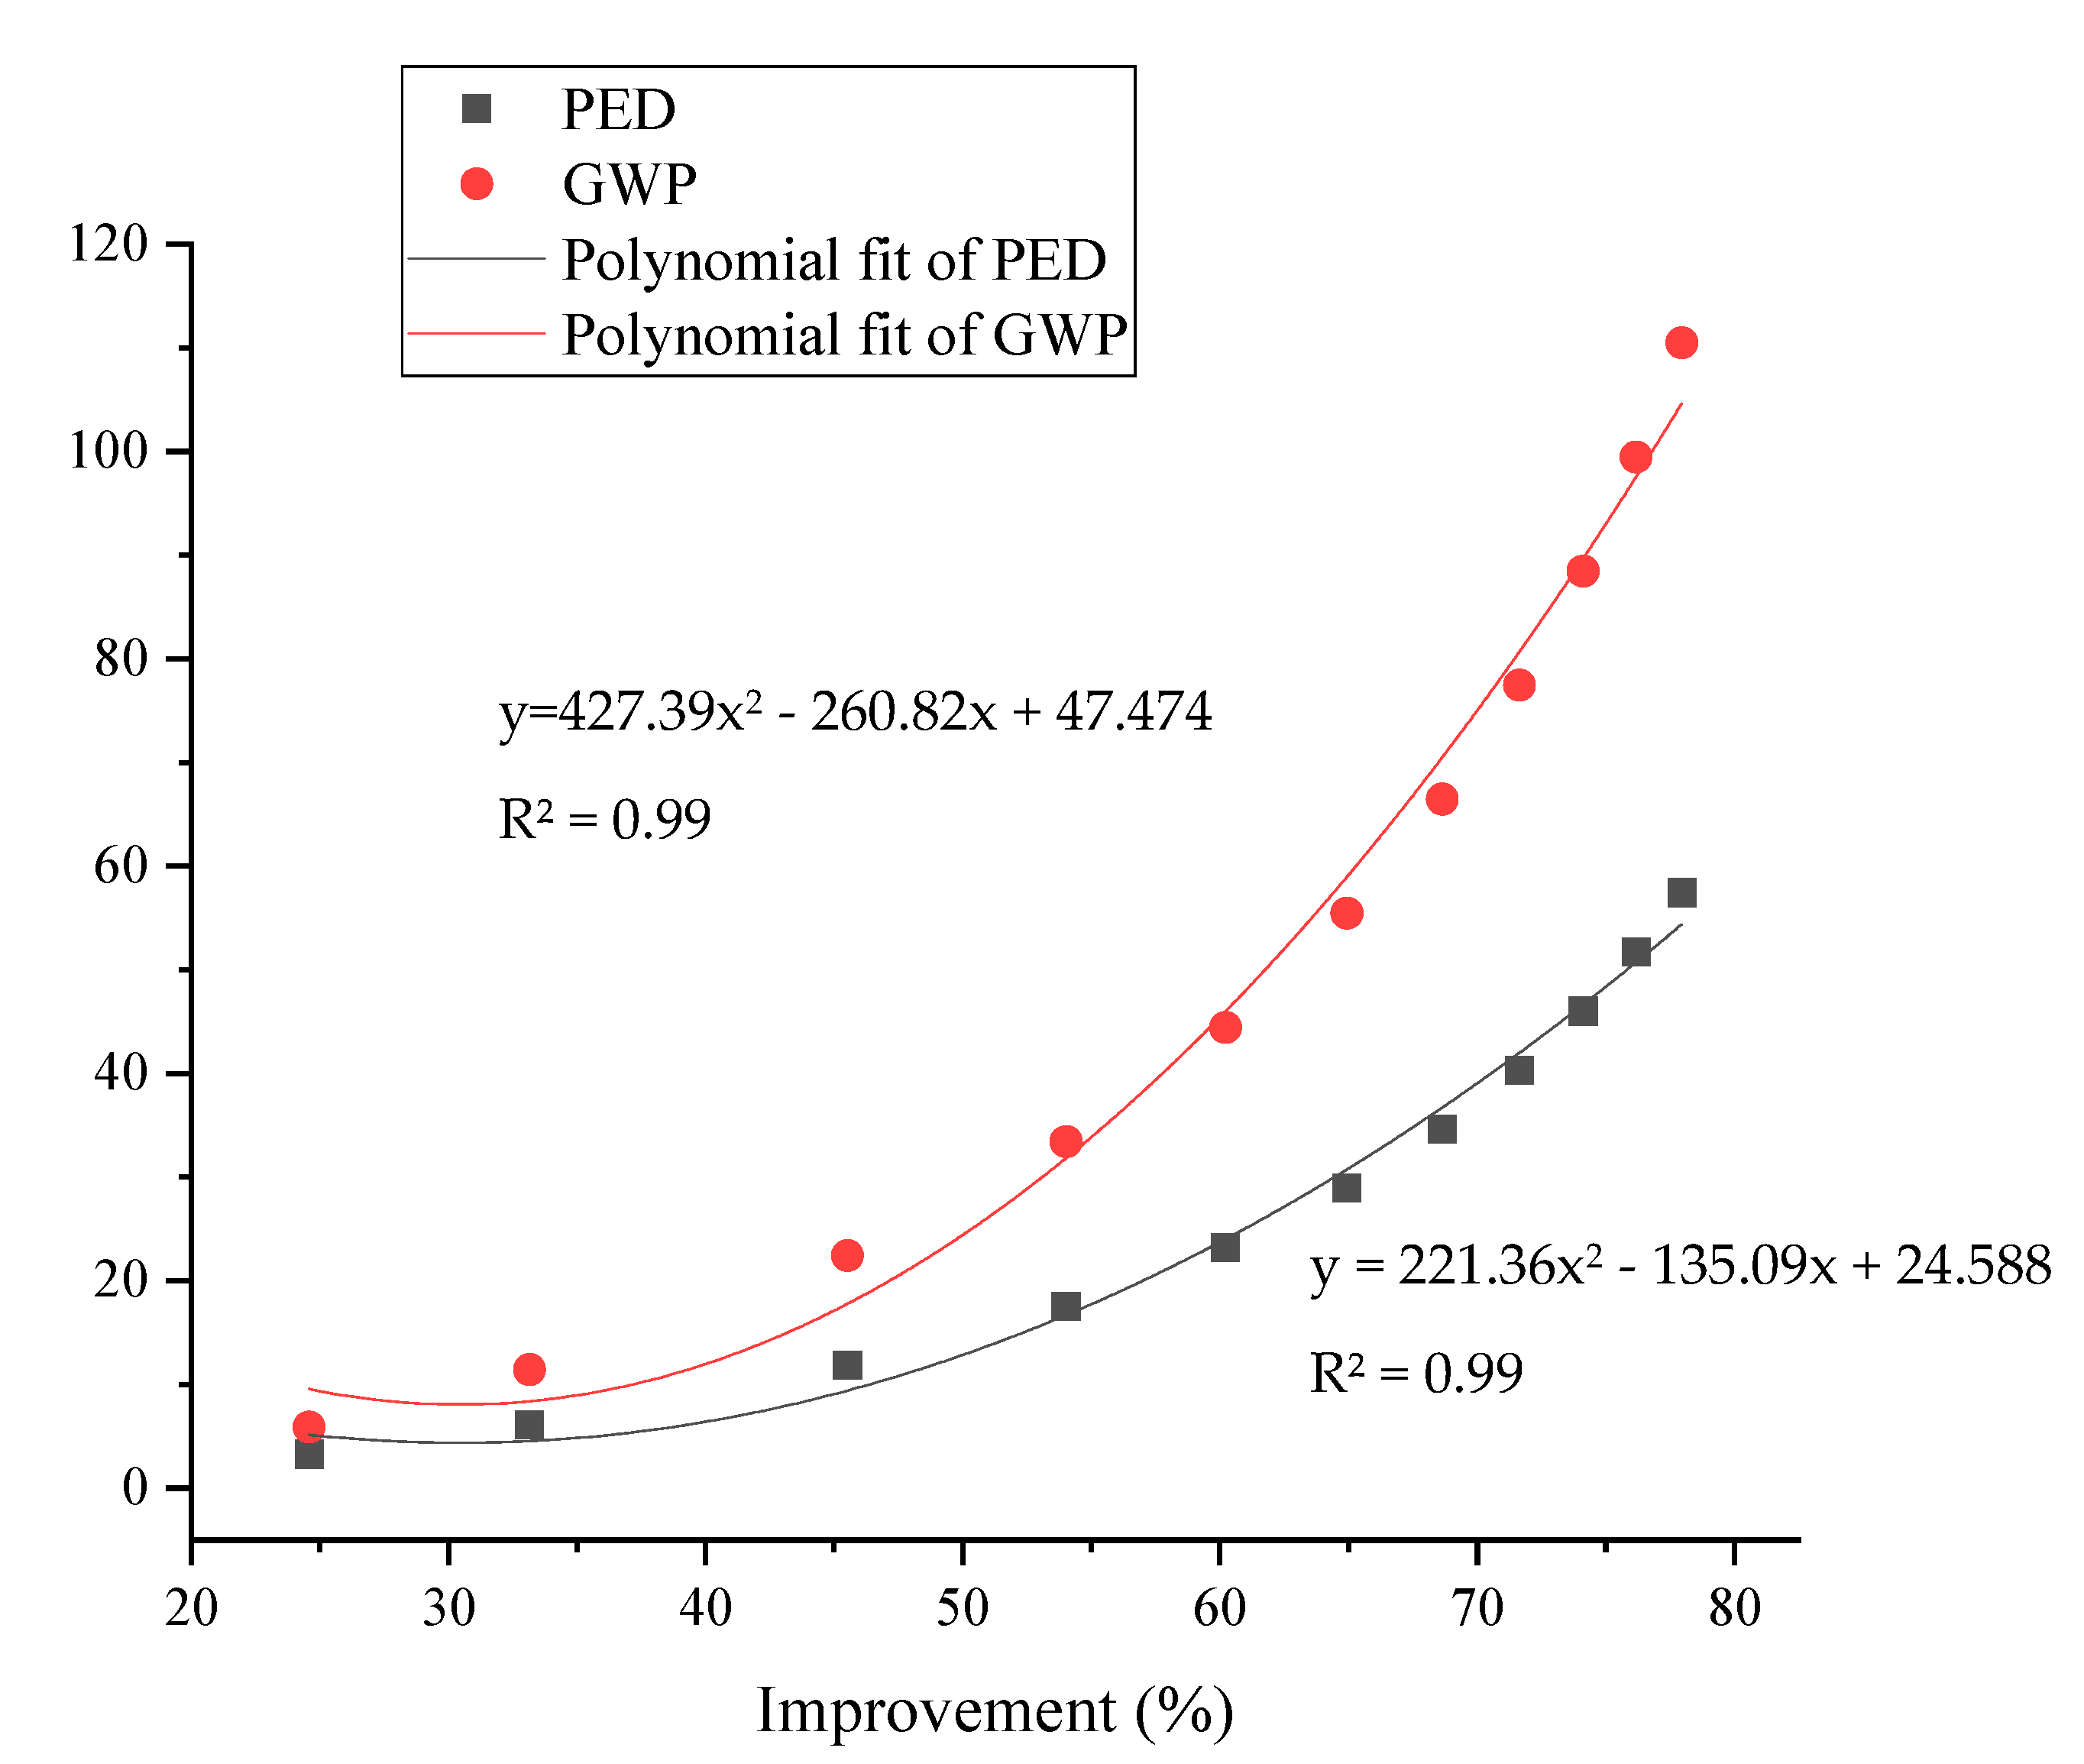
Taking the prototype residential building in a cold area as an example, the environmental impact of the rock wool insulation exterior wall and roof under different thickness of insulation layer was analyzed. The initial heat transfer coefficients of external walls and roofs are 0.7 and 0.45 W/(m2·K) and the results are shown in Table 19. As the thickness of rock wool increases, the thermal performance of exterior walls and roofs gradually improves and the environmental impact indicators also increase. Therefore, the relationship between thermal performance improvement and the environmental impact was quantitatively analyzed.
As shown in Figure 12, when the thermal performance of a rock wool insulation exterior wall is improved within 60%, the environmental impact index changes slowly. When the increase is greater than 60%, the change rates of PED and GWP begin to increase.
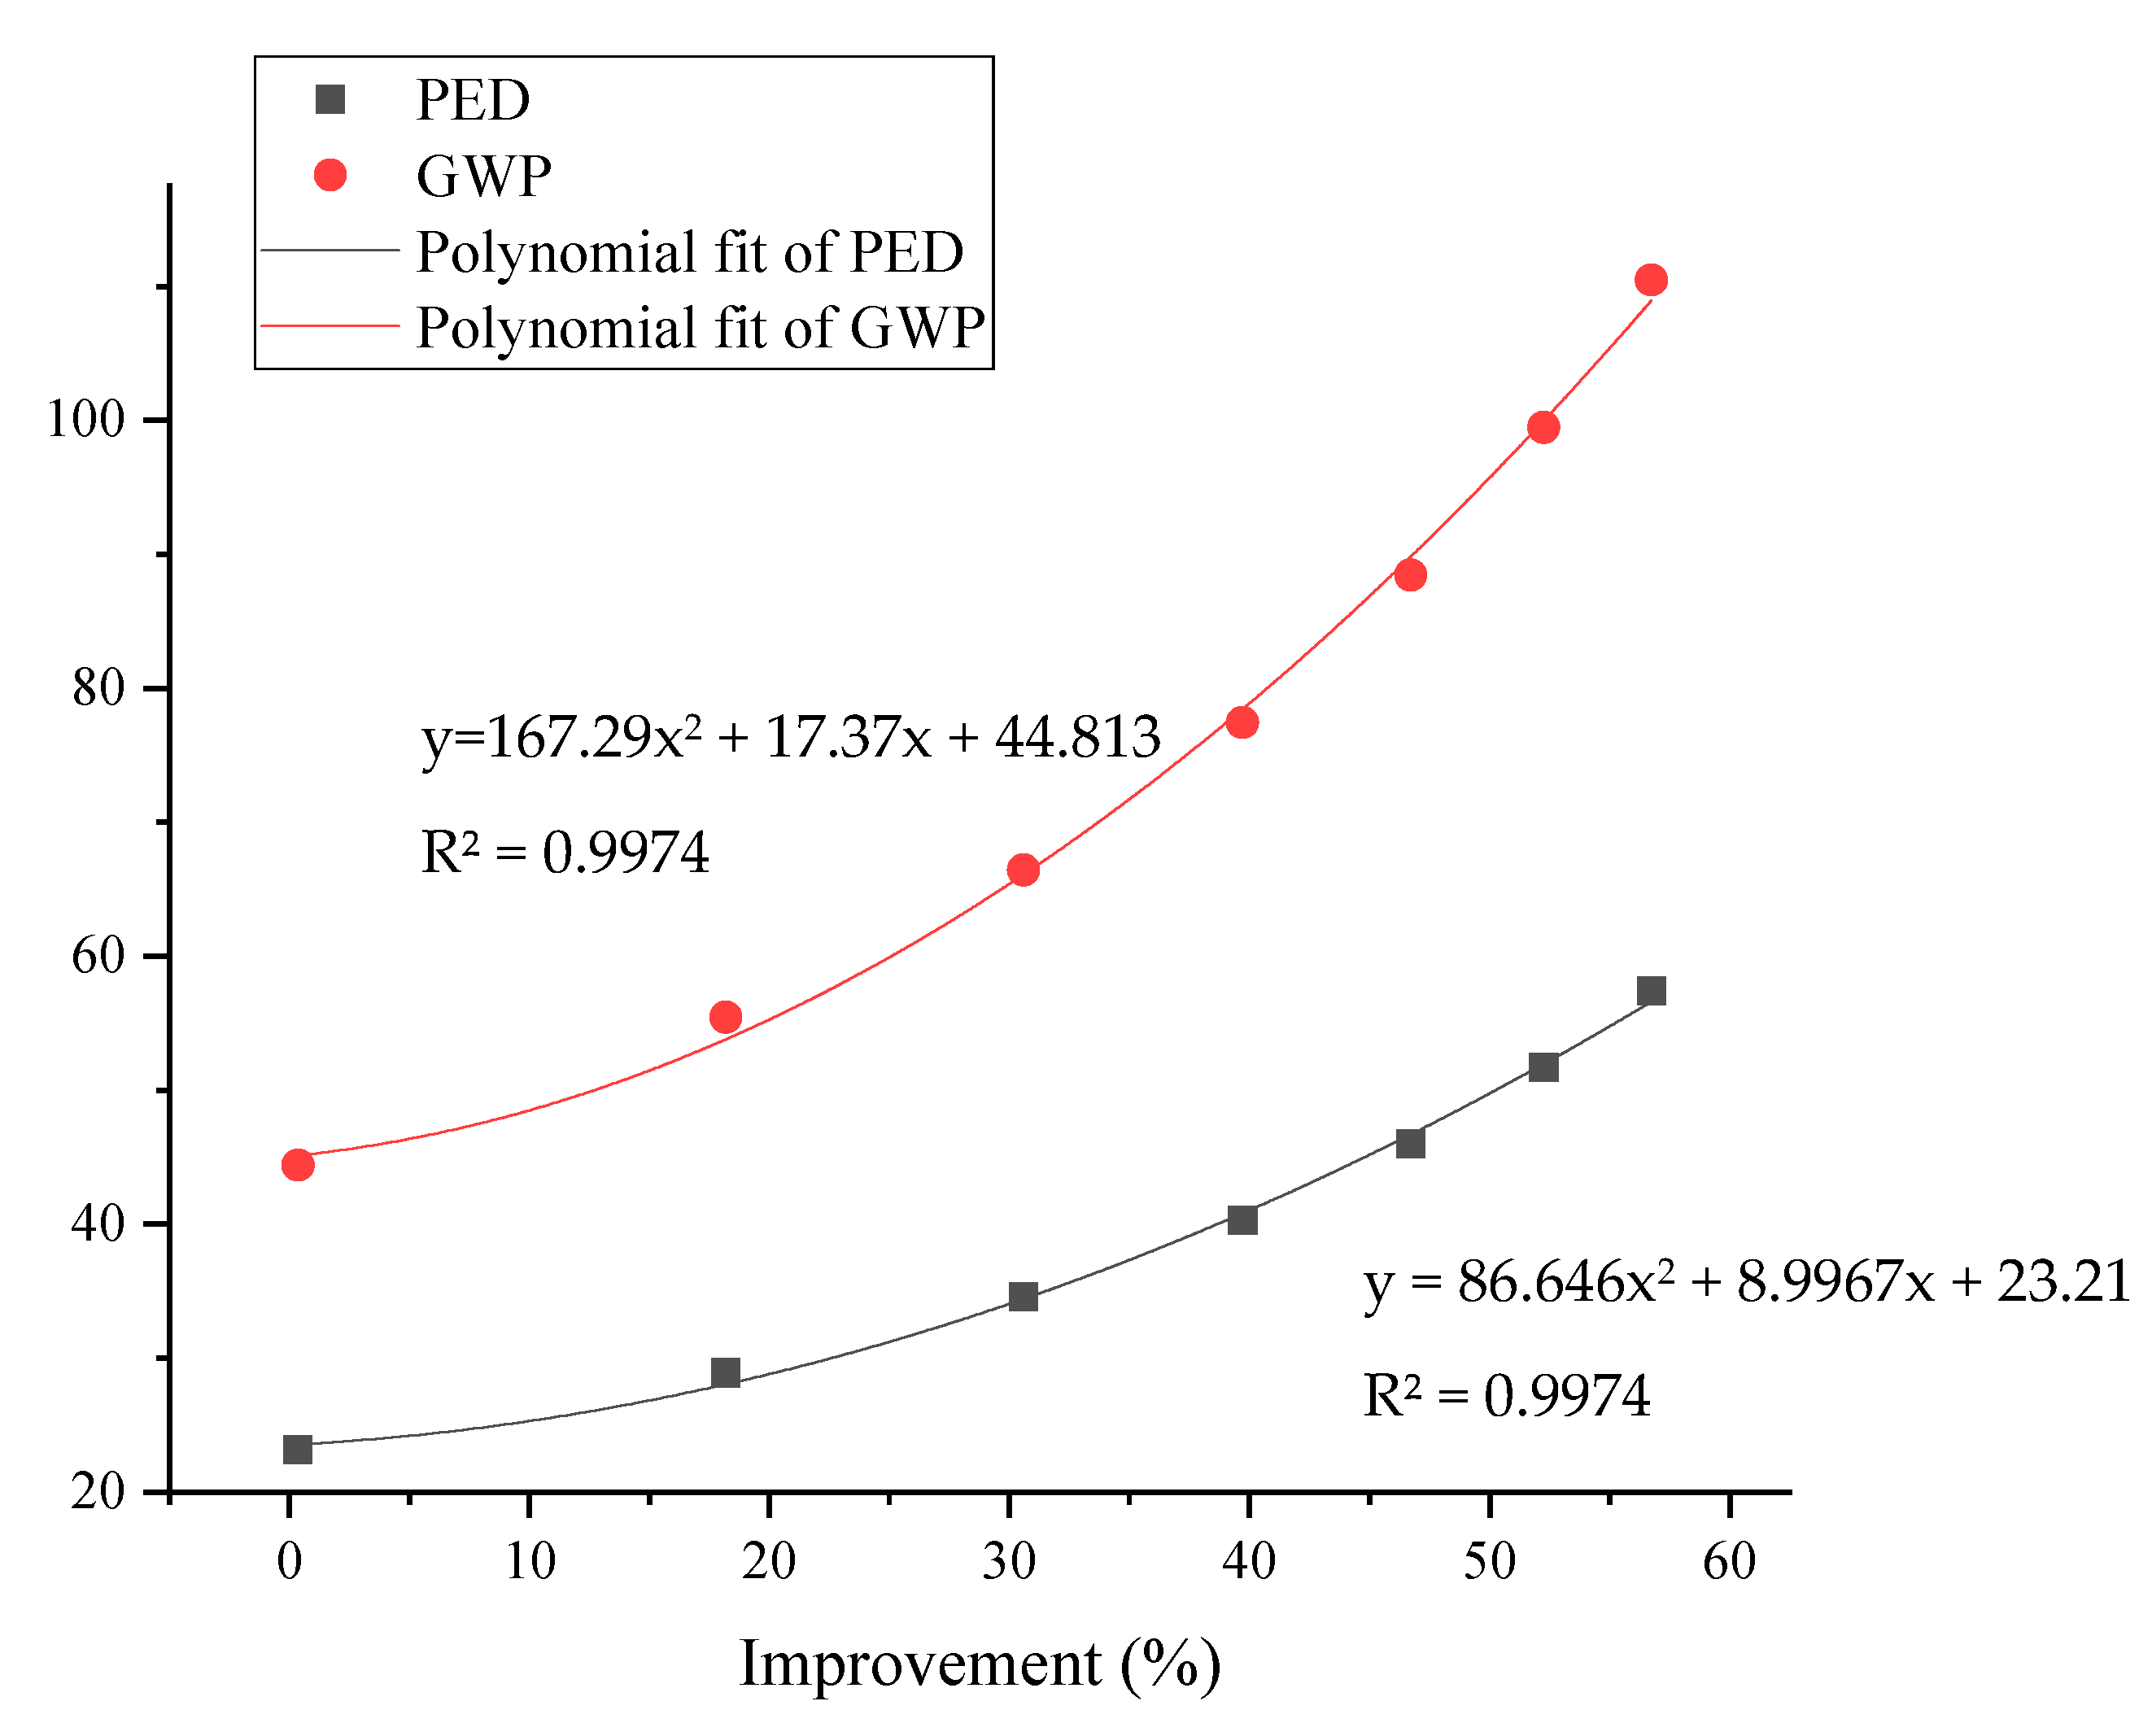
As shown in Figure 13, when the thermal performance of a rock wool insulation roof is improved within 40%, the environmental impact indicators change slowly. When the increase is greater than 40%, the change rates of PED and GWP begin to increase.
3.2.4. Cost Analysis of a Building Envelope
According to the costs of the thermal insulation materials of the envelope in Table 5, the costs of the four thermal insulation layers with different thicknesses were quantified. Quantitative indicators of the costs of different types of windows are summarized in Table 6.
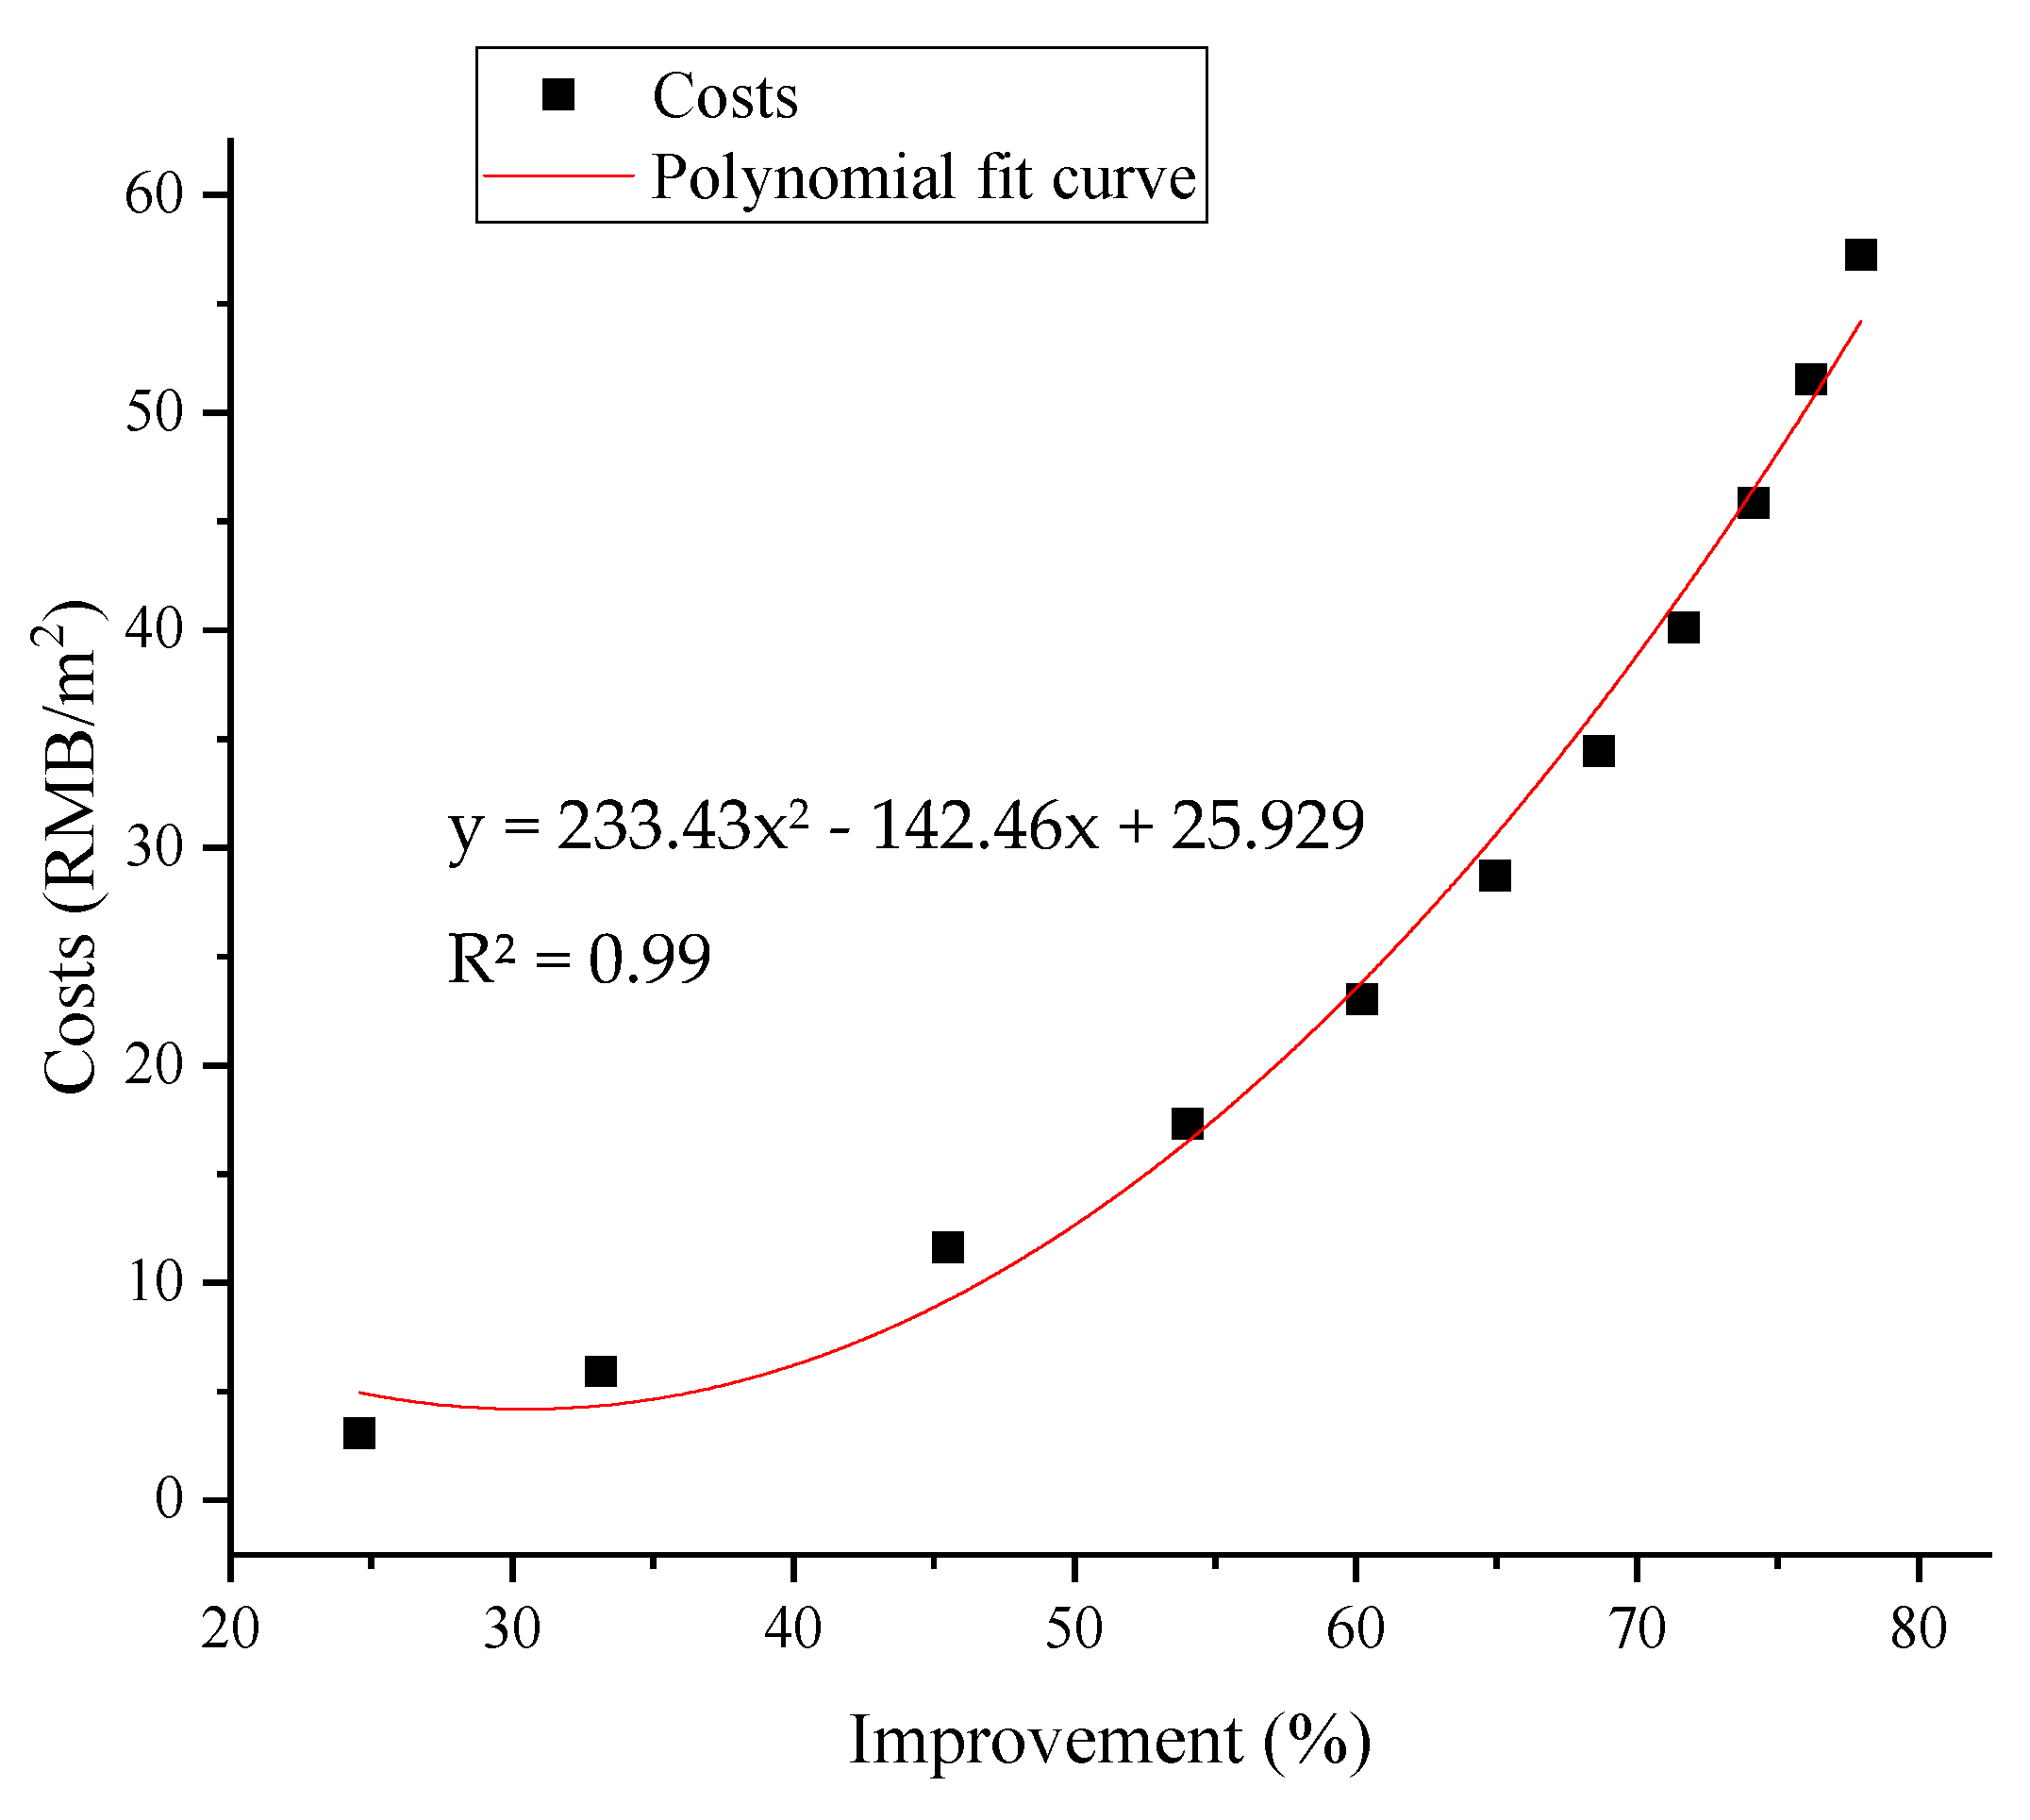
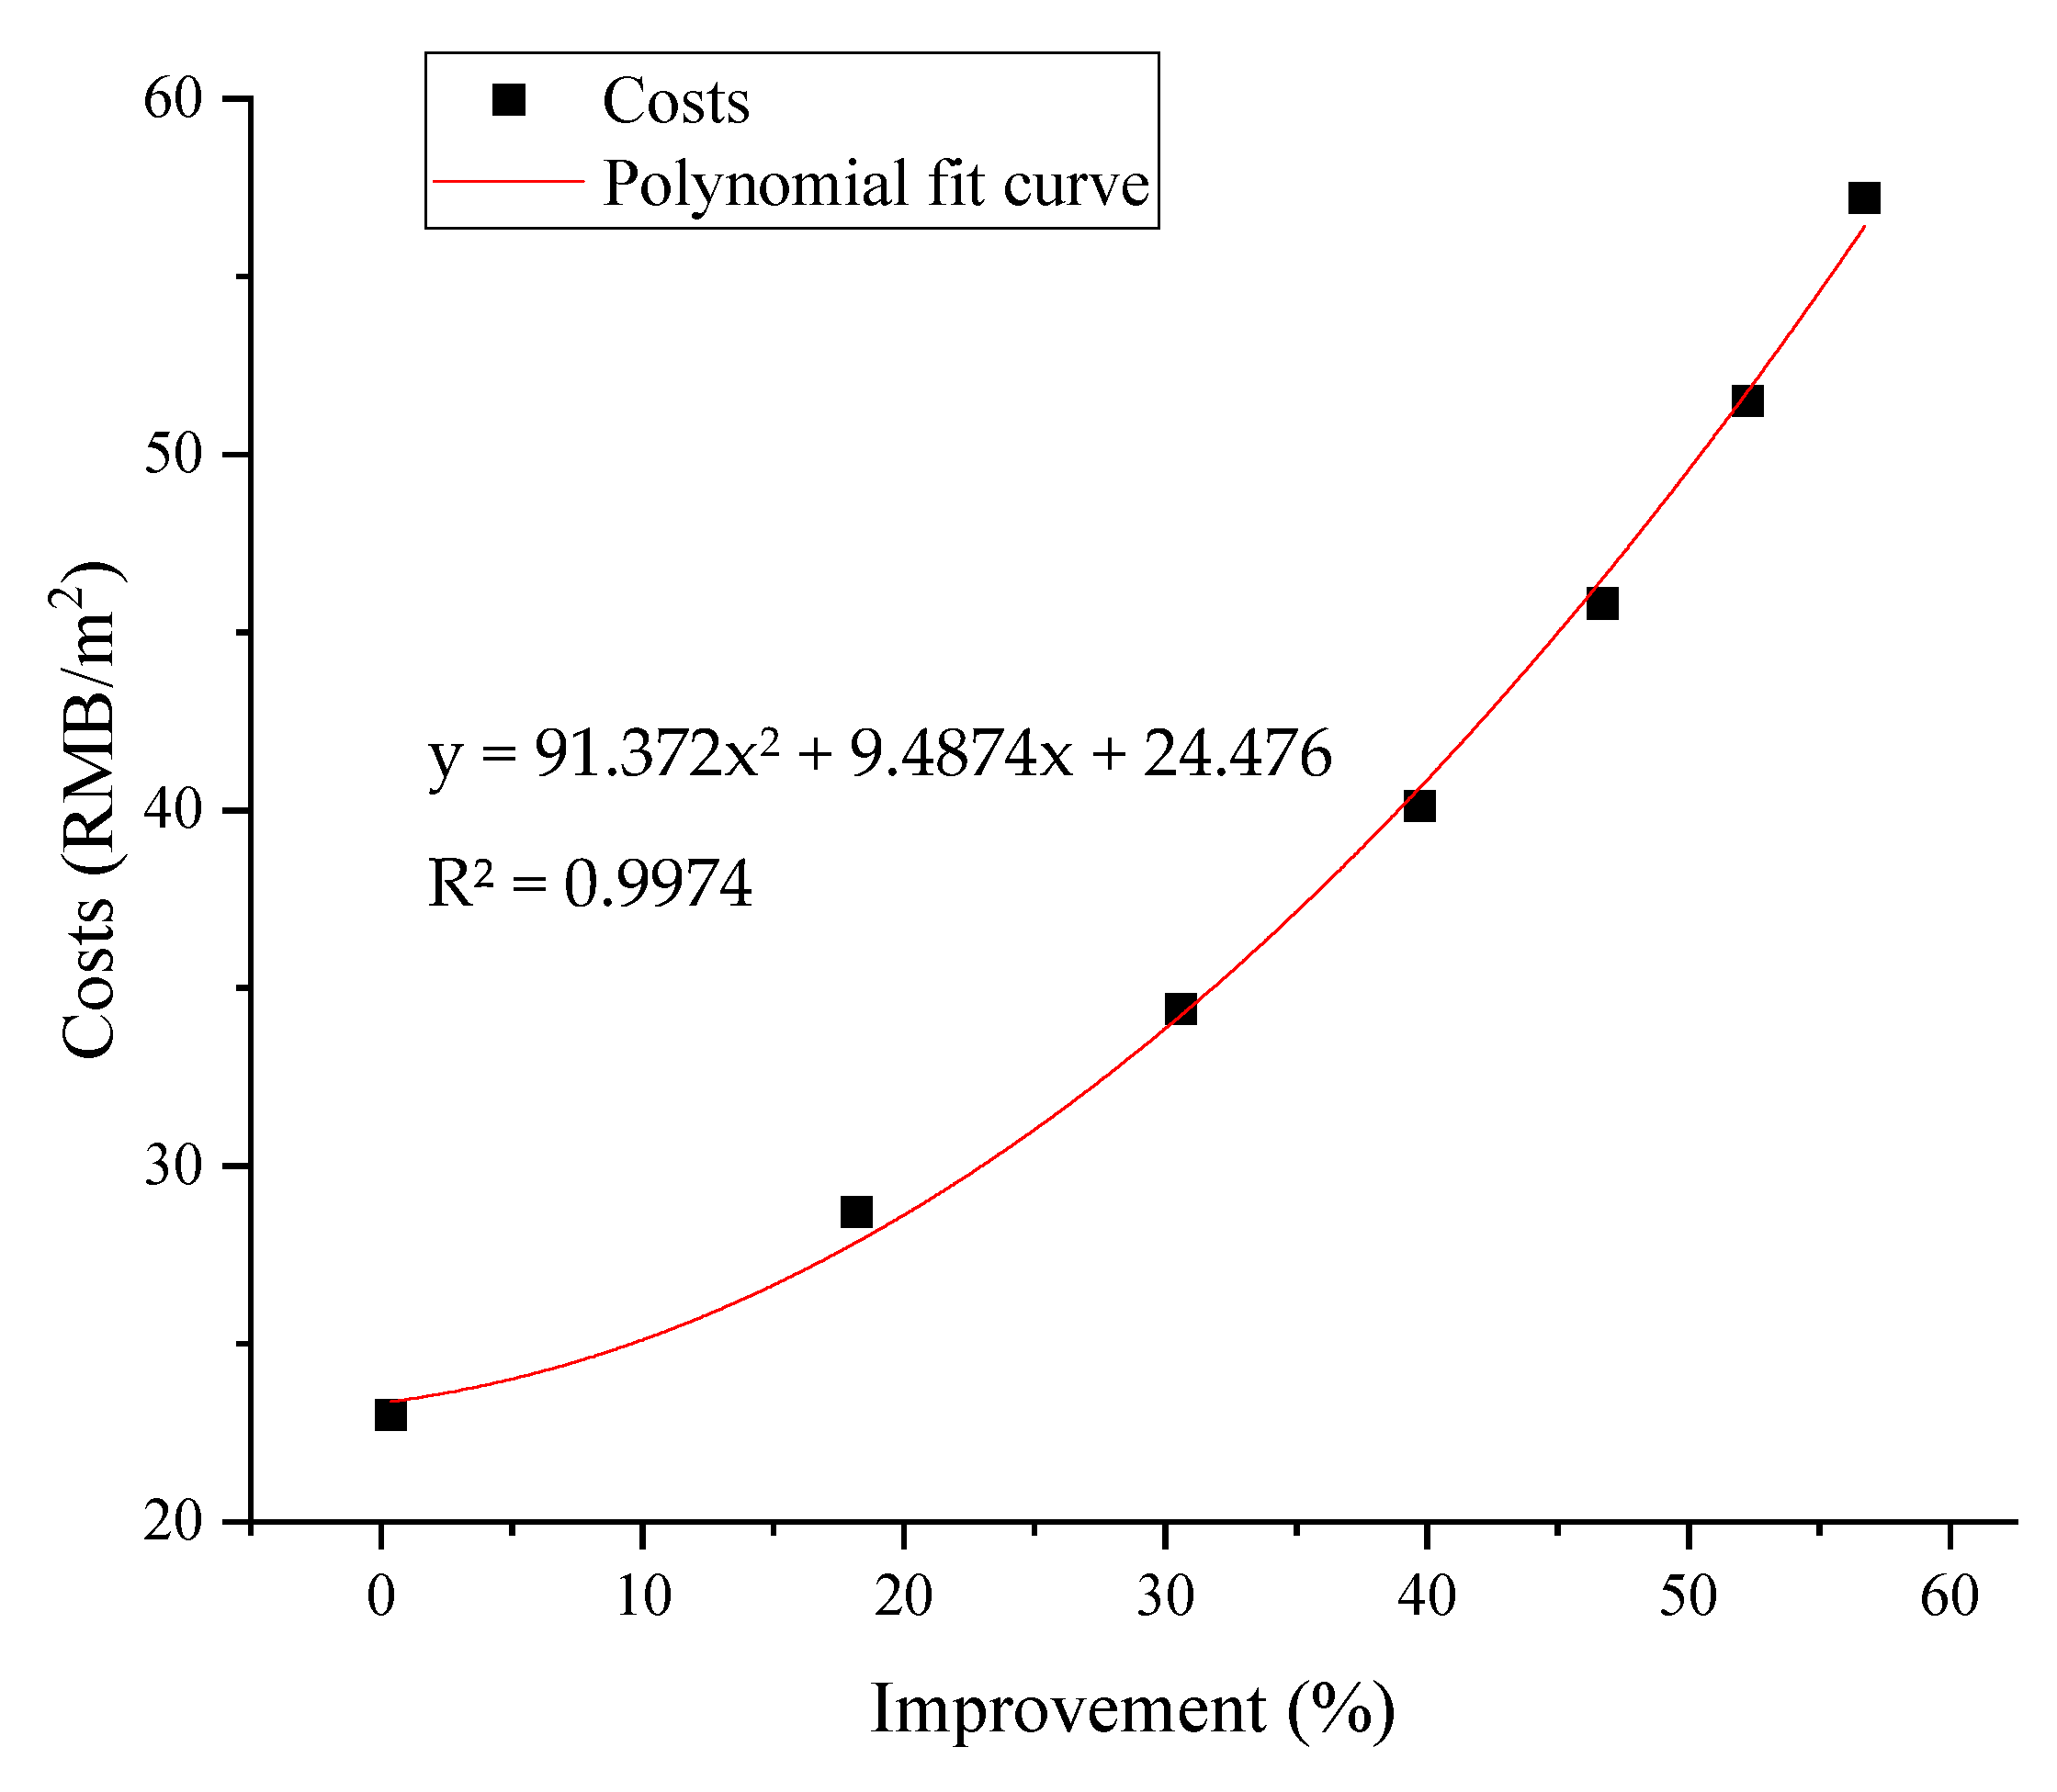
Taking the prototype residential building in a cold area as an example, the costs of a rock wool insulation exterior wall and roof under different thicknesses of insulation layer were analyzed, and the results are shown in Table 20. As the thickness of rock wool increases, the thermal performance of exterior walls and roofs gradually improves, and the costs also increase. Therefore, the relationship between thermal performance improvement and costs was quantitatively analyzed.
Figure 14 and Figure 15 show the relationship between the thermal performance improvement and costs of an exterior wall and roof. When the thermal performance of the exterior wall is improved by less than 50%, the economic cost increases slightly, and when it is improved by more than 50%, the initial investment begins to increase rapidly. The increase of roof thermal performance has little effect on the investment cost, which is a trend of slow growth.
In this research, we quantitatively analyzed the heat transfer coefficients of exterior walls and roofs with four different thermal insulation materials under different thicknesses. The corresponding thermal performance improvement ranges of different exterior walls and roofs were further analyzed, and a database of common practices was established. Quantitative analysis of the thermal performance of 10 kinds of common windows and the corresponding thermal performance improvement range was performed, leading to the establishment of a common windows database. According to the life cycle environmental impact assessment index, we established a database of the environmental impact load formed by different envelope practices. At the same time, the economic cost database of thermal performance improvement of an envelope was established through investment analysis. Finally, the quantitative data of the aforementioned individual indicators were summarized into a multi-index database of green building envelope practices, as presented in Table 21, Table 22, Table 23, Table 24, Table 25 and Table 26, for residential and public buildings in cold areas.
3.3. Analysis of Building Heat Consumption
3.3.1. Building Heat Consumption
The standard for the energy consumption of buildings (GB/T 51161-2016) [44] requires the restriction value and guidance value for the heat consumption level of civil buildings. From Table 27 and Figure 16, it is apparent that in the 10 green building projects tested, all of the winter heat consumption values meet the restriction value requirements, and the proportion of projects that meet the guidance value requirements reaches 80%. From these results, it can be concluded that the actual thermal insulation effect of the green building envelope is good, and most of them meet the requirements of the building heat consumption limit.
In order to analyze the relationship between the actual heat consumption and thermal performance of exterior walls, roofs, and windows, the thermal performance improvement range of each part of the test project envelope was calculated and arranged as shown in Table 28.
An improvement of the thermal performance of the enclosure structure will reduce the thermal load of the building, but the actual heat consumption of the project might not decrease. As shown in Figure 17, when the thermal performance of the three parts of the building envelope is improved more closely, they consume less heat, such as Item 5 and Item 6. However, when the thermal performance of the roof part is improved significantly and the window part is improved slightly, the heat consumption is still large, such as Item 4. Therefore, it is not comprehensive enough to explore the influencing factors of heat consumption only by analyzing the improvement of the thermal performance. At the same time, the energy consumption limit and actual heat consumption of residential buildings are generally lower than those of public buildings, except for the energy consumption of public building projects 5 and 6, which was found to be lower, and the energy consumption of residential project 10, which was higher. This is because projects 5 and 6 are three-star green buildings which perform better in energy-saving operation and management. Additionally, project 10 has a better thermal performance in terms of the external walls, the performance of the exterior windows is poor, and the non-energy saving behavior of the households also increases the energy consumption [45].
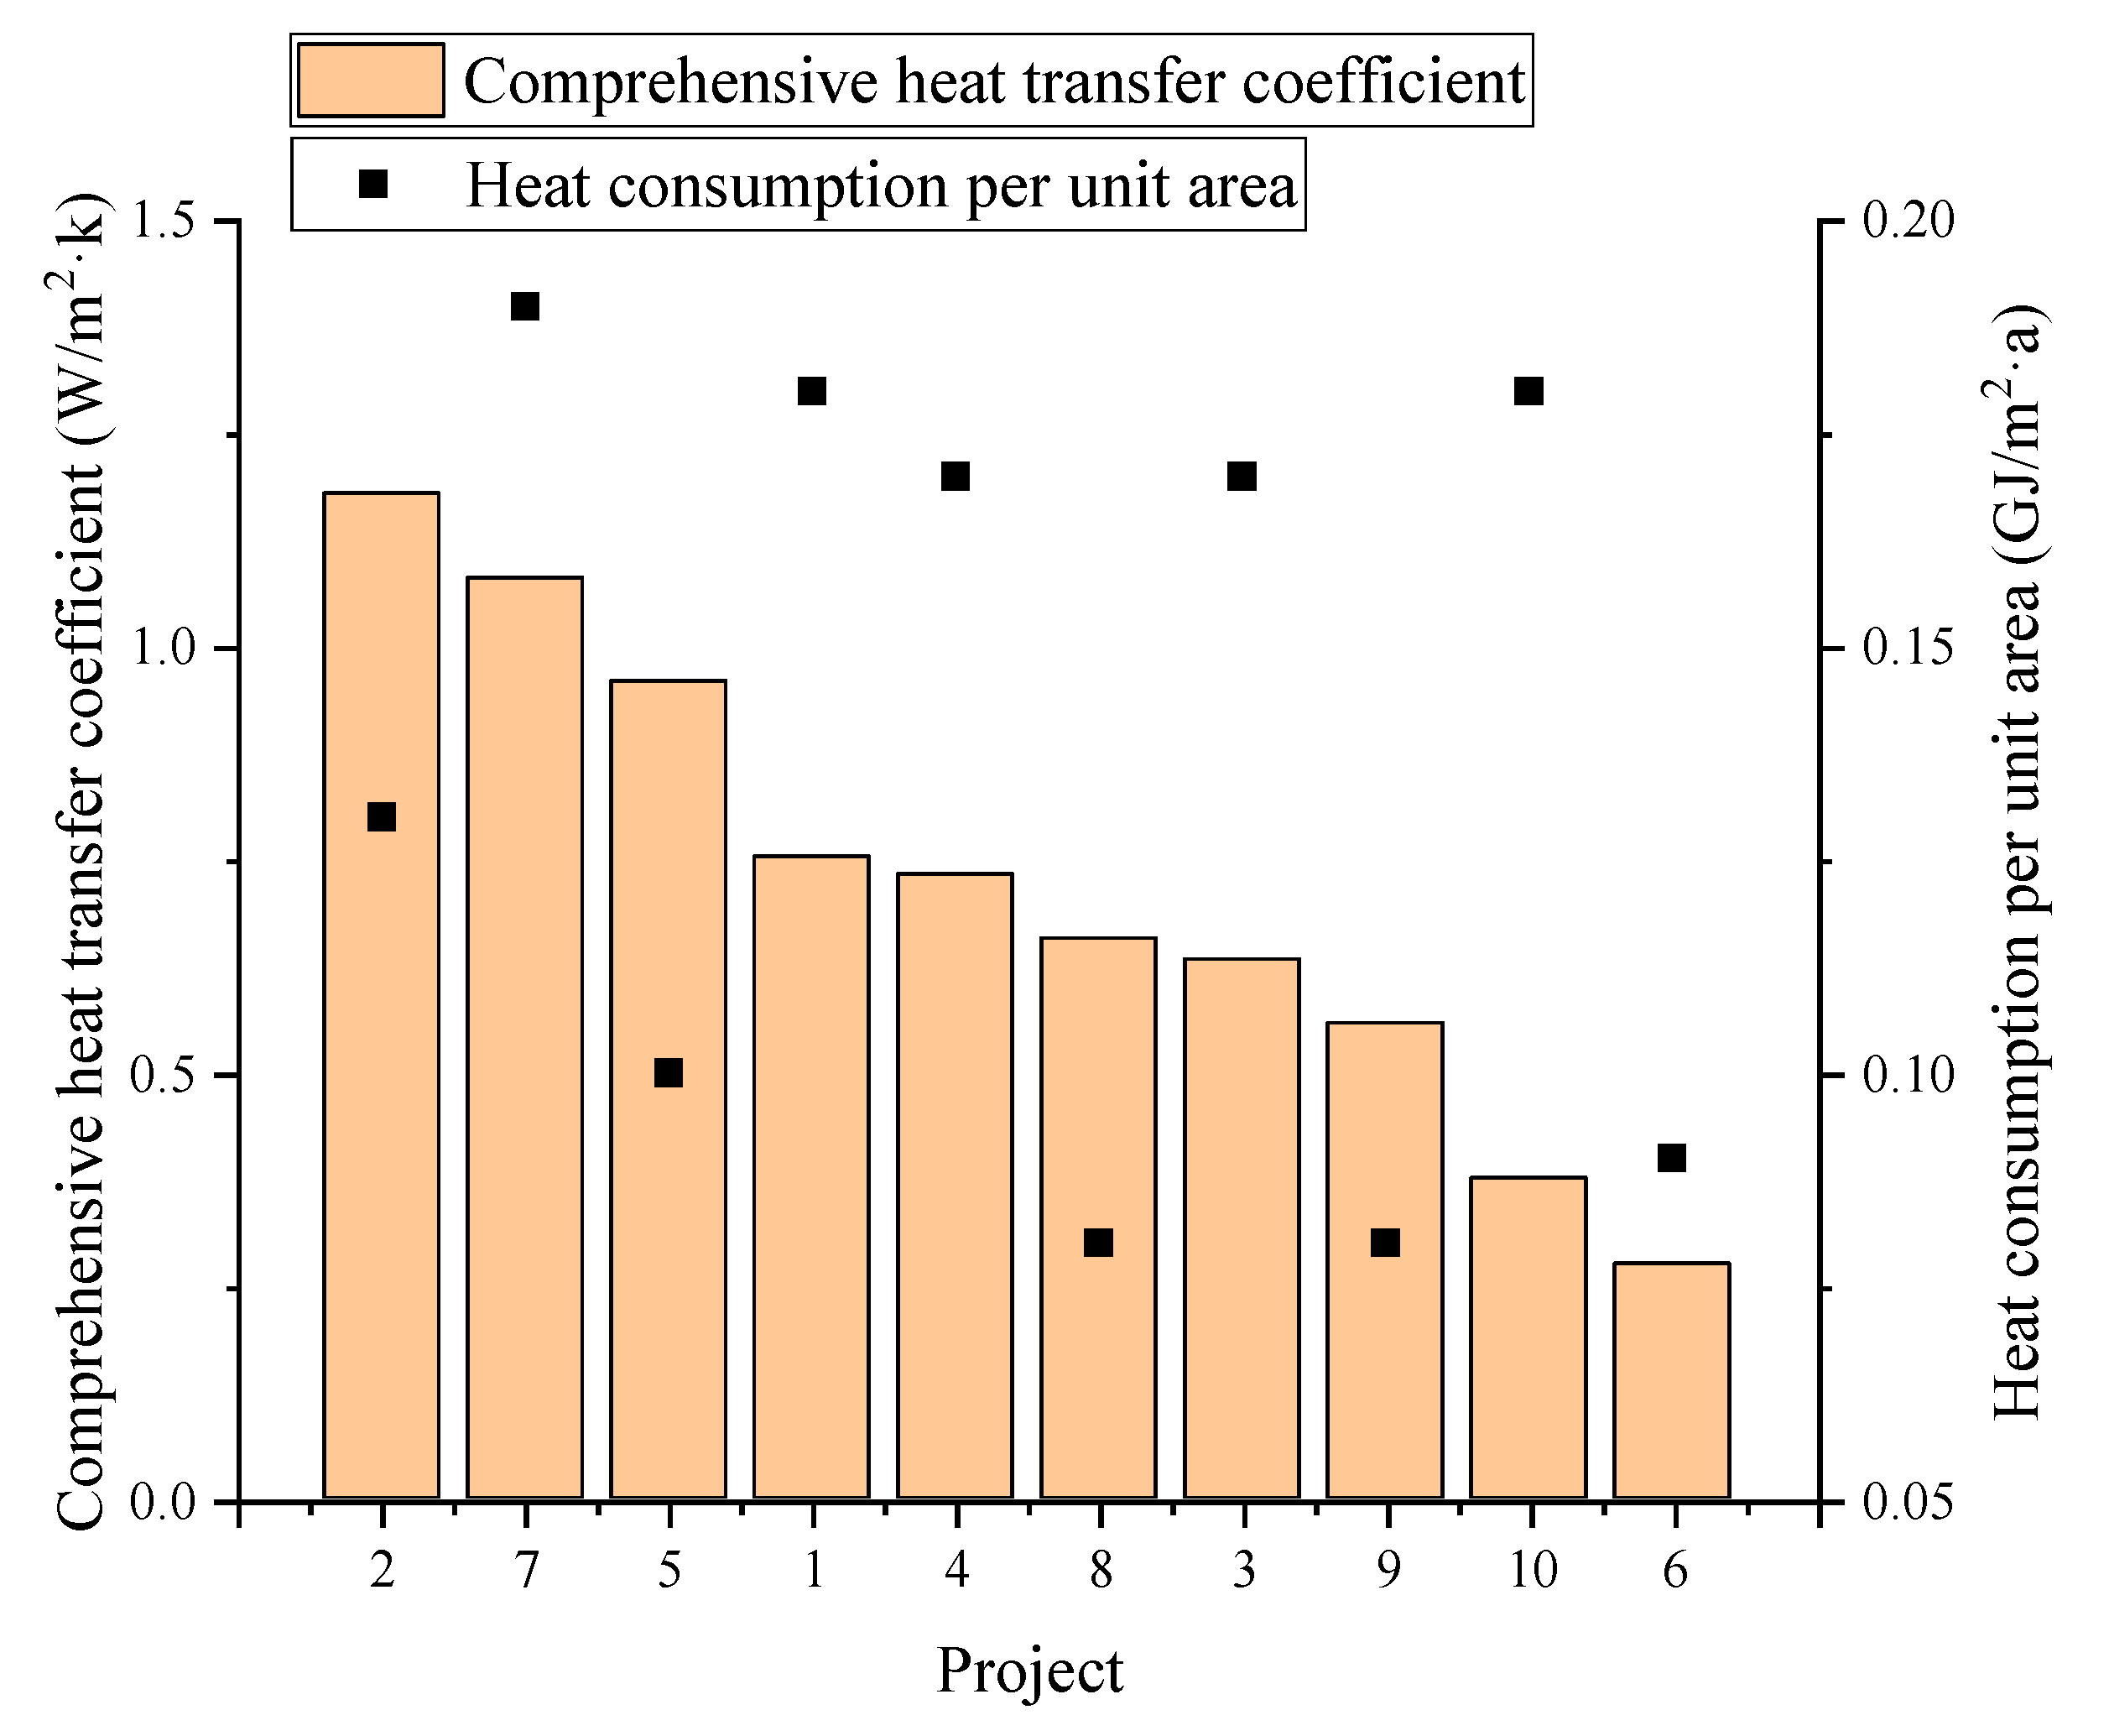
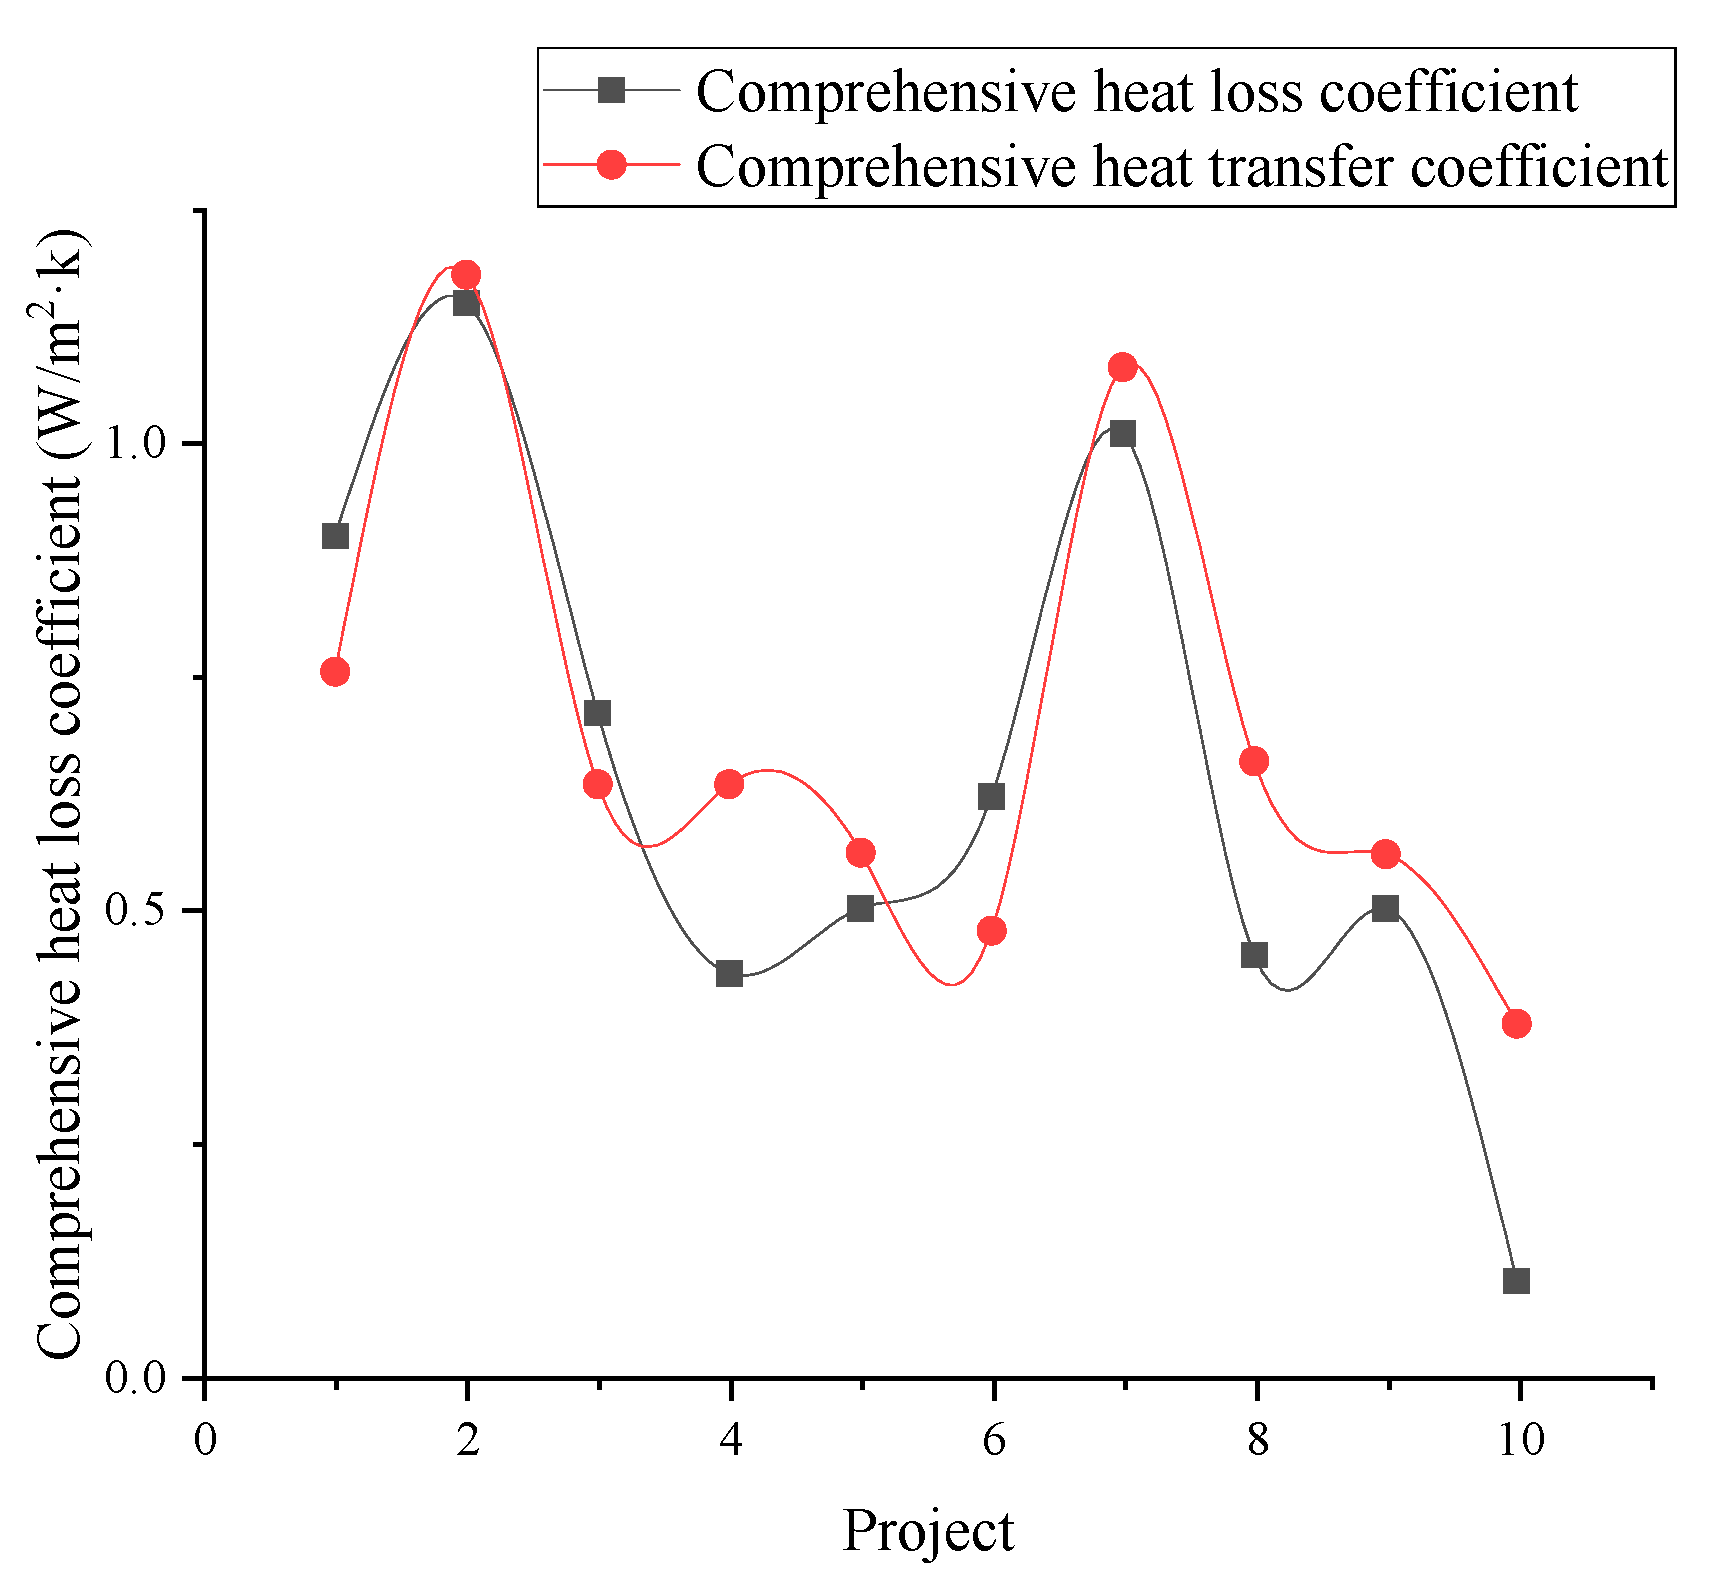
As shown in Figure 18, the comprehensive heat transfer coefficients of the envelope of 10 projects are arranged in descending order. Although the comprehensive heat transfer coefficients are reduced, the actual heat consumption in winter does not show a significant correlation with them. The heat consumption of green buildings in winter is affected by the thermal performance of the envelope structure, as well as other factors, such as the window-wall ratio, performance matching between the building envelope structures, improper operation during the use of the building, and so on. In addition, the comprehensive heat loss coefficient reflects the relationship between actual heat consumption and the thermal performance of the envelope. It can be used as an index to evaluate the thermal insulation performance of the building envelope structure and considers the influence of the U-value and area of the external wall, window, and roof. As shown in Figure 19, the variation trend of the comprehensive heat loss coefficient of the envelope structure is close to that of the comprehensive heat transfer coefficient. Therefore, it can not only characterize the comprehensive thermal performance of the envelope structure, but also be calculated from the actual heat consumption, and can also represent the actual heat consumption of the building.
3.3.2. Sensitivity Analysis of the Comprehensive Heat Loss Coefficient
The building model used for sensitivity analysis refers to Items 1 and 10 tested in this paper, which are typical public and residential buildings in cold areas, respectively. Taking the actual shape coefficient, heat transfer coefficient, window-wall ratio, and indoor human activities as boundary conditions, the Design Builder software was used to establish the model and calculate the winter heat consumption. The basic information of the project and the results of simulated heat consumption are shown in Table 29.
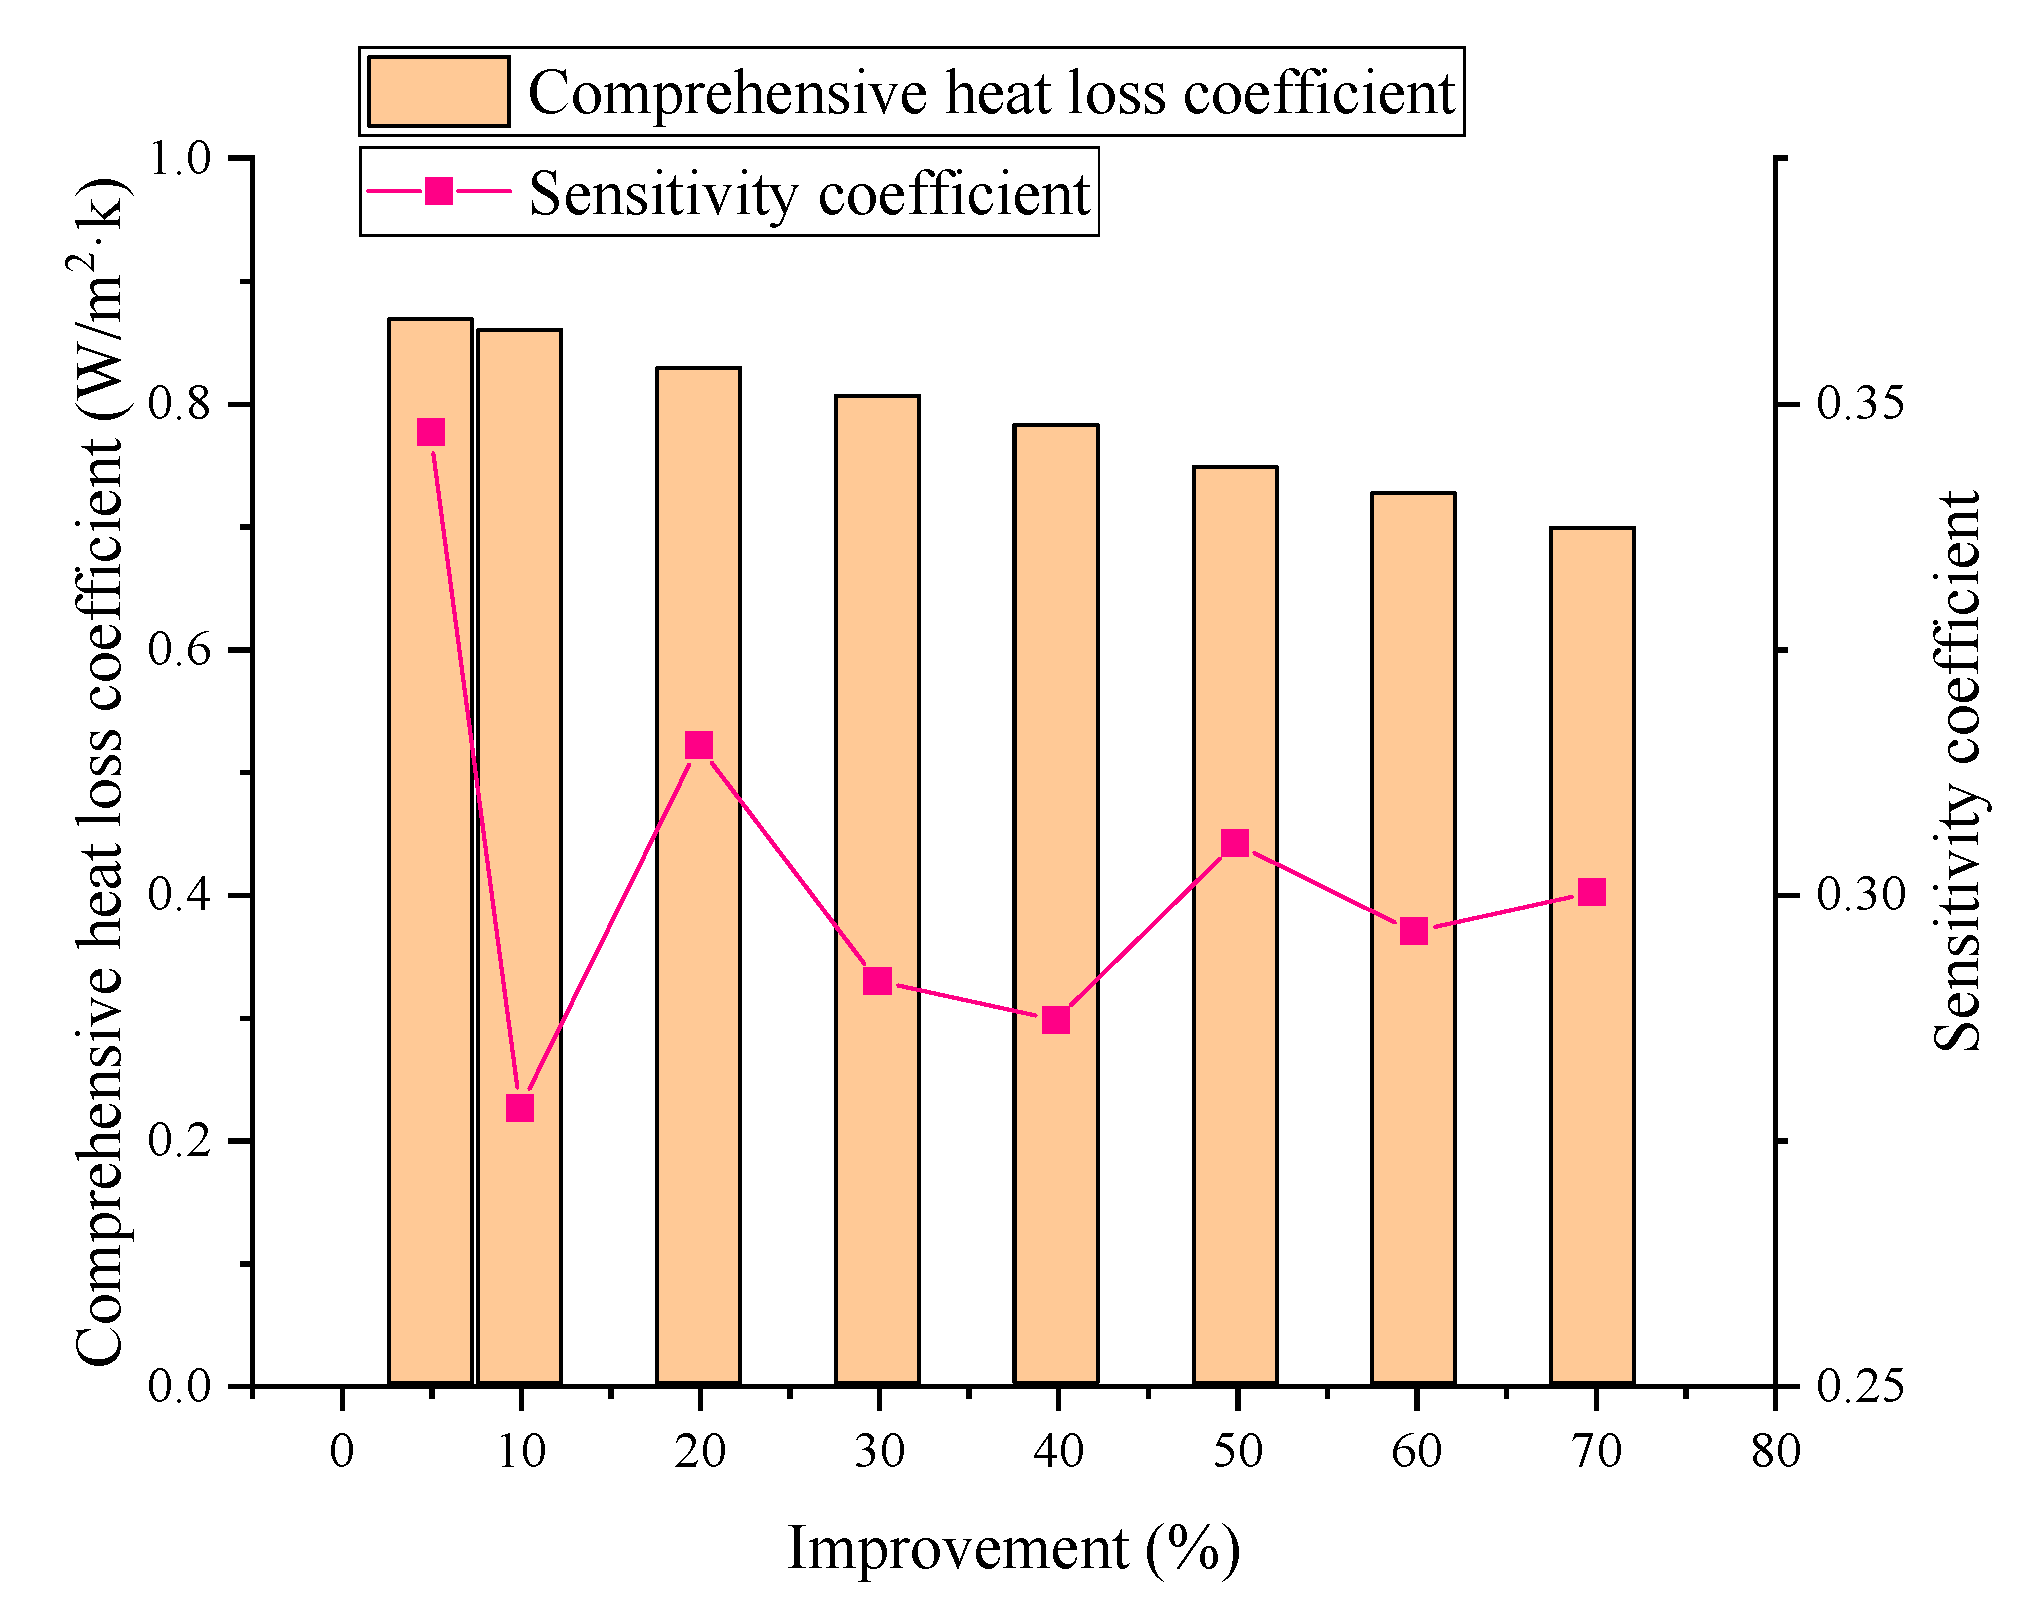
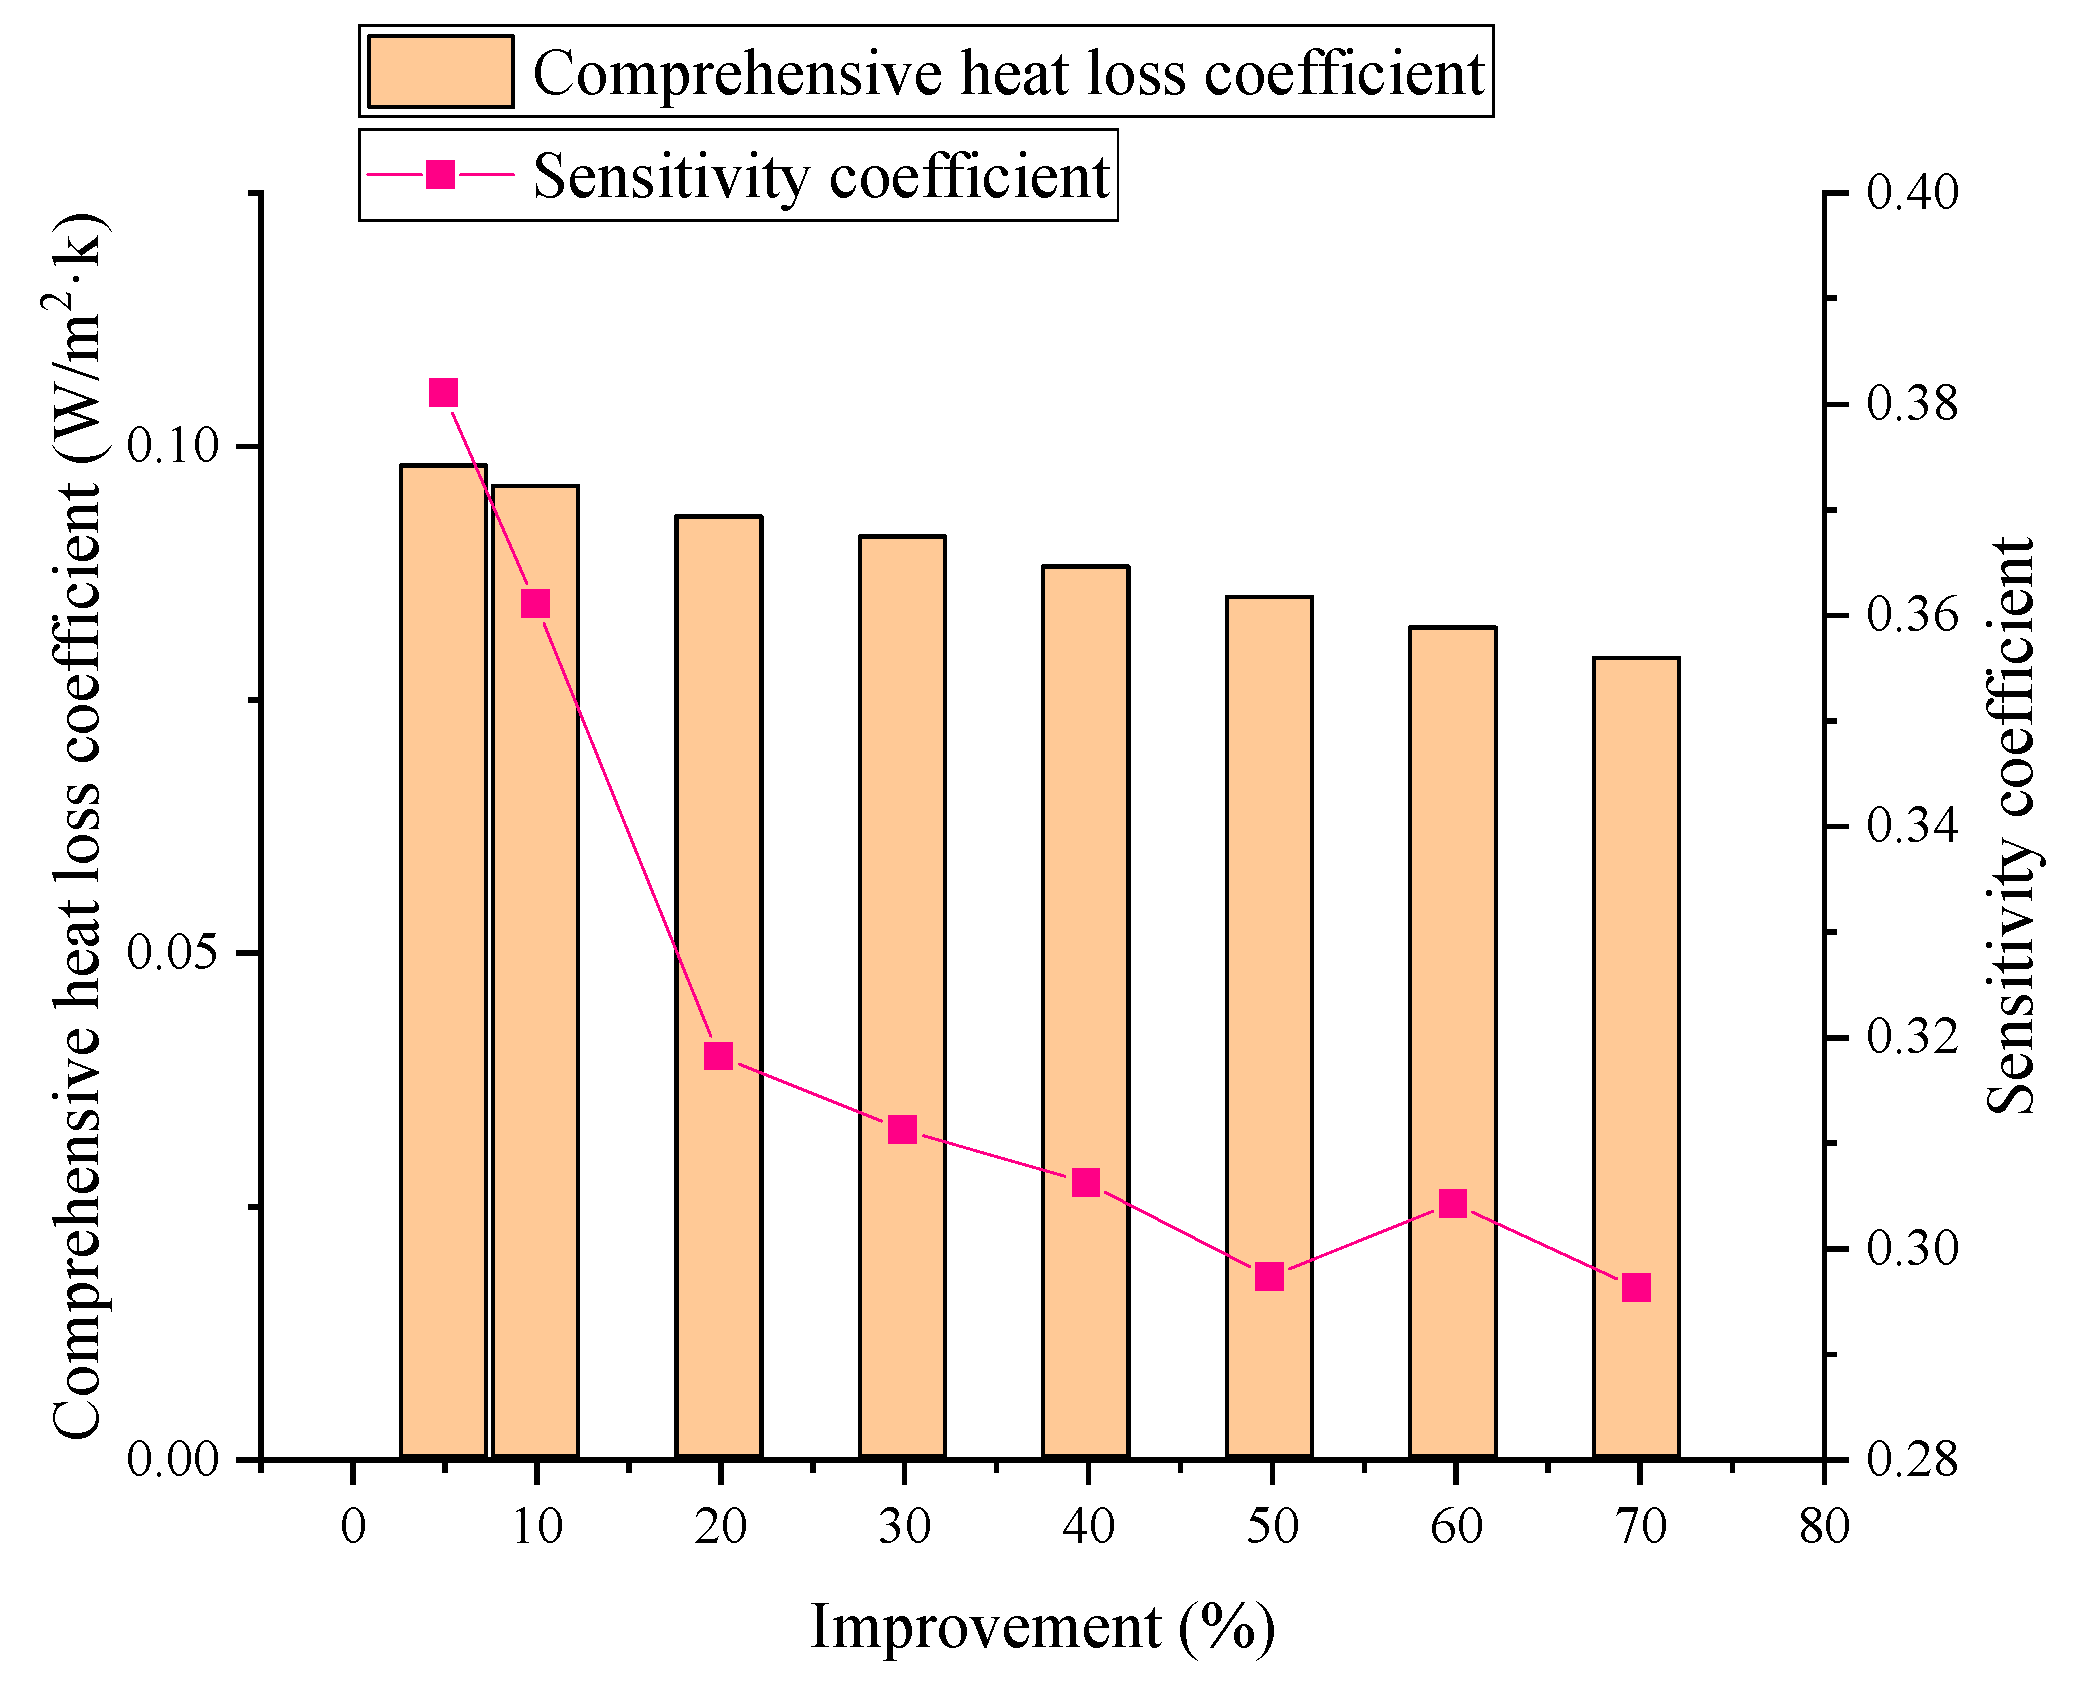
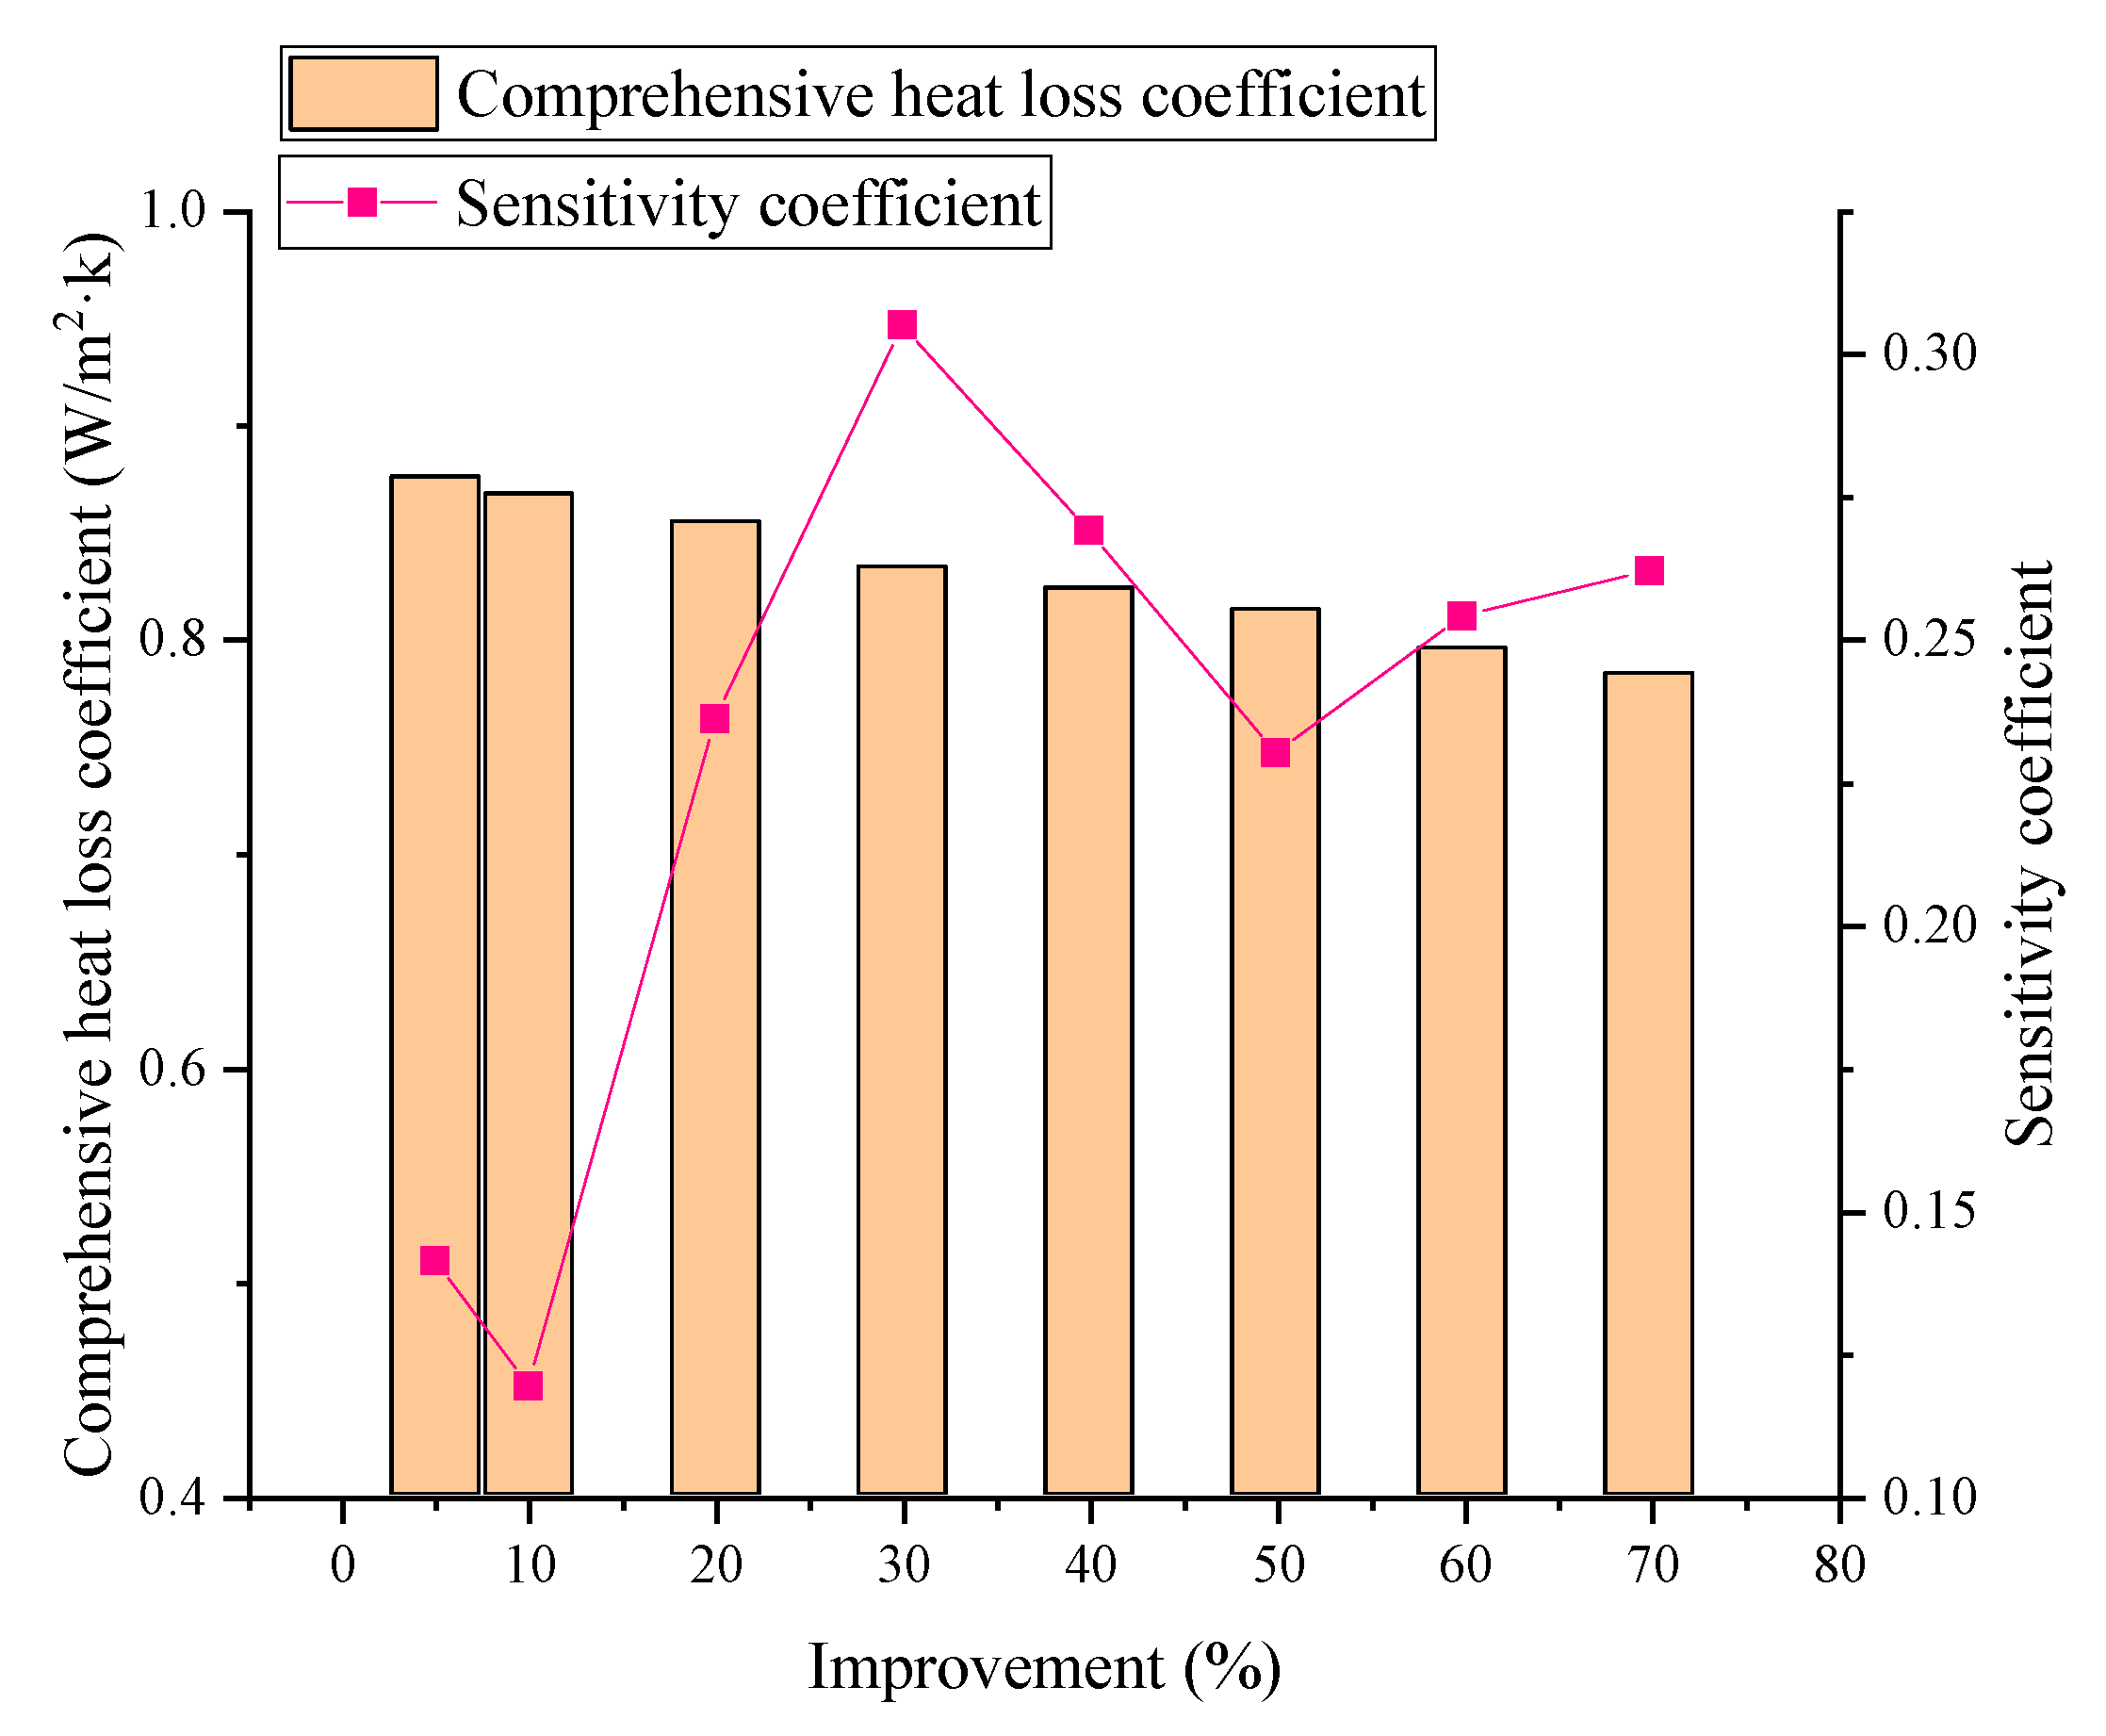
In order to discuss the influence of the thermal performance of the external wall on the comprehensive heat loss coefficient of the envelope, the thermal performance of the external wall only was improved, while the roof and window remained unchanged, and the heat consumption was simulated. We calculated the comprehensive heat loss coefficient according to Equations (7)–(9). Subsequently, we further calculated the sensitivity coefficient IC according to Equation (10) and Figure 20 and Figure 21 show that although the comprehensive heat loss coefficients of public buildings and residential buildings are quite different, the sensitivity coefficients resulting from the change of thermal performance of external walls are not very different; the IC range of public buildings is 0.278–0.347 and that of residential buildings is 0.296–0.381. When the improvement of exterior wall reaches 20%, the change of sensitivity coefficient begins to slow down, and the comprehensive heat loss coefficient tends to be stable. Therefore, there is a linear relationship between the thermal performance of external walls and the comprehensive thermal loss coefficient.
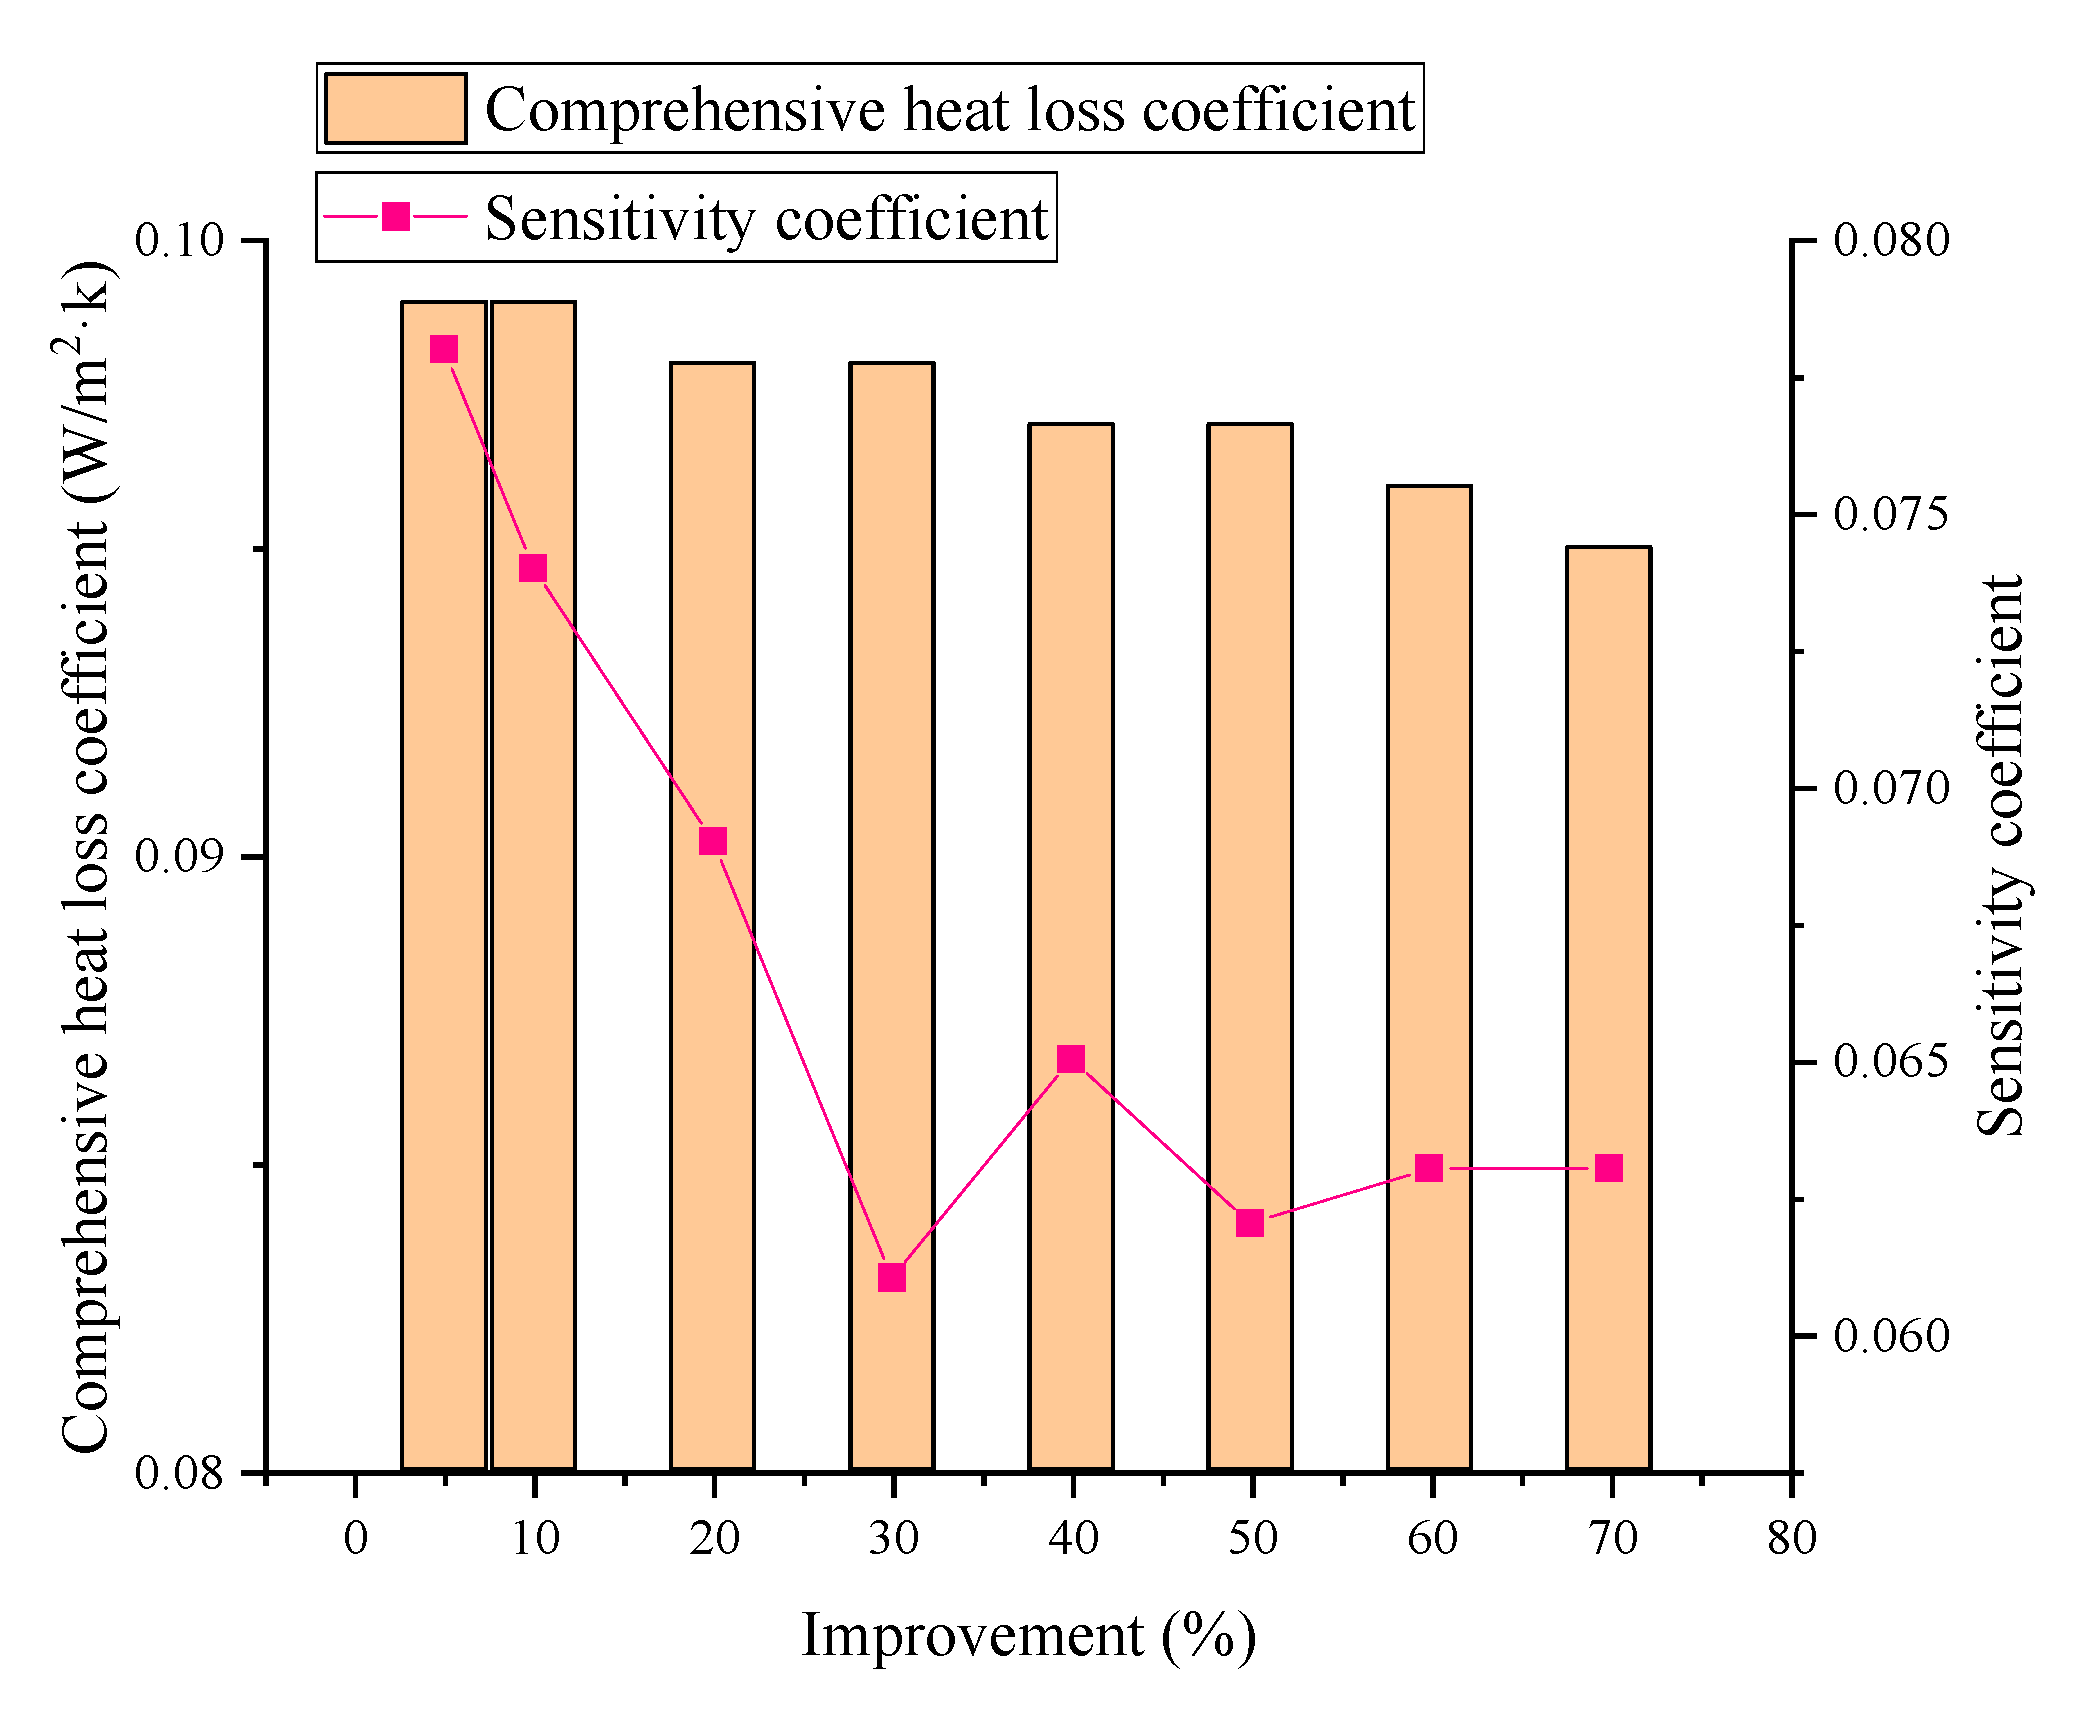
Figure 22 and Figure 23 show that the improvement of the roof thermal performance has less influence on the comprehensive heat loss coefficient of the enclosure structure. The IC range of public buildings is 0.15–0.186 and that of residential buildings is 0.062–0.078. Compared to public buildings, the IC fluctuation of residential buildings is less. When the thermal performance of public building roofs increases by 30%, the impact on the comprehensive heat loss coefficient suddenly increases and then begins to stabilize. In residential buildings, the roof thermal performance has little effect and is not the main factor.
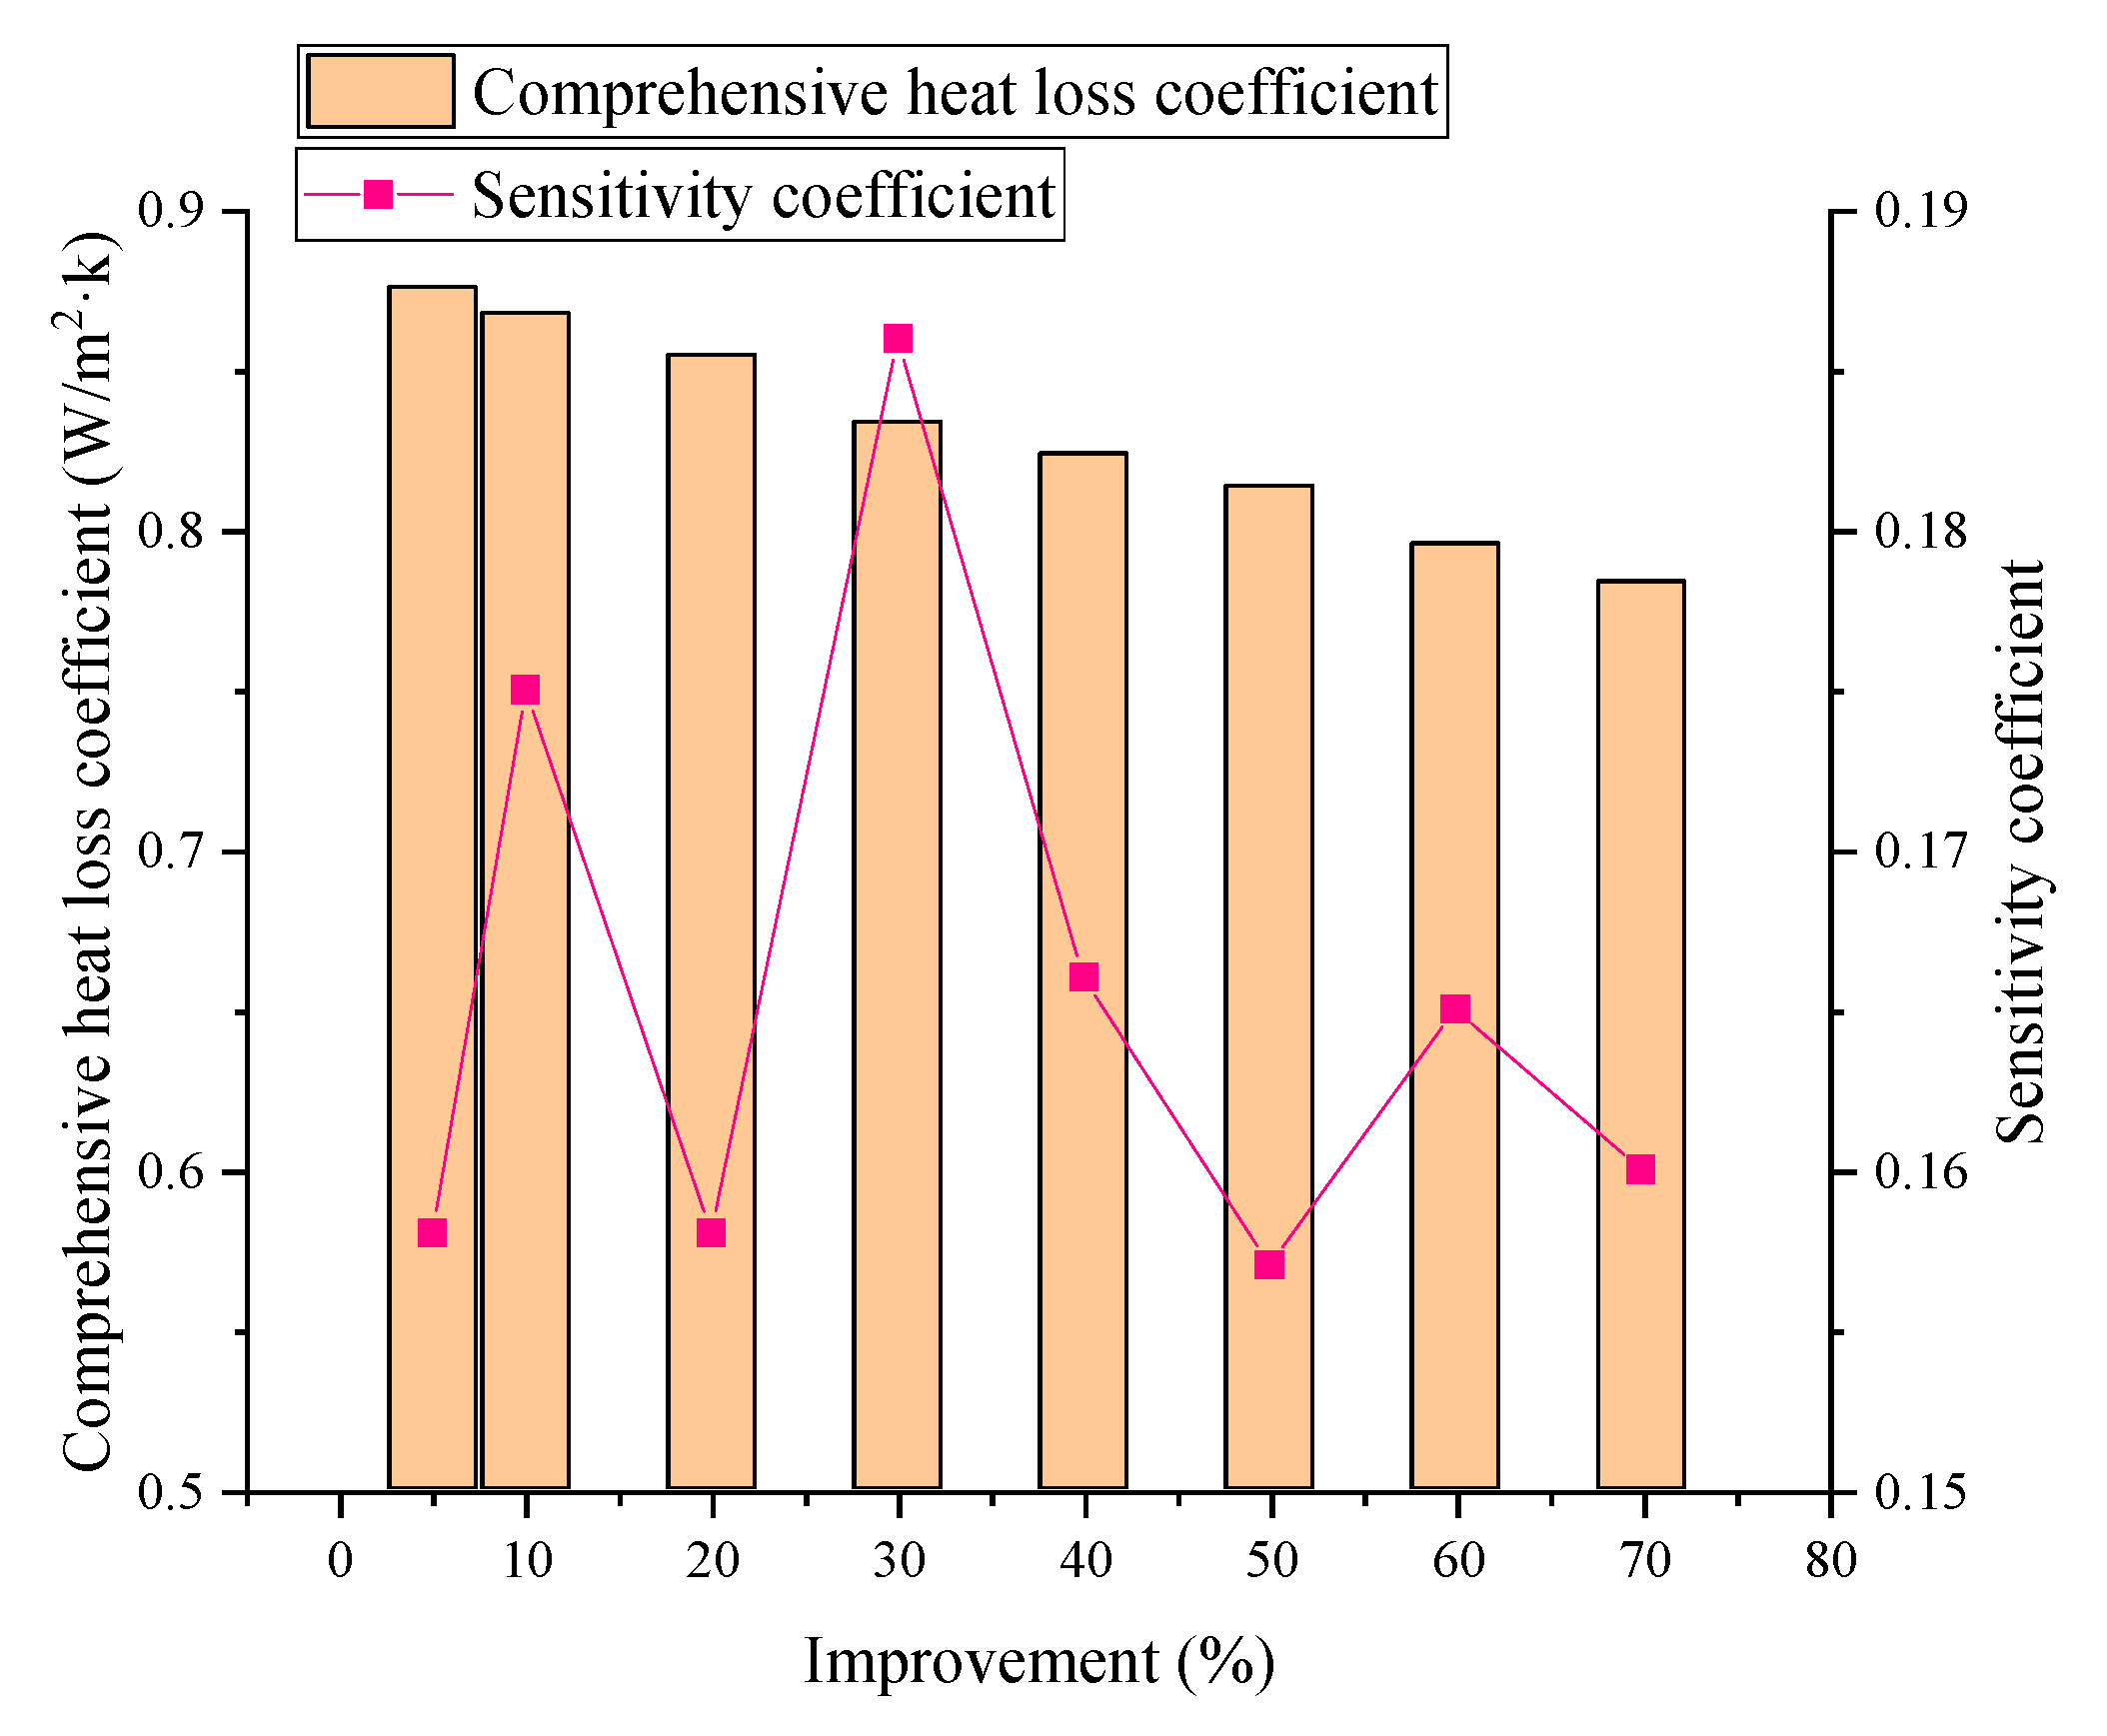
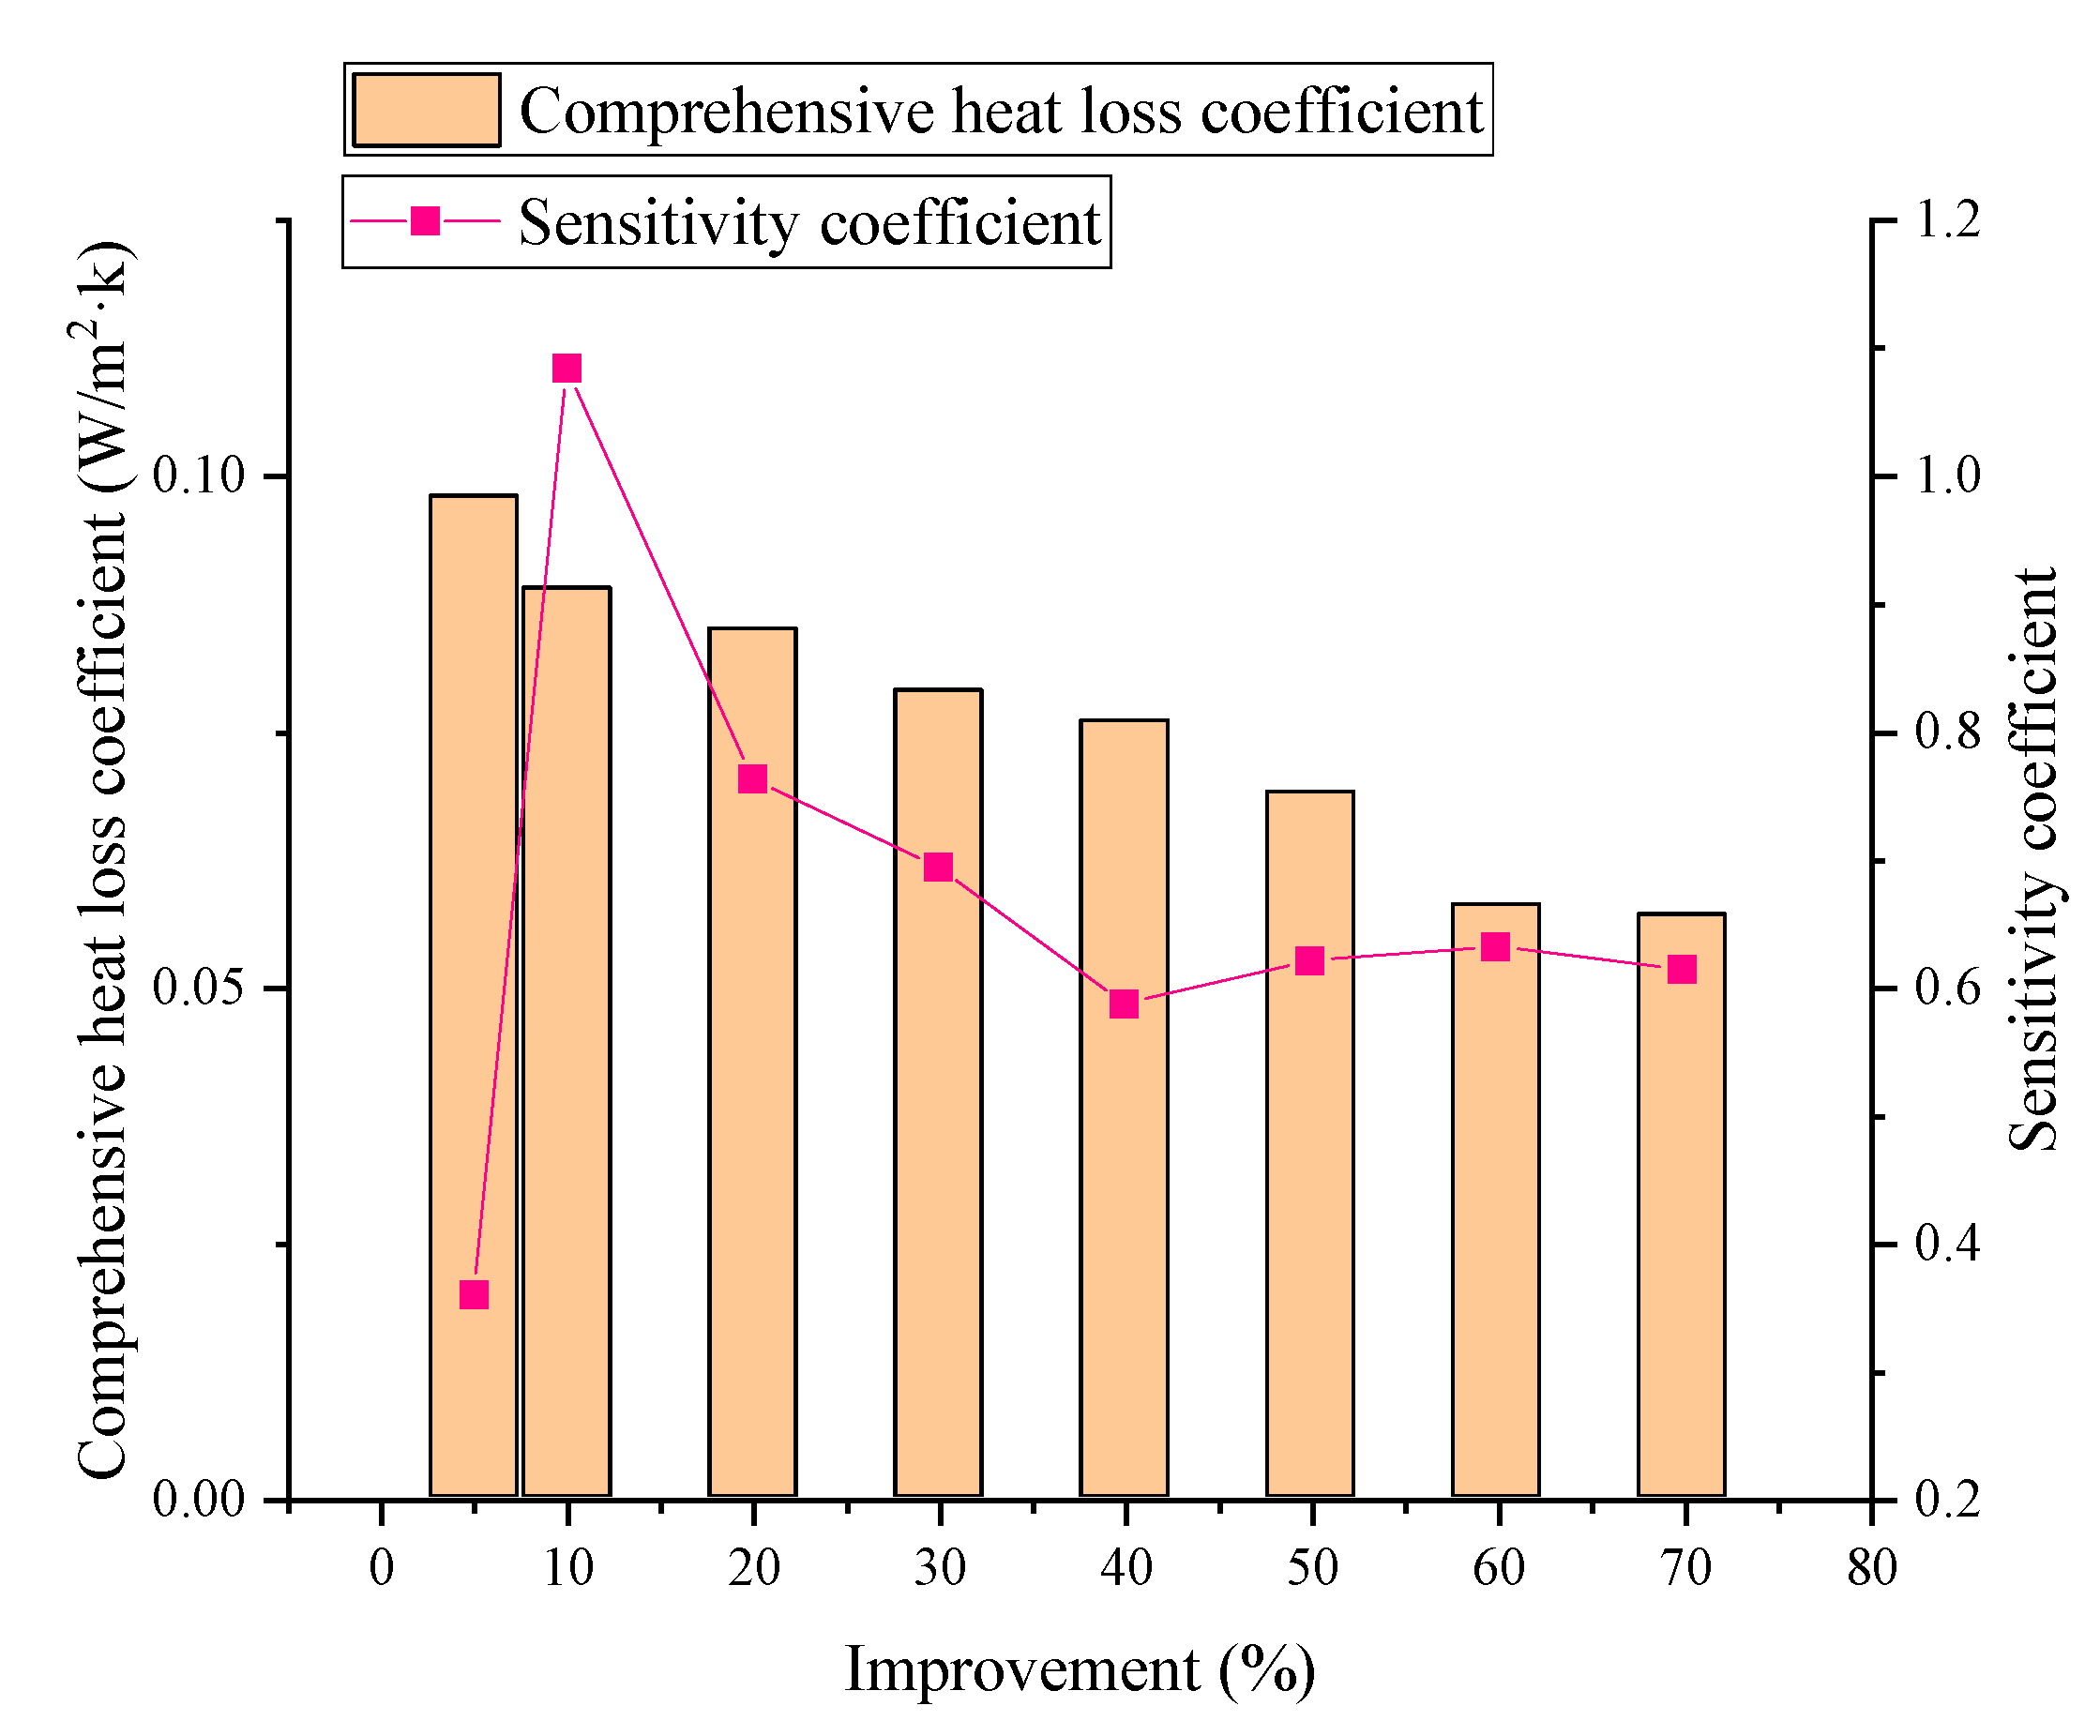
Figure 24 and Figure 25 show that the thermal performance of external windows has a significant influence on the comprehensive heat loss coefficient of the enclosure. The IC of public buildings ranges from 0.119 to 0.305, which is similar to the IC of external walls. The IC of residential buildings ranges from 0.358 to 1.084, which is the most important factor. As is evident from Figure 24, when the thermal performance of the outer window is improved by 30%, the influence on the comprehensive heat loss coefficient of the enclosure structure is the greatest, and the influence becomes less and then tends to be stable. Figure 25 shows that in residential buildings, the influence of the thermal performance of external windows on comprehensive heat loss is at a high level, which begins to decline after increasing by 10% and then tends to stabilize at 0.6. The linear equations of thermal performance improvement and the comprehensive thermal loss coefficient are y = 0.0227x + 0.9062 and R = 0.9762 (Public building), and y = 0.0058x + 0.1027 and R = 0.9804 (Residential building).
3.3.3. Modified Comprehensive Heat Loss Coefficient
From the above analysis, it is apparent that in both public buildings and residential buildings, the influence of exterior walls and windows on building heat consumption is greater and the influence of roofs is relatively lower. Therefore, the comprehensive heat loss coefficient can be determined by the thermal performance of exterior walls and windows and subsequently, improvement of the calculation method can be realized. In this paper, we use the regression analysis method in SPSS software to calculate the linear regression Equation (12), with the comprehensive heat loss coefficient as the dependent variable and the heat transfer coefficient of the exterior wall and window as the independent variable.
where is the modified comprehensive heat loss coefficient, W/m2·K; is the heat transfer coefficient of the external wall, W/m2·K; and is the heat transfer coefficient of the external window, W/m2·K.
According to Equation (12), the comprehensive heat loss coefficient of measured items is calculated to verify the accuracy of the formula. The verification results presented in Table 30 show that except for the maximum error of item 10, the errors of the corrected calculation results of other items are within ±15% and the trend of change is shown in Figure 26. The comprehensive heat loss coefficient is consistent with the trend of change of the corrected results. If the number of samples is increased in future research, the error value of the corrected calculation results will be further reduced. Therefore, Equation (12) can be used to calculate and construct the correct results for the comprehensive heat loss coefficient of the building envelope.
4. Results
4.1. Multi-Index Comprehensive Evaluating Model
According to the quantitative results of green building envelope practices in a cold area, we can get the calculation equations (Equations (13)–(17)) of the thermal performance, environmental impact, and economic cost of different practices. Taking the rock wool insulation exterior wall and roof as examples, we can establish the multi-index model.
where x is the thickness of insulation material, mm.
PED = 0.286x
GWP = 0.5522x
COST = 0.3016x,
First, the index values of rock wool with different thicknesses were calculated according to the aforementioned equations. The thickness range was 10 to 200 mm. Thereafter, MATLAB was used to make the indicators dimensionless, as shown in Table 31 and Table 32. Finally, according to the different importance of each index, the weight of each index was determined by the method of quadrant weight assignment, and the comprehensive score under different thicknesses of insulation layer was calculated using Equation (11).
From the above calculation results, the optimum thickness of rock wool for the external wall should be 100 and 60 mm for the roof. For other types of enclosure, the same method can be used for evaluation, which need not be detailed here.
4.2. Model Application
Taking the prototype residential building in a cold area as an example, we used the multi-index evaluation model to evaluate the practice of the envelope and then selected the best building envelope scheme. The analysis and evaluation process is as follows:
(1) According to the simulation results in Table 7 and Figure 5, when the overall thermal performance of the building is improved between 5% and 50%, good results can be achieved, and when it reaches 40%, the improvement effect is the best;
(2) Table 8 and Figure 6 show that in the simulation results of thermal load, the proportion of external windows and external walls is large, about 40–50%, while the proportion of roof heat load is small, about 5%;
(3) Figure 21, Figure 23 and Figure 25 show the sensitivity analysis results of the thermal performance of the building envelope. We can see that the comprehensive heat loss coefficient is more sensitive to the performance improvement of external walls and windows, and improvement of the roof thermal performance has little impact on it;
(4) According to the analysis above, we determined that the thermal performance of the external wall and window can be improved by 40% and that of the roof can be improved by 5%. Subsequently, the corresponding scheme can be seen in Table 21, Table 22, Table 23, Table 24, Table 25 and Table 26, according to the promotion range, and the comprehensive score can be calculated according to the multi-index evaluation model, as shown in Table 33. The optimal scheme can be selected after comparison: XPS board (30 mm) for external wall insulation, PU board (60 mm) for roof insulation, and a heat broke aluminum frame (5Low-e + 13Ar + 5) for external windows.
5. Discussion
The heat load simulation results in Figure 5 and Figure 7 show the relationship between the improvement range of the building thermal performance and the heat load. When the thermal performance of a residential building envelope is improved by 5–50%, a better effect can be achieved, and the best improvement range is 40%. When the thermal performance is improved by 29%, it is close to the four-step energy efficiency standard (JGJ 26-2018) [11] implemented on August 1, 2019. When the improvement of the thermal performance reaches 36% and 43%, respectively, it corresponds to the requirements of 10% and 20% improvement of the envelope based on the four-step energy saving standard in the Assessment Standard for Green Building (GB/T 50378-2019) [13]. This shows the rationality of the two new standards. The effective range of improving the thermal performance of the public building envelope is also 5–50%, and the best range of improving performance is 30%. In addition, the heat load proportion range of two types of buildings is exterior window > exterior wall > roof.
According to the research results, the methods of the green building envelope in a cold area can be summarized. Based on the basic practices of exterior walls and roofs, the heat transfer coefficients of four kinds of insulation layers under different thicknesses, the corresponding thermal performance improvement range, and the heat transfer coefficients and thermal performance improvement range of 10 kinds of common exterior windows were quantitatively analyzed. The life cycle environmental impact assessment index was introduced to analyze the environmental impact of different building envelopes. Simultaneously, an investment analysis was conducted, and the cost of thermal performance improvement was quantified. The results show that the life cycle and environmental impact cost will increase sharply if the thermal performance of the enclosure is improved too much [46]. Finally, the above quantitative results were summarized into a database of green building envelope practices in cold areas (Table 21, Table 22, Table 23, Table 24, Table 25, Table 26 and Table 27), which provides data support for a multi-index evaluation of the green building envelope. However, this paper lacks case tests and research on common buildings and other climate areas. In future research, we can increase the number of projects, expand the research area, and expand and update the building envelope database.
The heat consumption test results (Figure 17) of 10 green building projects show that the actual heat consumption of the building is affected by the thermal performance of the envelopes in three positions. Therefore, to reflect the relationship between the heat consumption and thermal performance of the envelope, the concept of the comprehensive heat loss coefficient was upgraded, and the actual heat consumption of the building was equivalent to the heat transferred by the enclosure in the unit area. The sensitivity analysis of the thermal performance of the exterior wall, roof, and window shows that the exterior wall and window had the greatest impact on the thermal performance of the building envelope, while the roof had the least impact [38]. This is consistent with the results of the thermal load simulation analysis. It shows that the key to improving the thermal performance of the building envelope is to improve the performance of the exterior wall and window. Furthermore, the correction formula of the comprehensive heat loss coefficient was proposed, and the verification results of the comprehensive heat loss coefficient of the measured items were used. Except for the maximum error of project 10, the error of other projects was within ±15%. The change trend of the measured value and the corrected value was consistent, so the correction formula Equation (12) is valid.
According to the quantitative database of each index of the building envelope, the multi-index evaluation model and design selection system of the building envelope was established. Through the above analysis and research, the selection principle of the building envelope scheme was determined. According to the evaluation results of the comprehensive score calculation using the database and the multi-index evaluation model, the best envelope scheme for green residential buildings in cold areas is as follows: XPS board (30 mm) for external wall insulation, PU board (60 mm) for roof insulation, and a heat broke aluminum frame (5Low-e + 13Ar + 5) for external windows. The database of building envelope practice needs to be further expanded and updated. The weight coefficient and evaluation index used in the evaluation model can also be adjusted according to the emphasis of different evaluation objectives in practical applications.
6. Conclusions
This paper presents a multi-index evaluation and decision-making method for the green building envelope and applies it to the envelope design of typical residential buildings in the cold areas of northern China. The method of selecting exterior windows, exterior walls, and roofs is discussed in terms of the thermal performance, life cycle cost, and environmental load. This evaluation system includes a multi-index evaluation model and building envelope practice database, which can guide the formulation of relevant design or evaluation standards and can also guide the architectural design or building retrofit works. In future research, through the establishment and analysis of a database of specific application scenarios, this method can also be applied to the evaluation of different types of building envelope in other climatic regions. Moreover, the database of envelope practices also needs to be expanded and updated. In addition, the weight of each index of the multi-index evaluation model needs further study as the change of weight can affect the evaluation results. The selection of weight and index can also be adjusted according to the emphasis of the evaluation purpose. Therefore, the framework proposed in this study has wide application prospects.
On the basis of the energy efficiency standard limit, improving the overall building envelope performance can yield better results. However, when the level of thermal performance improvement is too high, the energy effect is not significant because the proportion of heat consumption of the envelope will be reduced. At the same time, with the increase in thermal performance, the corresponding life cycle cost and environmental impact will increase significantly. Therefore, it is not wise to over pursue the high level of thermal performance improvement, which should be moderate.
The actual heat consumption of the building is often different from the theoretical calculation results, and the heat transfer coefficient of the envelope cannot directly reflect the actual energy consumption level of the building. In terms of the thermal performance of the enclosure structure, different performance improvement schemes have different effects. The thermal performance improvement of the exterior wall and the exterior window should be balanced as the performance of the roof has little influence on the overall heat consumption of the building. The relationship among the three needs further study. The energy consumption of public buildings is generally higher than that of residential buildings, and the proportion of heat consumption of their external windows is higher. In addition to the influence of the heat transfer coefficient of the enclosure, the building shape coefficient, window-wall ratio [47], orientation, operation mode [48], and other factors will impact the actual heat consumption. In this paper, the prediction model of green building heat consumption in the cold area was established by optimizing the comprehensive heat loss coefficient of the enclosure. In future research, more case studies should be included to improve the accuracy of the prediction model.
Author Contributions
Conceptualization, T.Z. and Z.W.; methodology, Z.W.; validation, T.Z.; formal analysis, Z.W.; investigation, T.Z.; resources, S.L.; writing—original draft preparation, Z.W.; writing—review and editing, S.L.; visualization, Z.W.; supervision, S.L.; project administration, S.L.; funding acquisition, S.L. All authors have read and agreed to the published version of the manuscript.
Funding
“This research was funded by National Key R&D Program of China, Grant No. 2016YFC0700100”.
Acknowledgments
This research has been supported by the “National Key R&D Program of China” (Grant No. 2016YFC0700100).
Conflicts of Interest
The authors declare no conflicts of interest.
Appendix A

References
- International Energy Agency. International Energy Agency Tracking Clean Energy Progress 2016. Available online: http://www.iea.org/publications/freepublications/publication/TrackingCleanEnergyProgress2016 (accessed on 12 March 2017).
- Europa. Available online: https://ec.europa.eu/energy/en/topics/energy-efficiency/buildings (accessed on 29 June 2018).
- Eom, J.Y.; Clarke, L.; Kim, S.H.; Kyle, P.; Patel, P. China’s building energy demand: Long-term implications from a detailed assessment. Energy 2012, 46, 405–419. [Google Scholar] [CrossRef]
- Hewawasam, V.; Matsui, K. Historical development of climate change policies and the Climate Change Secretariat in Sri Lanka. Environ. Sci. Policy 2019, 101, 255–261. [Google Scholar] [CrossRef]
- Huo, T.F.; Ren, H.; Zhang, X.L.; Cai, W.G.; Feng, W.; Zhou, N.; Wang, X. China’s energy consumption in the building sector: A Statistical Yearbook-Energy Balance Sheet based splitting method. J. Clean. Prod. 2018, 185, 665–679. [Google Scholar] [CrossRef]
- Zhang, S.; Zhao, T. Identifying major influencing factors of CO2 emissions in China: Regional disparities analysis based on STIRPAT model from 1996 to 2015. Atmos. Environ. 2019, 207, 136–147. [Google Scholar] [CrossRef]
- EIA. International Energy Outlook 2016. 2017. Available online: https://www.eia.gov/electricity/ (accessed on 23 December 2017).
- Zhao, M.; Künzel, H.M.; Antretter, F. Parameters influencing the energy performance of residential buildings in different Chinese climate zones. Energy Build. 2015, 96, 64–75. [Google Scholar] [CrossRef]
- Yu, S.; Eom, J.Y.; Zhou, Y.Y.; Evans, M.; Clarke, L. Scenarios of building energy demand for China with a detailed regional representation. Energy 2014, 67, 284–297. [Google Scholar] [CrossRef]
- Ministry of Housing and Urban-Rural Development of the People’s Republic of China (MOHURD). Design Code for Civil Building Energy Efficiency (JGJ 26-86); China Architecture & Building Press: Beijing, China, 1986. (In Chinese)
- Ministry of Housing and Urban-Rural Development of the People’s Republic of China (MOHURD). Residential Buildings in Severe Cold and Cold Zones (JGJ 26-2018); China Architecture & Building Press: Beijing, China, 2018. (In Chinese)
- Ministry of Housing and Urban-Rural Development of the People’s Republic of China (MOHURD). Design Standard for Energy Efficiency of Public Buildings (GB 50189-2015); China Architecture & Building Press: Beijing, China, 2015. (In Chinese)
- Ministry of Housing and Urban-Rural Development of the People’s Republic of China (MOHURD). Assessment Standard for Green Building (GB/T 50378-2019); China Architecture & Building Press: Beijing, China, 2019. (In Chinese)
- Bruce-Hyrkäs, T.; Pasanen, P.; Castro, R. Overview of Whole Building Life-Cycle Assessment for Green Building Certification and Ecodesign through Industry Surveys and Interviews. Procedia CIRP 2018, 69, 178–183. [Google Scholar] [CrossRef]
- Song, X.Y.; Ye, C.T.; Li, H.S.; Wang, X.L.; Ma, W.B. Field study on energy economic assessment of office buildings envelope retrofitting in southern China. Sustain. Cities Soc. 2017, 28, 154–161. [Google Scholar] [CrossRef]
- Kaynakli, O. A review of the economical and optimum thermal insulation thickness for building applications. Renew. Sustain. Energy Rev. 2012, 16, 415–425. [Google Scholar] [CrossRef]
- Dylewski, R.; Adamczyk, J. Study on ecological cost-effectiveness for the thermal insulation of building external vertical walls in Poland. Renew. Sustain. Energy Rev. 2012, 16, 415–425. [Google Scholar] [CrossRef]
- Daouas, N. Impact of external longwave radiation on optimum insulation thickness in Tunisian building roofs based on a dynamic analytical model. Appl. Energy 2016, 177, 136–148. [Google Scholar] [CrossRef]
- Hee, W.J.; Alghoul, M.A.; Bakhtyar, B.; Elayeb, O.; Shameri, M.A.; Alrubaih, M.S.; Sopian, K. The role of window glazing on daylighting and energy saving in buildings. Renew. Sustain. Energy Rev. 2015, 42, 323–343. [Google Scholar] [CrossRef]
- Zhang, L.L.; Li, Z.A.; Hou, C.P.; Wei, D.; Hou, Y.Y. Optimization analysis of thermal insulation layer attributes of building envelope exterior wall based on DeST and life cycle economic evaluation. Case Stud. Therm. Eng. 2019, 14, 100410. [Google Scholar] [CrossRef]
- Dodoo, A.; Gustavsson, L.; Tettey, U.Y.A. Cost-optimized energy-efficient building envelope measures for a multi-storey residential building in a cold climate. Energy Procedia 2019, 158, 3760–3767. [Google Scholar] [CrossRef]
- Azari, R. Integrated energy and environmental life cycle assessment of office building envelopes. Energy Build. 2014, 82, 156–162. [Google Scholar] [CrossRef]
- Saafi, K.; Daouas, N. A life-cycle cost analysis for an optimum combination of cool coating and thermal insulation of residential building roofs in Tunisia. Energy 2018, 152, 925–938. [Google Scholar] [CrossRef]
- Li, X.D.; Yang, F.; Zhu, Y.M.; Gao, Y.X. An assessment framework for analyzing the embodied carbon impacts of residential buildings in China. Energy Build. 2014, 85, 400–409. [Google Scholar] [CrossRef]
- Aldawi, F.; Alam, F. Residential Building Wall Systems: Energy Efficiency and Carbon Footprint. In Thermofluid Modeling for Energy Efficiency Applications; Khan, M.M.K., Hassan, N.M.S., Eds.; Elsevier: Amsterdam, The Netherlands, 2016; pp. 169–196. [Google Scholar]
- Adamczyk, J.; Dylewski, R. The impact of thermal insulation investments on sustainability in the construction sector. Renew. Sustain. Energy Rev. 2017, 80, 421–429. [Google Scholar] [CrossRef]
- Azari, R.; Garshasbi, S.; Amini, P.; Rashed-Ali, H.; Mohammadi, Y. Multi-objective optimization of building envelope design for life cycle environmental performance. Energy Build. 2016, 126, 524–534. [Google Scholar] [CrossRef]
- Kosareo, L.; Ries, R. Comparative environmental life cycle assessment of green roofs. Build. Environ. 2014, 42, 2606–2613. [Google Scholar] [CrossRef]
- Wu, R.; Mavromatidis, G.; Orehounig, K.; Carmeliet, J. Multiobjective optimization of energy systems and building envelope retrofit in a residential community. Appl. Energy. 2017, 190, 634–649. [Google Scholar] [CrossRef]
- Ferrara, M.; Filippi, M.; Sirombo, E.; Cravino, V. A Simulation-Based Optimization Method for the Integrative Design of the Building Envelope. Energy Procedia 2015, 78, 2608–2613. [Google Scholar] [CrossRef] [Green Version]
- Ascione, F.; Bianco, N.; Mauro, G.M.; Napolitano, D.F. Building envelope design: Multi-objective optimization to minimize energy consumption, global cost and thermal discomfort. Application to different Italian climatic zones. Energy 2019, 174, 359–374. [Google Scholar] [CrossRef]
- Echenagucia, T.M.; Capozzoli, A.; Cascone, Y.; Sassone, M. The early design stage of a building envelope: Multi-objective search through heating, cooling and lighting energy performance analysis. Appl. Energy 2015, 154, 577–591. [Google Scholar] [CrossRef]
- Ciulla, G.; D’Amico, A.; Lo Brano, V.; Traverso, M. Application of optimized artificial intelligence algorithm to evaluate the heating energy demand of non-residential buildings at European level. Energy 2019, 176, 380–391. [Google Scholar] [CrossRef]
- Wu, W.D.; Guo, J.L.; Li, J.W.; Huo, H.Y.; Meng, Q.; Wang, W.D. A multi-objective optimization design method in zero energy building study: A case study concerning small mass buildings in cold district of China. Energy Build. 2018, 158, 1613–1624. [Google Scholar] [CrossRef]
- Li, H.X.; Wang, S.W.; Cheung, H. Sensitivity analysis of design parameters and optimal design for zero/low energy buildings in subtropical regions. Appl. Energy 2018, 228, 1280–1291. [Google Scholar] [CrossRef]
- Singh, R.; Lazarus, I.J.; Kishore, V.V.N. Uncertainty and sensitivity analyses of energy and visual performances of office building with external venetian blind shading in hot-dry climate. Appl. Energy 2016, 184, 155–170. [Google Scholar] [CrossRef]
- Tian, W. A review of sensitivity analysis methods in building energy analysis. Renew. Sustain. Energy Rev. 2013, 20, 411–419. [Google Scholar] [CrossRef]
- Liu, C. Research on Energy Conservation Reconstruction Technology of Public Building in Cold Region Based on Sensitivity Analysis. Master’s Thesis, Liaoning University of Science and Technology, Anshan, China, 2019. (In Chinese). [Google Scholar]
- Ministry of Housing and Urban-Rural Development of the People’s Republic of China (MOHURD). Residential Buildings in Severe Cold and Cold Zones (JGJ 26-2010); China Architecture & Building Press: Beijing, China, 2010. (In Chinese)
- Ministry of Housing and Urban-Rural Development of the People’s Republic of China (MOHURD). Design Code for Civil Building Energy Efficiency (JGJ 26-95); China Architecture & Building Press: Beijing, China, 1995. (In Chinese)
- Jin, O.Y.; Li, D.S. Discussion on the determination method of building heat loss coefficient. HVAC 1983, 4, 11–15. (In Chinese) [Google Scholar]
- Jiang, Q. Selection Technology of Material for Green Building, 1st ed.; Publisher: Beijing, China, 2015; pp. 90–120. [Google Scholar]
- China Building Materials Online. Available online: http://www.jc.net.cn/ (accessed on 16 May 2018).
- Ministry of Housing and Urban-Rural Development of the People’s Republic of China (MOHURD). Standard for Energy Consumption of Building (GB/T 51161-2016); China Architecture & Building Press: Beijing, China, 2016. (In Chinese)
- Ling, J.H.; Ma, H.T.; Yu, H.Z.; Xing, J.C. Quantitative research of incentive effects of heat-metering policy on energy-saving behavior in Tianjin. Front. Energy 2014, 8, 504–512. [Google Scholar] [CrossRef]
- Kumar, S.; Takano, A.; Alanne, K.; Siren, K. A life cycle approach to optimizing carbon footprint and costs of a residential building. Build. Environ. 2017, 123, 146–162. [Google Scholar]
- Yong, S.-G.; Kim, J.-H.; Gim, Y.; Kim, J.; Cho, J.; Hong, H.; Baik, Y.-J.; Koo, J. Impacts of building envelope design factors upon energy loads and their optimization in US standard climate zones using experimental design. Energy Build. 2017, 141, 1–15. [Google Scholar] [CrossRef]
- Zhou, Z.; Wang, C.; Sun, X.; Gao, F.; Feng, W.; Zillante, G. Heating energy saving potential from building envelope design and operation optimization in residential buildings: A case study in northern China. J. Clean. Prod. 2018, 174, 413–423. [Google Scholar] [CrossRef]
Figure 1.
Building stereogram and plan of a typical building model.

Figure 2.
Heat consumption testing equipment.

Figure 3.
Building stereogram and plan of the model for project 1.

Figure 4.
Building stereogram and plan of the model for project 10.

Figure 5.
Relationship between thermal performance improvement and the heat load of a residential building.
Figure 5.
Relationship between thermal performance improvement and the heat load of a residential building.

Figure 6.
Proportion of heat load in each part of the residential building envelope.

Figure 7.
Relationship between thermal performance improvement and the heat load of a public building.
Figure 7.
Relationship between thermal performance improvement and the heat load of a public building.

Figure 8.
Proportion of heat load in each part of the public building envelope.

Figure 9.
Proportion of building envelope materials.

Figure 10.
Relationship between the thickness of a rock wool insulation layer and the thermal performance of an exterior wall.
Figure 10.
Relationship between the thickness of a rock wool insulation layer and the thermal performance of an exterior wall.

Figure 11.
Relationship between the thickness of a rock wool insulation layer and the thermal performance of a roof.
Figure 11.
Relationship between the thickness of a rock wool insulation layer and the thermal performance of a roof.

Figure 12.
Relationship between thermal performance improvement of an exterior wall and the environmental impact.
Figure 12.
Relationship between thermal performance improvement of an exterior wall and the environmental impact.

Figure 13.
Relationship between thermal performance improvement of a roof and the environmental impact.
Figure 13.
Relationship between thermal performance improvement of a roof and the environmental impact.

Figure 14.
Relationship between thermal performance improvement of an exterior wall and costs.

Figure 15.
Relationship between thermal performance improvement of a roof and costs.

Figure 16.
The relationship between heat consumption and the limit value.

Figure 17.
The relationship between thermal performance improvement and heat consumption.

Figure 18.
Relationship between the comprehensive heat transfer coefficient and heat consumption.

Figure 19.
Variation trend of the comprehensive heat loss coefficient and comprehensive heat transfer coefficient.
Figure 19.
Variation trend of the comprehensive heat loss coefficient and comprehensive heat transfer coefficient.

Figure 20.
Sensitivity analysis of public building exterior walls.

Figure 21.
Sensitivity analysis of residential building exterior walls.

Figure 22.
Sensitivity analysis of public building roofs.

Figure 23.
Sensitivity analysis of residential building roofs.

Figure 24.
Sensitivity analysis of public building exterior windows.

Figure 25.
Sensitivity analysis of residential building exterior windows.

Figure 26.
Validation of the comprehensive heat loss coefficient.


Table 1.
Building prototype modeling parameters in a cold area.
| Building Type | Shape Coefficient | External Window U (W/m2·K) | External Wall U (W/m2·K) | Roof U (W/m2·K) | Window-Wall Ratio | Length (m) × Width (m) × Height (m) |
|---|---|---|---|---|---|---|
| Residential building | 0.3 | 2.7 | 0.7 | 0.45 | 0.3 | 15 × 15 × 30 |
| Public building | 0.4 | 1.9 | 0.45 | 0.4 | 0.5 | 11 × 11 × 30 |
Table 2.
Information of ten green buildings.
| Project | Location | Type | Grade |
|---|---|---|---|
| 1 | Tianjin | Office | Three-star design |
| 2 | Tianjin | Office | Two-star operation |
| 3 | Shijiazhuang | Office | Three-star design |
| 4 | Tianjin | School | Three-star operation |
| 5 | Tianjin | Office | Three-star design |
| 6 | Tianjin | Office | Three-star operation |
| 7 | Tianjin | Office | Two-star design |
| 8 | Hezei | Residence | Three-star operation |
| 9 | Hezei | Residence | Three-star operation |
| 10 | Taian | Residence | Two-star operation |
Table 3.
Non-renewable energy consumption (PED) and greenhouse effect (GWP) of different types of insulation layer [42] (pp. 90–95).
Table 3.
Non-renewable energy consumption (PED) and greenhouse effect (GWP) of different types of insulation layer [42] (pp. 90–95).
| Material | PED (kgce/kg) | GWP (kg CO2 eq/kg) |
|---|---|---|
| Rock wool | 2.6 | 5.02 |
| Polyurethane (PU) | 6.74 | 11.5 |
| Polystyrene (EPS/XPS) | 8.46 | 12.1 |
Table 4.
PED and GWP of different types of external window [42] (pp. 117–120).
Table 4.
PED and GWP of different types of external window [42] (pp. 117–120).
| Frame | Glass | PED (kgce/m2) | GWP (kg CO2 eq/m2) |
|---|---|---|---|
| PVC | 5low-e + 12Ar + 5 | 4.51 | 9.89 |
| Heat broke aluminum | 5low-e + 6A + 5 | 6.73 | 15.25 |
| Heat broke aluminum | 5low-e + 8A + 5 | 6.73 | 15.25 |
| Heat broke aluminum | 5low-e + 6Ar + 5 | 6.73 | 15.25 |
| Heat broke aluminum | 5low-e + 12A + 5 | 6.73 | 15.25 |
| Heat broke aluminum | 5low-e + 13Ar + 5 | 6.73 | 15.25 |
| PVC | 5low-e + 12A + 5 + 12A + 5 | 5.31 | 11.7 |
| PVC | 5low-e + 10Ar + 5 + 6Ar + 5 | 5.31 | 11.7 |
| PVC | 5low-e + 10Ar + 5 + 8Ar + 5 | 5.31 | 11.7 |
| PVC | 5low-e + 13Ar + 5 + 13Ar + 5 | 5.31 | 11.7 |
Table 5.
Costs of different types of insulation layer.
| Material | Unit Price (RMB/m3) |
|---|---|
| Rock wool | 302 |
| Polyurethane | 680 |
| Polystyrene (EPS/XPS) | 348/501 |
Table 6.
Costs of different types of external window.
| Frame | Glass | Unit Price (RMB/m2) |
|---|---|---|
| PVC | 5low-e + 12Ar + 5 | 359 |
| Heat broke aluminum | 5low-e + 6A + 5 | 450 |
| Heat broke aluminum | 5low-e + 8A + 5 | 474 |
| Heat broke aluminum | 5low-e + 6Ar + 5 | 613 |
| Heat broke aluminum | 5low-e + 12A + 5 | 568 |
| Heat broke aluminum | 5low-e + 13Ar + 5 | 650 |
| PVC | 6low-e + 12A + 6 + 12A + 6 | 483 |
| PVC | 6low-e + 10Ar + 6 + 6Ar + 6 | 495 |
| PVC | 6low-e + 10Ar + 6 + 8Ar + 6 | 512 |
| PVC | 6low-e + 13Ar + 6 + 13Ar + 6 | 540 |
Table 7.
Heat load of a prototype residential building.
| Improvement | U-Value(W/m2·K) | Heat Load (kWh/m2·a) | Heat Load Decrease (kWh/m2·a) | Decline Rate | ||
|---|---|---|---|---|---|---|
| External Window | External Wall | Roof | ||||
| 0% | 2.7 | 0.7 | 0.45 | 41.02 | N/A | N/A |
| 5% | 2.57 | 0.67 | 0.43 | 38.57 | 2.45 | 5.97% |
| 10% | 2.43 | 0.63 | 0.41 | 35.18 | 3.39 | 8.79% |
| 20% | 2.16 | 0.56 | 0.36 | 31.73 | 3.45 | 9.81% |
| 30% | 1.89 | 0.49 | 0.315 | 27.72 | 4.01 | 12.64% |
| 40% | 1.62 | 0.42 | 0.27 | 23.02 | 4.7 | 16.96% |
| 50% | 1.35 | 0.35 | 0.225 | 20.56 | 2.46 | 10.69% |
| 60% | 1.08 | 0.28 | 0.18 | 19.99 | 0.57 | 2.77% |
| 65% | 0.95 | 0.25 | 0.16 | 19.86 | 0.13 | 0.65% |
Table 8.
Proportion of heat load in each part of the residential building envelope.
| Improvement | External Window | External Wall | Roof | |||
|---|---|---|---|---|---|---|
| Heat Load (kWh/m2·a) | Proportion | Heat Load (kWh/m2·a) | Proportion | Heat Load (kWh/m2·a) | Proportion | |
| 0% | 20.93 | 51.02% | 18.06 | 44.03% | 2.03 | 4.95% |
| 5% | 20.07 | 50.73% | 17.52 | 44.29% | 1.97 | 4.97% |
| 10% | 18.52 | 51.20% | 15.85 | 43.80% | 1.81 | 5.00% |
| 20% | 16.60 | 50.71% | 14.50 | 44.30% | 1.63 | 4.98% |
| 30% | 14.35 | 48.27% | 13.83 | 46.54% | 1.54 | 5.20% |
| 40% | 12.21 | 46.92% | 12.44 | 47.80% | 1.37 | 5.28% |
| 50% | 10.40 | 45.51% | 11.22 | 49.11% | 1.23 | 5.38% |
| 60% | 9.63 | 46.88% | 9.85 | 47.97% | 1.06 | 5.14% |
| 65% | 9.50 | 50.81% | 8.24 | 44.08% | 0.95 | 5.11% |
Table 9.
Heat load of a prototype public building.
| Improvement | U-Value (W/m2·k) | Heat Load (kWh/m2·a) | Heat Load Decrease (kWh/m2·a) | Decline Rate | ||
|---|---|---|---|---|---|---|
| External Window | External Wall | Roof | ||||
| 0% | 1.9 | 0.45 | 0.4 | 57.07 | N/A | N/A |
| 5% | 1.8 | 0.428 | 0.38 | 51.92 | 5.15 | 9.02% |
| 10% | 1.71 | 0.405 | 0.36 | 46.63 | 5.29 | 10.19% |
| 20% | 1.52 | 0.36 | 0.32 | 41.27 | 5.36 | 11.49% |
| 30% | 1.33 | 0.315 | 0.28 | 34.45 | 6.82 | 16.53% |
| 40% | 1.14 | 0.27 | 0.24 | 30.53 | 3.92 | 11.38% |
| 50% | 0.95 | 0.225 | 0.2 | 27.41 | 3.12 | 10.22% |
| 60% | 0.76 | 0.18 | 0.16 | 25.66 | 1.75 | 6.38% |
| 65% | 0.7 | 0.16 | 0.14 | 25.57 | 0.09 | 0.35% |
Table 10.
Proportion of heat load in each part of the public building envelope.
| Improvement | External Window | External Wall | Roof | |||
|---|---|---|---|---|---|---|
| Heat Load (kWh/m2·a) | Proportion | Heat Load (kWh/m2·a) | Proportion | Heat Load (kWh/m2·a) | Proportion | |
| 0% | 41.19 | 72.18% | 13.78 | 24.14% | 2.10 | 3.68% |
| 5% | 38.17 | 70.79% | 13.70 | 25.40% | 2.05 | 3.81% |
| 10% | 37.48 | 71.22% | 13.18 | 25.05% | 1.96 | 3.73% |
| 20% | 33.86 | 70.13% | 12.54 | 25.98% | 1.87 | 3.88% |
| 30% | 25.49 | 67.71% | 10.56 | 28.06% | 1.59 | 4.23% |
| 40% | 21.50 | 66.10% | 9.44 | 29.03% | 1.59 | 4.87% |
| 50% | 18.22 | 64.11% | 8.88 | 31.26% | 1.31 | 4.63% |
| 60% | 18.84 | 68.61% | 7.50 | 27.33% | 1.11 | 4.05% |
| 65% | 18.15 | 71.01% | 6.38 | 24.95% | 1.03 | 4.04% |
Table 11.
Common practices of non-transparent envelopes.
| Position | Inner Layer | Foundation Layer | Leveling Course | Insulation Layer | Outer Layer |
|---|---|---|---|---|---|
| Wall | Cement mortar | Aerated concrete block | Cement mortar | Rock wool/PU/EPS/XPS | Cement mortar |
| Roof | Cement mortar | Aerated concrete block | Cement mortar | Rock wool/PU/EPS/XPS | Cement mortar |
Table 12.
Quantification of the heat transfer coefficient of a rock wool insulation exterior wall.
| Material | Thickness mm | Thermal Conductivity W/m·K | U-Value W/m2·K |
|---|---|---|---|
| Rock wool | 10 | 0.041 | 0.528 |
| 20 | 0.041 | 0.468 | |
| 40 | 0.041 | 0.381 | |
| 60 | 0.041 | 0.321 | |
| 80 | 0.041 | 0.278 | |
| 100 | 0.041 | 0.244 | |
| 120 | 0.041 | 0.218 | |
| 140 | 0.041 | 0.197 | |
| 160 | 0.041 | 0.180 | |
| 180 | 0.041 | 0.166 | |
| 200 | 0.041 | 0.153 | |
| Cement mortar | 20 | 0.93 | N/A |
| Aerated concrete block | 200 | 0.14 | N/A |
Table 13.
Quantification of the heat transfer coefficient of a rock wool insulation roof.
| Material | Thickness mm | Thermal Conductivity W/m·K | U-Value W/m2·K |
|---|---|---|---|
| Rock wool | 10 | 0.041 | 1.91 |
| 20 | 0.041 | 1.30 | |
| 40 | 0.041 | 0.80 | |
| 60 | 0.041 | 0.57 | |
| 80 | 0.041 | 0.45 | |
| 100 | 0.041 | 0.37 | |
| 120 | 0.041 | 0.31 | |
| 140 | 0.041 | 0.27 | |
| 160 | 0.041 | 0.24 | |
| 180 | 0.041 | 0.21 | |
| 200 | 0.041 | 0.19 | |
| Cement mortar | 20 | 0.93 | N/A |
| Reinforced concrete | 100 | 1.74 | N/A |
Table 14.
Level of thermal performance improvement for different insulation exterior walls.
| Thickness (mm) | Thermal Performance Improvement | |||
|---|---|---|---|---|
| Rock wool | PU | EPS | XPS | |
| 10 | 24.61% | 30.91% | 26.89% | 28.01% |
| 20 | 33.21% | 42.50% | 36.71% | 38.36% |
| 40 | 45.61% | 56.94% | 50.11% | 52.13% |
| 60 | 54.13% | 65.59% | 58.82% | 60.87% |
| 80 | 60.34% | 71.34% | 64.95% | 66.91% |
| 100 | 65.07% | 75.44% | 69.48% | 71.34% |
| 120 | 68.79% | 78.52% | 72.98% | 74.72% |
| 140 | 71.80% | 80.91% | 75.76% | 77.39% |
| 160 | 74.28% | 82.83% | 78.02% | 79.55% |
| 180 | 76.35% | 84.39% | 79.90% | 81.33% |
| 200 | 78.12% | 85.69% | 81.48% | 82.83% |
Table 15.
Level of thermal performance improvement for different insulation roofs.
| Thickness mm | Insulating Layer Material | |||
|---|---|---|---|---|
| Rock Wool | PU | EPS | XPS | |
| 10 | N/A | N/A | N/A | N/A |
| 20 | N/A | N/A | N/A | N/A |
| 40 | N/A | N/A | N/A | N/A |
| 60 | N/A | 20.06% | N/A | 2.53% |
| 80 | 0.40% | 38.50% | 17.82% | 24.58% |
| 100 | 18.27% | 50.02% | 32.87% | 38.50% |
| 120 | 30.70% | 57.91% | 43.26% | 48.08% |
| 140 | 39.85% | 63.65% | 50.86% | 55.08% |
| 160 | 46.87% | 68.01% | 56.67% | 60.41% |
| 180 | 52.42% | 71.44% | 61.25% | 64.61% |
| 200 | 56.92% | 74.20% | 64.95% | 68.01% |
Table 16.
Improvement in the thermal performance of different types of windows.
| Frame | Glass | U-Value W/(m2·k) | Improvement | |
|---|---|---|---|---|
| Residential | Public | |||
| PVC | 5 + 12Ar + 5 | 2.511 | 7.00% | N/A |
| Heat broke aluminum | 5low-e + 6A + 5 | 2.43 | 10.00% | N/A |
| Heat broke aluminum | 5low-e + 8A + 5 | 2.1 | 22.22% | N/A |
| Heat broke aluminum | 5low-e + 6Ar + 5 | 1.988 | 26.37% | N/A |
| Heat broke aluminum | 5low-e + 12A + 5 | 1.774 | 42.87% | 6.63% |
| Heat broke aluminum | 5low-e + 13Ar + 5 | 1.495 | 44.63% | 21.32% |
| PVC | 5low-e + 12A + 5 + 12A + 5 | 1.3 | 51.85% | 31.58% |
| PVC | 5low-e + 10Ar + 5 + 6Ar + 5 | 1.2 | 55.56% | 36.84% |
| PVC | 5low-e + 10Ar + 5 + 8Ar + 5 | 1.13 | 58.15% | 40.53% |
| PVC | 5low-e + 13Ar + 5 + 13Ar + 5 | 1.06 | 60.74% | 44.21% |
Table 17.
PED of the thermal insulation layer.
| Thickness mm | PED (kgce/m2) | |||
|---|---|---|---|---|
| Rock Wool | PU | EPS | XPS | |
| 10 | 2.860 | 2.359 | 1.692 | 2.961 |
| 20 | 5.720 | 4.718 | 3.384 | 5.922 |
| 40 | 11.440 | 9.436 | 6.768 | 11.844 |
| 60 | 17.160 | 14.154 | 10.152 | 17.766 |
| 80 | 22.880 | 18.872 | 13.536 | 23.688 |
| 100 | 28.600 | 23.590 | 16.920 | 29.610 |
| 120 | 34.320 | 28.308 | 20.304 | 35.532 |
| 140 | 40.040 | 33.026 | 23.688 | 41.454 |
| 160 | 45.760 | 37.744 | 27.072 | 47.376 |
| 180 | 51.480 | 42.462 | 30.456 | 53.298 |
| 200 | 57.200 | 47.180 | 33.840 | 59.220 |
Table 18.
GWP of the thermal insulation layer.
| Thickness mm | GWP (kg CO2 eq/m2) | |||
|---|---|---|---|---|
| Rock Wool | PU | EPS | XPS | |
| 10 | 5.522 | 4.025 | 2.420 | 4.235 |
| 20 | 11.044 | 8.050 | 4.840 | 8.470 |
| 40 | 22.088 | 16.100 | 9.680 | 16.940 |
| 60 | 33.132 | 24.150 | 14.520 | 25.410 |
| 80 | 44.176 | 32.200 | 19.360 | 33.880 |
| 100 | 55.220 | 40.250 | 24.200 | 42.350 |
| 120 | 66.264 | 48.300 | 29.040 | 50.820 |
| 140 | 77.308 | 56.350 | 33.880 | 59.290 |
| 160 | 88.352 | 64.400 | 38.720 | 67.760 |
| 180 | 99.396 | 72.450 | 43.560 | 76.230 |
| 200 | 110.440 | 80.500 | 48.400 | 84.700 |
Table 19.
Thermal performance and environmental impact of a rockwool exterior wall and roof.
| Thickness mm | Exterior Wall | Roof | PED/m2 | GWP/m2 | ||
|---|---|---|---|---|---|---|
| U-Value W/(m2·K) | Improvement | U-Value W/(m2·K) | Improvement | |||
| 10 | 0.53 | 24.61% | 1.91 | N/A | 2.86 | 5.522 |
| 20 | 0.47 | 33.21% | 1.30 | N/A | 5.72 | 11.044 |
| 40 | 0.38 | 45.61% | 0.80 | N/A | 11.44 | 22.088 |
| 60 | 0.32 | 54.13% | 0.57 | N/A | 17.16 | 33.132 |
| 80 | 0.28 | 60.34% | 0.45 | 0.40% | 22.88 | 44.176 |
| 100 | 0.24 | 65.07% | 0.37 | 18.27% | 28.6 | 55.22 |
| 120 | 0.22 | 68.79% | 0.31 | 30.70% | 34.32 | 66.264 |
| 140 | 0.20 | 71.80% | 0.27 | 39.85% | 40.04 | 77.308 |
| 160 | 0.18 | 74.28% | 0.24 | 46.87% | 45.76 | 88.352 |
| 180 | 0.17 | 76.35% | 0.21 | 52.42% | 51.48 | 99.396 |
| 200 | 0.15 | 78.12% | 0.19 | 56.92% | 57.2 | 110.44 |
Table 20.
Thermal performance and costs of a rock wool exterior wall and roof.
| Thickness mm | Exterior Wall | Roof | RMB/m2 | ||
|---|---|---|---|---|---|
| U-Value W/(m2·k) | Improvement | U-Value W/(m2·k) | Improvement | ||
| 10 | 0.53 | 24.61% | 1.91 | N/A | 2.86 |
| 20 | 0.47 | 33.21% | 1.30 | N/A | 5.72 |
| 40 | 0.38 | 45.61% | 0.80 | N/A | 11.44 |
| 60 | 0.32 | 54.13% | 0.57 | N/A | 17.16 |
| 80 | 0.28 | 60.34% | 0.45 | 0.40% | 22.88 |
| 100 | 0.24 | 65.07% | 0.37 | 18.27% | 28.6 |
| 120 | 0.22 | 68.79% | 0.31 | 30.70% | 34.32 |
| 140 | 0.20 | 71.80% | 0.27 | 39.85% | 40.04 |
| 160 | 0.18 | 74.28% | 0.24 | 46.87% | 45.76 |
| 180 | 0.17 | 76.35% | 0.21 | 52.42% | 51.48 |
| 200 | 0.15 | 78.12% | 0.19 | 56.92% | 57.2 |
Table 21.
External wall insulation of residential buildings in a cold area.
| Material | Index | Improvement | |||||||
|---|---|---|---|---|---|---|---|---|---|
| 5% | 10% | 20% | 30% | 40% | 50% | 60% | 70% | ||
| Rock wool | Thickness (mm) | 10 | 10 | 10 | 20 | 40 | 60 | 80 | 140 |
| PED/m2 | 2.86 | 2.86 | 2.86 | 5.72 | 11.44 | 17.16 | 22.88 | 40.04 | |
| GWP/m2 | 5.52 | 5.52 | 5.52 | 11.04 | 22.09 | 33.13 | 44.18 | 77.31 | |
| RMB/m2 | 3.02 | 3.02 | 3.02 | 6.03 | 12.06 | 18.10 | 24.13 | 42.22 | |
| PU | Thickness (mm) | 10 | 10 | 10 | 10 | 20 | 40 | 60 | 80 |
| PED/m2 | 2.36 | 2.36 | 2.36 | 2.36 | 4.72 | 9.44 | 14.15 | 18.87 | |
| GWP/m2 | 4.03 | 4.03 | 4.03 | 4.03 | 8.05 | 16.10 | 24.15 | 32.20 | |
| RMB/m2 | 6.80 | 6.80 | 6.80 | 6.80 | 13.60 | 27.20 | 40.80 | 54.40 | |
| EPS | Thickness (mm) | 10 | 10 | 10 | 20 | 40 | 60 | 80 | 120 |
| PED/m2 | 1.69 | 1.69 | 1.69 | 3.38 | 6.77 | 10.15 | 13.54 | 20.30 | |
| GWP/m2 | 2.42 | 2.42 | 2.42 | 4.84 | 9.68 | 14.52 | 19.36 | 29.04 | |
| RMB/m2 | 3.48 | 3.48 | 3.48 | 6.96 | 13.92 | 20.88 | 27.84 | 41.76 | |
| XPS | Thickness (mm) | 10 | 10 | 10 | 20 | 40 | 40 | 60 | 100 |
| PED/m2 | 2.96 | 2.96 | 2.96 | 5.92 | 11.84 | 11.84 | 17.77 | 29.61 | |
| GWP/m2 | 4.24 | 4.24 | 4.24 | 8.47 | 16.94 | 16.94 | 25.41 | 42.35 | |
| RMB/m2 | 5.01 | 5.01 | 5.01 | 10.02 | 20.04 | 20.04 | 30.06 | 50.10 | |
Table 22.
Roof insulation of residential buildings in a cold area.
| Material | Index | Improvement | |||||||
|---|---|---|---|---|---|---|---|---|---|
| 5% | 10% | 20% | 30% | 40% | 50% | 60% | 70% | ||
| Rock wool | Thickness (mm) | 100 | 100 | 120 | 140 | 160 | 180 | 220 | 300 |
| PED/m2 | 28.60 | 28.60 | 34.32 | 40.04 | 45.76 | 51.48 | 62.92 | 85.80 | |
| GWP/m2 | 55.22 | 55.22 | 66.26 | 77.31 | 88.35 | 99.40 | 121.48 | 165.66 | |
| RMB/m2 | 30.16 | 30.16 | 36.19 | 42.22 | 48.26 | 54.29 | 66.35 | 90.48 | |
| PU | Thickness (mm) | 60 | 60 | 60 | 80 | 100 | 100 | 140 | 180 |
| PED/m2 | 14.15 | 14.15 | 14.15 | 18.87 | 23.59 | 23.59 | 33.03 | 42.46 | |
| GWP/m2 | 24.15 | 24.15 | 24.15 | 32.20 | 40.25 | 40.25 | 56.35 | 72.45 | |
| RMB/m2 | 40.80 | 40.80 | 40.80 | 54.40 | 68.00 | 68.00 | 95.20 | 122.40 | |
| EPS | Thickness (mm) | 80 | 80 | 100 | 100 | 120 | 140 | 180 | 240 |
| PED/m2 | 13.54 | 13.54 | 16.92 | 16.92 | 20.30 | 23.69 | 30.46 | 40.61 | |
| GWP/m2 | 19.36 | 19.36 | 24.20 | 24.20 | 29.04 | 33.88 | 43.56 | 58.08 | |
| RMB/m2 | 27.84 | 27.84 | 34.80 | 34.80 | 41.76 | 48.72 | 62.64 | 83.52 | |
| XPS | Thickness (mm) | 80 | 80 | 80 | 100 | 120 | 140 | 160 | 220 |
| PED/m2 | 23.69 | 23.69 | 23.69 | 29.61 | 35.53 | 41.45 | 47.38 | 65.14 | |
| GWP/m2 | 33.88 | 33.88 | 33.88 | 42.35 | 50.82 | 59.29 | 67.76 | 93.17 | |
| RMB/m2 | 40.08 | 40.08 | 40.08 | 50.10 | 60.12 | 70.14 | 80.16 | 110.22 | |
Table 23.
External window of residential buildings in a cold area.
| Improvement | Frame | Glass | PED | GWP | RMB/m2 |
|---|---|---|---|---|---|
| 5% | PVC | 5 + 12Ar + 5 | 4.51 | 9.88 | 359 |
| 10% | Heat broke aluminum | 5low-e + 6A + 5 | 6.73 | 15.25 | 450 |
| 20% | Heat broke aluminum | 5low-e + 8A + 5 | 6.73 | 15.25 | 474 |
| 30% | Heat broke aluminum | 5low-e + 12A + 5 | 6.73 | 15.25 | 568 |
| 40% | Heat broke aluminum | 5low-e + 13Ar + 5 | 6.73 | 15.25 | 650 |
| 50% | PVC | 5low-e + 12A + 5 + 12A + 5 | 5.31 | 11.7 | 483 |
| 60% | PVC | 5low-e + 13Ar + 5 + 13Ar + 5 | 5.31 | 11.7 | 540 |
Table 24.
Roof insulation of public buildings in a cold area.
| Material | Index | Improvement | |||||||
|---|---|---|---|---|---|---|---|---|---|
| 5% | 10% | 20% | 30% | 40% | 50% | 60% | 70% | ||
| Rock wool | Thickness (mm) | 40 | 40 | 60 | 80 | 100 | 120 | 180 | 240 |
| PED/m2 | 11.44 | 11.44 | 17.16 | 22.88 | 28.60 | 34.32 | 51.48 | 68.64 | |
| GWP/m2 | 22.09 | 22.09 | 33.13 | 44.18 | 55.22 | 66.26 | 99.40 | 132.53 | |
| RMB/m2 | 12.06 | 12.06 | 18.10 | 24.13 | 30.16 | 36.19 | 54.29 | 72.38 | |
| PU | Thickness (mm) | 20 | 20 | 20 | 40 | 60 | 80 | 100 | 140 |
| PED/m2 | 4.72 | 4.72 | 4.72 | 9.44 | 14.15 | 18.87 | 23.59 | 33.03 | |
| GWP/m2 | 8.05 | 8.05 | 8.05 | 16.10 | 24.15 | 32.20 | 40.25 | 56.35 | |
| RMB/m2 | 13.60 | 13.60 | 13.60 | 27.20 | 40.80 | 54.40 | 68.00 | 95.20 | |
| EPS | Thickness (mm) | 40 | 40 | 40 | 60 | 80 | 100 | 140 | 200 |
| PED/m2 | 6.77 | 6.77 | 6.77 | 10.15 | 13.54 | 16.92 | 23.69 | 33.84 | |
| GWP/m2 | 9.68 | 9.68 | 9.68 | 14.52 | 19.36 | 24.20 | 33.88 | 48.40 | |
| RMB/m2 | 13.92 | 13.92 | 13.92 | 20.88 | 27.84 | 34.80 | 48.72 | 69.60 | |
| XPS | Thickness (mm) | 30 | 40 | 40 | 60 | 80 | 100 | 120 | 180 |
| PED/m2 | 8.88 | 11.84 | 11.84 | 17.77 | 23.69 | 29.61 | 35.53 | 53.30 | |
| GWP/m2 | 12.71 | 16.94 | 16.94 | 25.41 | 33.88 | 42.35 | 50.82 | 76.23 | |
| RMB/m2 | 15.03 | 20.04 | 20.04 | 30.06 | 40.08 | 50.10 | 60.12 | 90.18 | |
Table 25.
External window of public buildings in a cold area.
| Material | Index | Improvement | |||||||
|---|---|---|---|---|---|---|---|---|---|
| 5% | 10% | 20% | 30% | 40% | 50% | 60% | 70% | ||
| Rock wool | Thickness (mm) | 100 | 120 | 120 | 140 | 160 | 200 | 260 | 330 |
| PED/m2 | 28.60 | 34.32 | 34.32 | 40.04 | 45.76 | 57.20 | 74.36 | 94.38 | |
| GWP/m2 | 55.22 | 66.26 | 66.26 | 77.31 | 88.35 | 110.44 | 143.57 | 182.23 | |
| RMB/m2 | 30.16 | 36.19 | 36.19 | 42.22 | 48.26 | 60.32 | 78.42 | 99.53 | |
| PU | Thickness (mm) | 60 | 60 | 80 | 80 | 100 | 120 | 160 | 200 |
| PED/m2 | 14.15 | 14.15 | 18.87 | 18.87 | 23.59 | 28.31 | 37.74 | 47.18 | |
| GWP/m2 | 24.15 | 24.15 | 32.20 | 32.20 | 40.25 | 48.30 | 64.40 | 80.50 | |
| RMB/m2 | 40.80 | 40.80 | 54.40 | 54.40 | 68.00 | 81.60 | 108.80 | 136.00 | |
| EPS | Thickness (mm) | 80 | 100 | 100 | 120 | 140 | 160 | 200 | 280 |
| PED/m2 | 13.54 | 16.92 | 16.92 | 20.30 | 23.69 | 27.07 | 33.84 | 47.38 | |
| GWP/m2 | 19.36 | 24.20 | 24.20 | 29.04 | 33.88 | 38.72 | 48.40 | 67.76 | |
| RMB/m2 | 27.84 | 34.80 | 34.80 | 41.76 | 48.72 | 55.68 | 69.60 | 97.44 | |
| XPS | Thickness (mm) | 80 | 80 | 100 | 100 | 120 | 160 | 180 | 260 |
| PED/m2 | 23.69 | 23.69 | 29.61 | 29.61 | 35.53 | 47.38 | 53.30 | 76.99 | |
| GWP/m2 | 33.88 | 33.88 | 42.35 | 42.35 | 50.82 | 67.76 | 76.23 | 110.11 | |
| RMB/m2 | 40.08 | 40.08 | 50.10 | 50.10 | 60.12 | 80.16 | 90.18 | 130.26 | |
Table 26.
External window of public buildings in a cold area.
| Improvement | Frame | Glass | PED | GWP | RMB/m2 |
|---|---|---|---|---|---|
| 5% | Heat broke aluminum | 5low-e + 12A + 5 | 6.73 | 15.25 | 568 |
| 10% | Heat broke aluminum | 5low-e + 13Ar + 5 | 6.73 | 15.25 | 650 |
| 20% | Heat broke aluminum | 5low-e + 13Ar + 5 | 6.73 | 15.25 | 650 |
| 30% | PVC | 5low-e + 12A + 5 + 12A + 5 | 5.31 | 11.7 | 483 |
| 40% | PVC | 5low-e + 10Ar + 5 + 8Ar + 5 | 5.31 | 11.7 | 495 |
Table 27.
Heat consumption of green buildings in a cold area.
| Project | Floor Area m2 | Heat Consumption GJ/a | Heat Consumption Per Unit Area GJ/m2·a | Constraint Value GJ/m2·a | Bootstrap Value GJ/m2·a |
|---|---|---|---|---|---|
| 1 | 10,723 | 1922.3 | 0.18 | 0.25 | 0.2 |
| 2 | 129,928 | 41,281.9 | 0.13 | 0.25 | 0.2 |
| 3 | 6628.1 | 1139.6 | 0.17 | 0.23 | 0.15 |
| 4 | 10,762 | 1838.0 | 0.17 | 0.25 | 0.2 |
| 5 | 14,700 | 788.9 | 0.05 | 0.25 | 0.2 |
| 6 | 8091 | 736.5 | 0.09 | 0.25 | 0.2 |
| 7 | 24,648 | 4616.4 | 0.19 | 0.25 | 0.2 |
| 8 | 20,861 | 1766.7 | 0.08 | 0.21 | 0.14 |
| 9 | 16,724 | 1416.4 | 0.08 | 0.21 | 0.14 |
| 10 | 3283.8 | 599.3 | 0.18 | 0.21 | 0.14 |
Table 28.
Improvement of the thermal performance in practical projects.
| Project | U-Value of External Wall W/(m2·K) | U-Value of Roof W/(m2·K) | U-Value of External Window W/(m2·K) | Heat Consumption Per Unit Area GJ/m2·a | ||||||
|---|---|---|---|---|---|---|---|---|---|---|
| Design | Limit | Improvement | Design | Limit | Improvement | Design | Limit | Improvement | ||
| 1 | 0.4 | 0.6 | 33.33% | 0.41 | 0.55 | 25.45% | 2.2 | 2.7 | 18.52% | 0.18 |
| 2 | 0.5 | 0.6 | 16.67% | 0.35 | 0.55 | 36.36% | 2 | 2.7 | 25.93% | 0.13 |
| 3 | 0.43 | 0.6 | 28.33% | 0.39 | 0.5 | 22.00% | 2.8 | 2.8 | 0.00% | 0.17 |
| 4 | 0.44 | 0.6 | 26.67% | 0.15 | 0.55 | 72.73% | 2.5 | 2.7 | 7.41% | 0.17 |
| 5 | 0.461 | 0.6 | 23.17% | 0.418 | 0.55 | 24.00% | 2 | 2.3 | 13.04% | 0.05 |
| 6 | 0.18 | 0.6 | 70.00% | 0.14 | 0.55 | 74.55% | 1.1 | 2.4 | 54.17% | 0.09 |
| 7 | 0.51 | 0.6 | 15.00% | 0.49 | 0.55 | 10.91% | 2.7 | 2.7 | 0.00% | 0.19 |
| 8 | 0.34 | 0.6 | 43.33% | 0.42 | 0.55 | 23.64% | 2 | 2.3 | 13.04% | 0.08 |
| 9 | 0.42 | 0.7 | 40.00% | 0.27 | 0.45 | 40.00% | 2 | 2.3 | 13.04% | 0.08 |
| 10 | 0.31 | 0.63 | 50.79% | 0.49 | 0.55 | 10.91% | 2.7 | 2.8 | 3.57% | 0.18 |
Table 29.
Basic information of typical projects.
| Type | U-Value W/m2·K | Heat Consumption kWh/a | Envelope Area m2 | ||
|---|---|---|---|---|---|
| External Window | External Wall | Roof | |||
| Public building | 2.2 | 0.4 | 0.41 | 522,327.1 | 7081.5 |
| Residential building | 2.7 | 0.31 | 0.49 | 174,024.8 | 21,084.2 |
Table 30.
Modified calculation results.
| Project | Error | ||
|---|---|---|---|
| 1 | 0.9 | 0.80 | −11.2% |
| 2 | 1.15 | 1.26 | 9.4% |
| 3 | 0.71 | 0.63 | −11.4% |
| 4 | 0.43 | 0.37 | −13.2% |
| 5 | 0.50 | 0.56 | 11.4% |
| 6 | 0.62 | 0.58 | −7.2% |
| 7 | 1.01 | 0.93 | −7.5% |
| 8 | 0.45 | 0.43 | −3.6% |
| 9 | 0.5 | 0.43 | −13.3% |
| 10 | 0.1 | 0.28 | 184.0% |
Table 31.
Comprehensive score table of a rock wool insulation exterior wall.
| Thickness mm | Weight Value of Index | Score Z | |||
|---|---|---|---|---|---|
| 0.5 | 0.125 | 0.125 | 0.25 | ||
| 10 | 0.00 | 1 | 1 | 1 | 0.50 |
| 20 | 0.098 | 0.947 | 0.947 | 0.947 | 0.523 |
| 40 | 0.278 | 0.842 | 0.842 | 0.842 | 0.560 |
| 60 | 0.439 | 0.737 | 0.737 | 0.737 | 0.588 |
| 80 | 0.579 | 0.632 | 0.632 | 0.632 | 0.605 |
| 100 | 0.699 | 0.526 | 0.526 | 0.526 | 0.613 |
| 120 | 0.800 | 0.421 | 0.421 | 0.421 | 0.610 |
| 140 | 0.880 | 0.316 | 0.316 | 0.316 | 0.598 |
| 160 | 0.940 | 0.211 | 0.211 | 0.211 | 0.575 |
| 180 | 0.980 | 0.105 | 0.105 | 0.105 | 0.543 |
| 200 | 1 | 0 | 0 | 0 | 0.50 |
Table 32.
Comprehensive score table of a rock wool insulation roof.
| Thickness mm | Weight Value of Index | Score Z | |||
|---|---|---|---|---|---|
| 0.5 | 0.125 | 0.125 | 0.25 | ||
| 10 | 0 | 1 | 1 | 1 | 0.500 |
| 20 | 0.354 | 0.947 | 0.947 | 0.947 | 0.651 |
| 40 | 0.649 | 0.842 | 0.842 | 0.842 | 0.745 |
| 60 | 0.779 | 0.737 | 0.737 | 0.737 | 0.758 |
| 80 | 0.852 | 0.632 | 0.632 | 0.632 | 0.742 |
| 100 | 0.899 | 0.526 | 0.526 | 0.526 | 0.712 |
| 120 | 0.931 | 0.421 | 0.421 | 0.421 | 0.676 |
| 140 | 0.955 | 0.316 | 0.316 | 0.316 | 0.636 |
| 160 | 0.974 | 0.211 | 0.211 | 0.211 | 0.592 |
| 180 | 0.988 | 0.105 | 0.105 | 0.105 | 0.547 |
| 200 | 1 | 0 | 0 | 0 | 0.500 |
Table 33.
Multi-index evaluation results of a residential building envelope in a cold area.
| Type | Rock Wool | PU | EPS | XPS |
|---|---|---|---|---|
| Exterior wall | 0.56 (40 mm) | 0.579 (20 mm) | 0.598 (30 mm) | 0.604 (30 mm) |
| Roof | 0.712 (100 mm) | 0.776 (60 mm) | 0.747 (80 mm) | 0.750 (80 mm) |
| Exterior window | Heat broke aluminum frame (5low-e + 13Ar + 5) | |||
© 2020 by the authors. Licensee MDPI, Basel, Switzerland. This article is an open access article distributed under the terms and conditions of the Creative Commons Attribution (CC BY) license (http://creativecommons.org/licenses/by/4.0/).
Share and Cite
MDPI and ACS Style
Lu, S.; Wang, Z.; Zhang, T. Quantitative Analysis and Multi-Index Evaluation of the Green Building Envelope Performance in the Cold Area of China. Sustainability 2020, 12, 437. https://0-doi-org.brum.beds.ac.uk/10.3390/su12010437
AMA Style
Lu S, Wang Z, Zhang T. Quantitative Analysis and Multi-Index Evaluation of the Green Building Envelope Performance in the Cold Area of China. Sustainability. 2020; 12(1):437. https://0-doi-org.brum.beds.ac.uk/10.3390/su12010437
Chicago/Turabian StyleLu, Shilei, Zichen Wang, and Tianshuai Zhang. 2020. "Quantitative Analysis and Multi-Index Evaluation of the Green Building Envelope Performance in the Cold Area of China" Sustainability 12, no. 1: 437. https://0-doi-org.brum.beds.ac.uk/10.3390/su12010437
Note that from the first issue of 2016, this journal uses article numbers instead of page numbers. See further details here.