1. Introduction
The rising upsurge in the use of cellphones has paved the way for the ‘mobile revolution’ whereby smartphones hold a center point in a consumer’s life as they spend significant time using them. This proximity with smartphones supersedes time spent and relations with all other portable electronic devices. Consumers fear that smartphones have become indispensable as they are constantly hooked to their gadgets not only for online activities but also for monitoring and controlling a plethora of their daily activities. As per the statistics shared by Deloitte in the Global Mobile Consumer Survey, the US edition [
1], mobile phone penetration in the US alone is 85% among the baby boomers and about 90% among the millennial. The proliferated use of smartphones poses new challenges for higher education institutes along with the detrimental effects these devices have on the overall academic performance of university students [
2]. Moreover, this 24/7 ‘online connectivity’ phenomenon is increasingly becoming a source of distraction and distress among the younger population as lower exam scores were found, which was correlated to the excessive use of portable devices such as cell phones [
3,
4].
Smartphones have become a popular medium of social as well as academic connection. Proponents of smartphone usage in higher education institutes assert that students communicate with each other through their cellphones to exchange notes, lectures, and assignments and for productive academic discussions [
5]. Prolific literature is available that empirically proves the negative impact of excessive smartphone usage on student academic performance in universities such as Mendoza et al. [
6], Giunchiglia et al. [
7], Duke and Montag [
8], Yang et al. [
9], Nayak [
10], and Ali et al. [
11]. According to Han and Yi [
4], Kibona and Mgaya [
12], and Froese et al. [
13], the high level of addiction to the smartphone negatively influences the student’s academic performance. Thus, this level of addiction causes several concerns on whether the usage of smartphone elevates or deteriorates student academic performance. Several research studies have been carried out on new digital technologies and smartphone applications that enhance the effectiveness of the overall learning prospects of higher education institutions. These research studies demonstrate that smartphone applications and digital technologies have enhanced the teaching and learning capabilities of teachers and students [
14,
15,
16,
17,
18]. On the other hand, several studies have advocated the positive influence of smartphone applications and new technologies on the academic performance of university students [
19,
20,
21,
22,
23,
24,
25,
26]. Thus, there is no conclusive evidence that the smartphone has really increased or decreased student academic performance, therefore, there is a dire need to reexamine the impact of the smartphone on the academic performance of university students. Hence, the undertaken study was carried out to investigate university students’ academic performance with the maximum functions of a smartphone.
Hence, keeping the view of these effects of the smartphone on the daily lives of university students, this study is an attempt to ascertain an association amid students’ academic performance in universities, and smartphone usage among university students in Pakistan. The significance of the undertaken study lies in several factors. Through empirical evidence, the authors investigate the functions of a smartphone as exogenous predictors such as smartphone applications, multimedia messaging service (MMS), and short message service (SMS), warp-speed processing, and entertainment on academic performance of a student. At the same time, this paper also addresses the impact of electronic word of mouth (eWOM) and attitude as mediating variables between exogenous and endogenous variables in a relationship between functions of a smartphone and student academic performance. The study also evaluates the impact of technology and addiction as a moderator between the functions of smartphone and student performance. We used the SEM-based multivariate approach in which we employed exploratory factor analysis, confirmatory factor analysis, and conditional process modeling. Thus, this kind of detailed study is carried out for the first time in Pakistan regarding smartphone usage amongst university students which provides new dimensions to future researchers, parents, teachers, smartphone marketers, and policymakers to comprehend the real issues and come up with corrective strategies to channelize the best use of a smartphone.
The rest of the paper is organized as follows.
Section 2 discusses the relevant previous literature,
Section 3 elaborates the Material and Methods,
Section 4 contains results and findings of the undertaken study,
Section 5 deals with the discussion, and
Section 6 comprises the conclusion followed by the theoretical and managerial implication of the undertaken study.
2. Review of Previous Literature
Mendoza et al. [
6] conducted an interesting experiment where participants were divided into two groups and attended a short lecture under different cellphone conditions (with/without smartphones). In this paper, the authors suggested that excessive use of smartphones is a cause of distraction and hampers learning during classroom lectures. The groups that were allowed to keep their smartphones kept on receiving distracting messages. Their attention span was much shorter as compared to the group without access to smartphones. The findings of the study establish the causality between technology and learning and also suggest that the academic performance of students can be made more effective by limiting the use of technology during class lectures.
Giunchiglia et al. [
7] monitored the students’ time, which was spent on social media using their smartphones and its effect on student academic performance in universities. The respondents were encouraged to maintain a logbook to keep track of their interaction with smartphones and the usage of social media. The finding of the study suggested that excessive use of smartphones led to ‘addictiveness’ that negatively influenced student academic performance in universities. In a similar research study, Duke and Montag [
8] studied the impact of smartphone addiction in the context of overall smartness, wellbeing, and productivity of the millennial. They established a link between the work-related usage of smartphones and self-rated productivity. It was found that too much use of smartphones causes ‘techno stress’ which impacts mental health and ultimately leads to declined work-related performance.
Yang et al. [
9] explored the ‘problematic use of smartphones’ (PSU) among university students in China. The authors studied the association amid PSU, academic procrastination, and academic anxiety. The findings of the study proposed an affirmative relation amid PSU, academic anxiety, and deferment. The authors also suggested that students could control the excessive use of smartphones through exercising self-regulation. Nayak [
10] studied the influence of smartphones on student academic performance in universities of India. The author focused on gender differences and found that although female students used more smartphones as compared to their male counterparts, the males neglected their work, felt anxious, and had less self-control due to smartphone addiction and consequently fared poorly in their studies as compared to female students.
According to Jacobsen and Forste [
27], smartphone usage created the negative impact of texting and calling on a self-reported Grade Point Average (GPA) for university students’ academic performance in the case of the United States. On the contrary, Hong et al. [
28] concluded the positive association between calling and texting on academic performance in perspective of Taiwan’s female university students. In the same vein, Lepp et al. [
29] demonstrated that students who use fewer smartphones show better academic performance than those who use more smartphones. Similarly, Wood et al. [
30], Rosen et al. [
31], Kirschner and Karpinski [
32], Karpinski et al. [
33], and Junco [
34] demonstrated the negative association amid the use of a smartphone and student academic performance in universities. Several research studies have been carried out on new digital technologies and smartphone applications that enhance the effectiveness of the overall learning prospects of higher education institutions. These research studies demonstrate that smartphone applications and digital technologies have enhanced the teaching and learning capabilities of teachers and students [
14,
15,
16,
17,
18].
García-Martínez et al. [
14] took a detailed systemic review of 16 research studies, which were published in the Web of Science and Scopus journals. They reviewed these papers and concluded that in general, smartphone applications have a positive influence on the learning capacities of university students. Similarly, several research studies have advocated the positive influence of smartphone applications and new technologies on the academic performance of university students [
19,
20,
21,
22,
23,
24,
25,
26]. However, few research studies have concluded a negative influence of smartphone usage that hampers the academic performance of university students such as Ali et al. [
11], Mendoza et al. [
6], Giunchiglia et al. [
7], Duke and Montag [
8], Yang et al. [
9], and Nayak [
10]. According to Han and Yi [
4], Kibona and Mgaya [
12], and Froese et al. [
13], the high level of addiction to the smartphone negatively influences student academic performance.
Thus, based on the previous literature, it is occluded that there are inconclusive results regarding smartphone use and student academic performance in universities, therefore, there is a strong need to investigate this relationship with more variables and with greater scope. Hence, keeping a view of these effects of the smartphone on student academic performance in universities, this study is an attempt to ascertain an association between student academic performance in universities and smartphone usage in Pakistan. According to Ahmed et al. [
35], recent statistics exhibited that 60% of the Pakistani population comprises of youth who are heavy users of smartphones, henceforth this study primarily focuses on university students. In this scenario, the importance of the undertaken study has more practical implications in the perspective of student academic performance in Pakistani universities.
2.1. Conceptual Framework and Hypotheses Formation
2.1.1. Direct Hypothesized Relationship
A framework of relationship is developed to understand the direct hypothesized relationship between the exogenous variables such as multimedia messaging service (MMS), short message service (SMS), mobile applications, warp-speed processing (WSP), and entertainment on student academic performance in universities.
2.1.2. Indirect Hypothesized Relationship (Mediation)
The current study takes into account the impact of electronic word of mouth (eWOM) and attitude as mediating variables between exogenous and endogenous variables.
2.1.3. Hypothesized Moderating Relationship
The current study incorporated technology and addiction as moderating variables between independent variables and outcome variable to measure the influence of moderating variables.
Technology as a Moderator
Advancement in technology has increased the usage of smartphones by students and the general public [
35]. According to Chen and Chang [
90], and Saroha and Diwan [
91], smartphone functions are experiencing drastic and swift remodeling due to the encompassing influence of telecommunication and information technologies. Drastic and swift access to data and information processing has made the smartphone more useful and advanced. Thus, this swiftness of technology has compelled organizations to adopt new and digital means of communication around the globe [
92,
93,
94,
95]. Millennials are part of the digital generation where technology is deeply infused in their daily life and helps them in multitasking [
34,
35]. In a previous study, it was reported that research and development (R&D) and knowledge technologies affirmatively impact student grades and intention to complete the task [
96]. The proponents of using a smartphone in academic learning argue that information and communication technologies (ICT) fosters students’ overall performance, however, as argued by Aljomaa et al. [
97], the impact of smartphone use and student academic performance in universities depends on how technology is introduced and handled. Several other studies also substantiated that technology is a potent moderator in the advancement and delivery system that is important for the functions of the latest smartphone tools [
35,
61,
98]. It is therefore hypothesized that:
Hypothesis 8A. Technology is a significant moderator between multimedia messaging service (MMS) and students’ academic performance.
Hypothesis 8B. Technology is a significant moderator between short message service (SMS) and students’ academic performance.
Hypothesis 8C. Technology is a significant moderator between mobile applications and students’ academic performance.
Hypothesis 8D. Technology is a significant moderator between warp-speed processing (WSP) and students’ academic performance.
Hypothesis 8E. Technology is a significant moderator between entertainment and students’ academic performance.
Addiction as a Moderator
Although not officially diagnosed as a clinical disorder, neither its direct impact is known but a smartphone is considered to be addictive as it can interfere in our daily lives [
99,
100]. The authors concluded a moderating role amid smartphone addiction, smartphone interruption, and work-related productivity. Similarly, it was found that excessive use of smartphones during studies leads to the addictive tendency among students that subconsciously negatively impacts their academic performance, daily activities, social relationships, and overall physical and mental wellbeing [
10,
101]. Another study was conducted on the compulsive use of smartphones and it was demonstrated that addiction to smartphones increases mental stress and reduces concentration among students [
102,
103,
104]. Smartphone addiction plays a moderating role in the association of smartphone functions, and student academic performance in universities [
12,
105,
106]. It is therefore hypothesized that:
Hypothesis 9A. Addiction is a significant moderator between multimedia messaging service (MMS) and students’ academic performance.
Hypothesis 9B. Addiction is a significant moderator between short message service (SMS) and students’ academic performance.
Hypothesis 9C. Addiction is a significant moderator between mobile applications and students’ academic performance.
Hypothesis 9D. Addiction is a significant moderator between warp-speed processing (WSP) and students’ academic performance.
Hypothesis 9E. Addiction is a significant moderator between entertainment and students’ academic performance.
2.2. Conceptual Model of the Research Study
Figure 1 is the depiction of the conceptual framework of the undertaken study in which we showed the impact of smartphone function on the academic performance of students. Moreover, we have also shown the influence of mediating variables and moderating variables between exogenous and endogenous variables.
3. Material and Methods
3.1. Research Design and Selection of Measurement Scales
The research design of the undertaken study is quantitative and cross-sectional, and data was collected through a modified structured questionnaire. The items of considered variables were adapted from Han and Yi [
4], Ahmed et al. [
35,
106], Chen and Chang [
90], Mathwick et al. [
39], Çizmeci and Ercan [
42], Kumar [
54], Goldenberg et al. [
84], Zhang and Mao [
88], and Saroha and Diwan [
91], etc. We used a five-point Likert scale, and responses were collected from ten universities of Karachi, the respondents were enrolled in undergraduate, graduate, postgraduate, and professional degree programs.
3.2. Sampling Strategy and Sample Size
We employed a non-probability sampling technique i.e., the purposive technique for collecting the sample data from the selected respondents. We selected those respondents who were using smartphones, and they were well aware of the functionalities of smartphones. Initially, 800 questionnaires were floated to the respondents in which 784 responses were found corrected and completed. However, 16 responses were found incorrect or incomplete.
3.3. Statistical Techniques for Estimation
For the analysis purposes, we employed several statistical techniques including exploratory factor analysis (EFA) for the reduction and validation of the considered variables and items; we also used component factor analysis. Descriptive analysis for the basic characteristics of the constructs, further, in EFA we employed total variance extracted, Kaiser–Meyer–Olkin (KMO) and Bartlett’s techniques for the suitability, adequacy, and retention of the data [
12,
106,
107]. In our analysis, we also employed a confirmatory factor analysis (CFA) for the analysis of reliabilities and validities. Finally, we used the conditional process modeling for the analysis of direct and indirect (mediation and moderation) relationships between the variables [
108,
109,
110]. Further elaboration and analysis of these techniques are provided in the next estimation section.
3.4. Profile of Respondents
Researchers included a sample of 784 respondents, however, the questionnaire was forwarded to 800 respondents, thus the response rate is 98.00%, and according to Hair et al. [
111], that is considered very good.
Table 1 demonstrates the detailed demographic profile of respondents.
4. Results
For the results and estimation, researchers employed descriptive analysis, exploratory and confirmatory factor analysis to confirm the hypothesized measured and structured models. Moreover, researchers employed conditional process analysis to ascertain hypothesized mediation, moderation, and direct association between the factors.
4.1. Descriptive Statistics
The confirmation of data normality is paramount for SEM modeling, thus, researchers employed descriptive analysis that consists of skewness, standard deviation, mean, and kurtosis [
112]. For this purpose, researchers converted all the values into z-score, and then employed the descriptive analysis, which demonstrates that Kurtosis value ranges from −3 to +3, however, the values of standard deviation and skewness lie between −1.5 to +1.5 (
Table 2) which confirmed the normality of the sample data [
113].
4.2. Reliabilities and Validities
Table 3 demonstrated composite reliabilities and Cronbach’s alpha for seven factors, which showed every factor has a value greater than 0.80, which is well above the threshold value (>0.60) as suggested by Hair et al. [
111]. Outcomes of
Table 3 further demonstrated that all the items have factor loadings ranging between 0.70–0.90, which fulfills the criterion of discriminant validities of all the constructs [
12]. For all the individual constructs, the average variance explained falls greater than 0.60, which fulfills the convergent validities of considered items and factors [
114,
115].
4.3. Exploratory Factor Analysis—EFA
Researchers employed the EFA technique to ascertain the fitness and reduction of sample data through the validation process [
115,
116]. The rotated component matrix was extracted through principal component analysis, which also authenticated the validation of items and factors of the sample data. The undertaken research consists of ten variables and 30 items in which performance of students (POS), multimedia message service (SMS), short message service (SMS), mobile applications (MAP), warp-speed processing (WSP), entertainment (ENT), electronic word of mouth (eWOM), attitude (ATT), technology (TEC), and addiction (ADD) have three constructs each.
Table 4 exhibited that the factor loading of each item is more than 0.50, which confirmed and validated all items and factors, which researchers loaded for the undertaken study [
106,
110,
117].
4.4. Kaiser Meyer Olkin (KMO) and Bartlett’s Techniques
Researchers examined the appropriateness and fitness of ample data through Kaiser Meyer Olkin (KMO) analysis and Bartlett’s Sphericity test.
Table 5 exhibited that the KMO value is 0.811, which is equitably excellent since the values ranging from 0.70–0.79 are considered to be good, and ranging from 0.80–0.99 are considered excellent [
12,
117].
Table 4 also demonstrated the results of Bartlett’s Sphericity test, which showed probability is less than 0.50, i.e., 0.000, which indicated the correlation between items is cogent and adequate at a 5% significance level.
4.5. Total Variance Explained
The cumulative percentage of variance for thirteen factors demonstrated the dispersion of the variance of these potential factors; the total value of Eigen is greater than 1, which further established the amount of variance amongst prospective factors. The cumulative variance is 87.47%, which is considered to be very good since the minimum threshold value is 50% as shown in
Table 6. Hence, based on total eigenvalue and cumulative variance, it is concluded that the data sample is considered reliable, and an SEM-based multivariate approach can be employed [
12,
109].
4.6. Anti-Image Correlation Matrix (AICM)
The outcomes of
Table 7 exhibited that the diagonal of the anti-image correlation matrix (AICM) is greater than the values of 0.50, thus it is further concluded that our considered variables are suitable for the undertaken study and we can proceed for further analysis.
4.7. Confirmatory Factor Analysis—CFA
According to Hair et al. [
111], the CFA is an appropriate and direct approach to check the measurement model, moreover, the CFA analysis examines whether data fit a hypothesized measurement model. In the considered measured model, researchers confirm the factors of the smartphone such as multimedia message service, short message service, mobile applications, warp-speed processing, entertainment, whereas, technology and addiction as moderating variables, and electronic word of mouth and attitude as mediating factors, and students’ academic performance in universities as outcome variable. Researchers have incorporated thirty items of all ten factors into the confirmatory factor analysis, and fixing the sample data between unobserved and observed [
12,
113]. The outcomes of
Table 5 demonstrated the considered hypothesized measured model is adequate because the fit indices are within the threshold limits such as RMSEA: 0.032, GFI: 0.96, CFI: 0.97, NFI: 0.931, IFI: 0.961, PNFI: 0.679, and PCFI: 0.737.
4.8. Structural Equation Modeling—SEM
For the estimation of the purchase decision, researchers have employed structural equation modeling. Researchers have incorporated multimedia message service, short message service, mobile applications, warp-speed processing, and entertainment as independent variables, whereas, technology and addiction as moderating variables, and electronic word of mouth and attitude as mediating factors, and student academic performance in universities as an outcome variable in our considered structural model. The results of
Table 8 exhibited that the fit-indices demonstrate that the entire structured model is acceptable because the fit indices are within the threshold values such as RMSEA: 0.021, GFI: 0.97, CFI: 0.98, NFI: 0.912, IFI: 0.955, PNFI: 0.725, and PCFI: 0.728.
4.9. Hypothesized Direct Relationship
Researchers used standardized regression weights (SRW) for interpreting a direct relationship between functions of smartphones such as multimedia message service, short message service, mobile applications, warp-speed processing, entertainment, and dependent variable (performance of students). Outcomes of
Table 9 exhibited that four hypotheses H1–H5 are supported (T > 2 and
p < 0.05); however, the hypothesis regarding short message service (H2) is rejected. Thus, it is finally, concluded that multimedia message service, mobile applications, warp-speed processing, and entertainment have a significant impact on student academic performance in universities as the outcome variable, and short message service does not have any impact on student performance. Outcomes of individual variables signified that warp-speed processing and multimedia message service have the highest impacts of 0.8079, and 0.3547, respectively. However, mobile applications followed with the impact of 0.0860, and entertainment has a negative but significant impact i.e., −0.1414 on the academic performance of students.
4.10. Indirect Hypothesized Relationship (Mediation)
The results of
Table 10 demonstrated the significant influence of mediating variables such as electronic word of mouth (eWOM) and attitude in an association of exogenous variables such as multimedia message service, short message service, mobile applications, warp-speed processing, entertainment, and endogenous variable i.e., academic performance of students. The results of mediation were extracted through normal theory and bootstrapping methods. Researchers formulated two sets of five hypotheses such as (H6A—H6E), and (H7A—H7E), the results of the bootstrapping method exhibited that the decision of all the hypotheses is supported (zero does not occur between BootLLCI and BootULCI) [
109,
118]. Hence, it is established that eWOM and attitude have a significant mediating effect amongst exogenous variables and endogenous variable i.e., academic performance of students. The outcomes of the normal theory method demonstrated similar results and concluded the same inference because z > ±1.96, and corresponding probabilities are less than 0.05 in all the cases. Hence, it is finally concluded that eWOM and attitude are significant mediators, which have a significant impact amongst all the exogenous variables, and endogenous variables [
12,
110].
4.11. Hypothesized Relationship of Moderation
Outcomes of
Table 11 exhibited the moderating effects of technology and addiction in the relationship of exogenous variables such as multimedia message service, short message service, mobile applications, warp-speed processing, entertainment, and endogenous variable i.e., academic performance of students. Researchers formulated two sets of five hypotheses such as (H8A—H8E) and (H9A—H9E), and the outcomes of
Table 11 demonstrated that all the hypotheses are accepted (
p < 0.05). Thus, it is conclusively established that technology and addiction are the significant moderators, which have a significant impact amongst all the exogenous variables such as multimedia message service, short message service, mobile applications, warp-speed processing, entertainment, and endogenous variable.
Table 11 exhibited the detailed outcomes of hypotheses (H8A—H8E) and (H9A—H9E).
4.12. 3D Graphical Representation of the Conditional Impact
Figure 2,
Figure 3,
Figure 4,
Figure 5,
Figure 6,
Figure 7,
Figure 8,
Figure 9,
Figure 10 and
Figure 11 exhibited the conditional visualizing impact of moderating variables (technology and addiction) between smartphone functions such as multimedia message service, short message service, mobile applications, warp-speed processing, entertainment, and endogenous variable i.e., student academic performance in universities.
Figure 2,
Figure 3,
Figure 4,
Figure 5,
Figure 6,
Figure 7,
Figure 8,
Figure 9,
Figure 10 and
Figure 11 exhibited the graphical depiction of moderation of technology and addiction in a relationship between exogenous variables and student academic performance in universities as outcome variable. As the outcome variable changes with every reading of moderating variables, thus, this variation demonstrated a significant influence of moderators. The graphical representation is an important condition for demonstrating the influence of the moderator because the ultimate graphical evidence is the final proof of moderation [
12,
109,
118]. From
Figure 2,
Figure 3,
Figure 4,
Figure 5,
Figure 6,
Figure 7,
Figure 8,
Figure 9,
Figure 10 and
Figure 11, the red color depicts the independent variables, however, orange color shows the impact of moderating variables, whereas, the green color demonstrates the academic performance of university students.
The summary of outcomes of hypothesized direct and indirect relationship has been presented in
Table 12:
5. Discussion
The results of the undertaken study demonstrate the smartphone affirmative influence on student academic performance in universities; the previous literature also exhibited similar outcomes [
25,
26,
27,
28,
29]. Outcomes also demonstrating that the multimedia media messaging (MMS) has an affirmative influence on student academic performance in universities, this also confirms the results of research studies that were carried out by Hasan et al. [
15], Dzamesi et al. [
16], Lepp et al. [
29], Rosen et al. [
31], and Junco [
34]. Outcomes of the undertaken study further exhibit that smartphones’ applications also exerted an affirmative influence on student academic performance in university students. These outcomes are consistent with the previous literature [
40,
41,
54,
55]. Findings of this research further demonstrate that warp-speed processing also has an affirmative influence on student academic performance of university students; similarly, Han and Yi [
4], Shahibi and Aziz [
23], Boahene et al. [
24], and Chou and Liu [
63] demonstrated similar outcomes. However, entertainment from the smartphone is a greater factor that hampers the university students’ academic performance; previous literature also exhibited similar outcomes [
7,
8,
21,
22,
34]. The outcomes of mediation exhibited that eWOM has an affirmative and cogent influence between smartphone functions on student academic performance in universities as the outcome variable [
12,
42]. Previous literature also demonstrated similar results [
10,
17,
76,
77,
78,
79]. The results of this research further exhibit that attitude exerts an affirmative and significant influence between functions of smartphone and university students’ academic performance, which shows similar findings of previous literature [
16,
42,
106,
107,
108]. Outcomes of moderation of addiction exhibit the significant influence between functions of smartphone and students’ academic performance in universities as the outcome variable [
8,
10,
12,
16,
18,
33]. Finally, the moderating variable such as technology plays a significant influence between functions of smartphone and university students’ academic performance, previous literature also exhibited similar outcomes such as García-Martínez et al. [
14], Qi [
25], Hossain et al. [
26], Chen and Chang [
90], Saroha and Diwan [
91], Rout and Samarpita [
92], McGill and Klobas [
96], and Aljomaa et al. [
97].
6. Conclusions
The objective of the undertaken study is to examine the influence of smartphone usage in university students, and its impact on their academic performance. This research study is exclusive in a way that the outcomes conclude that functions of the smartphone such as smartphone applications, multimedia service message (MMS), short service message (SMS), and warp-speed processing have an affirmative impact on student academic performance in universities as the outcome variable. However, the entertainment damages students’ academic performance in universities. Similarly, the mediating variables such as electronic word of mouth (eWOM) and attitude have a significant and positive influence in a relationship between smartphone functions such as smartphone applications, multimedia service message (MMS), short service message (SMS), warp-speed processing, and entertainment, and student academic performance in universities in the case of Pakistani universities. The outcomes of moderation conclude that addiction and technology play a significant role as moderator in a relationship between smartphone functions such as smartphone applications, multimedia service message (MMS), short service message (SMS), warp-speed processing, and entertainment, and student academic performance in universities as the outcome variable. Hence, in conclusion, the outcomes demonstrate that smartphones influence student academic performance in universities in several ways. The previous literature demonstrated the mix results that there is an adverse or affirmative influence of smartphones on student academic performance; however, this study shows an affirmative and vital influence of smartphones on student academic performance of Pakistani university students. Thus, the outcomes of the undertaken study are important in a way that we used diverse functions of a smartphone and then evaluated the individual influence of these functions on the students’ performance. Moreover, the results are significant because besides the exogenous variables, we also incorporated attitude and eWOM as a mediator, and technology and addiction as a moderator, to evaluate the impact of functions of the smartphone on student academic performance in universities as the outcome variable. The outcomes have concluded that these mediators and moderators have a significant influence between smartphone usage and academic performance of university students. Thus, the outcomes of this research enlighten the influence of multiple factors of the smartphone, and its influence on student academic performance in universities. Hence, this research has significant theoretical and practical implications.
7. The Theoretical and Managerial Contribution
The undertaken research laid down the basic foundations for future researchers to advance their studies concerning the influence of smartphones on student academic performance in universities as the outcome variable. The undertaken study provides a unique conceptual framework and measuring scales for different constructs. This research will also help future research scholars to replicate the outcomes of the undertaken study to another technology-related product, which can influence student academic performance in universities as the outcome variable, moreover, the outcomes of the undertaken study also provide guidelines to teachers, parents, and policymakers on how smartphones could be used in an effective way that transforms the maximum benefits regarding the best student academic performance in universities as the outcome variable. Towards student academic performance in universities, finally, this research also gives many directions to marketers and R&D professionals of smartphone companies, the results also provide guidelines to marketers on how they can enhance the functionalities and sales of their smartphones. Marketers can use the functions of smartphones for the effective advertising of their services and products. Digital marketing is the new era of marketing, thus, the smartphone would be the best channel for the advertising of their brands. A mostly young population uses the smartphone, thus, this is an excellent opportunity to grasp this major segment of the population for optimal sales and branding.
8. Limitations and Areas of Future Research Studies
The undertaken research is significant in the field of smartphone functions and the student academic performance for university students. However, there are certain limitations of this research. The undertaken research is limited to certain cities and countries, for more generalized results, the sample data may be taken across countries of the region. For more robust results, data might be taken from rural and urban centers of the country. In this research, only a few mediating and moderating variables have been incorporated, thus, for future studies, several other psychological and behavioral variables might be included for more comprehensive outcomes. We used the SEM-based multivariate approach which does not address the cause and effect between the variables, therefore, in future research studies, more robust models could be employed for cause and effect investigation amongst the variables.
Author Contributions
Conceptualization, R.R.A. and F.S.; methodology, R.R.A.; software, R.H.S.; validation, D.S., R.R.A., and S.A.M.; formal analysis, R.R.A.; investigation, F.S.; resources, M.H.P.; data curation, R.H.S.; writing—original draft preparation, R.R.A., and F.S.; writing—review and editing, S.A.M.; visualization, D.S.; supervision, R.R.A.; project administration, M.H.P. All authors have read and agreed to the published version of the manuscript.
Funding
This research received no external funding.
Acknowledgments
We acknowledge the support of Indus University that provided during this project including administrative and technical support.
Conflicts of Interest
The authors declare no conflict of interest.
References
- Deloitte Global Mobile Consumer Survey: US Edition. A New Era in Mobile Continues; Touche Tohmatsu Limited: London, UK, 2018; pp. 2–16. Available online: https://www2.deloitte.com/content/dam/Deloitte/us/Documents/technology-media-telecommunications/us-tmt-global-mobile-consumer-survey-exec-summary-2018.pdf (accessed on 11 July 2019).
- Tindell, D.R.; Bohlander, R.W. The Use and Abuse of Cell Phones and Text Messaging in the Classroom: A Survey of College Students. Coll. Teach. 2012, 60, 1–9. [Google Scholar] [CrossRef]
- Ravizza, S.M.; Hambrick, D.Z.; Fenn, K.M. Non-academic Internet use in the classroom is negatively related to classroom learning regardless of intellectual ability. Comput. Educ. 2014, 78, 109–114. [Google Scholar] [CrossRef]
- Han, S.; Yi, Y.J. How does the smartphone usage of college students affect academic performance? J. Comput. Assist. Learn. 2019, 35, 13–22. [Google Scholar] [CrossRef] [Green Version]
- Al-Khalifa, H.S.; Garcia, R.A. The State of Social Media in Saudi Arabia’s Higher Education. Int. J. Technol. Educ. Mark. 2013, 3, 65–76. [Google Scholar] [CrossRef]
- Mendoza, J.S.; Pody, B.C.; Lee, S.; Kim, M.; McDonough, I.M. The effect of cellphones on attention and learning: The influences of time, distraction, and monophobia. Comput. Hum. Behav. 2018, 86, 52–60. [Google Scholar] [CrossRef]
- Giunchiglia, F.; Zeni, M.; Gobbi, E.; Bignotti, E.; Bison, I. Mobile social media usage and academic performance. Comput. Hum. Behav. 2018, 82, 177–185. [Google Scholar] [CrossRef] [Green Version]
- Duke, É.; Montag, C. Smartphone addiction, daily interruptions and self-reported productivity. Addict. Behav. Rep. 2017, 6, 90–95. [Google Scholar] [CrossRef]
- Yang, Z.; Asbury, K.; Griffiths, M.D. An exploration of problematic smartphone use among Chinese university students: Associations with academic anxiety, academic procrastination, self-regulation, and subjective wellbeing. Int. J. Ment. Health Addict. 2019, 17, 596–614. [Google Scholar] [CrossRef] [Green Version]
- Nayak, J.K. Relationship among smartphone usage, addiction, academic performance and the moderating role of gender: A study of higher education students in India. Comput. Educ. 2018, 123, 164–173. [Google Scholar] [CrossRef]
- Ali, H.H.; Imran, M.; Noori, Y. Frequency of Smart Phone Usage in Medical Students and its Association with Academic Performance. Int. J. Endorsing Health Sci. Res. 2019, 7, 154–161. [Google Scholar] [CrossRef]
- Kibona, L.; Mgaya, G. Smartphones’ effects on academic performance of higher learning students. A case of Ruaha Catholic University—Iringa, Tanzania. J. Multidiscip. Eng. Sci. Technol. 2015, 2, 777–784. [Google Scholar]
- Froese, A.D.; Carpenter, C.N.; Inman, D.A.; Schooley, J.R.; Barnes, R.B.; Brecht, P.W.; Chacon, J.D. Effects of classroom cell phone use on expected and actual learning. Coll. Stud. J. 2012, 46, 323–332. [Google Scholar]
- García-Martínez, I.; Fernández-Batanero, J.M.; Cobos Sanchiz, D.; Luque de la Rosa, A. Using Mobile Devices for Improving Learning Outcomes and Teachers’ Professionalization. Sustainability 2019, 11, 6917. [Google Scholar] [CrossRef] [Green Version]
- Hasan, R.; Palaniappan, S.; Mahmood, S.; Shah, B.; Abbas, A.; Sarker, K.U. Enhancing the Teaching and Learning Process Using Video Streaming Servers and Forecasting Techniques. Sustainability 2019, 11, 2049. [Google Scholar] [CrossRef] [Green Version]
- Dzamesi, J.Y.W.; Akyina, K.O.; Manu, J.; Danso, E. Perceived Effects of Smartphone Usage on Students’ Attitude Towards Learning in a Health Institution. J. Educ. Pract. 2019, 10, 71–81. [Google Scholar] [CrossRef] [Green Version]
- Shields, S.D.; Riley, C.W. Examining the Correlation between Excessive Recreational Smartphone Use and Academic Performance Outcomes. J. High. Educ. Theory Pract. 2019, 19. [Google Scholar] [CrossRef]
- Choi, S. Relationships between Smartphone Usage, Sleep Patterns and Nursing Students’ Learning Engagement. J. Korean Biol. Nurs. Sci. 2019, 21, 231–238. [Google Scholar] [CrossRef]
- Calafell, G.; Banqué, N.; Viciana, S. Purchase and Use of New Technologies among Young People: Guidelines for Sustainable Consumption Education. Sustainability 2019, 11, 1541. [Google Scholar] [CrossRef] [Green Version]
- Molina-Carmona, R.; Pertegal-Felices, M.L.; Jimeno-Morenilla, A.; Mora-Mora, H. Virtual Reality Learning Activities for Multimedia Students to Enhance Spatial Ability. Sustainability 2018, 10, 1074. [Google Scholar] [CrossRef] [Green Version]
- Schaal, S.; Lude, A. Using Mobile Devices in Environmental Education and Education for Sustainable Development—Comparing Theory and Practice in a Nation-Wide Survey. Sustainability 2015, 7, 10153–10170. [Google Scholar] [CrossRef] [Green Version]
- Han, S.; Capraro, R.M.; Capraro, M.M. How science, technology, engineering, and mathematics project based learning affects high-need students in the US. Learn. Indiv. Diff. 2016, 51, 157–166. [Google Scholar] [CrossRef]
- Shahibi, M.S.; Aziz, F.A. The Effect of Smartphone that Influences the Compulsive Usage among Students. Int. J. Acad. Res. Bus. Soc. 2017, 7, 808–908. [Google Scholar] [CrossRef] [Green Version]
- Boahene, K.O.; Fang, J.; Sampong, F. Social Media Usage, and Tertiary Students’ Academic Performance: Examining the Influences of Academic Self-Efficacy and Innovation Characteristics. Sustainability 2019, 11, 2431. [Google Scholar] [CrossRef] [Green Version]
- Qi, C. A double-edged sword? Exploring the impact of students’ academic usage of mobile devices on technostress and academic performance. Behav. Inf. Technol. 2019, 38, 1337–1354. [Google Scholar] [CrossRef]
- Hossain, S.F.A.; Nurunnabi, M.; Hussain, K.; Saha, S.K. Effects of variety-seeking intention by mobile phone usage on university students’ academic performance. Cogent Educ. 2019, 6. [Google Scholar] [CrossRef]
- Jacobsen, W.C.; Forste, R. The wired generation: Academic and social outcomes of electronic media use among university students. Cyberpsychol. Behav. Soc. Netw. 2011, 14, 275–280. [Google Scholar] [CrossRef]
- Hong, F.Y.; Chiu, S.I.; Huang, D.H. A model of the relationship between psychological characteristics, mobile phone addiction and use of mobile phones by Taiwanese university female students. Comput. Hum. Behav. 2012, 28, 2152–2159. [Google Scholar] [CrossRef]
- Lepp, A.; Barkley, J.E.; Karpinski, A.C. The relationship between cell phone use, academic performance, anxiety, and satisfaction with life in college students. Comput. Hum. Behav. 2014, 31, 343–350. [Google Scholar] [CrossRef]
- Wood, E.; Zivcakova, L.; Gentile, P.; Archer, K.; De Pasquale, D.; Nosko, A. Examining the impact of off-task multi-tasking with technology on real-time classroom learning. Comput. Educ. 2012, 58, 365–374. [Google Scholar] [CrossRef]
- Rosen, L.D.; Lim, A.F.; Carrier, L.M.; Cheever, N.A. An empirical examination of the educational impact of text message-induced task switching in the classroom: Educational implications and strategies to enhance learning. Psicol. Educ. 2011, 17, 163–177. [Google Scholar]
- Kirschner, P.A.; Karpinski, A.C. Facebook, and academic performance. Comput. Hum. Behav. 2010, 26, 1237–1245. [Google Scholar] [CrossRef]
- Karpinski, A.; Kirschner, P.; Ozer, I.; Mellott, J.; Ochwo, P. An exploration of social networking site use, multitasking, and academic performance between the United States and European university students. Comput. Hum. Behav. 2013, 29, 1182–1192. [Google Scholar] [CrossRef]
- Junco, R. In-class multitasking and academic performance. Comput. Hum. Behav. 2012, 28, 2236–2243. [Google Scholar] [CrossRef]
- Ahmed, R.R.; Streimikiene, D.; Berchtold, G.; Vveinhardt, J.; Channar, Z.A.; Soomro, R.H. Effectiveness of Online Digital Media Advertising as A Strategic Tool for Building Brand Sustainability: Evidence from FMCGs and Services Sectors of Pakistan. Sustainability 2019, 11, 3436. [Google Scholar] [CrossRef] [Green Version]
- Bellman, S.; Potter, R.F.; Treleaven-Hassard, S.; Robinson, J.A.; Varan, D. The Effectiveness of Branded Mobile Phone Apps. J. Interact. Mark. 2011, 25, 191–200. [Google Scholar] [CrossRef]
- Confos, N.; Davis, T. Young consumer-brand relationship-building potential using digital marketing. Eur. J. Mark. 2016, 50, 1993–2017. [Google Scholar] [CrossRef]
- Handayanto, A.J. Analysis of Consumer Awareness on Twitter Communication and Brand Equity of Bear Brand Milk. J. Res. Mark. 2016, 5, 348–356. [Google Scholar] [CrossRef] [Green Version]
- Mathwick, C.; Wiertz, C.; De Ruyter, K. Social Capital Production in a Virtual P3 Community. J. Consum. Res. 2008, 34, 832–849. [Google Scholar] [CrossRef] [Green Version]
- Woodcock, B.; Middleton, A.; Nortcliffe, A. Considering the smartphone learner: An investigation into student interest in the use of personal technology to enhance their learning. Stud. Engagem. Exp. J. 2012, 1, 1–15. [Google Scholar]
- Al-Meshal, S.; Almotairi, M. Consumer Acceptance of Mobile Marketing: An Empirical Study on the Saudi Female. Int. J. Mark. Stud. 2013, 5, 94–100. [Google Scholar] [CrossRef] [Green Version]
- Çizmeci, F.; Ercan, T. The Effect of Digital Marketing Communication Tools in the Creation of Brand Awareness by Housing Companies. Megaron 2015, 10, 149–161. [Google Scholar]
- Muk, A. Consumers’ intention to opt into SMS advertising. Int. J. Advert. 2007, 26, 177–198. [Google Scholar] [CrossRef]
- Kolla, N. Consumer Attitude towards Mobile Advertising: An Empirical Study. Indian J. Appl. Res. 2011, 4, 340–342. [Google Scholar] [CrossRef]
- Barwise, P.; Strong, C. Permission-based mobile advertising. J. Interact. Mark. 2002, 16, 14–24. [Google Scholar] [CrossRef]
- Bamoriya, P.; Bamoriya, H.; Singh, P. Perceptual mapping of electronic banking channels in India:
A Multidimensional Scaling approach. Int. J. Res. Stud. Manag. 2014, 3, 17–26. [Google Scholar] [CrossRef]
- Scharl, A.; Dickinger, A.; Murphy, J. Diffusion and success factors of mobile marketing. Electron. Commer. Res. Appl. 2005, 4, 159–173. [Google Scholar] [CrossRef] [Green Version]
- Kenny, D.; Marshall, J.F. Contextual marketing: The real business of the Internet. Harv. Bus. Rev. 2000, 78, 119–125. [Google Scholar]
- Yuan, S.T.; Tsao, Y.W. A recommendation mechanism for contextualized mobile advertising. Expert Syst. Appl. 2003, 24, 399–414. [Google Scholar] [CrossRef]
- Barnes, T. RSS: Marketing newest communication channel. J. Website Promot. 2007, 1, 15–30. [Google Scholar] [CrossRef]
- Kaplan, A.M.; Haenlein, M. Users of the world, unite! The challenges and opportunities of social media. Bus. Horiz. 2010, 53, 59–68. [Google Scholar] [CrossRef]
- Saura, J.R.; Palos-Sánchez, P.; Cerdá Suárez, L.M. Understanding the digital marketing environment with KPIs and web analytics. Future Internet 2017, 9, 76. [Google Scholar] [CrossRef] [Green Version]
- Ross, C.; Orr, E.S.; Sisic, M.; Arseneault, J.M.; Simmering, M.G.; Orr, R.R. Personality and motivations associated with Facebook use. Comput. Hum. Behav. 2009, 25, 578–586. [Google Scholar] [CrossRef] [Green Version]
- Kumar, M. Impact of the evolution of smartphones in education technology and its application in technical and professional studies: An Indian perspective. Int. J. Manag. Inf. Technol. 2011, 3, 39–49. [Google Scholar]
- Mtega, W.P.; Bernard, R.; Msungu, A.C.; Sanare, R. Using mobile phones for teaching and learning purposes in higher learning institutions: The case of Sokoine University of Agriculture in Tanzania. In Proceedings of the 5th UbuntuNet Alliance Annual Conference, Dar es Salam, Tanzania, 14–16 November 2012; pp. 118–129. Available online: https://repository.ubuntunet.net/handle/10.20374/130 (accessed on 25 June 2019).
- Montgomery, K.C.; Chester, J. Interactive Food and Beverage Marketing: Targeting Adolescents in the Digital Age. J. Adolesc. Health 2009, 45, S18–S29. [Google Scholar] [CrossRef] [PubMed]
- Chaffey, D. E-Business and E Commerce Management, 3rd ed.; Prentice-Hall: Alexandria, VA, USA, 2008. [Google Scholar]
- Chi, H. Interactive Digital Advertising vs. Virtual Brand Community: Exploratory Study of User Motivation and Social Media Marketing Responses in Taiwan. J. Interact. Advert. 2011, 12, 44–61. [Google Scholar] [CrossRef]
- Holzer, A.; Ondrus, J. Trends in mobile application development. In Lecture Notes of the Institute for Computer Sciences, Social Informatics and Telecommunications Engineering; Springer: Berlin/Heidelberg, Germany, 2009; pp. 55–64. [Google Scholar]
- Munsell, C.R.; Harris, J.L.; Sarda, V.; Schwartz, M.B. Parents’ beliefs about the health fullness of sugary drink options: Opportunities to address misperceptions. Public Health Nutr. 2015, 19, 46–54. [Google Scholar] [CrossRef] [Green Version]
- Bu, N.; Niu, S.; Yu, L.; Ma, W.; Long, G. Bridging Semantic Gap between App Names: Collective Matrix Factorization for Similar Mobile App Recommendation. In Lecture Notes in Computer Science; Springer: Berlin/Heidelberg, Germany, 2016; pp. 324–339. [Google Scholar]
- Mady, T.T. Sentiment toward marketing: Should we care about consumer alienation and readiness to use technology? J. Consum. Behav. 2011, 10, 192–204. [Google Scholar] [CrossRef]
- Chou, S.W.; Liu, C.H. Learning effectiveness in a Web-based virtual learning environment: A learner control perspective. J. Comput. Assist. Learn. 2005, 21, 65–76. [Google Scholar] [CrossRef]
- Bush, A.J.; Bush, V.; Harris, S. Advertiser perceptions of the Internet as a marketing communications tool. J. Advert. Res. 1998, 38, 17–27. [Google Scholar]
- Jobe, W. Native Apps vs. Mobile Web Apps. Int. J. Interact. Mob. Technol. 2013, 7, 27. [Google Scholar] [CrossRef]
- Lulu, D.L.B.; Kuflik, T. Wise Mobile Icons Organization: Apps Taxonomy Classification Using Functionality
Mining to Ease Apps Finding. Mob. Inf. Syst. 2016, 2016, 3083450. [Google Scholar]
- Lui, K.; Wong, A. Does media multitasking always hurt? A positive correlation between multitasking and multisensory integration. Psychon. Bull. Rev. 2012, 19, 647–653. [Google Scholar] [CrossRef] [PubMed] [Green Version]
- Prabu, D.; Kim, J.; Brickman, J.; Ran, W.; Curtis, C. Mobile phone distraction while studying. New Media Soc. 2014. [Google Scholar] [CrossRef] [Green Version]
- Mangold, W.G.; Faulds, D.J. Social media: The new hybrid element of the promotion mix. Bus. Horiz. 2009, 52, 357–365. [Google Scholar] [CrossRef]
- Laroche, M.; Habibi, M.R.; Richard, M.O.; Sankaranarayanan, R. The effects of social media-based brand communities on brand community markers, value creation practices, brands trust and brand loyalty. Comput. Hum. Behav. 2012, 28, 1755–1767. [Google Scholar] [CrossRef] [Green Version]
- Blair, M.K. Using Digital and Social Media Platforms for Social Marketing; Oxford Medicine Online; Oxford University Press: Oxford, UK, 2017. [Google Scholar]
- Li, X.; Chan, K.W.; Kim, S. Service with Emoticons: How Customers Interpret Employee Use of Emoticons in
Online Service Encounters. J. Consum. Res. 2019, 45, 973–987. [Google Scholar] [CrossRef]
- Palos-Sanchez, P.; Saura, J.R.; Martin-Velicia, F. A study of the effects of programmatic advertising on users’
concerns about privacy overtime. J. Bus. Res. 2019, 96, 61–72. [Google Scholar] [CrossRef]
- Kim, K.; Stout, P.A.; Yoo, C.Y. Assessing the effects of animation in online banner advertising: Hierarchy of
effects model. J. Interact. Advert. 2004, 4, 49–60. [Google Scholar]
- Popp, B.; Woratschek, H. consumer-brand identification revisited: An integrative framework of brand identification, customer satisfaction, and price image and their role for brand loyalty and word of mouth. J. Brand Manag. 2017, 24, 1–21. [Google Scholar] [CrossRef]
- Lien, C.H.; Cao, Y. Examining wechat users’ motivations, trust, attitudes, and positive word-of-mouth: Evidence from china. Comput. Hum. Behav. 2014, 41, 104–111. [Google Scholar] [CrossRef]
- Schmäh, M.; Wilke, T.; Rossmann, A. Electronic Word-of-Mouth: A Systematic Literature Analysis. In Digital Enterprise Computing; Rossmann, A., Zimmermann, A., Eds.; Gesellschaft für Informatik: Bonn, Germany, 2017; pp. 147–158. [Google Scholar]
- Hennig-Thurau, T.; Malthouse, E.C.; Friege, C.; Gensler, S.; Lobschat, L.; Rangaswamy, A.; Skiera, B. The impact of new media on customer relationships. J. Serv. Res. 2010, 13, 311–330. [Google Scholar] [CrossRef] [Green Version]
- Ellison, N.B.; Lampe, C.; Steinfield, C. Spatially Bounded Online Social Networks and Social Capital: The Role of Facebook. In Proceedings of the Annual Conference of the International Communication Association (ICA), Dresden, Germany, 19–23 June 2006. [Google Scholar]
- Herr, P.M.; Kardes, F.R.; Kim, J. Effects of word-of-mouth and product-attribute information on persuasion: An accessibility-diagnosticity perspective. J. Consum. Res. 1991, 17, 454–462. [Google Scholar] [CrossRef]
- Virvilaite, R.; Tumasonyte, D.; Sliburyte, L. The influence of word of mouth communication on brand equity:
Receiver perspectives. Procedia Soc. Behav. Sci. 2015, 213, 641–646. [Google Scholar] [CrossRef] [Green Version]
- Cornelissen, J. Corporate image: An audience centered model. Corp. Commun. Int. J. 2000, 5, 119–125. [Google Scholar] [CrossRef]
- Vermeulen, I.E.; Seegers, D. Tried and tested: The impact of online hotel reviews on consumer consideration. Tour. Manag. 2009, 30, 123–127. [Google Scholar] [CrossRef]
- Morgan, N.J.; Pritchard, A.; Piggott, R. Destination branding and the role of the stakeholders: The case of New Zealand. J. Vacat. Mark. 2003, 9, 285–299. [Google Scholar] [CrossRef]
- Goldenberg, J.; Libai, B.; Muller, E. Talk of the network: A complex systems look at the underlying process of
word-of-mouth. Mark. Lett. 2001, 12, 211–223. [Google Scholar] [CrossRef]
- Yang, H.P.; Mutum, D.S. Electronic word-of-mouth for university selection: Implications for academic leaders and recruitment managers. J. Gen. Manag. 2015, 40, 23–44. [Google Scholar] [CrossRef]
- Wang, Y.; Sun, S. Assessing beliefs, attitudes, and behavioral responses toward online advertising in three countries. Int. Bus. Rev. 2010, 19, 333–344. [Google Scholar] [CrossRef]
- Zhang, J.; Mao, E. From Online Motivations to Ad Clicks and to Behavioral Intentions: An Empirical Study of Consumer Response to Social Media Advertising. Psychol. Mark. 2016, 33, 155–164. [Google Scholar] [CrossRef]
- Jabali, O.; Saeedi, M.; Shbeitah, G.; Ayyoub, A.A. Medical faculty members’ perception of smartphones as an educational tool. BMC Med. Educ. 2019, 19, 264. [Google Scholar] [CrossRef] [PubMed] [Green Version]
- Chen, T.Y.; Chang, H.S. Reducing consumers’ perceived risk through banking service quality cues in Taiwan. J. Bus. Psychol. 2005, 19, 521–539. [Google Scholar] [CrossRef]
- Saroha, R.; Diwan, S.P. Modelling customer satisfaction and customer loyalty in the frame of the telecommunications industry: A review. EuroMed J. Manag. 2017, 2, 15–37. [Google Scholar] [CrossRef]
- Rout, B.; Samarpita, S. Technology of e-banking: Customer perception and satisfaction towards public sector banks in Bhubaneswar city. IOSR J. Bus. Manag. 2017, 19, 29–38. [Google Scholar] [CrossRef]
- Prasadh, R.R.; Suresh, J. Customer satisfaction index model for the Indian banking industry: A qualitative study. Asian Soc. Sci. 2016, 13, 114–129. [Google Scholar] [CrossRef] [Green Version]
- Raza, S.A.; Hanif, N. Factors acting internet banking adoption among internal and external customers: A case of Pakistan. Int. J. Electron. Financ. 2013, 7, 82–96. [Google Scholar] [CrossRef] [Green Version]
- Angur, M.G.; Nataraajan, R.; Jahera, J.S., Jr. Service quality in the banking industry: An assessment in a developing economy. Int. J. Bank Mark. 1999, 17, 116–125. [Google Scholar] [CrossRef]
- McGill, T.J.; Klobas, J.E. A task—Technology fit view of learning management system impact. Comput. Educ. 2009, 52, 496–508. [Google Scholar] [CrossRef]
- Aljomaa, S.S.; Qudah, M.F.A.; Albursan, I.S.; Bakhiet, S.F.; Abdul-Jabbar, A.S. Smartphone addiction among university students in the light of some variables. Comput. Hum. Behav. 2016, 61, 155–164. [Google Scholar] [CrossRef]
- McCloskey, W. Retail. White Paper; Email Data Source: New York, NY, USA, 2006. [Google Scholar]
- Ravizza, S.M.; Delgado, M.R. Motivational enhancement of cognitive control depends on depressive symptoms. Emotion 2014, 14, 646–650. [Google Scholar] [CrossRef] [Green Version]
- Widyanto, L.; Griffiths, M. Internet addiction: Does it really exist? In Psychology and the Internet: Intrapersonal, Interpersonal, and Transpersonal Applications; Gackenbach, J., Ed.; Academic Press: Burlington, NJ, USA, 2006; pp. 141–163. [Google Scholar]
- Van Deursen, A.J.; Bolle, C.L.; Hegner, S.M.; Kommers, P.A. Modeling habitual and addictive smartphone behavior: The role of smartphone usage types, emotional intelligence, social stress, self-regulation, age, and gender. Comput. Hum. Behav. 2015, 45, 411–420. [Google Scholar] [CrossRef] [Green Version]
- Samaha, M.; Hawi, N. Relationships among smartphone addiction, stress, academic performance, and satisfaction with life. Comput. Hum. Behav. 2016, 57, 321–325. [Google Scholar] [CrossRef]
- Gökçearslan, Ş.; Mumcu, F.K.; Haşlaman, T.; Çevik, Y.D. Modelling smartphone addiction: The role of smartphone usage, self-regulation, general self-efficacy and cyber loafing in university students. Comput. Hum. Behav. 2016, 63, 639–649. [Google Scholar] [CrossRef]
- Wang, H.; Huang, H.; Wu, H.M. Relationship between personality and mobile phone addiction: A mediating role of social anxiety. Chin. J. Clin. Psychol. 2014, 3, 447–450. [Google Scholar]
- Groeger, L.; Buttle, F. Deciphering Word-of-Mouth Marketing Campaign Reach: Every day Conversation
Versus Institutionalized Word of Mouth. J. Advert. Res. 2016, 56, 368–384. [Google Scholar] [CrossRef]
- Ahmed, R.R.; Vveinhardt, J.; Štreimikiene, D.; Ashraf, M. Interactive Digital Media and Impact of Customer Attitude and Technology on Brand Awareness: Evidence from the South Asian Countries. J. Bus. Econ. Manag. 2017, 18, 1115–1134. [Google Scholar] [CrossRef] [Green Version]
- Filipovic, J. Brand awareness and buying intention in the online environment. Marketing 2015, 46, 277–284. [Google Scholar] [CrossRef]
- Geçti, F.; Gümüs, N. Examining the Attitudes towards Mobile Advertising Messages: A Field Research on Turkish Consumers. China-USA Bus. Rev. 2013, 12, 204–210. [Google Scholar]
- Ahmed, R.R.; Vveinhardt, J.; Streimikiene , D.; Awais, M. Mediating and Marketing factors influence the prescription behavior of Physicians: An Empirical Investigation. Amfiteatru Econ. 2016, 18, 153–167. [Google Scholar]
- Ahmed, R.R.; Vveinhardt, J.; Streimikiene, D. The direct and indirect impact of the Pharmaceutical industry in Economic expansion and Job creation: Evidence from Bootstrapping and Normal theory methods. Amfiteatru Econ. 2018, 20, 454–469. [Google Scholar] [CrossRef]
- Hair, J.F.; Black, W.C.; Babin, B.J.; Anderson, R.E. Multivariate Data Analysis, 7th ed.; Prentice-Hall: Upper Saddle River, NJ, USA, 2010. [Google Scholar]
- Huang, J.H.; Lee, B.C.Y.; Ho, S.H. Consumer attitude toward grey market goods. Int. Mark. Rev. 2004, 21, 598–614. [Google Scholar] [CrossRef] [Green Version]
- Byrne, B.M. Structural Equation Modeling with AMOS, Basic Concepts, Application, and Programming, 2nd ed.; La Erlbaum Associates: Hillsdale, NJ, USA, 2009. [Google Scholar] [CrossRef]
- Fornell, C.; Larcker, D.F. Evaluating structural equation models with unobservable variables and measurement error. J. Mark. Res. 1981, 39, 39–50. [Google Scholar] [CrossRef]
- Kline, T.J.B.; Sulsky, L.M.; Rever-Moriyama, S.D. Common method variance and specification errors: A practical approach to detection. J. Psychol. 2000, 134, 401–421. [Google Scholar] [CrossRef] [PubMed]
- Emory, C.W.; Cooper, D.R. Business Research Methods, 4th ed.; Irvin: Boston, MA, USA, 1991. [Google Scholar]
- Kaiser, H.F. An index of factorial simplicity. Psychometrika 1974, 39, 31–36. [Google Scholar] [CrossRef]
- Hayes, A.F. Introduction to Mediation, Moderation, and Conditional Process Analysis: A Regression-Based Approach; The Guilford Press: New York, NY, USA, 2013. [Google Scholar]
Figure 1.
Conceptual model of the research study. Source: Adapted from previous literature [
4,
35,
39,
42,
54,
84,
88,
91,
106].
Figure 1.
Conceptual model of the research study. Source: Adapted from previous literature [
4,
35,
39,
42,
54,
84,
88,
91,
106].
Figure 2.
Visualization of 3D graphs for the conditional moderating effect of addiction and technology.
Figure 2.
Visualization of 3D graphs for the conditional moderating effect of addiction and technology.
Figure 3.
Visualization of 3D graphs for the conditional moderating effect of addiction and technology.
Figure 3.
Visualization of 3D graphs for the conditional moderating effect of addiction and technology.
Figure 4.
Visualization of 3D graphs for the conditional moderating effect of addiction and technology.
Figure 4.
Visualization of 3D graphs for the conditional moderating effect of addiction and technology.
Figure 5.
Visualization of 3D graphs for the conditional moderating effect of addiction and technology.
Figure 5.
Visualization of 3D graphs for the conditional moderating effect of addiction and technology.
Figure 6.
Visualization of 3D graphs for the conditional moderating effect of addiction and technology.
Figure 6.
Visualization of 3D graphs for the conditional moderating effect of addiction and technology.
Figure 7.
Visualization of 3D graphs for the conditional moderating effect of addiction and technology.
Figure 7.
Visualization of 3D graphs for the conditional moderating effect of addiction and technology.
Figure 8.
Visualization of 3D graphs for the conditional moderating effect of addiction and technology.
Figure 8.
Visualization of 3D graphs for the conditional moderating effect of addiction and technology.
Figure 9.
Visualization of 3D graphs for the conditional moderating effect of addiction and technology.
Figure 9.
Visualization of 3D graphs for the conditional moderating effect of addiction and technology.
Figure 10.
Visualization of 3D graphs for the conditional moderating effect of addiction and technology.
Figure 10.
Visualization of 3D graphs for the conditional moderating effect of addiction and technology.
Figure 11.
Visualization of 3D graphs for the conditional moderating effect of addiction and technology.
Figure 11.
Visualization of 3D graphs for the conditional moderating effect of addiction and technology.
Table 1.
Respondents’ profile.
Table 1.
Respondents’ profile.
| Demographics | Frequency | Percent |
|---|
| Gender | Male | 435 | 55.48% |
| Female | 349 | 44.52% |
| Marital Status | Single | 671 | 85.59% |
| Married | 113 | 14.41% |
| Age (in years) | 18–25 | 321 | 40.94% |
| 25–30 | 273 | 34.82% |
| 30–35 | 102 | 13.01% |
| More than 35 | 88 | 11.22% |
| Education (enrolled) | Under-graduation | 362 | 46.17% |
| Graduation | 243 | 30.99% |
| Post-Graduation | 115 | 14.67% |
| Professional degree | 64 | 8.16% |
| Experience (in years) | 0–0 | 276 | 35.20% |
| 1–5 | 219 | 27.93% |
| 5–10 | 188 | 23.98% |
| More than 10 | 101 | 12.88% |
| Income (in PKR 000) | 0–0 | 287 | 36.61% |
| 10–25 | 210 | 26.79% |
| 25–35 | 161 | 19.26% |
| 35–45 | 89 | 10.84% |
| More than 45 | 52 | 6.51% |
| Total–N | 784 |
Table 2.
Descriptive statistics.
Table 2.
Descriptive statistics.
| | Mean | Student Deviation | Skewness | Kurtosis |
|---|
| Statistic | Student Error | Statistic | Statistic | Student Error | Statistic | Student Error |
|---|
| Performance of Students | 3.81 | 0.038 | 1.075 | −0.899 | 0.087 | 0.287 | 0.174 |
| SMS | 3.77 | 0.038 | 1.072 | −0.827 | 0.087 | 0.190 | 0.174 |
| MMS | 3.95 | 0.039 | 1.100 | −0.965 | 0.087 | 0.340 | 0.174 |
| Mobile Apps | 3.97 | 0.040 | 1.113 | −0.977 | 0.087 | 0.288 | 0.174 |
| Warp-Speed Processing | 3.85 | 0.037 | 1.047 | −0.939 | 0.087 | 0.570 | 0.174 |
| Entertainment | 3.50 | 0.036 | 1.020 | −0.550 | 0.087 | −0.305 | 0.174 |
| Attitude | 3.84 | 0.037 | 1.038 | −0.941 | 0.087 | 0.620 | 0.174 |
| EWOM | 3.93 | 0.039 | 1.095 | −0.953 | 0.087 | 0.343 | 0.174 |
| Technology | 3.91 | 0.039 | 1.083 | −0.947 | 0.087 | 0.397 | 0.174 |
| Addiction | 3.78 | 0.036 | 0.996 | −0.978 | 0.087 | 0.896 | 0.174 |
Table 3.
Analysis of reliabilities and validities.
Table 3.
Analysis of reliabilities and validities.
| Variables/Factors | Constructs | FL | CA | CR | AVE |
|---|
| Performance of Students | POS1 | 0.732 | | | |
| POS2 | 0.880 | 0.849 | 0.718 | 0.729 |
| POS3 | 0.936 | | | |
| Multimedia Message Service | MMS1 | 0.829 | | | |
| MMS2 | 0.905 | 0.827 | 0.713 | 0.687 |
| MMS3 | 0.746 | | | |
| Simple Message Service | SMS1 | 0.931 | | | |
| SMS2 | 0.831 | 0.821 | 0.711 | 0.682 |
| SMS3 | 0.701 | | | |
| Mobile Applications | MAP1 | 0.900 | | | |
| MAP2 | 0.820 | 0.812 | 0.709 | 0.665 |
| MAP3 | 0.716 | | | |
| Warp-Speed Processing | WSP1 | 0.826 | | | |
| WSP2 | 0.905 | 0.854 | 0.719 | 0.731 |
| WSP3 | 0.832 | | | |
| Entertainment | ENT1 | 0.812 | | | |
| ENT2 | 0.943 | 0.832 | 0.714 | 0.699 |
| ENT3 | 0.742 | | | |
| Electronic Word of Mouth | EWOM1 | 0.782 | | | |
| EWOM2 | 0.932 | 0.848 | 0.717 | 0.723 |
| EWOM3 | 0.831 | | | |
| Attitude | ATT1 | 0.832 | | | |
| ATT2 | 0.845 | 0.806 | 0.707 | 0.651 |
| ATT3 | 0.740 | | | |
| Technology | TEC1 | 0.827 | | | |
| TEC2 | 0.703 | 0.820 | 0.711 | 0.681 |
| TEC3 | 0.931 | | | |
| Addiction | ADD1 | 0.721 | | | |
| ADD2 | 0.903 | 0.818 | 0.710 | 0.675 |
| ADD3 | 0.831 | | | |
Table 4.
Principal component analysis. Rotated component matrix a.
Table 4.
Principal component analysis. Rotated component matrix a.
| Factors | Items | | Components |
|---|
| 1 | 2 | 3 | 4 | 5 | 6 | 7 | 8 | 9 | 10 |
|---|
| Performance of Students | POS1 | 0.732 | | | | | | | | | |
| POS2 | 0.880 | | | | | | | | | |
| POS3 | 0.936 | | | | | | | | | |
| Simple Message Service | SMS1 | | 0.931 | | | | | | | | |
| SMS2 | | 0.831 | | | | | | | | |
| SMS3 | | 0.701 | | | | | | | | |
| Multimedia Message Service | MMS1 | | | 0.829 | | | | | | | |
| MMS2 | | | 0.905 | | | | | | | |
| MMS3 | | | 0.746 | | | | | | | |
| Mobile Apps | MAP1 | | | | 0.900 | | | | | | |
| MAP2 | | | | 0.820 | | | | | | |
| MAP3 | | | | 0.716 | | | | | | |
| Technology | TEC1 | | | | | 0.827 | | | | | |
| TEC2 | | | | | 0.703 | | | | | |
| TEC3 | | | | | 0.931 | | | | | |
| Addiction | ADD1 | | | | | | 0.721 | | | | |
| ADD2 | | | | | | 0.903 | | | | |
| ADD3 | | | | | | 0.831 | | | | |
| Warp-Speed Processing | WSP1 | | | | | | | 0.826 | | | |
| WSP2 | | | | | | | 0.905 | | | |
| WSP3 | | | | | | | 0.832 | | | |
| Entertainment | ENT1 | | | | | | | | 0.812 | | |
| ENT2 | | | | | | | | 0.943 | | |
| ENT3 | | | | | | | | 0.742 | | |
| Attitude | ATT1 | | | | | | | | | 0.832 | |
| ATT2 | | | | | | | | | 0.845 | |
| ATT3 | | | | | | | | | 0.740 | |
| Electronic word of mouth | EWOM1 | | | | | | | | | | 0.782 |
| EWOM2 | | | | | | | | | | 0.932 |
| EWOM3 | | | | | | | | | | 0.831 |
Table 5.
Kaiser Meyer Olkin (KMO) and Bartlett’s techniques.
Table 5.
Kaiser Meyer Olkin (KMO) and Bartlett’s techniques.
| Kaiser–Meyer–Olkin Measure of Sampling Adequacy | 0.811 |
| Bartlett’s Test of Sphericity | Approx. Chi-Square | 21,599.816 |
| Df | 435 |
| Sig. | 0.000 |
Table 6.
Total variance explained.
Table 6.
Total variance explained.
| Component | Initial Eigenvalues | Extraction Sums of Squared Loadings | Rotation Sums of Squared Loadings |
|---|
| Total | % of Variance | Cumulative % | Total | % of Variance | Cumulative % | Total | % of Variance | Cumulative % |
|---|
| 1 | 7.581 | 25.268 | 25.268 | 7.581 | 25.268 | 25.268 | 7.558 | 25.194 | 25.194 |
| 2 | 2.935 | 9.783 | 35.051 | 2.935 | 9.783 | 35.051 | 2.592 | 8.641 | 33.835 |
| 3 | 2.641 | 8.802 | 43.853 | 2.641 | 8.802 | 43.853 | 2.590 | 8.632 | 42.467 |
| 4 | 2.604 | 8.682 | 52.535 | 2.604 | 8.682 | 52.535 | 2.563 | 8.545 | 51.011 |
| 5 | 2.504 | 8.345 | 60.880 | 2.504 | 8.345 | 60.880 | 2.557 | 8.524 | 59.535 |
| 6 | 2.280 | 7.600 | 68.480 | 2.280 | 7.600 | 68.480 | 2.536 | 8.452 | 67.988 |
| 7 | 1.821 | 6.072 | 74.552 | 1.821 | 6.072 | 74.552 | 1.798 | 5.992 | 73.979 |
| 8 | 1.743 | 5.809 | 80.361 | 1.743 | 5.809 | 80.361 | 1.794 | 5.982 | 79.961 |
| 9 | 1.630 | 5.433 | 85.794 | 1.630 | 5.433 | 85.794 | 1.750 | 5.833 | 85.794 |
| 10 | 1.528 | 5.283 | 87.479 | 1.528 | 5.283 | 87.479 | 1.740 | 5.496 | 87.479 |
Table 7.
Outcomes of AICM (anti-image correlation matrices).
Table 7.
Outcomes of AICM (anti-image correlation matrices).
| Factors | POS | SMS | MMS | MAP | WSP | ENT | ATT | EWOM | TEC | ADD |
|---|
| Anti−image Correlation Matrix (AICM) | POS | 0.799 a | −0.484 | −0.627 | 0.154 | 0.268 | −0.424 | −0.313 | −0.510 | 0.276 | 0.296 |
| SMS | −0.484 | 0.785 a | 0.653 | −0.219 | −0.543 | 0.373 | 0.143 | 0.057 | −0.113 | −0.518 |
| MMS | −0.627 | 0.653 | 0.740 a | −0.239 | −0.532 | 0.481 | 0.290 | −0.014 | −0.019 | −0.718 |
| Mobile Apps | 0.154 | −0.219 | −0.239 | 0.879 a | 0.365 | 0.037 | −0.665 | −0.094 | −0.297 | −0.120 |
| WSP | 0.268 | −0.543 | −0.532 | 0.365 | 0.810 a | −0.135 | −0.496 | −0.142 | −0.333 | 0.402 |
| Entertainment | −0.424 | 0.373 | 0.481 | 0.037 | −0.135 | 0.701 a | −0.028 | 0.135 | −0.310 | −0.283 |
| Attitude | −0.313 | 0.143 | 0.290 | −0.665 | −0.496 | −0.028 | 0.861 a | 0.100 | 0.132 | −0.132 |
| EWOM | −0.510 | 0.057 | −0.014 | −0.094 | −0.142 | 0.135 | 0.100 | 0.923 a | −0.371 | 0.119 |
| Technology | 0.276 | −0.113 | −0.019 | −0.297 | −0.333 | −0.310 | 0.132 | −0.371 | 0.910 a | −0.143 |
| Addiction | 0.296 | −0.518 | −0.718 | −0.120 | 0.402 | −0.283 | −0.132 | 0.119 | −0.143 | 0.824 a |
Table 8.
Model fit indices.
Table 8.
Model fit indices.
| Fit Indices | RMSEA | GFI | CFI | NFI | IFI | PNFI | PCFI |
|---|
| Criteria | ≤0.05 | >0.95 | ≥0.95 | >0.90 | >0.95 | >0.50 | >0.50 |
| Structural model | 0.021 | 0.97 | 0.98 | 0.912 | 0.955 | 0.725 | 0.728 |
| Measurement Model | 0.032 | 0.96 | 0.97 | 0.931 | 0.961 | 0.679 | 0.737 |
Table 9.
Hypothesized direct relationship.
Table 9.
Hypothesized direct relationship.
| Hypothesis | Variables | Regression Paths | Standard. Regression Weights | SE | T | p | Decision |
|---|
| H1 | Multimedia Message Service | MMS→POS | 0.3547 | 0.025 | 14.27 | 0.000 | Supported |
| H2 | Short Message Service | SMS→POS | 0.0205 | 0.036 | 0.56 | 0.571 | Not Supported |
| H3 | Mobile Applications | MAP→POS | 0.0860 | 0.026 | 3.27 | 0.001 | Supported |
| H4 | Warp-Speed Processing | WSP→POS | 0.8079 | 0.063 | 12.65 | 0.000 | Supported |
| H5 | Entertainment | ENT→POS | −0.1414 | 0.073 | −2.107 | 0.041 | Supported |
Table 10.
Mediation analysis.
Table 10.
Mediation analysis.
| Mediation | Bootstrapping Method | Normal Theory Method |
|---|
| Indirect Effect | Boot SE | Boot LLCI | Boot ULCI | Indirect Effect | SE | Z * | Prob. ** |
|---|
| H6A: | MMS→eWOM→POS | 0.372 | 0.027 | 0.318 | 0.425 | 0.372 | 0.023 | 15.82 | 0.000 |
| H6B: | SMS→eWOM→POS | 0.505 | 0.025 | 0.455 | 0.556 | 0.505 | 0.024 | 20.69 | 0.000 |
| H6C: | MAP→eWOM→POS | 0.527 | 0.026 | 0.477 | 0.577 | 0.527 | 0.024 | 22.06 | 0.000 |
| H6D: | WSP→eWOM→POS | 0.581 | 0.025 | 0.530 | 0.630 | 0.581 | 0.027 | 20.99 | 0.000 |
| H6E: | ENT→eWOM→POS | 0.049 | 0.030 | 0.010 | 0.019 | 0.049 | 0.025 | 1.99 | 0.046 |
| H7A: | MMS→ATT→POS | 0.150 | 0.017 | 0.116 | 0.186 | 0.150 | 0.018 | 8.12 | 0.000 |
| H7B: | SMS→ATT→POS | 0.213 | 0.034 | 0.146 | 0.282 | 0.213 | 0.024 | 8.83 | 0.000 |
| H7C: | MAP→ATT→POS | 0.255 | 0.028 | 0.201 | 0.315 | 0.255 | 0.033 | 7.75 | 0.000 |
| H7D: | WSP→ATT→POS | 0.265 | 0.035 | 0.196 | 0.335 | 0.265 | 0.026 | 9.93 | 0.000 |
| H7E: | ENT→ATT→POS | 0.042 | 0.013 | 0.016 | 0.069 | 0.042 | 0.012 | 3.63 | 0.000 |
Table 11.
Moderating effect.
Table 11.
Moderating effect.
| Hypotheses | Moderator | Moderation | Effect | SE | T | p * | LLCI | ULCI |
|---|
| Moderating Effects of TEC and ADD b/w MMS and POS |
| H8A: | TEC | MMS × TEC | −0.081 | 0.013 | −6.01 | 0.000 | −0.107 | −0.054 |
| H9A: | ADD | MMS × ADD | −0.128 | 0.012 | −10.36 | 0.000 | −0.152 | −0.104 |
| Moderating Effects of TEC and ADD b/w SMS and POS |
| H8B: | TEC | SMS × TEC | −0.232 | 0.014 | −15.80 | 0.000 | −0.261 | −0.203 |
| H9B: | ADD | SMS × ADD | −0.183 | 0.017 | −10.66 | 0.000 | −0.216 | −0.149 |
| Moderating Effects of TEC and ADD b/w MAP and POS |
| H8C: | TEC | MAP × TEC | −0.178 | 0.014 | −12.14 | 0.000 | −0.207 | −0.149 |
| H9C: | ADD | MAP × ADD | −0.171 | 0.014 | −11.46 | 0.000 | −0.200 | −0.142 |
| Moderating Effects of TEC and ADD b/w WSP and POS |
| H8D: | TEC | WSP × TEC | −0.169 | 0.014 | −11.37 | 0.000 | −0.198 | −0.140 |
| H9D: | ADD | WSP × ADD | −0.084 | 0.018 | −4.68 | 0.000 | −0.120 | −0.049 |
| Moderating Effects of TEC and ADD b/w ENT and POS |
| H8E: | TEC | ENT × TEC | −0.051 | 0.019 | −2.64 | 0.008 | −0.088 | −0.013 |
| H9E: | ADD | ENT × ADD | 0.060 | 0.019 | 3.05 | 0.002 | 0.021 | 0.098 |
Table 12.
Summary of the hypotheses.
Table 12.
Summary of the hypotheses.
| Serial. Number. | Hypotheses | Relationship | Variables Relationship | Outcome | Decision |
|---|
| 1 | H1 | Direct | MMS→POS | Significant | Accepted |
| 2 | H2 | Direct | SMS→POS | Insignificant | Rejected |
| 3 | H3 | Direct | MAP→POS | Significant | Accepted |
| 4 | H4 | Direct | WSP→POS | Significant | Accepted |
| 5 | H5 | Direct | ENT→POS | Significant | Accepted |
| 6 | H6A | Mediation | MMS→eWOM→POS | Significant | Accepted |
| 7 | H6B | Mediation | SMS→eWOM→POS | Significant | Accepted |
| 8 | H6C | Mediation | MAP→eWOM→POS | Significant | Accepted |
| 9 | H6D | Mediation | WSP→eWOM→POS | Significant | Accepted |
| 10 | H6E | Mediation | ENT→eWOM→POS | Significant | Accepted |
| 11 | H7A | Mediation | MMS→ATT→POS | Significant | Accepted |
| 12 | H7B | Mediation | SMS→ATT→POS | Significant | Accepted |
| 13 | H7C | Mediation | MAP→ATT→POS | Significant | Accepted |
| 14 | H7D | Mediation | WSP→ATT→POS | Significant | Accepted |
| 15 | H7E | Mediation | ENT→ATT→POS | Significant | Accepted |
| 16 | H8A | Moderation | MMS→TEC→POS | Significant | Accepted |
| 17 | H8B | Moderation | SMS→TEC→POS | Significant | Accepted |
| 18 | H8C | Moderation | MAP→TEC→POS | Significant | Accepted |
| 19 | H8D | Moderation | WSP→TEC→POS | Significant | Accepted |
| 20 | H8E | Moderation | ENT→TEC→POS | Significant | Accepted |
| 21 | H9A | Moderation | MMS→ADD→POS | Significant | Accepted |
| 22 | H9B | Moderation | SMS→ADD→POS | Significant | Accepted |
| 23 | H9C | Moderation | MAP→ADD→POS | Significant | Accepted |
| 24 | H9D | Moderation | WSP→ADD→POS | Significant | Accepted |
| 25 | H9E | Moderation | ENT→ADD→POS | Significant | Accepted |
© 2020 by the authors. Licensee MDPI, Basel, Switzerland. This article is an open access article distributed under the terms and conditions of the Creative Commons Attribution (CC BY) license (http://creativecommons.org/licenses/by/4.0/).

 ,
, 


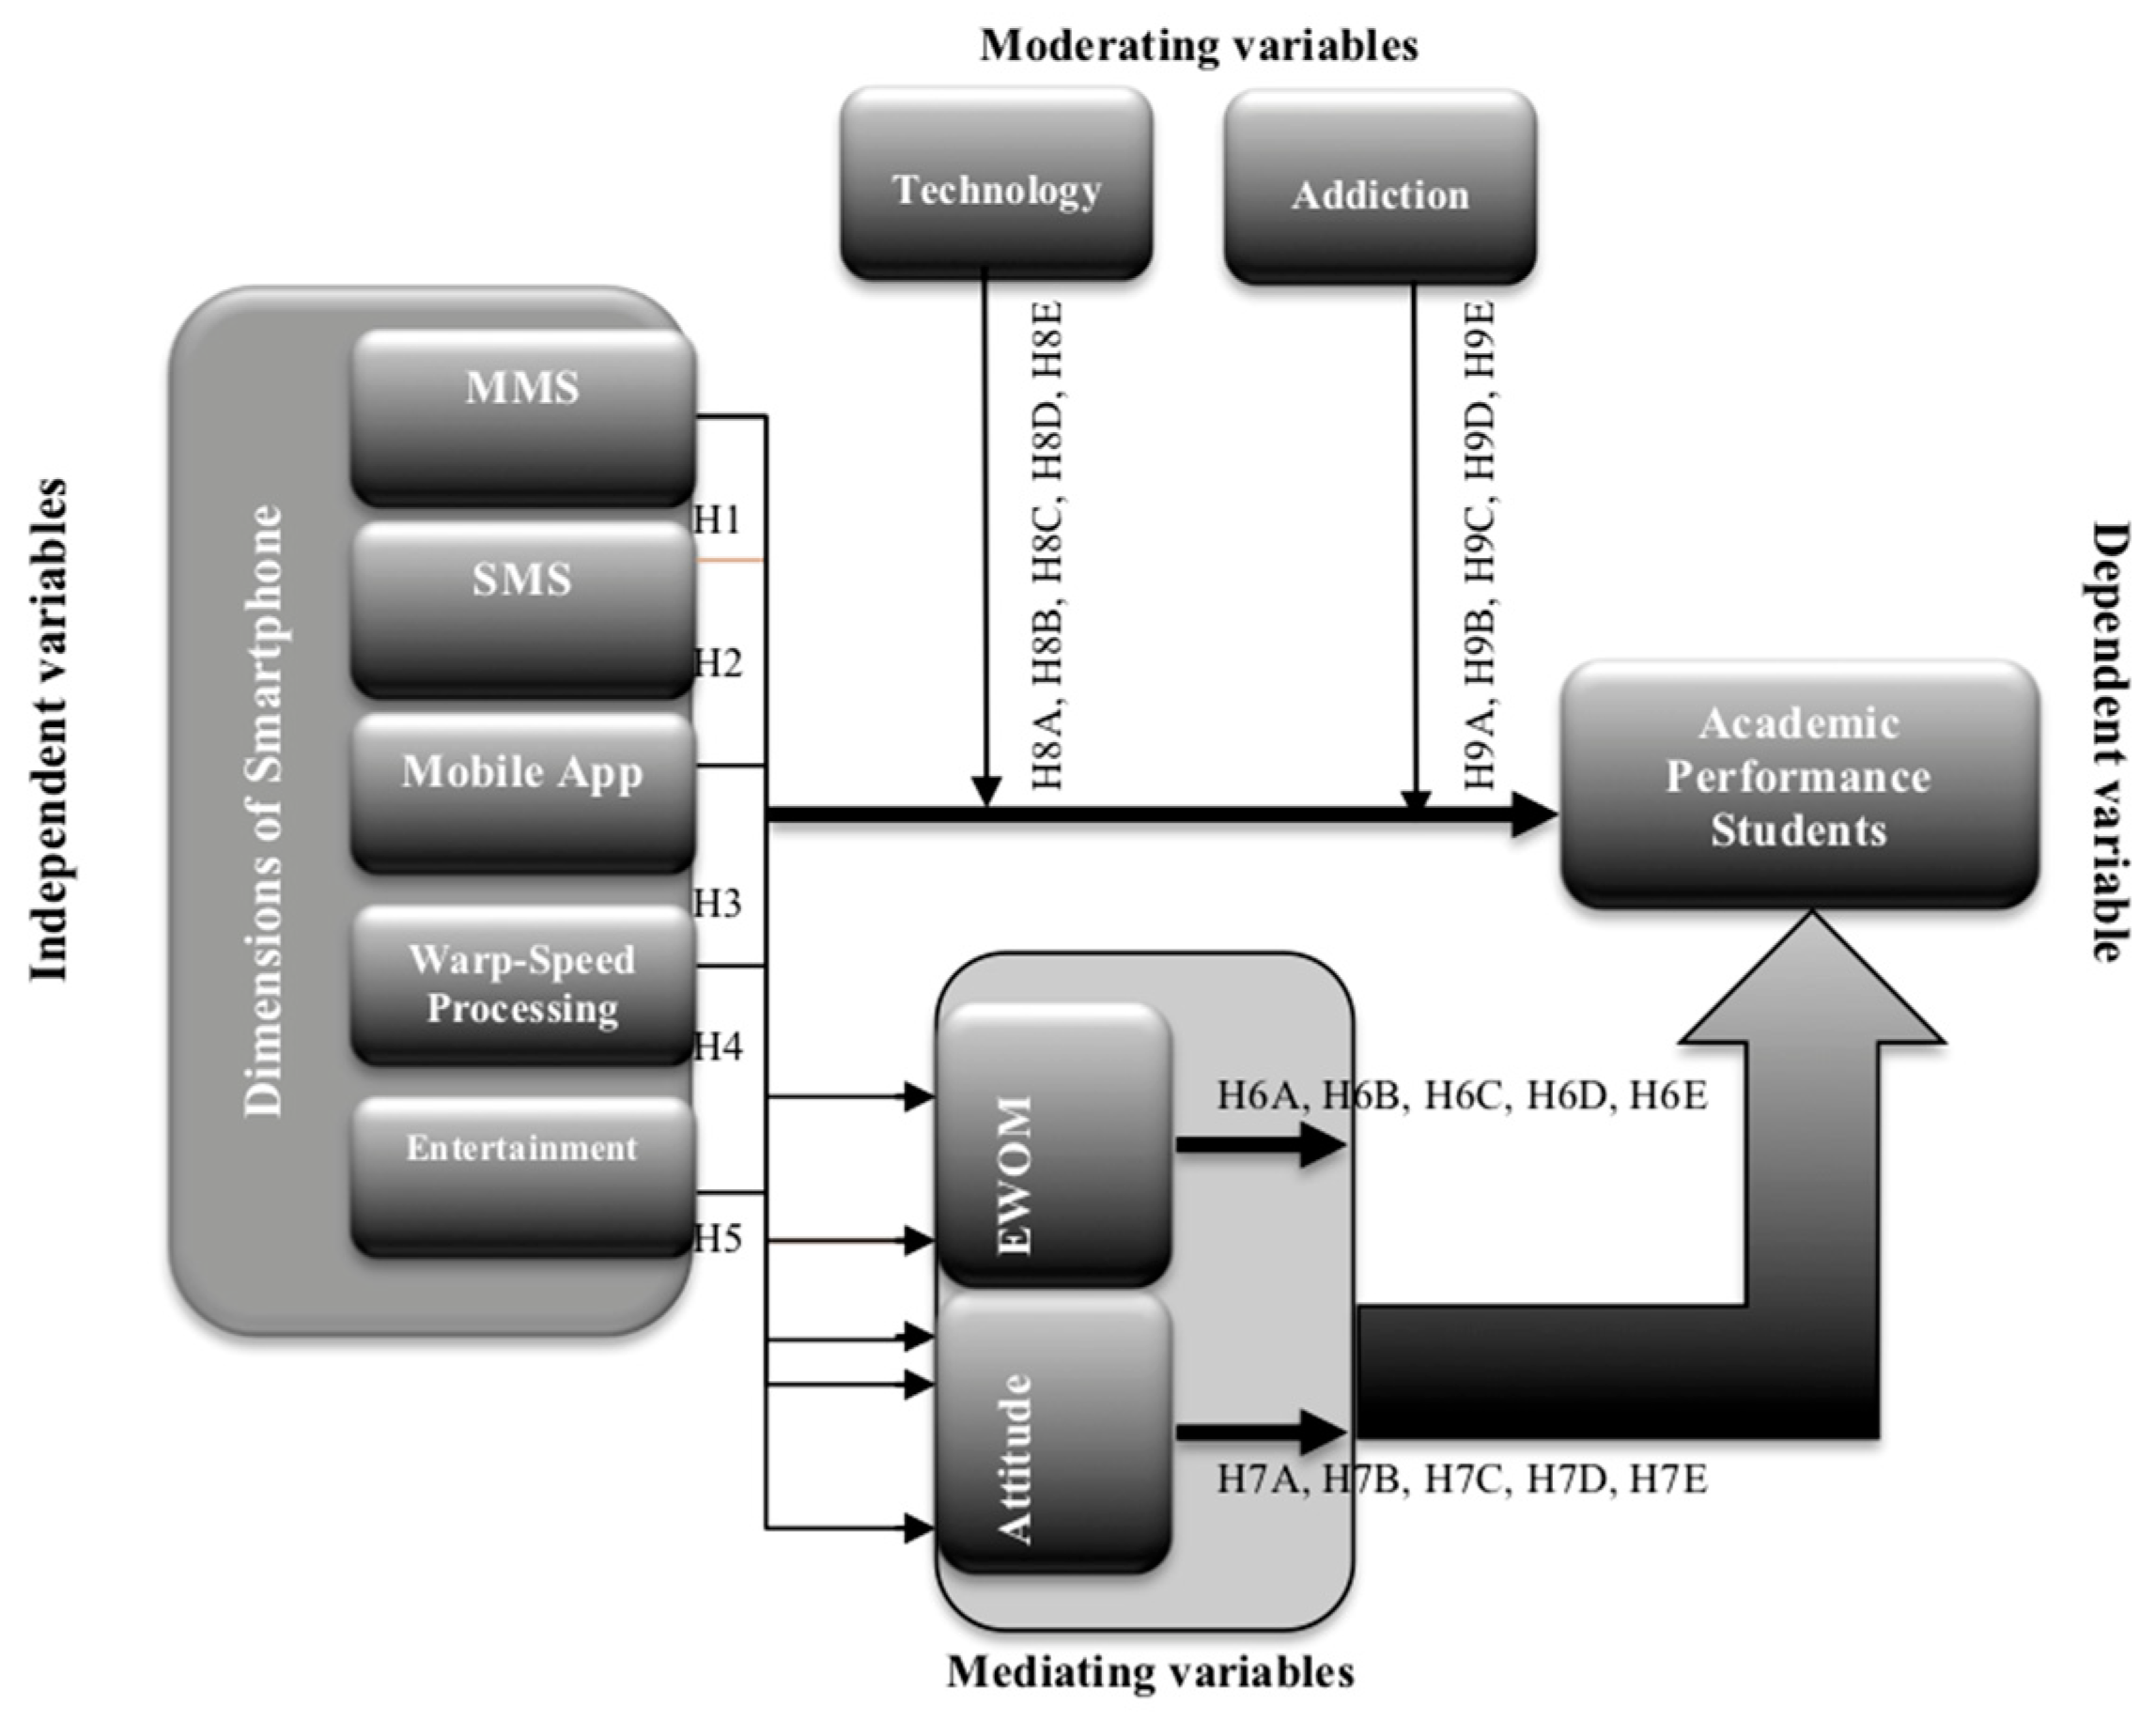
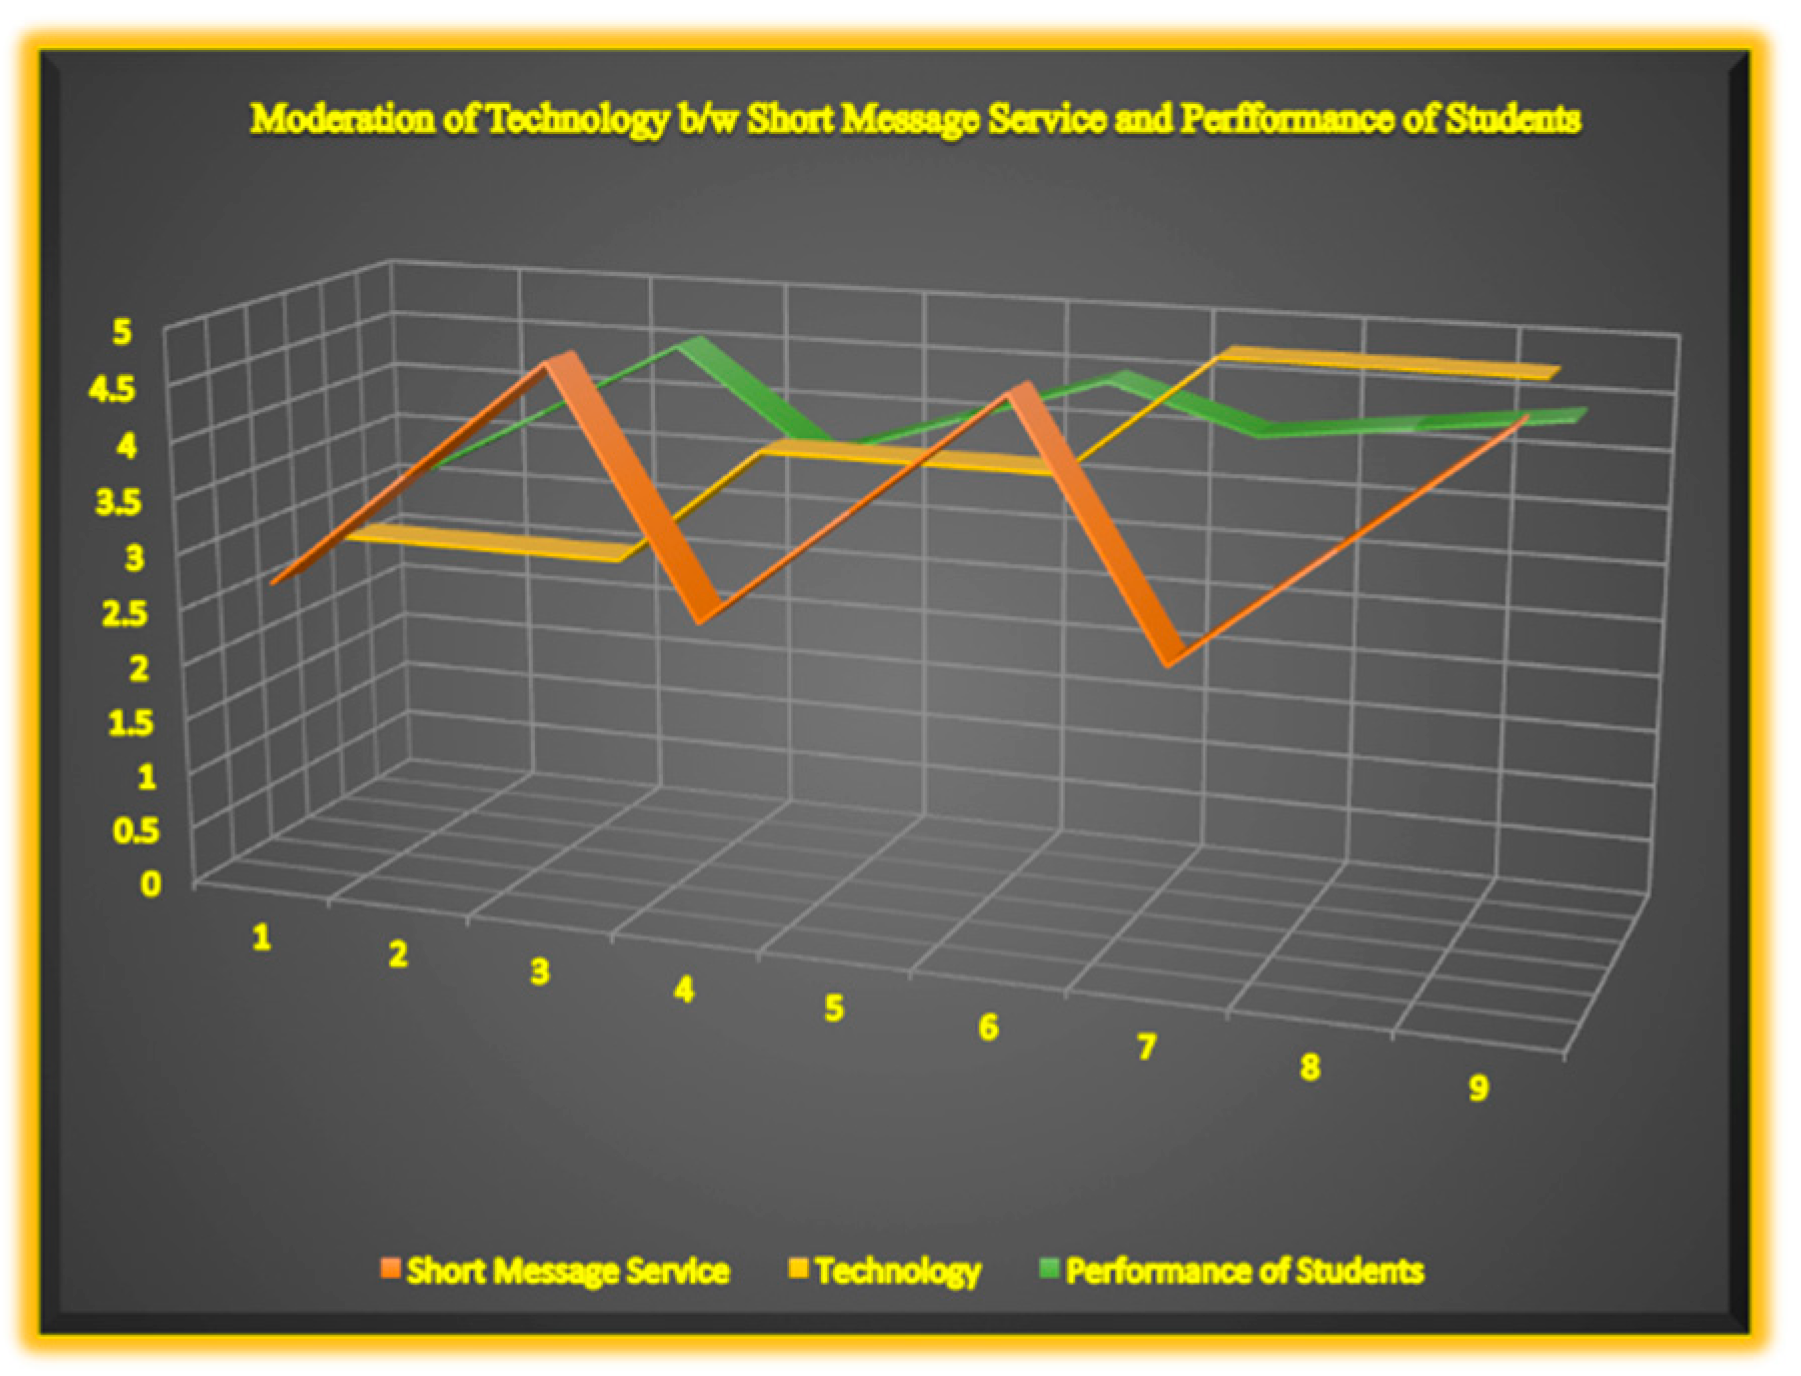
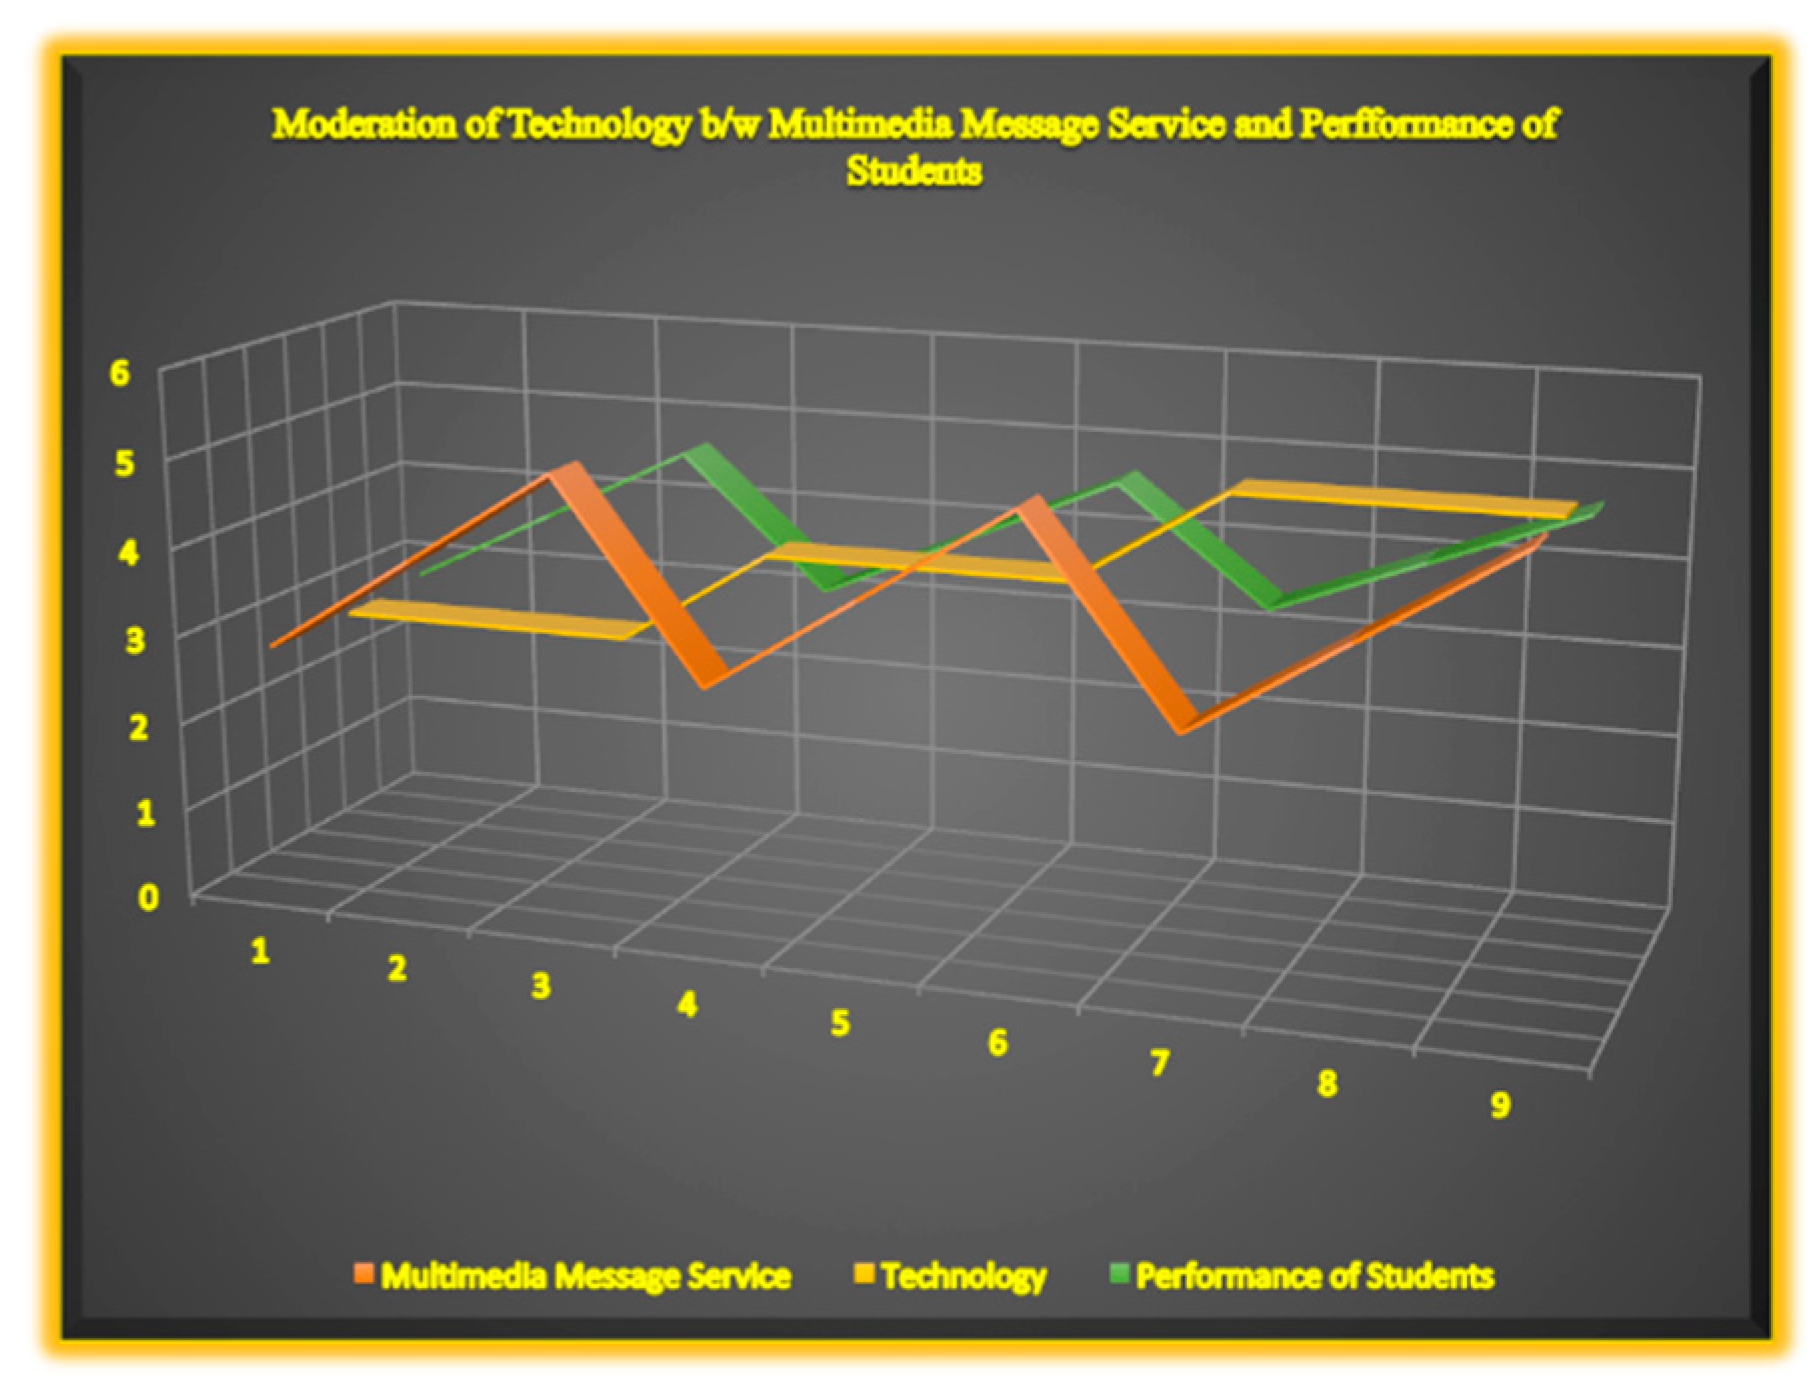
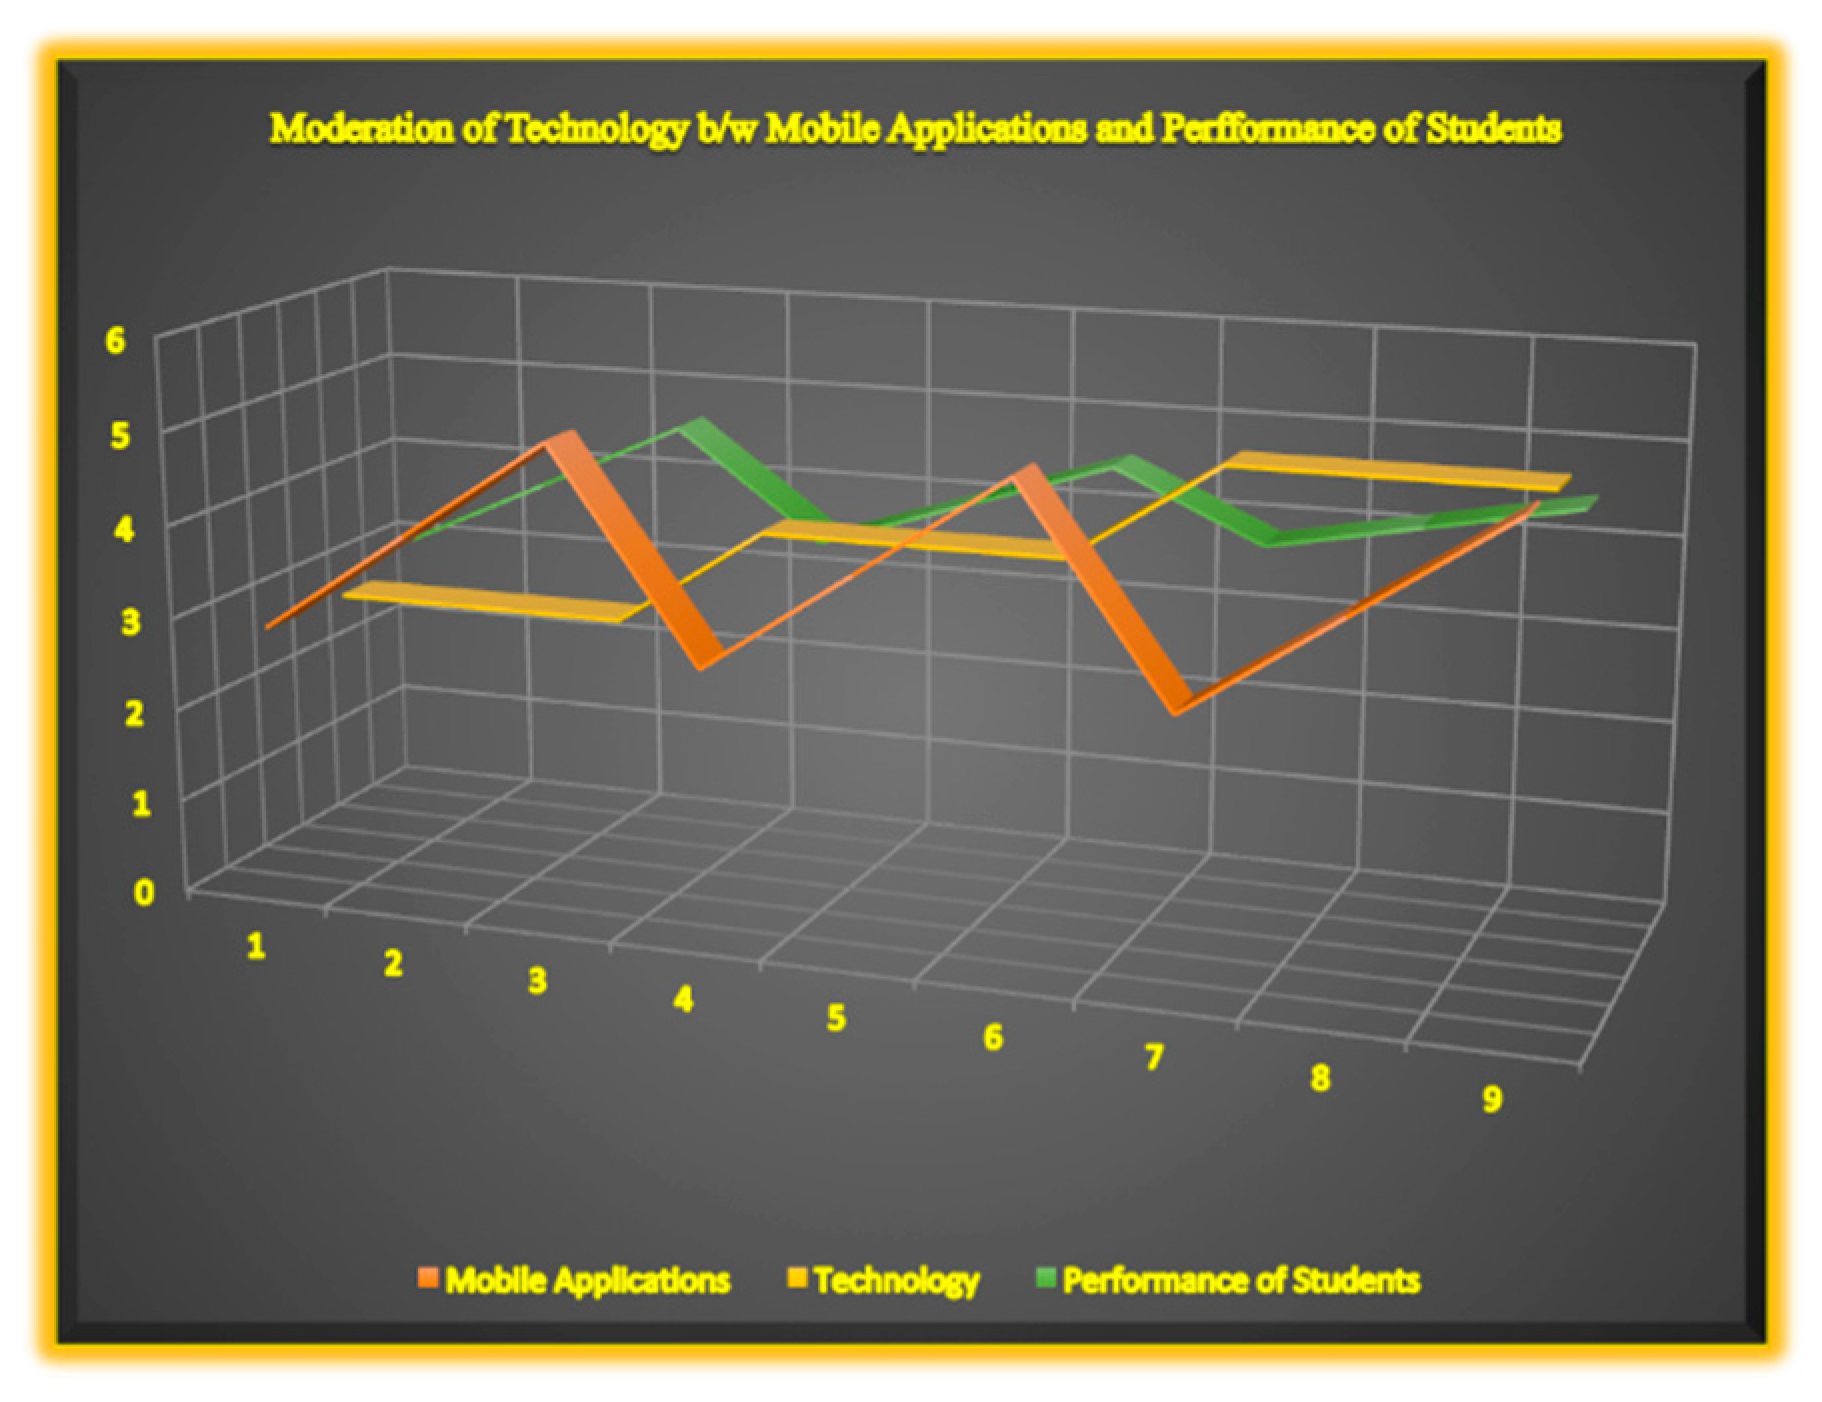
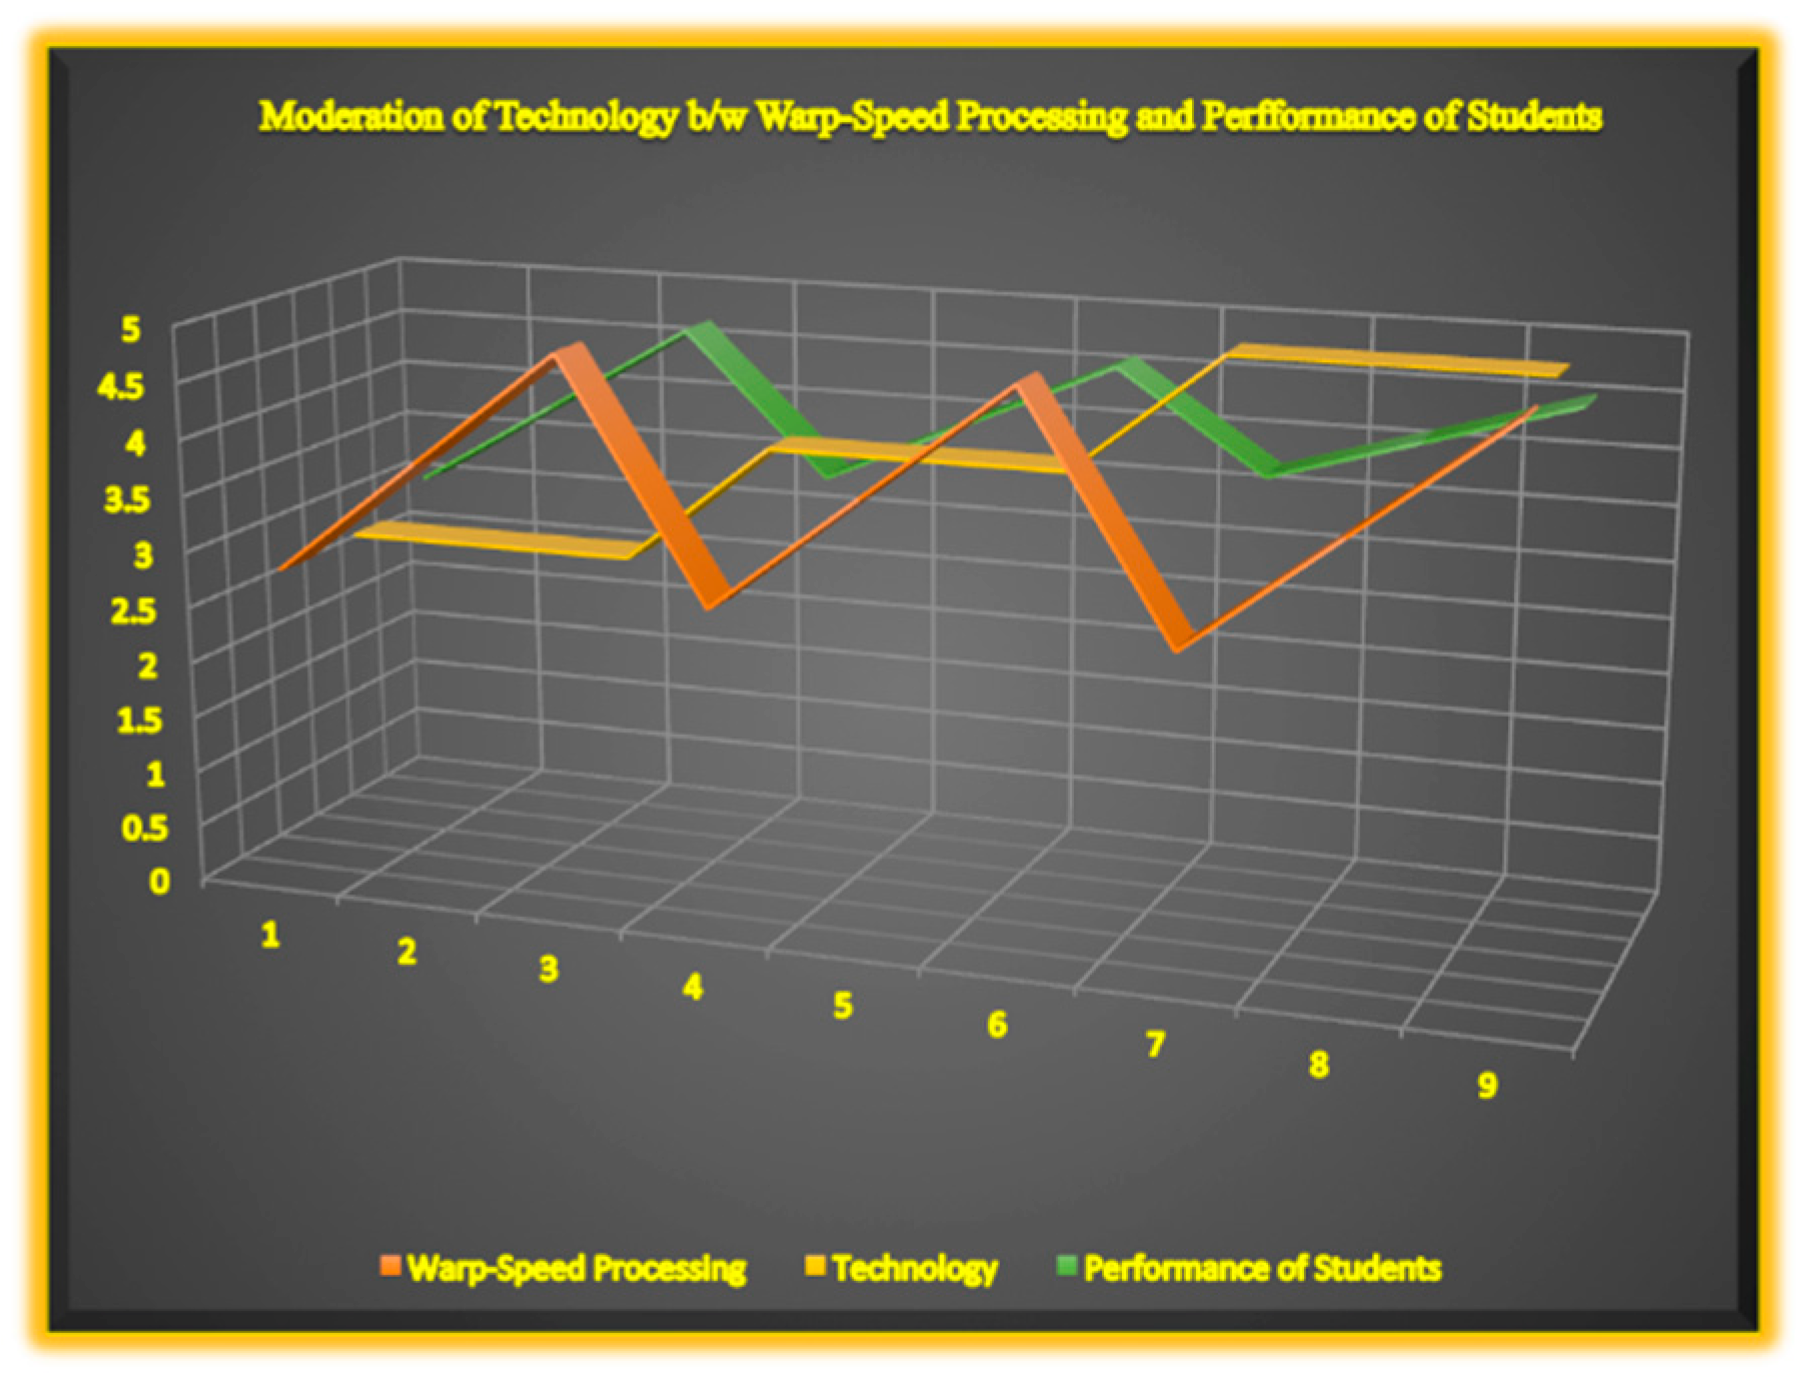
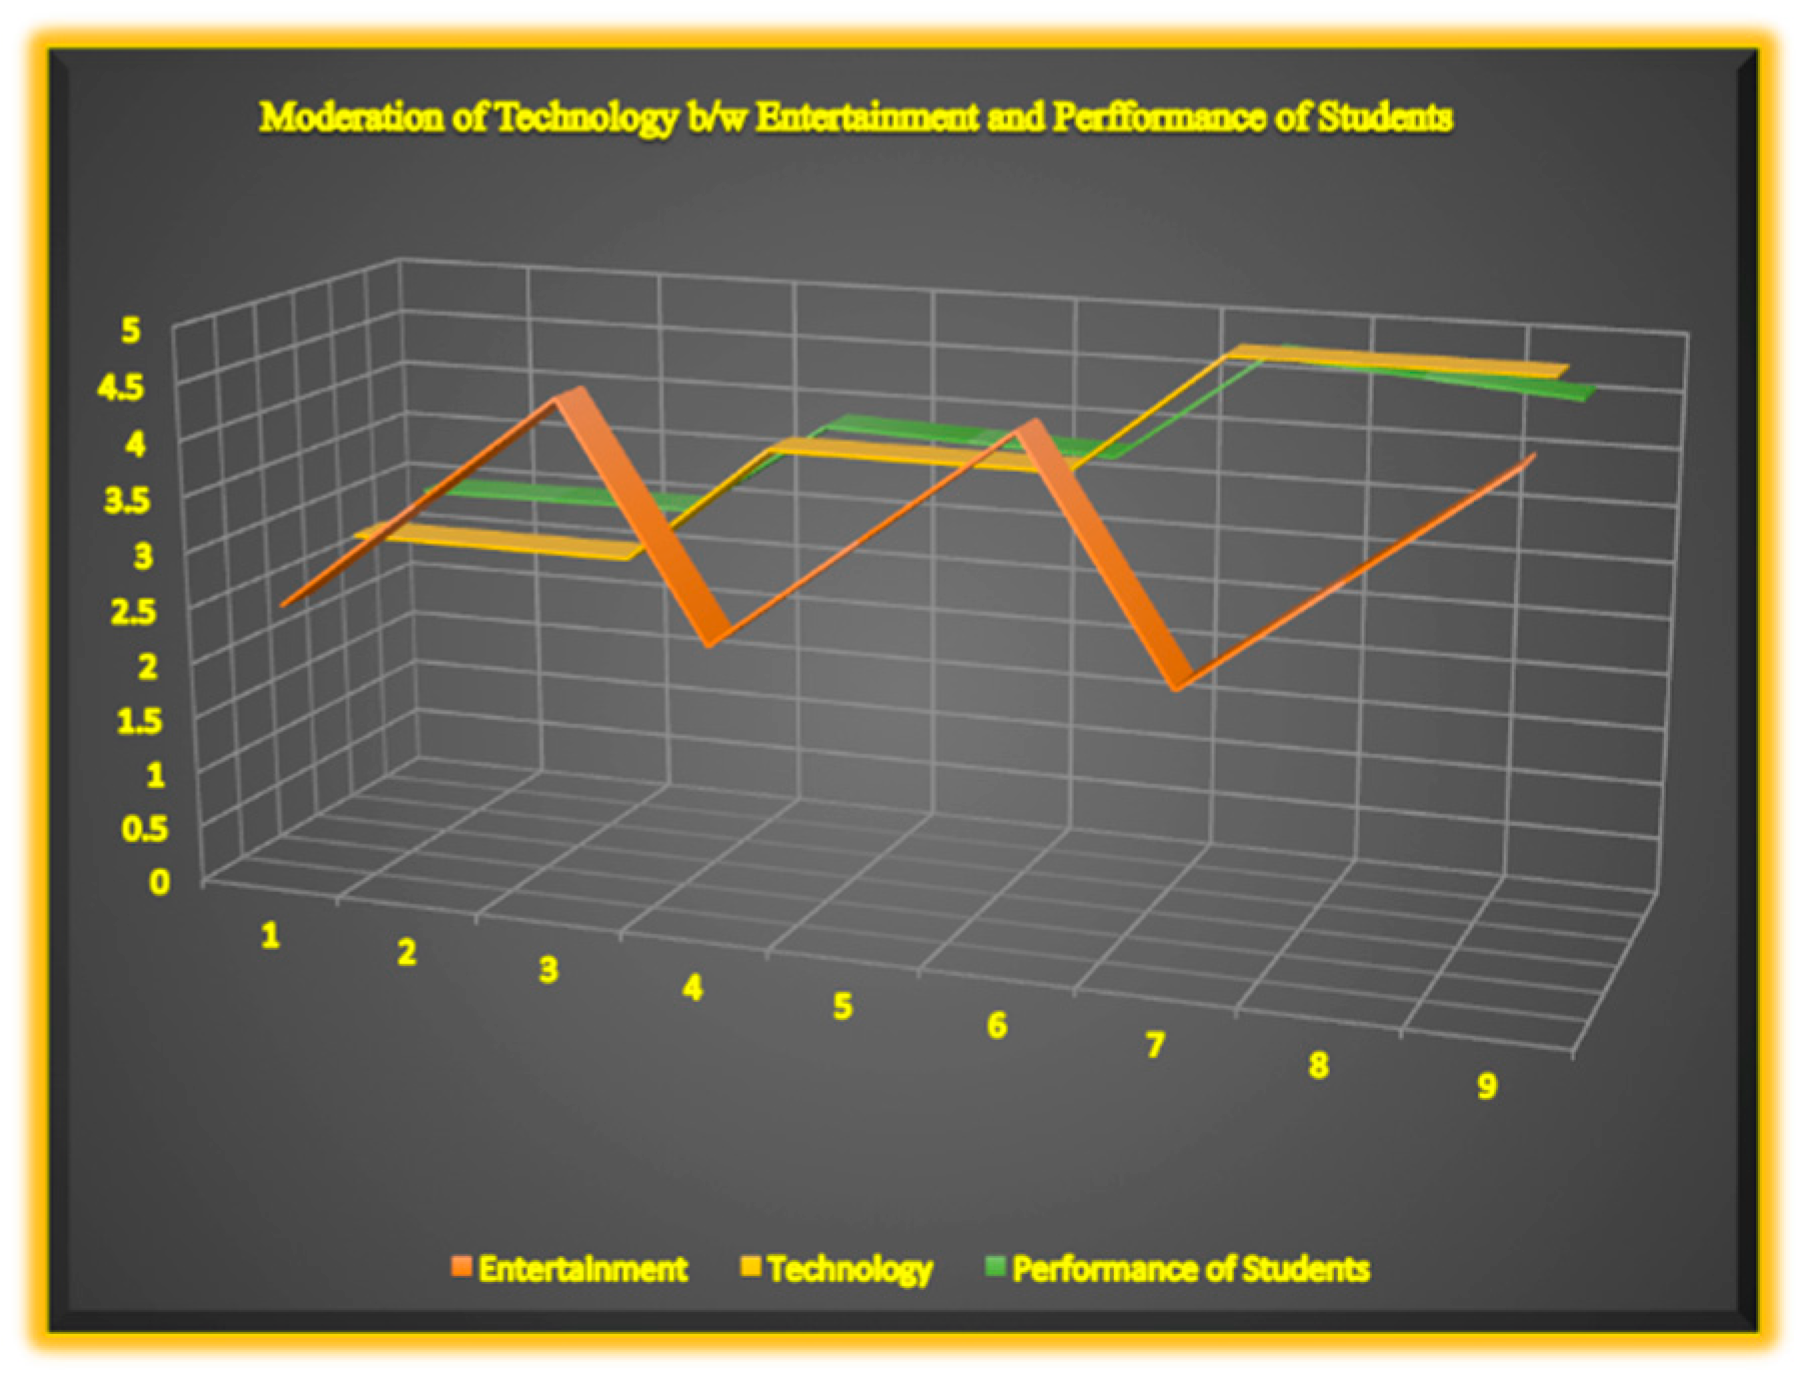
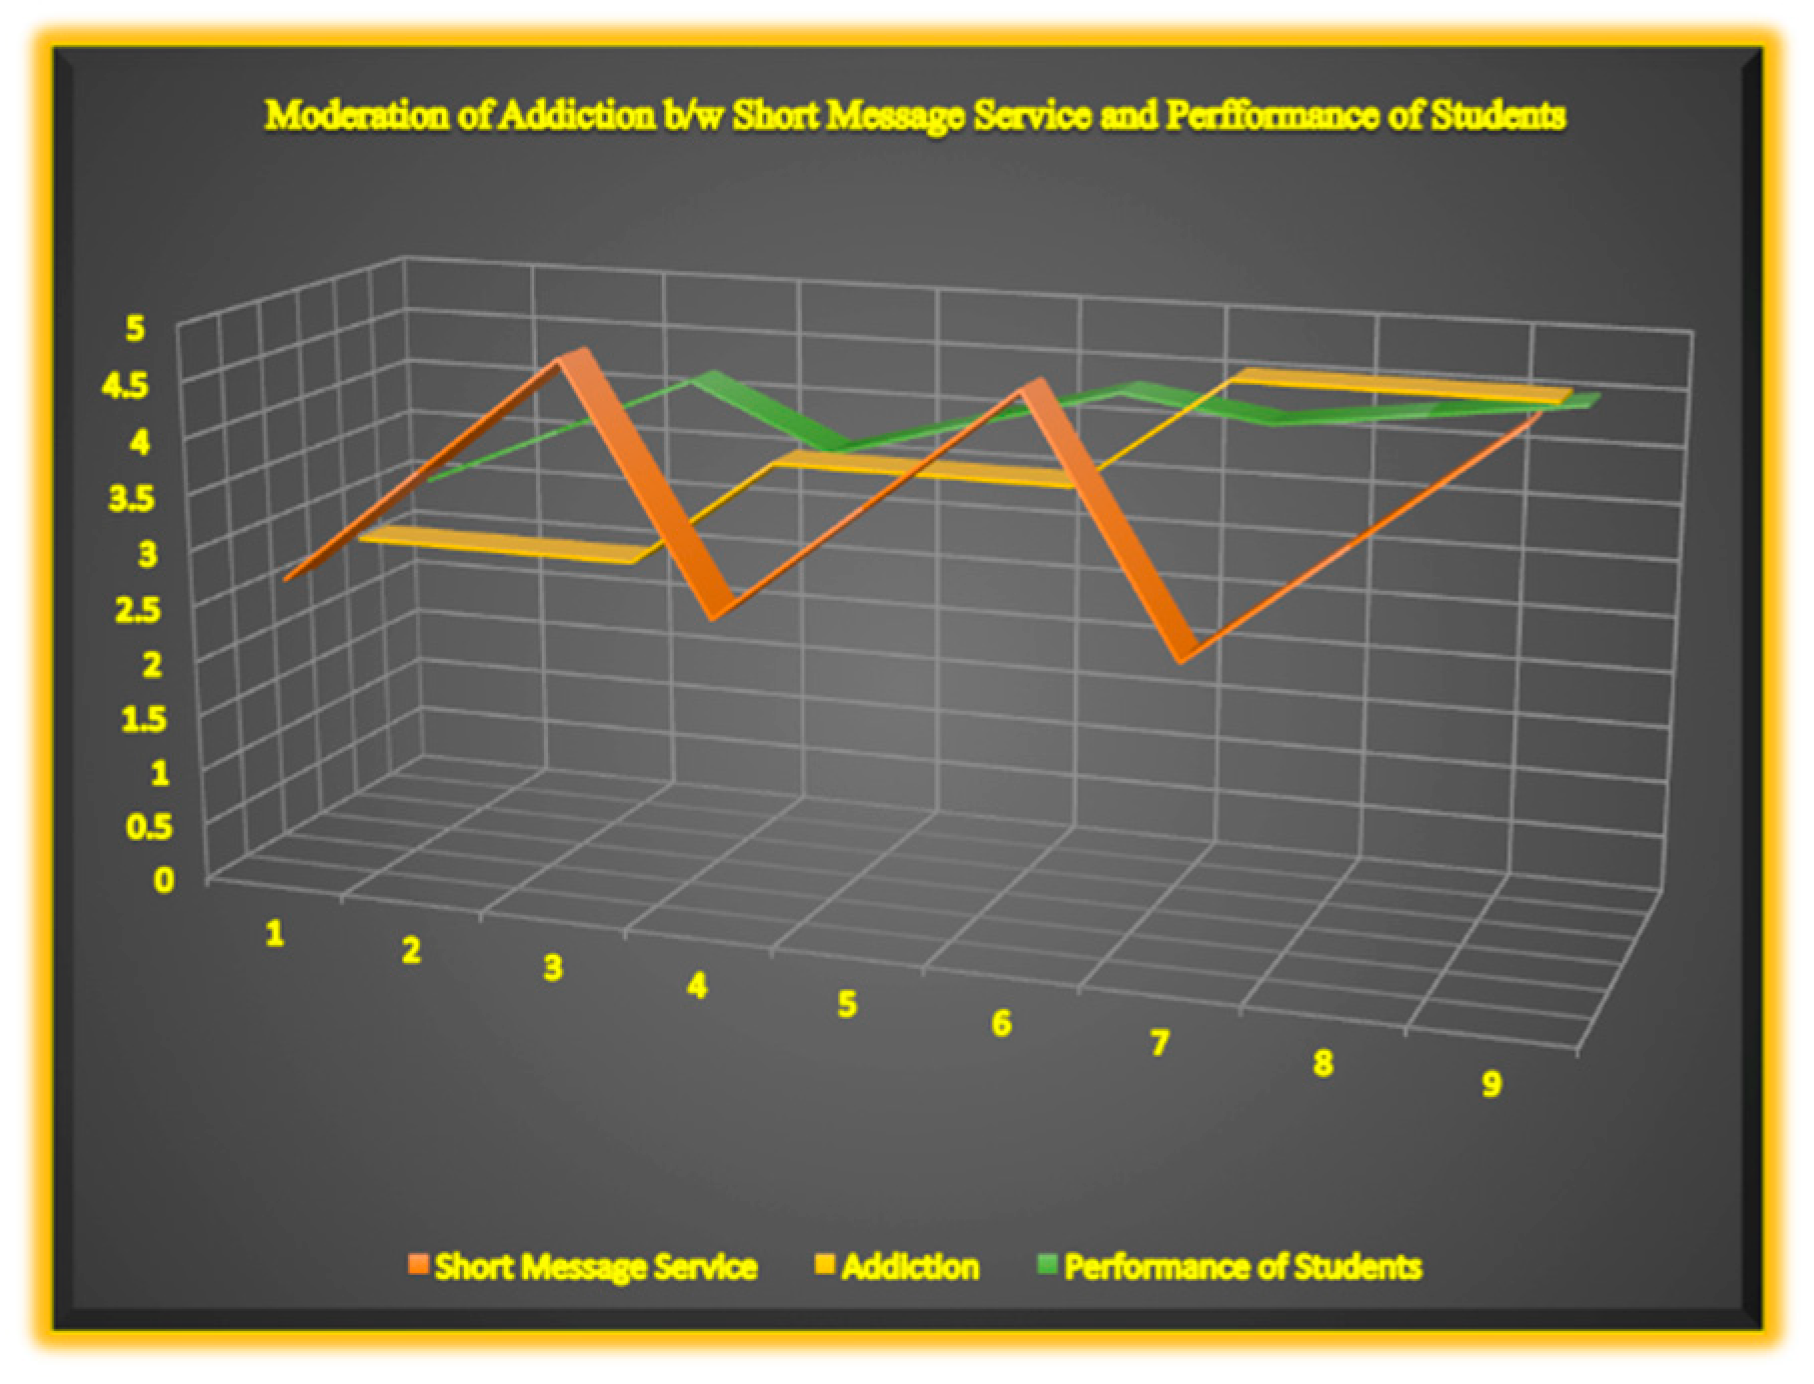
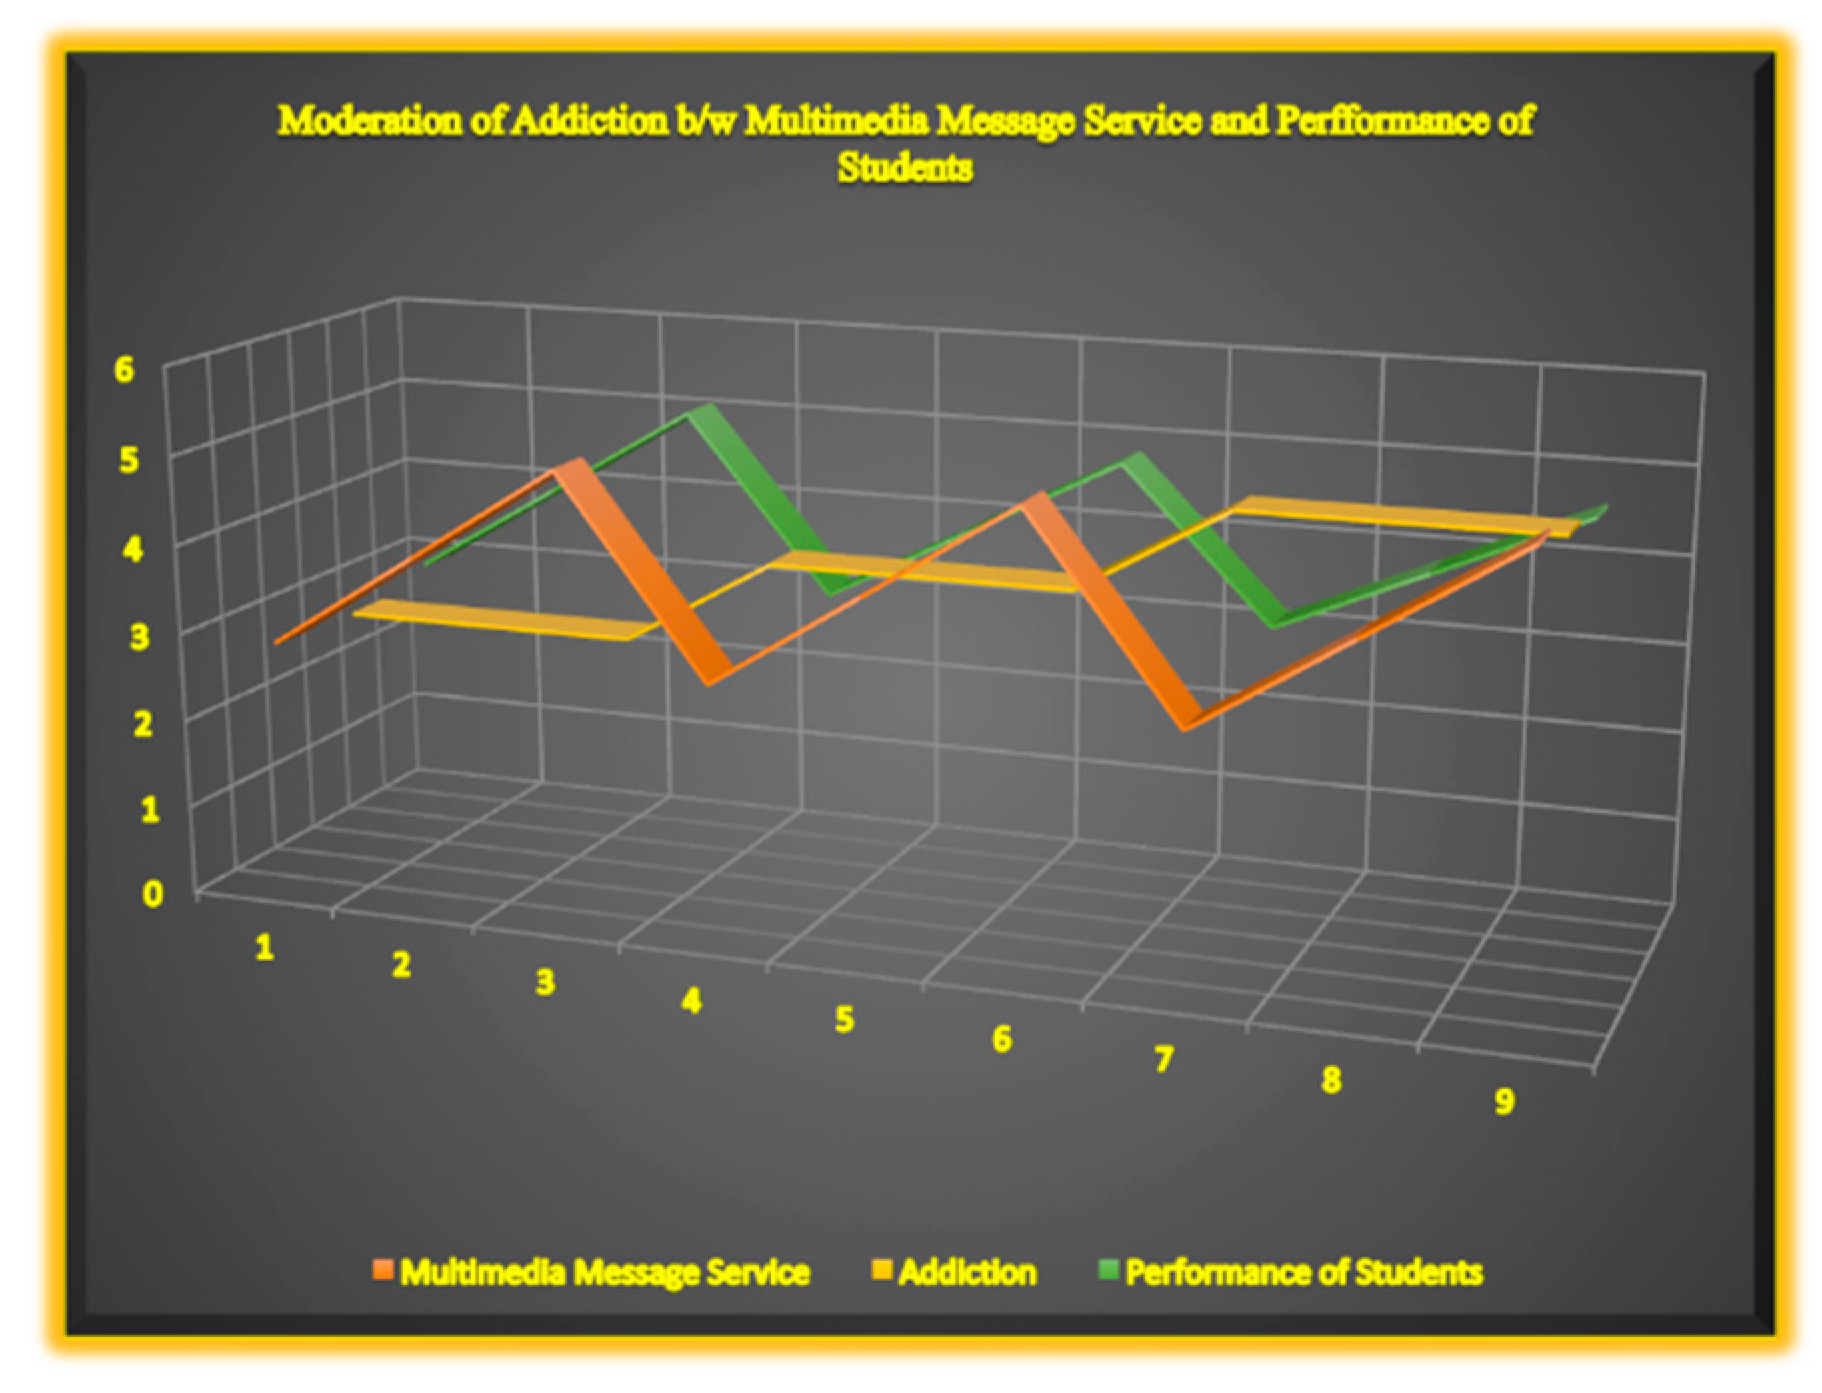
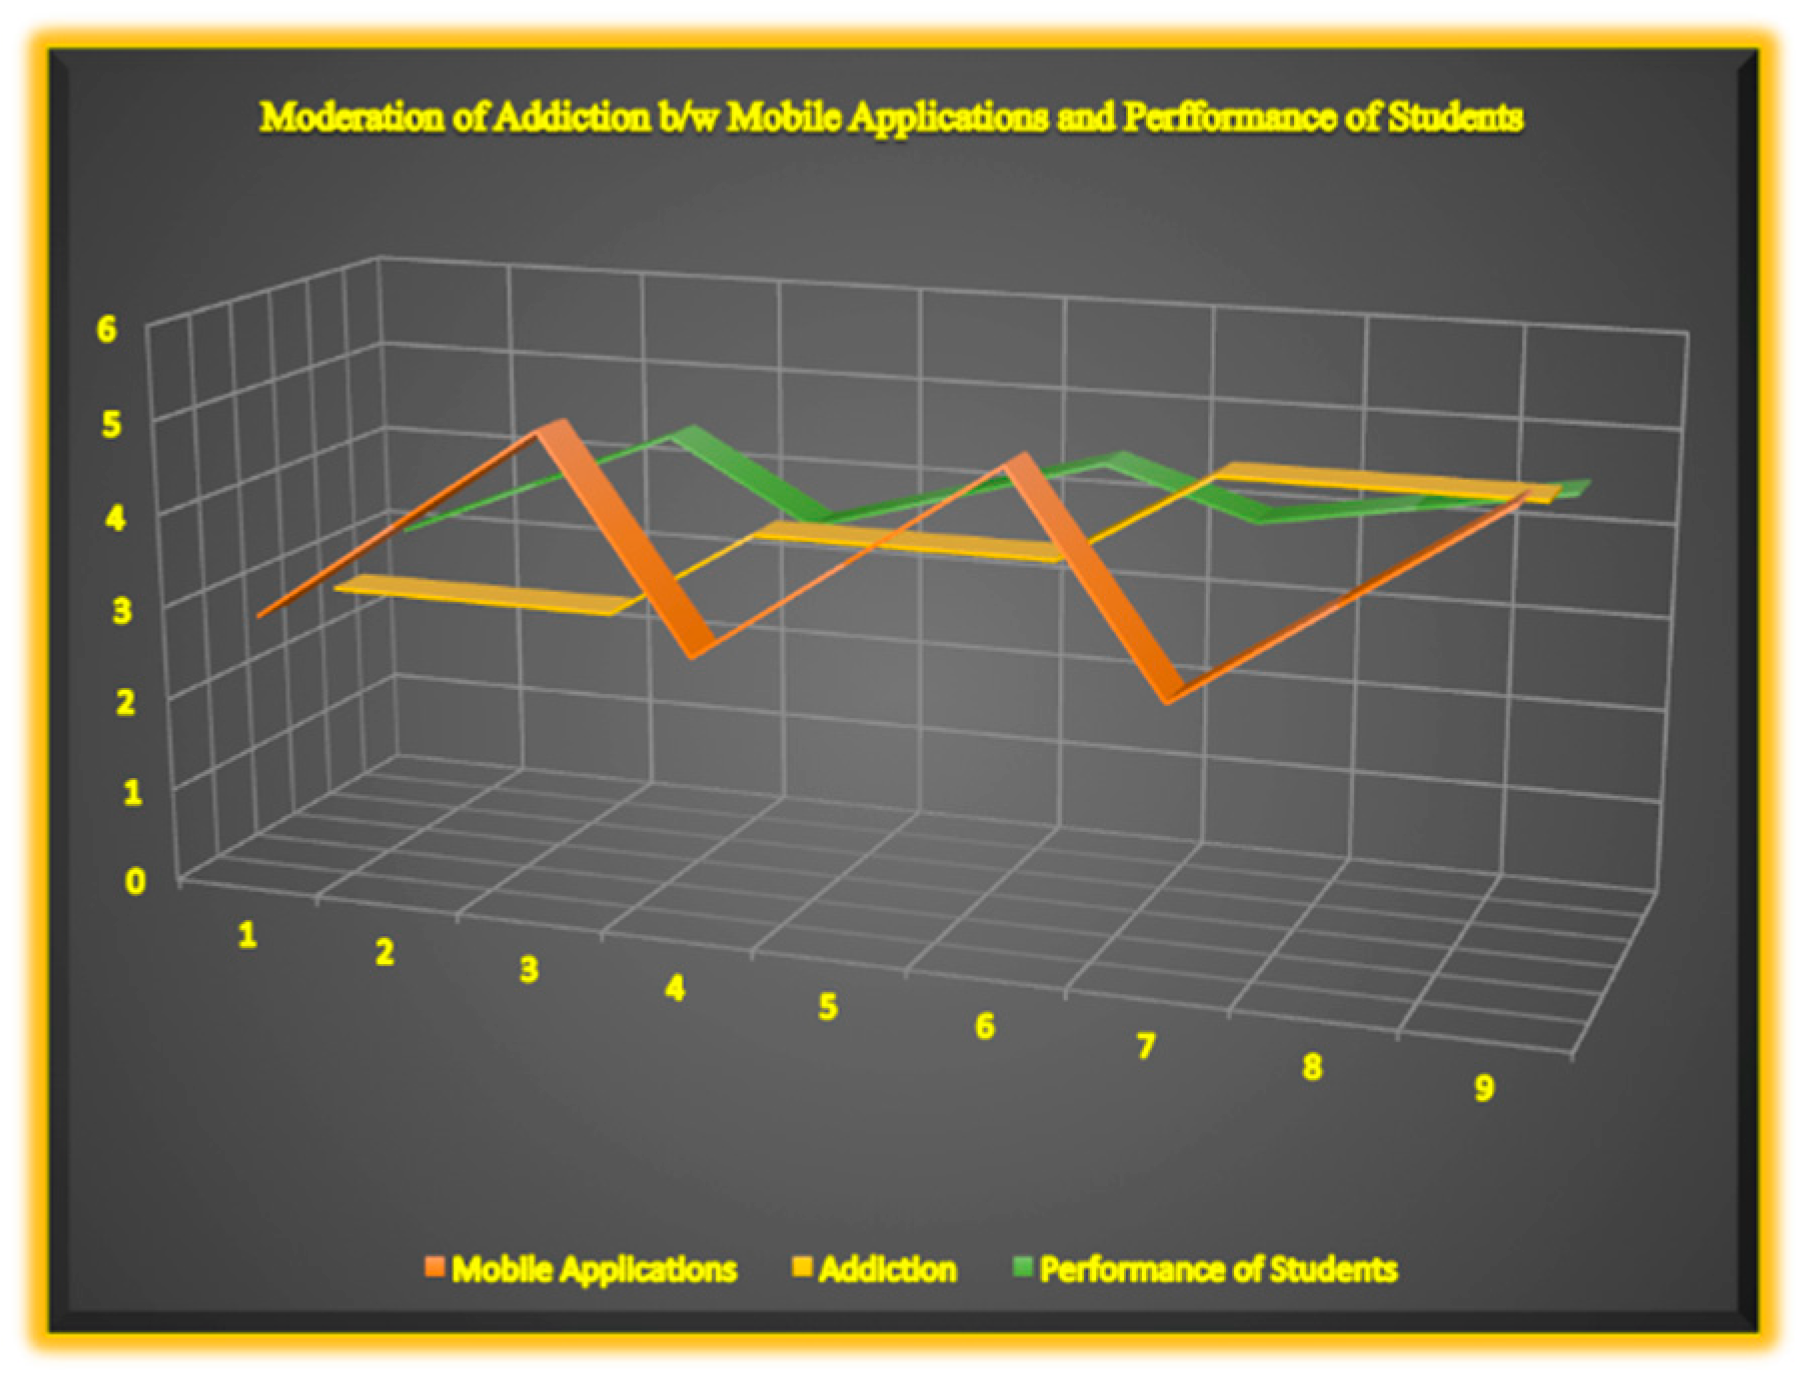
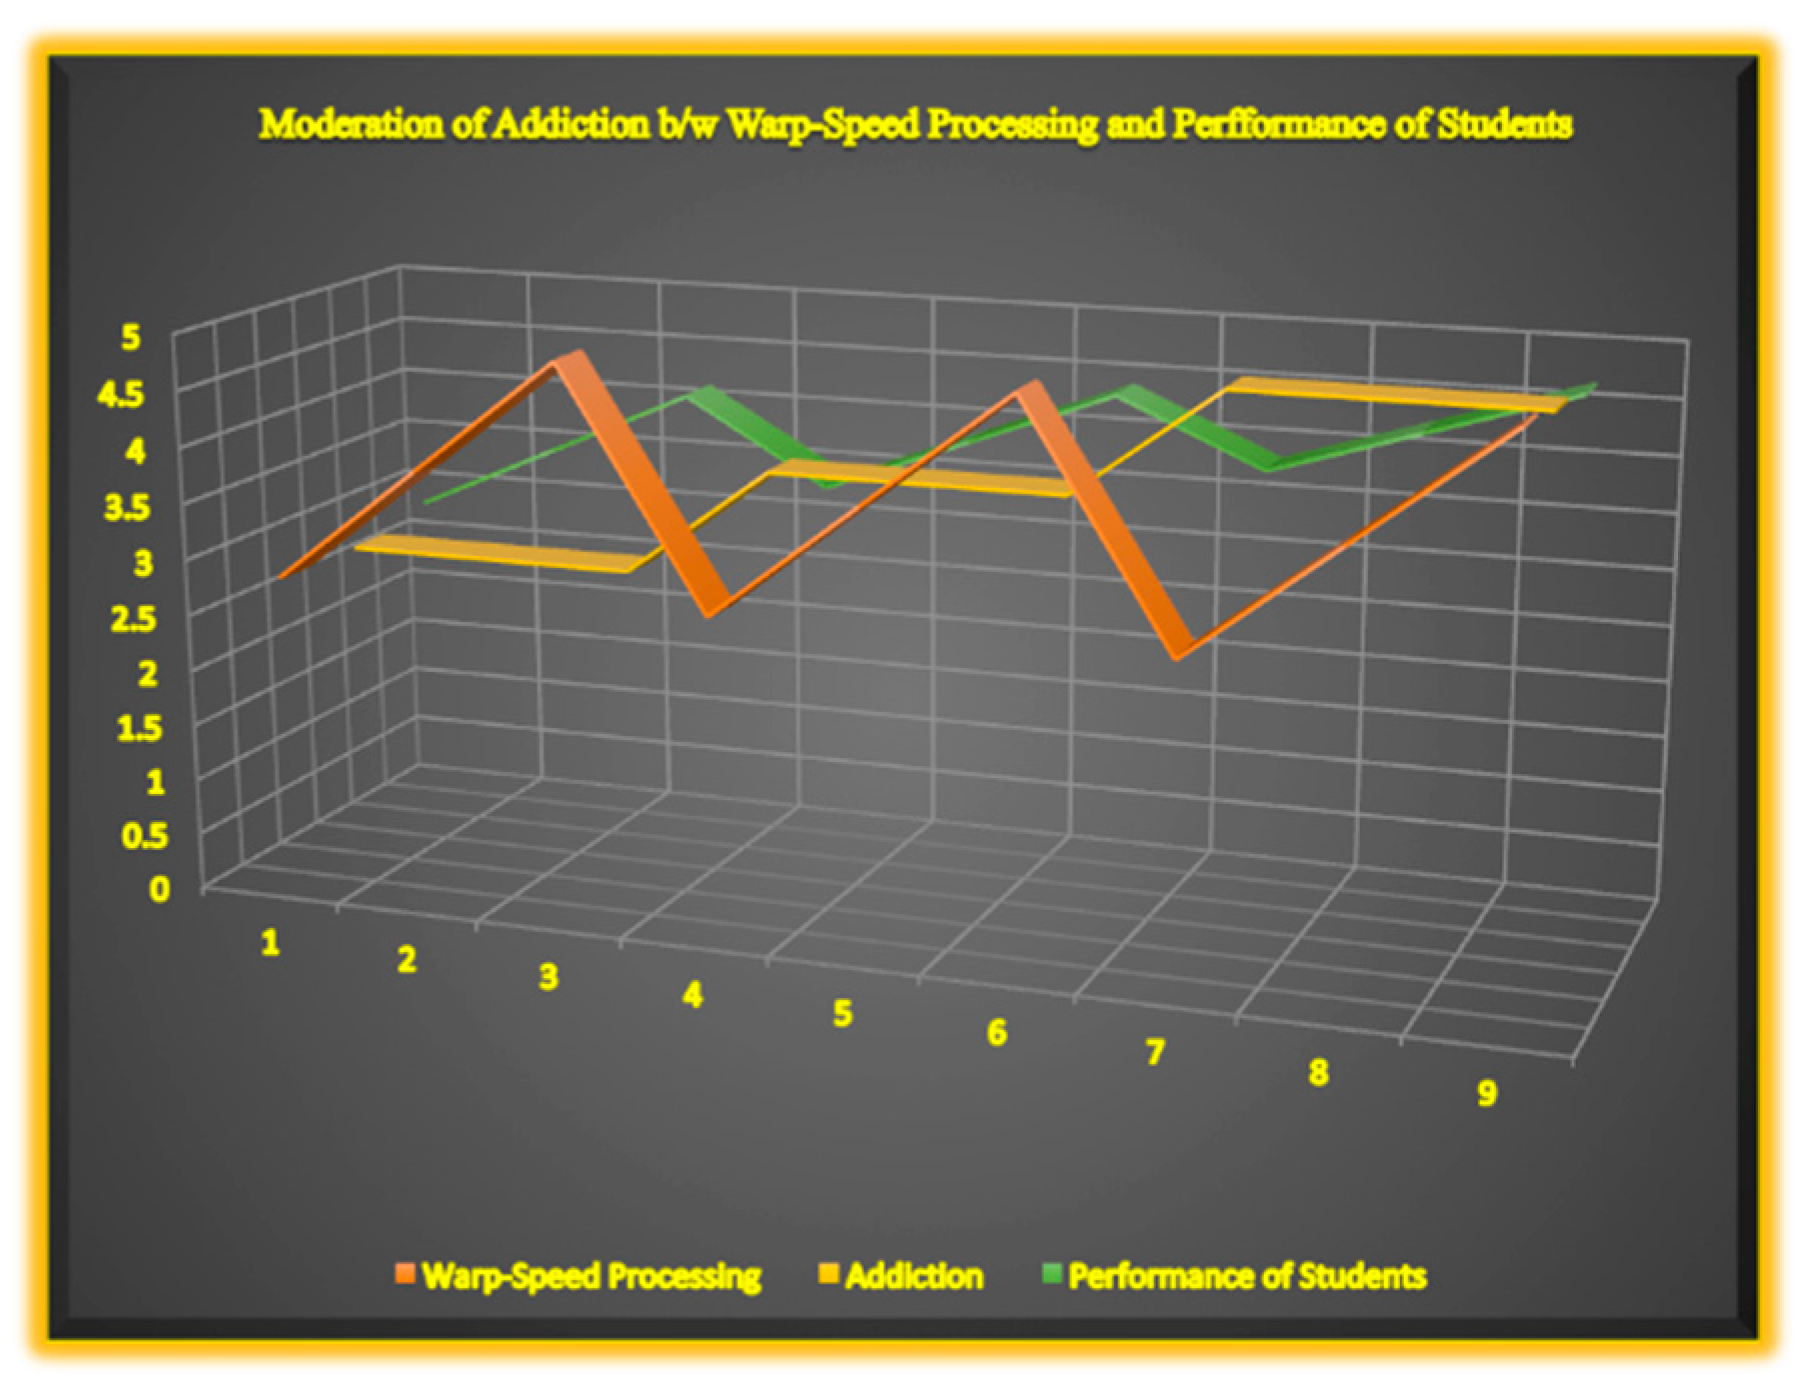
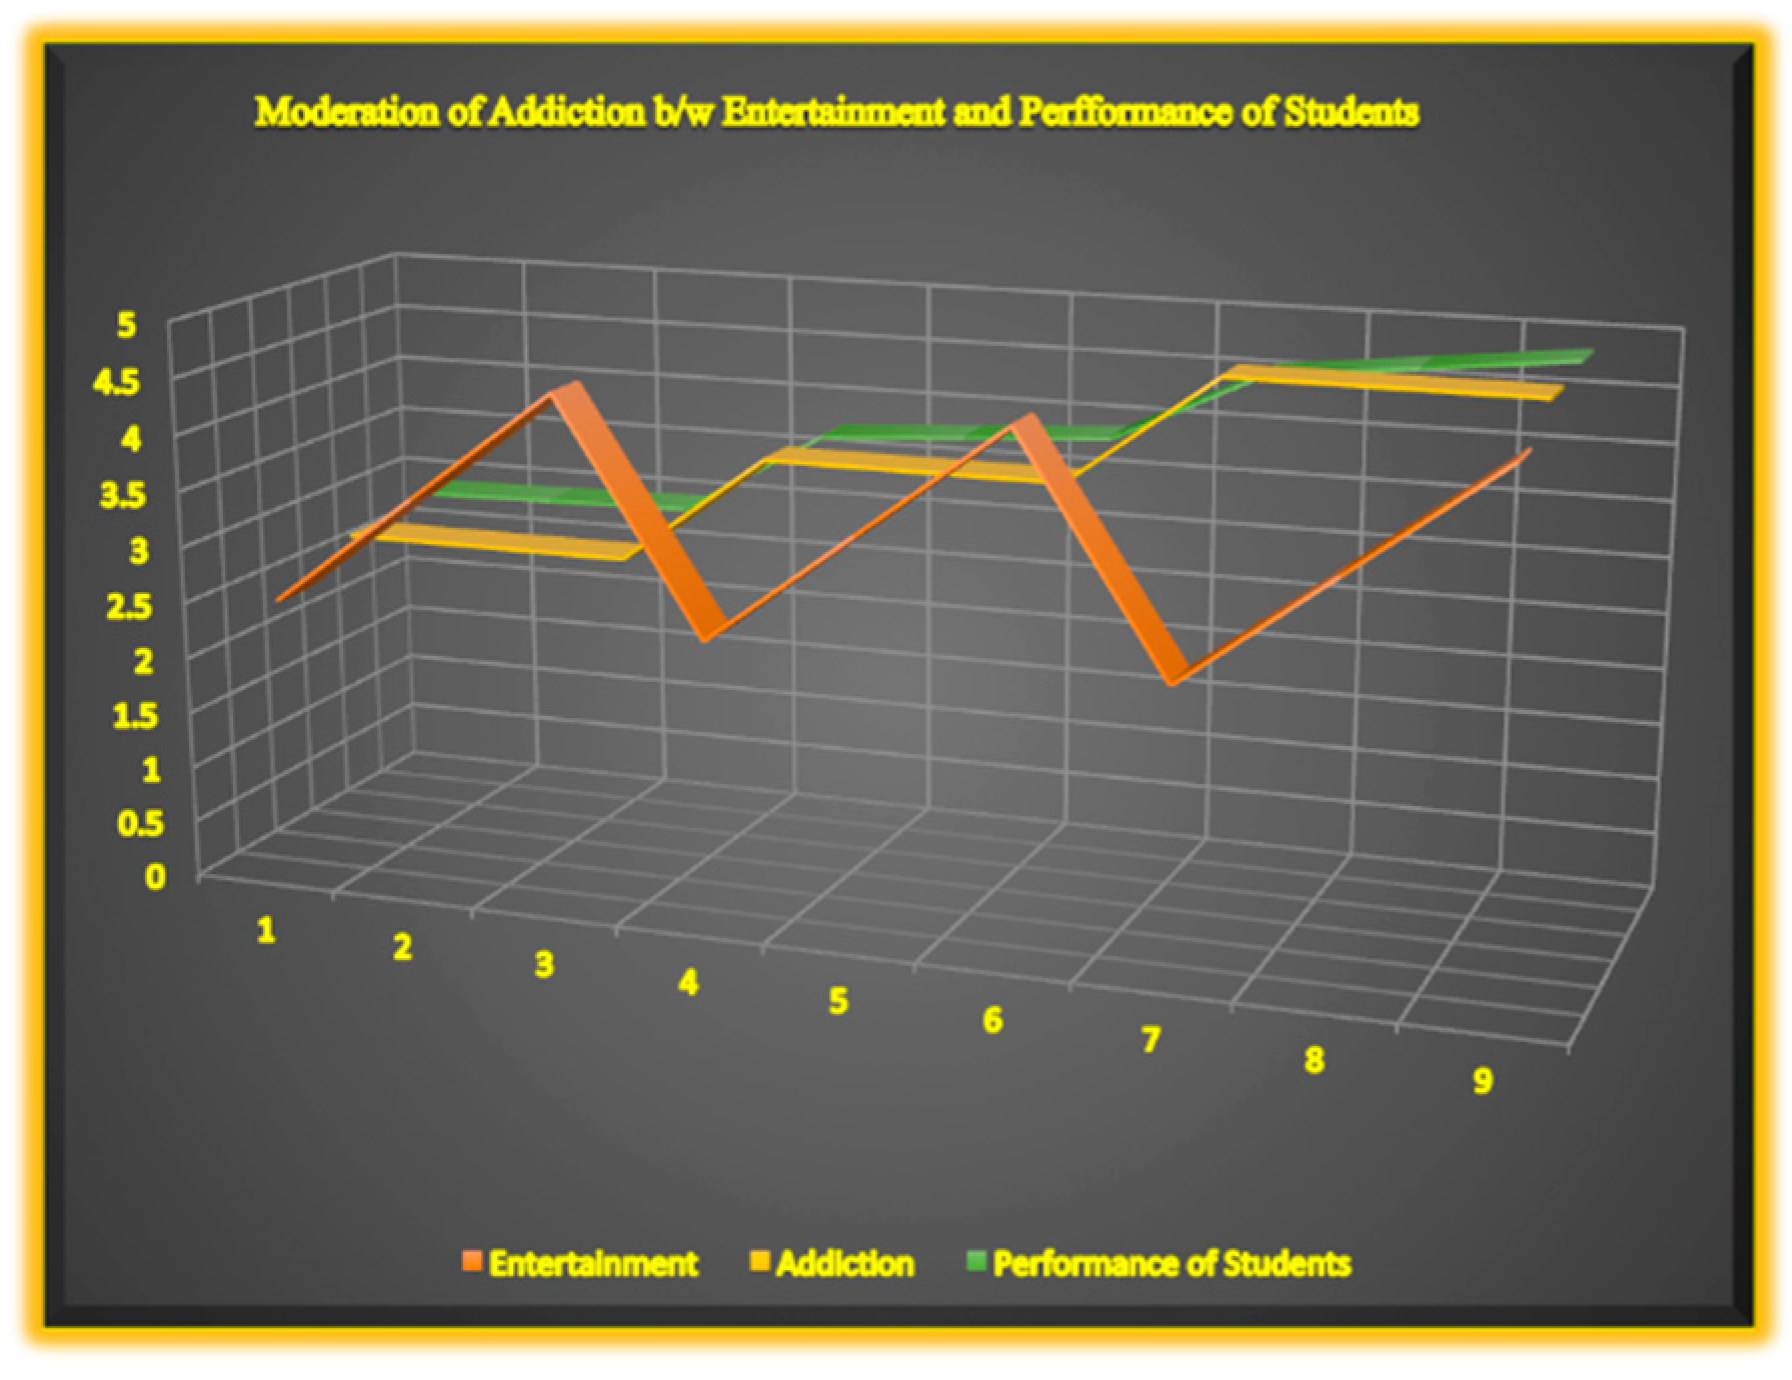