Article

The Coordinated Relationship between Investment Potential and Economic Development and Its Driving Mechanism: A Case Study of the African Region

1
College of Geography and Ocean Sciences, Nanjing University, Nanjing 210023, China
2
Institute of African Research, Nanjing University, Nanjing 2100232, China
3
College of Geographical Sciences, Southwest University, Chongqing 400700, China
4
College of Resources and Environmental Sciences, Hunan Normal University, Changsha 410081, China
5
Hunan Key Laboratory of Land Resources Evaluation and Utilization, Changsha 410007, China
*
Author to whom correspondence should be addressed.
Sustainability 2020, 12(1), 442; https://0-doi-org.brum.beds.ac.uk/10.3390/su12010442
Submission received: 23 November 2019 / Revised: 23 December 2019 / Accepted: 3 January 2020 / Published: 6 January 2020

Abstract

:
In order to analyze the coordination relationship between investment potential and economic development and its driving mechanisms, this study integrated the entropy weight method, coupling coordination degree model, exploratory spatial data analysis, geographic detector, and geographically weighted regression model. The developed approach was applied using data from 51 African countries from 2008 to 2016. The results showed that: (1) While the level of economic development in the African continent has increased steadily, the overall investment potential needs to be improved. The mean economic development index rose from 0.116 to 0.151, but the economic gap among countries was still highly evident. (2) Uncoordinated development and barely coordinated development level were the dominant types of relationship between investment potential and economic development in African countries. The spatial distribution showed significant agglomeration characteristics; the sub-hot spot and sub-cold point regions maintained strong dependence with their hot spot and cold point counterparts. The hot spot areas gradually formed an agglomeration in Southern Africa and highly fragmented distribution in other areas. The cold spot areas formed a spatial distribution pattern of “one core and one belt” with some countries in Western Africa forming the core, while some Central and East African countries constituting the belt. (3) The coordination relationship between investment potential and economic development was influenced mainly by factors including economic base, residents’ living standard, industrial construction level, information support level, and business friendliness. Using geographically weighted regression coefficient distribution of indicators, the driving mechanisms of spatial distribution could be divided into five types: economic base driven, industry-driven, information application-driven, business convenience-driven, and consumer market-driven.

1. Introduction

In the era of economic globalization, international investment and trade have become more ubiquitous and profitable, becoming essential engines for stimulating global economic growth. Enhancing the competitiveness of marketable goods, promoting the development of industrial technology, reducing fund shortages in host countries, and optimizing the structure of foreign trade commodities are critical in boosting global trade [1]. With the growing trend of international investment liberalization and the exponential rise of transnational investments [2,3], the difficulties faced by transnational investors and host countries are becoming more and more complex. Transnational investors have limited understanding regarding the host country’s economic conditions, trade risks, market operation uncertainties, and government regulatory risks [4], which could lead to difficulties in controlling investment costs and projecting prospects and profits and could eventually result in investment losses. Meanwhile, insufficient consideration is given by host countries towards improving the domestic investment environment, making it challenging to formulate reasonable and attractive foreign investment policies [5]. As a result, critical opportunities in attracting investments and technical upgrades could be overlooked. Establishing a scientific investment potential evaluation index system becomes particularly important in determining investment orientation and avoiding investment risks [6]. The static analysis of investment potential based on the entropy weight method (EWM), the grey correlation degree model (GCDM), factor analysis (FA), and data envelopment analysis (DEA) has percolated into the mainstream of current researches [7,8]. However, this static analysis has largely evaded the impact of economic cycle changes, resulting in a lack of long-term reference for investment potential. Most scholars have used investment hotspots of Western Europe and North America as research objects and have paid little attention to the evolution of investment potential of other regions such as Africa, Latin America, and Southeast Asia in the context of economic globalization. Some scholars have established investment potential evaluation systems using fundamental indicators such as GDP and population size. However, these assessment systems have limited capacity to understand the impact of resource development, economic environment, open environment, entrepreneurial environment, and other development systems on investment potential. Establishing an evaluation index system that comprehensively reflects the investment potential is crucial in analyzing the evolution of investment potential of underdeveloped regions.
The investment potential and economic development have the coordination relation of mutual influence, mutual connection, and mutual restriction. The level of economic development of the host country provides an essential guarantee for the improvement of investment potential, which can influence the level of government investment in infrastructure construction, the living conditions of communities, and various market activities and can directly be related to the commercial space of transnational investment and operation. In the context of the relative stability of the international market environment, the global economy, and the political structure, the investment potential is positively related to the international investment in the country. This could have direct influence on the fixed capital accumulation of the host country, the choice of corporate layout, the modernization of the production management concept, and improvement of the technological level of the host country, providing the host country with a driving force needed for economic development. In the era of global trade, the failure to establish a suitable investment environment can lead to significant reduction in foreign capital investments, which is not conducive to the overall development of the domestic market economy and creates difficulties in guaranteeing a stable trend of economic growth. The lack of investment policies, foreign capital utilization, and management levels result in insufficient conversion of investment potential into economic development, which will subsequently have an adverse impact on the host country’s economic development and cross-border investment operations. Studies on the synergistic relationship between investment potential and economic development have highlighted the reference value for both the host country and transnational investors. At present, only a limited number of studies have been conducted regarding the relationship between investment potential and economic development [9,10,11,12,13]. In contrast, the relationships between urbanization, economic development, ecological environment, and other subsystems have widely been investigated using the coupling degree model (CDM) and the coordination model (CM). Researchers have become inclined to use analytical techniques, such as trend surface analysis, the Markov chain model, and the standard deviation ellipse model, to study the temporal and spatial evolution characteristics of coordination relations [14]. More recently, the use of GIS technology has provided new paths for analysis in this field [15]. However, the internal driving mechanism of the coordination relationship and differentiation has been investigated sparingly, creating difficulties in providing refined and targeted support for policy and decision-makers. While scholars have done a lot of work in analyzing and comparing the strengths of the coordination relationship between regions, they have largely neglected to understand the effect of the lag attribute in the subsystem, which impedes the necessary adjustments to the national macroeconomic policies. Thus, more attention ought to be directed towards the classification and determination of coordination relationships and the driving mechanism of spatial distribution difference.
African countries were selected as the research subject in this study, as shown in Figure 1. Since the start of the 21st century, Africa has gradually become a hotspot for global investments [16,17]. In 2016, foreign direct investment (FDI) inflows in Africa reached US $59.4 billion. FDI has become one of the essential catalysts driving African growth and development. The efficient reduction of investment risks and the adoption of appropriate investment policies have become principal concerns for African countries in the new era. With these in mind, this study is focused on answering three key questions: First, what are the investment potentials and economic trends among African countries? Second, what is the level of coordination relationship between the investment potential and economic development among African countries? And third, what are the significant factors affecting the differentiation in coordination degrees among countries?
In order to answer these research questions, we formulated the following specific objective for this study: (1) to identify the dynamic evolution trends of investment potential and economic development; (2) to specify the temporal and spatial classification attributes of the coordination relationship between investment potential and economic development; and (3) to explore the driving mechanism of spatio-temporal heterogeneity of the coordination relationship. In this study, we integrated the entropy weight method (EWM), the coupling coordination degree model (CCDM), exploratory spatial data analysis (ESDA), and other methods to examine the evolution characteristics of the coordination relationship between the investment potential and economic growth in African countries. Combined with the geographic detector (GD), geographically weighted regression (GWR), and other econometric methods, the driving mechanism of the coordination relationship between investment potential and economic development was analyzed. The findings and conclusion of this study can be used as a reference for transnational investors and help in supporting African nations in establishing a clear coordination relationship between investment potential and economic development.

2. Research Methods and Data

2.1. The Index System and Data Sources

Investment potential and economic development are complex systems with multiple connotations. The investment potential system emphasizes the benefits of capital investment, which directly affects the fixed capital accumulation, the choice of corporate layout, and the technological advancements of the host country. In order to quantify and analyze investment potential, indicators have to be selected that are able to adequately reflect the country’s enterprise operation costs, the level of security for investments, the return capacity of capital investment, and the overall investment environment. Economic development provides market and commercial space for investment behavior and plays a crucial role in improving the people’s living standards, upgrading infrastructure, and optimizing the industrial structure. Some of the crucial indicators have to be selected to reflect economic strength, market vitality, and industrial modernization level of the host country. Based on The Global Competitiveness Report 2018, The World Investment Report 2018, and reports from other international institutions, we developed an evaluation system for investment potential and economic development, which included 10 subsystems: resource endowment environment, economic development environment, market health environment, entrepreneurial friendly environment, infrastructure environment, open environment, labor and employment environment, basic development level, industrial construction level, and the people’s living standards. The evaluation system comprised 33 indicators, as listed in Table 1. The data inputs were derived from the World Bank Database, the African Statistical Yearbook, Doing Business Report, and The World Investment Report. Due to missing information for some countries (i.e., South Sudan, Somalia, Libya, and Western Sahara), this study focused on 51 African countries, from 2008 (global financial crisis) to 2016 with a 4-year time interval.

2.2. Methods

The EWM was used to analyze the dynamic evolution of investment potential and economic growth. The CCDM and ESDA were then applied to examine the spatio-temporal evolution of the coordination relationship, while the GD was used to investigate the main driving factors affecting the coordination relationship. Finally, a GWR model was used to analyze the extent of the principal driving factors for the various regions.

2.2.1. Entropy Weight Method

The entropy method is a technique to determine the weight of the index and is often used in calculating the index score. The equations used are as follows:
forward   indexes :   u i j = x i x min x max x min ,
backward   indexes :   u i j = x max x i x max x min ,
where uij is the standardized value; xmax is the maximum value; xmin is the minimum value; xi is the standardized value.
M i = j = 1 n w i u i j ,   j = 1 n w i = 1 ,
where Mi is the evaluation index; wi is the weight. For more details on the operational steps, refer to Li et al. and Li et al. [18,19].

2.2.2. Coupling Coordination Degree Model

The CCDM evaluates the degree of correlation between two or more systems and is often used in research on urbanization, ecologicalization, population growth, and innovation capacity building. Based on the coupling and coordination mechanisms between investment potential and economic development, we used the CCDM to analyze the coordination relationship between investment potential and economic development in Africa, as illustrated in Figure 2.
The formulas used are as follows:
C = ( U × Q ) / ( U + Q ) 2 2 ,
T = α U + β Q ,
D = C × T ,
where D is the degree of coordination between the investment potential and the economic development index; U is the investment potential index [20]; Q is the economic development level index; C is the coupling degree between investment potential and economic development; T is the comprehensive coordination index of the two systems; α, β are the undetermined coefficients. While investment potential serves as an essential catalyst for economic growth, it is not the only driving factor for economic development, and in this study, we used α = 0.4 and β = 0.6 [20,21].

2.2.3. Exploratory Spatial Data Analysis

Using Moran’s I index, we calculated the spatial agglomeration of investment potential and economic development coordination in Africa en masse, using the equation
M o r a n s I = i = 1 n j 1 n W i j ( D i D ¯ ) ( D j D ¯ ) S 2 i = 1 n j = 1 n W i j ,
where Wij is an element of a spatial weight matrix indicating whether i and j are contiguous and S2 is the variance of the attribute value. The range of Moran’s I ∈ [−1,1], such that values greater than zero represent positive correlations, and values lower than zero represent negative correlations.
The Getis-OrdGi* index was used to identify the hot spots and cold spots in the spatial distribution of the coordination degree between investment potential and economic development, using the formula:
G i * ( d ) = i = 1 n W i j ( d ) D i / i = 1 n D i ,
when Gi*(d) is positive, the area i indicates a hot spot; when Gi*(d) is negative, the area i suggests a cold spot.

2.2.4. Geographic Detector

Developed by Wang et al., the geographic detector is an operating software for identifying driving factors [22]. It mainly includes factor detection, interaction detection, risk area detection, and ecological detection. The factor detector can reveal the influence of driving factors on the investment potential and economic development coordination degree. The formula is
T D = 1 i = 1 L N h σ h 2 N σ 2 ,
where D is the driving factor of the coordination between investment potential and economic development; TD is the explanatory power of the driving factor influencing the coordination relationship between the two systems; Nh is the number of units of type h; N is the number of all countries; and σh2 and σ2 are the variances of the D values for the h class and for all countries, respectively.

2.2.5. Geographically Weighted Regression Model

The spatial econometric model fully accounts for the autocorrelation of geographic elements and can effectively measure the spatial non-stationarity of the driving factors [23]. Based on the coordination degree and the corresponding data of investment potential and economic development from 2008 to 2016, we developed a regression model to analyze the driving factors that led to the spatial heterogeneity of the coordination relationship. The model established is as follows:
y i = β 0 ( u i , v i ) + j = 1 k β ( u i , v i ) x i j + ε i ,
where yi is the coordination degree index; xij is the various explanatory variables; (ui,vi) is geographical position coordinates; βi is the corresponding geospatial position function for each region; and εi is the residual.

3. Results

3.1. Dynamic Evolution of Investment Potential and Economic Development: 2008, 2012, and 2016

Table 2 and Figure 3 summarize the progression of the investment potential and the economic growth among African countries. From 2008 to 2016, the average investment potential index decreased from 0.259 to 0.252, representing a decline of about 2.7%, while its corresponding coefficient of variation (CV) value decreased from 0.437 to 0.386. The evaluation scores (ranging from 0 to 1), which reflect the investment potential for African countries, showed low values. At the same time, the investment potential was moderately stable, and the relative differences in investment potentials among countries had gradually contracted. The average economic development index increased from 0.116 to 0.151, while its corresponding CV value decreased from 1.152 to 1.025. This suggests that the overall economic level of African economies has steadily increased. However, growth among African countries had been highly heterogeneous, and the gap between economies has become more evident. As shown in Figure 3, the exponential distribution curve of the investment potential is highly comparable with the exponential distribution curve of economic development. South Africa, Egypt, Seychelles, Mauritius, and Botswana were among the top countries both in terms of investment potential and economic growth. This indicates that the spatial distribution of the investment potential index and economic development index is strongly related, which supports the coupling coordination mechanism between investment potential and economic growth.

3.2. Spatial Differentiation Characteristics of the Coordinated Relationship between Investment Potential and Economic Development in Africa: 2008, 2012, and 2016

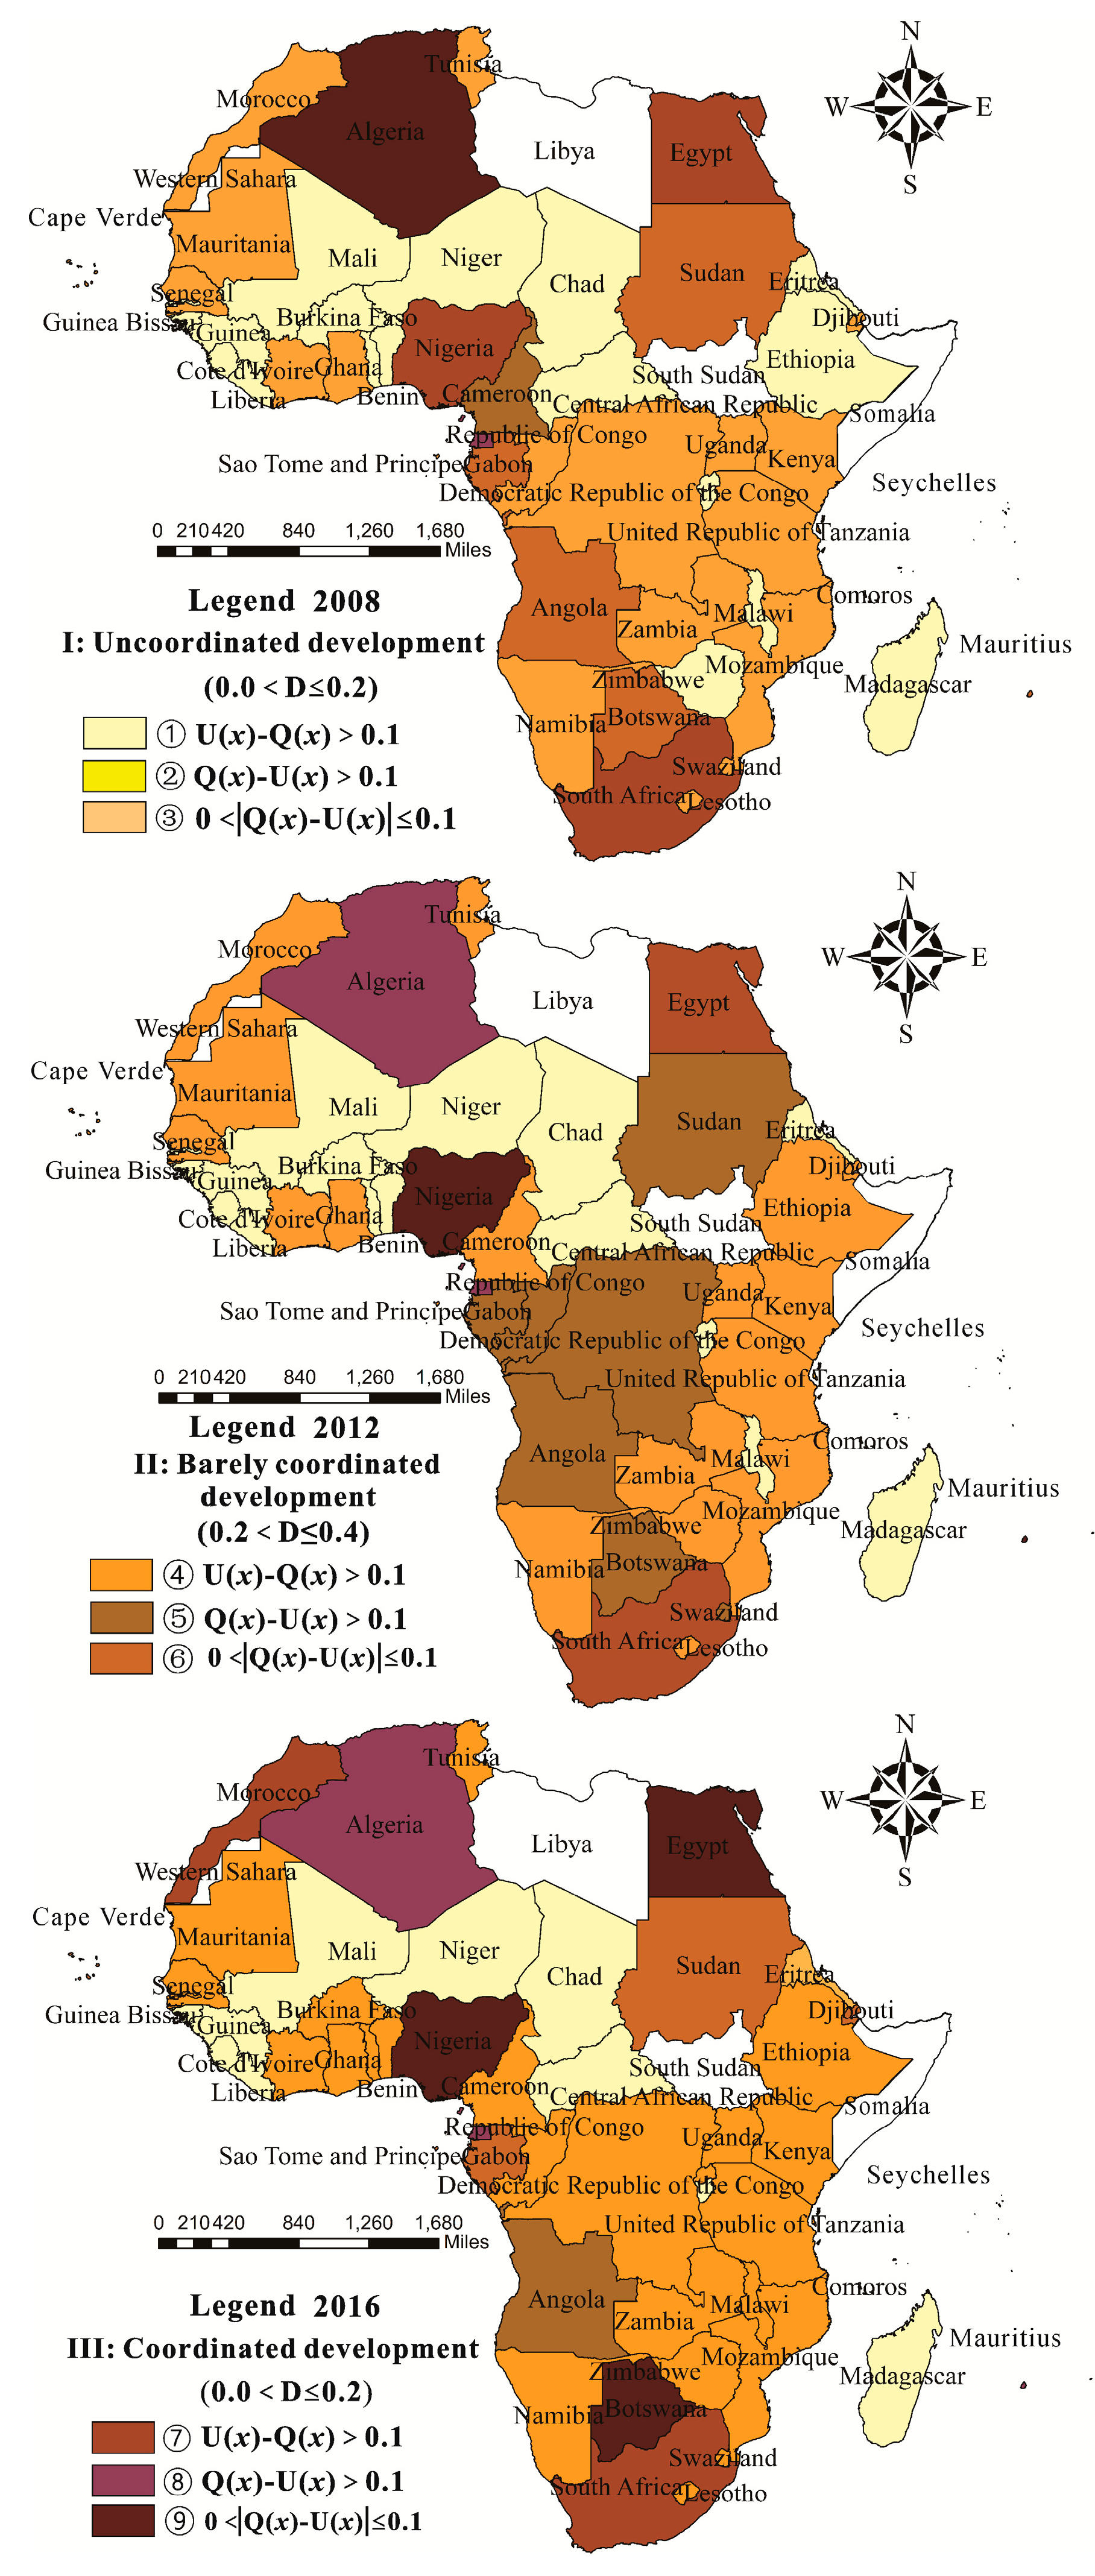
3.2.1. Classification of Coordinated Relationship between Investment Potential and Economic Development

The CCDM was used to calculate the coordination degree between investment potential and economic development. Using 0.2 and 0.4 as nodes, the calculation results were divided into three categories: (1) uncoordinated development, (2) barely coordinated development, and (3) coordinated development. Using the lagging condition of investment potential index and economic development index, the values were further subdivided into three groups: relative lag of economic development (U(x) − Q(x) > 0.1), relative lag of investment potential (Q(x) − U (x) > 0.1), relative balance between investment potential and economic development (0 < |Q(x) − U(x)| ≤ 0.1). We found that for 2008, a high percentage of countries (39.22%) were categorized as having uncoordinated development; this value steadily declined over the years, which in 2016 stood at 21.57%. This suggests that the general coordinated relationship among African economies has started to develop. The barely coordinated category was the dominant grouping and increased further over time. For 2008, 2012 and 2016, the percentages of countries under this category were 50.98%, 52.94%, and 60.78%, respectively. This indicates that a considerable number of countries in Africa continued having weak coordinated relationship between investment potential and economic development (see Table 3).
As shown in Figure 4, countries with uncoordinated development level and where economic growth trailed investment potential included Mali, Niger, Guinea and other Western African countries, and Madagascar. Since these countries already have substantial investment attraction, they ought to focus on attracting foreign capital into primary industrial sectors by highlighting the high probability for quick returns on investment and excellent economic benefits and enhancing the promotion of investment potential for economic growth in the future. Countries categorized under barely coordinated were dominated by those with relative lag in economic development. This country-type was concentrated in Eastern and Western Africa (e.g., Ethiopia, Uganda, Mauritania, Burkina Faso), with some sporadic distributions in Southern Africa. Among the countries with coordinated development, those with balanced investment potential and economic development increased in 2016, including Egypt, Nigeria, and Botswana. These countries are capitalizing on the economic advantages of investment potential. In the future, these countries ought to direct foreign investment towards the industrial-technological innovation system, cultivate new growth points with scientific and technological innovation as the core, and continue to promote the positive role of foreign investment towards economic infrastructure. Countries with coordinated development and relative lag of investment potential expanded in 2016 and included Algeria, Equatorial Guinea, Mauritius, and Seychelles. The recommended path for these countries to achieve sustainable economic growth involves enhancing the guiding role of the government’s financial resources, accelerating upgrades in infrastructure facilities, and creating a conducive infrastructure- and business-friendly environment. Overall, in each category of coordination relationship, the dominant subclass was countries with a relative lag in economic development. Due to stark differences in lag determination between systems, different country types should adopt specific strategies for opening up and attracting investment.

3.2.2. Analysis of the Spatio-Temporal Pattern of the Coordinated Relationship between Investment Potential and Economic Development

For 2008, 2012, and 2016, the corresponding Moran’s I indexes were 0.360, 0.232, and 0.237, respectively. The z-test values were 4.668, 3.081, and 3.152, and the results were statistically significant (p < 0.01). The results indicate that the spatial distribution of the coordination degree between investment potential and economic development is characterized by spatial agglomeration as a whole. The calculated Getis-OrdGi* Indexes using ArcGIS Software and the obtained p-value scores were divided into four categories using the natural breaks classification method: cold spot, sub-cold spot, sub-hot spot, and hot spot (see Figure 5).
In 2008, the hot spots formed an agglomeration in Southern Africa (e.g., South Africa, Botswana, and Namibia), and another in Central Africa (e.g., the Republic of Congo and Cameroon). For cold spots, an agglomeration was formed by some countries in Western Africa, including Mali, Senegal, Guinea, and other Western African countries. In 2012, the hot spot agglomeration zone in Central Africa contracted, and Chad became an isolated cold point with no contiguous country of the same type. By 2016, the pattern of a dual-core group in hot spot area had been broken. With the overall decline in coordination degree, the hot spot region in Central Africa had vanished entirely and was converted into a sub-hot spot area. The Southern African region became the only hot spot agglomeration in the content. Algeria, Tunisia, and Egypt in Northern Africa continued being hot spots from 2008 to 2016. Meanwhile, the cold spot region continued to spread in Central Africa forming a spatial pattern of “one core and one belt”. The “one core” area was composed of several Western African countries (e.g., Mali, Guinea, and Côte d’Ivoire) while the “one belt” comprised a number of Central and Eastern African countries (e.g., Chad, Central African Republic, the Democratic Republic of the Congo, and Tanzania). Overall, the countries found in the hot spot areas maintained the characteristics of centralized distribution and fragmented distribution in the local area. The cold spot agglomeration gradually changed in a strip-shaped distribution, while the sub-hot spot and the sub-cold spot areas were always distributed around the hot spots and cold spots, indicating strong dependence on the shifts and evolution of hot spot and cold spot agglomerations.

3.3. The Driving Mechanism of the Coordinated Relationship between Investment Potential and Economic Development in Africa

3.3.1. The Analysis of Driving Factors Based on Geographic Detector

Without a doubt, the geographical location, infrastructure development, and macro-regional economic integration between countries can have significant impact on the coordination relationship between investment potential and economic development, but obtaining commensurate indicators quantifying these parameters is highly problematic. The following parameters were chosen as indicators in analyzing the driving factors: economic base level, industrial construction level, degree of urbanization level, information support level, level of business friendliness, residents’ living standards, and government support. We discretized the various indicators into five categories using the natural breaks classification method. The factor detection module was then used to analyze the main driving factors that influenced the coordination relationship for the purpose of dimensionality reduction while resolving possible multicollinearity problems. The results are as shown in Table 4.
Our analysis showed the top five indicators included economic base, residents’ living standard, industrial construction level, use of modern information technology, and level of business friendliness. The degree of urbanization and government support were shown to be weak parameters for the coordination relationship between investment potential and economic development in African countries. For the given study period, we found that the influence of the indicators changed significantly over time. In 2008, residents’ living standards (0.714) was the leading variable, followed by economic base (0.657) and industrial construction level (0.486). In 2012, the residents’ living standards (0.772) remained the leading parameter, followed by economic basic level (0.768), which also increased substantially in interpretative strength. The other top variables declined at varying degrees. In 2016, economic base level (0.812) had overtaken residents’ living standards (0.732) as the leading indicator. Information support level (0.403) increased its interpretative strength, overtaking industrial construction level (0.390) as the third top indicator.

3.3.2. Geographically Weighted Regression Analysis of Driving Factors

In order to further understand the indicators’ spatial dimension, we constructed a geographically weighted regression model using the five leading driving factors as independent variables and used the coordination degrees for 2008, 2012, and 2016 as dependent variables. The GWR tool in ArcGIS software was employed for the regression model. As shown in Table 5, the regression model had R2 between 0.712 and 0.723 and adjusted R2 between 0.675 and 0.692, indicating that the model could be reasonably explained using the five independent variables. This confirms that the main driving factors obtained through geo-detection have a strong capacity to gauge the coordination degree distribution. Visualizing the resulting regression coefficients, as shown in Figure 6, we analyzed the spatial heterogeneity of indicators.
Based on the spatial distribution of high-value regions of the regression coefficient, we divided the driving mechanisms of the coordination relationship into five groups: economic base driven, industry-driven, information application-driven, business convenience-driven, and consumer market-driven.
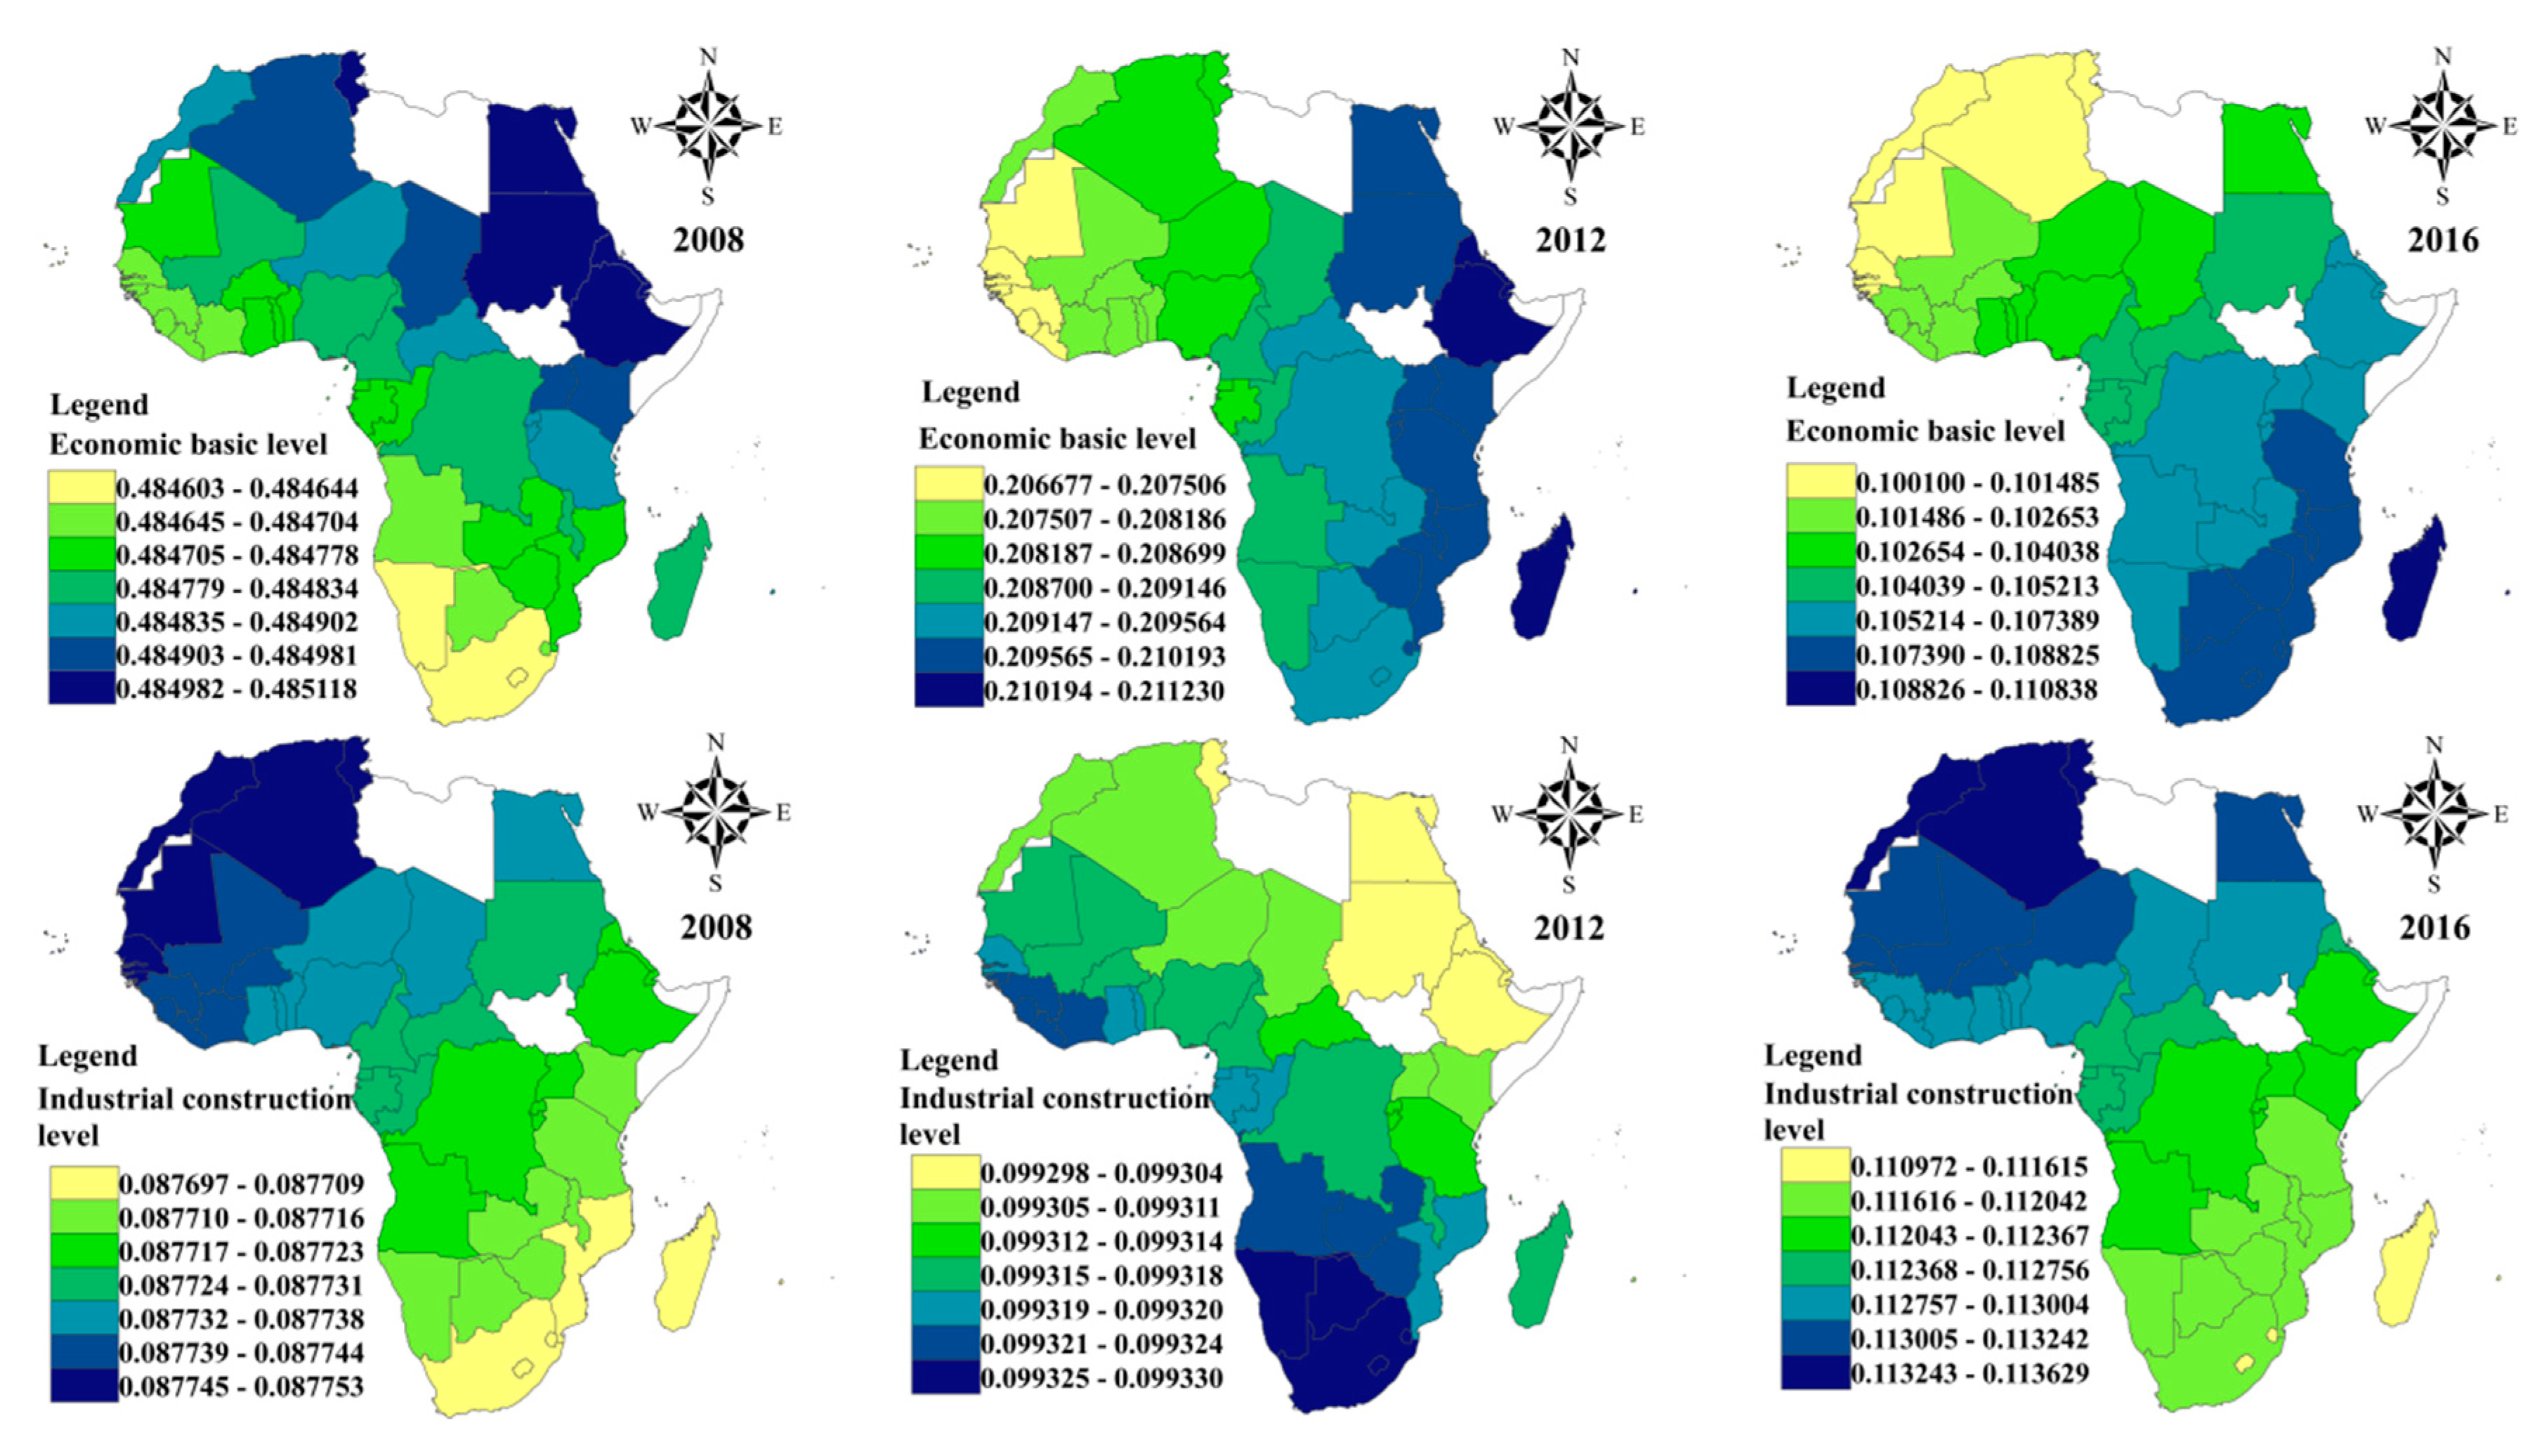
  • The regression coefficient for economic base had been decreasing gradually but remained one of the most influential driving factors. In 2008, the economic base had a significant impact on the coordination degree for Ethiopia, Sudan, Egypt, Tunisia, Eritrea, and other countries in the northeast. From 2012 to 2016, the high-value distribution area shifted gradually to Southeastern Africa, and Madagascar became an economic base driven country.
  • The spatial distribution of the regression coefficient for industrial construction showed significant changes. In 2008, the industrial construction level was a vital driving force for improving coordination in Algeria, Morocco, Tunisia, Mauritania, and Senegal. In 2012, a large number of countries in southern Africa became a country of industry-driven. In 2016, the high-value area of the regression coefficient contracted to the north. In the end, the coordination degree of only Algeria, Morocco, and Tunisia was strongly driven by the industrial construction level.
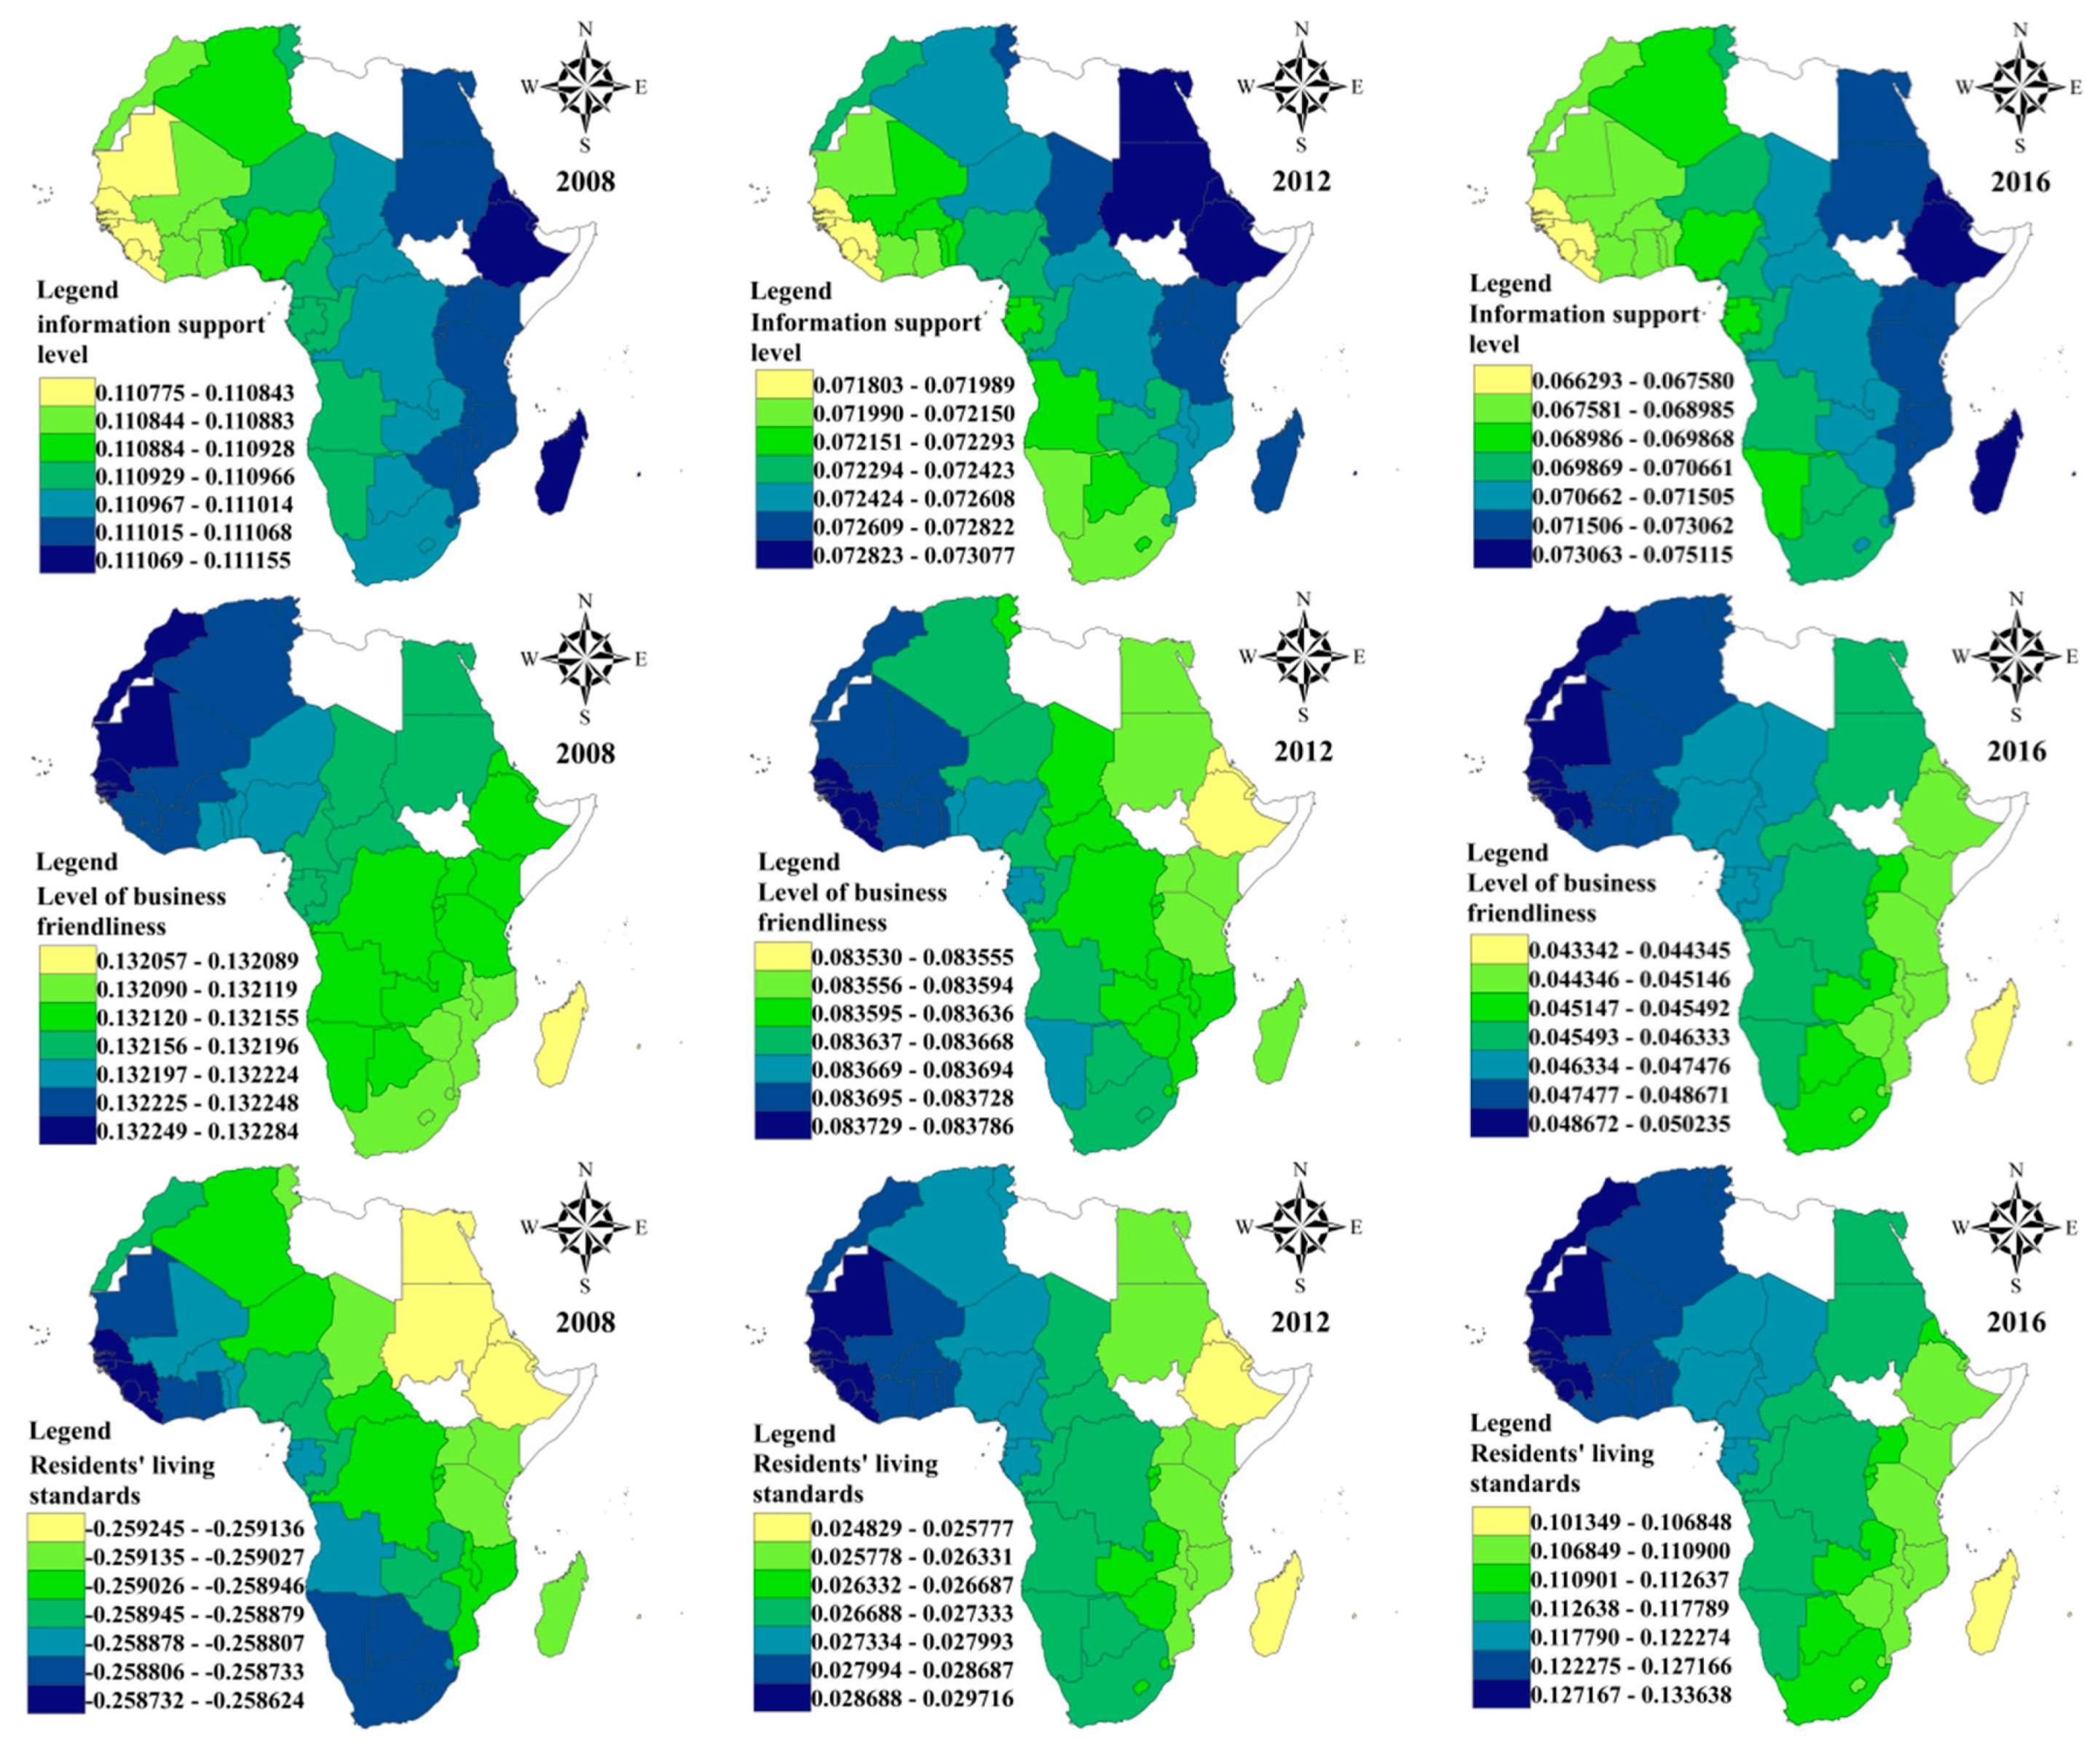
  • The change in regression coefficient for information support level can be characterized as having an east–west configuration, where the high-value areas are found on the eastern side of the continent the regression coefficient decrease gradually when moving westwards. Ethiopia and Madagascar were found to be significantly affected by the information support level and are categorized as being information application-driven economies.
  • From 2008 to 2016, the regression coefficients appeared to have the morphological characteristics of decreasing from northwest to southeast; the areas with highest regression coefficients for business friendliness were found in northwest Africa (e.g., Morocco, Mauritius, Senegal, and Cape Verde). Business friendliness is an essential driving factor to promote improvements in the coordination relations in these countries, which can be categorized as being the business convenience-driven type. At the same time, Southeast African countries must actively pursue more spillover benefits from a business conducive environment.
  • Over time, the regression coefficient for the residents’ living standards has changed from negative to positive, and the positive effect of this variable has substantially increased. High regression coefficient areas for this variable gradually extended from Liberia, Côte d’Ivoire, Guinea, Guinea-Bissau, and Senegal into Morocco, Cape Verde, and Mauritania. The changes in the residents’ consumption capability, product demand level, and consumer market have a vital role in promoting the coordination relationship, particularly in Africa’s northwestern region, which can be considered as being consumer market-driven.

4. Discussion

4.1. Evaluation of Investment Potential and Economic Development

The investment potential and economic development level of Africa were measured using the entropy weight method, which shows that the average value of investment potential in 2016 was only 0.252, while the average value of economic development was only 0.151. This suggests that the current investment potential and economic development in Africa are still at low levels, consistent with findings from previous research [24,25]. For most African countries, guiding the capital flow into infrastructure construction and social services and promoting sustained development in technical training, science and engineering education, and technology research should be considered as urgent national concerns.
Countries with smaller economies, such as Seychelles, Mauritius, and Botswana, have relatively high rankings in the evaluation index comparison, contrary to the finding of Xie et al. and Jiang et al. [25,26]. This is mainly because the evaluation system used in this study employed a large number of mean indicators and ratio indicators, such as per capita cultivated land area and per capita GNI (gross national income). The rankings in the subsystem evaluation index for many countries are comparable with those from international reports such as the Doing Business Report and the World Investment Report (In 2016, Seychelles, Mauritius, and Botswana ranked the 99th, 20th, and 86th places in The World Investment Report). This supports the feasibility and rationale of the indicator selection approach.

4.2. The Evolution of the Coordinated Relationship between Investment Potential and Economic Development

Based on the coupling and coordination mechanisms between investment potential and economic development, we used the CCDM to analyze the coordination relationship between investment potential and economic development in Africa, which is an extension of the field of coordination relationship research [12,27,28]. We divided the coordination relationship into three levels based on the coordination degree of each country, from coordinated development to uncoordinated development. As the value of the coordination degree decreases, so does the degree of mutual promotion between investment potential and economic development. This study has shown that barely coordinated development and uncoordinated development are the main forms of coordination relationship in Africa. Based on the analysis of evaluation indicators, this may be the result of inefficient government policies and management, shortage in technical skills and required competencies, and the high import dependence of many economies in Africa, which have hindered overall improvements in the business environment and economic development. This finding on the condition regarding the coordination relationships in African countries could be used to explain the current backwardness in investment potential and economic development found in much of the region. It also supports the feasibility and scientificity of using the CCDM to analyze the coordination relationship between investment potential and economic development.
The analysis of the subsystem shows that the dominant coordination relationship subtype was relative lag in economic development. This could be related to factors such as the instability in local politics, complex dynamics of international relations, and instability in the international exchange rate market. Individual countries would need to adjust the equilibrium relationship between investment potential and economic development to match the complexities of the international investment environment and satisfy the demands for economic development. The spatio-temporal pattern analysis suggests that the coordination degree has spatial agglomeration characteristics. This suggests that countries with high coordination degrees demonstrate driving effects, which can improve coordination relationships in the surrounding areas [29]. Finally, based on the analysis of the coordination relationship classification, adopting policies that would effectively attract investment is crucial for many African countries in promoting the coordinated development of the national economy and investment environment.

4.3. The Driving Mechanism of the Coordinated Relationship between Investment Potential and Economic Development

When using the geographic detector in measuring the driving factors of coordination relationship, we found that the economic base level, residents’ living standard, information support level, industrial construction level, and business friendliness are the leading factors influencing coordination relationship, sorted by the value of their explanatory power. This suggests that in order to improve the coordination degree between investment potential and economic development, African countries would need to strengthen their economic base, use the “national wealth to benefit the masses”, support the development of the industrial system, and promote the democratization of internet use. In the geographically weighted regression analysis, we found significant spatial heterogeneity in the distribution of indicator influence. From high-value areas, the regression coefficients decreased gradually into low-value regions, indicating that these parameters are influenced by the spatial-neighbor effect and distance attenuation mechanism in forming different driving mechanisms. Also, driving mechanisms in adjacent areas have high similarity.
The driving factor analysis, combined with the geographic detector and geographical weighted regression method, provides more advantages in screening and detecting spatial heterogeneity of driving factors compared with previous approaches [30]. The indicator rankings generated from different methods showed substantial similarity. For example, the economic base level and the residents’ living standards were the most important parameters found using geographically weighted regression and geographic detectors. This can be used to support the feasibility and reasoning of combining the methods in order to have a more comprehensive understanding of the driving mechanisms affecting investment potential and economic development.

4.4. Limitations of the Study

This study has some potential shortcomings. First, although the evaluation index system included a number of indicators, this does not guarantee that all significant variabilities have been considered in the indicator list. Some indicators of development, such as inflation, environmental phenomena, and poverty rates, were not considered. Likewise, the endogeneity issue between investment potential and economic development evaluation system could not be completely avoided. Second, because of limited research conducted with regards to the relationship between investment potential and economic development, our approach required some inevitable use of subjectivity from methodological choices to analysis framework. Third, the driving effect of geographical location, infrastructure development, and the economic integration between countries were not included in this study and would have to be explored in future studies. The research scope can also be extended to reflect the differences in the coordination relationship between investment potential and economic development within countries.

5. Conclusions

This study made use of data from 51 African countries, combining the entropy weight method, coupling coordination degree model, exploratory spatial data analysis, geographic detector, and geographically weighted regression model in order to analyze the evolution and driving mechanisms of the coordination relationship between investment potential and economic development. The following conclusions are drawn.
  • We found that the spatial distribution of high-level countries has strong similarities in terms of investment potential and economic development. The overall investment potential of African countries was found to be weak, but the internal differences in investment potential have gradually narrowed. The overall economic level is rising steadily, but the “economic gap” between countries is still very evident.
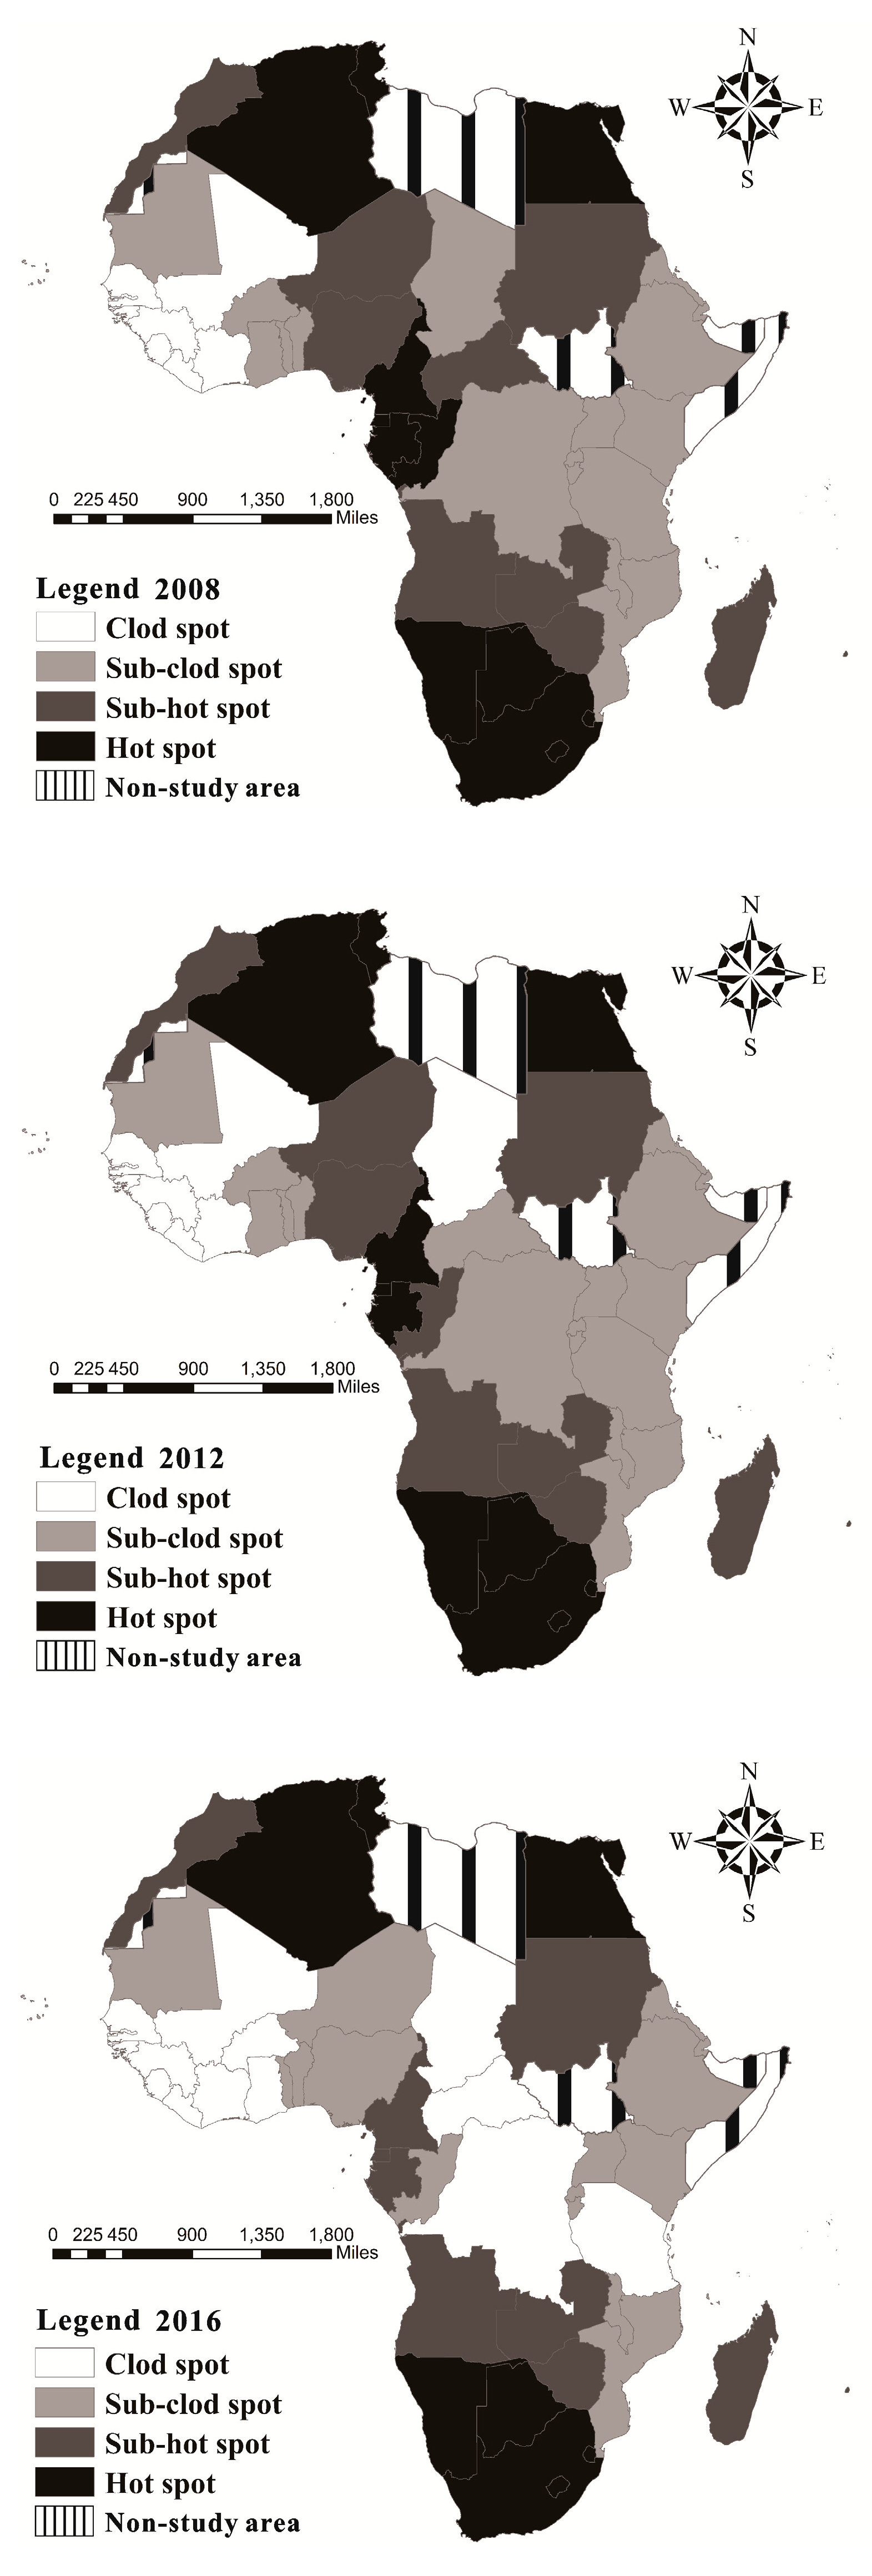
  • The coordinated relationship between investment potential and economic development can be divided into three categories: uncoordinated development, barely coordinated development, and coordinated development. Uncoordinated development and barely coordinated development were the most dominant types of coordinated relationship. By determining the lag conditions, countries can adopt unique strategies in order to attract foreign investments. The coordinated relationship between investment potential and economic development in African countries showcased attributes of spatial agglomeration. Hot spot areas were characterized by condensed and continuous distributions as the overall pattern while the local area had fragmented distributions; a hot spot agglomeration was found in Southern Africa. For cold spot areas, a spatial distribution pattern of “one core and one belt” was formed, with some Western African countries become part of the core area and some Central and Eastern African countries constituting the belt.
  • Economic base, residents’ living standard, industrial construction level, information support level, and business friendliness were the leading indicators in the relationship between investment potential and economic development. The distribution of regression coefficients showed distinct spatial heterogeneity. According to the distribution of regression coefficients in various countries, the driving mechanism of the coordination relationship can be divided into five types: economic base driven, industry-driven, information application-driven, business convenience-driven, and consumer market-driven.
Although this study has some shortcomings, such as constraints in the evaluation system, subjectivity of the methodological choices, and the absence of some parameters of driving factors, it serves as an essential reference for African countries to develop unique strategies and policies, in order to effectively attract inflows of foreign investments. In the context of economic globalization, African countries must actively optimize their investment potential, create a conducive business environment, and guide foreign investments towards areas according to the actual condition of their natural resource endowment, industrial advantages, industrial layout, and foreign trade direction. In particular, African countries must focus on improving the level of education and social security in order to make full use of Africa’s huge demographic dividend and rapid urbanization process in attracting foreign investments. Similarly, countries can also prioritize improving the utilization efficiency of foreign capital. Governments should implement effective domestic macroeconomic policies (e.g., low inflation monetary policies, low debt growth fiscal policies) and export-oriented trade strategies that can be competitive in the global economy. Strengthening economic cooperation between countries and avoiding the convergence of industrial structure are crucial in creating a conducive environment for market competition and improving the level of foreign capital utilization. These changes can provide the needed continued external support for African integration and sustainable development.

Author Contributions

G.W. and Z.Z. conceived and designed the research; G.W. drafted the manuscript and prepared figures and revised the manuscript; P.S. and X.O. discussed the results. All authors have read and agreed to the published version of the manuscript.

Funding

This research was funded by the “The Program of National Natural Science Foundation of China” (NO.41371024), “Talent Introduction Program Project of Southwest University” (NO.SWU019020) and “The Open Topic of Hunan Key Laboratory of Land Resources Evaluation and Utilization” (NO. SYS-ZX-201902).

Acknowledgments

Special thanks to the professional language editing service from EditX.

Conflicts of Interest

The authors declare no conflict of interest.

References

  1. Ezcurra, R. Does Economic Globalization affect Regional Inequality? A Cross-country Analysis. World Dev. 2013, 52, 92–103. [Google Scholar] [CrossRef]
  2. Vogli, R.D.; Kouvonen, A.; Elovainio, M.; Marmot, M. Economic globalization, inequality and body mass index: A cross-national analysis of 127 countries. Crit. Public Health 2014, 24, 15. [Google Scholar] [CrossRef]
  3. Samimi, P.; Jenatabadi, H.S. Globalization and economic growth: Empirical evidence on the role of complementarities. PLoS ONE 2014, 9, e87824. [Google Scholar] [CrossRef] [Green Version]
  4. Yang, W.L.; Du, D.B.; You, X.J.; Shi, W.T.; Yan, Z.M. Network Structure Evolution and Spatial Complexity of Global Transnational Investment. Sci. Geogr. Sin. 2017, 37, 1300–1309. [Google Scholar]
  5. Radice, H. Transnational corporations and global capitalism: Reflections on the last 40 years. Crit. Perspect. Int. Bus. 2014, 10, 21–34. [Google Scholar] [CrossRef]
  6. Chen, Y.; Chai, H.; Huang, Y. Based on Fuzzy Comprehensive Evaluation Method The Investment Risk Assessment of Chinese Enterprises in The Countries Along ng ntries AlonRoadng. IOP Conf. Ser. Earth Environ. Sci. 2018, 108, 042073. [Google Scholar] [CrossRef]
  7. Junkes, M.B.; Tereso, A.P.; Afonso, P.S.L.P. The Importance of Risk Assessment in the Context of Investment Project Management: A Case Study. Procedia Comput. Sci. 2015, 64, 902–910. [Google Scholar] [CrossRef] [Green Version]
  8. Ge, S.J.; Shi, A.N. Construction of the Factors Affecting China′s Hydropower Projects and Overseas Investment Risk Assessment Index System. Appl. Mech. Mater. 2014, 672, 2077–2084. [Google Scholar] [CrossRef]
  9. Fang, Y.N. Risk Assessment of Chinese Enterprises to Overseas Direct Investment Countries under the “Belt and Road” Strategy. Discuss. Mod. Econ. 2016, 1, 79–83. [Google Scholar]
  10. Ding, L.; Zhao, W.T.; Huang, Y.L.; Cheng, S.G.; Liu, C. Research on the Coupling Coordination Relationship between Urbanization and the Air Environment: A Case Study of the Area of Wuhan. Atmosphere 2015, 6, 1539–1558. [Google Scholar] [CrossRef] [Green Version]
  11. Zhang, C.M.; Zhang, X.L.; Wu, Q.Y.; Li, H.B. The Coordination About Quality and Scale of Urbanization:Case Study of Jiangsu Province. Sci. Geogr. Sin. 2013, 33, 16–22. [Google Scholar]
  12. Ji, C.; Zhanqi, W.; Hongwei, Z. Integrated Evaluation of Coupling Coordination for Land Use Change and Ecological Security: A Case Study in Wuhan City of Hubei Province, China. Int. J. Environ. Res. Public Health 2017, 14, 1435–1450. [Google Scholar]
  13. Wang, Y.H.; Yuan, Y.; Wang, Y.L.; Zhang, X.L.; Qiao, W.F. Relationship and mechanism of coupling development between population and land urbanization: A case study of Jiangsu province. Geogr. Res. 2017, 36, 149–160. [Google Scholar]
  14. Wang, Y.H. Empirical Study of the Coupling Coordination Relationship of urbanization and ecological environment in Nanchang and Jiujiang urban belts. J. Interdiscip. Math. 2014, 17, 516–526. [Google Scholar]
  15. Wang, S.J.; Ma, H.; Zhao, Y.B. Exploring the relationship between urbanization and the eco-environment-A case study of Beijing-Tianjin-Hebei region. Ecol. Indic. 2014, 45, 171–183. [Google Scholar] [CrossRef]
  16. Mhlanga, N.; Blalock, G.; Christy, R.D. Understanding Foreign Direct Investment in the Southern African Development Community: An Analysis Based on Project-Level Data. Agric. Econ. 2010, 41, 337–347. [Google Scholar] [CrossRef]
  17. Ampiah, K.; Rose, C. The Evolving Relations between Japan and Africa: The Discourse of the Tokyo International Conference on African Development (TICAD). Jpn. Stud. 2012, 32, 153–159. [Google Scholar] [CrossRef]
  18. Li, S.; Ying, Z.X.; Zhang, H. Comprehensive assessment of urbanization coordination: A case study of Jiangxi province, China. Chin. Geogr. Sci. 2019, 29, 128–142. [Google Scholar] [CrossRef] [Green Version]
  19. Li, M.C.; Mao, C.M. Spatial-Temporal Variance of Coupling Relationship between Population Modernization and Eco-Environment in Beijing-Tianjin-Hebei. Sustainability 2019, 4, 991. [Google Scholar] [CrossRef] [Green Version]
  20. He, J.Q.; Wang, S.J.; Liu, Y.Y.; Ma, H.T.; Liu, Q.Q. Examining the relationship between urbanization and the eco-environment using a coupling analysis: Case study of Shanghai, China. Ecol. Indic. 2017, 77, 185–193. [Google Scholar] [CrossRef]
  21. Yao, L.; Li, X.L.; Li, Q.; Wang, J.K. Temporal and Spatial Changes in Coupling and Coordinating Degree of New Urbanization and Ecological-Environmental Stress in China. Sustainability 2019, 4, 1171. [Google Scholar] [CrossRef] [Green Version]
  22. Wang, J.F.; Xu, C.D. Geographic detector: Principle and Prospect. Acta Geogr. Sin. 2017, 72, 116–134. [Google Scholar]
  23. Xu, B.; Xu, L.; Xu, R.J.; Luo, L.Q. Geographical analysis of CO2 emissions in China’s manufacturing industry: A geographically weighted regression model. J. Clean. Product. 2017, 26, 173–187. [Google Scholar] [CrossRef]
  24. Wang, F.X.; Mao, A.H.; Li, H.L.; Jia, M.L. Quality Measurement and Regional Difference of Urbanization in Shandong Province Based on the Entropy Method. Sci. Geogr. Sin. 2013, 33, 1323–1329. [Google Scholar]
  25. Xie, S.H.; Gan, C.; Wang, Q. The Comprehensive Evaluation of the Investment Environment of the African Countries and the Analysis of the Spatial Difference. Econ. Geogr. 2017, 37, 10–16. [Google Scholar]
  26. Jiang, D.L.; Yang, D.; Ren, Z.P.; Chen, Y.Y.; Zhang, Z.K. Evaluation of Comprehensive Economic and Social Development level in Africa based on TOPSIS method. Trop. Geogr. 2015, 35, 242–249. [Google Scholar]
  27. Song, Q.J.; Zhou, N.; Liu, T.L.; Siehr, S.A.; Qi, L. Investigation of a “coupling model” of coordination between low-carbon development and urbanization in China. Energy Policy. 2018, 121, 346–354. [Google Scholar] [CrossRef] [Green Version]
  28. Lu, C.Y.; Yang, J.Q.; Li, H.J.; Jing, S.L.; Pang, M.; Lu, C.P. Research on the Spatial-Temporal Synthetic Measurement of the Coordinated Development of Population-Economy-Society-Resource-Environment (PESRE) Systems in China Based on Geographic Information Systems (GIS). Sustainability 2019, 10, 2877. [Google Scholar] [CrossRef] [Green Version]
  29. Xu, J.G.; Yin, H.W.; Zhong, G.F.; Zeng, Z.G. African Economic pattern based on Spatial autocorrelation. Econ. Geogr. 2006, 26, 771–775. [Google Scholar]
  30. Cai, B.B.; Zhao, W.; Li, Y.H.; Li, Z.Y. Spatial pattern and influencing factors of Coupling and Coordination between Regional Innovation and Regional economy in China. Res. Sci. Technol. Manag. 2019, 10, 96–105. [Google Scholar]
Figure 1. Geographical location map of the study area.
Sustainability 12 00442 g001
Figure 2. The mechanism of coupling and coordination between investment potential and economic development.
Sustainability 12 00442 g002
Figure 3. The trend graph of investment potential index and economic development index among African countries for 2008, 2012, and 2016.
Sustainability 12 00442 g003
Figure 4. Spatio-temporal classification of coordination relationship. Note: The color symbols in each legend box in Figure 4 are applicable for all three images.
Sustainability 12 00442 g004
Figure 5. Spatial distribution of cold spot and hot spot regions of coordination degree.
Sustainability 12 00442 g005
Figure 6. The Spatial Distribution of regression coefficients of driving factors in 2008, 2012, and 2016.
Sustainability 12 00442 g006aSustainability 12 00442 g006b
Table 1. The evaluation system of investment potential and economic development system.
System LayerSubsystem LayerIndicator LayerWeight
Investment potential systemUQ: Resource endowment environmentUQ1 Per capita cultivated land area (Hectare/person)0.029
UQ2 Proportion of urban population to the total population (%)0.024
UQ3 Economically active population (Thousand people)0.087
UT: Economic development environmentUT1 GDP growth rate (%)0.011
UT2 Total value of fixed assets formation (Million dollars)0.187
UT3 ·Annual growth rate of inflation calculated by CPI (%)0.006
UT4 Proportion of industrial production to GDP (%)0.033
UI: Market healthy environmentUI1 Contract execution index (-)0.038
UI2 Unit container export cost (USD)0.007
UI3 Easy access to credit (-)0.034
UP: Entrepreneurial friendly environmentUP1 Government expenditure as a share of GDP (%)0.023
UP2 Investor protection ease (-)0.033
UP3 Business environment index (-)0.044
UP4 Ease of licensing (-)0.038
UE: Infrastructure construction environmentUE1 Number of visitors arriving (Thousand people)0.135
UE2 Teacher-student ratio in primary schools (%)0.019
UE3 Number of hospital beds per 10,000 people (Quantity)0.087
UE4 Number of mobile cellular subscribers per 1000 inhabitants (Quantity)0.024
UF: Opening to the outside environmentUF1 Cross-border trade index (-)0.043
UF2 The total export value of goods and services accounts for the proportion of GDP (%)0.027
UF3 Total import and export as a percentage of GDP (%)0.022
UK: Employment environmentUK1 Labor force participation rate over 15 years old (%)0.021
UK2 ·Adult illiteracy rate (%)0.016
UK3 ·Total unemployment rate (%)0.010
Economic development systemQT: Basic development levelQT1 GDP (Million dollars)0.163
QT2 Per capita national reserve (USD)0.175
QT3 Government revenue as a percentage of GDP (%)0.026
QI: Industrial construction levelQI1 Per capita manufacturing value added (USD/person)0.158
QI2 Agricultural added value as a share of GDP (%)0.011
QI3 FDI inflow stock (Million dollars)0.141
QP: People’s living standardsQP1 Per capita GNI (USD/person)0.108
QP2 Per capita domestic savings (USD/person)0.131
QP3 ·Per capita private consumption expenditure (%)0.089
Note: The indicator with · is the reverse attribute indicator. Otherwise, the parameter indicates positive attributes. CPI, consumer price index. FDI, foreign direct investment. GNI, gross national income.
Table 2. The statistical description of investment potential and economic development for 2008, 2012, and 2016.
Investment Potential IndexEconomic Development Index
200820122016200820122016
AVG0.2590.2550.2520.1160.130.151
CV0.4370.3790.3861.1521.0941.025
SD0.1120.0970.0970.1330.1420.155
Note: AVG is the average of the evaluation system index; CV (coefficient of variation) is used to measure the extent of index differences and can be computed using the equation: CV = SD/AVG; SD is standard deviation, which is used to measure the degree of dispersion of the data set.
Table 3. Statistical information on the classification of the two-system coordination relationship.
Uncoordinated DevelopmentBarely Coordinated DevelopmentCoordinated Development
200820122016200820122016200820122016
Total201711262731579
Percentage (%)39.2233.3321.5750.9852.9460.789.8013.7317.65
RLOED (①④⑦)201710192025322
RLOIP (②⑤⑧)000101124
RB (③⑥⑨)001675133
Note: RLOED, Relative lag of economic development; RLOIP, Relative lag of investment potential; RB, Relative balance; “①~⑨” means the same as Figure 4.
Table 4. Selected indicators and results of geographic detection.
Driving FactorsIndicators for Explaining the Driving FactorMeaning of IndicatorsP2008P2012P2016
X1 EBLper capita GDPNational macroeconomic operating state0.65680.76830.8124
X2 ICLThe added value of the secondary industry and service sector accounted for the proportion of GDPThe dominant position of the industrial economy0.48590.43470.3903
X3 DUUrbanization rateUrban scale and level of urban development0.26430.21480.1030
X4 ISLNumber of mobile cellular phone users per 1000 inhabitantsThe application of modern information technology0.44500.43050.4013
X5 LBFEase of doing business indexNational support for various business activities0.32600.28120.2767
X6 RLSPer capita GNIBasic living standards and consumption capacity of the residents0.71370.77220.7315
X7 GSLProportion of fiscal expenditure to GDPGovernment’s ability to support the operation of the national economy0.09250.24590.1427
Note: economic basic level (EBL), industrial construction level (ICL), degree of urbanization (DU), information support level (ISL), level of business friendliness (LBF), residents’ living standards (RSL), government support level (GSL). P2008, P2012, P2016 are the interpretative strengths for each driving factor to the degree of coordination in 2008, 2012, and 2016, respectively.
Table 5. The statistical description of the geographically weighted regression (GWR) model operation results.
ParameterYears
200820122016
Bandwidth93,666,588.1244,340,087.9612,967,325.55
Residual squares0.13020.12200.1278
Sigma0.05370.05210.0537
AICc−143.1478−146.4001−143.1496
R20.71640.72320.7120
Adjusted R20.68480.69210.6752
Note: AICc, Akaike information criterion.

