A Numerical Study on Mitigation Strategies of Urban Heat Islands in a Tropical Megacity: A Case Study in Kaohsiung City, Taiwan


Department of Landscape Architecture, National Chiayi University, Chiayi 60004, Taiwan
*
Author to whom correspondence should be addressed.
Sustainability 2020, 12(10), 3952; https://0-doi-org.brum.beds.ac.uk/10.3390/su12103952
Submission received: 6 April 2020
/
Revised: 29 April 2020
/
Accepted: 7 May 2020
/
Published: 12 May 2020
(This article belongs to the Collection Sustainable Built Environment)
Abstract
:In recent years, with the rapid increase in global warming and urbanization, urban heat island effects (UHI) have become an important environmental issue. Taiwan is no exception, with previous studies demonstrating serious UHIs in megacities. Although existing UHI research has utilized computer simulations to analyze improvement scenarios, there are few cooling strategy studies in actual blocks of Taiwan. Therefore, this study selected a block of a megacity in a tropical region of Taiwan as a case study by ENVI-met. Five improvement strategies were tested and compared to the current situation (B0): (1) Case C1 changed to permeable pavement, (2) Case C2 increased the green coverage ratio (GCR) of the street to 60%, (3) Case C3 changed to permeable pavement and increased the GCR in the street to 60%, (4) Case C4 changed to permeable pavement, increased the GCR in the street to 60%, and increased the GCR in the parks to 80%, and (5) Case C5 changed to permeable pavement, increased GCR in the street to 60% and parks to 80%, and set the GCR on the roof of public buildings to 100%. The results showed that the average temperature of the current thermal environment is 36.0 °C, with the comfort level described as very hot. Among the five improvement schemes, C5 had the greatest effect, cooling the area by an average of 2.00 °C. Further analysis of the relationship between the different GCRs of streets (SGCR) and the cooling effects revealed that for every 10% increase in the SGCR, the temperature of the pedestrian layer was reduced by 0.15 °C.
1. Introduction
Since the Industrial Revolution, the rapid shift in land use from natural to agriculture or urban areas has caused the accumulation of artificial matter over the land surface, and the subsequent high-rise construction, human activities, and energy consumption have led to global climate change [1,2,3]. According to United Nations 2018 statistics, 55% of the world’s population is concentrated in urban areas, which is projected to increase to 68% by 2050, and 90% in high-income countries such as in North America [4]. Therefore, urban environmental problems will inevitably become more serious and important, especially the urban heat island (UHI) effect, when the temperature in the urban center is higher than that of the surrounding suburbs [5].
In Taiwan, a survey of the heat island effect in Taipei Metropolitan Area (25°08′ N, 121°30′ E) in 1999 found that the UHII (heat island intensity) comparing the city center and peripheral suburbs can reach 4–5 °C (day and night maximum values) in summer [6] compared with a 2 °C (night mean value) difference in other high-latitude countries, such as Japan [7]. More recently, in the summer of 2012 (July), high temperature heat waves above 38 °C were also recorded in Taipei and lasted for more than three days [8]. In the same year, Sun and Jian surveyed Taipei’s heat island using mobile observations and found that UHII reached as high as 6.87 °C during the day (maximum value) [9]. Furthermore, the heat island intensity of medium-sized cities in the tropical region of Taiwan in 2018 was comparable to that of large cities (4.1 °C, day maximum value) [10], indicating that the urban high temperature in Taiwan is a cause for concern and an urgent urban issue. In addition, some studies have also found that the high temperature in summer caused by UHI will cause public health problems such as the increase of heat strokes during the day [7], and an increase in the number of tropical nights (minimum temperature ≧ 20 °C (Spain), 25 °C (Japan)) leads to an increase in the morbidity and mortality of the elderly or people with chronic diseases [7,11,12]. In this sense, the UHI can also be considered as a new meteorological risk in subtropical and tropical cities under the global warming.
Previous research of the urban climate was limited to existing equipment and technology, and it was often only possible to analyze through limited weather station data, resulting in more practical applications that could only provide qualitative suggestions [1,5,13]. However, in the face of urban land management, building control, urban planning, and other policy studies that need to comprehensively consider multiple factors, it is difficult to establish specific and clear management measures without quantitative data. Around 2010, with the advancement of computer technology, urban climate problems could become quantitatively analyzed, with various complex factors investigated through computer numerical simulation technologies such as CFD (computational fluid dynamics) [7,14,15,16,17,18,19]. Through a variety of mathematical and physical equations describing the microclimate of the environment combined with 3D spatial numerical data, CFD can effectively quantify and analyze the possible effects of various space control strategies, hence it has become an effective management tool in urban development policies.
Current research on heat islands using CFD can be classified into two aspects: mechanism and improvement strategy. In terms of mechanism research, the main focus is on the influence of the characteristics of the urban physical environment, on temperature, or thermal comfort, and the simulated urban models are mostly simple and ideal models [20,21,22,23,24,25,26,27,28,29,30,31]. The main mechanisms to be explored include: (1) the impact of the type, density, and configuration of street or roof plants on the thermal environment [22,23,24,25,26,27,28,29], (2) the influence of urban geometric factors (SVF: Sky View Factor, H/W: The ratio of the canyon height (H) to canyon width (W)) on the thermal environment [24,26], and (3) the influence of building configuration, height, and orientation on the thermal environment [24,30,31]. At the same time, to ensure that the studies of urban characteristics in different countries have the same reference benchmark, there are also mechanisms to include such classification considerations [26] after Stewart and Oke [32] proposed in 2012 the classification definition of urban types (such as LCZ: Local Climate Zone Classification).
In the discussion of improvement strategies, urban models are mostly complex blocks, and the simulation parameter settings are based on the actual urban situation’s investigation and research data [15,33,34,35,36,37,38,39,40,41,42,43,44,45,46,47,48,49]. The main strategies discussed are: (1) street tree planting [33,34,35,36,37,38,39,40], (2) improvement of albedo on pavement/wall surfaces [41,42,43], (3) increase of roof greening [44,45,46], and (4) changing planting species or LAD(Leaf Area Density) [25,47,48,49]; the main thermal environment exploration project is also temperature and comfort (PMV). In addition, simulations of the thermal environment before and after urban development can be performed [43], or simulation analysis can be done of the current urban thermal environment [48,49]. However, in addition to global warming, flooding caused by heavy rainfall is also one of the important environmental issues, with the emergence of the concept of sponge cities, including permeable pavement, which is a combination of heat mitigation (reduction of surface temperature) and altering the water environment. Runoff reduction is one of the most common sponge city methods [50,51] but has not been discussed in heat island studies.
In addition, because the urban structure of each region is different, simple models often cannot reflect the problems of actual blocks, so theoretical research needs to be applied to the actual block environment to truly reflect its mitigation benefits. In temperate countries, such as Canada and Italy [36,40] or tropical deserts and Mediterranean countries, e.g., Egypt, [38] researchers have analyzed the actual blocks, while Taiwan, which is located in a tropical island, has rarely conducted research on the improvement strategies of its actual blocks. Although the theoretical mechanism of the urban structure is mature, it is difficult to implement to actual policy.
Therefore, this study selected large tropical cities with large heat island effects in Taiwan [6] and used actual CFD simulation tools to analyze their current thermal environment conditions, evaluating the spatial elements of three types of blocks: buildings, streets, and parks. Improvement measures in different heat islands, thermal environment improvement benefits under water permeability, planting species and green coverage, and related mechanisms, are discussed. Finally, suggestions for the improvement of the existing rules on urban planning and design are put forward.
2. Materials and Methods
2.1. Simulated Area and Site Characteristics
The study site is located in the megacity of the tropical region of Taiwan, the actual center block area of Kaohsiung City (22°6′ N, 120°00′ E). The site area is 23.9 ha, and it is a mixed commercial district. The ratio of land use types and the ratio of buildings on different floors in the study area are shown in Table 1 and Figure 1. The highest proportion of land use type is residential and commercial mixed buildings, which account for about 57%, followed by roads (40%). Building heights of below 5 stories is approximately 74%, 6–14 story buildings account for 22%, and the average building height is 5.2 stories.
2.2. CFD Simulation
2.2.1. ENVI-Met
The CFD simulation software used in this study was a CFD simulation tool developed by a German research group that suitable for outdoor environments, ENVI-met Version 4.43 (www.envi-met.com). The simulation tool is a prognostic non-hydrostatic model composed by a three-dimensional main model and one-dimensional atmospheric boundary layer model. Based on the fundamental laws of fluid dynamics and thermodynamics, it can reproduce the outdoor microclimatic and physical situation of urban or rural spaces by accounting for the interaction of surface, plants, and air to evaluate the thermal conditions [51,52]. Several studies have shown that ENVI-met can simulate both spatial and temporal temperature and wind speed for the evaluation of microclimate in both simple and complex urban areas [20,21,22,23,24,25,26,27,28,29,30,31,33,34,35,36,37,38,39,40,41,42,43,44,45,46,47,48]. A recent review by Tsoka et al. [53] also provided evidence of its suitability for urban climate analysis and examined mitigation strategies.
2.2.2. Parameter Setting
The space setting was as follows: simulation grids 55 × 65 × 40, horizontal grid resolution = 10 m, and vertical grid resolution = 3 m (Table 2) The initial setting of the meteorological environment was based on the days on which the highest summer temperature (from June to September) of the Central Meteorological Administration’s Sinsing station [8] from 2014 to 2019 exceeded 35 °C. The initial simulation time was set as 0:00 [54], the initial temperature was 29.7 °C, wind speed 1.9 m/s, wind direction was west wind, and humidity was 52%–76%. The total simulation time was 48 h and the dates after 24 h of simulation were used for analysis and evaluation (Table 3). Other settings of surface materials and planting are shown as Table 4.
2.2.3. Simulation Items and Accuracy Verification
The simulated thermal environment items included air temperature, surface temperature, wind speed, humidity, MRT (mean radiation temperature), and finally, a comprehensive thermal comfort assessment based on the simulated thermal environment results. The thermal comfort indicators used in this research, SET (standard effective temperature) and PET (physical equivalent temperature), include human physiological and environmental factors to evaluate the physiological thermal comfort produced by the heat exchange between the human body and various factors in the surrounding environment, providing a comprehensive assessment of the comfort of the thermal environment. SET is a general comfort index in the field of architecture, proposed by Gagge et al. [55]. It is a comprehensive index with the same thermal sensation obtained by the subjective responses of subjects to different air temperatures, relative humidity, wind speed environment, and solar radiation intensity, and is applicable for outdoor thermal comfort evaluation. PET was proposed by the German scholar, Höppe [56] and is a comfort index suitable for outdoor spaces. It considers all the physiological functions of the human body, including vasoconstriction and expansion, physiological sweating, and physiological thermal balance. It is mostly used for outdoor thermal environment evaluation. The value of SET and PET, which corresponds to the human body’s thermal sensation, is shown in Table 5.
The simulation results of the thermal environmental factors and comfort on the selected dates at the hottest time (2:00 p.m.) of the day were comparatively analyzed. The simulation results of each grid, including the average value, the maximum value, and the minimum value of each analysis item, were imported into Excel to calculate.
In the verification of simulation results, because the correctness of the CFD radiation calculation affects the accuracy and reference of the final simulation results, the surface temperature generated by the CFD radiation calculation and the air temperature result obtained by the final fluid calculation were used as reference indicators and to compare the results with similar land cover properties or urban spaces to examine the accuracy and referentiality of the simulation results [14,15].
2.3. Simulated Configurations
Based on previous research regarding the heat island mechanism, it is known that the land cover type and urban geometry formed by a building group are the main influencing factors [58,59]. However, because changes of building geometry need to change building height and street width, it is very difficult in terms of policy implementation and cost to make changes for a mature existing block. Therefore, the improvement strategies analyzed in this study were mainly on land cover types, including (A) street planting of trees; (B) roof greening strategies, which have been considered in previous studies; and (C) permeable paving with both water retention and heat reduction effects to reflect the flooding caused by global changes. Simultaneously, according to the three most common urban space units, streets, building areas, and parks in actual urban blocks, different degrees of greening or permeable pavement improvement strategies were implemented. The five practical management policies that we used and are easy to implement were: (1) C1 changed to permeable pavement, (2) C2 increased the GCR of the street to 60%, (3) C3 changed to permeable pavement with a green coverage ratio (GCR) of 60%, (4) C4 changed to permeable pavement with a GCR of 60% and a park GCR of 80%, and (5) C5 changed to permeable pavement, GCR was 60%, park GCR was 80%, and public building roof GCR was 100%. They were compared with the current situation (B0) to understand the UHI improvement benefits of each case as a reference for urban planning or design. The detailed simulation conceptual architecture is shown in Figure 2. The detailed description and related settings of each scheme are shown in Table 6 and Table 7.
In addition, due to the degree of street GCR, there should be a significant difference in the cooling effect of the UHI [22,23,24,25], however, there are few studies on real blocks. Therefore, this study further explored the impact on the thermal environment of the different GCRs of trees near streets by adding cases C2a, C2b, and C2c. Simultaneously, due to the previous research of the strategy of roof greening, comprehensive greening roofs were assumed in the study area. Case C5 and C5a were added to compare the research results of this study with other studies and understand the difference between roof greening of total block area (restrictions on private buildings to be greened).
2.4. Analysis at Different Levels
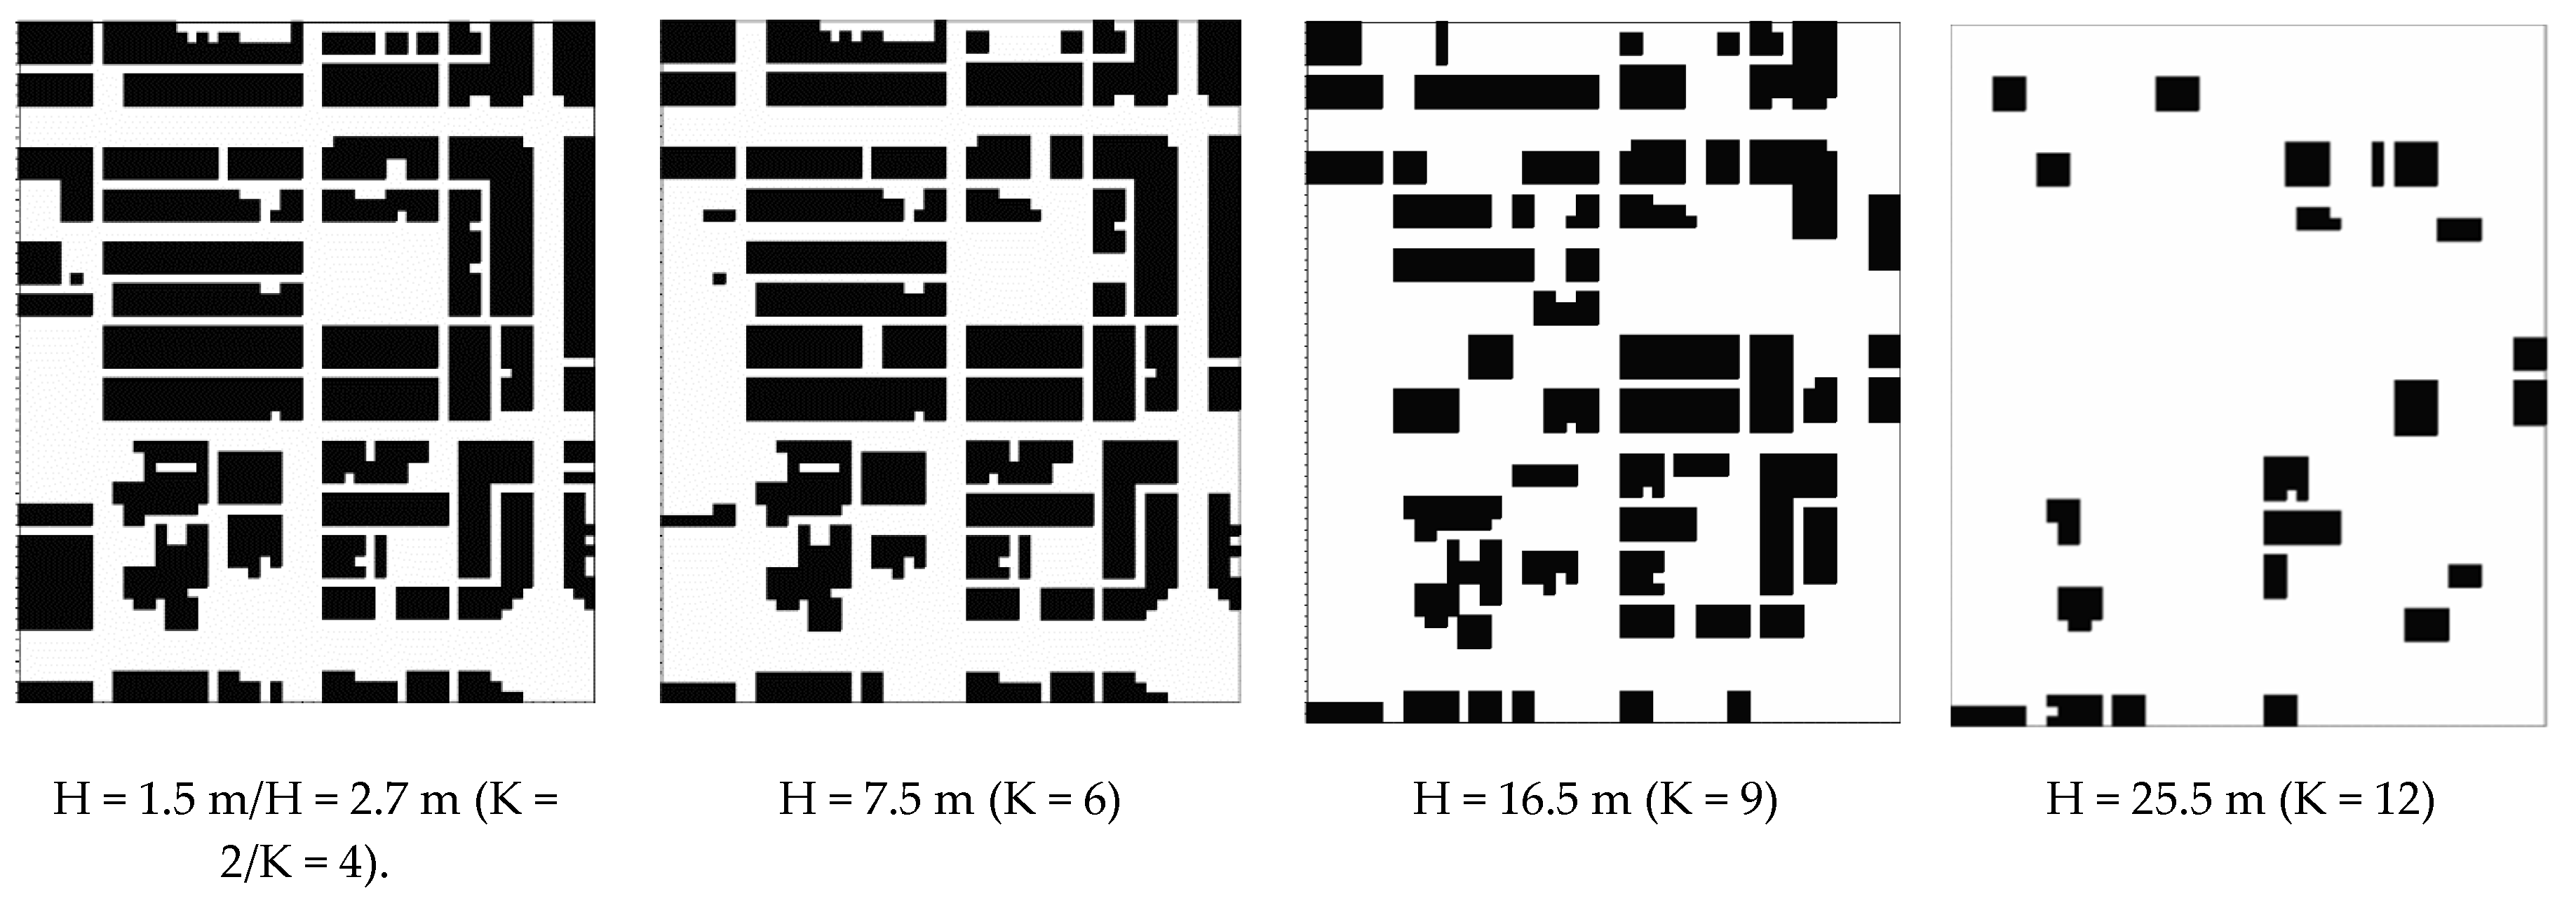
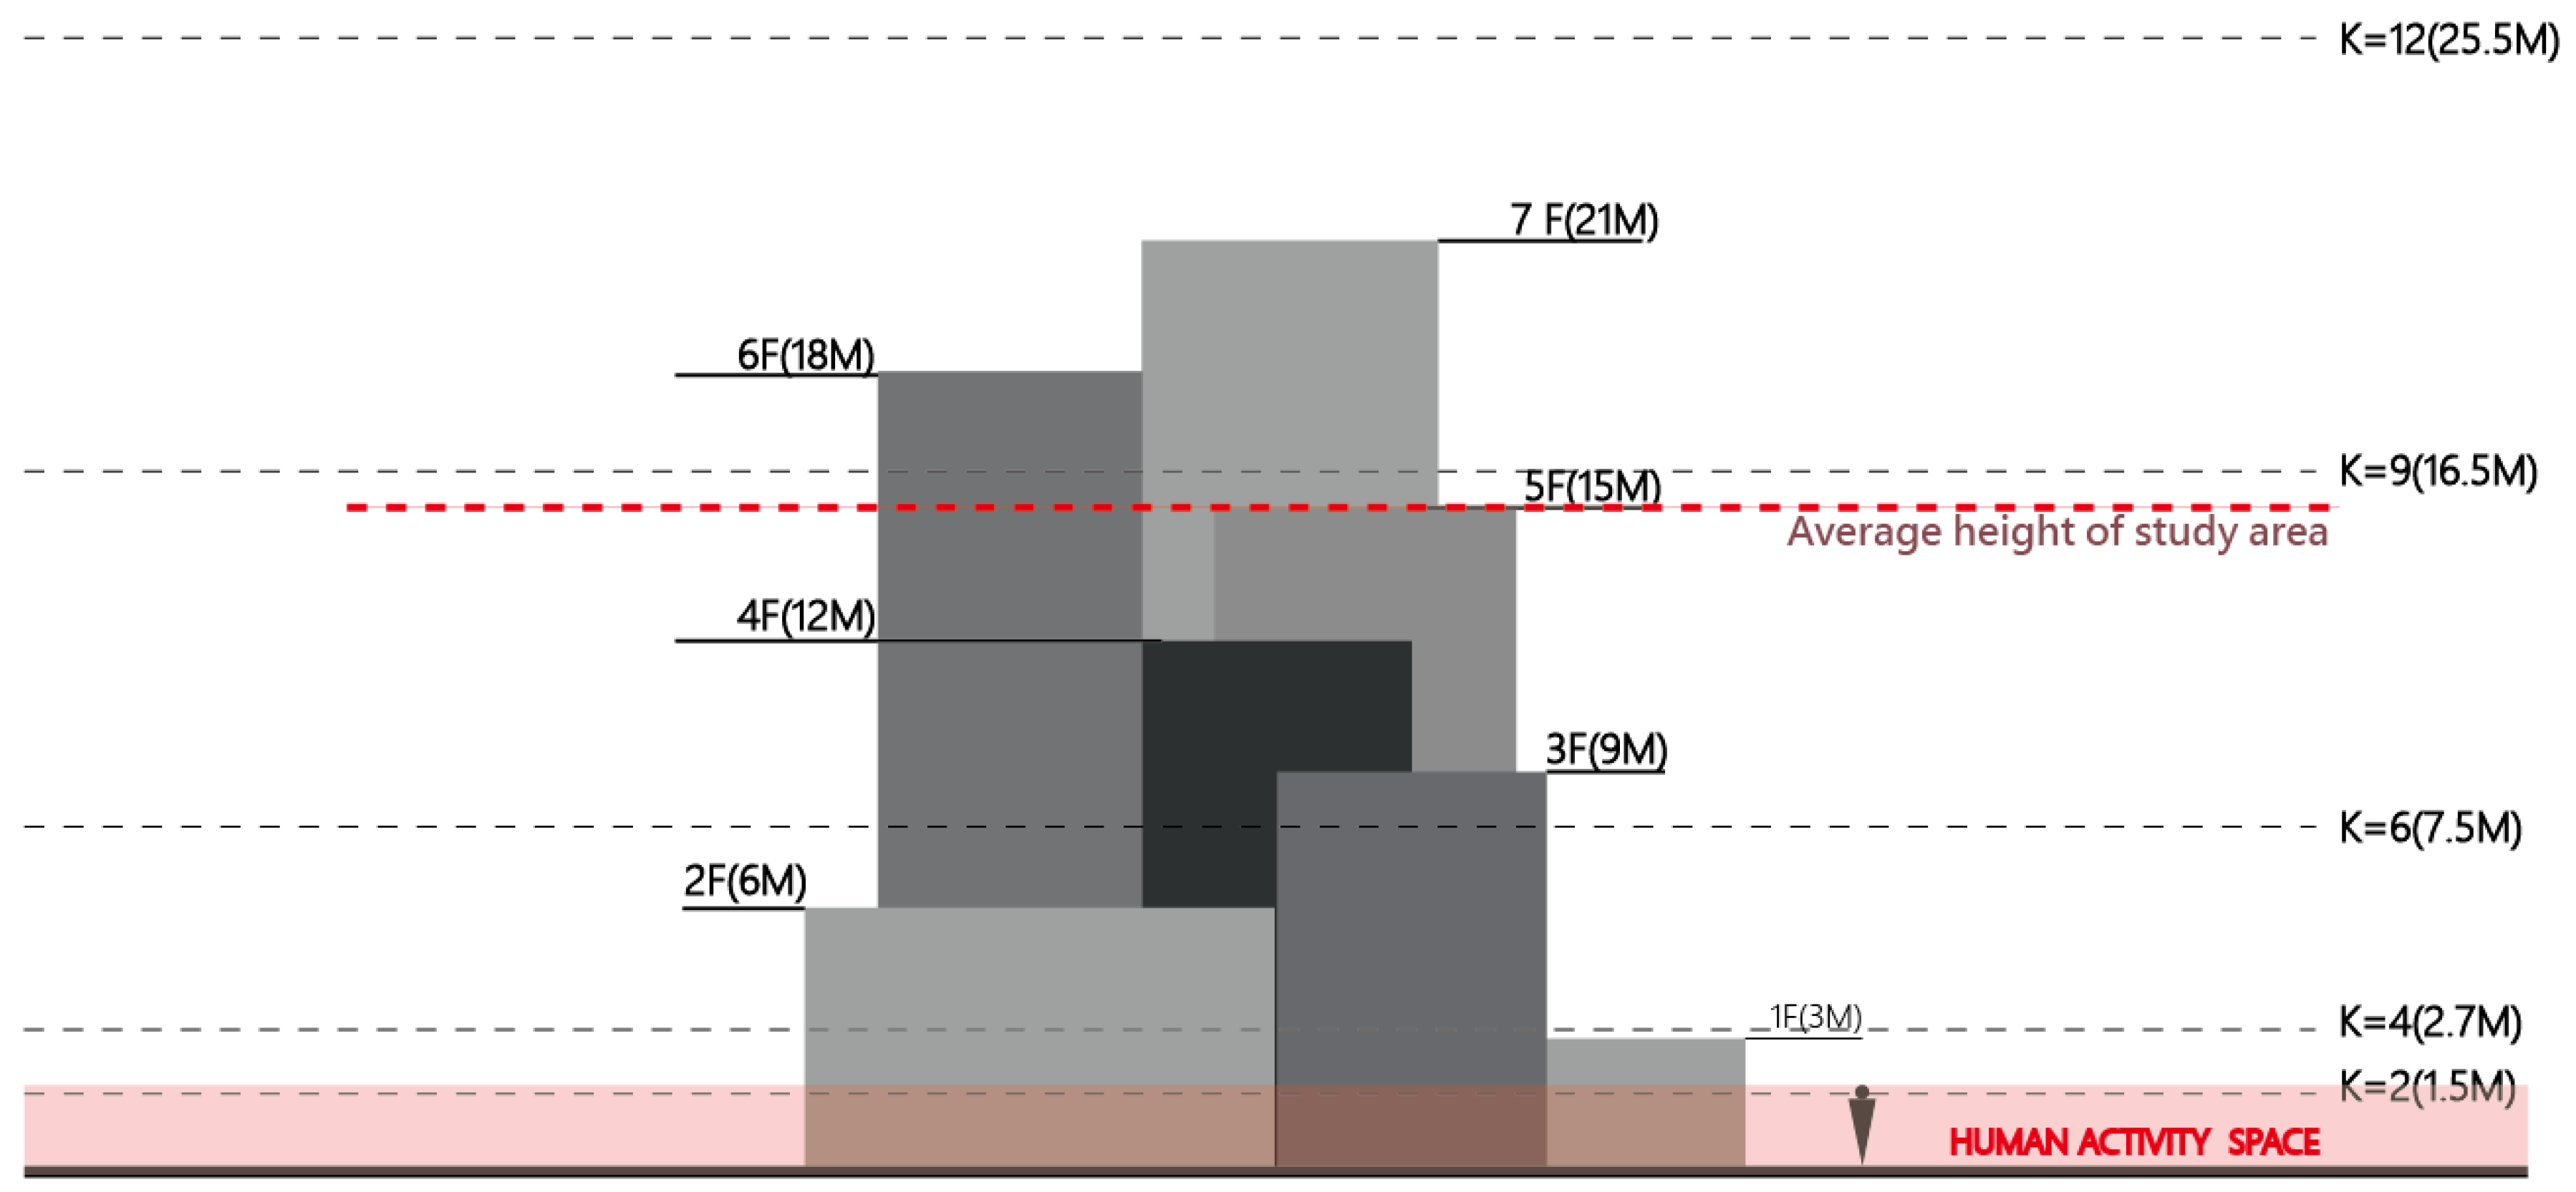
As the average number of floors in the building in the simulation area is 5 and the overall average height of the Cianjin District is 21 m, the divisions were pedestrian height (1.5 m), 1F (3 m), 2F (6 m), 5F (15 m), 8F (24 m) (height of less building obscuration) to explore the difference of the improvement of the microclimate environment at the near-surface pedestrian level and different height levels between the cases (Figure 3 and Figure 4). In addition, due to the limitation of the simulation results of the vertical grid, the actual vertical floor plan heights were 1.5 m (K= 2), 2.7 m (K = 4), 7.5 m (K = 6), 16.5 m (K = 9), and 25.5 m (K = 12), respectively (k represents the grid point of vertical resolution.).
3. Results and Discussion
3.1. Verification of Simulation Results (2:00 p.m.)
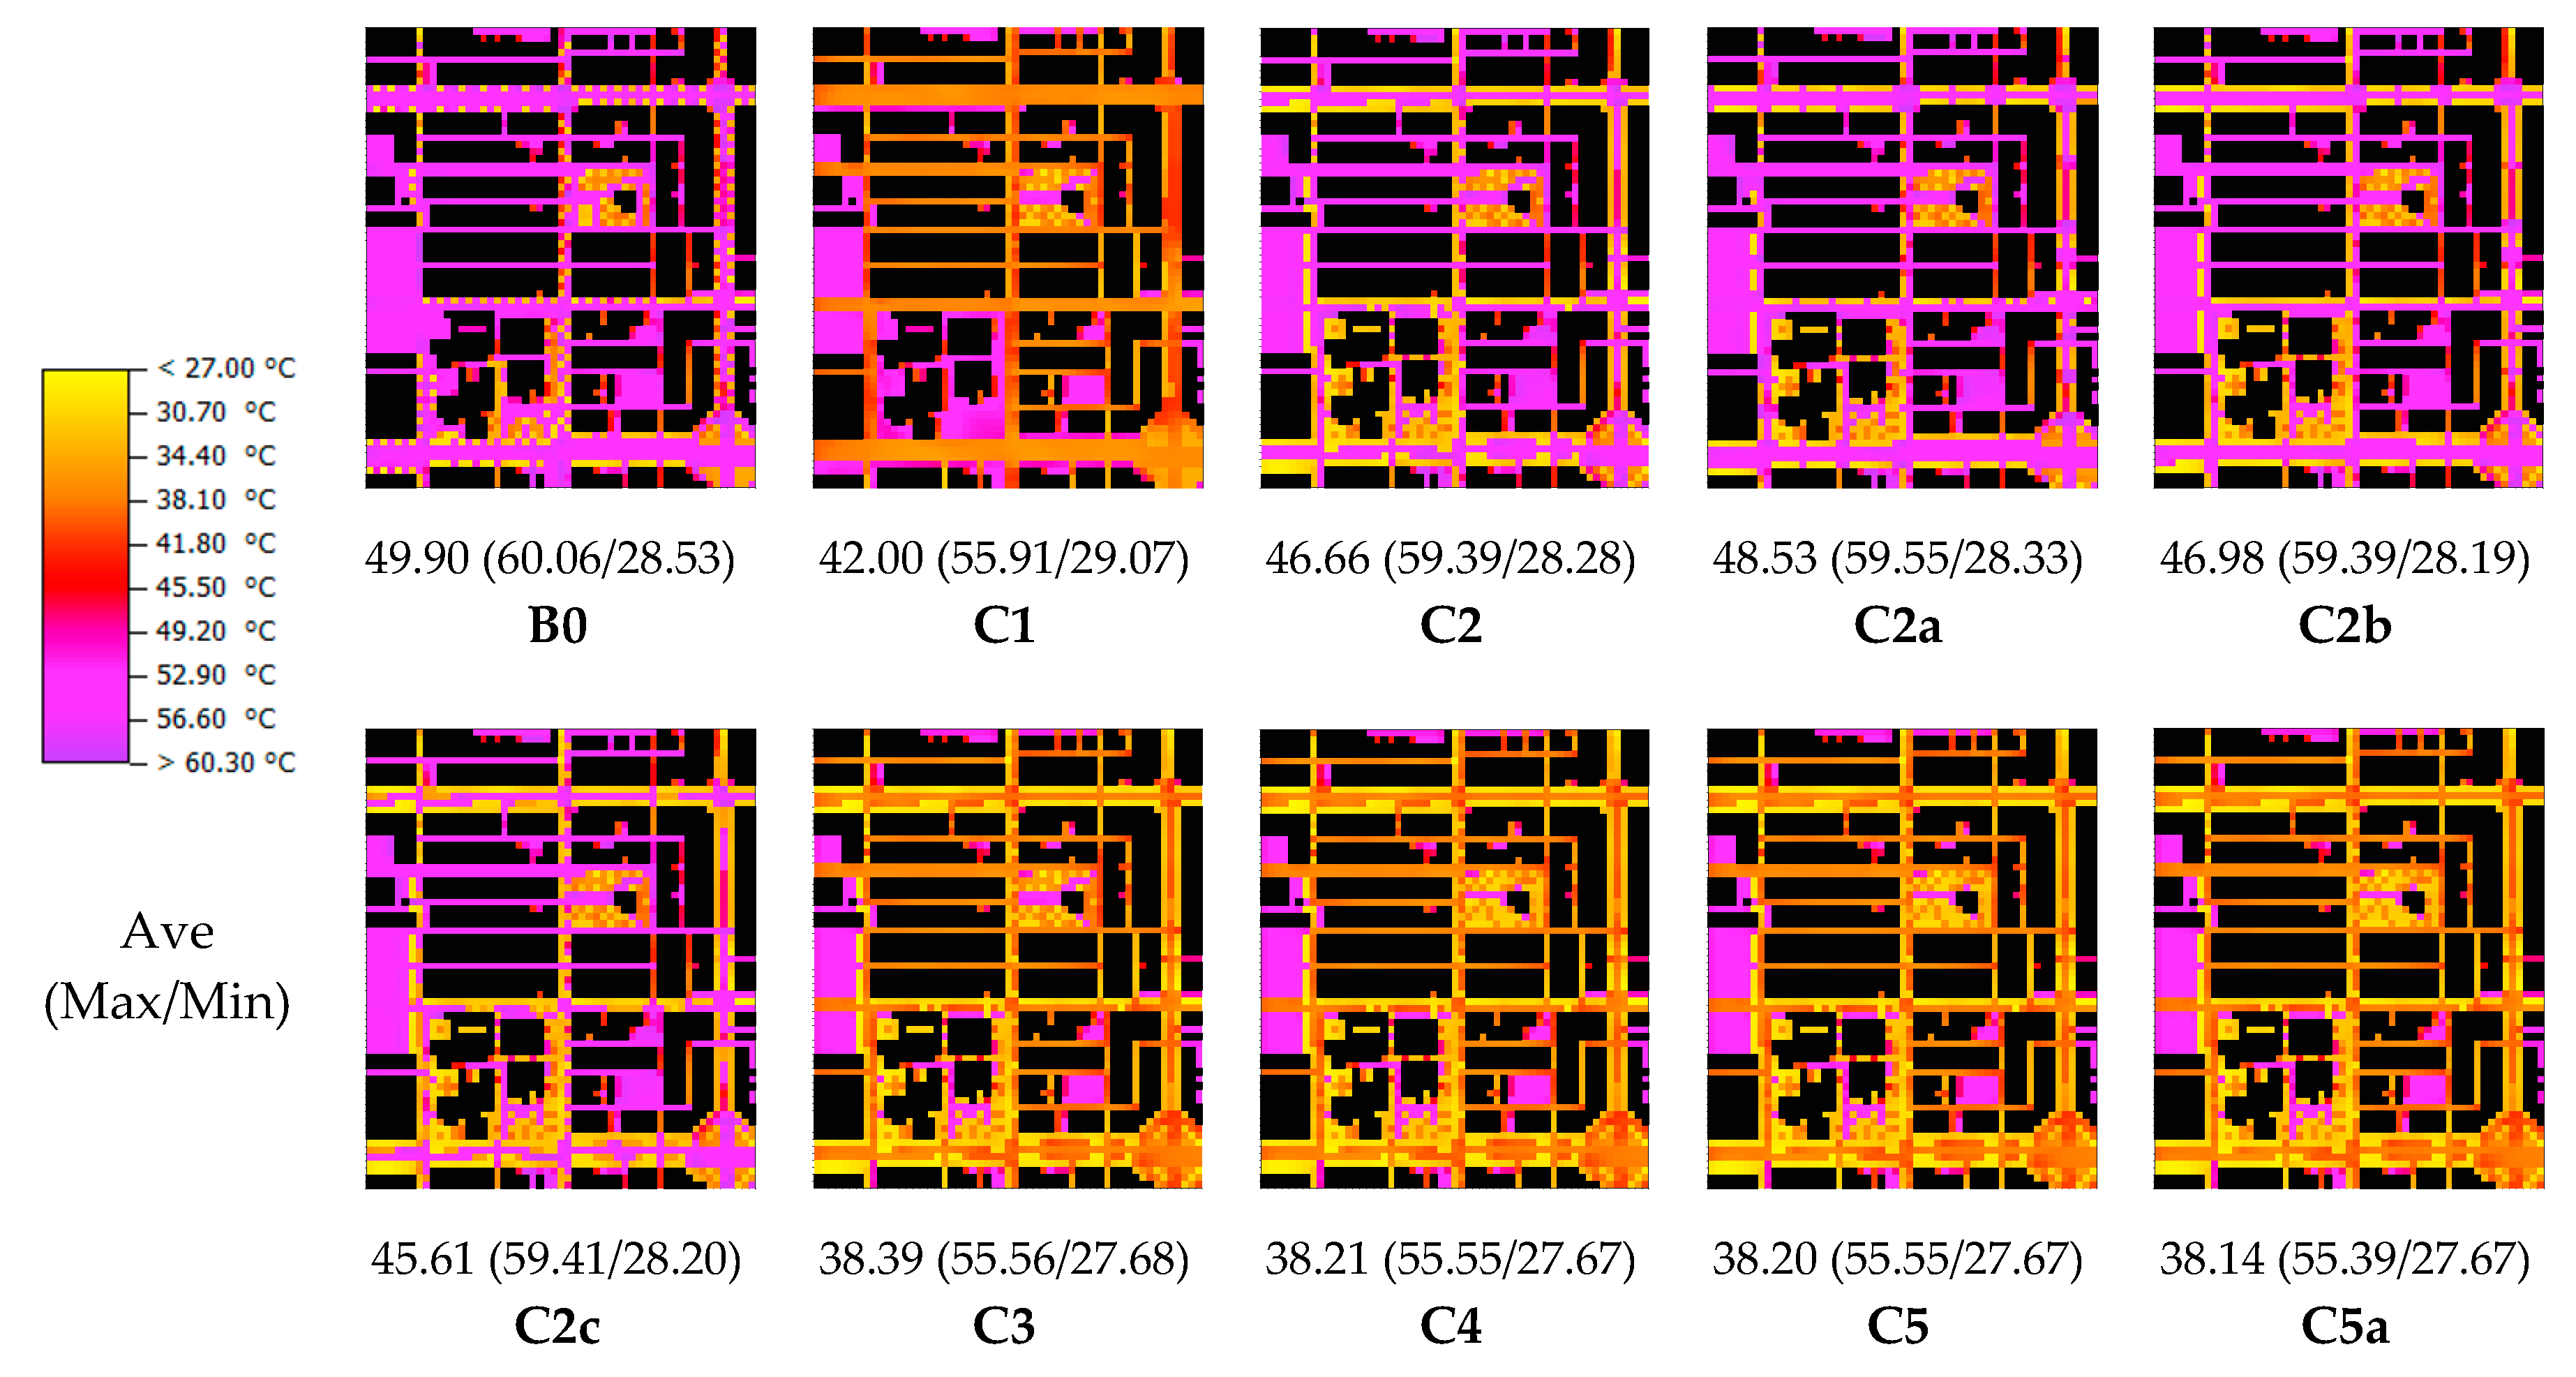
The surface temperature simulation results of all schemes are presented in Figure 5, showing that the surface temperature of the artificial pavement was between 50 °C and 60 °C, the surface temperature of the permeable pavement was 30–35 °C, and the ground surface temperature under the canopy was 28 °C, consistent with the trend and numerical range scale of the measured results of related land cover types [60,61,62].
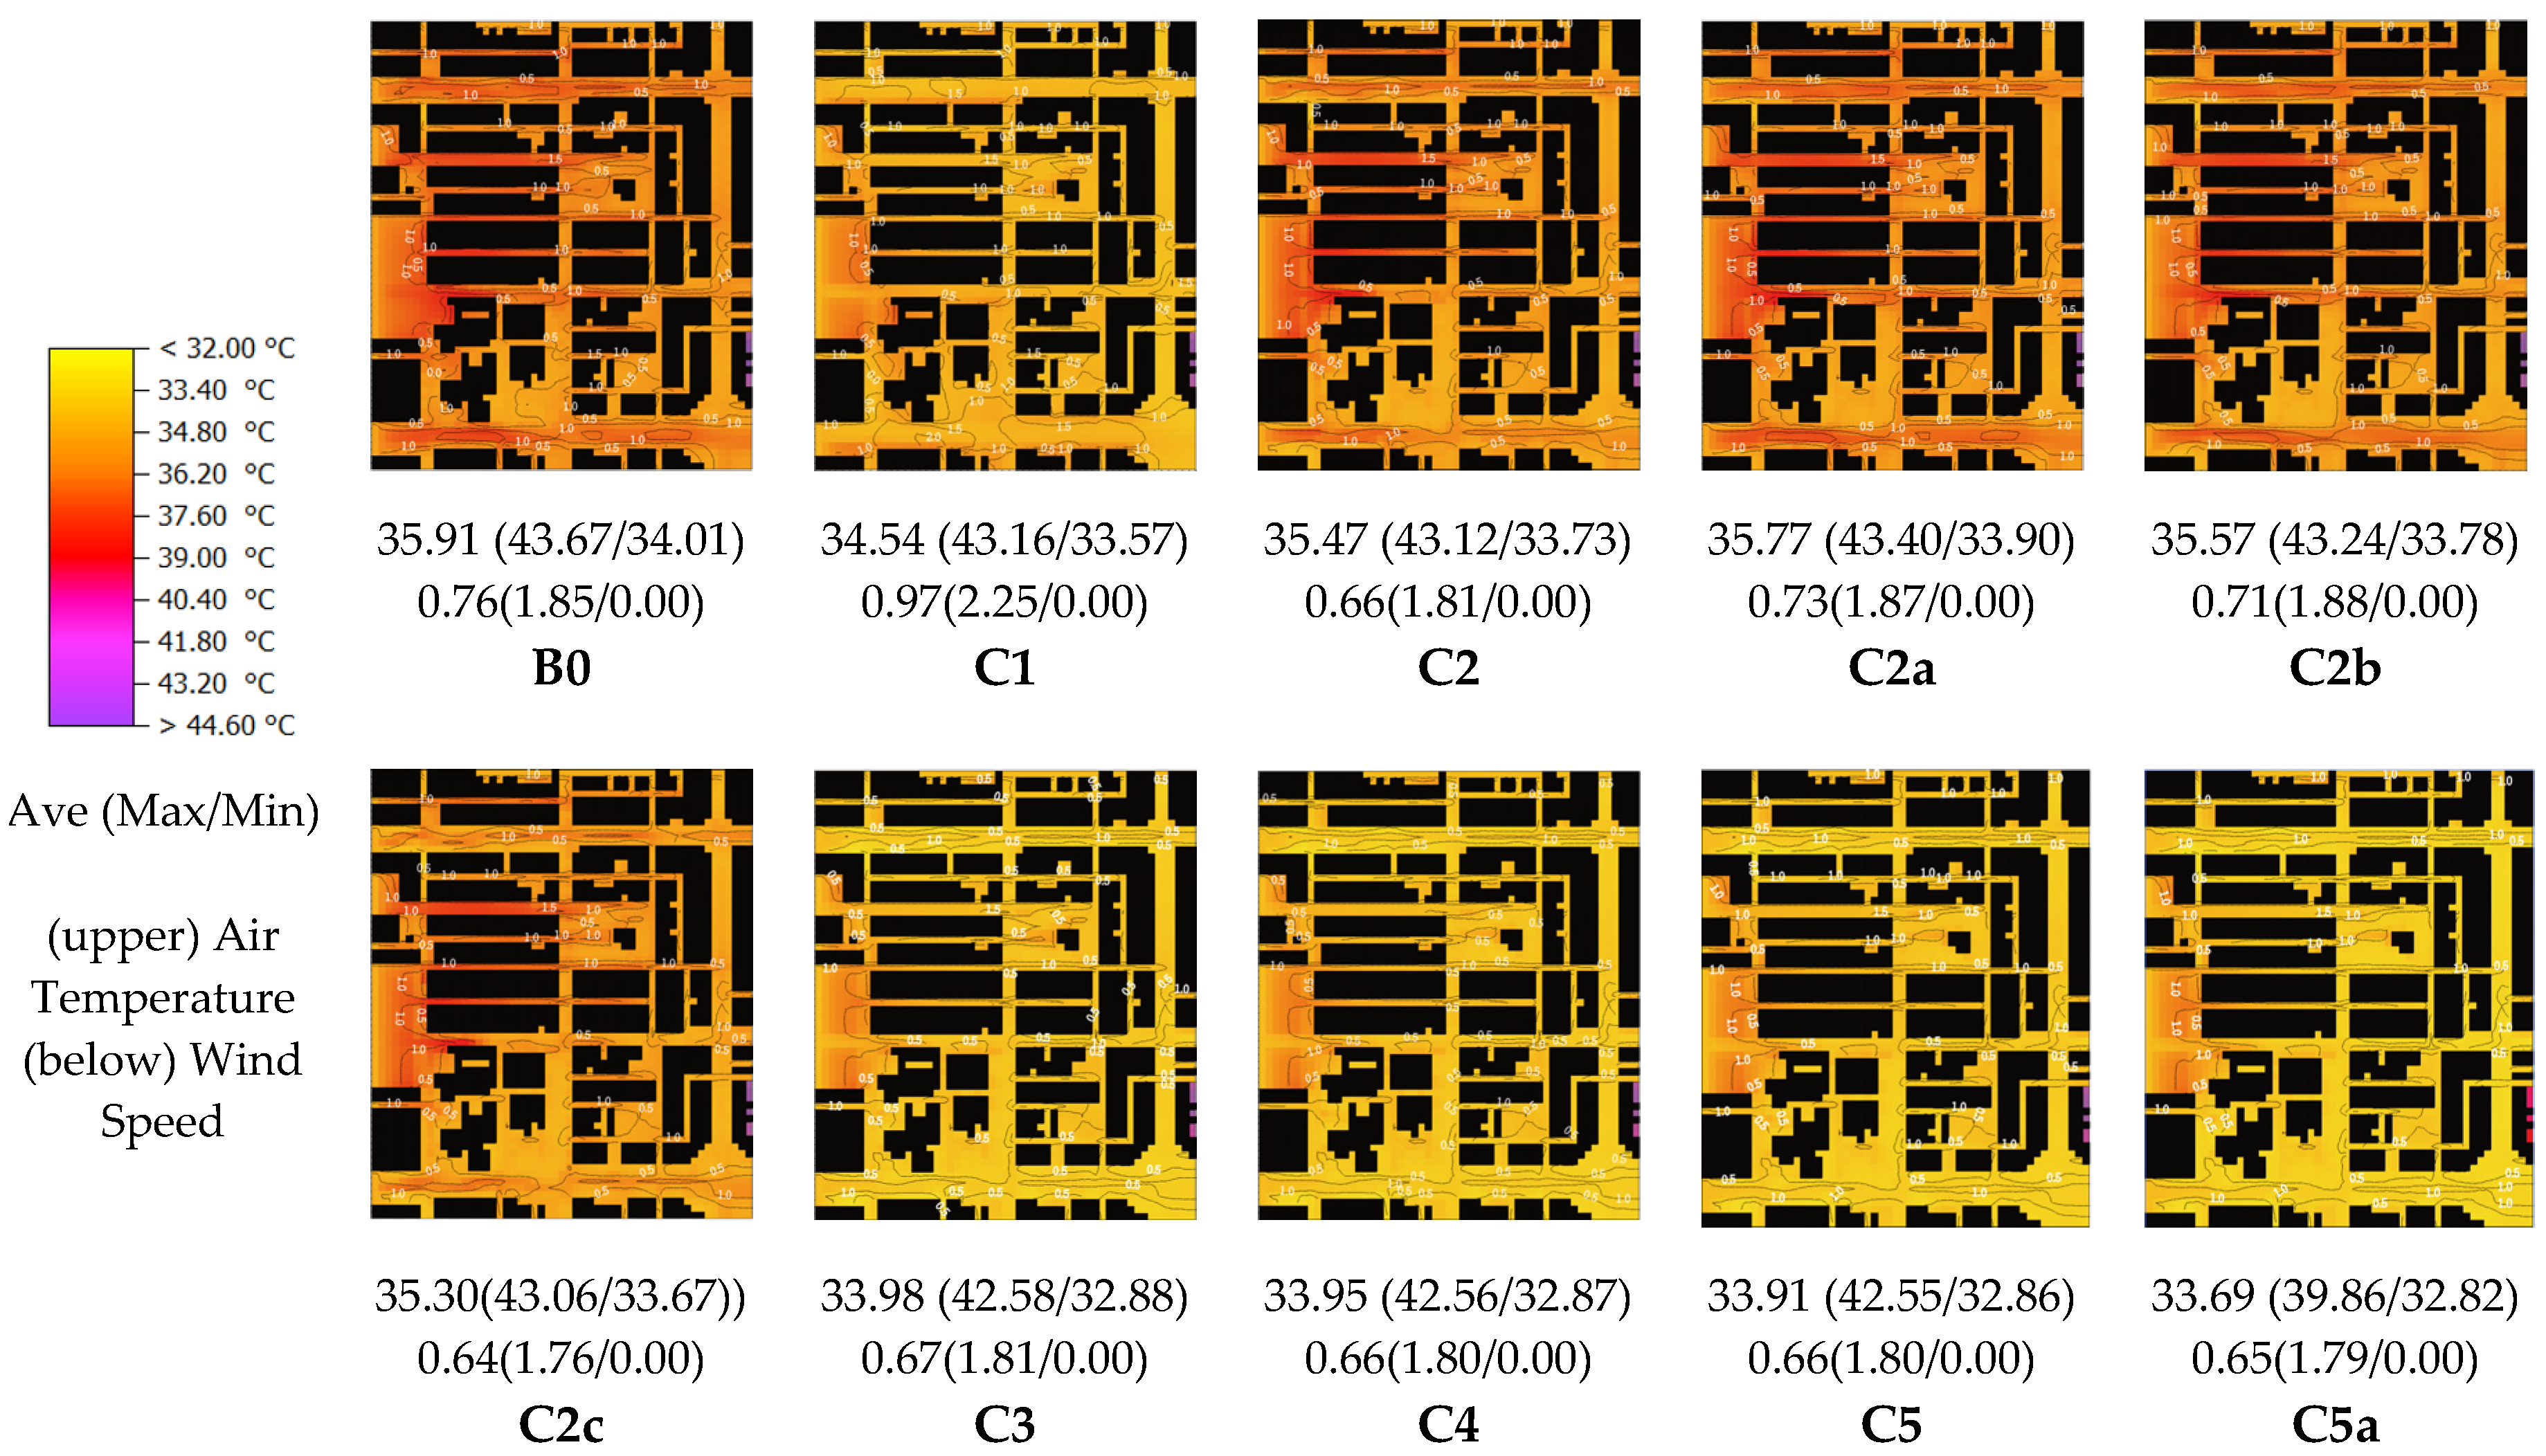
In addition, in all schemes, the average temperature of the streets on the upwind side of the park was 37.5 °C (representing urban temperature conditions without the influence of green space), dropping to around 33–34 °C after entering the park. This effect extended to the adjacent or leeward street (Figure 6), which matches the trend and numerical range scale obtained from the actual research results inside and outside the park [63,64]. Therefore, the simulation results have a certain degree of reference.
3.2. Thermal Environment Status in the Block
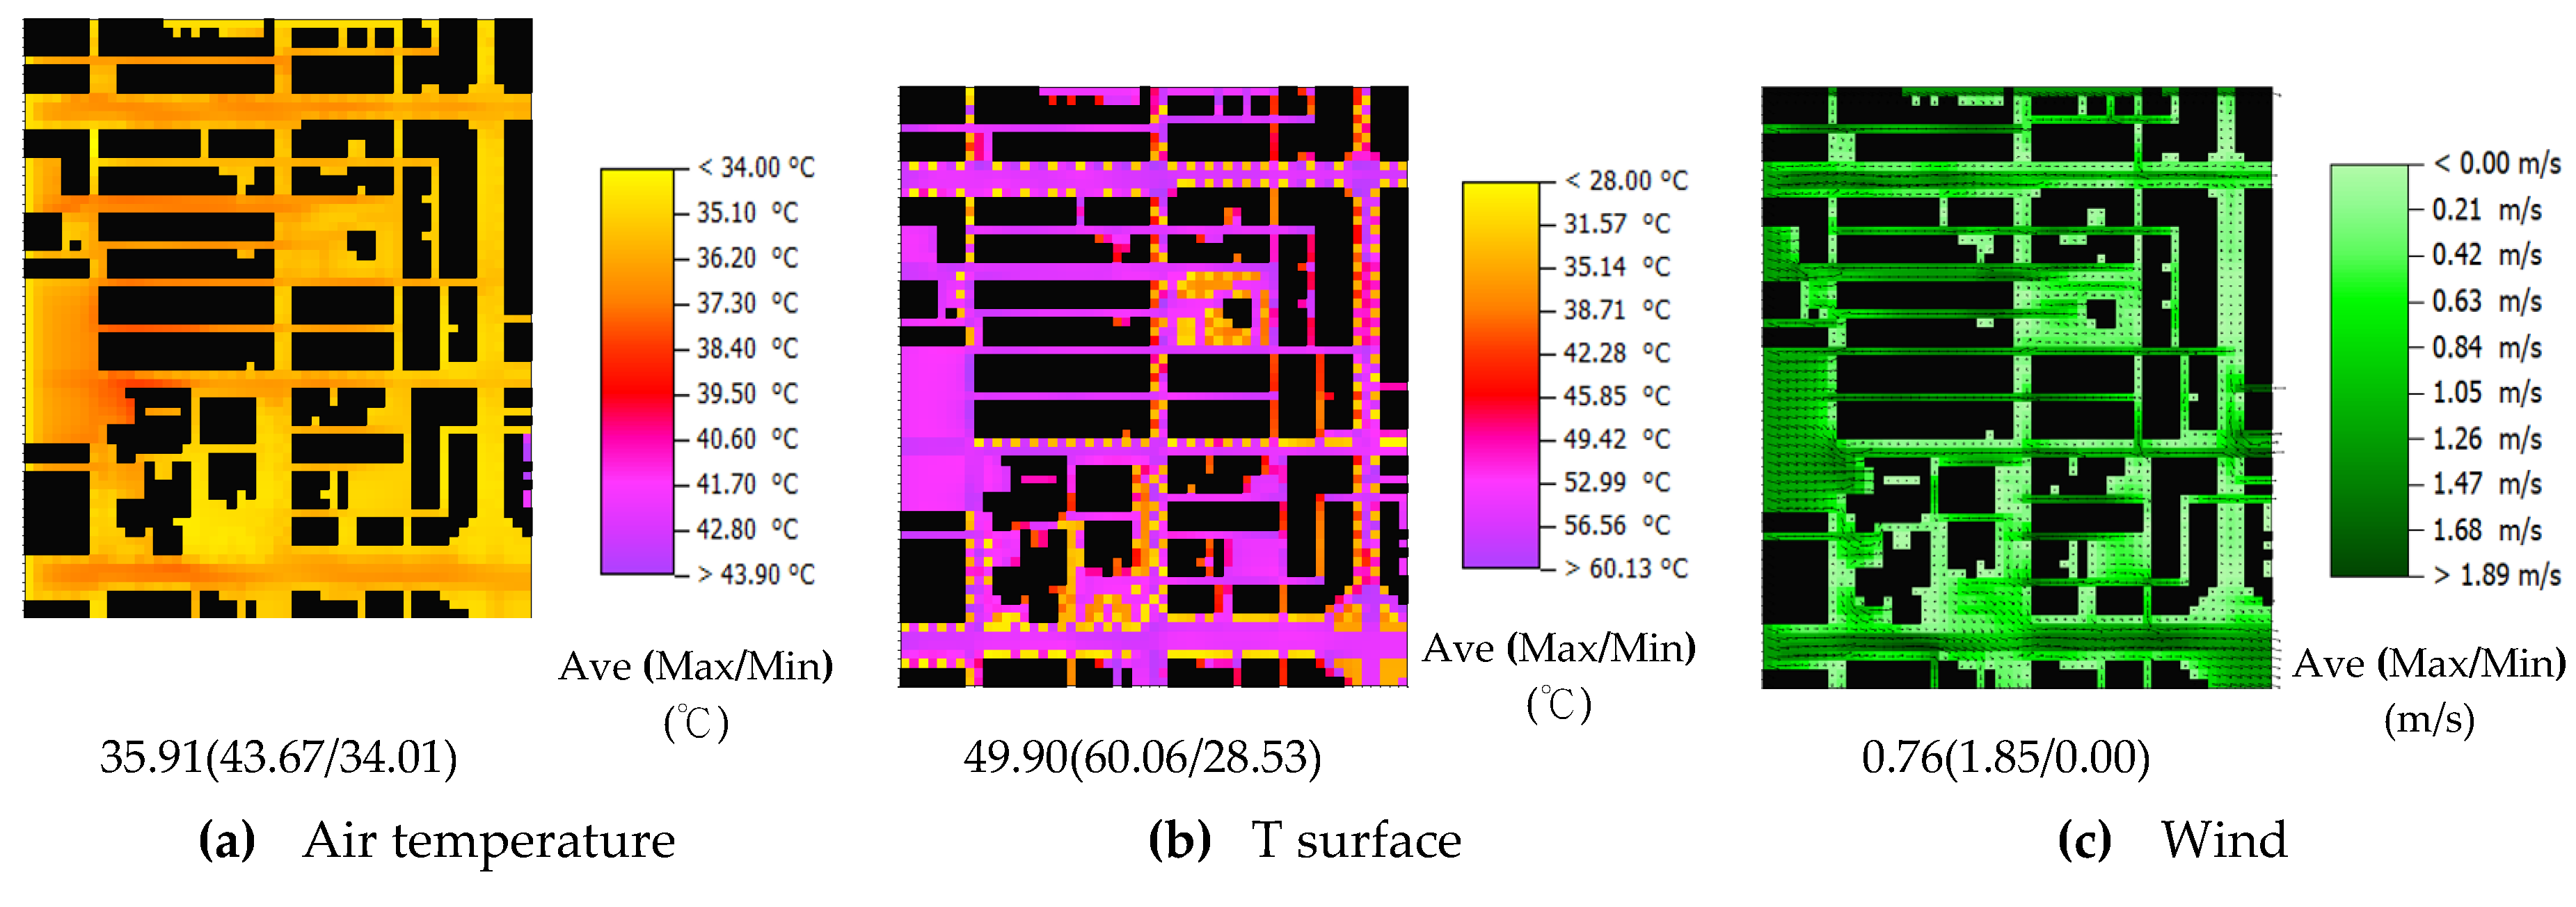
The simulation results for B0 of the current situation of the block at H = 1.5 m is provided in Figure 7, showing that the average surface temperature of the street was 50.0 °C, the average wind speed was 0.76 m/s, and the street parallel to the wind direction was east-to-west. The street with the highest wind speed reached an average wind speed of 1.8 m/s more than 2.3 times the block’s average. The average air temperature of the block was 36.0 °C. Regarding the comfort results, under the existing environmental conditions, the SET of the block was 38.3 °C on average, which reached the very hot range of thermal sensation. In addition, the average value of PET was as high as 50.51 °C, that is, within the very hot thermal sensation range, only decreasing to 40.4 °C under the canopy of trees on the street (Table 5).
3.3. Pedestrian Activity Layer Benefits of Each Improvement Strategy (H = 1.5 m)
3.3.1. Analysis of the Effect of Temperature Mitigation and Mechanism
The temperature simulation results are shown in Figure 8a; the maximum cooling effect of C3, C4, and C5 was –1.93, –1.96, and –2.00 °C, respectively, followed by –1.37 for C1, and, the lowest was –0.44 °C for C2. This means that a GCR of the street of 60% and the strategy of changing the pavement to permeable (C3–C5) had the most obvious cooling effects on the overall street. Secondly was the strategies of changing the street to the permeable pavement without planting (C1), and changing the street GCR to 60% (C2) had the lowest cooling effects. Simultaneously, because the proportion of parks and public buildings in the block is only about 2%–7%, increasing the GCR of the park or the roof greening of the public buildings only increased the cooling effect of the overall block by 0.03–0.04 °C. The main reason was the difference in the reduction effect of the surface temperature, as shown in Figure 8b. The C1 case can reduce the average surface temperature of the overall block by as much as 7.90 °C, while C2 can reduce it by 3.24 °C, indicating that surface temperature has an important influence on the pedestrian temperature near the surface layer. If the water can be effectively retained through the sponge city strategy to cause latent heat to evaporate, the improvement in the thermal environment of the block will be greater than the case of a GCR of 60% at street level. Whether the street can maintain good ventilation is also a decisive factor to determine whether the urban surface can discharge heat after absorbing solar radiation. According to the wind speed simulation results in Figure 9, because C1 had no plants, the wind speed at the pedestrian layer increased by about 0.2 m/s, thereby improving the heat emission effect. The other four strategies (C2–C5) included planting trees, reducing the overall wind speed by about 0.1 m/s, but there was not much difference between each of those strategy.
3.3.2. Analysis of the Effect of Comfort and Mechanism
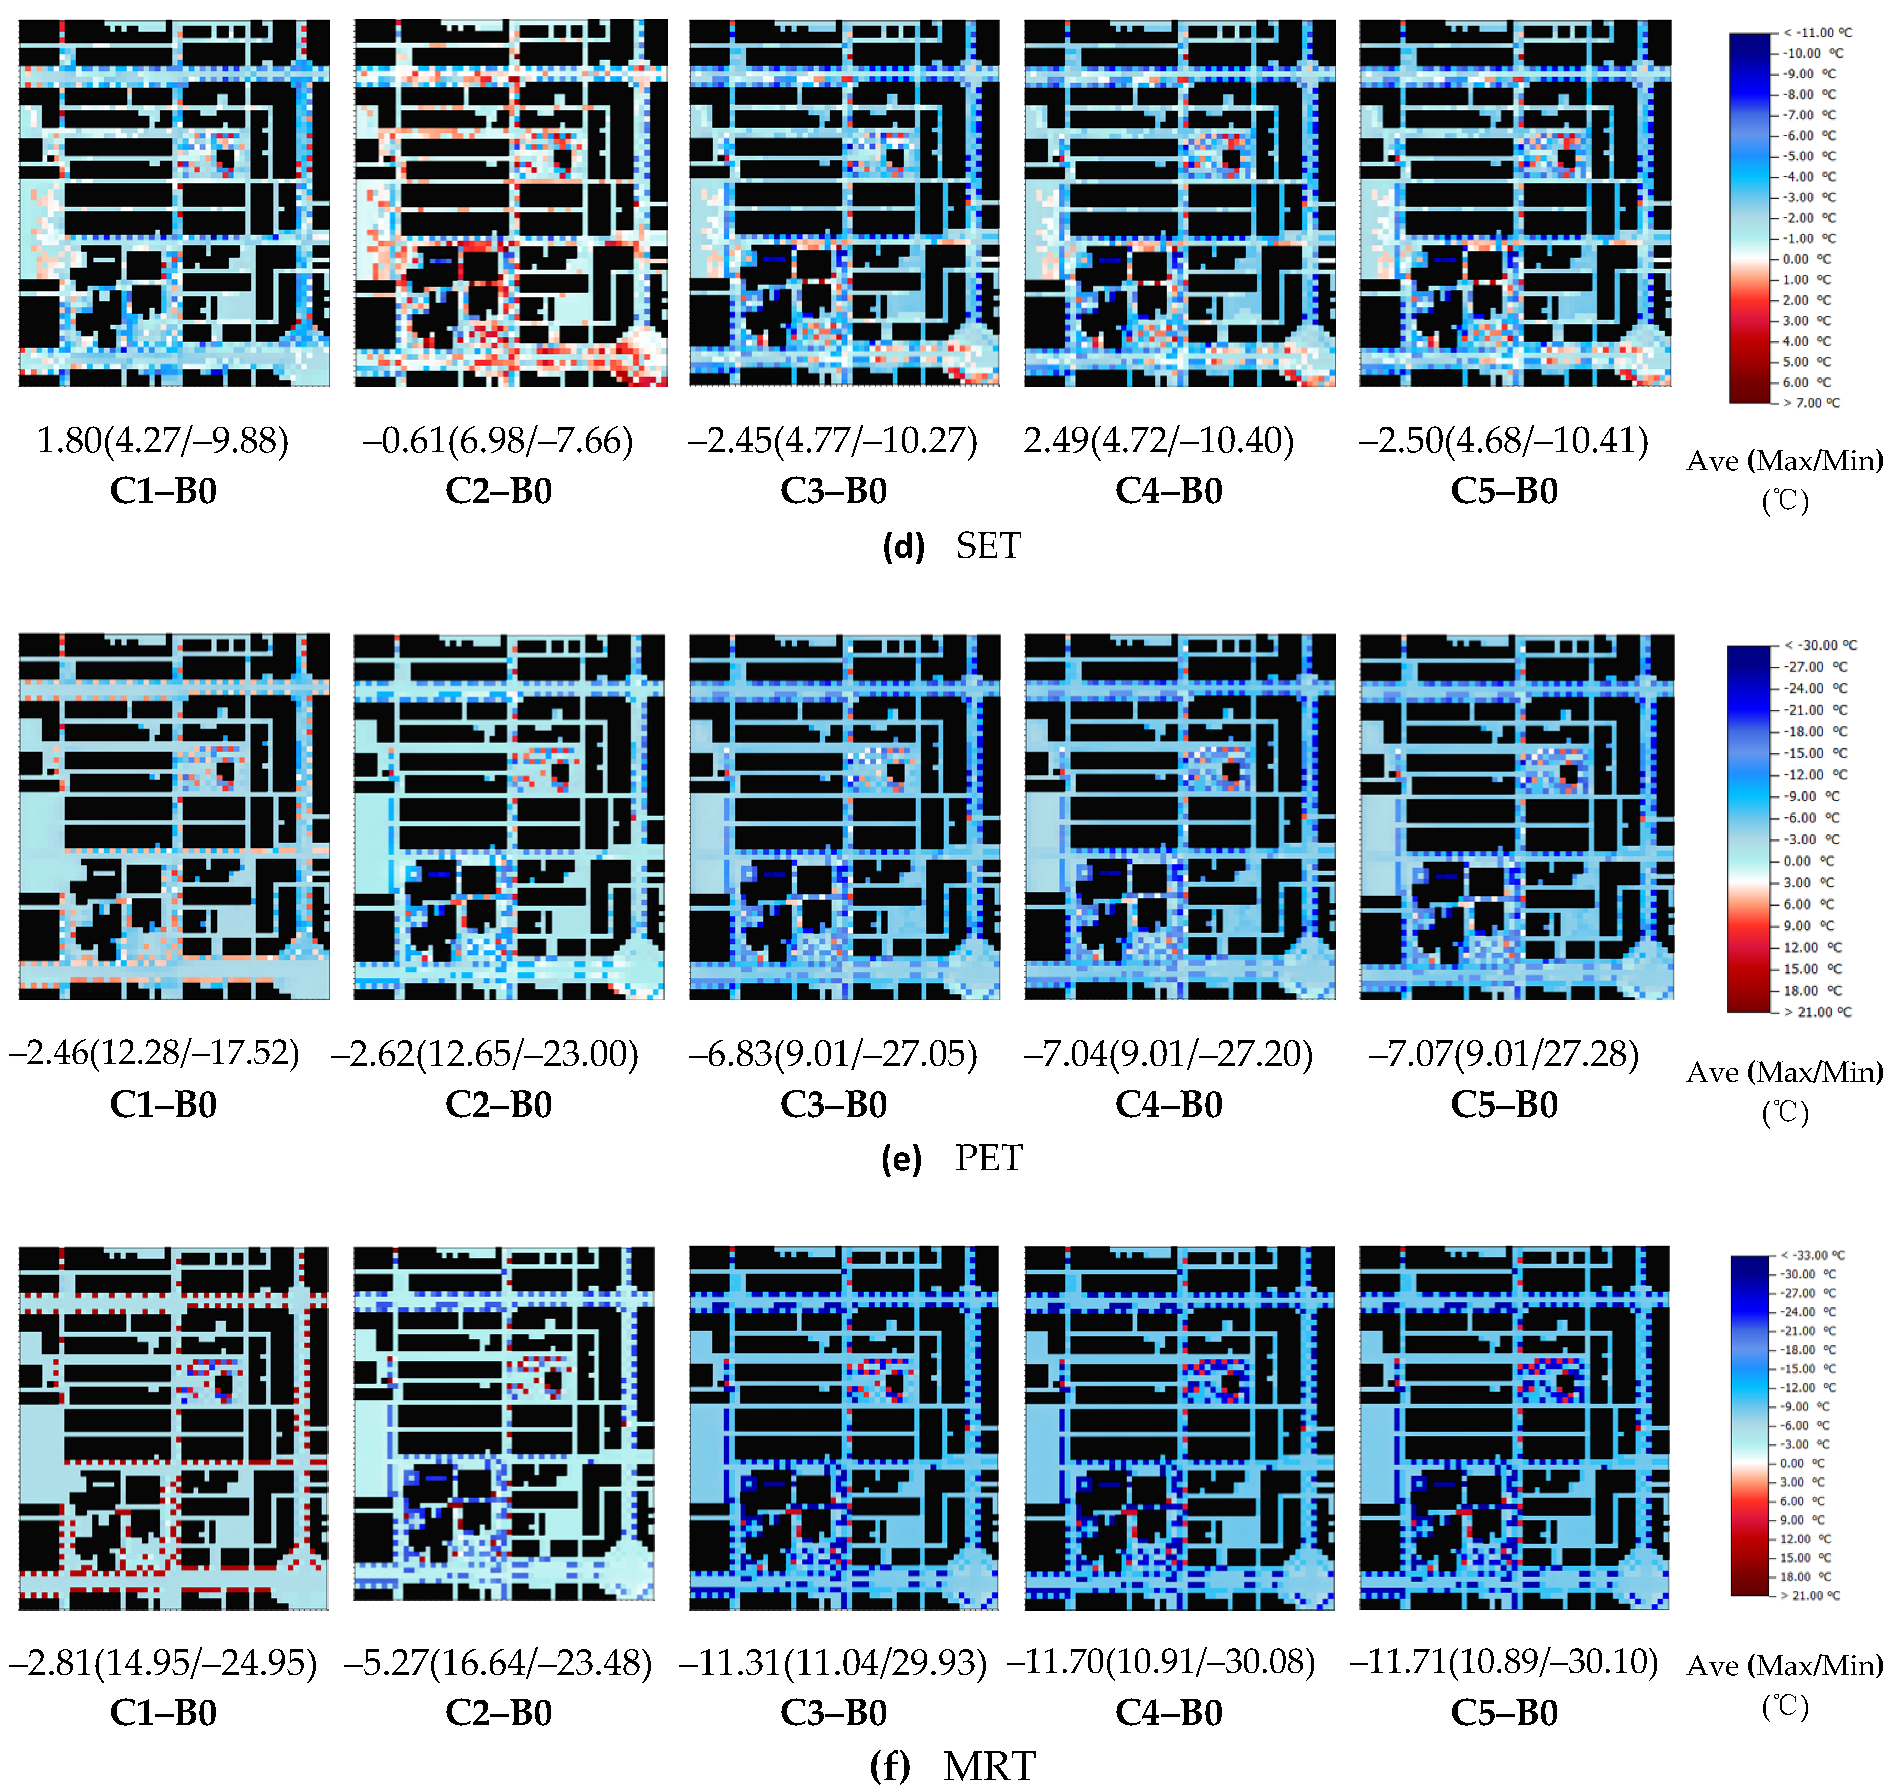
The simulation results of comfort SET and PET are shown in Figure 9 and Figure 10. The differences and characteristics of the various schemes on the SET are similar to those of the air temperature. The reduction effects of C3, C4, and C5 were –2.45, –2.49, and –2.50 °C, respectively, followed by –1.80 °C for C1, and the lowest was –0.61 °C for C2. However, there were different changes in PET, with C3, C4, and C5 all having similar mitigation effects. The largest mitigation effects were –6.83, –7.04, and –7.07 °C, for C3, C4, and C5, respectively, followed by C2 at –2.62 °C, and the lowest was –2.46 °C for C1. In addition, on average, the PET mitigation effect was larger than SET, especially for the most effective C3, C4, and C5 situations, with a difference of 4.2 °C or more. This effect can ease the comfort from very hot to hot and from cold to warm (Table 5).
Although there are many factors that affect human comfort, MRT indicates how much average long and short wave radiation the human body absorbs [64]. The simulation results are shown in Figure 11, demonstrating the maximum reduction effects in MRT in C3, C4, and C5 of –11.31, –11.70, and –11.71 °C, respectively, followed by –5.27 °C for C2, with the lowest being –2.81 °C for C1. This means that C1 receives higher solar radiation because it has no plantings, so the reduction in MRT cannot be higher than the shading effect achieved by planting (C2). However, due to the lower surface temperature achieved by the permeable pavement, which decreases the long-wave radiation, the comprehensive result can still cause a –2.81 °C lower MRT than the current B0 situation. Furthermore, the difference in the reduction effect of C1 on MRT is lower than that of C2, so will not impact its overall effect on comfort. In addition, the effect of this MRT will be directly reflected in PET, and the effect on SET will not be more obvious than PET.
3.4. Analysis of the Effectiveness of Improvement Strategies at Different Height Layers
3.4.1. Temperature Mitigation Effects and Wind Speed Changes
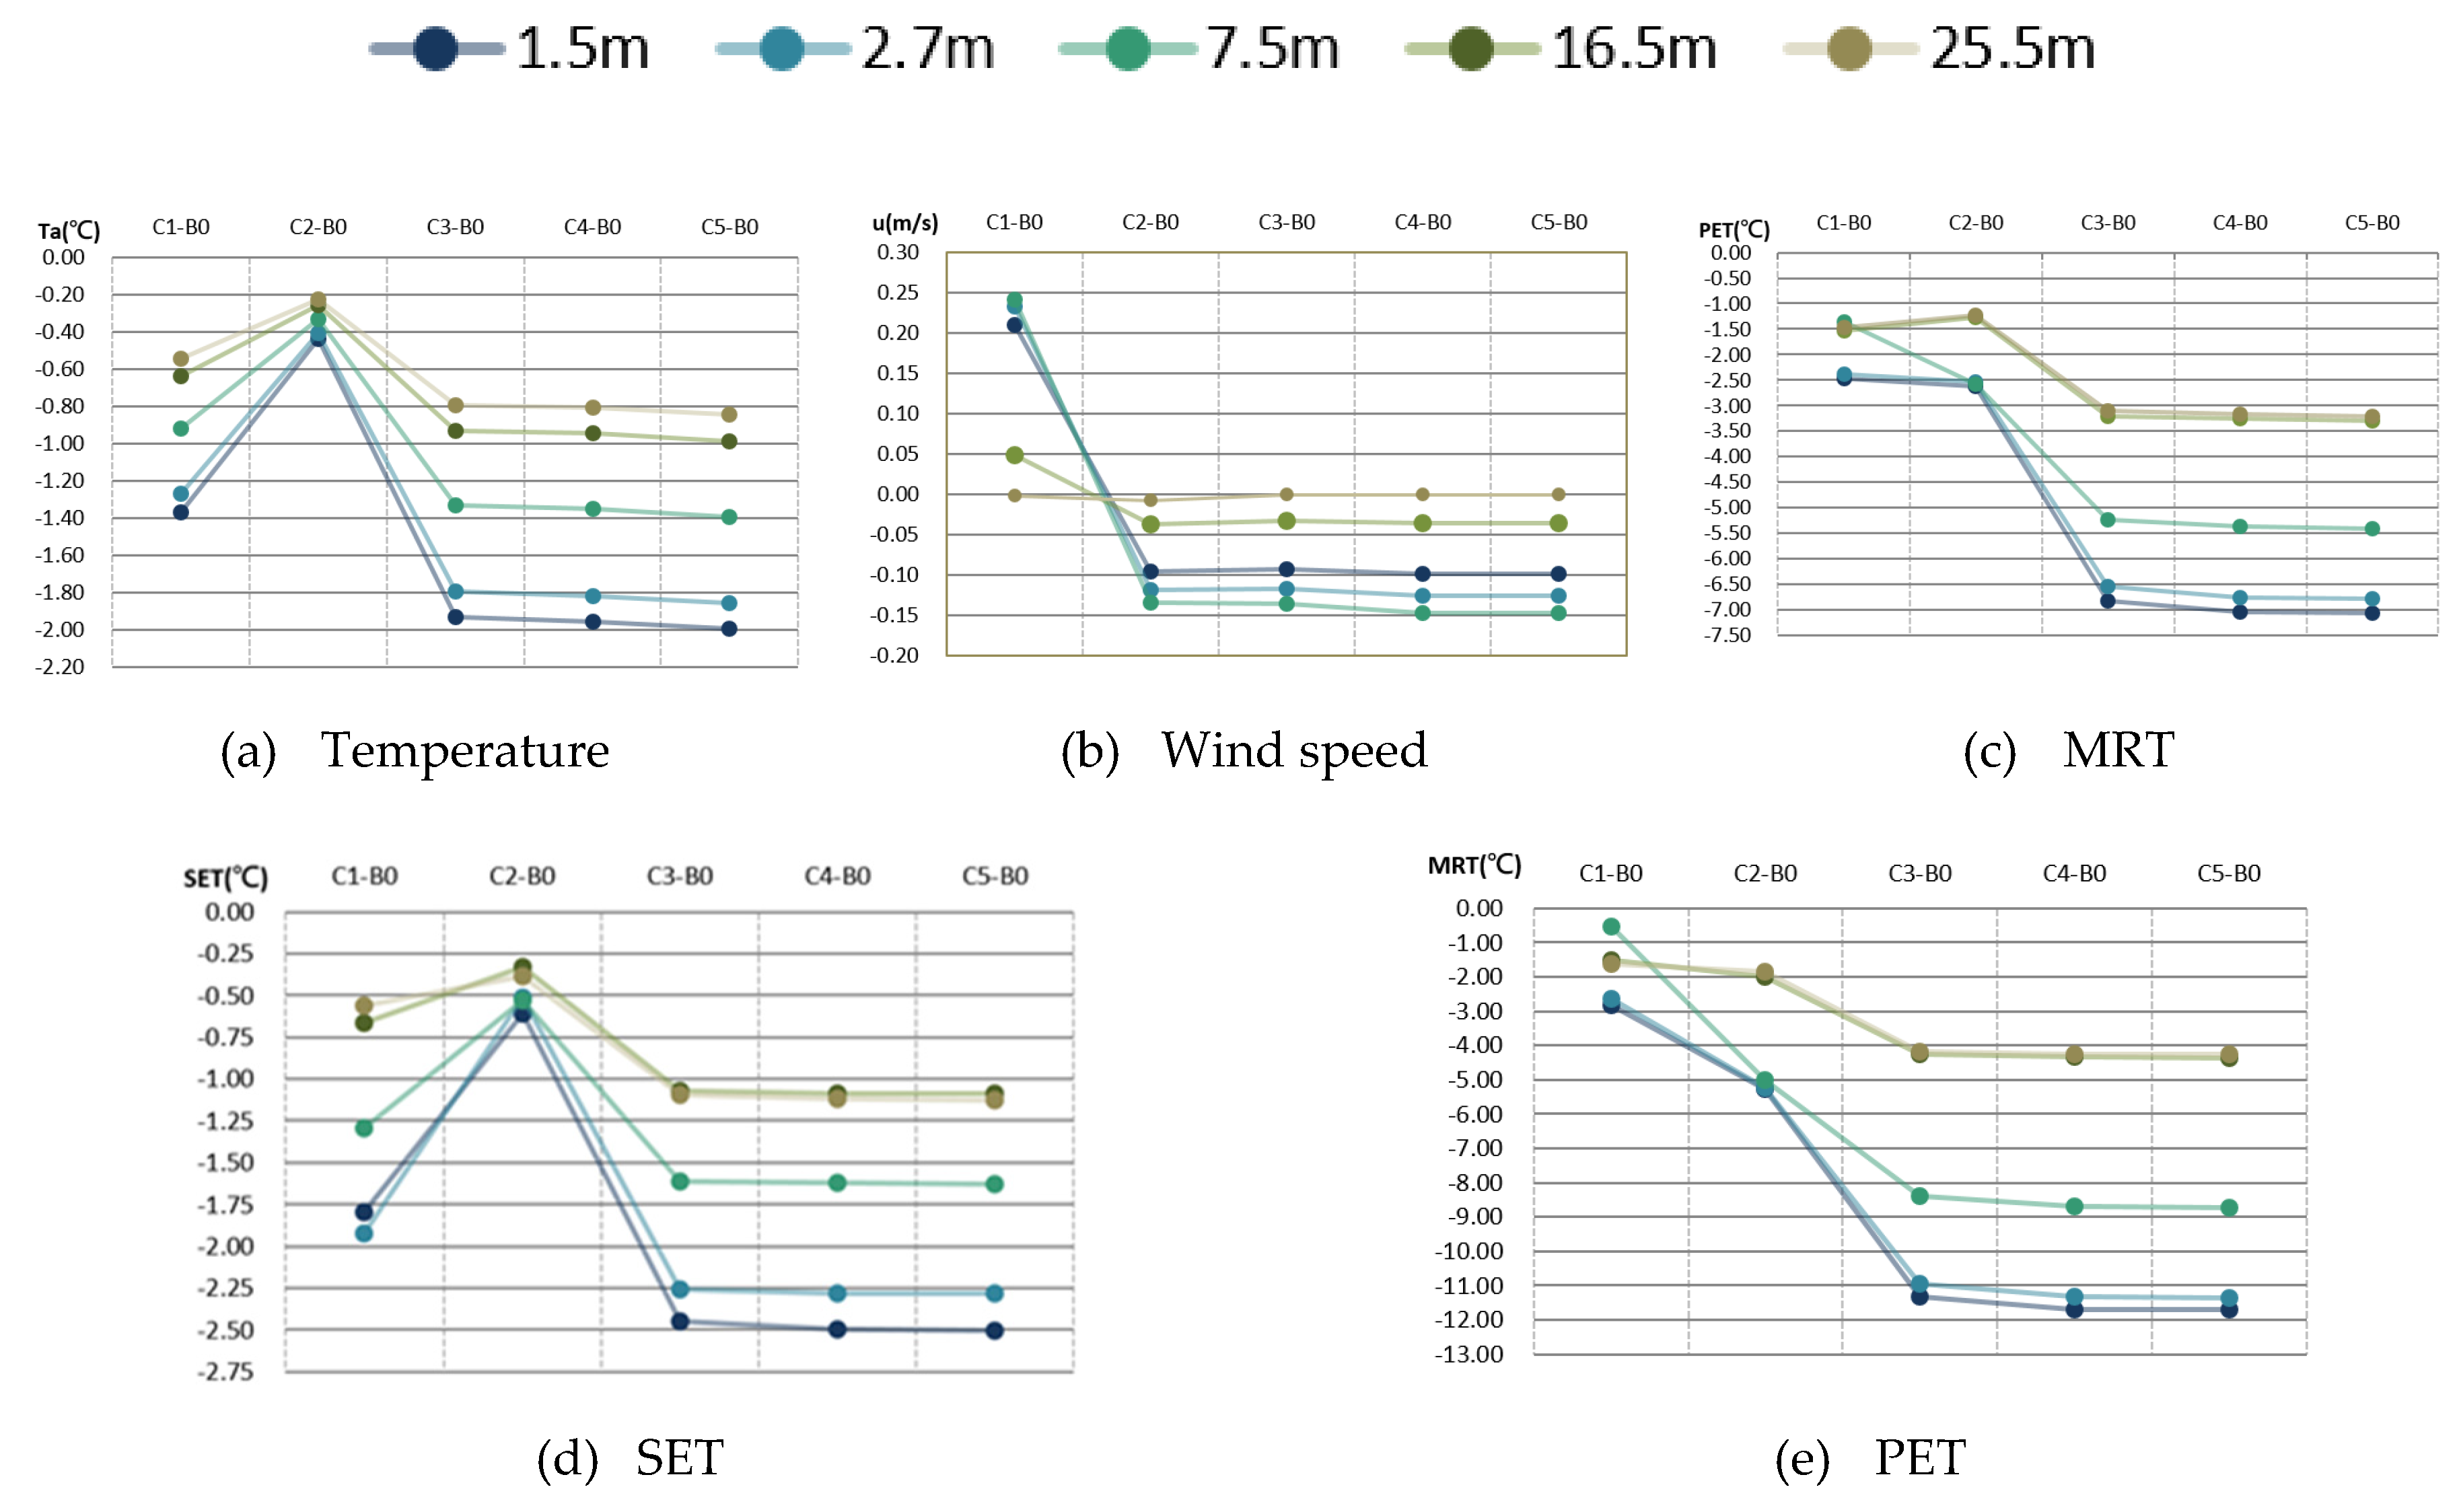
The comparison of the temperature of the vertical schemes is shown in Figure 9a, with C3, C4, and C5 having the largest cooling effects, followed by C1 and C2, in other words, the higher the temperature, the smaller the temperature improvement.
In addition, the comparison of the ventilation status of each scheme in each layer is shown in Figure 9b. The changing trend of the schemes from the height level of H = 1 m to H = 7.5 m in the pedestrian layer was consistent. Among them, due to no planting, the difference in C1 above H = 2.7 m is larger than the pedestrian layer. The wind speed increased by 0.25 m/s compared to B0. For heights above H = 16.5 m, there was no significant difference between schemes.
3.4.2. Analysis of the Effect of Comfort and MRT
A comparison of the comfort levels SET and PET in the vertical layers are shown in Figure 9c,d. In terms of SET, the vertical change trends of all schemes were the same, with C3, C4, and C5 achieving the largest reduction, followed by C1 and C2, in other words, the higher the height, the smaller the SET improvement effect. It is of note that the improvement effect of C1 was greater than the result near the ground (H = 1 m) when H = 2.7 m. In terms of PET, the vertical change trend of each scheme was consistent with H = 1 m, with the largest reduction achieved by C3, C4, and C5, followed by C2 and C1, in other words, the higher the PET, the smaller the improvement. It is worth noting that the reduction of C1 at H = 7.5 m suddenly decreased, and the characteristics of this change were consistent with the MRT results (Figure 12e), which shows the criticality of the impact of MRT on the comfort index PET.
3.5. Comparison of Different Areas (Streets, Parks, Buildings)
3.5.1. Comparison of the Effects Between Permeable Pavement and Greening at Streets (C1 vs. C2)
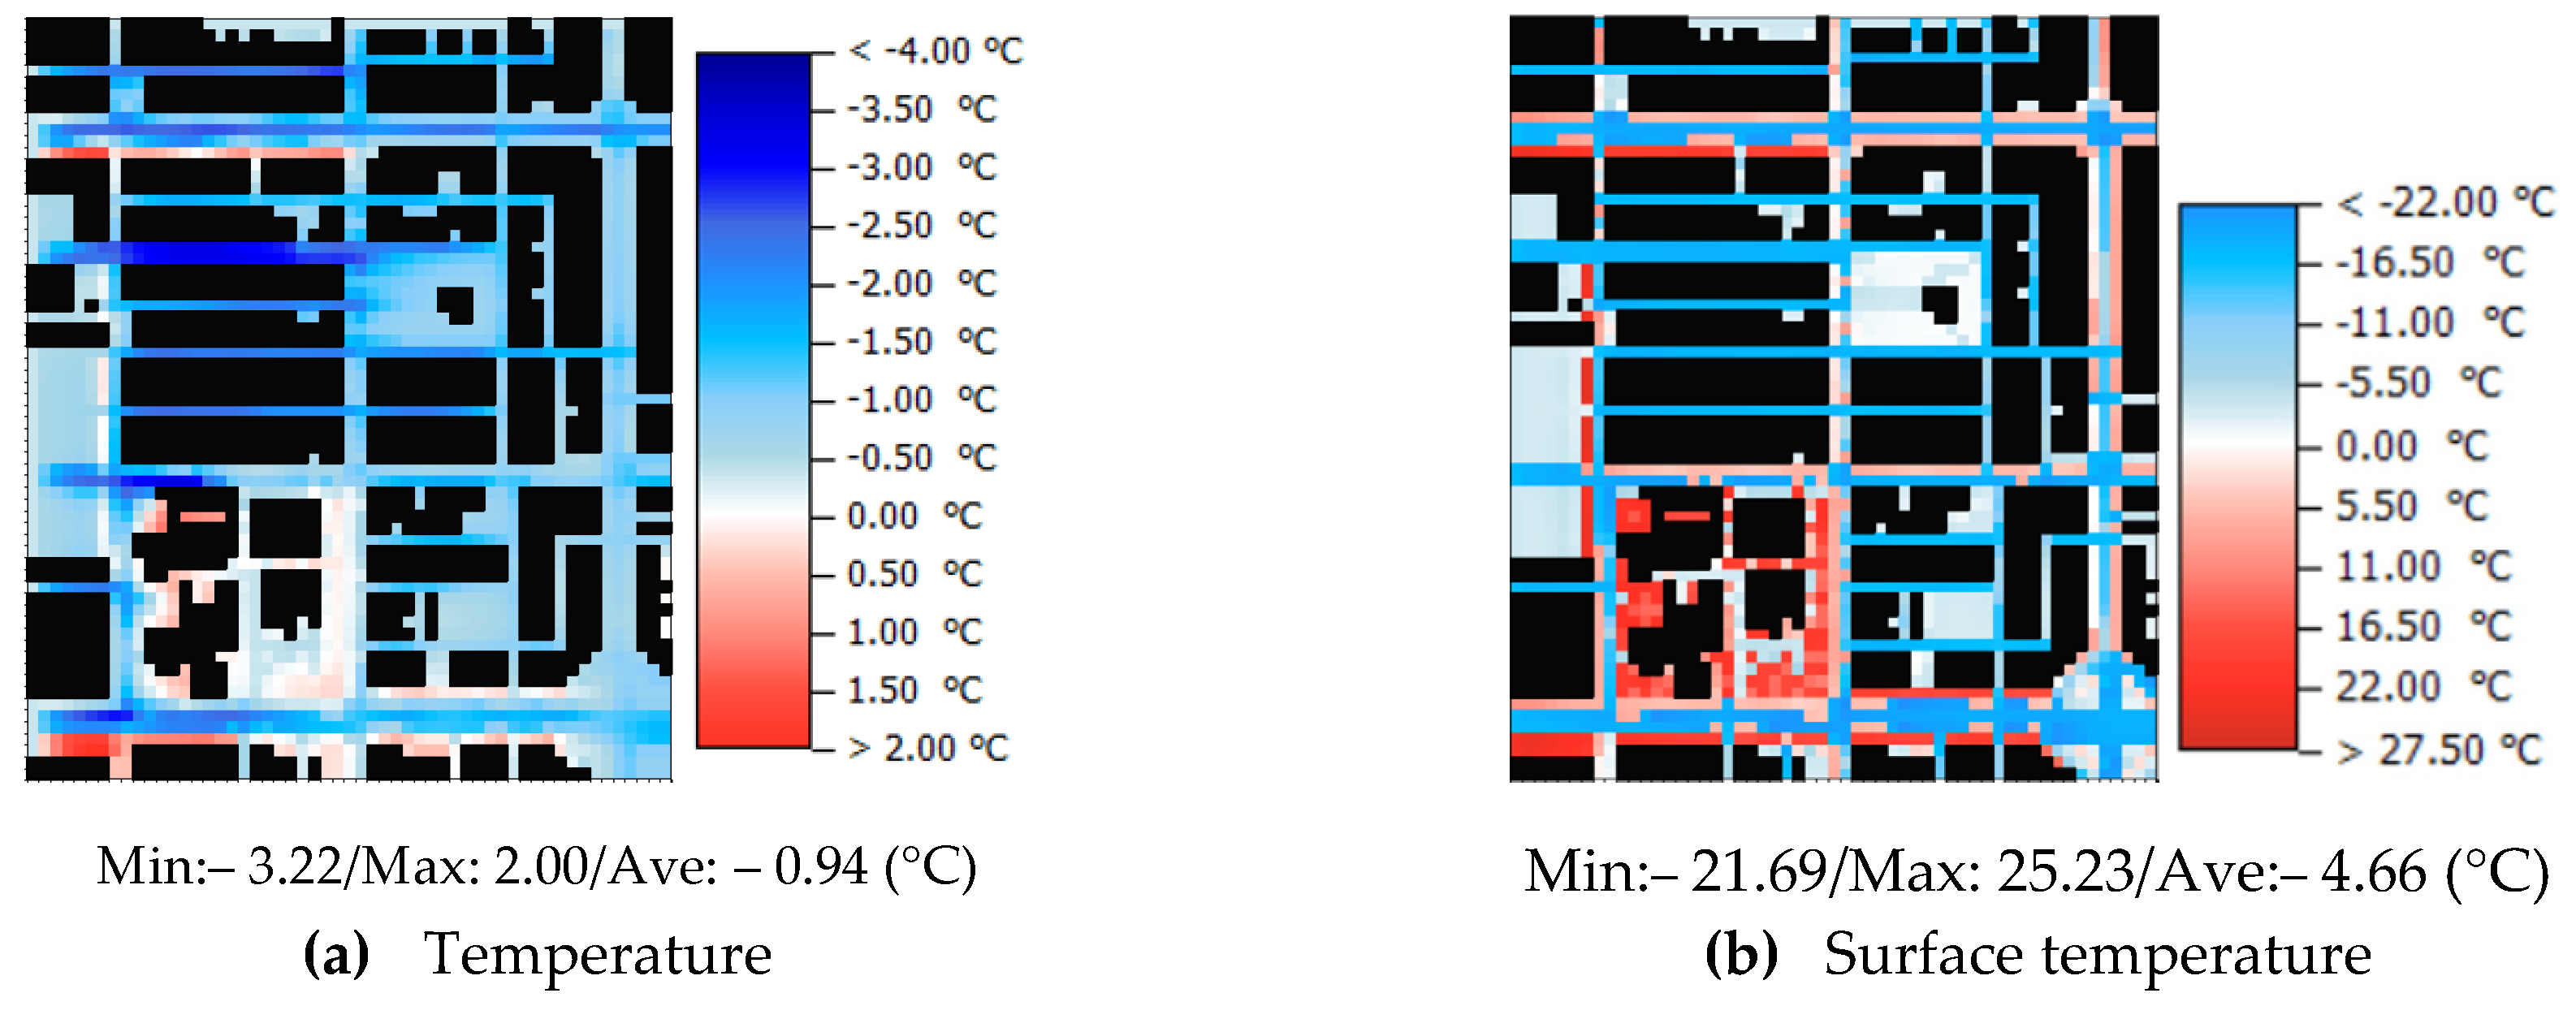
A comparison of the differences in air temperature and surface temperature between the permeable paving (C1) and tree planting (C2) strategies is shown in Figure 10, with the average reduction in temperature achieved by C1 being 0.94 °C lower than that of C2 (Figure 10a). The main difference was that the surface temperature of the open spaces or non-planted pavement in C1 had a greater effect in reducing the temperature, which was reduced by as much as 21 °C (Figure 10b), resulting in a temperature drop of 0.5–3.0 °C (Figure 10a).
3.5.2. Comparison of Differences in the Park (C4–C3 vs. C3–C2)
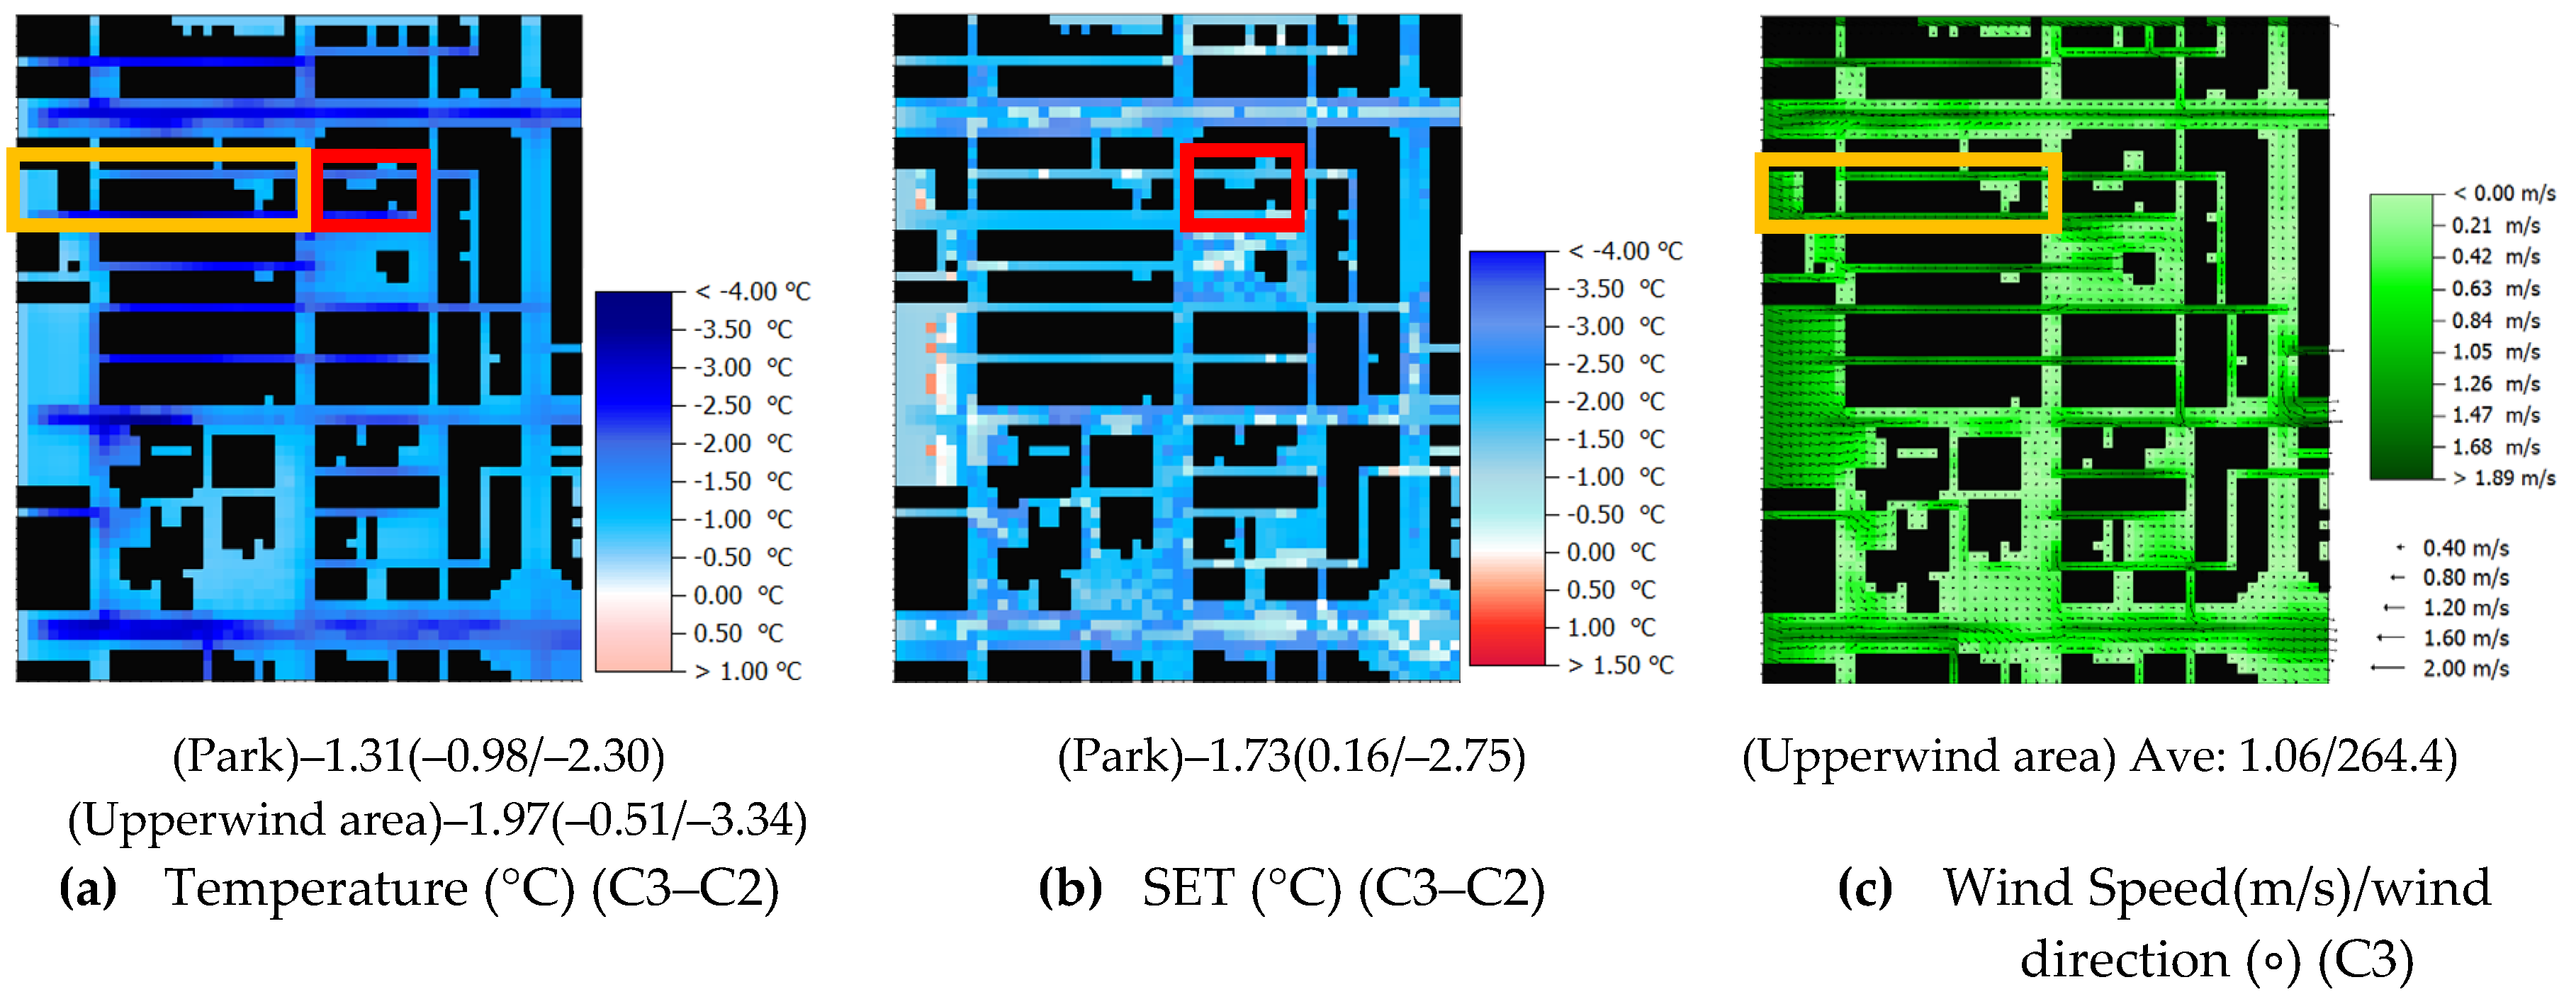
A comparison of different green coverage rates in the park area, scheme C3 (total green coverage ratio 60%/arbor 50%) vs. scheme C4 (total green coverage ratio 80%/arbor 75%), is shown in Figure 11. The average improvement in the air temperature and comfort in the park was small, having little impact on the overall block, but the impact of the air temperature was extended to the downwind block.
In addition, under the same park green coverage (total green coverage ratio 60%/arbor 50%), the difference in changing the park’s outer block to permeable paving is shown in Figure 12. The strategy of scheme C3 reduced the average temperature in the park by 1.31 °C and SET by 1.73 °C compared to C2, indicating that increasing the green coverage of the park by 20% had a stronger mitigating effect. It is speculated that the possible reason for this is that the cool air generated by the water retention on the street up-wind of the park can flow into the park (average wind speed = 0.69 m/s, westerly).
3.6. Influence of Different GCR on Streets
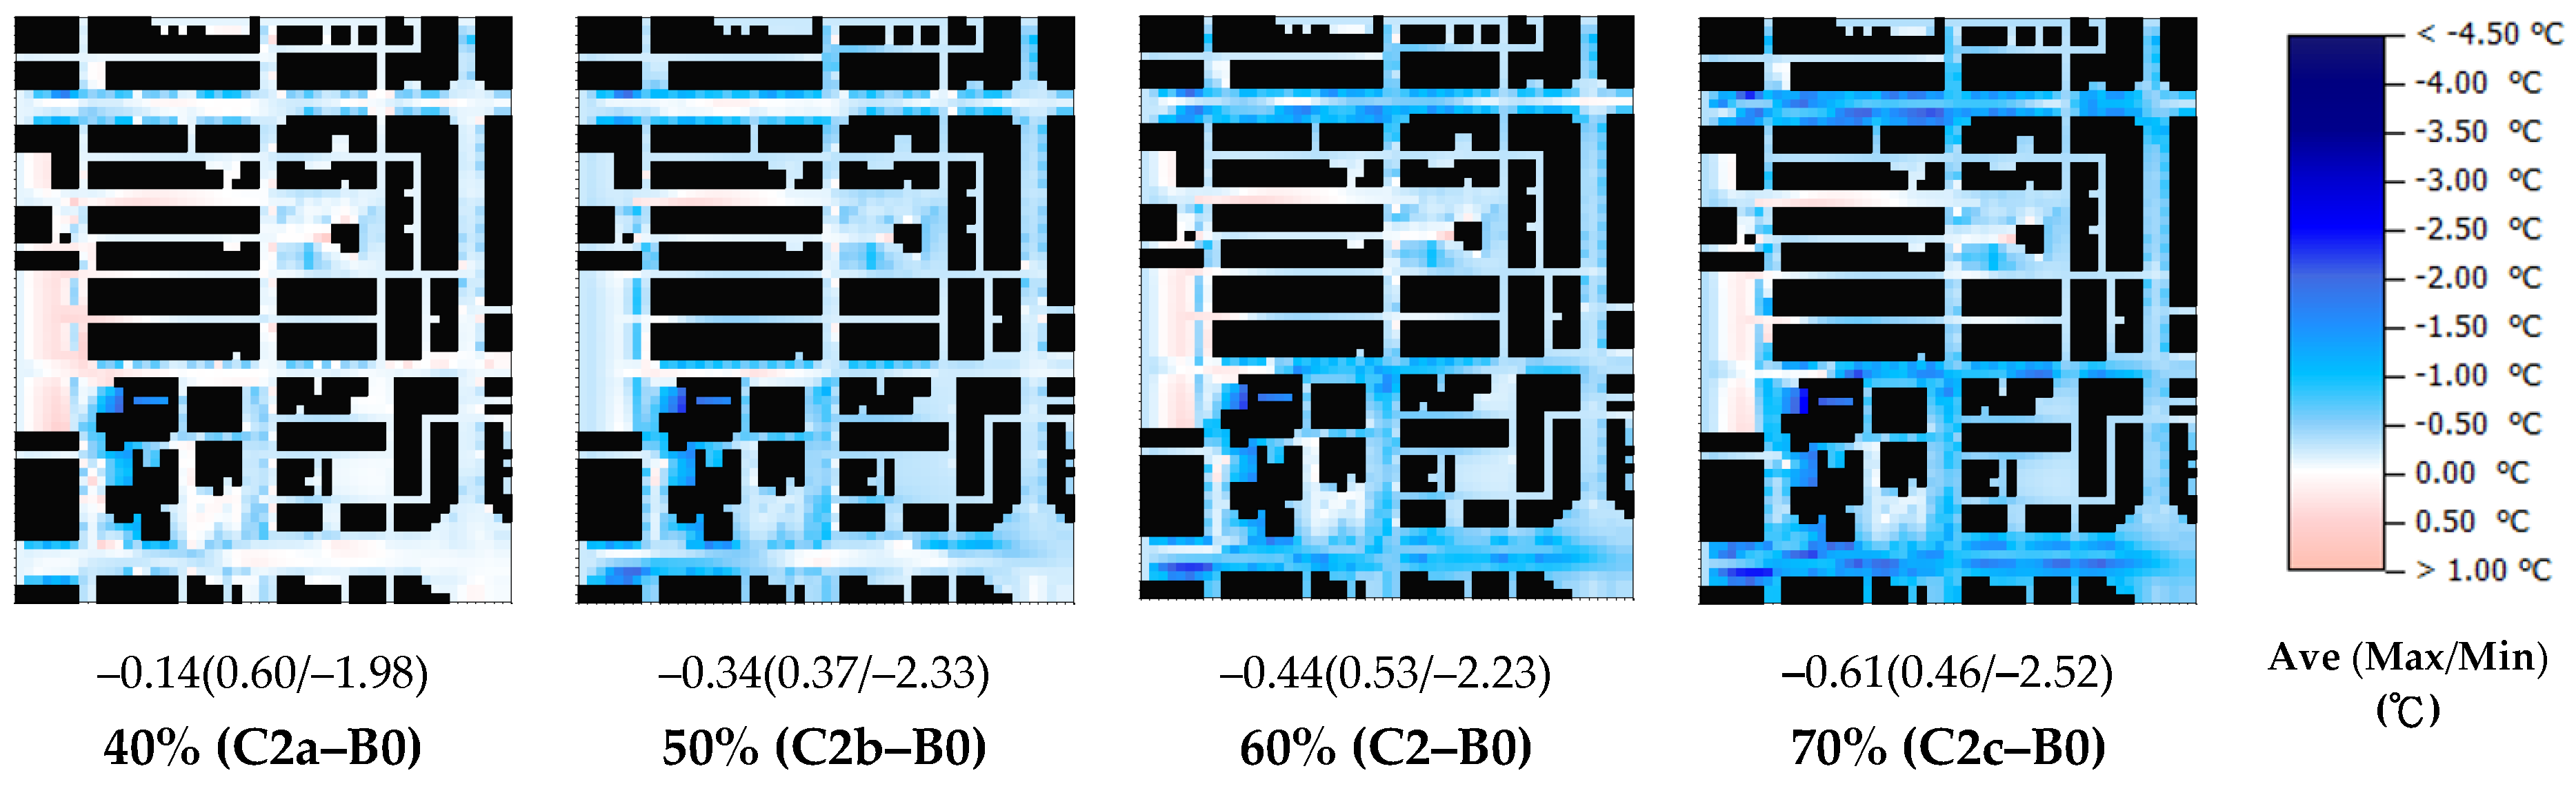
In order to understand the effect of the increase in the GCR on the cooling effect in streets, a linear regression analysis was performed on the green coverage and cooling value (average value) of the four schemes (C2, C2a, C2b, C2c), showing that for every 10% increase in arbor GCR of the street, the temperature of the pedestrian layer was reduced by 0.15 °C (R2 = 0.98), which was a highly correlated linear relationship (Figure 13a), and the cooling area distribution extended from the tree planting area to the periphery (Figure 14). Accordingly, the amount of tree planting required to reduce the pedestrian air temperature by 1 °C was 26% of the site area (= 67% street GCR × 39% street area ratio); when the street green coverage ratio (arbor) was 100%, the maximum cooling effect was estimated to reach 1.1 °C.
In terms of comfort SET and PET results, linear regression analysis (Figure 13c,d) showed that when the arbor green coverage of the street increased by 10%, SET and PET reduced the comfort level of the pedestrian layer by 0.15 °C (R2 = 0.95) and 0.71 °C (R2 = 0.99). To reduce the pedestrian comfort level from the B0 state (SET = 38.32 °C, PET = 50.51 °C) to the perceived level of comfort (SET = 30.0 °C, PET = 23.0 °C; Table 5), it was estimated that tree planting of approximately 222% (= 570% street GCR × 39% street area ratio) and 160% (= 410% street GCR × 39% street area ratio) of the GCR is required. Considering that humans living in tropical areas have a high degree of heat resistance [65], and the degree of comfort falls into the warm temperature and cold feeling (SET = 34.0 °C, PET = 34.0 °C; Table 5), the amount of tree planting required is about 117% of the total site area (= 300% street GCR × 39% street area ratio) and 98% (= 250% street GCR × 39% street area ratio) green cover amount. This means that for people in tropical areas, if they want to walk in the urban street space on a hot summer afternoon, the overall street tree GCR (at LAD = 1.3) must reach about 100% of the total site area.
In contrast, the changes in the vertical coverage of different streets in the vertical direction are shown in Figure 13, indicating a negative linear relationship between temperature and GCR at all altitudes (R2 > 0.95), and the temperature decreases as the vertical altitude rises. This means that the higher the vertical height, the smaller the temperature difference caused by different GCRs. The wind speed results show that, except for the height layers = 7.5 m and 25.5 m, the other height layers have a linear relationship that is negatively related to the GCR (R2 > 0.99) below the H = 2.7 m layer. As the vertical level increases, the decreasing slope of the wind speed increases, and above H = 16.5 m, the opposite is true, in particular, it may be affected by the planting canopy (canopy height 3–10 m). In terms of the MRT, there was a linear relationship (R2 > 0.98) that was negatively correlated with GCR at each layer, and the decreasing slope value of the MRT was higher below the height layer of H = 7.5 m and at 16.5 m. It is possible that the height below 7.5 m is affected by the shadowing of the planting canopy (canopy height 3–10 m), so that the radiation in/under the planting canopy decreases as the GCR increases, indicating that the reduction in radiation caused by planting the canopy will be greater than the shadow shielding effect produced by the height of the building. The comfort value SET results, except for the height layer of H = 2.7 m, had a linear relationship that negatively correlated with the GCR (R2 > 0.94). The trend in the PET results was similar to the MET results, suggesting that PET is greatly affected by MRT.
3.7. Influence of Different Building Cover Areas on Roof Greening
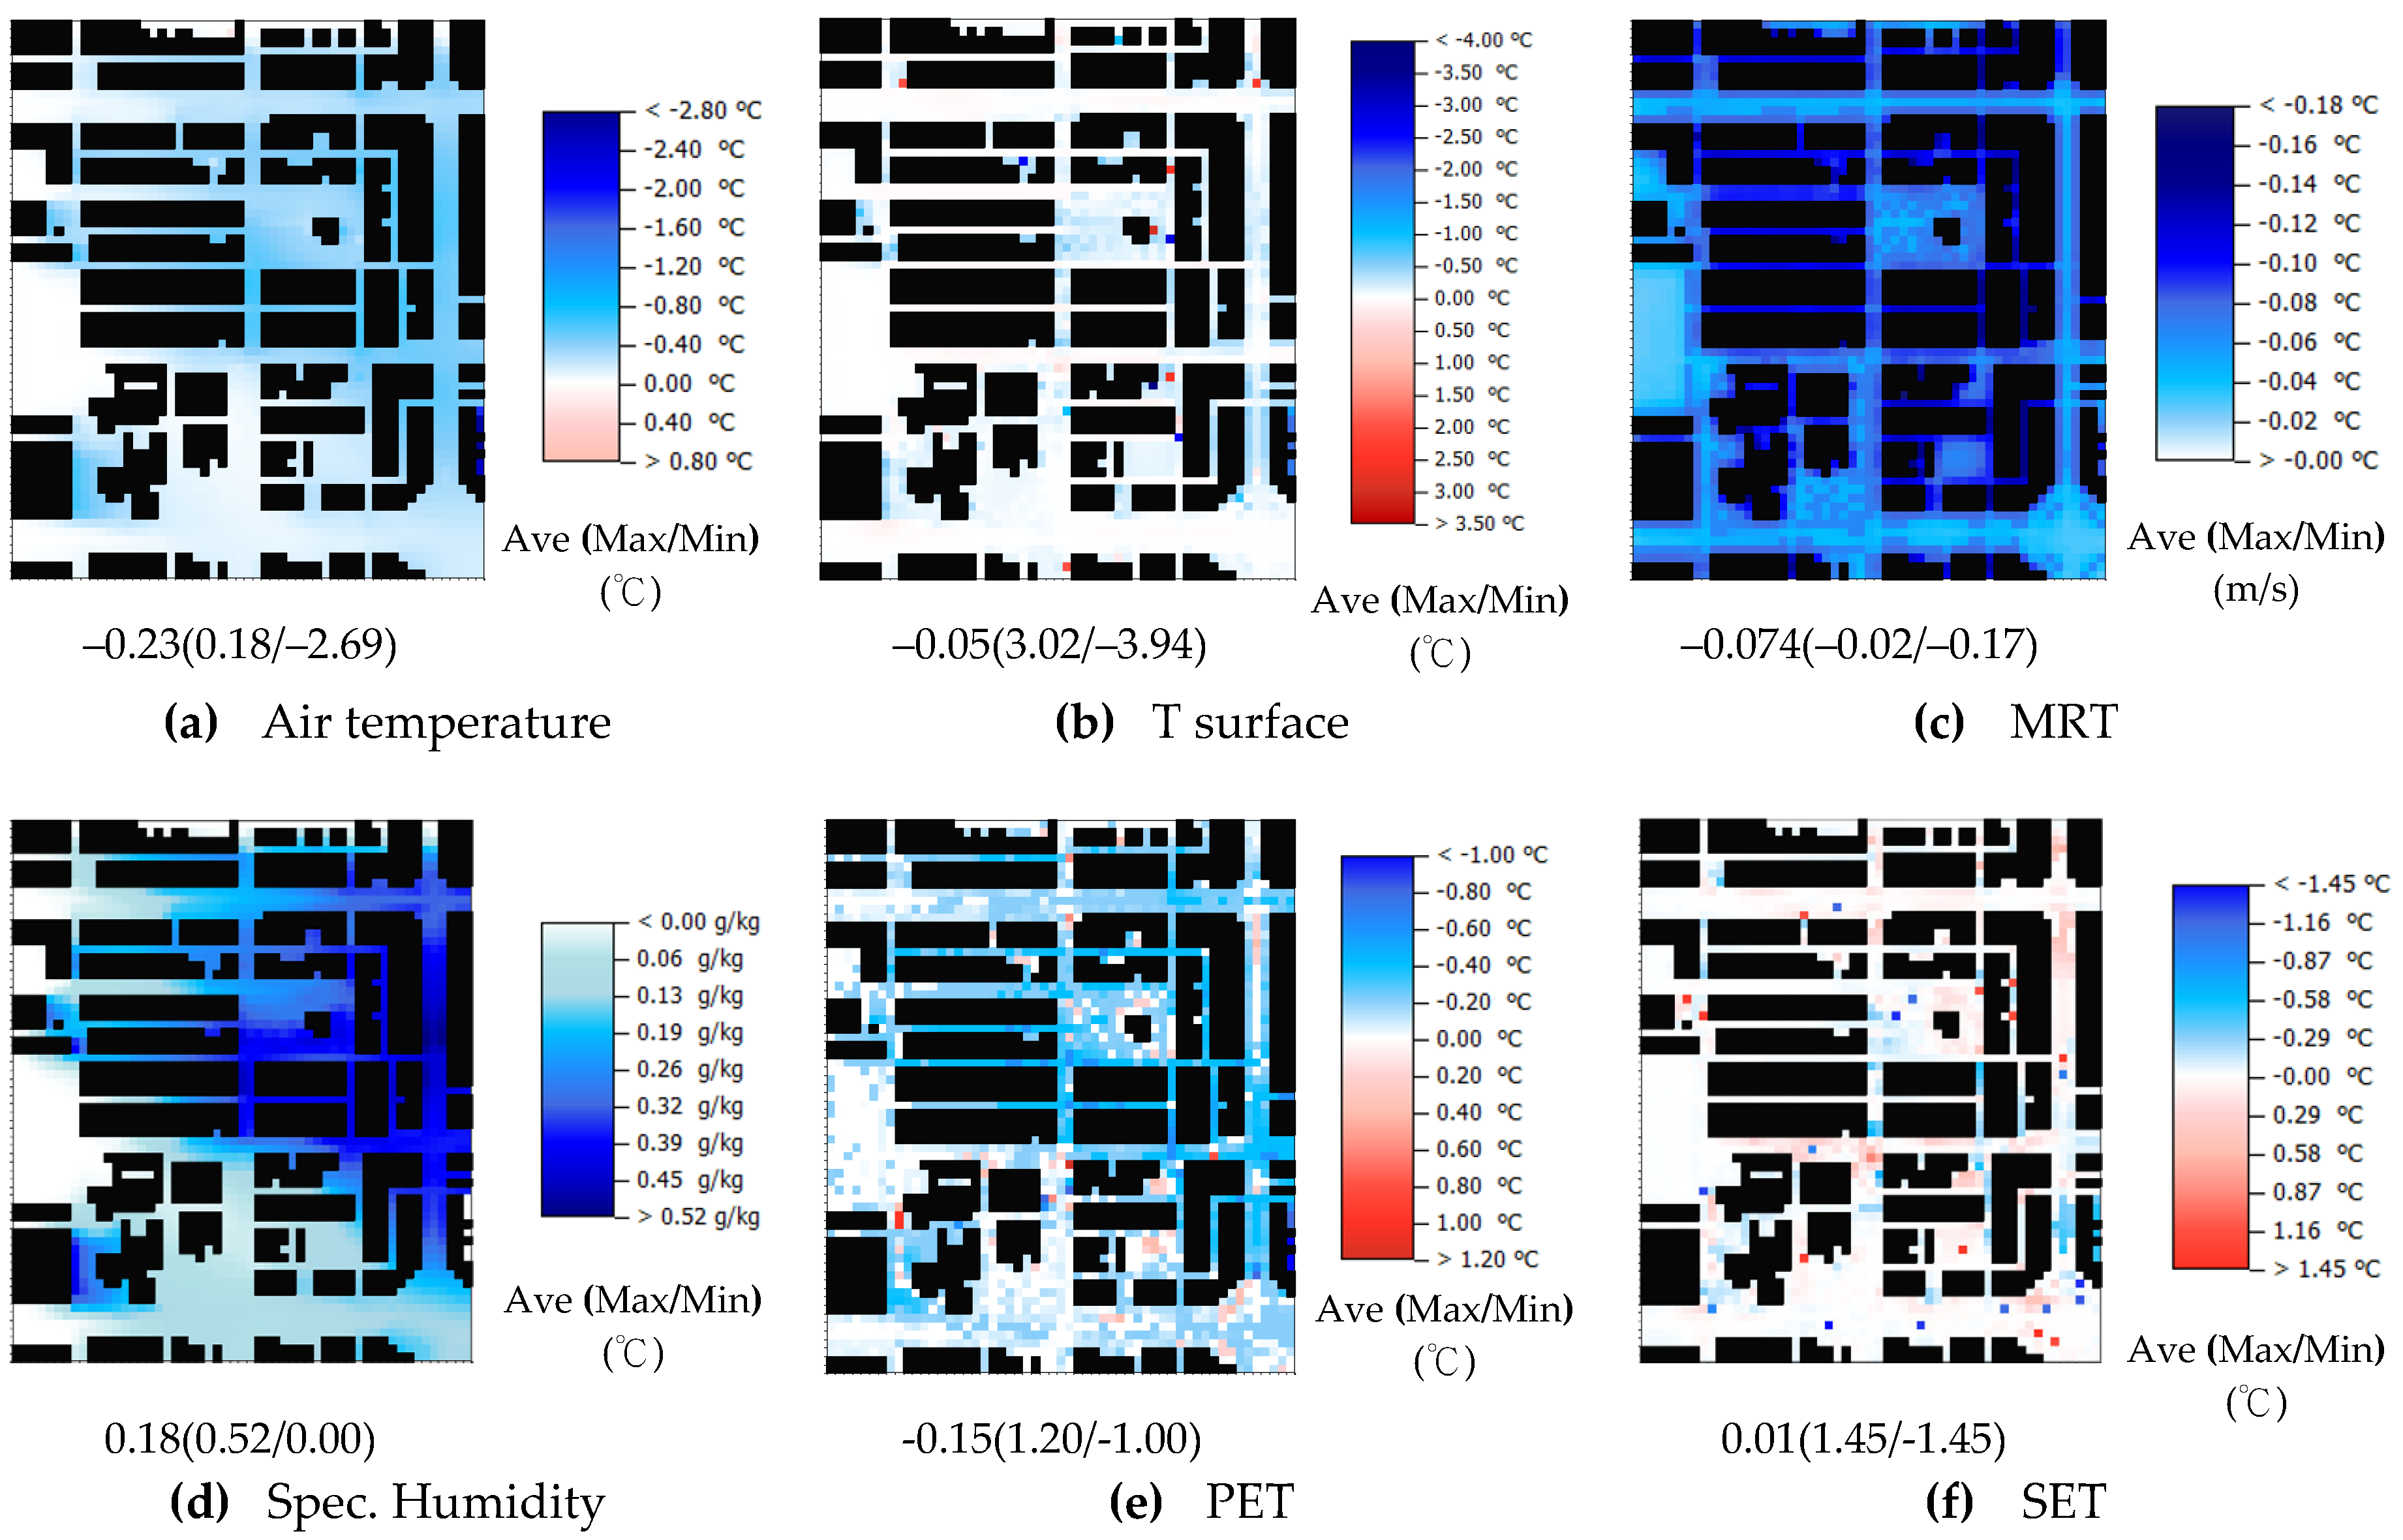
A comparison of the effects of comprehensive roof greening (C5a) of the site and the roof greening (C5) of public buildings at H = 1.5 m is shown in Figure 15. In terms of temperature, the average difference was only 0.22 °C. When converted to the difference in the proportion of unit areas (public buildings: all buildings = 7.1:56.6 = 12.5%), C5a increased the area of roof greening by 87.5%, then every 10% increase in roof greening area reduced the temperature by 0.03 °C. It is speculated that the reason for this is that the average roof layer of the site is about 2–4 floors (47.6%, Table 1, Figure 3), so the effect of roof greening is most obvious near the roof. Therefore, further analysis of the results of various meteorological factors in the vertical direction (temperature, humidity, wind direction, wind speed, MRT, PET, SET) revealed that the temperature difference between C5a and C5 reached a maximum of –0.33 °C at H = 16.5 m (5F high), followed by the upper and lower layers, where the temperature difference also gradually decreased (Table 8). The impact of roof greening is most affected by the average height of the building roofs in the block, mainly manifesting in temperature. At the same time, as the distance in height from the roof is higher, the impact is smaller, therefore, for a pedestrian activity layer with a height of 1.5 m, the temperature effect range was approximately 0.2 °C in the case of a fully greened block roof (thin layer greening H = 0.2 m, LAD = 0.3).
Alcazar et al. [28] used a simple block model and ENVI-met by LAD = 0.3 and 1.5 hypotheses of roof greening (grass flower), to obtain air temperature values at the pedestrian level of approximately –0.2 °C and –1.0 °C, similar to those obtained in this study. Razzaghmanesh et al. [44] performed a simulation analysis on an actual block and found that when H < 20 m, the roof GCR increased by 10%, reducing the air temperature at the pedestrian level by –0.02 °C, which is equivalent to the value scale of this study.
4. Conclusions
This study focused on the actual central business areas of a megacity in the tropical region of Taiwan, using CFD simulation tools to analyze and understand the thermal environment caused by the current physical environment (B0). Three main street space units and three UHI mitigation strategies feasible for policy control, street arbor greening, roof greening (grass), and permeable pavement, were simulated to explore the effects of different mitigation strategies (C2~C5) on the thermal environment, particularly with regard to temperature and comfort. The vertical thermal environment difference analyses were performed at five levels of a representative height in the block of the site, further analyzing the influences of different proportions for comparison with previous research, to provide important reference results for future government urban planning or design regulations.
According to the simulation results of B0, the current thermal environment, the average temperature in the summer at 2:00 p.m. can reach 36.0 °C, with a maximum street temperature of 38.5 °C. Due to the influence of the high radiation environment (MRT = 62.5 °C) comfort of SET and PET reached a very hot level of human cold and heat experience, which is a poor thermal environment for people to move around in in outdoor spaces. Strategies such as improving the pavement of streets, building areas, and parks, and increasing the green coverage ratio and arbor planting types can reduce the air temperature and increase comfort, thereby improving the thermal environment of the pedestrian layer. Of the five improvement schemes simulated, C5 achieved the most improvement, with the effect of C2 being marginal. It is of note that the cooling effect of water retention on the street pavement was three times greater than that of tree planting on the street, mainly because it effectively reduced the surface temperature of the street pavement (about -11~–20 °C), further reducing the temperature above the pavement (–0.5~–3 °C). As the park occupies a small area within the test area, the impact on the thermal environment caused by changes in the green coverage of the park had little effect on the overall block. A summary of the important results is shown in Table 9.
Regarding the vertical layer results, the changing trends of each layer and scheme were consistent with the pedestrian layer, in other words, the higher the altitude, the smaller the temperature or comfort improvement effect. It is of note that the height and thickness of the street canopy will have an impact on the height layer where it is located, especially on the effects of wind speed and radiation MRT. The GCR of different streets and their cooling phenomena was highly correlated and it was estimated that the amount of tree planting required to reduce the pedestrian temperature by 1 °C was 26% of the total site area; if the street green coverage ratio (arbor) was 100%, it is estimated that the maximum cooling for the site as a whole could reach 1.1 °C. By comparing the effects of green roofs on the different building areas, the overall roof greening was only 0.2 °C higher than that on the public buildings on the pedestrian floor, with the cooling effect being similar to the average building height of the site (H = 16.5 m) (0.33 °C). This range was comparable to previous research, indicating that if the setting of the LAD value was different, the temperature effect would be significantly different.
To improve the existing urban thermal environment in Taiwan in the future, it is recommended that (1) the green coverage ratio of the buildings should be at least 60%, (2) if there is no planting in the street, the pavement must be permeable, but if there is planting, the planting species should be mainly arbor, with a green coverage ratio of at least 60%, and (3) the green coverage ratio of the parks must be at least 60% (including more than 50% trees).
Author Contributions
Conceptualization, J.-M.H.; methodology, J.-M.H.; software, J.-M.H. and L.-C.C.; validation, J.-M.H. and L.-C.C.; data analysis, J.-M.H. and L.-C.C.; writing—original draft preparation, J.-M.H. and L.-C.C.; writing—review and editing, J.-M.H.; visualization, J.-M.H. and L.-C.C.; supervision, J.-M.H.; project administration, J.-M.H.; funding acquisition, J.-M.H. All authors have read and agreed to the published version of the manuscript.
Funding
The support for this study from the Ministry of Science and Technology, Taiwan through grant No. MOST 107–2221–E–415–002–MY2 is gratefully acknowledged.
Conflicts of Interest
The authors declare no conflicts of interest.
References
- Akbari, H.; Davis, S.; Dorsano, S.; Huang, J.M.; Winnett, S. (Eds.) Cooling Our Communities: A Guidebook on Tree Planting and Light-Colored Surfacing; U.S. Environmental Protection Agency, Office of Policy Analysis, Climate Change Division: Washington, DC, USA, 1992. [Google Scholar]
- Brown, R.D.; Terry, J.G. Microclimatic Landscape Design: Creating Thermal Comfort and Energy Efficiency; John Wiley & Sons, Inc.: New York, NY, USA, 1995. [Google Scholar]
- Givoni, B. Climate Consideration in Building and Urban Design; Van Nostrand Reinhold: New York, NY, USA, 1997. [Google Scholar]
- UN United Nations. World Urbanization Prospects 2018; UN Population Division; UN United Nations: New York, NY, USA, 2018.
- Oke, T.R. Boundary Layer Climates, 2nd ed.; Routledge: London, UK; New York, NY, USA, 1987. [Google Scholar]
- Lin, H.T.; Lee, K.P. Experimental Analyses of Urban Heat Island Effects of the Four Metropolitan Cities in Taiwan (I)--The Comparision of the Heat Island Intensities Between Taiwan and the World Cities. J. Arch. 1999, 31, 51–73. (In Chinese) [Google Scholar]
- Ministry of the Environment Government of Japan. Investigation Report of Heat Island Measures and Method; Ministry of the Environment Government of Japan: Tokyo, Japan, 2001. (In Japanese)
- Observation Data Inquire System of Taiwan Central Weather Bureau. Available online: https://e-service.cwb.gov.tw/HistoryDataQuery/index.jsp (accessed on 7 May 2020).
- Sun, C.Y.; Jian, Z.X. Heat Island Effect of Taipei Metropolitan Area. J. City Plan. 2016, 43, 437–462. (In Chinese) [Google Scholar]
- Huang, J.M.; Chang, H.Y.; Wang, Y.S. Spatiotemporal Changes in the Built Environment Characteristics and Urban Heat Island Effect in a Medium-sized City, Chiayi City, Taiwan. Sustainability 2020, 12, 365. [Google Scholar] [CrossRef] [Green Version]
- Royé, D. The effects of hot nights on mortality in Barcelona, Spain. Int. J. Biometeorol. 2017, 61, 2127–2140. [Google Scholar] [CrossRef] [PubMed]
- Scott, A.A.; Waugh, D.W.; Zaitchik, B.F. Reduced Urban Heat Island intensity under warmer conditions. Environ. Res. Lett. 2018, 13, 064003. [Google Scholar] [CrossRef]
- Oke, T.R. Canyon Geometry and the Nocturnal Urban Heat Island: Comparison of Scale Model and Field Observations. Int. J. Climatol. 1981, 1, 237–254. [Google Scholar] [CrossRef]
- Ooka, R. Recent development of assessment tools for urban climate and heat-island investigation especially based on experiences in Japan. Int. J. Climatol. 2007, 27, 1919–1930. [Google Scholar] [CrossRef]
- Huang, J.; Ooka, R.; Omori, T. The Effect of the Urban Heat Island Mitigation Strategies on Outdoor Thermal Environment in Tokyo Central City-Numerical Simulation. In Proceedings of the 7th Asia-Pacific Conference on Wind Engineering, Taipei, Taiwan, 8–12 November 2009. [Google Scholar]
- Ministry of the Environment Government of Japan. Report on Actual Analysis of Urban Heat Island Phenomenon and Measures to be Taken; Ministry of the Environment Government of Japan: Tokyo, Japan, 2000; pp. 9–13. (In Japanese)
- Ministry of the Environment Government of Japan. Investigation Report on the Environmental Impact of the Heat Island Phenomenon; Ministry of the Environment Government of Japan: Tokyo, Japan, 2003; pp. 1–18. (In Japanese)
- Yoshida, S.; Ooka, R.; Mochida, T. Study on Effect of Greening on Outdoor Thermal Environment Using Three Dimensional Plant Canopy Model. J. Archit. Trans. Aij 2000, 536, 87–94. (In Japanese) [Google Scholar] [CrossRef] [Green Version]
- Chen, H.; Ooka, R.; Huang, H.; Tsuchiya, T. Study on mitigation measures for outdoor thermal environment on present urban blocks in Tokyo using coupled simulation. Build. Environ. 2009, 44, 2290–2299. [Google Scholar] [CrossRef]
- Hu, T.; Yoshie, R. Indices to evaluate ventilation efficiency in newly-built urban area at pedestrian level. J. Wind Eng. Ind. Aerodyn. 2013, 112, 39–51. [Google Scholar] [CrossRef]
- Lan, Y.; Zhan, Q. How do urban buildings impact summer air temperature? The effects of building configurations in space and time. Build. Environ. 2017, 125, 88–98. [Google Scholar] [CrossRef]
- Santos Nouri, A.; Fröhlich, D.; Matos Silva, M.; Matzarakis, A. The Impact of Tipuana tipu Species on Local Human Thermal Comfort Thresholds in Different Urban Canyon Cases in Mediterranean Climates: Lisbon, Portugal. Atmosphere 2018, 9, 12. [Google Scholar] [CrossRef] [Green Version]
- Rui, L.; Buccolieri, R.; Gao, Z.; Ding, W.; Shen, J. The Impact of Green Space Layouts on Microclimate and Air Quality in Residential Districts of Nanjing, China. Forests 2018, 9, 224. [Google Scholar] [CrossRef] [Green Version]
- Srivanit, M.; Jareemit, D. Modeling the influences of layouts of residential townhouses and tree-planting patterns on outdoor thermal comfort in Bangkok suburb. J. Build. Eng. 2020, 30, 101262. [Google Scholar] [CrossRef]
- Morakinyo, T.E.; Lam, Y.F. Simulation study on the impact of tree-configuration, planting pattern and wind condition on street-canyon’s micro-climate and thermal comfort. Build. Environ. 2016, 103, 262–275. [Google Scholar] [CrossRef]
- Lobaccaro, G.; Acero, J.A. Comparative analysis of green actions to improve outdoor thermal comfort inside typical urban street canyons. Urban Clim. 2015, 4, 251–267. [Google Scholar] [CrossRef]
- Alcazar, S.S.; Olivieri, F.; Neila, J. Green roofs: Experimental and analytical study of its potential for urban microclimate regulation in Mediterranean–continental climates. Urban Clim. 2016, 17, 304–317. [Google Scholar] [CrossRef]
- Jin, C.; Bai, X.; Luo, T.; Zou, M. Effects of green roofs’ variations on the regional thermal environment using measurements and simulations in Chongqing, China. Urban For. Urban Green. 2018, 29, 223–237. [Google Scholar] [CrossRef]
- Lyu, T.; Buccolieri, R.; Gao, Z. A Numerical Study on the Correlation between Sky View Factor and Summer Microclimate of Local Climate Zones. Atmosphere 2019, 10, 438. [Google Scholar] [CrossRef] [Green Version]
- Jin, H.; Liu, Z.; Jin, Y.; Kang, J.; Liu, J. The Effects of Residential Area Building Layout on Outdoor Wind Environment at the Pedestrian Level in Severe Cold Regions of China. Sustainability 2017, 9, 2310. [Google Scholar] [CrossRef] [Green Version]
- Yang, Y.; Zhang, X.; Lu, X.; Hu, J.; Pan, X.; Zhu, Q.; Su, W. Effects of Building Design Elements on Residential Thermal Environment. Sustainability 2018, 10, 57. [Google Scholar] [CrossRef] [Green Version]
- Stewart, I.D.; Oke, T.R. Local climate zones for urban temperature studies. Bull. Am. Meteorol. 2012, 93, 1879–1900. [Google Scholar] [CrossRef]
- Skelhorn, C.; Lindley, S.; Levermore, G. The impact of vegetation types on air and surface temperatures in a temperate city: A fine scale assessment in Manchester, UK. Landsc. Urban Plan. 2014, 121, 129–140. [Google Scholar] [CrossRef]
- Sodoudi, S.; Zhang, H.; Chi, X.; Müller, F.; Li, H. The influence of spatial configuration of green areas on microclimate and thermal comfort. Urban Forest. Urban Green. 2018, 34, 85–96. [Google Scholar] [CrossRef]
- Ng, E.; Chen, L.; Wang, Y.; Yuan, C. A study on the cooling effects of greening in a high-density city: An experience from Hong Kong. Build. Environ. 2012, 47, 256–271. [Google Scholar] [CrossRef]
- Wang, Y.; Akbari, H. The effects of street tree planting on Urban Heat Island mitigation in Montreal. Sustain. Cities Soc. 2016, 27, 122–128. [Google Scholar] [CrossRef]
- Lee, H.; Mayer, H.; Chen, L. Contribution of trees and grasslands to the mitigation of human heat stress in a residential district of Freiburg, Southwest Germany. Landsc. Urban Plan 2016, 148, 37–50. [Google Scholar] [CrossRef]
- Aboelata, A. Vegetation in different street orientations of aspect ratio (H/W 1:1) to mitigate UHI and reduce buildings’ energy in arid climate. Build. Environ. 2020, 172, 106712. [Google Scholar] [CrossRef]
- Aboelata, A.; Sodoudi, S. Evaluating the effect of trees on UHI mitigation and reduction of energy usage in different built up areas in Cairo. Build. Environ. 2020, 168, 106490. [Google Scholar] [CrossRef]
- Ambrosini, D.; Galli, G.; Mancini, B.; Nardi, I.; Sfarra, S. Evaluating Mitigation Effects of Urban Heat Islands in a Historical Small Center with the ENVI-Met Climate Model. Sustainability 2014, 6, 7013–7029. [Google Scholar] [CrossRef] [Green Version]
- O’Malley, C.; Piroozfar, P.; Farr, E.R.; Pomponi, F. Urban Heat Island (UHI) mitigating strategies: A case-based comparative analysis. Sustain. Cities Soc. 2015, 19, 222–235. [Google Scholar] [CrossRef] [Green Version]
- Wang, Y.; Berardi, U.; Akbari, H. Comparing the effects of urban heat island mitigation strategies for Toronto, Canada. Energy Build. 2016, 114, 2–19. [Google Scholar] [CrossRef]
- Razzaghmanesh, M.; Beecham, S.; Salemi, T. The role of green roofs in mitigating Urban Heat Island effects in themetropolitan area of Adelaide, South Australia. Urban For. Urban Green. 2016, 15, 89–102. [Google Scholar] [CrossRef]
- Dwivedi, A.; Mohan, B.K. Impact of green roof on micro climate to reduce Urban Heat Island. Remote Sens. Appl. Soc. Environ. 2018, 10, 56–69. [Google Scholar] [CrossRef]
- Ziaul, S.; Pal, S. Modeling the effects of green alternative on heat island mitigation of a meso level town, West Bengal, India. Adv. Space Res. 2020, 65, 1789–1802. [Google Scholar] [CrossRef]
- Liu, Z.; Zheng, S.; Zhao, L. Evaluation of the ENVI-Met Vegetation Model of Four Common Tree Species in a Subtropical Hot-Humid Area. Atmosphere 2018, 9, 198. [Google Scholar] [CrossRef] [Green Version]
- .Kim, Y.; An, S.M.; Eum, J.H.; Woo, J.H. Analysis of Thermal Environment over a Small-Scale Landscape in a Densely Built-Up Asian Megacity. Sustainability 2016, 8, 358. [Google Scholar] [CrossRef] [Green Version]
- Huang, J.M.; Hong, S.L. A study on the Spatial Pattern of Taiwan Urban Parks to Improve the Urban Heat Island Effect—Taking Chiayi City Park as an example. J. Landsc. 2019, 23, 19–50. (In Chinese) [Google Scholar]
- Derkzen, M.L.; van Teeelen, A.J.A.; Verburg, P.H. Green infrastructure for urban climate adaptation: How do residents’ views on climate impacts and green infrastructure shape adaptation preferences? Landsc. Urban Plan 2017, 157, 106–130. [Google Scholar] [CrossRef]
- Jia, Z.; Tang, S.; Luo, W.; Li, S.; Zhou, M. Small scale green infrastructure design to meet dierent urban hydrological criteria. J. Environ. Manag. 2016, 171, 92–100. [Google Scholar] [CrossRef]
- Bruse, M.; Fleer, H. Simulating surface-plant-air interactions inside urban environments with a three dimensional numerical model. Environ. Model Softw. 1998, 13, 373–384. [Google Scholar] [CrossRef]
- Huttner, S. Further Develop and Application of the 3D Microclimate Simulation ENVI-met; Johannes Gutenberg-University: Mainz, Germany, 2012; p. 147. [Google Scholar]
- Tsoka, S.; Tsikaloudaki, A.; Theodosiou, T. Analyzing the ENVI-met microclimate model’s performance and assessing cool materials and urban vegetation applications–A review. Sustain. Cities Soc. 2018, 43, 55–76. [Google Scholar] [CrossRef]
- Perini, K.; Magliocco, A. Effects of vegetation, urban density, building height and atmospheric conditions on local temperatures and thermal comfort. Urban For. Urban Green 2014, 13, 495–506. [Google Scholar] [CrossRef]
- Gagge, A.P.; Fobelets, A.P.; Berglund, P.E. A standard predictive index of human response to the thermal environment. Ashrae Trans. 1986, 92, 709–731. [Google Scholar]
- Höppe, P. The physiological equivalent temperature – A universal index for the biometeorological assessment of the thermal environment. Int. J. Biometeorol. 1999, 43, 71–75. [Google Scholar] [CrossRef] [PubMed]
- Matzarakis, A.; Mayer, H. Applications of a universal thermal index: Physiological equivalent temperature. Int. J. Biometeorol. 1999, 43, 76–84. [Google Scholar] [CrossRef] [PubMed]
- Erell, E.; Pearlmutter, D.; Williamson, T. Urban Microclimate: Designing the Spaces between Buildings; Routledge: New York, NY, USA, 2011; p. 266. [Google Scholar]
- Oke, T.R.; Mills, G.; Christen, A.; Voogt, J.A. Urban Climates; Cambridge University Press: Cambridge, UK, 2017. [Google Scholar]
- Lin, T.P.; Ho, Y.F.; Huang, Y.S. Seasonal effect of pavement on outdoor thermal environments in subtropical Taiwan. Build. Environ. 2007, 42, 4124–4131. [Google Scholar] [CrossRef]
- Klok, L.; Zwart, S.; Verhagen, H.; Mauric, E. The surface heat island of Rotterdam and its relationship with urban surface characteristics. Resour. Conserv. Recycl. 2012, 64, 23–29. [Google Scholar] [CrossRef]
- Mathew, A.; Khandelwal, S.; Kaul, N. Analysis of diurnal surface temperature variations for the assessment of surface urban heat island effect over Indian cities. Energy Build. 2018, 159, 271–295. [Google Scholar] [CrossRef]
- Yu, C.; Hien, W.N. Thermal Benefits of City Parks. Energy Build. 2006, 38, 105–120. [Google Scholar] [CrossRef]
- Huang, J.M.; Ooka, R.; Katsuki, T. (Part 1) The research on the cool island effects and the thermal environment of the medium size green space in the city. In Proceedings of the 60th Japan National Congress for Theoretical and Applied Mechanics, Tokyo, Japan, 2011. (In Japanese). [Google Scholar]
- Lin, T.P. Thermal perception, adaptation and attendance in a public square in hot and humid regions. Build. Environ. 2009, 44, 2017–2026. [Google Scholar] [CrossRef]
Figure 1.
Study area (a) and (b), aerial satellite view (c), and distribution of building floors (d).
Figure 1.
Study area (a) and (b), aerial satellite view (c), and distribution of building floors (d).

Figure 2.
Detailed illustration of urban space allocation.

Figure 3.
Height of each section and building distribution.

Figure 4.
Schematic diagram of the relationship between the section height of each level and the building and pedestrian heights.
Figure 4.
Schematic diagram of the relationship between the section height of each level and the building and pedestrian heights.

Figure 5.
Surface temperature distribution for each scenario. (2:00 p.m.).

Figure 6.
Air temperature distribution for each scenario (2:00 p.m., H = 1.5 m).

Figure 7.
Distribution for B0 simulation results (H = 1.5 m).


Figure 8.
Comparison difference of each scenario with the B0 (H = 1.5m).


Figure 9.
Comparison of the difference in the vertical layers of each scenario with B0 (X–B0).

Figure 10.
Temperature and surface temperature difference of C1– C2.

Figure 11.
Temperature and surface temperature difference of C4–C3 (Ave(Max/Min)).

Figure 12.
Temperature and SET difference of C3–C2 and wind speed/wind direction of C3.

Figure 13.
Comparison of the results of different schemes at different height layers with the B0 (C2X–B0).
Figure 13.
Comparison of the results of different schemes at different height layers with the B0 (C2X–B0).

Figure 14.
Difference in air temperature for the four scenarios and B0.

Figure 15.
Difference of C5a–C5 (H = 1.5 m).


Table 1.
Ratio of each space type in the study area and proportion of building area of different heights (in number of floors).
Table 1.
Ratio of each space type in the study area and proportion of building area of different heights (in number of floors).
| Type of Land Use | Class of Building Floor | |||||||||
|---|---|---|---|---|---|---|---|---|---|---|
| (%) | Government | Park | Residential | Road | (%) | 1F | 2–4F | 5F | 6–14F | >15F |
| Percentage of Area | 7.1 | 2.3 | 49.5 | 39.1 | Percentage of Area | 8.3 | 47.6 | 17.9 | 21.6 | 4.6 |
Table 2.
Space setting of ENVI-met.
| Space Size | Grid Size | Geographical Location | |||||
|---|---|---|---|---|---|---|---|
| x-Grids | 55 | dx | 10.00 | Place | TAIWAN | Latitude and longitude | |
| y-Grids | 65 | dy | 10.00 | Zone | CET/UTC+8 | Latitude (–W, +E) | 120.00 |
| z-Grids | 40 | dz | 3.00 | 120.00 | longitude (–S, +N) | 22.10 | |
Table 3.
Settings of the initial meteorological environment.
| Start Date | 2016.06.27 | Start Time | 00:00:00 | Simulation Time (h) | 48 |
| Air Temperature (°C) | 29.7 | Wind Speed(m/s) | 1.9 | Wind Direction (360°) | 266 |
| Relative Humidity (%) | 52–76 | Pressure (hPa) | 1006.7 | - |
Table 4.
Settings of the basic value of surface materials and plants.
| Surface Materials | Plants | |||||||
|---|---|---|---|---|---|---|---|---|
| Type | Asphalt | Permeable asphalt | Pavement | Permeable pavement | Loamy | Type | Grass | Arbor |
| Code | ST | SW | PP | PW | LO | Code | XX | T1 |
| Albedo | 0.125 | 0.125 | 0.225 | 0.225 | 0.300 | Albedo | 0.225 | 0.200 |
| Emissivity | 0.95 | 0.950 | 0.805 | 0.805 | 0.925 | H(m) | 0.2 | 10 |
| Permeability | False | True | False | True | True | LAD | 0.3 | 2.18 |
Table 5.
Thermal perception of standard effective temperature (SET) and physical equivalent temperature (PET) [57].
Table 5.
Thermal perception of standard effective temperature (SET) and physical equivalent temperature (PET) [57].
| SET (°C) | <17 | 17~30 | 30~34 | 34~37 | >37 | ||||
|---|---|---|---|---|---|---|---|---|---|
| Thermal perception | Cool | Comfortable | Warm | Hot | Very hot | ||||
| PET (°C) | <4 | 4~8 | 8~13 | 13~18 | 18~23 | 23~29 | 29~35 | 35~41 | >41 |
| Thermal perception | Very cold | Cold | Cool | Slightly cool | Comfortable | Slightly warm | Warm | Hot | Very hot |
| Grade of physiological stress | Extreme cold stress | Strong cold stress | Moderate cold stress | Slight cold stress | No thermal stress | Slight heat stress | Moderate heat stress | Strong heat stress | Extreme heat stress |
Table 6.
Xeriscaping conversion scenarios and alterations to model parameters.
| Scenario | Street | Site of Building | Park | ||||||
|---|---|---|---|---|---|---|---|---|---|
| GCR (arbor) | Permeable Pavement | GCR of 1F | Permeable Pavement | GCR | GCR (arbor) | Permeable Pavement | GCR of 1F | ||
| (%) | (T/F) | (%) | (T/F) | (%) | (%) | (T/F) | (%) | ||
| B0 | Present Situation | 24 | F | 14 | F | 0 | 50 | 26.3 | F |
| C1 | Permeable Pavement | 0 | T | 0 | T | 0 | 60 | 50 | F |
| C2 | IncreaseSGCR | 60 | F | 60 | F | 0 | 60 | 50 | F |
| C2a | 40 | ||||||||
| C2b | 50 | ||||||||
| C2c | 70 | ||||||||
| C3 | C2 + Permeable Pavement | 60 | T | 60 | T | 0 | 60 | 50 | T |
| C4 | C3 + IncreaseGCR of Park | 60 | T | 60 | T | 0 | 80 | 75 | T |
| C5 | C4 + Roof Greening of Public Building (12.5%) | 60 | T | 60 | T | 100 | 80 | 75 | T |
| C5a | C4 + Roof Greening of all buildings (100%) | ||||||||
Table 7.
The space setting input files of the ENVI-met 3D model.
| Scenario | B0 | C1 | C2 | |
|---|---|---|---|---|
| 3D Model |  |  |  | |
| Scenario | C3 | C4 | C5 | |
| 3D Model |  |  |  | |
| Scenario | C2a | C2b | C2c | C5a |
| 3D Model |  |  |  |  |
Table 8.
Differences in the thermal environment values of vertical layers of C5a-C5.
| C5a–C5 | T. Surface | Ta | Wind Speed | Spec. Humidity | MRT | PET | SET |
|---|---|---|---|---|---|---|---|
| (°C) | (°C) | (m/s) | (g/kg) | (°C) | (°C) | (°C) | |
| H = 1.5m | –0.05(0M) | –0.22 | –0.005 | 0.182 | –0.074 | –0.147 | 0.009 |
| H = 2.7m | - | –0.23 | –0.005 | 0.183 | –0.077 | –0.143 | 0.012 |
| H = 7.5m | - | –0.27 | –0.006 | 0.194 | –0.087 | –0.197 | 0.005 |
| H = 16.5m | - | –0.33 | –0.005 | 0.218 | –0.087 | –0.353 | –0.057 |
| H = 25.5m | - | –0.27 | –0.002 | 0.166 | –0.082 | –0.319 | –0.069 |
Table 9.
Comparison of each scenario (X-B0 difference) (2:00 p.m., H = 1.5 m)
| Average of Block | B0 | C1–B0 | C2–B0 | C3–B0 | C4–B0 | C5–B0 |
|---|---|---|---|---|---|---|
| Air temperature (AT) (°C) | 35.91 | –1.37 | –0.44 | –1.93 | –1.96 | –2.00 |
| Wind speed (m/s) | 0.76 | 0.21 | –0.10 | –0.09 | –0.10 | –0.10 |
| MRT(°C) | 62.50 | –2.81 | –5.27 | –11.31 | –11.70 | –11.71 |
| T. surface (ST) (°C) | 49.90 | –7.90 | –3.24 | –11.51 | –11.69 | –11.70 |
| PET (°C) | 50.51 | –2.46 | –2.62 | –6.83 | –7.04 | –7.07 |
| SET (°C) | 38.32 | –1.80 | –0.61 | –2.45 | –2.49 | –2.50 |
© 2020 by the authors. Licensee MDPI, Basel, Switzerland. This article is an open access article distributed under the terms and conditions of the Creative Commons Attribution (CC BY) license (http://creativecommons.org/licenses/by/4.0/).
Share and Cite
MDPI and ACS Style
Huang, J.-M.; Chen, L.-C. A Numerical Study on Mitigation Strategies of Urban Heat Islands in a Tropical Megacity: A Case Study in Kaohsiung City, Taiwan. Sustainability 2020, 12, 3952. https://0-doi-org.brum.beds.ac.uk/10.3390/su12103952
AMA Style
Huang J-M, Chen L-C. A Numerical Study on Mitigation Strategies of Urban Heat Islands in a Tropical Megacity: A Case Study in Kaohsiung City, Taiwan. Sustainability. 2020; 12(10):3952. https://0-doi-org.brum.beds.ac.uk/10.3390/su12103952
Chicago/Turabian StyleHuang, Jou-Man, and Liang-Chun Chen. 2020. "A Numerical Study on Mitigation Strategies of Urban Heat Islands in a Tropical Megacity: A Case Study in Kaohsiung City, Taiwan" Sustainability 12, no. 10: 3952. https://0-doi-org.brum.beds.ac.uk/10.3390/su12103952
Note that from the first issue of 2016, this journal uses article numbers instead of page numbers. See further details here.