Article

Soil Disturbance and Recovery after Coppicing a Mediterranean Oak Stand: The Effects of Silviculture and Technology

1
Department of Agricultural and Forest Sciences, University of Tuscia, 01100 Viterbo, Italy
2
Department of Land, Environment, Agriculture and Forestry, Università degli Studi di Padova, 35020 Legnaro, Padova, Italy
3
CNR Institute of Bioeconomy, Via Madonna del Piano 10, 50019 Sesto Fiorentino FI, Italy
*
Author to whom correspondence should be addressed.
Sustainability 2020, 12(10), 4074; https://0-doi-org.brum.beds.ac.uk/10.3390/su12104074
Submission received: 24 April 2020 / Revised: 11 May 2020 / Accepted: 12 May 2020 / Published: 15 May 2020

Abstract

:
Traditional coppice management system is one of the most debated topics in the Mediterranean area, as it is a forest management system that accounts for over 23 million hectares. Coppicing is considered the oldest form of sustainable forest management. Its past and current widespread popularity is mainly due to its capacity to positively contribute to the rural economy and ecosystem services. This research aimed at assessing the effect of coppicing on soil characteristics, understanding a possible treatment return time, and evaluating the implementation of proper sustainable forest operations (SFOs) in order to have a better understanding of the disturbance caused by silvicultural treatment and forest operations with two different harvesting techniques. The results demonstrated that physical, chemical, and biological soil features were partially disturbed by the coppicing. Both silvicultural treatment and forest operations influenced soil disturbance. The least impactful technique was extraction by winch, while forwarding resulted in heavier alterations of soil characteristics. It took about five years for the soil to recover its original pre-harvest conditions when the disturbance was caused by the silvicultural treatment alone (non-trafficked areas) and about eight to nine years when the disturbance was the cumulated effect of silvicultural treatment and logging activity (trafficked areas).

1. Introduction

The coppice management system is one of the most debated topics in the Mediterranean area, as it is a forest management system that accounts for over 23 million hectares [1]. Coppicing is considered the oldest form of sustainable forest management and for this reason it is considered as a natural forest management system [2]. Its past and current popularity is mainly due to its capacity to positively contribute to the rural economy and ecosystem services [3]. Even if this management system presents environmental shortcomings, coppicing represents a valid and flexible management system that requires low inputs and guarantees maintenance of many aesthetic, environmental, social, and economic functions [1,4,5].
Recent findings in ecological and forestry research have highlighted that coppice forests contribute to soil protection and biodiversity conservation [6,7], showing good resilience and significant adaptability to climate change [1,8].
In the past, Mediterranean oak coppice stands were an important source of timber, firewood, and charcoal [9], as well as litter and pasture [10]. Today, they are mostly invested in the production of wood biomass for energy use due to their capacity to yield sustained amount of raw material at short intervals (on average one cutting cycle is every 12–18 years) [2].
These short cutting cycles could negatively affect soil quality and regeneration vigor [11,12]. Special concern is aroused by the risk for soil degradation connected with frequent machine traffic, which may cause compaction, topsoil removal, and general disturbance [13,14,15,16]. Nevertheless, not all logging techniques have the same impact potential and the specific characteristics of any given operation depend on site characteristics, silvicultural management, technological level, and product strategy [17,18]. Furthermore, technological innovations in forest logging and mechanization [19,20] could positively contribute to the improvement of work conditions, compared with traditional logging systems [21,22].
Assessing ground disturbance and minimizing possible damage due to silvicultural treatments and forest operations remain the main focus of sustainable forest management (SFM) [23,24,25]. In order to reach this aim, numerous suggestions have come from recent research, namely: to minimize the area of soil disturbance and compaction by appropriate operation planning [18,26,27]; to make careful execution of logging operations [28,29]; and to use suitable mechanization [12,30,31,32,33,34]. All this is in consideration of the fact that adequately managed forest ecosystems are highly resilient in the long-term [25,35].
Focusing the attention on coppice systems, there is a need to acquire more information about the impacts due to silvicultural treatment, i.e., actual logging and their interactions. These topics are very often the subject of heated arguments and detailed scientific results are needed to better understand the issue and provide best practice suggestions [2]. For these reasons, the concept of sustainability is frequently overlooked and is not considered as a clear instrument to assess the impact of global change and development.
SFM is based on continuous improvements of silvicultural practice and logging methods. In particular, better knowledge is needed on the recovery time of managed forest ecosystems after the inevitable disturbance cause by forest operations, however well they are managed. This is one of the key factors for sustainable use and an important issue both for high forests and coppices [1].
Recent studies [4,5,36] on coppicing in the Mediterranean area have highlighted that within a short time after harvesting (0–3 years), soil and regeneration characteristics show clear signs of recovery. These findings demonstrated that physical, chemical, and biological soil features were only marginally affected by the silvicultural treatment applied, but strongly impacted by harvesting operations.
Coppicing maintains a cyclical pattern of extreme changes in ground-level light penetration [1,37,38], producing heterogeneous mosaics of forest in various stages of succession that harbor a rich variety of animals and vascular plants [39,40,41,42,43].
Only efficient planning and management of forest operations and accurate knowledge of the environmental dynamics of the forest will offer high social and environmental benefits and provide various ecosystem services in the long term [44]. These aspects can be guaranteed only through SFM in synergy with sustainable forest operations (SFO) [45]. These tools are essential for proper environmental protection and they are mandatory in order to maintain forests and their multiple functions [45]. In particular, forest operations and coppice management are interesting but delicate issues to be analyzed and evaluated in order to achieve real sustainability.
Starting from this background to increase scientific knowledge on the effects of coppicing, the present experiment was designed with four specific goals:
  • to investigate the impact of the silvicultural treatment on soil condition;
  • to find out how both silvicultural treatment and forest operations influence soil characteristics;
  • to compare the impact of two different harvesting techniques on soil condition;
  • to assess the recovery capacity of soil after harvesting in order to project a possible treatment return time; and evaluating the existence of a proper SFO.
To this end, soil conditions in a Turkey oak coppice located in central Italy were monitored every year for five years after harvesting.

2. Materials and Methods

2.1. Study Sites

The study stand was Turkey oak (Quercus cerris L.) forest managed as coppice with standards. The stand was located in Central Italy, Lazio Region, Tarquinia municipality (42°34′37.07″ N, 11°76′40.00″ E). The whole forest covered about 100 ha, with homogeneous elevation, slope gradient, and roughness: 100 m a.s.l., 25% slope gradient and ca 5% of the surface presenting obstacles to machine traffic, respectively. The accessibility of the forest was therefore fairly good (12 m/ha of main forest roads) but the road network in the area included few permanent skid trails.
The soil was an Abruptic Luvisol (EpiArenic Cutanic) (WRB, 2014) alluvial, with good depth (ranging from 0.6 to 0.9 m) non-hydromorph and with a neutral reaction. Soil texture was defined as Silty-Loam (SL), due to the high silt content (52%), moderate sand content (38%) and low clay content (10%). Soil field capacity (CC) was 24%, determined using the soil water method [46].

2.2. Silviculture and Harvesting Technique

The study coppice was clear-cut at the age of 35 years, releasing 140 standards per hectare. Standards belonged to three age classes: 35-years-old (60%), 45-years-old (30%), and 60-years-old or older (10%). The harvesting operation was completed within approximately 150 days for the about 100 ha studied.
Only one harvesting system was applied, the tree length system (TLS) [47]. One control study area was selected of about 20 ha of coppice unharvested and not impacted for more than 20 years. Felling was performed motor-manually by three teams of two operators equipped with Husqvarna 550 XP chainsaws.
About one half of the wood (about 50 ha) was skidded to roadside landing using a forestry fitted farm tractor equipped with a winch. This was a four-wheel drive LANDINI tractor with a rated power of 80 kW and a total weight of 4200 kg, including the forestry winch. The tractor stationed on the main forest road reached the trees with its winch and pulled them to the road. Once it had assembled a full load, the tractor drove on the forest road all the way to the landing. The average tractor load was 0.9 t.
The remaining half of the wood (about 50 ha) was carried to the roadside landing using a John Deere 1410D eco III eight-wheeled purpose-built forwarder. This machine had a rated power of 136 kW, an empty weight of 16,600 kg and payload capacity of 14,000 kg. The forwarder left the forest road and entered the stand, travelling on the forest floor and picking the delimbed stems with its 7.5 m hydraulic loader. Once a full load had been assembled, the forwarder drove back to the forest road and then to the landing. The average single load size was 11.7 t.
Pre-harvest stand characteristics (Table 1) were obtained using standard forest mensuration techniques on thirty randomly selected circular plots with a 20 m radius, each therefore covering an area of 1256 m2. These measurements confirmed the substantial uniformity of the three study areas: control, winch, and forwarder.
The stand data collected on the three-study area before harvesting showed the same average values with similar growth trends (Table 1). The post-harvest measurements of soil characteristics were taken every year for five years.

2.3. Analytical Methods

Soil analyses were conducted on 30 randomly selected sample plots (SP) on each study area (W, F, and C). Each SP consisted of a circular area of 113 m2. The analyses were done in order to assess the presence/absence of soil impacts due to the silvicultural treatment and to the forest operations and followed the research protocols proposed by Picchio et al. [21,31,48] and Venanzi et al. [2]. In particular, for the SPs in the harvested areas (W and F), two different strata were selected based on a visual assessment of impact (e.g., the presence or absence of bent understory, crushed litter, ruts, or soil mixing) to represent trafficked and untrafficked soil conditions, respectively. In the case of the winch treatment, these signs derived from the sliding of the tree bunches on the forest floor, as they were pulled to the road by the winch. In the case of the forwarders, these signs were derived from the passage of the wheels. On each stratum, the soil was analyzed for texture, bulk density (BD), penetration resistance (PR), shear resistance (or strength) (SR), organic matter content (OM), pH, and QBS-ar (soil biological quality index referred to micro arthropod community). For particle size distribution, three soil samples in each SP were randomly collected from the top 30 cm of soil [4].
Rock fragments (particles with >2 mm diameter) were removed from the air-dried samples by sieving. Silt, clay, and sand were determined using the Andreasen pipette method [48]. These fractions were used to find the soil classes using the textural USDA triangle [49].
BD, PR, and SR were determined through the methods proposed by Marchi et al. [4] and expressed in Mg m-3, MPa, and t m-2, respectively. The pH value was measured using potentiometric analysis in soil/saline solution suspensions (soil-KCl 1 mol) in a 1:2.5 proportion. OM measurement was performed by incineration in a mitten at 400 °C for 4 h following the thorough elimination of water and pre-treatment at 160 °C for 6 h.
As described in Marchi et al. [4] and Spinelli et al. [50], linear transect were laid down according to a systematic pattern. Each transect was rectangular in shape (1 m x 50 m) and was established using a compass and tape measure. These linear transect were used to assess the relative proportions of the two strata (i.e., trafficked and untrafficked).
The QBS-ar index was used as a biological indicator for the soil analysis, being extremely sensitive to environmental variations caused by disturbance. This index is mainly qualitative and evaluates the presence and complexity of the soil microarthropod community. The methodology applied was reported in Venanzi et al. [5] and Marchi et al. [4].

2.4. Statistical Analyses

Statistical analyses were carried out with StatisticaTM version 7.1 (TIBCO Software Inc.). Data distribution was plotted and checked for normality and homogeneity of variance using the Lilliefors and Levene tests, respectively. To check differences between treatments t-test and ANOVA, were applied, followed by Tukey’s post-hoc test when necessary. The elected significance level was α < 0.05. Data that violated the normality and/or the homoscedasticity assumptions were analyzed using the nonparametric Kruskal–Wallis test. Non-linear regression analysis was done for all the soil variables in relation to the time (in years) post-harvesting. This analysis was applied to assess the possible existence of a recovery trend for the main soil characteristics. The polynomial approach was applied because these natural dynamics can be better described by a non-linear function [51]. Non-metric multidimensional scaling (NMDS) was used to show the differences in the average soil parameters for the different treatments over the five observed periods.

3. Results

3.1. Analysis of the Impacted Surface

The proportion of the total surface affected by machine traffic was significantly different for the two harvesting systems (Table 2).

3.2. Physical and Chemical Analyses of Soil

Soil data was collected every year for five years, always in the same month, in particular during the last fortnight of September, in order to operate always under the same weather conditions. These analyses showed no statistically significant differences regarding soil moisture in the harvested forests between sampling periods (average moisture ± standard deviation: 34 ± 2%; 32 ± 5%; 35 ± 7%; 32 ± 6%; 36 ± 4% for 1, 2, 3, 4, and 5 years after coppicing, respectively). In the control areas, soil moisture showed the same trend, but with slightly higher values (difference range of about +6% to +9%).

3.2.1. Soil Bulk Density

The soil bulk density (BD) data showed statistically significant differences between the two strata (trafficked and untrafficked), the two harvesting techniques and the five periods (in Table 3 were reported only the values of two periods, i.e., 1 and 5 years after coppicing). In particular, BD was higher in the trafficked areas than the untrafficked ones, in the first four periods, and within these areas BD was higher for the F than for the W treatment. Data collected in the fifth year showed a recovery of soil BD for all treatments.
A clear BD recovery was shown for the trafficked soil typologies (Figure 1) that started three years after harvesting, while for the untrafficked soil typology it started two years after coppicing. BD was affected by the uncovering effect due to coppicing and during the first two years after coppicing it was higher in the harvested but untrafficked areas than in the control ones (Table 3 and Figure 1). The regression models built (Table 4 and Figure 1) are all statistically significant but with a relatively weak explanatory value (r2adj ~ 0.4) for the control and the untrafficked treatments, and somewhat stronger (r2adj ~ 0.6) for the two trafficked treatments. During the fourth and fifth year post-harvesting the untrafficked treatment and the trafficked winch treatment showed a complete recovery of soil BD (Figure 1). Conversely, soil BD trafficked by the forwarder did not show a complete recovery five years after harvesting (Figure 1), but the improving trend indicated that full recovery could be achieved in the sixth or seventh year.

3.2.2. Soil Penetration Resistance

The results for soil penetration resistance (PR) matched those for BD and showed statistically significant differences between the two mechanization levels, traffic strata (trafficked and untrafficked), and five years (in Table 5 were reported only the values of years 1 and 5). In particular, PR was clearly higher in the trafficked areas than in the untrafficked ones in the first four periods and within those groups higher PR was recorded in F than in W. Analysis of the last period (five years after logging) showed a recovery of soil PR for the W area, while for the F area there were again higher values in the trafficked areas.
A clear PR recovery trend was visible for the untrafficked and trafficked soil typologies (Figure 2), starting two years after logging. PR was affected by the uncovering effect due to coppicing during the first two years after harvesting and was higher in the harvested but untrafficked area than in the control ones (Table 5 and Figure 2). The regression models built (Table 6 and Figure 2) are all statistically significant with a reasonably good explanatory value (r2adj ~ 0.5) for the C and untrafficked treatments, a better explanatory value (r2adj ~ 0.6) for the W/trafficked typology, and a high explanatory value (r2adj ~ 0.7) for F/trafficked typology. During the third year post-harvest, untrafficked soil showed a complete recovery of soil PR (Figure 2). The same occurred for the soil trafficked in the winch treatment, but only one year later. Finally, the PR of soil trafficked by the forwarder showed a complete recovery five years after harvesting (Figure 2).

3.2.3. Soil Shear Resistance

The soil shear resistance (SR) data showed statistically significant differences between the two mechanization levels, soil strata (trafficked and untrafficked), and five periods (in Table 7 were reported only the values of two periods, 1 and 5 years after coppicing). In particular, SR was clearly higher in the trafficked treatments than in the untrafficked ones in all the five periods observed, with higher impacts in the F treatment than in the W treatment. Data from the last period (5 years after logging) showed full recovery of soil SR for the W treatment, but not for the F treatment in the trafficked areas.
A clear SR recovery trend was visible for the trafficked strata (Figure 3), starting two years after logging. SR was not affected by the uncovering effect due to coppicing and was higher in the control area than in the harvested ones (Table 7 and Figure 3). The estimated regression models (Table 8 and Figure 3) are statistically significant only for trafficked soils, with a medium explanatory value (r2adj ~ 0.5) for the W/Trafficked treatment and a low one (r2adj ~ 0.4) for the F/Trafficked treatment. During the fourth year post-harvesting the soil trafficked by winching showed a complete recovery of SR (Figure 3). On the contrary, the SR of the soil trafficked by forwarding did not show a complete recovery five years after harvesting (Figure 3). However, the trends indicated that full recovery should be achieved between the eighth and ninth year.

3.2.4. Soil Organic Matter Content

The soil organic matter content (OM) showed statistically significant differences between the two mechanization levels, soil strata (trafficked and untrafficked) and five periods (data partially shown in Table 9 for one and five years after coppicing). OM content was clearly lower in the trafficked stratum than in the untrafficked one in the five observed periods, with higher impact in the F treatment than in the W treatment. The data indicates that even five years after logging, OM content was not back to the original values in the trafficked stratum of both the W and the F treatments, while it was achieved in the untrafficked strata.
However, the trends are for a slow but clear recovery, which became visible two years after harvesting in the winch/trafficked treatment, and one year later in the forwarder/trafficked treatment (Figure 4). OM content was affected by the uncovering effect due to coppicing (i.e., mineralization due to the access of light) in the four years after harvesting and it was lower in the harvested but untrafficked areas than in the control ones (Table 9 and Figure 4). The regression models built (Table 10 and Figure 4) are all statistically significant with a medium to high explanatory value (r2adj ~ 0.5 for C/Untrafficked, and r2adj ~ 0.7) for W/Trafficked and F/Trafficked). During the fourth year post-harvesting untrafficked soil showed a complete recovery of soil OM content (Figure 4), while the OM content of soil trafficked by winching and forwarding was not back to the original values even five years after harvest: trends indicated that full recovery could be expected between the seventh and the eighth year.

3.2.5. Soil pH

Soil pH is an important soil characteristic, because its variations affect a number of pedological parameters and processes [52] (Picchio et al., 2019). In this study (Table 11, Table 12 and Figure 5), soil pH did not seem affected by either silvicultural treatment or logging technique.

3.3. Soil Biodiversity Aalysis

The QBS-ar index (QBS-ar) showed statistically significant differences between the two mechanization levels, soil strata (trafficked and untrafficked), and five periods (data partially shown in Table 13, for the first and fifth year after coppicing). QBS-ar content was clearly lower in the trafficked areas than in the untrafficked ones in all the five observed periods, with the highest impact one year after coppicing. The effect was stronger for the F treatment than for the W treatment, but this trend reversed in the fifth year when the residual impact was stronger for the W treatment compared with the F treatment. Complete recovery was not achieved within five years for any of the two treatments, neither in the trafficked nor the untrafficked strata.
However, trend analysis showed that QBS-ar recovery started already in the second year after harvest for all treatments (Figure 6). The QBS-ar index was affected by the uncovering effect due to coppicing and during the five years after harvesting it was lower in the harvested areas than in the control ones, even in the absence of visible disturbance (Table 13 and Figure 6). The regression models (Table 14 and Figure 6) are all statistically significant and have a very high explanatory value (r2adj ~ 0.9). During the 5 years post-harvesting neither the untrafficked nor the trafficked strata showed a complete recovery of the QBS-ar index (Figure 6). However, the trends indicate that full recovery could be achieved between the sixth and the seventh year for untrafficked areas and between the eighth (forwarding) and the ninth year (winching) for trafficked areas.

4. Discussion

First of all, it is important to state upfront the possible limitations of this study so that any conclusions are interpreted with due caution, especially when it comes to generalization. Even if the analyses were done with statistical normalization and standardized methodologies, some residual limitations are still present. The main possible limitation is the reference to one specific stand and machine system. This is a common limitation of most studies of this type and while the stand was representative of a wider typology, it is clear that different results could have been obtained on different stands or on the same stand type growing on a different soil substrate. The same goes with machine selection, since both winching and forwarding can be applied with a wide range of different machines with different competence and with different levels of attention to minimizing undesirable environmental effects. Nevertheless, this study offers an interesting example of how different extraction techniques can impact the physical and biological characteristics of forest soils, and it is still suitable as an approximate general reference until more data will be available for other forest and machine types.
Comparison with previous studies supports cautions generalization. The proportion of the trafficked surface is only slightly higher than reported by Marchi et al. [4] and very close to that reported by Venanzi et al. [5], Picchio et al. [53], and Jourgholami et al. [54]. In fact, the highest value reported in the study for forwarding—31%—matches almost perfectly the 33% benchmark offered by Spinelli et al. [55] for the harvesting of coppice stands with traditional ground-based technology in Central Italy. In that regard, one must be aware that the proportion of total surface disturbed by forest operations is widely variable and is strongly dependent on the type of intervention, with the lightest harvesting operations—such as the selective removal of individual trees—impacting as little as 5% of the total surface [56] and the heaviest ones—the salvage of large windthrown areas—affecting over 50% of the total surface [57], and that independently of the harvesting technique. As a matter of fact, this study also highlights the role of silviculture, indicating that significant soil impacts occur even in the absence of machine traffic, by merely removing the forest canopy, which can be easily construed as the most traumatic event for the forest ecosystem.
Corroboration for the results of this study is also offered by previous studies of soil compaction consequent to harvesting. The 14% to 19% soil bulk density increase recorded here matches quite well the 12% increase recorded in Mediterranean pine forests by Kleibl et al. [58]. This value is twice as large as recorded by Magagnotti et al. [59] for dedicated forest skidders (increase in soil BD ca. 6%), but one must account for the different technology and for the very good floatation capacity of the dedicated forest equipment used in the quoted study. In any case, the post-impact soil BD values recorded in these studies and those obtained from the current experiment are almost the same, and range between 1.1 and 1.3 g cm−3. This is very important because several studies indicate that root growth is impaired only when soil BD reaches higher values than here, and in the range of 1.7 to 1.8 g cm−3 [60,61]. Therefore, it is unlikely that the level of compaction recorded in this study may stunt stand growth, which is also confirmed by the fact that the soil started recovering relatively quickly, and in most cases the original soil properties were fully restored within five years. Incidentally, this result is even better than reported by Kleibl et al. [58] for Mediterranean pine stands also located in Central Italy, where full recovery was not achieved within the sixth year.
The study also showed that winching caused lighter soil disturbance compared with forwarding, and generally allowed for faster recovery, except in the case of QBS-ar. However, this is a contentious subject because the studies that have compared the soil impacts caused by tree-length and cut-to-length harvesting offer contrasting results: some support the findings of this research and indicate that TL causes lighter impacts [2], while others support the exact contrary [62,63]. The issue is likely one of machine selection and operational planning. In particular, one may argue that the forwarder used in this study may have been too big for the work at hand, and that the higher level of disturbance it caused could have been avoided if one had selected a lighter machine, like one of the many mini-forwarder available on the market and used in Italy, too [64]. In any case, the problem is that winching is a labor-intensive work technique with a much lower technical and financial performance compared with forwarding [65]. What is more, winching is a very tiresome job and none of the solution adopted to relieve operator’s fatigue has been fully successful [66,67]. As a matter of fact, this work technique has almost disappeared from the coppice operations conducted in more industrialized countries like France [31,68]. Italian loggers are now looking with increasing interest to modern forwarder technology [69]. Finally, a decisive step towards mechanization is the best way to reduce fatalities in forest operations, which should be a strategic objective and a strong ethical obligation [70].
In decreasing order of disturbance, soil SR, QBS-ar index, OM content, and BD were influenced by coppicing.
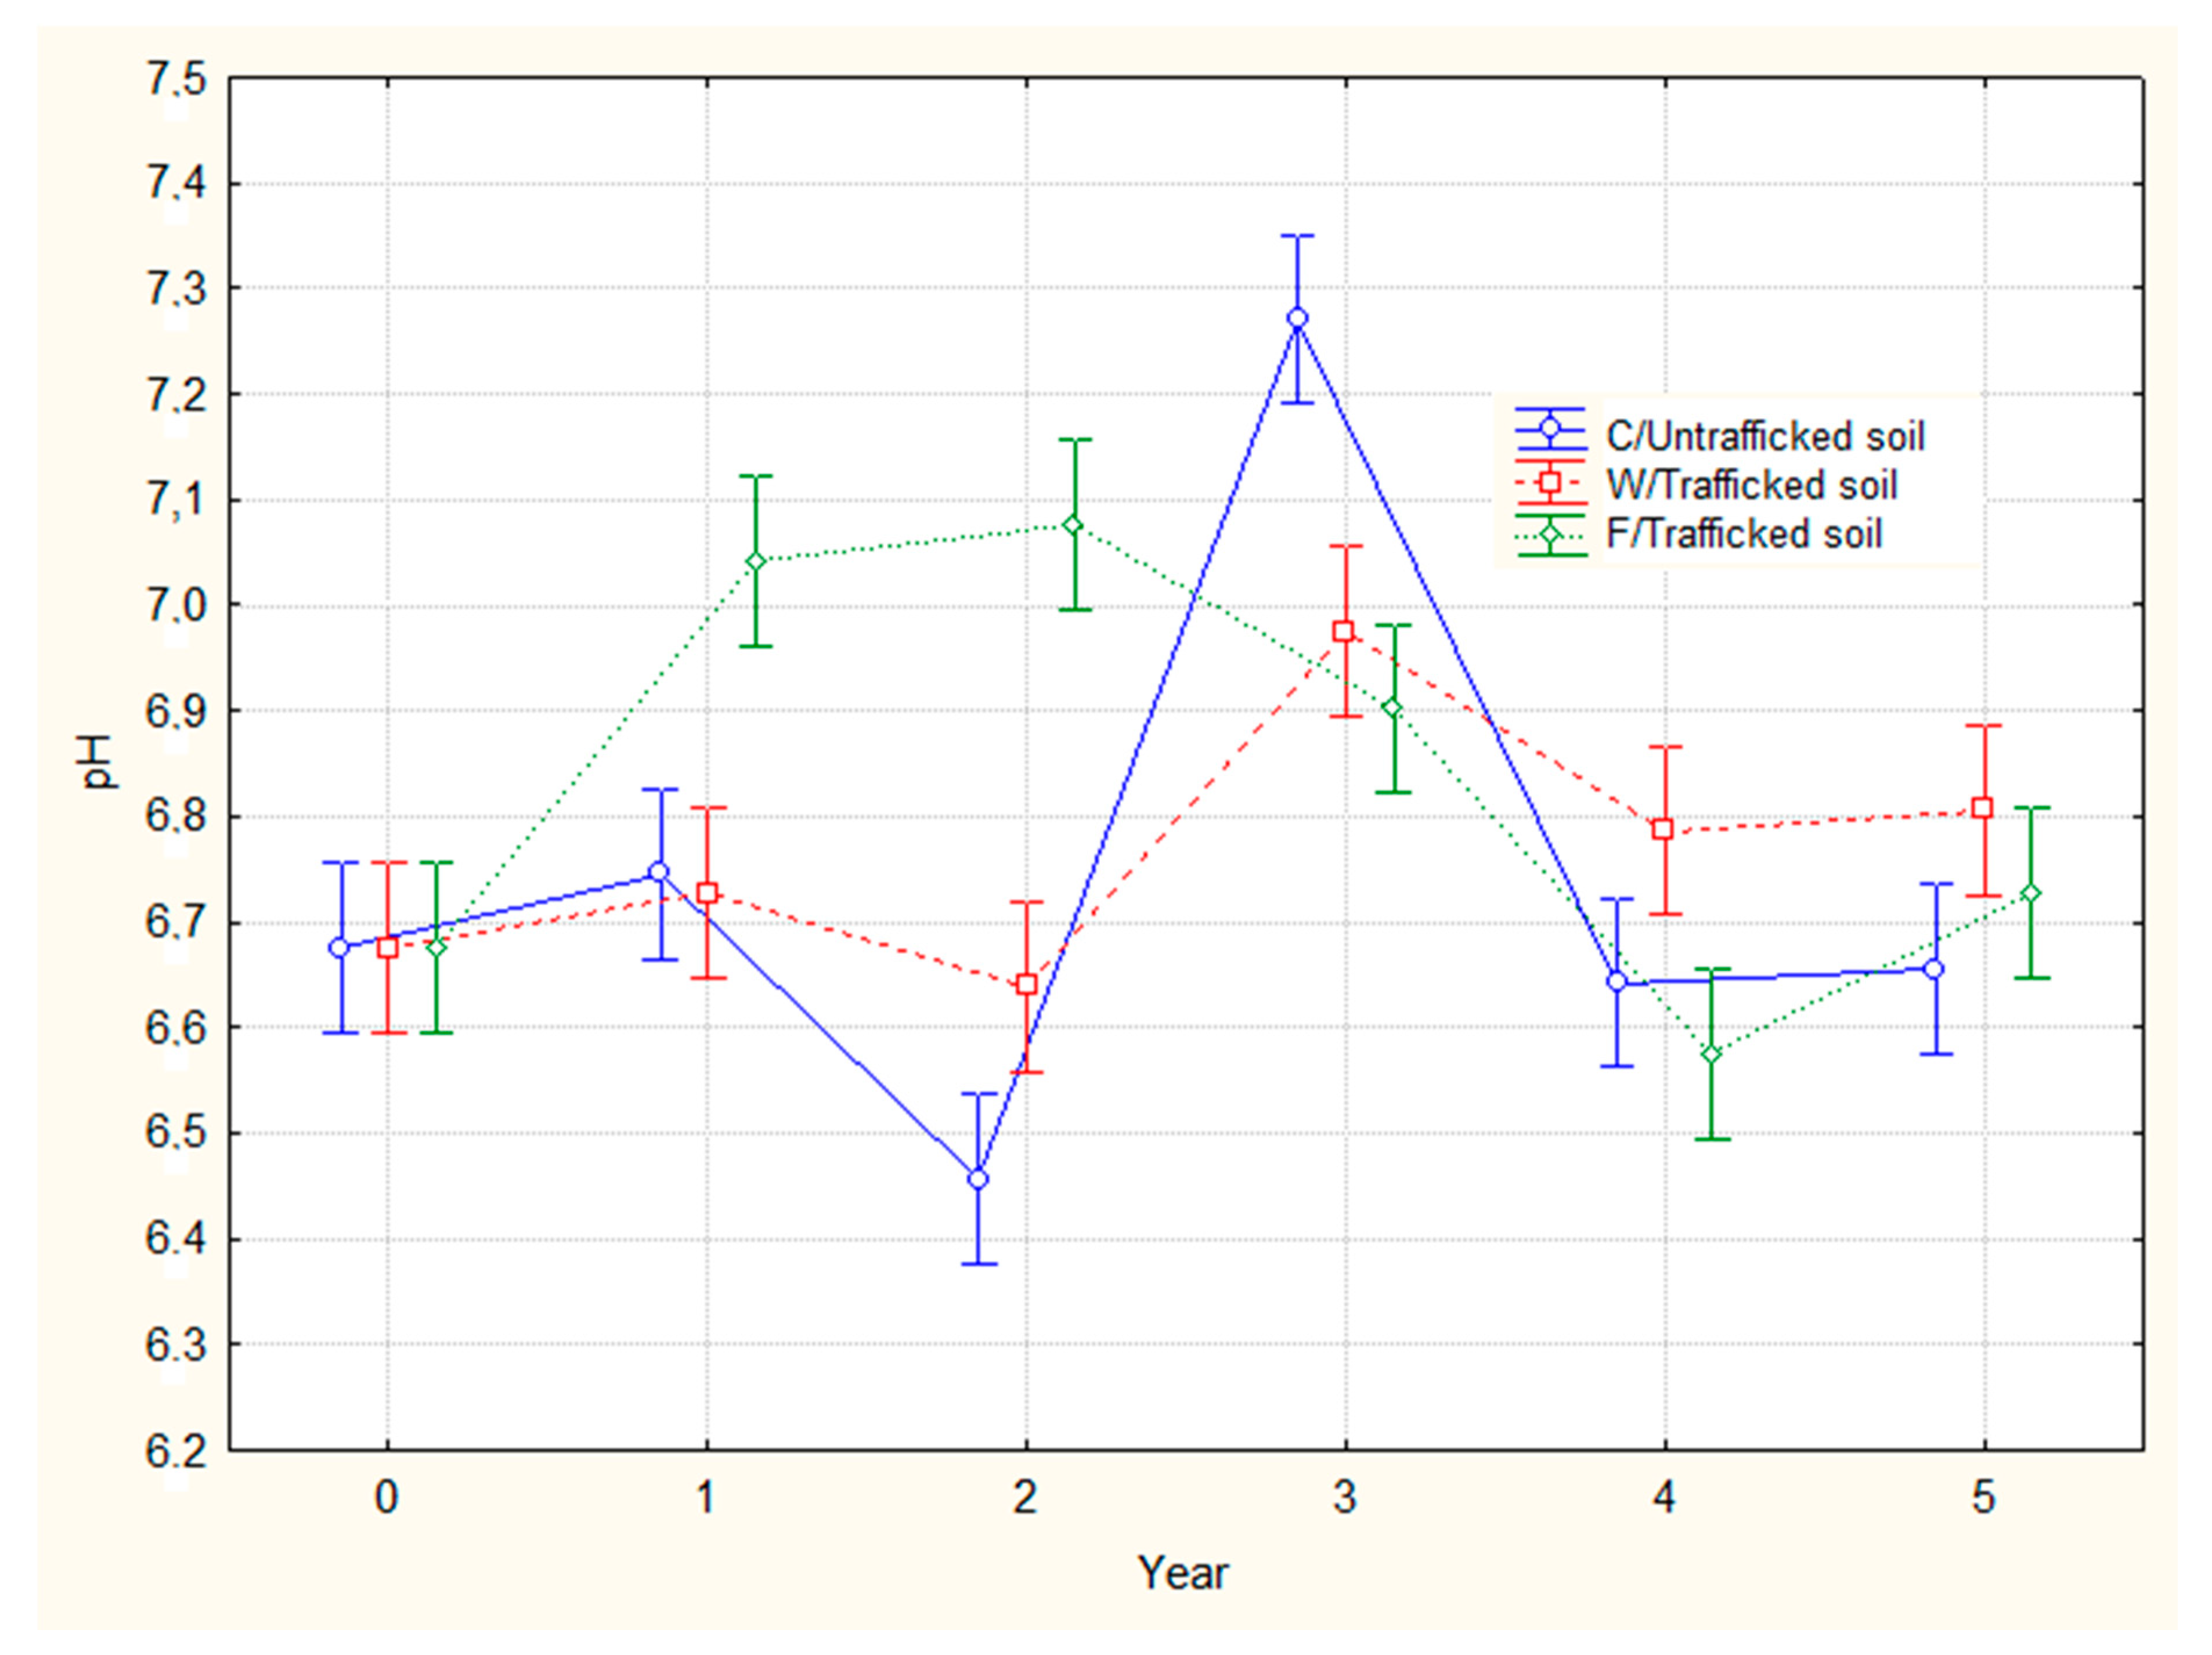
Full recovery was observed between the fourth and fifth year for OM content and BD. Instead, soil PR and pH were not influenced at all by coppicing. This was shown by the comparison of untrafficked soil surfaces in the coppiced areas with the control areas (left unmanaged for the last two decades). These findings are marginally similar to what was found by Venanzi et al. [2,3,4,5] and Marchi et al. [4]). These soil parameters could be affected by weather events, but due to the quick canopy regeneration in coppice management these impacts were limited to a period of few years after harvesting (3–5 years).
As found also by many authors [2,4,5,28,29,32,48,71,72], in the short-term, the soil disturbance caused by forest operations showed significant differences between trafficked and untrafficked soil samples. In this case the highest impact being found for forwarding rather than winching, especially in the first year after harvest. However, a recovery trend clear emerged within the second or third year, depending on specific soil property and treatment.
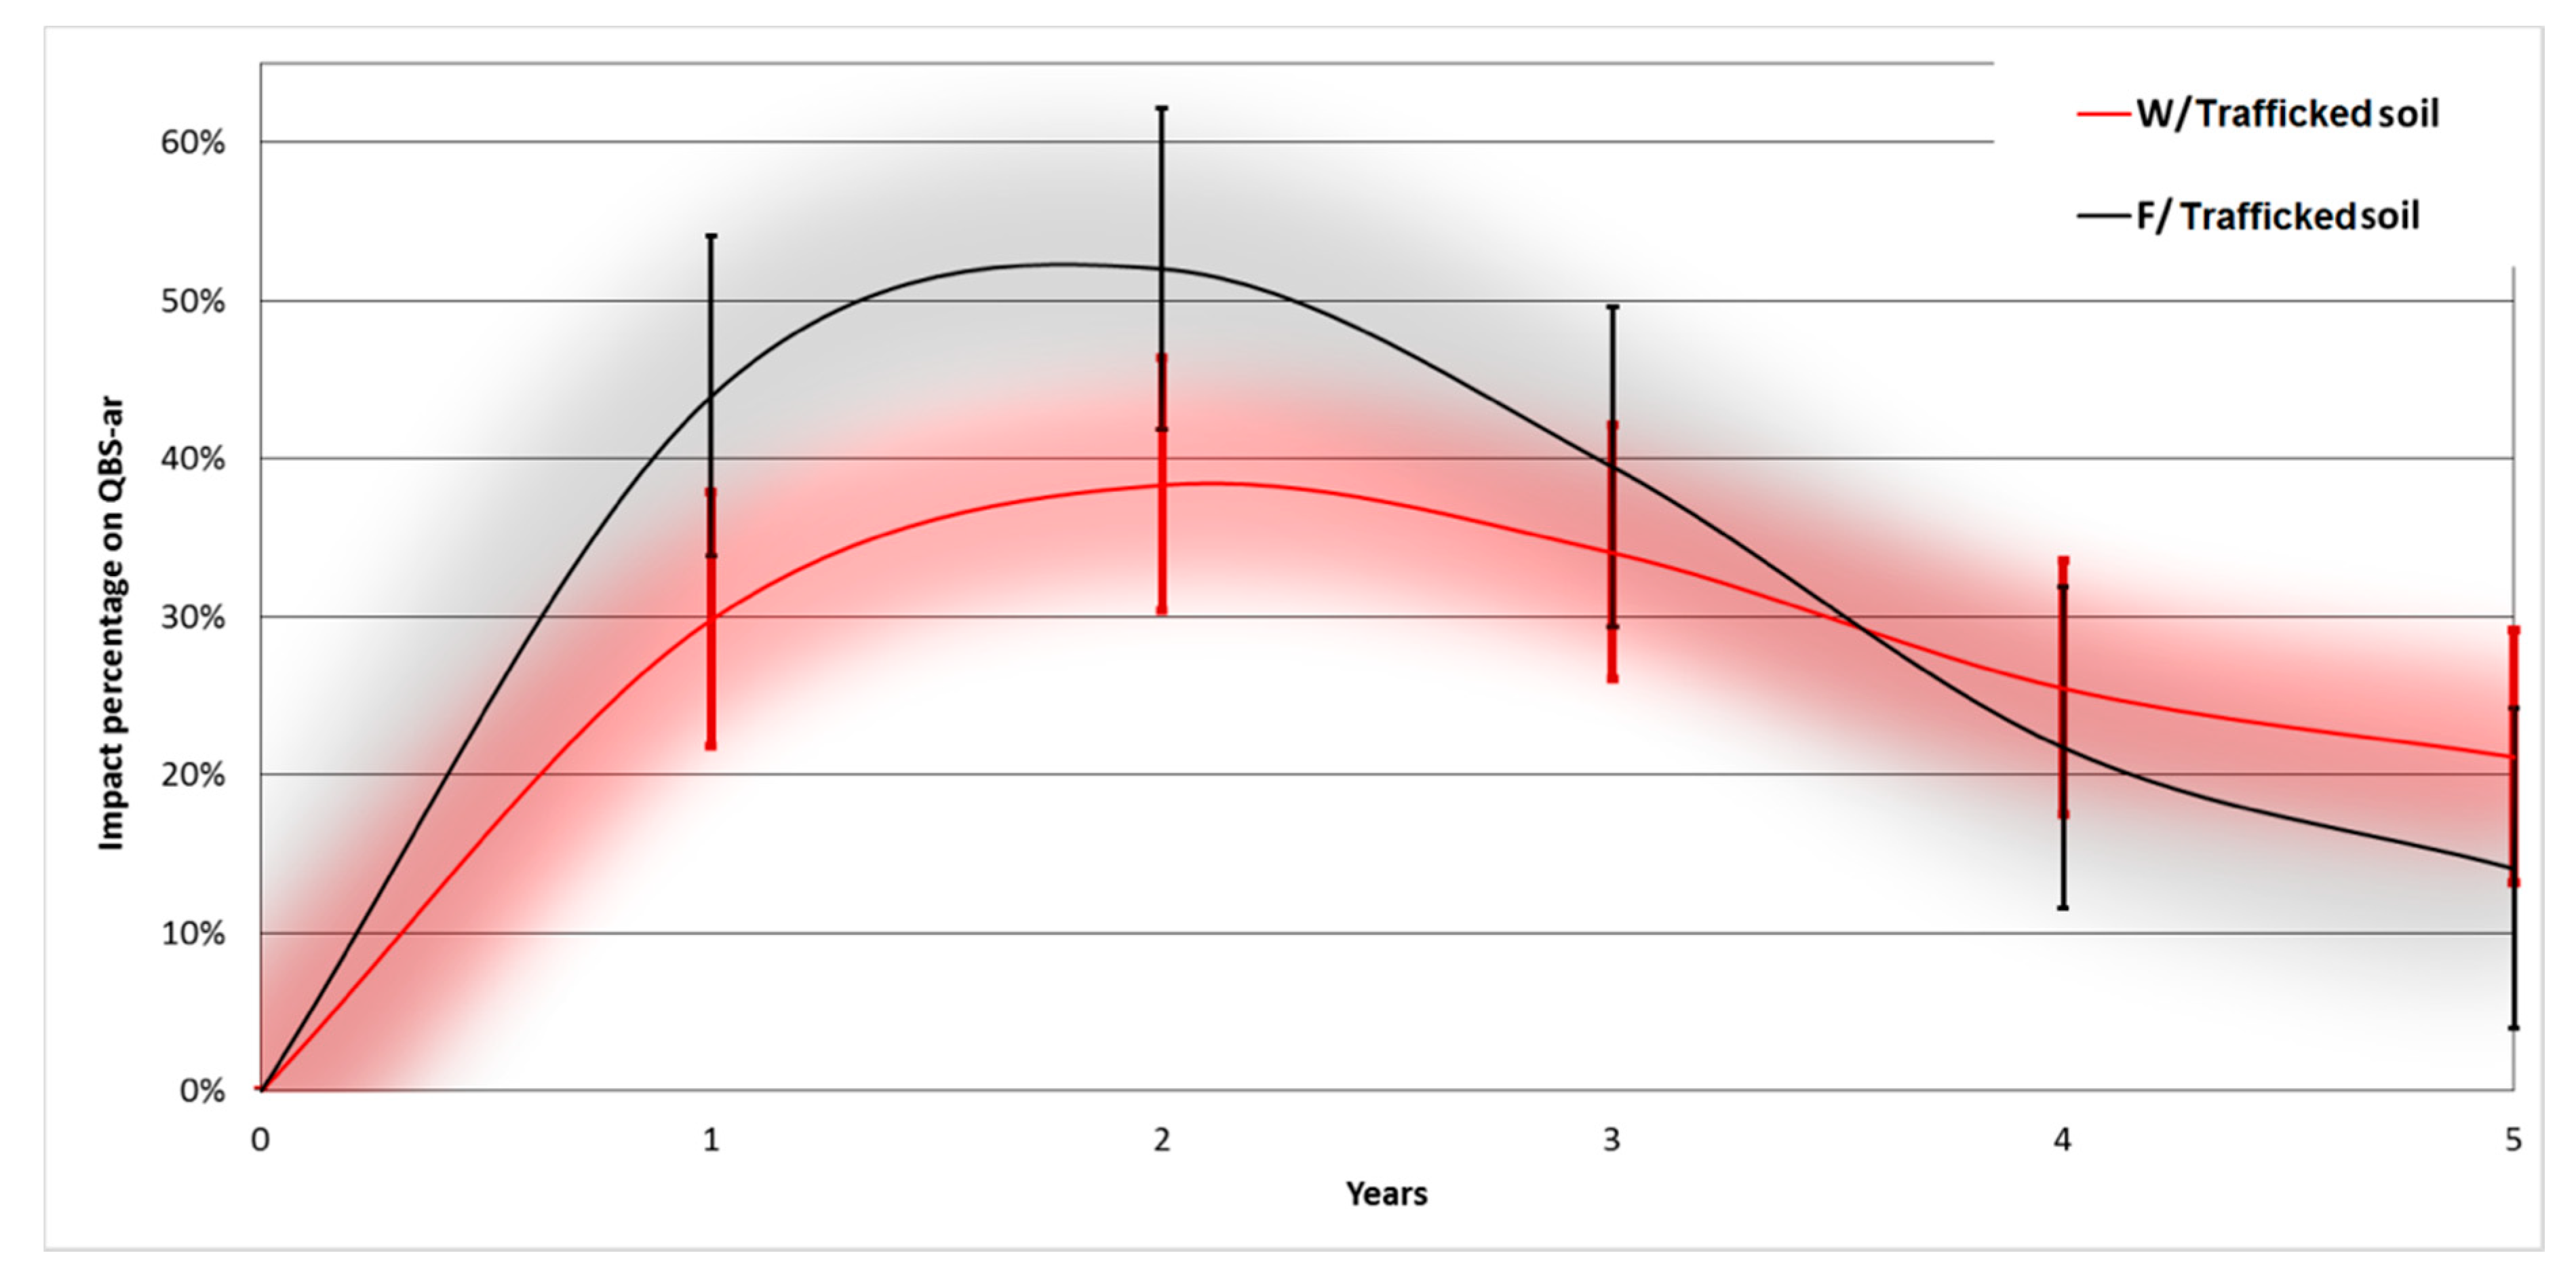
Five years after logging, the two harvesting techniques showed different recovery trends. For the areas extracted by winching, BD and PR showed a complete recovery, while SR, OM, and QBS-ar index showed an important but incomplete recovery with percentages of residual impact varying between 24% and 44%. Conversely, in the areas extracted by forwarding, BD, PR, SR, OM, and QBS-ar index showed an important but incomplete recovery with residual impact varying between 4% and 144%. Consequently, as also suggested by Venanzi et al. [2], there is a need to discuss a possible limit on forest soil surface directly affected by the moving of machinery and logs, even if recovery could be considered relatively fast. The better results shown by winching was related to the limited movements of the tractor directly on the forest floor, since the tractor stationed on the road.
Differently from what was found by Venanzi et al. [2], soil organic matter content was not clearly influenced by coppicing and complete recovery was possible four years after logging. In general, the chemical and physical parameters observed were similar to those found in other studies [2,4,5] but in this forest typology the recovery of the soil disturbance specifically caused by coppicing (canopy removal) was recovered 3–4 years after harvesting.
As found also by Venanzi et al. [2], logging activities showed significant modification of OM content for both harvesting techniques. Recovery started 2–3 years after logging and it was expected to be complete after 7–8 years. The negative variation in OM content during the first years after coppicing may be linked to canopy removal, which means a lack of leaves contributing to litter formation and an increase in the respiratory activity of soil microorganisms. Quick recovery shown was linked to fast canopy regeneration and to the release of the twigs on the ground, both typical of coppice management.
Soil pH did not show any clear statistical relation with treatments or time. As found in other studies [2,4,5,12,71], soil pH generally shows low variation and is not clearly connected with soil disturbance.
As also showed in other research [2,4,5] QBS-ar index was negatively influenced by coppicing, and recovery was slower here than showed in other studies (expected 6–7 years after logging). That was consistent with the physical and chemical properties of the observed soil. This was shown by a comparison of the untrafficked soil surfaces in the coppiced areas with the control areas.
The QBS-ar index is often linked to physical and chemical soil parameters, therefore it is logical that significant differences in the QBS-ar index would be found between trafficked and untrafficked soil samples. The greatest impact was for winching areas (48%) and the lowest for forwarding areas (40%). Similar values were found in other similar studies [2,4,5,28,29,48]. Soil recovery was evident three years after coppicing and it showed different rates for the two harvesting techniques. Five years after harvesting, the forwarding areas showed an important recovery with only 4% residual impact, while the winching areas showed a modest recovery with still 40% residual impact. This result, in contrast to the other soil parameters, is closely linked to the different working capacities of the two machines used, which has resulted in the forwarder completing the harvesting in a much shorter time. Therefore, the disturbance inflicted on soil micro-arthropods lasted a much shorter time compared with the disturbance inflicted by the tractor with winch.
Although these findings underline the vulnerability of forest soil due to natural and/or human disturbance [73], in the case of coppice management the forest soil showed a significant recovery in a short period, highlighting that this silvicultural practice is sustainable and that coppice stands are quite resilient in the face of external disturbance.
Within such context, precision forestry could be an interesting approach to reduce impacts, through rationalized planning of logging operations [74]. The design and application of low impact logging methods [18,19,20,21,22,23,24,25,26,27] and sustainable forest operations (SFO) criteria, together with operator training is the mainstay of reduced impact logging, rather than the mechanization level.
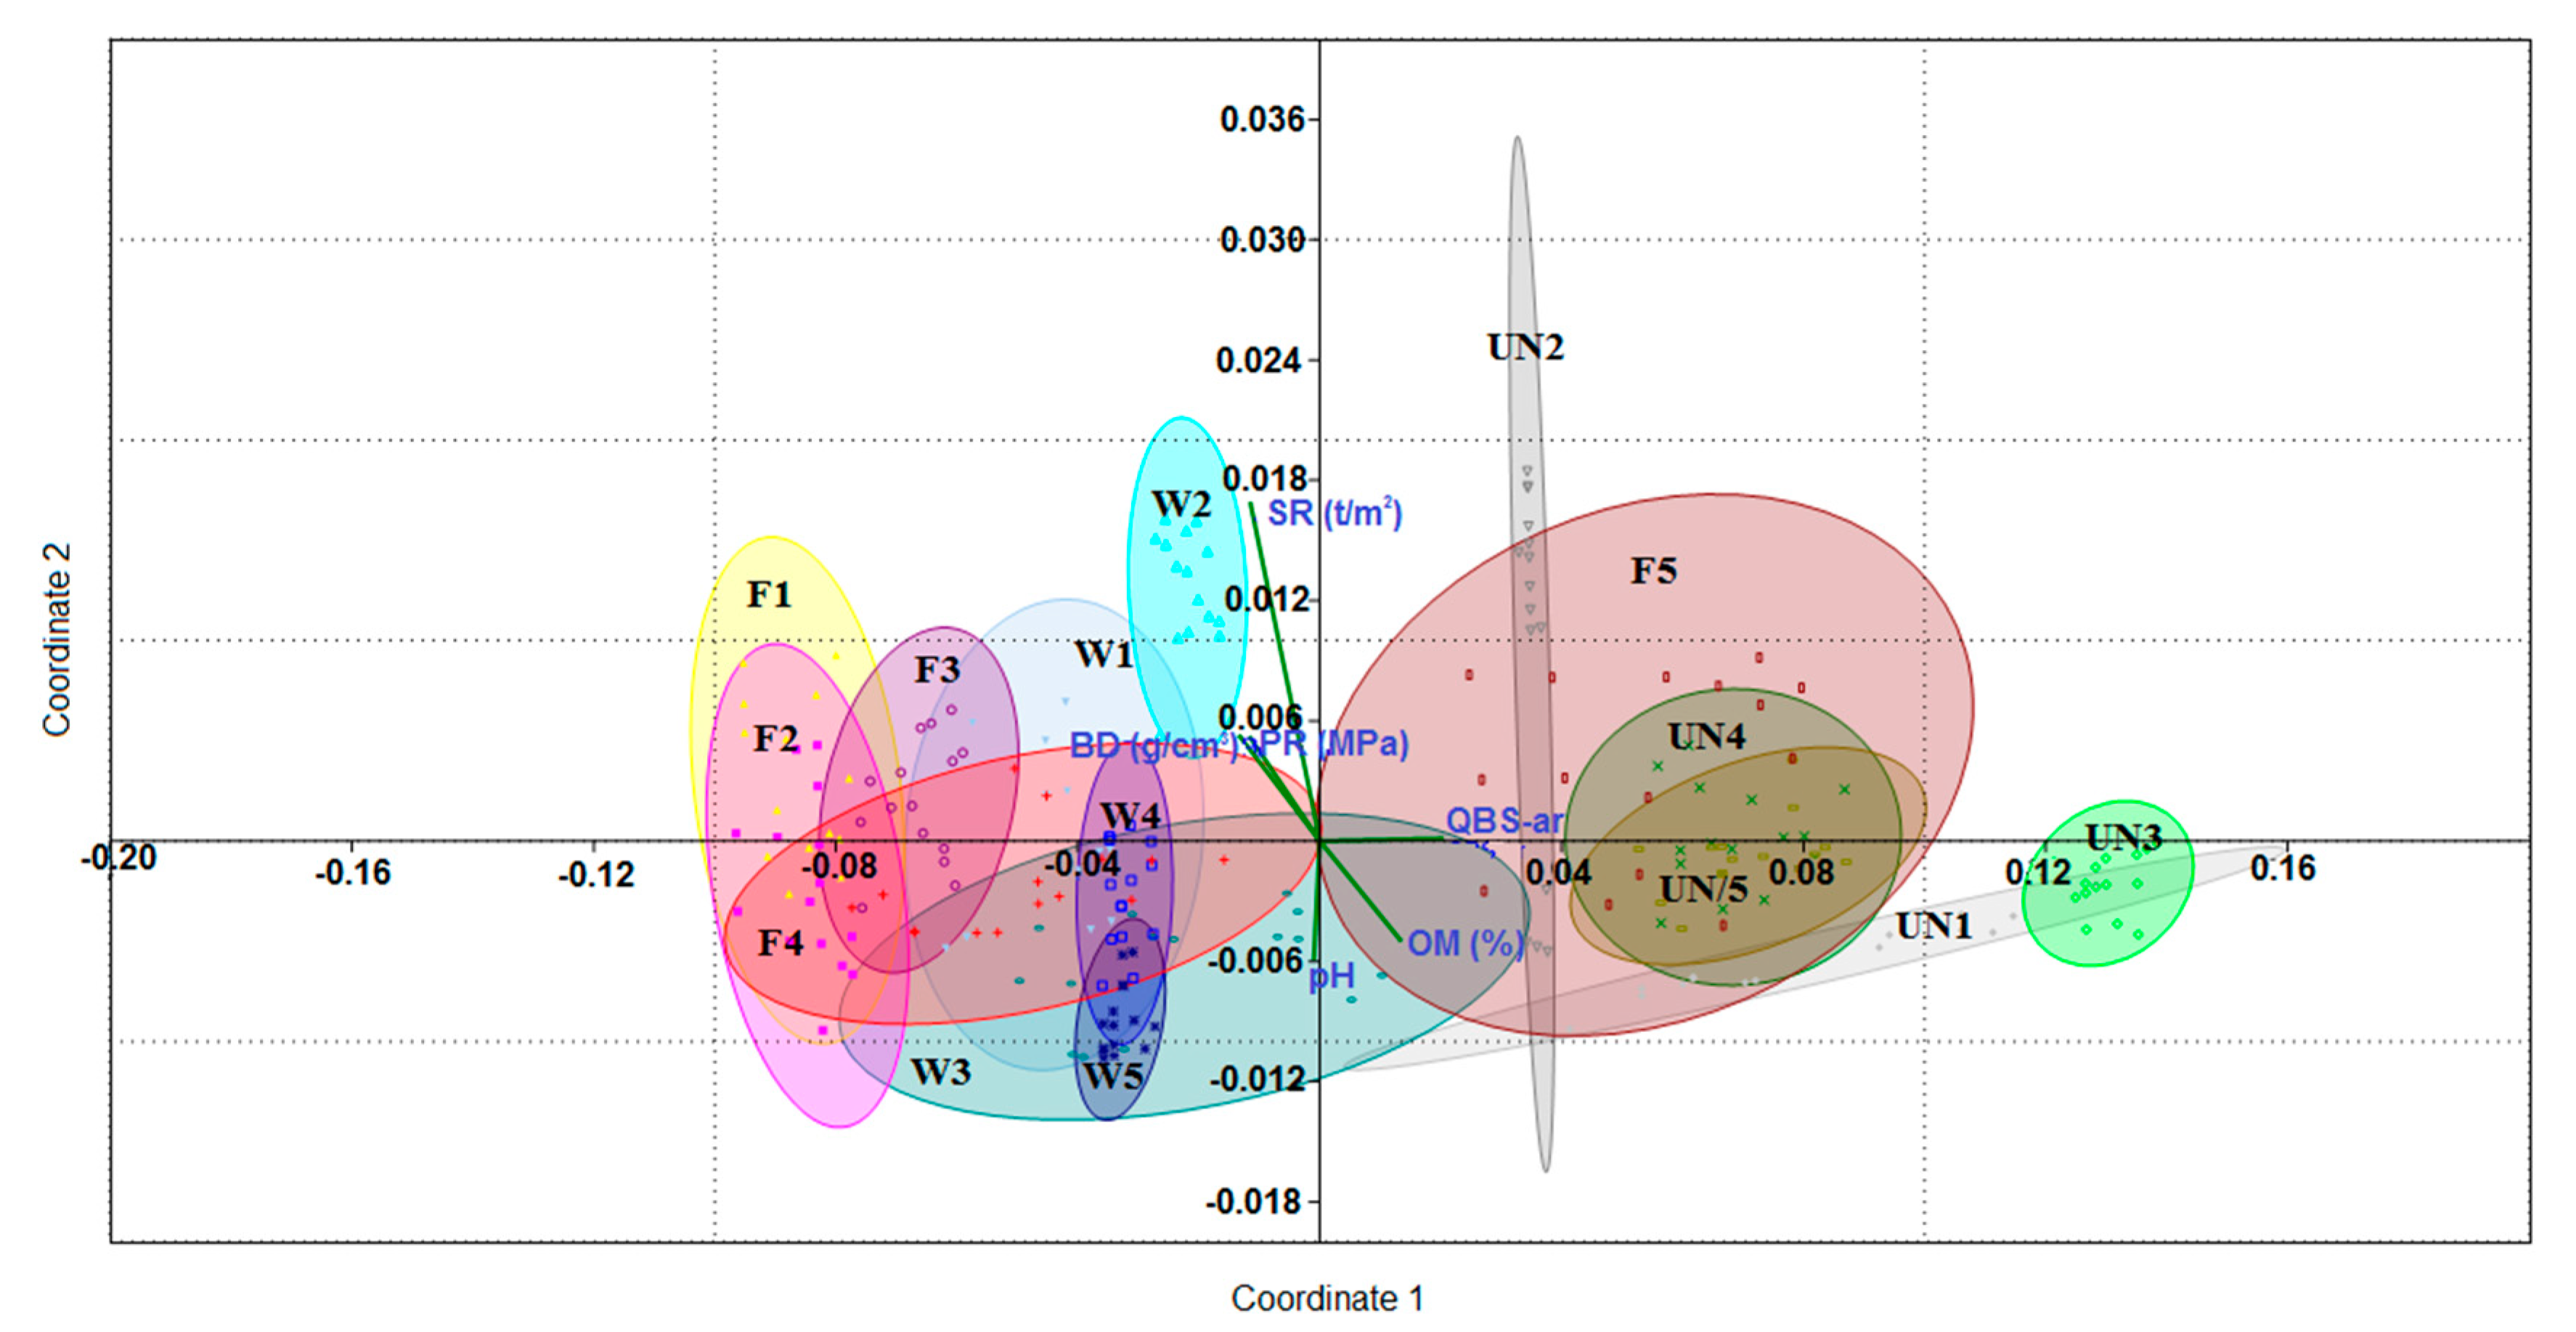
Principal non-metric multidimensional scaling (NMDS) tests produced a two-dimensional ranking (Figure 7) that provided a significantly greater reduction in statistical stress than expected by chance (α = 0.05). When considering BD, PR, SR, OM, pH, and QBS-ar index, the two axes explained 96.2% of the overall variance. These six variables showed the maximum correlation with the ordination axes. The variables BD, PR, SR, and pH illustrated the soil scenario on the weighted scale of axis 1 (Figure 7). The impact arrangement along axis 2 was dominated mainly by QBS-ar index and in part by OM content (Figure 7).
The nMDS for the ten disturbed and five undisturbed scenarios showed a negative relationship between the time after harvesting and the impact levels. Therefore, five years after harvesting disturbed areas showed similar conditions to undisturbed areas. The two technology type scenarios (Figure 7) showed an initial differentiation with lower impact for the winching scenario but starting from the fourth year after coppicing they reached similar impact degrees.
Comparing the results of this work with those shown by Venanzi et al. [2], there are some differences to be attributed mainly to the different soil types and climatic conditions. These differences are reflected in terms of the need for longer recovery times in Mediterranean areas with greater aridity. The phytoclimatic zone reported in Venanzi et al. [2] is warm Castanetum, while in this study the zone is an intermediate Lauretum (according to Pavari phytoclimatic classification [75]). Thus, there seems to be a positive relationship between recovery time and actual or perceived aridity of the forest ecosystem. In Venanzi et al. [2] the recovery of soil impacts caused by coppicing as a management practice (i.e., canopy gap) was almost complete three years after harvesting, while from in this study the same level of recovery took almost five (6–7 years for complete recovery of the QBS-ar index). The recovery from logging disturbance showed a clear positive trend, but in Venanzi et al. [2] 4–5 years post-harvesting it was possible to confirm, statistically, a complete recovery while from this study the soil recovery was expected 8–9 years after coppicing.

5. Conclusions

Part of this applied research has the potential to translate into “forest harvesting best practices” in order to increase the knowledge for a sustainable management of coppice forests in the Mediterranean area, supporting the decision making of forest managers.
As found in other studies, the physical, chemical, and biological soil features were partially disturbed by the act of coppicing for itself, due to the sudden and drastic interruption of canopy cover. Machine traffic compounded such disturbance, through its mechanical action on the soil structure, resulting in a substantial alteration of the physical-mechanical soil components.
Between the two extraction techniques on test, winching caused the least disturbance while forwarding had stronger impacts. That was likely related to the small size of the trees being extracted (which minimized the impact of winching) and to the choice of a heavy forwarder model instead of a lighter one.
However, soil recovery was almost complete five years after harvesting without substantial differences between logging techniques.
Soil recovery after logging showed a statistical positive trend with similar results in the fifth year for both harvesting techniques, although five years after harvesting it was not possible to confirm that recovery was yet complete. However, full recovery is likely to be achieved approximately eight or nine years after harvest, regardless of the logging technique tested.
Similar studies are important for their potential contribution to updating the guidelines, criteria, and indicators for sustainable forest management, as proposed by Forest Europe and Reduced Impact Logging (RIL) in a perspective of SFOs application.

Author Contributions

Conceptualization, R.V., R.P., S.G., and R.S.; methodology, R.V. and R.P.; software, R.V. and R.P.; validation, R.V., R.P., and S.G.; formal analysis, R.V. and R.P.; investigation, R.V. and R.P.; data curation, R.V. and R.P.; writing—original draft preparation, R.V., R.P., S.G., and R.S.; writing—review and editing, R.V., R.P., S.G., and R.S.; supervision, R.V., R.P., S.G., and R.S. All authors read and agreed to the published version of the manuscript.

Funding

This research received no external funding.

Acknowledgments

This work was supported by the Italian Ministry for education, University and Research (MIUR) for financial support (Law 232/2016, Italian University Departments of excellence)—UNITUS-DAFNE WP3.

Conflicts of Interest

The authors declare no conflicts of interest. The funders had no role in the design of the study; in the collection, analyses, or interpretation of data; in the writing of the manuscript; or in the decision to publish the results.

References

  1. Unrau, A.; Becker, G.; Spinelli, R.; Lazdina, D.; Magagnotti, N.; Nicolescu, V.N.; Buckley, P.; Bartlett, D.; Kofman, P.D. (Eds.) Coppice Forests in Europe; Freiburg i. Br.; Albert Ludwig University of Freiburg: Freiburg, Germany, 2018; 392p. [Google Scholar]
  2. Venanzi, R.; Picchio, R.; Grigolato, S.; Latterini, F. Soil and forest regeneration after different extraction methods in coppice forests. For. Ecol. Manag. 2019, 454, 117666. [Google Scholar] [CrossRef]
  3. Szabò, P. Driving forces of stability and change in woodland structure: A case-study from the Czech lowlands. For. Ecol. Manag. 2010, 259, 650–656. [Google Scholar] [CrossRef]
  4. Marchi, E.; Picchio, R.; Mederski, P.S.; Vusić, D.; Perugini, M.; Venanzi, R. Impact of silvicultural treatment and forest operation on soil and regeneration in Mediterranean Turkey oak (Quercus cerris L.) coppice with standards. Ecol. Eng. 2016, 95, 475–484. [Google Scholar] [CrossRef]
  5. Venanzi, R.; Picchio, R.; Piovesan, G. Silvicultural and logging impact on soil characteristics in Chestnut (Castanea sativa Mill.) Mediterranean coppice. Ecol. Eng. 2016, 96, 82–89. [Google Scholar] [CrossRef]
  6. Matula, R.; Šrámek, M.; Kvasnica, J.; Uherková, B.; Slepička, J.; Matoušková, M.; Kutchartt, E.; Svátek, M. Pre-disturbance tree size, sprouting vigour and competition drive the survival and growth of resprouting trees. For. Ecol. Manag. 2019, 446, 71–79. [Google Scholar] [CrossRef]
  7. Müllerová, J.; Hédl, R.; Szabó, P. Coppice abandonment and its implications for species diversity in forest vegetation. For. Ecol. Manag. 2015, 343, 88–100. [Google Scholar] [CrossRef] [Green Version]
  8. Imamura, K.; Managi, S.; Saito, S.; Nakashizuka, T. Abandoned forest ecosystem: Implications for Japan’s Oak Wilt disease. J. For. Econ. 2017, 29, 56–61. [Google Scholar] [CrossRef]
  9. Picchio, R.; Spina, R.; Maesano, M.; Carbone, F.; Lo Monaco, A.; Marchi, E. Stumpage value in the short wood system for the conversion into high forest of a oak coppice. For. Stud. China 2011, 13, 252–262. [Google Scholar] [CrossRef]
  10. Gimmi, U.; Bürgi, M.; Stuber, M. Reconstructing anthropogenic disturbance regimes in forest ecosystems: A case study from the Swiss Rhone valley. Ecosystems 2008, 11, 113–124. [Google Scholar] [CrossRef] [Green Version]
  11. Olajuyigbe, S.; Tobin, B.; Saunders, M.; Nieuwenhuis, M. Forest thinning and soil respiration in a Sitka spruce forest in Ireland. Agr. For. Meteorol. 2012, 157, 86–95. [Google Scholar] [CrossRef]
  12. Picchio, R.; Mercurio, R.; Venanzi, R.; Gratani, L.; Giallonardo, T.; Lo Monaco, A.; Frattaroli, A.R. Strip clear-cutting application and logging typologies for renaturalization of pine afforestation—A case study. Forests 2018, 9, 366. [Google Scholar] [CrossRef] [Green Version]
  13. Klvac, R.; Vrána, P.; Jirousek, R. Possibilities of using the portable falling weight deflectometer to measure the bearing capacity and compaction of forest soils. J. For. Sci. 2010, 56, 130–136. [Google Scholar] [CrossRef] [Green Version]
  14. Korb, J.E.; Fulé, P.Z.; Gideon, B. Different restoration thinning treatments affect level of soil disturbance in ponderosa pine forests of Northern Arizona, USA. Ecol. Restor. 2007, 25, 43–49. [Google Scholar] [CrossRef]
  15. Williamson, J.R.; Neilsen, W.A. The influence of soil and forest site on rate and extent of soil compaction and profile disturbance of skid-trails during ground-based harvesting. Can. J. For. Res. 2000, 30, 1196–1205. [Google Scholar] [CrossRef]
  16. Grigal, D.F. Effects of extensive forest management on soil productivity. For. Ecol. Manag. 2000, 138, 167–185. [Google Scholar] [CrossRef]
  17. Vusić, D.; Šušnjar, M.; Marchi, E.; Spina, R.; Zečić, T.; Picchio, R. Skidding operations in thinning and shelterwood cut of mixed stands—Work productivity, energy inputs and emissions. Ecol. Eng. 2013, 61, 216–223. [Google Scholar] [CrossRef]
  18. Picchio, R.; Pignatti, G.; Marchi, E.; Latterini, F.; Benanchi, M.; Foderi, C.; Venanzi, R.; Verani, S. The application of two approaches using GIS technology implementation in forest road network planning in an Italian mountain setting. Forests 2018, 9, 277. [Google Scholar] [CrossRef] [Green Version]
  19. Spinelli, R.; Lombardini, C.; Marchi, E.; Aminti, G. A low-investment technology for the simplified processing of energy wood from coppice forests. Eur. J. For. Res. 2019, 138, 31–41. [Google Scholar] [CrossRef]
  20. Tolosana, E.; Spinelli, R.; Aminti, G.; Laina, R.; López-Vicens, I. Productivity, efficiency and environmental effects of whole-tree harvesting in Spanish coppice stands using a drive-to-tree disc saw Feller-Buncher. Croat. J. For. Eng. 2018, 39, 163–172. [Google Scholar]
  21. Picchio, R.; Neri, F.; Maesano, M.; Savelli, S.; Sirna, A.; Blasi, S.; Baldini, S.; Marchi, E. Growth effects of thinning damage in a Corsican pine (Pinus laricio Poiret) stand in central Italy. Forest Ecol. Manag. 2011, 262, 237–243. [Google Scholar] [CrossRef]
  22. Laschi, A.; Marchi, E.; González-García, S. Forest operations in coppice: Environmental assessment of two different logging methods. Sci. Total Environ. 2016, 562, 493–503. [Google Scholar] [CrossRef] [PubMed]
  23. Bertolotto, P.; Calienno, L.; Conforti, M.; D’Andrea, E.; Lo Monaco, A.; Magnani, E.; Marinšek, A.; Venanzi, R. Assessing indicators of forest ecosystem health. Ann. Silvi. Res. 2016, 40, 64–69. [Google Scholar]
  24. Picchio, R.; Spina, R.; Calienno, L.; Venanzi, R.; Lo Monaco, A. Forest operations for implementing silvicultural treatments for multiple purposes. Ital. J. Agron. 2016, 11, 156–161. [Google Scholar]
  25. Sohrabi, H.; Jourgholami, M.; Tavankar, F.; Venanzi, R.; Picchio, R. Post-harvest evaluation of soil physical properties and natural regeneration growth in steep-slope terrains. Forests 2019, 10, 1034. [Google Scholar] [CrossRef] [Green Version]
  26. Mederski, P. A comparison of harvesting productivity and costs in thinning operations with and without midfield. For. Ecol. Manag. 2006, 224, 286–296. [Google Scholar] [CrossRef]
  27. Picchio, R.; Latterini, F.; Mederski, P.S.; Venanzi, R.; Karaszewski, Z.; Bembenek, M.; Croce, M. Comparing accuracy of three methods based on the GIS environment for determining winching areas. Electronics 2019, 8, 53. [Google Scholar] [CrossRef] [Green Version]
  28. Cambi, M.; Certini, G.; Fabiano, F.; Foderi, C.; Laschi, A.; Picchio, R. Impact of wheeled and tracked tractors on soil physical properties in a mixed conifer stand. IForest 2016, 9, 89–94. [Google Scholar] [CrossRef] [Green Version]
  29. Picchio, R.; Mederski, P.S.; Tavankar, F. How and how much, do harvesting activities affect forest soil, regeneration and stands? Curr. For. Rep. 2020. [Google Scholar] [CrossRef] [Green Version]
  30. Marchi, E.; Picchio, R.; Spinelli, R.; Verani, S.; Venanzi, R.; Certini, G. Environmental impact assessment of different logging methods in pine forests thinning. Ecol. Eng. 2014, 70, 429–436. [Google Scholar] [CrossRef]
  31. Picchio, R.; Magagnotti, N.; Sirna, A.; Spinelli, R. Improved winching technique to reduce logging damage. Ecol. Eng. 2012, 47, 83–86. [Google Scholar] [CrossRef]
  32. Picchio, R.; Venanzi, R.; Tavankar, F.; Luchenti, I.; Bodaghi, A.I.; Latterini, F.; Nikooy, M.; Di Marzio, N.; Naghdi, R. Changes in soil parameters of forests after windstorms and timber extraction. Eur. J. For. Res. 2019, 138, 875–888. [Google Scholar] [CrossRef]
  33. Proto, A.R.; Macrì, G.; Visser, R.; Harrill, H.; Russo, D.; Zimbalatti, G. A case study on the productivity of forwarder extraction in small-scale Southern Italian forests. Small-Scale For. 2018, 17, 71–87. [Google Scholar] [CrossRef]
  34. Proto, A.R.; Zimbalatti, G. Firewood cable extraction in the southern Mediterranean area of Italy. For. Sci. Techn. 2016, 12, 16–23. [Google Scholar] [CrossRef]
  35. Sánchez-Moreno, S.; Minoshima, H.; Ferris, H.; Jackson, L.E. Linking soil properties and nematode community composition: Effects of soil management on soil food webs. Nematology 2006, 8, 703–715. [Google Scholar]
  36. Spinelli, R.; Pari, L.; Aminti, G.; Magagnotti, N.; Giovannelli, A. Mortality, re-sprouting vigor and physiology of coppice stumps after mechanized cutting. Ann. For. Sci. 2017, 74, 5. [Google Scholar] [CrossRef] [Green Version]
  37. Buckley, G. Ecology and Management of Coppiced Woodlands; Chapman & Hall: London, UK, 1992; 336p. [Google Scholar]
  38. Joys, A.C.; Fuller, R.J.; Dolman, P.M. Influences of deer browsing, coppice history, and standard trees on the growth and development of vegetation structure in coppiced woods in lowland England. For. Ecol. Manag. 2004, 202, 23–37. [Google Scholar] [CrossRef]
  39. Benes, J.; Cizek, O.; Dovala, J.; Konvicka, M. Intensive game keeping, coppicing and butterflies: The story of Milovicky Wood, Czech Republic. For. Ecol. Manag. 2006, 237, 353–365. [Google Scholar] [CrossRef]
  40. Bugalho, M.N.; Caldeira, M.C.; Pereira, J.S.; Aronson, J.; Pausas, J.G. Mediterranean cork oak savannas require human use to sustain biodiversity and ecosystem services. Front. Ecol. Environ. 2011, 9, 278–286. [Google Scholar] [CrossRef] [Green Version]
  41. Hédl, R.; Kopecky´, M.; Komárek, J. Half a century of succession in a temperate oakwood: From species-rich community to mesic forest. Divers. Distrib. 2010, 16, 267–276. [Google Scholar] [CrossRef]
  42. Spitzer, L.; Konvicka, M.; Tropek, R.; Tuf, I.H.; Tufová, J. Does closure of traditionally managed open woodlands threaten epigeic invertebrates? Effects of coppicing and high deer densities. Biol. Conserv. 2008, 141, 827–837. [Google Scholar] [CrossRef]
  43. Vodka, Š.; Cizek, L. The effects of edge-interior and understorey-canopy gradients on the distribution of saproxylic beetles in a temperate lowland forest. For. Ecol. Manag. 2013, 304, 33–41. [Google Scholar] [CrossRef]
  44. Abbas, D.; Di Fulvio, F.; Spinelli, R. European and United States perspectives on forest operations in environmentally sensitive areas. Scand. J. For. Res. 2018, 33, 188–201. [Google Scholar] [CrossRef]
  45. Marchi, E.; Chung, W.; Visser, R.; Abbas, D.; Nordfjell, T.; Mederski, P.S.; McEwan, A.; Brink, M.; Laschi, A. Sustainable Forest Operations (SFO): A new paradigm in a changing world and climate. Sci. Total Environ. 2018, 634, 1385–1397. [Google Scholar] [CrossRef] [Green Version]
  46. Saxton, K.E.; Rawls, W.J.; Romberger, J.S.; Papendick, R.I. Estimating generalized soil-water characteristics from texture. Soil Sci. Soc. Am. J. 1986, 50, 1031–1036. [Google Scholar] [CrossRef]
  47. Corona, P.; Ascoli, D.; Barbati, A.; Bovio, G.; Colangelo, G.; Elia, M.; Garfì, V.; Iovino, F.; Lafortezza, R.; Leone, V.; et al. Integrated forest management to prevent wildfires under Mediterranean environments. Ann. Silvi. Res. 2015, 39, 1–22. [Google Scholar]
  48. Picchio, R.; Neri, F.; Petrini, E.; Verani, S.; Marchi, E.; Certini, G. Machinery-induced soil compaction in thinning two pine stands in central Italy. For. Ecol. Manag. 2012, 285, 38–43. [Google Scholar] [CrossRef]
  49. Gee, G.W.; Bauder, J.W. Particle-size analysis. In Methods of Soil Analysis. Part I. Agronomy Monographs, 9, 2nd ed.; Klute, A., Ed.; ASA and SSSA: Madison, WI, USA, 1986; pp. 383–411. [Google Scholar]
  50. Spinelli, R.; Magagnotti, N.; Aminti, G.; De Francesco, F.; Lombardini, C. The effect of harvesting method on biomass retention and operational efficiency in low-value mountain forests. Eur. J. For. Res. 2016, 135, 755–764. [Google Scholar] [CrossRef]
  51. Rigal, S.; Devictor, V.; Dakos, V. A method for classifying and comparing non-linear trajectories of ecological variables. Ecol. Indic. 2020, 112, 106113. [Google Scholar] [CrossRef]
  52. Picchio, R.; Tavankar, F.; Nikooy, M.; Pignatti, G.; Venanzi, R.; Lo Monaco, A. Morphology, growth and architecture response of beech (Fagus orientalis Lipsky) and maple tree (Acer velutinum Boiss.) seedlings to soil compaction stress caused by mechanized logging operations. Forests 2019, 10, 771. [Google Scholar] [CrossRef] [Green Version]
  53. Picchio, R.; Tavankar, F.; Bonyad, A.; Mederski, P.S.; Venanzi, R.; Nikooy, M. Detailed analysis of residual stand damage due to winching on steep terrains. Small-scale For. 2019, 18, 255–277. [Google Scholar] [CrossRef] [Green Version]
  54. Jourgholami, M.; Majnounian, B.; Abari, M.E. Effects of tree-length timber skidding on soil compaction in the skid trail in Hyrcanian forests. For. Syst. 2014, 23, 288–293. [Google Scholar] [CrossRef] [Green Version]
  55. Spinelli, R.; Magagnotti, N.; Nati, C. Benchmarking the impact of traditional small-scale logging systems used in Mediterranean forestry. For. Ecol. Manag. 2010, 260, 1997–2001. [Google Scholar] [CrossRef]
  56. Spinelli, R.; Lombardini, C.; Magagnotti, N. Salvaging windthrown trees with animal and machine systems in protected areas. Ecol. Eng. 2013, 53, 61–67. [Google Scholar] [CrossRef]
  57. Magagnotti, N.; Picchi, G.; Spinelli, R. A versatile machine system for salvaging small-scale forest windthrow. Biosyst. Eng. 2013, 115, 381–388. [Google Scholar] [CrossRef]
  58. Kleibl, M.; Klvač, R.; Lombardini, C.; Porhaly, J.; Spinelli, R. Soil compaction and recovery after mechanized final felling of Italian coastal pine plantations. Croat. J. For. Eng. 2014, 35, 63–71. [Google Scholar]
  59. Magagnotti, N.; Spinelli, R.; Güldner, O.; Erler, J. Site impact after motor-manual and mechanised thinning in Mediterranean pine plantations. Biosyst. Eng. 2012, 113, 140–147. [Google Scholar] [CrossRef]
  60. Ampoorter, E.; Goris, R.; Cornelis, W.; Verheyen, K. Impact of mechanized logging on compaction status of sandy forest soils. For. Ecol. Manag. 2007, 241, 162–174. [Google Scholar] [CrossRef]
  61. Heilman, P. Root penetration of Douglas-fir seedlings into compacted soil. For. Sci. 1981, 27, 660–666. [Google Scholar]
  62. Cudzik, A.; Brennensthul, M.; Białczyk, W.; Czarnecki, J. Damage to Soil and Residual Trees Caused by Different Logging Systems Applied to Late Thinning. Croat. J. For. Eng. 2017, 38, 83–95. [Google Scholar]
  63. Dudek, T.; Sosnowski, J. Evaluation of the environmental impact of selected timber extraction technologies used in mountain forests. Sylwan 2011, 155, 413–420. [Google Scholar]
  64. Spinelli, R.; Magagnotti, N. Performance and cost of a new mini-forwarder for use in thinning operations. J. For. Res. 2010, 15, 358–364. [Google Scholar] [CrossRef]
  65. Spinelli, R.; Magagnotti, N. The effects of introducing modern technology on the financial, labour and energy performance of forest operations in the Italian Alps. Forest Policy Econ. 2011, 13, 520–524. [Google Scholar] [CrossRef]
  66. Spinelli, R.; Aalmo, G.O.; Magagnotti, N. The effect of a slack-pulling device in reducing operator physiological workload during log winching operations. Ergonomics 2015, 58, 781–790. [Google Scholar] [CrossRef] [PubMed]
  67. Magagnotti, N.; Aalmo, G.O.; Brown, M.; Spinelli, R. A new device for reducing winching cost and worker effort in steep terrain operations. Scand. J. For. Res. 2016, 31, 602–610. [Google Scholar] [CrossRef]
  68. Spinelli, R.; Cacot, E.; Mihelic, M.; Nestorovski, L.; Mederski, P.; Tolosana, E. Techniques and productivity of coppice harvesting operations in Europe: A meta-analysis of available data. Ann. For. Sci. 2016, 73, 1125–1139. [Google Scholar] [CrossRef] [Green Version]
  69. Ferrari, E.; Spinelli, R.; Cavallo, E.; Magagnotti, N. Attitudes towards mechanized Cut-to-Length technology among logging contractors in Northern Italy. Scand. J. For. Res. 2012, 27, 800–806. [Google Scholar] [CrossRef]
  70. Bell, J. Changes in logging injury rates associated with use of feller-bunchers in West Virginia. J. Saf. Res. 2002, 33, 436–471. [Google Scholar] [CrossRef]
  71. Cambi, M.; Hoshika, Y.; Mariotti, B.; Paoletti, E.; Picchio, R.; Venanzi, R.; Marchi, E. Compaction by a forest machine affects soil quality and Quercus robur L. seedling performance in an experimental field. For. Ecol. Manag. 2017, 384, 406–414. [Google Scholar] [CrossRef]
  72. Tavankar, F.; Bonyad, A.E.; Nikooy, M.; Picchio, R.; Venanzi, R.; Calienno, L. Damages to soil and tree species by cable-skidding in caspian forests of Iran. For. Syst. 2017, 26, e009. [Google Scholar] [CrossRef] [Green Version]
  73. Vossbrink, J.; Horn, R. Modern forestry vehicles and their impact on soil physical properties. Eur. J. For. Res. 2004, 123, 259–267. [Google Scholar] [CrossRef]
  74. Picchio, R.; Proto, A.R.; Civitarese, V.; Di Marzio, N.; Latterini, F. Recent contributions of some fields of the electronics in development of forest operations technologies. Electronics 2019, 8, 1465. [Google Scholar] [CrossRef] [Green Version]
  75. Pavari, A. Studio Preliminare Sulla Coltura di Specie Forestali Esotiche in Italia; Parte Generale, Volume I; Annali del Regio Istituto Superiore Forestale Nazionale; Tipografia Ricci: Florence, Italy, 1916; 221p. [Google Scholar]
Figure 1. Graphical interpretation of the non-linear regression analysis for BD in relation to the time (in years) post-harvesting. The polynomial curves are showed with an area describing the ± regression standard estimate error. C/Untrafficked r²adj = 0.438, F (3,176) = 39.685, p < 0.001. W/Trafficked r²adj = 0.615, F (3,176) = 40.408, p < 0.001. F/Trafficked r²adj = 0.623, F (3,176) = 41.686, p < 0.001. W: winching; F: forwarding; C: control.
Sustainability 12 04074 g001
Figure 2. Graphical interpretation of the non-linear regression analysis for PR in relation to the time (in years) post-harvesting. The polynomial curves showed with a halo composed by ± regression standard estimate error. C/Untrafficked r²adj = 0.502, F(3,176) = 30.917, p < 0.001. W/Trafficked r²adj = 0.589, F(3,176) = 43.425, p < 0.001. F/Trafficked r²adj = 0.695, F(3,176) = 68.571, p < 0.001. W: winching; F: forwarding; C: control.
Sustainability 12 04074 g002
Figure 3. Graphical interpretation of the non-linear regression analysis for SR in relation to the time (in years) post-harvesting. The polynomial curves showed with a halo composed by ± regression standard estimate error. W/Trafficked r²adj = 0.508, F(3,176) = 31.638, p < 0.001. F/Trafficked r²adj = 0.437, F(3,176) = 23.995, p < 0.001. W: winching; F: forwarding.
Sustainability 12 04074 g003
Figure 4. Graphical interpretation of the non-linear regression analysis for OM in relation to the time (in years) post-harvesting. The polynomial curves showed with a halo composed by ± regression standard estimate error. C/Untrafficked r²adj = 0.538, F(3,176) = 35.558, p < 0.001. W/Trafficked r²adj = 0.695, F(3,176) = 68.479, p < 0.001. F/Trafficked r²adj = 0.719, F(3,176) = 76.958, p < 0.001. W: winching; F: forwarding; C: control.
Sustainability 12 04074 g004
Figure 5. Graphical interpretation of the factorial ANOVA for pH (point: average value; bar: ±standard deviation). Difference tested between trafficked and untrafficked soil for the two mechanization levels in the five periods observed. W: winching; F: forwarding; C: control.
Sustainability 12 04074 g005
Figure 6. Graphical interpretation of the non-linear regression analysis for QBS-ar index percentage of impact (referred to the untrafficked soil) in relation to the time (in years) post-harvesting. The polynomial curves showed with a halo composed by ± regression standard estimate error. C/Untrafficked r²adj = 0.882, F(3,176) = 225.15, p < 0.001. W/Trafficked r²adj = 0.947, F(3,176) = 533.85, p < 0.001. W: winching; F: forwarding.
Sustainability 12 04074 g006
Figure 7. Non-metric multidimensional scaling (NMDS) analysis of the main indexes and indicators of the logging impact on soil (BD bulk density; PR: penetration resistance; SR: shear resistance; OM: organic matter content; QBS-ar: QBS-ar index). Difference tested between the three areas and the five time periods observed (UN: untrafficked soil; W: trafficked soil by winching; F: trafficked soil by forwarding; 1-5: years after coppicing).
Sustainability 12 04074 g007
Table 1. Pre-harvest stand characteristics for winching area (W), forwarding area (F), and control (C).
AreaShootsStandardsShootsStandardsShootsStandardsDensity *
(Trees/ha)
Basal Area
(m2/ha)
Above-
Ground Biomass Stock
Above-
Ground Biomass Harvested
Age
(Years)
DBH *
(cm)
Height *
(m)
(m3/ha)(m3/ha)
W365214.6 ± 2.126.0 ± 1.410.5 ± 3.213.8 ± 1.21168 ± 7524.1132.9109.5
F345414.1 ± 5.228.1 ± 4.110.9 ± 1.214.2 ± 2.31178 ± 4724.6136.4112.8
C204512.8 ± 1.522.3 ± 7.210.1 ± 2.713.1 ± 5.21188 ± 6623.7121.9-
* (average ± SD); W = Winch; F = Forwarder; C = Control.
Table 2. Soil area impacted by bunching and extraction activities (t-test results; average ± SD). W: winching; F: forwarding.
Areap-ValueTrafficked SoilUntrafficked Soil
W<0.0521.2 ± 4.1% a78.8%
F31.7 ± 2.9% b68.3%
Note: Different letters after means within each treatment indicate significant differences by Tukey test (p < 0.05).
Table 3. Results of the ANOVA and Tukey test for Bulk Density (average ± SD), difference tested between trafficked, untrafficked, and control soil for the two mechanization levels (data showed in columns). Results of the t-test for BD, difference tested between two time periods (data showed in rows). W: winching; F: forwarding; C: control.
AreaSoil ConditionBulk Density (g/cm3)p-Value
1 Year5 Years
WUntrafficked1.07 ± 0.07 a0.97 ± 0.14 a<0.05
Trafficked1.15 ± 0.12 b0.95 ± 0.11 a<0.05
FUntrafficked0.89 ± 0.15 c0.79 ± 0.09 b<0.05
Trafficked1.19 ± 0.29 d0.98 ± 0.03 a<0.05
CControl1.00 ± 0.17 a,c1.00 ± 0.17 a>0.05
p-value<0.05<0.05
Note: Different letters after means within each treatment indicate significant differences by Tukey test (p < 0.05).
Table 4. Results of the non-linear regression analysis for bulk density (BD) (dependent variable, g cm3) in relation to the time (in years) post-harvesting. W: winching; F: forwarding; C: control.
Area/Soil ConditionRegressionBetaBeta Std. Err.BB Std. Err.tp-Level
C/UntraffickedIntercept0.9760.01283.162<0.001
Years4.3950.4880.2190.0249.007<0.001
Years2−9.7561.265−0.0950.012−7.714<0.001
Years35.3200.8380.0100.0026.347<0.001
W/TraffickedIntercept0.9700.02244.779<0.001
Years5.2510.5730.4110.0459.164<0.001
Years2−11.8951.485−0.1820.023−8.010<0.001
Years36.5860.9840.0200.0036.691<0.001
F/TraffickedIntercept0.9940.02539.096<0.001
Years4.9550.5670.4600.0538.735<0.001
Years2−10.1931.471−0.1850.027−6.932<0.001
Years35.2130.9750.0190.0045.349<0.001
Table 5. Results of the ANOVA (average ± SD) and Tukey test for penetration resistance (PR) data. Difference tested between trafficked, untrafficked, and control soil for the two mechanization levels (data showed in columns). Results of the t-test for PR, difference tested among two time periods (data showed in rows). W: winching; F: forwarding; C: control.
AreaSoil ConditionPenetration Resistance (MPa)p-Value
1 Year5 Years
WUntrafficked0.59 ± 0.07 a0.45 ± 0.05 a<0.05
Trafficked1.01 ± 0.12 b0.44 ± 0.10 a<0.05
FUntrafficked0.64 ± 0.03 a,c0.46 ± 0.08 a<0.05
Trafficked1.18 ± 0.07 d0.59 ± 0.02 b<0.05
CControl0.49 ± 0.09 a0.49 ± 0.09 a>0.05
p-value<0.05<0.05
Note: Different letters after means within each treatment indicate significant differences by Tukey test (p < 0.05).
Table 6. Results of the non-linear regression analysis for penetration resistance (PR) (dependent variable, MPa) in relation to the time (in years) post-harvesting. W: winching; F: forwarding; C: control.
Area/Soil ConditionRegressionBetaBeta Std. Err.BB Std. Err.Tp-Level
C/UntraffickedIntercept0.4860.01826.880<0.001
Years2.9780.5960.1760.0355.001<0.001
Years2−6.7311.542−0.0760.018−4.366<0.001
Years33.3351.0210.0080.0023.266<0.01
W/TraffickedIntercept0.5040.04311.610<0.001
Years4.4330.5420.6900.0848.187<0.001
Years2−9.5991.402−0.2870.042−6.849<0.001
Years34.9610.9280.0290.0065.344<0.001
F/TraffickedIntercept0.4870.0578.628<0.001
Years4.8270.4661.1360.11010.354<0.001
Years2−9.8641.207−0.4460.055−8.173<0.001
Years34.8860.7990.0440.0076.112<0.001
Table 7. Results of the ANOVA (average ± SD) and Tukey test for shear resistance (SR) data. Difference tested between trafficked, untrafficked, and control soil for the two mechanization levels (data showed in columns). Results of the t-test for SR, difference tested among two time periods (data showed in rows). W: winching; F: forwarding; C: control.
AreaSoil ConditionShear Resistance (t/m2)p-Value
1 Year5 Years
WUntrafficked4.53 ± 0.38 a5.16 ± 1.36 a<0.05
Trafficked11.42 ± 1.20 b6.91 ± 2.57 b<0.05
FUntrafficked4.29 ± 0.91 c4.51 ± 2.94 a,c<0.05
Trafficked12.67 ± 2.57 d11.00 ± 3.76 d<0.05
CControl7.04 ± 2.68 e7.04 ± 2.68 b>0.05
p-value<0.05<0.05
Note: Different letters after means within each treatment indicate significant differences by Tukey test (p < 0.05).
Table 8. Results of the non-linear regression analysis for shear resistance (SR) (dependent variable, t/m2) in relation to the time (in years) post-harvesting. W: winching; F: forwarding; C: control.
Area/Soil ConditionRegressionBetaBeta Std. Err.BB Std. Err.tp-Level
C/UntraffickedIntercept8.3051.0946.180<0.001
Years1.1950.8453.0052.1261.414>0.05
Years2−2.4452.189−1.1801.056−1.117>0.05
Years31.2961.4500.1240.1390.894>0.05
W/TraffickedIntercept8.3050.8119.239<0.001
Years4.4250.59211.7791.5767.474<0.001
Years2−9.6551.533−4.9340.783−6.300<0.001
Years35.1021.0150.5170.1035.027<0.001
F/TraffickedIntercept8.3050.66012.588<0.001
Years4.4970.6349.0961.2827.098<0.001
Years2−9.0161.640−3.5010.637−5.498<0.001
Years34.6841.0860.3610.0844.313<0.001
Table 9. Results of the ANOVA and Tukey test for organic matter content (OM) (average ± SD). Difference tested between trafficked, untrafficked, and control soil for the two mechanization levels (data showed in columns). Results of the t-test for OM, difference tested among two time periods (data showed in rows). W: winching; F: forwarding; C: control.
AreaSoil ConditionOrganic Matter (%)p-Value
1 Year5 Years
WUntrafficked15.6 ± 0.019 a18.4 ± 0.001 a<0.05
Trafficked12.4 ± 0.054 b13.9 ± 0.005 b<0.05
FUntrafficked9.5 ± 0.004 c16.7 ± 0.002 c<0.05
Trafficked7.7 ± 0.002 d13.3 ± 0.004 b<0.05
CControl14.2 ± 0.029 e14.2 ± 0.029 a,c>0.05
p-value<0.05<0.05
Note: Different letters after means within each treatment indicate significant differences by Tukey test (p < 0.05).
Table 10. Results of the non-linear regression analysis for Organic Matter content (dependent variable, %) in relation to the time (in years) post-harvesting. W: winching; F: forwarding; C: control.
Area/Soil ConditionRegressionBetaBeta Std. Err.BB Std. Err.tp-Level
C/UntraffickedInterceptv0.1790.00536.612<0.001
Years−3.6280.574−0.0600.010−6.324<0.001
Years25.9151.4850.0190.0053.983<0.001
Years3−2.2380.983−0.0010.001−2.276<0.05
W/TraffickedIntercept0.1780.00628.953<0.001
Years−4.8400.466−0.1240.012−10.377<0.001
Years28.4951.2080.0420.0067.036<0.001
Years3−3.8810.800−0.0040.001−4.853<0.001
F/TraffickedIntercept0.1640.00722.798<0.001
Years−2.9120.447−0.0910.014−6.510<0.001
Years22.6601.1580.0160.0072.297<0.05
Years30.2230.7670.0010.0010.291>0.05
Table 11. Results of the ANOVA and Tukey test for pH (average ± SD). Difference tested between trafficked, untrafficked, and control soil for the two mechanization levels (data showed in columns). Results of the t-test for pH, difference tested between two time periods (data showed in rows). W: winching; F: forwarding; C: control.
AreaSoil ConditionpHp-Value
1 Year5 Years
WUntrafficked6.8 ± 0.02 a6.7 ± 0.05>0.05
Trafficked6.7 ± 0.12 a,b6.8 ± 0.105>0.05
FUntrafficked6.5 ± 0.45 b6.8 ± 0.05>0.05
Trafficked7.0 ± 0.26 a6.8 ± 0.01>0.05
CControl6.7 ± 0.43 a,b6.7 ± 0.43>0.05
p-value<0.05>0.05
Note: Different letters after means within each treatment indicate significant differences by Tukey test (p < 0.05).
Table 12. Results of the factorial ANOVA for pH. Difference tested between trafficked and untrafficked soil for the two mechanization levels in the five periods observed. W: winching; F: forwarding.
VariablesSum of SquareDegree of FreedomMean of SquareFp-Value
Year4.7350.9537.8<0.001
Untrafficked/W and F: Trafficked soil0.420.28<0.001
Year X Untrafficked/Wand F: Trafficked soil5.25100.5220.9<0.001
Error6.312520.03
Table 13. Results of the Kruskall–Wallis and Duncan test for QBS-ar index. Difference tested between trafficked, untrafficked, and control soil for the two mechanization levels (data showed in columns). Results of the Kolmogorov–Smirnov test for QBS-ar. Difference tested among two time periods (data showed in rows). W: winching; F: forwarding; C: control.
AreaSoil ConditionQBS-arp-Value
1 Year5 Years
WUntrafficked201 a197 a>0.05
Trafficked106 b110 b>0.05
FUntrafficked136 c181 a,c<0.05
Trafficked81 d173 c<0.05
CControl254 e254 d>0.05
p-value<0.05<0.05
Note: Different letters after means within each treatment indicate significant differences by Tukey test (p < 0.05).
Table 14. Results of the non-linear regression analysis for QBS-ar index (dependent variable, expressed as the percentage of impact referred to the untrafficked soil) in relation to the time (in years) post-harvesting. W: winching; F: forwarding.
Area/Soil ConditionRegressionBetaBeta Std. Err.BB Std. Err.Tp-Level
W/TraffickedIntercept4.4510.3860.4340.03811.534<0.001
Years−6.4650.946−0.1490.022−6.836<0.001
Years22.8160.5960.0140.0034.725<0.001
Years34.4510.3860.4340.03811.534<0.001
F/TraffickedIntercept5.8420.2590.6700.03022.530<0.001
Years−9.4230.635−0.2560.017−14.829<0.001
Years24.3040.4010.0260.00210.747<0.001
Years35.8420.2590.6700.03022.530<0.001

