Article

Management Strategies for Wood Fuel Harvesting—Trade-Offs with Biodiversity and Forest Ecosystem Services

1
Department of Forest Resource Management, Swedish University of Agricultural Sciences, 901 83 Umeå, Sweden
2
Department of Forest Biomaterials and Technology, Swedish University of Agricultural Sciences, 901 83 Umeå, Sweden
*
Author to whom correspondence should be addressed.
Sustainability 2020, 12(10), 4089; https://0-doi-org.brum.beds.ac.uk/10.3390/su12104089
Submission received: 21 April 2020 / Revised: 13 May 2020 / Accepted: 14 May 2020 / Published: 16 May 2020
(This article belongs to the Special Issue Integrated Sustainability Assessment of Forest Bioenergy Options)

Abstract

:
Bioenergy is expected to contribute to mitigating climate change. One major source for bioenergy is woody biomass from forests, including logging residues, stumps, and whole trees from young dense stands. However, at increased extraction rates of woody biomass, the forest ecosystem, its biodiversity, and its ability to contribute to fundamental ecosystem services will be affected. We used simulation and optimization techniques to assess the impact of different management strategies on the supply of bioenergy and the trade-offs between wood fuel harvesting, biodiversity, and three other ecosystem services—reindeer husbandry, carbon storage, and recreation. The projections covered 100 years and a forest area of 3 million ha in northern Sweden. We found that the development of novel and cost-effective management systems for biomass outtake from young dense stands may provide options for a significant supply of bioenergy to the emerging bioeconomy, while at the same time securing biodiversity and important ecosystem values in future stand developments. In addition, there is potential to increase the extraction of harvest residues and stumps while simultaneously improving conditions for biodiversity and the amount of carbon stored in forest ecosystems compared to current levels. However, the projected continuing trend of increased forest density (in terms of basal area) has a negative impact on the potential for reindeer husbandry and recreation, which calls for researching new management strategies on landscape levels.

1. Introduction

There are high expectations that bioenergy will contribute to mitigating climate change [1,2]. Today, woody biofuels account for about half of the EU’s total renewable energy consumption, and the demand for bioenergy will most likely increase [3] and references therein. Sweden is one of the main wood producers within the EU and is considered to be an important source for providing forest residues to the European bioenergy market [3]. In addition, the Swedish government adopted a climate goal of net zero emissions of greenhouse gases by 2045, and negative emissions thereafter [4]. The forest is expected to contribute to reaching the goal, inter alia by supplying more bioenergy [5]. It is therefore anticipated that Sweden’s woody biofuel demand will increase considerably, with an additional demand for forest-based feedstock in the emerging chemical-, petrochemical-, and energy industries of about 40–55 TWh in 2030 and 60–70 TWh in 2050 [6]. For comparison, the total energy supply in Sweden amounted to 565 TWh in 2017, of which 143 TWh consisted of biofuels [7]. Sweden and Finland are the two countries within Europe that utilize the largest volumes of woody biofuels, and as the demand for bioenergy increases it is expected that many other countries will follow suit [8].
There are two broad categories for woody biofuels: primary sources, such as logging residues, stumps, and low-quality logs, and secondary sources, i.e., by-products from the forest industries such as bark, saw dust, and black liqueur. Secondary sources are already fully utilized in Sweden [9]. Thus, an increase in the supply of woody biomass can only be fulfilled by increasing the extraction rates of primary sources, or by rising imports. The technical harvesting potential of primary woody biofuels in Sweden is estimated to be 60–73 TWh per year [9,10]. In 2018 the total supply of primary forest fuels in Sweden was ca 23 TWh [11], i.e., considerably below the technical harvesting potential.
Currently, logging residue extraction, i.e., the harvest of tops and branches left during final felling, occurs on less than 20% of the harvested area in northern Sweden, and about 60% in southern Sweden. Stump harvest occurs to a limited extent today, but is expected to increase to about 5%–10% of the annual clear-felled area in the coming years [12]. Similarly, logging residues constitute the main primary source of woody biofuels in most countries, but in the near future stumps and roundwood may play a more prominent role [8]. Biofuel harvest from early thinnings in dense young forests are currently done to insignificant levels, but will increase, as for stumps, if prize levels rise [13]. Therefore, there is considerable potential for increased extraction rates of primary woody biofuels, especially in northern Sweden, where current extraction rates are relatively low due to longer transport distances and lower harvestable volume per hectare compared to southern Sweden [12]. The situation is similar in other European countries, with large un-used potentials for woody biomass for energy use [8,14,15].
However, at increased extraction rates of woody biomass, the forest ecosystem, its biodiversity, and its ability to contribute to fundamental ecosystem services will be affected, due to, e.g., increased disturbance and the outtake of nutrients. A key question is therefore how much woody biomass forest ecosystems can provide in a sustainable way and what the trade-offs are between wood fuel harvesting, biodiversity, and other ecosystem services. Research on the environmental and biodiversity impacts of woody biomass extraction from forests has grown rapidly in recent years. Based on a literature review and expert assessment, de Jong et al. [16] estimated that the extraction of logging residues in Sweden can be increased 2.5 times from current levels, and still be sustainable in terms of impacts on biodiversity and environmental objectives. Another recent review pointed out that residue extraction clearly has negative impacts on soil quality, productivity, water quality, and biodiversity, but that the effects are small in comparison to conventional forestry itself [17]. However, existing studies often focus on the stand-scale and short-term impacts, focus on just one or a few ecosystem services or biodiversity aspects at a time, or do not include management options such as biofuel harvest from early thinnings [18,19,20,21]. As a result, there is a need to investigate the implications of woody biomass extraction on biodiversity and ecosystem services at landscape level and in the long-term [17]. To this end, simulation studies play an important role for predicting the long-term and landscape level effects of forest management on biofuel extraction potential, ecosystem services, and biodiversity. Thus, they enable the analyses of long-term effects before they are observable in the field. Such simulation studies, based on forest decision support systems using growth and yield models, can be done at different spatial scales and allow for the analysis of the impact of different management strategies on the availability of logging residues and trade-offs with ecosystem services and biodiversity. Further, optimization approaches allow for the selection of combinations of management strategies that allow for high woody biomass extraction potentials without compromising biodiversity and ecosystem services. There is a large number of long-term simulation and optimization studies using forest decision support systems and focusing on forest ecosystem services and biodiversity, but the focus is usually on stemwood production and not on harvest residues [22,23,24,25]. In this paper, we use long-term simulations of future forest development for different management and biofuel extraction strategies, combined with an optimization approach building on linear programming (LP) and goal programming (GP) to analyze how much woody biomass forest ecosystems can provide in a sustainable way.
The aim of this paper is to:
(1)
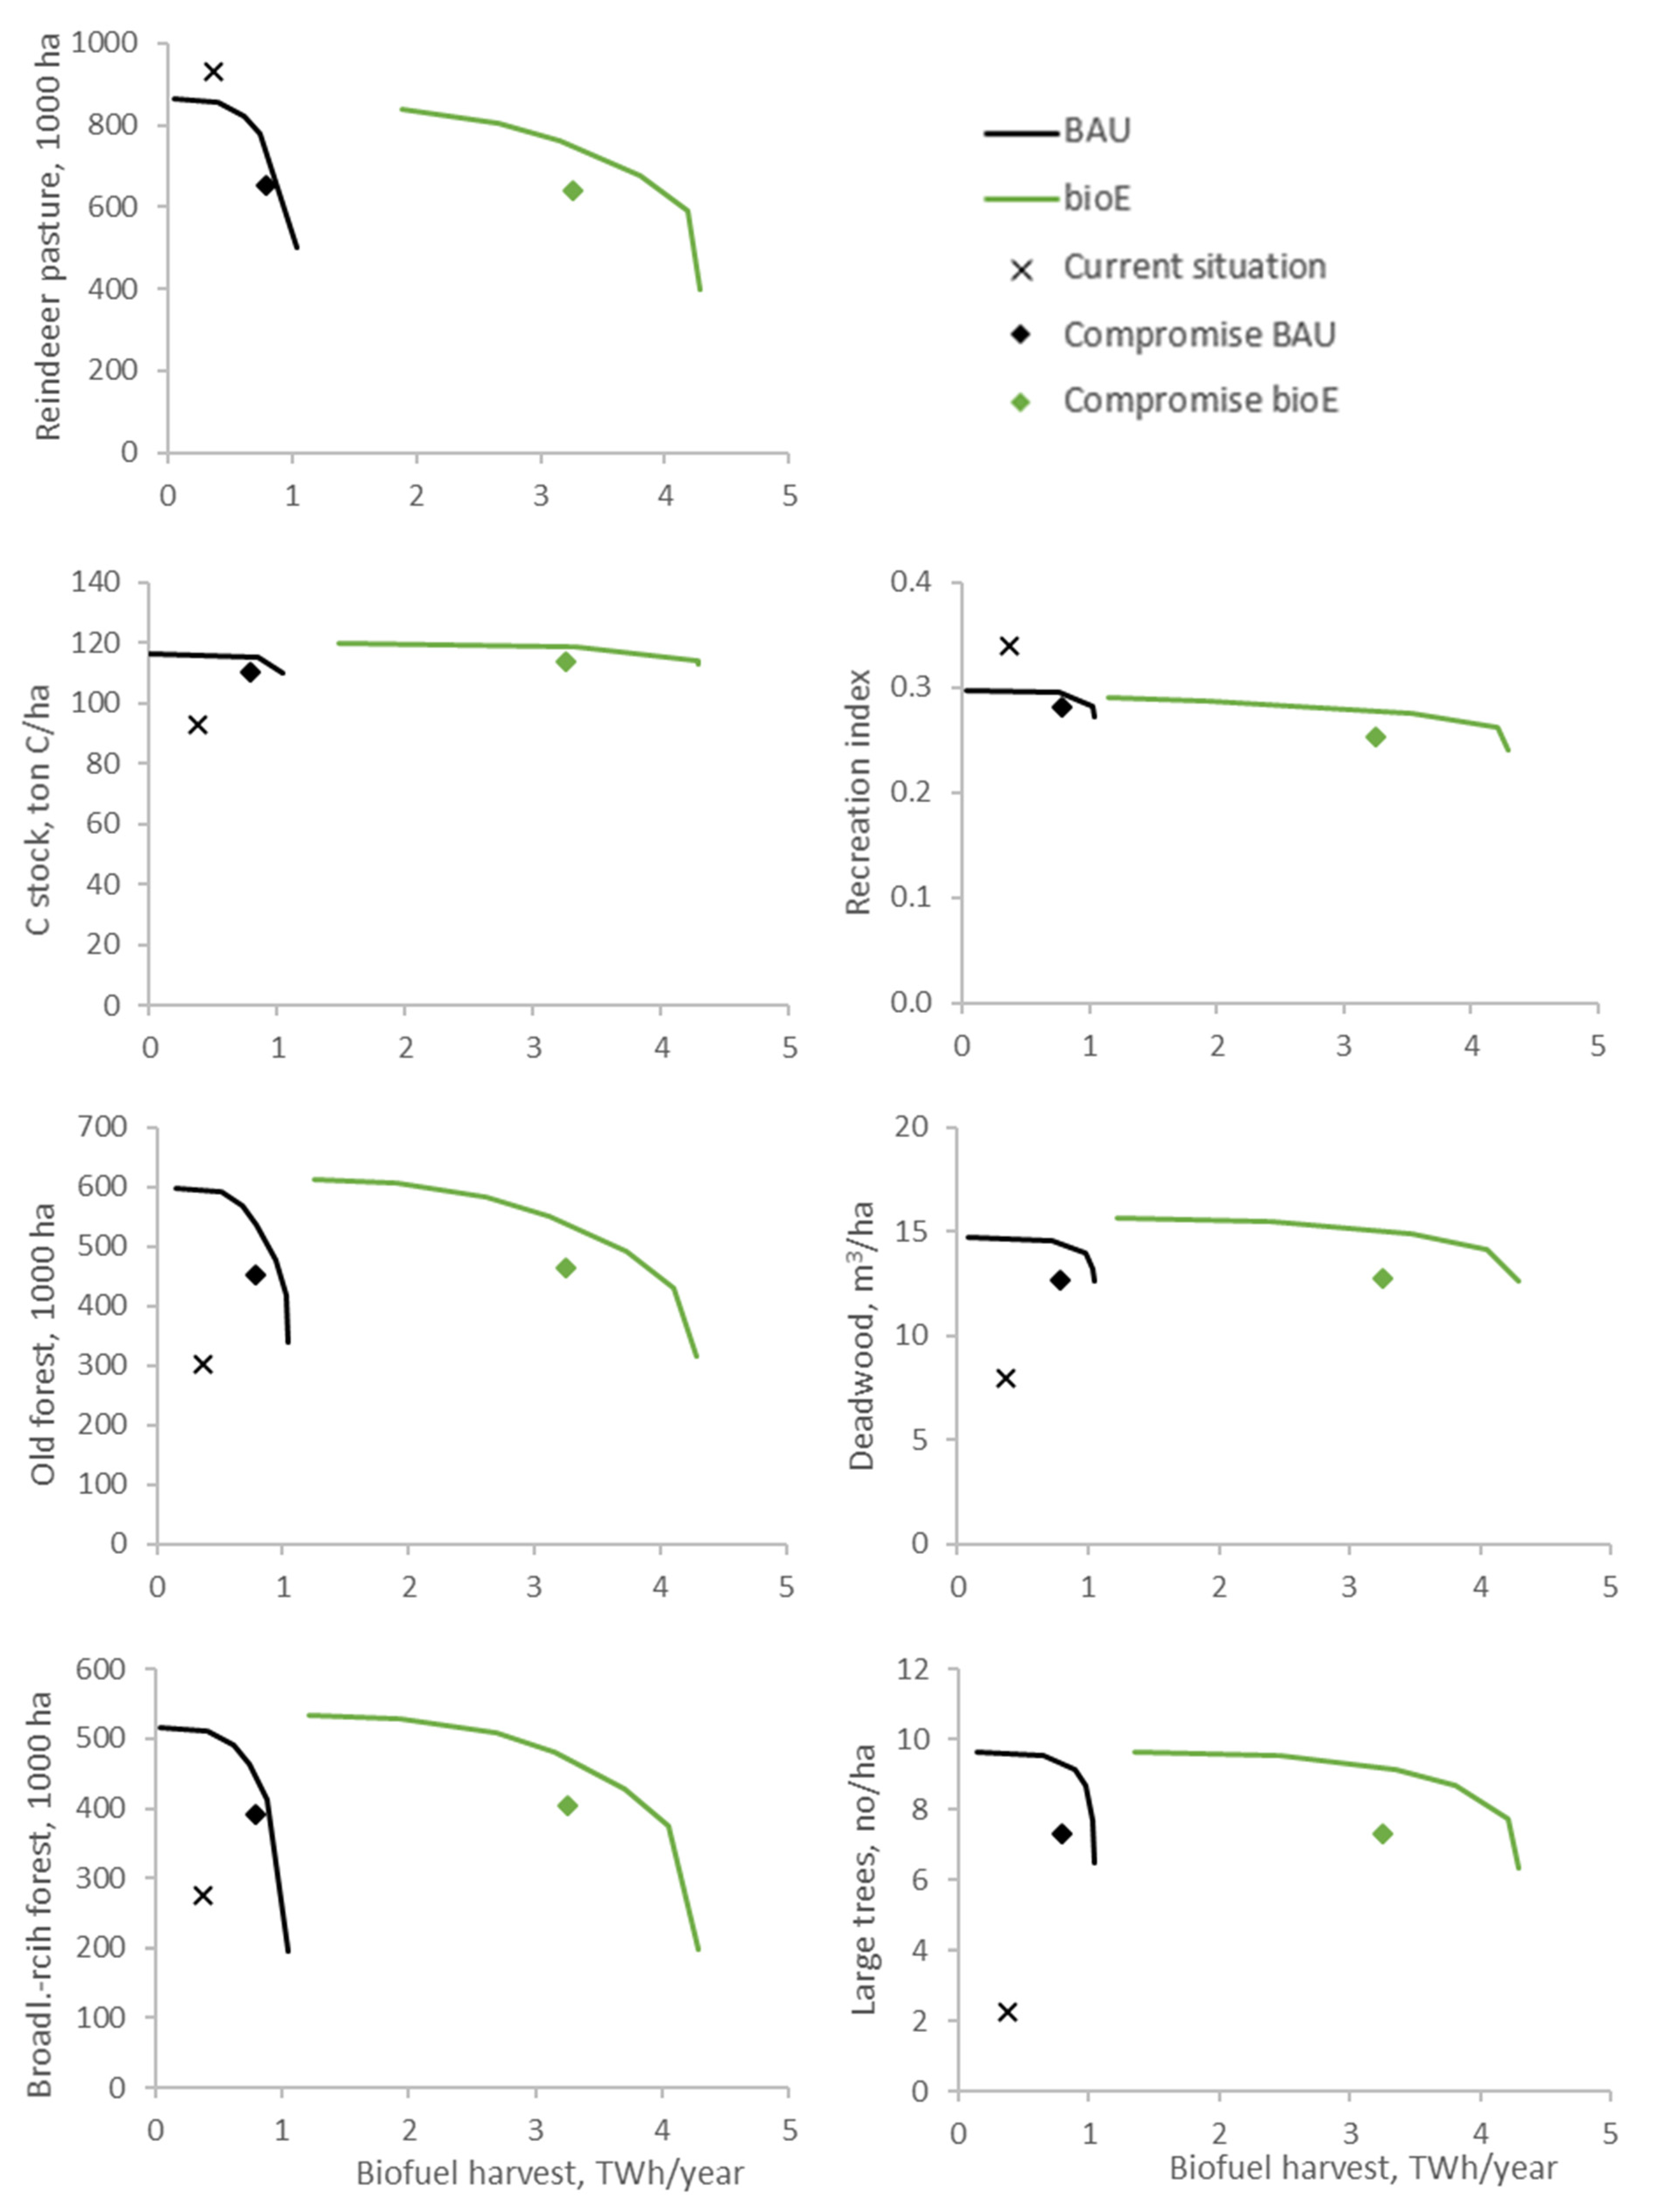
Assess the long-term trade-offs between biofuel extraction, biodiversity, and three core forest ecosystem services: carbon sequestration, recreation, and reindeer husbandry;
(2)
Identify a compromise solution for attaining the largest possible harvest levels of wood fuels combined with the least negative impact on other ecosystem services and biodiversity.
The analysis is done using the county of Västerbotten in northern Sweden, with more than 3 million ha productive forest1 (>10% of the total Swedish forest area; productive forests are forests with a mean annual increment > 1 m3/ha) as the case study area. Västerbotten county represents the forest conditions in northern Sweden, where only a small proportion of the available primary woody biofuels is utilized currently. We use an advanced forest decision support system and assess the trade-offs between biofuel extraction and other ecosystem services and biodiversity under two different biofuel extraction settings: extracting only logging residues from final fellings, and more intensive extraction practices additionally, including logging residues from thinnings, stumps from final fellings, and whole-tree extraction from dense young stands. All analysis is done with the assumption that the harvest of timber volume and pulpwood volume should be in line with the potential sustainable harvest levels based on projections done in the latest national scenario analysis [26].

2. Materials and Methods

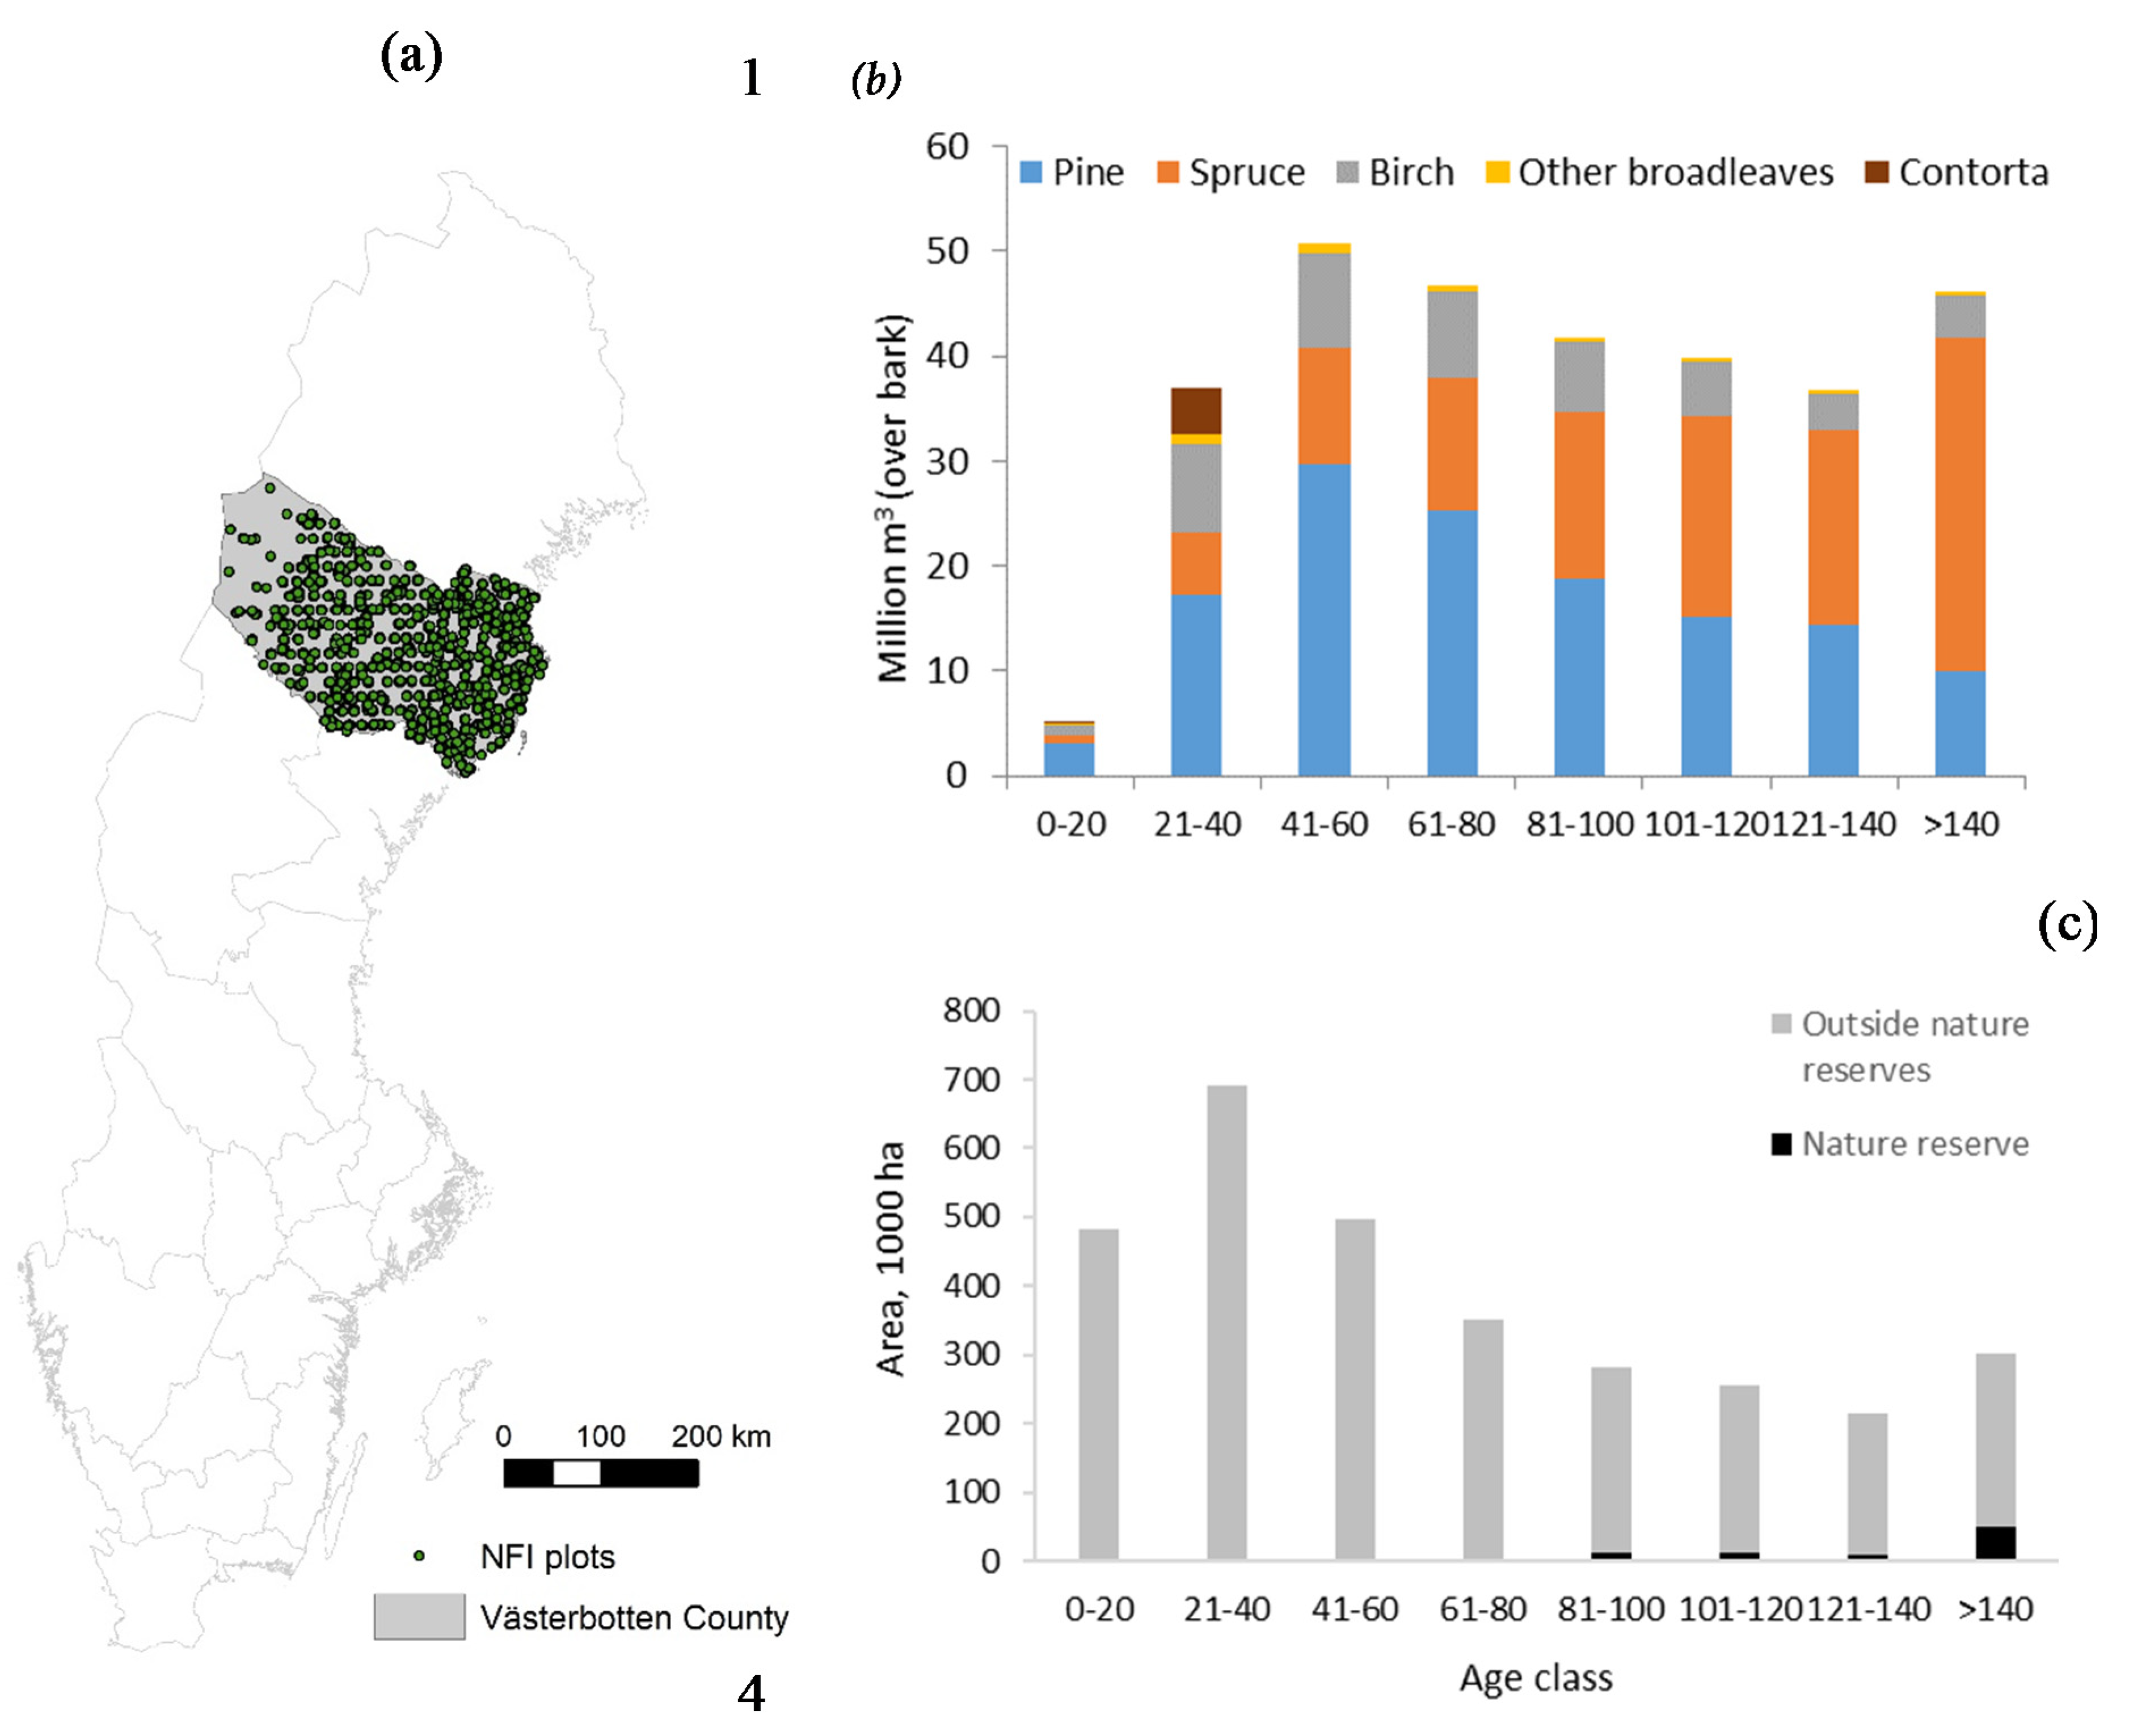
2.1. Case Study Area

The current forest conditions in the case study area were represented by a total of 2738 national forest inventory (NFI) plots, measured between the years 2008 and 2012. The NFI is an annual survey of all forest land in Sweden, initiated in 1923, where circular plots with a radius of 7 or 10 m placed along borders of squared tracts distributed in a systematic cluster design are inventoried [27]. Each plot represents a forest area of up to 1800 ha. Of the total productive forest area in Västerbotten, 3.0% is located in nature reserves, 7.5% in voluntary set-asides, and 6.7% in retention patches (based on the latest national forest impact analysis [26]). The mean age of the forest is 68 years, with almost 40% of the forest being younger than 40 years. Forests in nature reserves are primarily older than 80 years (Figure 1). The mean standing volume is 100 m3/ha, and the main species are Scots pine (Pinus sylvestris, 43%), Norway spruce (Picea abies, 38%), and birch (Betula spp., 16%). The remaining volume is divided almost equally between other broadleaves (1.4%) and lodgepole pine (Pinus contorta, 1.5%).

2.2. Ecosystem Services

We followed the ecosystem service classification of the Millenium Ecosystem Assessment [28], and in addition to woody biofuel extraction we included one provisioning service (reindeer husbandry), one cultural service (recreation), and one regulating service (carbon sequestration). We also included biodiversity, which can be regarded as a cultural service or supporting service but also as a foundation for all other ecosystem services, i.e., as a separate quality [29] (Table 1).
Reindeer husbandry is an important industry for the Sami people in northern Sweden, which justifies a consequence analysis of increased levels of woody biofuel harvesting. As an indicator for reindeer husbandry, we used the forest area that has the potential to support the growth of ground lichen based on [30]. Ground lichen, which is abundant especially in old, open pine forest, is an important food source for reindeer during autumn and winter, and has declined substantially due to modern forest practices [31].
Recreational activities in forests, including walking, jogging, berry and mushroom picking, as well as hunting, are very common both in Sweden and other boreal countries, and the importance and use of forests for recreational activities has been frequently recognized [32,33]. As indicator for recreation we used an index between 0 and 1 describing a plot’s suitability for recreation, based on a set of forest variables such as average height, trees/ha, and tree species distribution [34].
Carbon storage in forests contributes to the mitigation of climate change. In this study, carbon storage was calculated as the total forest carbon stock, including carbon in above- and belowground tree biomass and in the forest soil. Soil carbon storage was based on the Q-model, which is implemented in the Heureka system, and predicts the amount of carbon and nitrogen present in the litter and humus layer at a given time period [35].
We had no direct measure of biodiversity and therefore used proxies that are known to correlate with high species richness and/or the occurrence of rare species, and that are used as indicators to monitor the Swedish environmental quality objective Sustainable Forests [36]. In this study, we used the amount of dead wood, old forest, mature broad leaf forest, and number of large trees as indicators for biodiversity. Numerous studies support the fact that dead wood is one of the most important prerequisites for preserved biodiversity [37]. Dead wood in this study included all stemwood resulting from natural mortality with a minimum diameter of 10 cm, and in all decay classes. Old forest is important to some species relying on continuity [38]. Large trees are amongst the most important substrates for red-listed species in boreal forests [39]. During the last century, there has been a change in the landscape structure in that conifer species (pine and spruce) have become more dominant. This has led to a situation where biodiversity components tied to the presence of deciduous trees are under pressure [40].

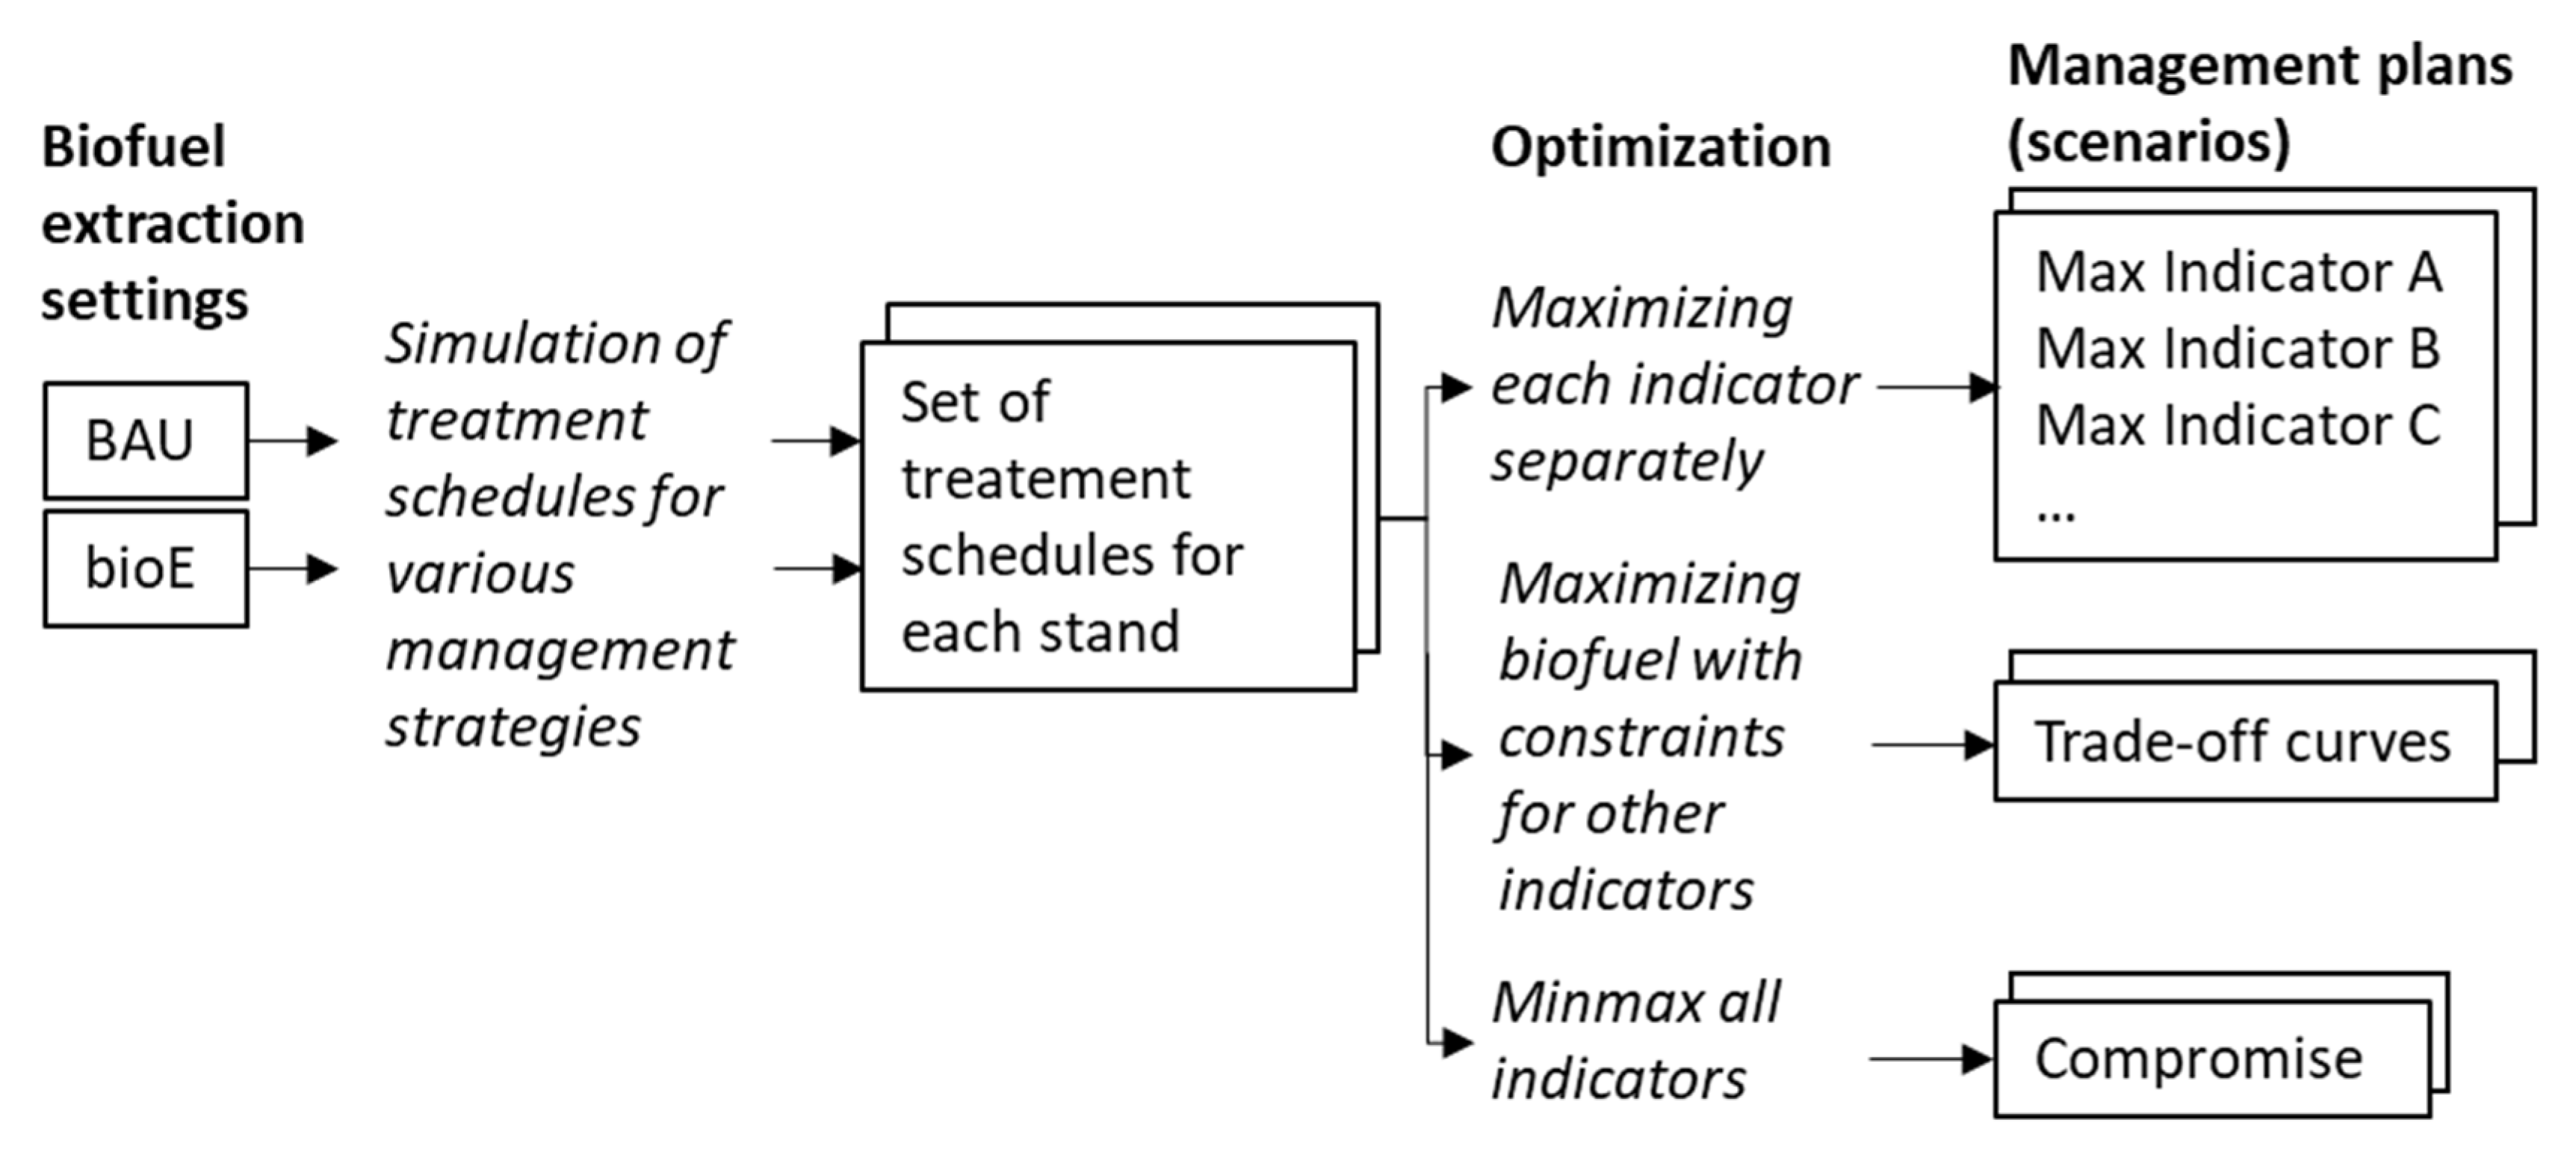
2.3. Analytical Framework

The trade-offs between increasing the extraction of woody biofuels and the impacts on the indicators for biodiversity and ecosystem services were investigated through a two-step procedure using long-term simulation of future forest development under different management alternatives combined with optimization based on LP. To this end, we used the Heureka application PlanWise, which is a decision support system for analysis and planning of the forest landscape [41]. PlanWise uses an optimization approach to determine the best possible combination of management strategies to meet user-defined objectives and constraints. This is done in two steps: treatment generation, and treatment selection (optimization).
During treatment generation, a large number of treatment schedules are created for each plot, for one or several management strategies. Treatment schedules vary in the timing of silvicultural activities, while management strategies can vary in management system (unmanaged, even-aged, and uneven-aged) and the type of silvicultural activity applicable (for example, natural regeneration/planting, number of thinnings, minimum rotation length, or different logging residue extraction practices, or different regeneration measures). For each plot, treatment schedule and period, PlanWise simulates the development of the tree layer by using a large set of models, e.g., empirical growth and yield models, models for stand establishment, diameter and height growth, ingrowth, and mortality. These models were developed by means of regression analysis using data from the National Forest Inventory, long-term experiments, and yield plots [42,43,44]. Other components of the forest ecosystem, like deadwood and carbon, were then calculated based on the development of the tree layer.
In treatment selection, an optimization problem was solved using linear programming (LP) or mixed integer programming (MIP) aiming at finding the optimal combination of treatment schedules for each plot, based on a user-defined objective that was to be minimized or maximized, and constraints that were to be met.
The following sections describe the details of the treatment generation and selection process applied in this study. Figure 2 gives an overview of the analytical framework.

2.4. Treatment Generation

For each NFI plot, a set of possible treatment schedules was generated covering the entire planning horizon, which in this study was set to 100 years, divided into 20 five-year periods. The treatment schedules for a given management strategy differed in the timing of forestry activities within the framework given by the management strategy. For each schedule, the outcome in terms of indicator values for the selected ecosystem services and biodiversity was simulated.
For the production forest (83% of the forest area, excluding nature reserves, voluntary set-asides, and retention patches), we defined six different possible management strategies: wood-production, no thinnings, broadleaves, long rotations, continuous cover forestry (CCF), and unmanaged (Table 2). The wood-production oriented strategy represents standard management practices, comprising regeneration through planting, cleaning, several thinnings, followed by final felling with the retention of three high stumps and ten live trees per hectare. The no thinning strategy includes cleanings, but no commercial thinnings. The broadleaves strategy aims at increasing the proportion of broadleaves in the landscape by increasing the share of retained broadleaves in cleaning and thinning operations, and allowing for longer rotation periods. In the long rotations strategy, pine is regenerated naturally and rotation time is prolonged by up to 60 years after reaching the minimum legal age for final felling. In the CCF strategy, which was only applied in spruce-dominated stands, the forest is managed with a series of selection fellings. Finally, a set-aside strategy was simulated for all production forests, in which the forest was left unmanaged.
Harvesting of woody biofuel is an option in all strategies except for the set-aside strategy. To be able to compare the effect of different ambitions regarding woody biofuel harvesting, the management strategies were simulated under two different settings for biofuel extraction: business-as-usual (BAU), representing current practices, and bioeconomy (bioE), with intensified biomass extraction options. In BAU, the only primary biofuel sources are logging residues (tops and branches) from final fellings. In bioE, additional biofuel sources are small diameter trees from whole tree harvesting in early thinnings (termed “biofuel thinning” in the remainder of the text), logging residues from regular thinnings, and stumps (including large roots) from final fellings. In biofuel thinnings, all the above-ground tree biomass is used for biofuel. Due to economic consideration, logging residues and stumps are only extracted in plots with a minimum spruce proportion of 50%, in both biofuel extraction settings. We applied environmental restrictions to logging residue and stump extraction based on recommendations of the Swedish Forest Agency [26]. These included that no logging residue and stump extraction take place on wet soils or peatland, due to the risk for rutting caused by forest machine trafficking. On moist soils, stumps are not extracted at all, while logging residue extraction is allowed on sandy soils, but not on clay- or fine silt soils. Further, stumps are not extracted on lichen-rich plots due to considerations for reindeer husbandry. Only spruce and pine stumps are extracted, stumps of all other tree species are left in the ground.
The remaining forest, 17% of the area, was set aside for nature conservation without any woody biofuel extraction, in both settings. Nature reserves were left unmanaged. In voluntary set-asides and retention patches, some nature-conservation focused management was implemented, by applying a management strategy consisting of selection felling on 10% (voluntary set-asides) or 20% (retention patches) of the area, leaving the remaining area unmanaged.

2.5. Treatment Selection

After simulating alternative treatment schedules for each NFI plot, a set of optimization problems were formulated and solved with LP for both biofuel extraction settings (BAU and bioE). All problems consisted of assigning treatment schedules to each NFI plot so that the value of the objective function was maximized while the defined restrictions were met. All optimizations included a constraint specifying the demand for roundwood harvest, based on projections done in the latest national scenario analysis on potential sustainable harvest levels [26]. Annual roundwood harvest demands range from 6.1 in the beginning, to 6.9 million m3 (under bark) in the end of the planning horizon (Figure 3). The roundwood demand includes firewood and unmerchantable stemwood, as a proportion of regular roundwood harvests. We did not include these volumes in our assessment of potential woody biofuels. We applied the same harvest demand constraint in all optimizations, allowing at most a +/−1% deviation from the harvest demand in each period. In addition, a constraint for evenness in woody biofuel extraction was included in all problems by accepting a maximal deviation of 20% in each period from average woody biofuel extraction over the entire planning horizon, which is in line with the deviation in harvest volume.

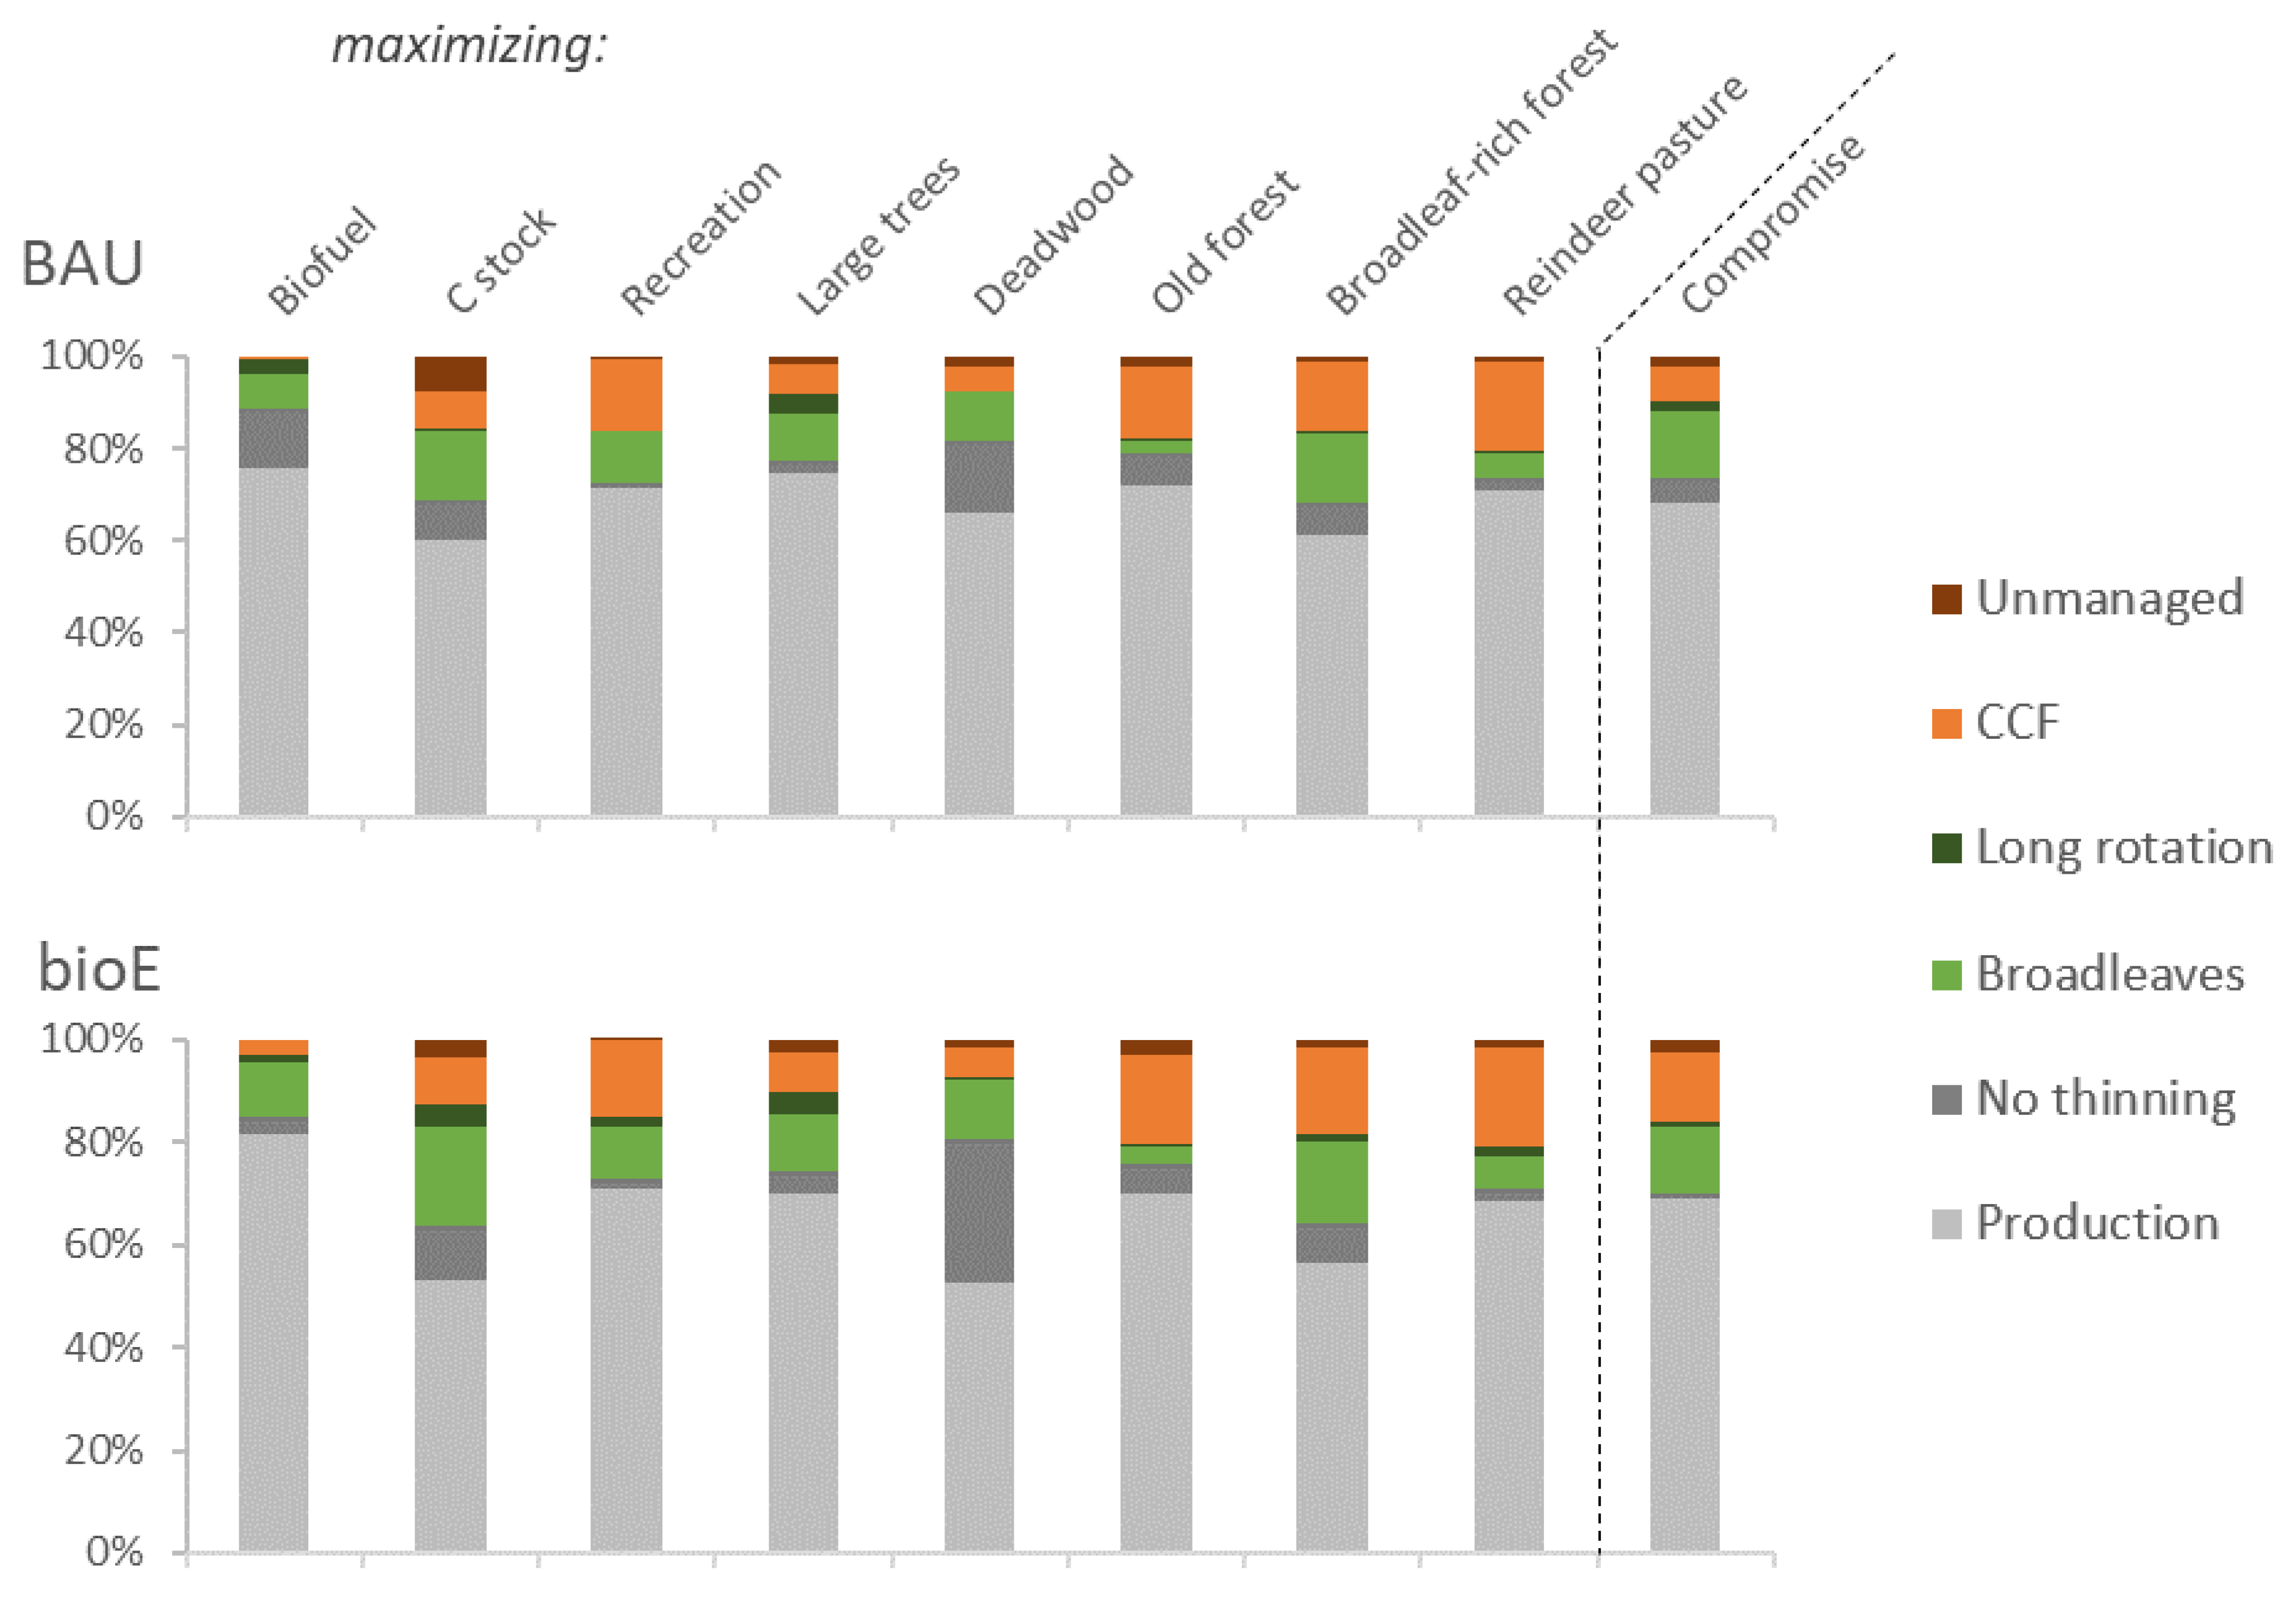
2.5.1. Maximum Potential per Indicator

The first set of LP problems aimed at determining the maximal potential production of the ecosystem services and biodiversity indicators (reindeer husbandry, carbon storage, recreation, old forest, mature broadleaf-rich forest, large diameter trees, and deadwood) for each scenario, subject to fulfilling a pre-defined level of roundwood harvest. The objective in each problem consisted of maximizing the total indicator value over all planning periods (separately for each of the indicators), subject to a demand for a certain amount of roundwood harvest for each five-year period.

2.5.2. Trade-offs between Woody Biofuel Extraction and One Indicator at a Time

To identify trade-offs between the extraction of woody biofuel and the other indicators, a second set of LP problems was formulated and solved, identifying a set of Pareto-efficient solutions, i.e., solutions where the result for any one of the objectives cannot be improved without compromising the result for the other objective. The objective in each problem consisted of maximizing the total indicator value over all planning periods, subject to a gradually decreasing demand for woody biofuel, i.e., decreasing the woody biofuel demand step-wise (99%, 95%, 90%, 80%, etc.) until a further decrease did not change the results anymore.

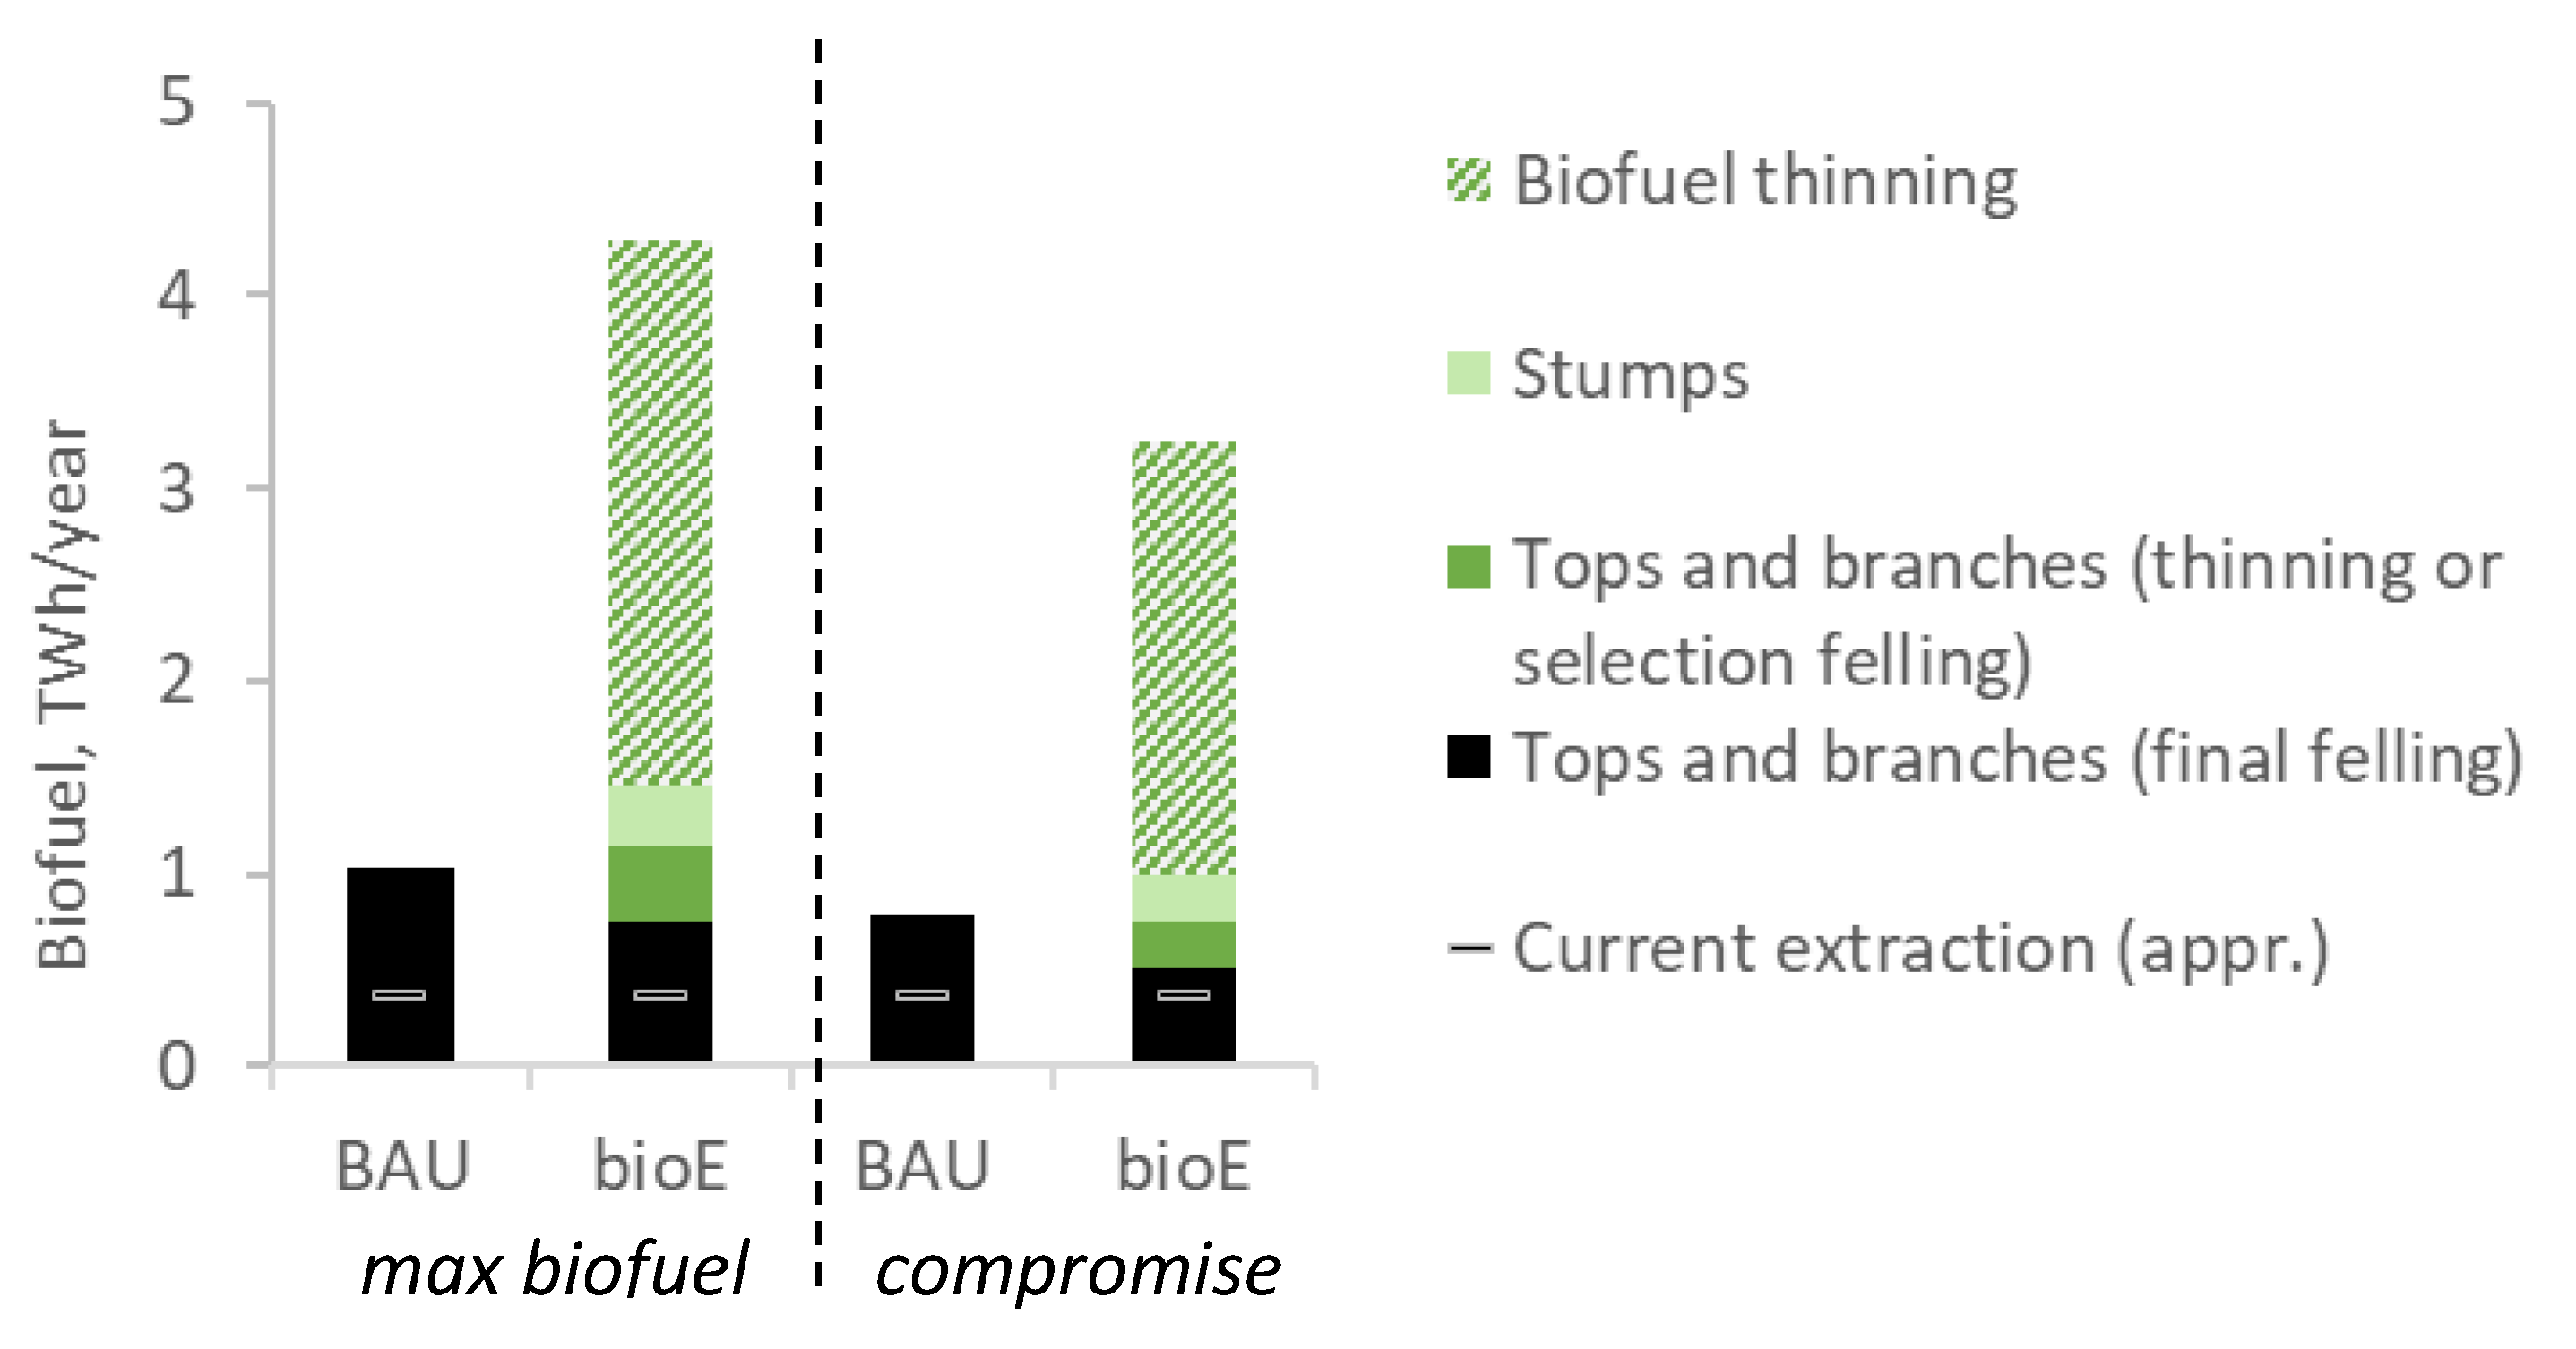
2.5.3. Compromise Solution, including all Indicators

Finally, we used GP to identify a compromise solution, aiming at minimizing the maximum relative deviation from the maximal potential production (resulting from the first set of LP problems) for all of the indicators at the same time.
Each problem was formulated with linear objectives and constraints and solved with LP. Consequently, the models are examples of a standard model I formulation [45]. All optimization models were formulated within the Heureka system, using the ZIMPL optimization modeling language [46] and solved with Gurobi 7.0. See Appendix A for the mathematical formulation of the problems.

3. Results

The two biofuel extraction settings differ widely in the woody biofuel extraction potential: BAU produces at most 1 TWh woody biofuels per year, while the maximum potential is more than 4 TWh per year in bioE. Woody biofuel amounts also varied strongly depending on which indicator was maximized (Table 1). However, in the bioE management settings, woody biofuel amounts were always higher than the maximum potential in BAU, independent of which indicator was maximized.
There was a large variation in the potential delivery of the different ecosystem services and biodiversity indicator levels (Table 3). In both biofuel extraction settings, there are trade-offs between woody biofuel extraction and ecosystem services, as well as biodiversity (Figure 4). The trade-off is particularly strong between woody biofuel on the one hand and mature broadleaf-rich forest and old forest on the other, while carbon stock, deadwood volumes, and recreation are less affected. However, the shape of the trade-off curves—i.e., the almost linear part, where an increase in biofuel harvest results in relatively small losses in the other indicator—suggests that careful management planning allows for increasing woody biofuel extraction with only small losses in all biodiversity and ecosystem service indicators, up to a certain point (Figure 4). The bioE settings allowed for considerably higher woody biofuel extraction, while reaching the same maximum levels of ecosystem services and biodiversity indicators as in BAU, except for recreation. The compromise scenarios allowed for the extraction of 0.8 (BAU settings) and 3.3 TWh (bioE settings) of woody biofuel per year. At the same time, the compromise scenarios also led to higher average ecosystem service and biodiversity indicator levels compared to current conditions (given by the input data and reflecting the state of the forest in 2010), except for reindeer pasture and recreation index, which decreased in all optimizations compared to current conditions, for both biofuel extraction settings (BAU and bioE). This is pre-dominantly due to forests becoming continuously denser, which has a negative impact on ground lichen and recreation.
The C stock increased over time in all scenarios, and about half of the increase was due to an increase of C stock in tree biomass, and the other half in forest soils. Woody biofuel extractions affected the total C stock only marginally.
The average annual woody biofuel extraction potential exceeded current extraction levels considerably in both the BAU and bioE management when maximizing biofuel, as well as in the compromise scenarios (Figure 5). Most of the biofuel potential under the bioE settings comes from biofuel thinning, an assortment that is hardly harvested currently. The extraction potential in the bioE compromise scenario corresponded to approximately 27% (BAU compromise scenario: 6%) of the total energy consumption of about 12.2 TWh in the Västerbotten region in the year 2017 [47]. The extraction potential for logging residues was somewhat higher in BAU compared to bioE as the average rotation length for spruce-dominated stands is longer in BAU, which means that stands have more biomass when final-felled.
The production strategy was the dominant strategy in both the BAU and bioE management settings, applied on more than half, and up to 82%, of the forest managed for wood supply in all scenarios (Figure 6). The production strategy was most prevalent when the focus was on maximizing biofuel, which at the same time had the lowest prevalence of CCF. CCF was more commonly applied in all other scenarios, including the compromise solutions (both under BAU and bioE management settings), as it supports biodiversity and several ecosystem services better than even-aged management [48]. There were only small differences in the distribution of management strategy between the BAU and bioE management settings. For example, the no thinning strategy was less common in the compromise scenarios under the bioE settings, as strategies that allow woody biofuel thinning were chosen instead. Notably, in all scenarios, a variety of strategies was applied—pure production-oriented management is not optimal, not even for maximizing woody biofuel extraction.

4. Discussion

Society is gradually evolving from a dependence on fossil fuels to sustainable alternatives like wood fuels. For many countries, there are good opportunities to increase the production of wood fuel in combination with timber and pulpwood production. However, at increased production rates, the forest ecosystem and its ecosystem services and biodiversity will be affected. As a result, studies investigating the possibilities to increase the production of wood fuel in a sustainable way are important. In this study, we used long-term simulations of future forest development for different management and biofuel extraction strategies, combined with an optimization approach to analyze how much woody biomass forest ecosystems can provide in a sustainable way.
The results from this study demonstrate that there is considerable leeway for forest management in pursuing desirable objectives, while maintaining current roundwood harvest levels. With careful management planning, the extraction of woody biofuel (i.e., biomass from logging residues, stumps, and thinnings in young dense stands) could be increased considerably from current levels without a significant negative impact on most of the studied ecosystem services and biodiversity. However, reindeer grazing potential and recreation index decreased compared to current levels, in all scenarios. This is to a large extent due to the projected increasing density in future forests, which continues an on-going trend [49]. This could be alleviated with increased thinning intensity, which would reduce the potential for wood production and was not assessed in this study.
Even if these results seem promising from a production perspective, a few issues have to be discussed. First, the indicators included in our analysis did not capture all effects of woody biofuel extraction. Our assessment of reindeer grazing potential and recreation focused primarily on forest structure and did not consider the potentially positive effects of residue removal on accessibility for reindeer or humans. Another uncertainty concerns the potential negative impact of residue extraction on wood production in the long-term, due to the additional extraction of nutrients [17,50]. In the study, we assumed that residue extraction after thinnings reduces the basal area increment by 5% during the following 15 years, while residue extraction after final felling does not have any impact on future wood production. Wood ash recycling may counteract nutrient depletion and minimize negative effects of residue extraction on growth, at least on some soil types [51,52].
While both logging residue and stump extraction could be increased without large adverse effects on other ecosystem services and biodiversity, the largest potential and currently under-used resource is biomass from biofuel thinning. Thus, the early stage of rotations seems to give a high flexibility in management without jeopardizing future stand values. As a recent literature review indicated, biomass harvest in dense early thinnings enables early outtake of bioenergy, while simultaneously maintaining the stand structure’s vertical heterogeneity and thereby supporting biodiversity [53]. The potential may also increase if cost-effective management systems are developed and implemented [54].
Our assessment was based on currently available technology for residue removal. The future development of technology and methodology for woody biofuel extraction operations may increase the available potential without compromising other forest values. For example, smarter extraction methods that are better able to separate residues into nutrient-rich parts—to be left in the forest—and nutrient-poorer parts—to be extracted—could lead to higher biomass extraction levels, better fuel quality and more nutrients left in the forest [55]. Another option is the development of precision forestry that leaves just enough of, e.g., deadwood/nutrients to keep the highest ecosystem service levels. In addition, our assessment did not account for transport distance from the forest to the industry. Energy wood and wood chips from harvest residues are predominantly transported by truck, which is not economically viable over distances longer than 100 km [15]. Long transport distances are currently one of the main factors behind the low residue extraction rate in northern Sweden. The future development of woody biofuel harvest is mainly influenced by economic preconditions, i.e., future energy prices and transport distances. Therefore, extraction levels may change quickly as a result of changes in energy prices or a shift from truck to train transport [12,15].
Our estimates of woody biomass potential from harvest residues are lower than those assessed in the latest Forest Impact Analysis—at most circa 0.5 TWh per 106 ha managed forest in our study compared to 1.8 TWh per 106 ha managed forest in northern Sweden [10,26]. However, the Forest Impact Analysis did not include any economic constraints for residue extraction, while our analysis included several such constraints, in particular by setting a lower limit for the proportion of spruce (50%) for forests where residues can be extracted.
The focus of our analysis was on the long-term impact of increased woody biofuel extraction, in particular the indirect impact through changes in management strategies. For example, a higher proportion of mixed forests can lead to the reduction in woody biofuel potential, since a minimum spruce proportion is needed for biofuel extraction to be economically feasible. Our results demonstrate that the increasing demands on the forest call for careful management planning. All scenarios had a variation in management strategies, i.e., the production strategy was not optimal on all sites even when the sole focus was on woody biofuel production.
The reliability of long-term projections naturally depends to a large degree on the quality of the used growth and yield models. The decision support system we used in our analysis has been shown to give reliable growth projections for time periods of 100 years [42], in particular for even-aged forests. Growth projections in forests managed with continuous cover forestry are less certain [56]. We did not project potential impacts of climate change, as our modeling approach only allowed for including climate change effects on growth, but not expected increased disturbance risks. Both the increased growth that is expected for northern European forests as a result of a warmer climate [57], and the need for salvage cuttings after disturbances may increase future biofuel potentials compared to our assessments.

5. Conclusions

To conclude, the development of novel and cost-effective management systems for biofuel outtake in early rotations may provide options for a significant supply of bioenergy to the emerging bioeconomy, while at the same time securing biodiversity and important ecosystem values in future stand developments. In addition, there is potential to increase the extraction of harvest residues and stumps while at the same time improving conditions for biodiversity and the amount of carbon stored in forest ecosystems compared to current levels. However, the suitability of forests for recreation and reindeer grazing may decrease from the current level due to increasing future stand density—irrespective of the intensity of wood fuel harvest.

Author Contributions

Conceptualization, J.E., Y.M. and K.Ö.; methodology, J.E. and K.Ö.; formal analysis, J.E.; investigation, J.E.; writing—original draft preparation, J.E., K.Ö., D.B. and J.L.; project administration, Y.M. and K.Ö.; funding acquisition, Y.M. All authors have read and agreed to the published version of the manuscript.

Funding

This research was funded by Brattås stiftelsen (grant number F15:03) and Energimyndigheten (grant number 48237-1).

Acknowledgments

We would like to thank three anonymous reviewers for their valuable comments.

Conflicts of Interest

The authors declare no conflict of interest. The funders had no role in the design of the study; in the collection, analyses, or interpretation of data; in the writing of the manuscript, or in the decision to publish the results.

Appendix A

Maximum Potential per Indicator

The first set of LP problems aimed at determining the maximal potential production of each indicator, e for each scenario, s, subject to fulfilling a pre-defined level of roundwood harvest and to a demand of evenness in woody biofuel extraction. This means that the problem described with Equation (A1)–(A10) was solved 16 times, once for each indicator and for both biofuel extraction settings.
The mathematical formulation of the first set of problems is as follows:
M a x   i I j J p P e i j p x i j
Subject to:
i I j J i T i j p x i j 0.99 T ¯ p                                     p P
i I j J i T i j p x i j 1.01 T ¯ p                                     p P
i I j J i M i j p x i j 0.99 M ¯ p                                   p P
i I j J i M i j p x i j 1.01 M ¯ p                                   p P
i I j J i B i j p x i j 0.8 i I j J p P B i j p x i j             p P
i I j J i B i j p x i j 1.2 i I j J p P B i j p x i j             p P
j J i x i j = 1                                                               i I
x i j = [ 0 , 1 ]                                                 i I     j J i
Equation (A1) specifies the objective function, i.e., to maximize the total value over all planning periods for indicator e. Equations (A2)–(A5) are connected to the timber and pulpwood demand in each period. Equations (A6) and (A7) are connected to the demand of evenness in woody biofuel extraction. Finally, Equations (A8) and (A9) ensure that all plots are assigned in total one treatment schedule.

Trade-offs between Woody Biofuel Extraction and One Indicator at a Time

The second set of problems aimed at identifying the trade-offs in each scenario between the extraction of woody biofuel and the other indicators subject to fulfilling a pre-defined level of roundwood harvest and to a demand of evenness in woody biofuel extraction.
The mathematical formulation of the second set of problems is as follows:
M a x   i I j J i p P e i j p x i j .
Subject to:
Equations (A2)–(A9) and:
i I j J i p P B i j p x i j > α M a x Z w .
Equation (A10) specifies the objective function, i.e., to maximize the indicator value over all periods. Equation (A11) specifies the gradually decreasing demand for woody biofuel. This means that the stated problem was solved a number of times for each indicator and scenario. Each time the value of α is gradually decreased from 0.99, 0.95, 0.90, 0.80, etc., until a further decrease in the demand of woody fuel did not change the results anymore. M a x Z w is the potential maximal extraction of woody biofuel. The value of M a x Z w is the result of solving the first set of Equations (A1)–(A9) with eijp = Bijp.

Compromise Solution, including all Indicators

The third set of problems identified a compromise solution, aiming at minimizing the maximum relative deviation from the maximal potential production (resulting from the first set of LP problems) for all of the indicators, at the same time subject to fulfilling a pre-defined level of roundwood harvest and to a demand of evenness in woody biofuel extraction. This means that the problem described below was solved two times, once for both biofuel extraction setting.
The mathematical formulation of the last set of problems is as follow:
M i n   Z c = m a x { Z e * * Z e * }         e = 1 , . . E .
Subject to:
Z e * = i I j J i p P e i j p x i j ,
and Equations (A2)–(A9).
Equations (A12) and (A13) specify the objective function, i.e., to minimize the maximal relative deviation from the maximal potential production for all of the indicators at the same time. Z e * * is the normalized value of the maximal production of indicator e resulting from solving of the first set of problems and Z e * is the normalized value under decision variable xij.
Table A1. Explanation of variables, sets and constants included in functions 1–13.
Model PartExplanation
Variables x i j   decision variable that takes a value between 0 and 1, indicating the proportion of NFI plot I that is assigned to treatment schedule j
SetsP  Set of all periods
I  Set of all NFI plots
J  Set of all treatment schedules
Ji  Set of treatment schedules for NFI plot i, J i J
E  Set of indicators
S  Set of scenarios
Constantseijp  Amount of indicator e in in NFI plot i, treatment schedule j and period p
Tijp  Harvested timber volume in NFI plot i, treatment schedule j and period p
Mijp  Harvested pulpwood volume in NFI plot i, treatment schedule j and period p
Bijp  Wood fuel biomass extracted in in NFI plot i, treatment schedule j and period p
T ¯ p   Timber demand in period p
M ¯ p   Pulpwood demand in period p
a  Proportion of the maximal potential production of one the other indicators

References

  1. Creutzig, F.; Ravindranath, N.H.; Berndes, G.; Bolwig, S.; Bright, R.; Cherubini, F.; Chum, H.; Corbera, E.; Delucchi, M.; Faaij, A.; et al. Bioenergy and climate change mitigation: An assessment. GCB Bioenergy 2015, 7, 916–944. [Google Scholar] [CrossRef] [Green Version]
  2. IPCC Summary for Policymakers. Climate Change 2014: Mitigation of Climate Change.Contribution of Working Group III to the Fifth Assessment Report of the Intergovernmental Panel on Climate Change; Cambridge University Press: Cambridge, UK, 2014. [Google Scholar]
  3. Proskurina, S.; Sikkema, R.; Heinimö, J.; Vakkilainen, E. Five years left–How are the EU member states contributing to the 20% target for EU’s renewable energy consumption; the role of woody biomass. Biomass Bioenergy 2016, 95, 64–77. [Google Scholar] [CrossRef]
  4. Ministry of the Environment and Energy. Gov. Bill 2016/17:146; Ett klimatpolitiskt ramverk för Sverige; Government Offices of Sweden: Stockholm, Sweden, 2016. [Google Scholar]
  5. Regeringskansliet. Strategi för Sveriges Nationella Skogsprogram [Strategy for Sweden’s National Forest Programme]; Government Offices of Sweden, Ministry of Enterprise och Innovation: Rosenbad, Stockholm, 2018. [Google Scholar]
  6. Börjesson, P.; Hansson, J.; Berndes, G. Future demand for forest-based biomass for energy purposes in Sweden. Forest Ecol. Manag. 2017, 383, 17–26. [Google Scholar] [CrossRef]
  7. Swedish Energy Agency Energy in Sweden 2019: An overview 2019. Available online: https://energimyndigheten.a-w2m.se/Home.mvc?resourceId=133464 (accessed on 10 January 2020).
  8. Díaz-Yáñez, O.; Mola-Yudego, B.; Anttila, P.; Röser, D.; Asikainen, A. Forest chips for energy in Europe: Current procurement methods and potentials. Renew. Sustain. Energy Rev. 2013, 21, 562–571. [Google Scholar] [CrossRef]
  9. Routa, J.; Asikainen, A.; Björheden, R.; Laitila, J.; Röser, D. Forest energy procurement: State of the art in Finland and Sweden. WIREs Energy Environ. 2013, 2, 602–613. [Google Scholar] [CrossRef]
  10. Fridh, M.; Christiansen, L. Rundvirkes- och Skogsbränslebalanser för år 2013-SKA15 [Timber and Woody Biofuel Balances 2013]; Skogsstyrelsen: Jönköping, Sweden, 2015. [Google Scholar]
  11. Swedish Energy Agency Produktion av Sönderdelade Oförädlade Primära Skogsbränslen av Inhemskt Ursprung Med Fördelning på sSortiment, GWh, 2013-. PxWeb. Available online: https://pxexternal.energimyndigheten.se/pxweb/sv/Produktion,%20import%20och%20export%20av%20of%c3%b6r%c3%a4dlade%20tr%c3%a4dbr%c3%a4nslen/-/EN0122_3.px/table/tableViewLayout2/?rxid=15989e6d-2e0c-485a-96d4-eefd08e86850 (accessed on 19 December 2019).
  12. Johansson, J.; Ranius, T. Biomass outtake and bioenergy development in Sweden: The role of policy and economic presumptions. Scand. J. For. Res. 2019, 1–8. [Google Scholar] [CrossRef] [Green Version]
  13. Bergström, D.; Ulvcrona, T.; Nordfjell, T.; Egnell, G.; Lundmark, T. Skörd av Skogsbränsle i Förstagallringar. [Harvesting of Fuel Wood Fuel from Early Thinnings]; SLU, Department of Forest Resource Management: Umeå, Sweden, 2010. [Google Scholar]
  14. Verkerk, P.J.; Fitzgerald, J.B.; Datta, P.; Dees, M.; Hengeveld, G.M.; Lindner, M.; Zudin, S. Spatial distribution of the potential forest biomass availability in Europe. For. Ecosyst. 2019, 6, 5. [Google Scholar] [CrossRef]
  15. Moskalik, T.; Gendek, A. Production of Chips from Logging Residues and Their Quality for Energy: A Review of European Literature. Forests 2019, 10, 262. [Google Scholar] [CrossRef] [Green Version]
  16. De Jong, J.; Akselsson, C.; Egnell, G.; Löfgren, S.; Olsson, B.A. Realizing the energy potential of forest biomass in Sweden–How much is environmentally sustainable? For. Ecol. Manag. 2017. [Google Scholar] [CrossRef] [Green Version]
  17. Ranius, T.; Hämäläinen, A.; Egnell, G.; Olsson, B.; Eklöf, K.; Stendahl, J.; Rudolphi, J.; Sténs, A.; Felton, A. The effects of logging residue extraction for energy on ecosystem services and biodiversity: A synthesis. J. Environ. Manag. 2018, 209, 409–425. [Google Scholar] [CrossRef]
  18. Zanchi, G.; Belyazid, S.; Akselsson, C.; Yu, L. Modelling the effects of management intensification on multiple forest services: A Swedish case study. Ecol. Model. 2014, 284, 48–59. [Google Scholar] [CrossRef] [Green Version]
  19. Verkerk, P.J.; Lindner, M.; Zanchi, G.; Zudin, S. Assessing impacts of intensified biomass removal on deadwood in European forests. Ecol. Indic. 2011, 11, 27–35. [Google Scholar] [CrossRef]
  20. Verkerk, P.J.; Mavsar, R.; Giergiczny, M.; Lindner, M.; Edwards, D.; Schelhaas, M.J. Assessing impacts of intensified biomass production and biodiversity protection on ecosystem services provided by European forests. Ecosyst. Serv. 2014, 9, 155–165. [Google Scholar] [CrossRef]
  21. Akujärvi, A.; Shvidenko, A.; Pietsch, S.A. Modelling the impacts of intensifying forest management on carbon budget across a long latitudinal gradient in Europe. Environ. Res. Lett. 2019, 14, 034012. [Google Scholar] [CrossRef]
  22. Eyvindson, K.; Repo, A.; Mönkkönen, M. Mitigating forest biodiversity and ecosystem service losses in the era of bio-based economy. For. Policy Econ. 2018, 92, 119–127. [Google Scholar] [CrossRef]
  23. Eggers, J.; Räty, M.; Öhman, K.; Snäll, T. How Well Do Stakeholder-Defined Forest Management Scenarios Balance Economic and Ecological Forest Values? Forests 2020, 11, 86. [Google Scholar] [CrossRef] [Green Version]
  24. Biber, P.; Borges, J.G.; Moshammer, R.; Barreiro, S.; Botequim, B.; Brodrechtová, Y.; Brukas, V.; Chirici, G.; Cordero-Debets, R.; Corrigan, E.; et al. How sensitive are ecosystem services in European forest landscapes to silvicultural treatment? Forests 2015, 6, 1666–1695. [Google Scholar] [CrossRef] [Green Version]
  25. Garcia-Gonzalo, J.; Bushenkov, V.; McDill, M.; Borges, J. A Decision Support System for Assessing Trade-Offs between Ecosystem Management Goals: An Application in Portugal. Forests 2014, 6, 65–87. [Google Scholar] [CrossRef] [Green Version]
  26. Claesson, S.; Lundström, A.; Duvemo, K.; Wikberg, P.-E. Skogliga Konsekvensanalyser 2015-SKA15 (Forest Impact Analysis) in Swedish; Skogsstyrelsen and Swedish University of Agricultural Sciences: Jönköping, Sweden, 2015; p. 110. [Google Scholar]
  27. Fridman, J.; Holm, S.; Nilsson, M.; Nilsson, P.; Ringvall, A.; Ståhl, G. Adapting National Forest Inventories to changing requirements–the case of the Swedish National Forest Inventory at the turn of the 20th century. Silva Fenn. 2014, 48. [Google Scholar] [CrossRef] [Green Version]
  28. MEA Millenium Ecosystem Assessment. Ecosystems and Human well-being: Synthesis; Island Press: Washington, DC, USA, 2005; ISBN 978-1-55963-227-0. [Google Scholar]
  29. Mace, G.M.; Norris, K.; Fitter, A.H. Biodiversity and ecosystem services: A multilayered relationship. Trends Ecol. Evol. 2012, 27, 19–26. [Google Scholar] [CrossRef]
  30. Korosuo, A.; Sandström, P.; Öhman, K.; Eriksson, L.O. Impacts of different forest management scenarios on forestry and reindeer husbandry. Scand. J. For. Res. 2014, 29, 234–251. [Google Scholar] [CrossRef]
  31. Sandström, P.; Cory, N.; Svensson, J.; Hedenås, H.; Jougda, L.; Borchert, N. On the decline of ground lichen forests in the Swedish boreal landscape: Implications for reindeer husbandry and sustainable forest management. Ambio 2016, 45, 415–429. [Google Scholar] [CrossRef] [PubMed]
  32. Bell, S.; Simpson, M.; Tyrväinen, L.; Sievänen, T.; Pröbstl, U. European Forest Recreation and Tourism: A Handbook; Taylor & Francis: Abingdon, UK, 2009; ISBN 978-1-135-21121-9. [Google Scholar]
  33. Elands, B.H.M.; van Marwijk, R.B.M. Policy and management for forest and nature based recreation and tourism. For. Policy Econ. 2012, 19, 1–3. [Google Scholar] [CrossRef]
  34. Eggers, J.; Lindhagen, A.; Lind, T.; Lämås, T.; Öhman, K. Balancing landscape-level forest management between recreation and wood production. Urban For. Urban Green. 2018, 33, 1–11. [Google Scholar] [CrossRef]
  35. Ortiz, C.; Karltun, E.; Stendahl, J.; Gärdenäs, A.I.; Ågren, G.I. Modelling soil carbon development in Swedish coniferous forest soils—An uncertainty analysis of parameters and model estimates using the GLUE method. Ecol. Model. 2011, 222, 3020–3032. [Google Scholar] [CrossRef]
  36. SEPA. Sweden’s Environmental Objectives–An Introduction; Swedish Environmental Protection Agency (Naturvårdsverket): Stockholm, Sweden, 2018. [Google Scholar]
  37. Lassauce, A.; Paillet, Y.; Jactel, H.; Bouget, C. Deadwood as a surrogate for forest biodiversity: Meta-analysis of correlations between deadwood volume and species richness of saproxylic organisms. Ecol. Indic. 2011, 11, 1027–1039. [Google Scholar] [CrossRef]
  38. Bauhaus, J.; Puettmann, K.; Messier, C. Silviculture for old-growth attributes. For. Ecol. Manag. 2009, 258, 525–537. [Google Scholar] [CrossRef] [Green Version]
  39. Berg, Å.; Ehnström, B.; Gustafsson, L.; Hallingbäck, T.; Jonsell, M.; Weslien, J. Threatened Plant, Animal, and Fungus Species in Swedish Forests: Distribution and Habitat Associations. Conserv. Biol. 1994, 8, 718–731. [Google Scholar] [CrossRef]
  40. Felton, A.; Gustafsson, L.; Roberge, J.-M.; Ranius, T.; Hjältén, J.; Rudolphi, J.; Lindbladh, M.; Weslien, J.; Rist, L.; Brunet, J.; et al. How climate change adaptation and mitigation strategies can threaten or enhance the biodiversity of production forests: Insights from Sweden. Biol. Conserv. 2016, 194, 11–20. [Google Scholar] [CrossRef]
  41. Wikström, P.; Edenius, L.; Elfving, B.; Eriksson, L.O.; Lämås, T.; Sonesson, J.; Öhman, K.; Wallerman, J.; Waller, C.; Klintebäck, F. The Heureka Forestry Decision Support System: An Overview. Math. Comput. For. Nat. Resour. Sci. 2011, 3, 87–95. [Google Scholar]
  42. Fahlvik, N.; Elfving, B.; Wikström, P. Evaluation of growth functions used in the Swedish forest planning system Heureka. Silva Fenn. 2014, 48. [Google Scholar] [CrossRef] [Green Version]
  43. Fridman, J.; Ståhl, G. A Three-step Approach for Modelling Tree Mortality in Swedish Forests. Scand. J. For. Res. 2001, 16, 455–466. [Google Scholar] [CrossRef]
  44. Wikberg, P.-E. Occurrence, Morphology and Growth of Understory Saplings in Swedish Forests. Ph.D. Thesis, Acta Universitatis Agriculturae Sueciae. Silvestria, Swedish University of Agricultural Sciences, Umeå, Sweden, 2004. [Google Scholar]
  45. Johnson, K.N.; Scheurman, H.L. Techniques for Prescribing Optimal Timber Harvest and Investment Under Different Objectives--Discussion and Synthesis. For. Sci. 1977, 23, a0001–z0001. [Google Scholar]
  46. Koch, T. Rapid Mathematical Programming. Ph.D. Thesis, Technische Universität Berlin, Berlin, Germany, 2005. [Google Scholar]
  47. SCB End-use of Energy by Region, Sector and Fuel Type. Available online: http://www.statistikdatabasen.scb.se/pxweb/sv/ssd/START__EN__EN0203/SlutAnvSektor/ (accessed on 10 January 2020).
  48. Peura, M.; Burgas, D.; Eyvindson, K.; Repo, A.; Mönkkönen, M. Continuous cover forestry is a cost-efficient tool to increase multifunctionality of boreal production forests in Fennoscandia. Biol. Conserv. 2018, 217, 104–112. [Google Scholar] [CrossRef]
  49. Hedwall, P.-O.; Brunet, J.; Nordin, A.; Bergh, J. Changes in the abundance of keystone forest floor species in response to changes of forest structure. J. Veg. Sci. 2013, 24, 296–306. [Google Scholar] [CrossRef]
  50. Achat, D.L.; Deleuze, C.; Landmann, G.; Pousse, N.; Ranger, J.; Augusto, L. Quantifying consequences of removing harvesting residues on forest soils and tree growth–A meta-analysis. For. Ecol. Manag. 2015, 348, 124–141. [Google Scholar] [CrossRef]
  51. Ekvall, H.; Löfgren, S.; Bostedt, G. Ash recycling—A method to improve forest production or to restore acidified surface waters? For. Policy Econ. 2014, 45, 42–50. [Google Scholar] [CrossRef]
  52. Ouvrard, B.; Abildtrup, J.; Bostedt, G.; Stenger, A. Determinants of forest owners attitudes towards wood ash recycling in Sweden-Can the nutrient cycle be closed? Ecol. Econ. 2019, 164, 106293. [Google Scholar] [CrossRef]
  53. Witzell, J.; Bergström, D.; Bergsten, U. Variable corridor thinning-a cost-effective key to provision of multiple ecosystem services from young boreal conifer forests? Scand. J. For. Res. 2019, 34, 497–507. [Google Scholar] [CrossRef]
  54. Karlsson, L.; Nyström, K.; Bergström, D.; Bergsten, U. Development of Scots pine stands after first biomass thinning with implications on management profitability over rotation. Scand. J. For. Res. 2015, 30, 416–428. [Google Scholar] [CrossRef]
  55. Pettersson, M.; Nordfjell, T. Fuel quality changes during seasonal storage of compacted logging residues and young trees. Biomass Bioenergy 2007, 31, 782–792. [Google Scholar] [CrossRef]
  56. Wikström, P. Jämförelse av Ekonomi och Produktion Mellan Trakthyggesbruk och Blädning i Skiktad Granskog-Analyser på Beståndsnivå Baserade på Simulering; Skogsstyrelsen: Jönköping, Sweden, 2008; p. 59. [Google Scholar]
  57. Lindner, M.; Fitzgerald, J.B.; Zimmermann, N.E.; Reyer, C.; Delzon, S.; van der Maaten, E.; Schelhaas, M.-J.; Lasch, P.; Eggers, J.; van der Maaten-Theunissen, M.; et al. Climate change and European forests: What do we know, what are the uncertainties, and what are the implications for forest management? J. Environ. Manag. 2014, 146, 69–83. [Google Scholar] [CrossRef] [PubMed] [Green Version]
Figure 1. Location of the study area (a), volume distribution by age class (b), and age class distribution (area) of the productive forest in the study area (c).
Sustainability 12 04089 g001
Figure 2. Overview of the analytical framework.
Sustainability 12 04089 g002
Figure 3. Total roundwood harvest demand (under bark) during the 100-year planning horizon.
Sustainability 12 04089 g003
Figure 4. Trade-offs (Pareto frontier) between average annual woody biofuel production (x-axis) and indicators for other ecosystem services and biodiversity. Markers indicate the current situation as well as average values for the compromise solutions. Current situation reflects indicator levels in 2010, from the input data.
Sustainability 12 04089 g004
Figure 5. Average annual woody biofuel extraction potential in different woody biofuel assortments, in the BAU and bioE scenarios, when maximizing for woody biofuel (max biofuel) and in the compromise solution. Current extraction rates are based on the average annual area where woody biofuel extraction after final felling has been notified (years 2015–2018, circa 2000 ha/year in study area) and an assumed average extraction rate of 38 ton dry matter/ha, and one ton dry matter corresponding to 4.9 MWh.
Sustainability 12 04089 g005
Figure 6. Proportion of management strategies in the BAU and bioE scenarios, when maximizing each indicator individually and in the compromise solution. Forest area set-aside fore nature conservation (nature reserves, voluntary set-asides, and retention patches) is not included.
Sustainability 12 04089 g006
Table 1. Definition of indicators for ecosystem services and biodiversity.
ClassificationIndicatorDefinitionUnit
Provisioning serviceWoody biofuel productionEnergy content of the extracted biomass of residues, stumps and whole trees (above stump, in biofuel thinnings), assuming that 1 t of biomass (dry weight) corresponds to 4.9 MWhTWh
Provisioning serviceReindeer husbandryArea potentially suitable for reindeer pasture (basal area < 20 m2/ha, tree density < 1600 stems/ha, not dominated by Pinus contorta), based on [30])ha
Regulating serviceCarbon storageTotal forest carbon stock (including carbon in above- and belowground tree biomass and forest soil)Mg C/ha
Cultural serviceRecreationIndex between 0 and 1 describing a plots’ suitability for recreation, with higher index values denoting a higher suitability for recreation -
BiodiversityOld forestArea of forest with age > 140 yearsha
BiodiversityMature broadleaf-rich forestArea of forest with age > 80 and broadleaves >= 25% of total basal areaha
BiodiversityLarge diameter treesDensity of trees with a diameter in breast height > 40 cmNumber of trees/ha
BiodiversityDeadwoodTotal deadwood volume, all decay classesm3/ha
Table 2. Description of the management strategies applied in the business-as-usual (BAU) and bioeconomcy (bioE) extraction settings for the productive forest.
Management Strategies
Management PracticesProductionNo ThinningBroadleavesLong RotationsCCFUnmanaged
RegenerationPlantingPlantingSpruce: planting
Pine: natural
Spruce: planting
Pine: natural, seed trees retained
NaturalNatural (when starting from bare forest land, otherwise not needed)
Broadleaf admixture after cleaning20%20%40%20%--
Broadleaf admixture after thinning20%-40%20%Selection fellings favoring broadleaves (larger proportional felling rate for conifers)-
Delay in final felling after reaching minimum final felling ageMax 30 yearsMax 30 years20–50 years35–60 years--
Number of single retention trees1010202010-
Number of high stumps3366--
Table 3. Pay-off table for the BAU and bioE scenarios, for the analyzed indicators. Columns show the results for the optimizations determining the maximum potential for each indicator (average over time; maximum potential per indicator in bold). The last column shows the results for the compromise scenario (% of maximum potential in brackets).
Maximizing:
IndicatorBiofuelReindeer PastureRecrea-tionC StockOld ForestMature Broadleaf-Rich ForestLarge-Diameter TreesDeadwoodCompromise
BAU
Biofuel (TWh/year)1.00.10.00.00.10.00.10.10.8 (76%)
Reindeer pasture (1000 ha)502863731461709641555499654 (76%)
Recreation index0.270.270.290.300.260.280.280.280.28 (95%)
C stock (ton C/ha)110111112116111112111112111 (95%)
Old forest (1000 ha)341512427336598405365328453 (76%)
Mature broadleaf-rich forest (1000 ha)197341343293280516207210391 (76%)
Large-diameter trees (trees/ha)6.27.17.06.67.16.99.66.57.3 (76%)
Deadwood (m3/ha)12.612.912.613.612.912.812.914.712.7 (86%)
bioE
Biofuel (TWh/year)4.31.21.21.51.31.21.41.23.3 (76%)
Reindeer pasture (1000 ha)399845675393668570499409641 (76%)
Recreation index0.240.280.290.230.260.260.260.230.26 (88%)
C stock (ton C/ha)113113112120114115114117114 (95%)
Old forest (1000 ha)317527403322614412375326465 (76%)
Mature broadleaf-rich forest (1000 ha)198352330267291534219210405 (76%)
Large-diameter trees (trees/ha)6.17.06.76.67.26.89.66.37.3 (76%)
Deadwood (m3/ha)12.513.112.614.113.313.213.215.512.8 (82%)

