Article

The Primacy of Politics in Public Food Security Policies: The Case of Home Gardens

by
Manrrubio Muñoz-Rodríguez
1,
Claudia Fernández-González
2,
Norman Aguilar-Gallegos
1,* and
María Virginia González-Santiago
2
1
Centro de Investigaciones Económicas, Sociales y Tecnológicas de la Agroindustria y la Agricultura Mundial (CIESTAAM), Universidad Autónoma Chapingo (UACh), Carretera México–Texcoco km. 38.5, Chapingo, Texcoco 56230, Estado de México C.P., Mexico
2
Departamento de Agroecología, Universidad Autónoma Chapingo (UACh), Carretera México–Texcoco km. 38.5, Chapingo, Texcoco 56230, Estado de México C.P., Mexico
*
Author to whom correspondence should be addressed.
Sustainability 2020, 12(10), 4316; https://0-doi-org.brum.beds.ac.uk/10.3390/su12104316
Submission received: 7 April 2020 / Revised: 21 May 2020 / Accepted: 21 May 2020 / Published: 25 May 2020

Abstract

:
Home gardens are often conceived as a panacea to contribute to the problem of food insecurity in poor rural and urban households. However, systematic reviews indicate weak evidence of significant impacts on families. This way, there has been an intense discussion about their effectiveness. This research aims to generate knowledge about the relevance of assuming food production in home gardens as an alternative to the home consumption. Two questions drive this paper: what number of home gardens, supported by three different government programs, persists? Moreover, what factors explain their permanence? Our sample constituted 261 beneficiaries, and the collection of data was through face-to-face field surveys and in situ visits to the vegetable garden granted. We show that less than 7.5% of gardens remain in right conditions after two years of establishment. The pleasure and need to produce, family involvement, urban/rural location, and the technology provided are determining factors for permanence. The results support the argument that the high rate of home gardens that fail is related to the primacy of politics in considering the problem of food security as a “lack of assets” to produce. Thus, this suggests that there is a weak link between the problem, policies, and the politics.

1. Introduction

People who do not have at all times physical and economic access to nutritious and innocuous food, so they can satisfy their needs and have an active and healthy life, are considered to have food insecurity [1]. This affects mainly the most vulnerable groups of society: unemployed, children, pregnant and fertile women, the elderly, handicapped, immigrant, and young people [2,3,4,5]. The consequences of food insecurity are the reduction in dietary diversity [6] and public health problems that have an impact on the development of a country’s human capital [7,8,9].
Between the years 2012 and 2014, it was estimated that there were 805 million undernourished people in the world, of which 7.5 million were in Latin America [10]. In Mexico, 23.3% of the population lacks access to food (i.e., that percentage is in food insecurity), from which 32.1% of the rural population is the most deprived of this fundamental right, compared to the 20.7% of the urban area. In absolute terms, in the first group there are 8.9 million and in the second 19.1 million [11]. For the Mexican government, these indicators constitute the evidence of a public problem. Other countries have addressed this through public policies that promote, for example, food production in households [12]; money transfers [4,13,14]; distribution of food supplements or fortified foods [15]; consumption of undervalued crops and ancient grains crops with high nutritional quality [16]; biofortification of food [15,17]; the enrichment with vitamins and minerals of the food that families commonly consume [18]; and nutritional education [8,19], among others.
In particular, vegetable garden production is part of the so-called agricultural interventions that seek to improve the nutritional status of vulnerable people through a diversified production (agriculture, livestock, or fisheries) and the biofortification of traditionally consumed crops [20]. Since the approach of these interventions has changed over time, there has been an intense debate about their effectiveness.
In this sense, several authors, through systematic reviews [20,21,22,23,24,25,26,27], agree that although there is strong evidence that agricultural interventions have had a positive impact on the production and consumption of vegetables, fruit, fish, milk, and meat, there is no statistically significant evidence on the impact of nutritional status and income. While some authors [20] claim that the lack of evidence should not be attributed to the ineffectiveness of the interventions but to the methodological weaknesses of the studies that identify its impacts. Despite all, it seems that there is a tendency to overestimate the virtues of home gardens because they are associated with issues such as community participation, gender equity, and sustainability, which are popular in the political discourse [27,28,29]. Under these arguments, it is not possible to definitely conclude to what extent home gardens in urban agriculture contribute to improve access to food and also to enhance food security in low-income countries [5].
Notwithstanding the evidence provided, vegetable gardens have been promoted as an almost infallible alternative to help to resolve food insecurity, and particularly micronutrient deficiency in low-income families of both rural and urban areas. In this sense, Artmann and Sartison [30] identified that urban and peri-urban agriculture contributes to ten key societal challenges, among them are food security, public health, and economic growth. Of course, home gardens are considered among the private gardens as spaces of food production [31], which include both rural and urban settings. Thus, the promotion of home gardens has been actively held by the local and national governments, and international agencies such as FAO, UNDP, and NGOs. This situation occurs in Mexico, and home gardens were a federal government strategy applied to the so-called National Crusade against Hunger (Cruzada Nacional contra el Hambre, in Spanish; see CONEVAL [11] for a brief description and its evaluation). In this regard, during the implementation of this strategy, it was reported that “318,830 people have improved their quality of life with home gardens and there are 29 thousand 461 inhabitants with backyard animals and vegetables.”
Statements of this nature assume that the establishment of a vegetable garden will undoubtedly lead to the production of vegetables and all their benefits are assured. However, between the establishment and the production, different situations can happen, for example, climatic and phytosanitary events, the abandonment of the garden, or as some authors affirmed [32], the vegetables produced are not those of frequent consumption, which can reduce or impede their production. Following this, other problems faced by urban/rural agriculture are land management and governance, resource efficiency, public health, economic growth, actors and networks, among others [30,33]. Indeed, these topics encompass different sets of variables, which, at the same time, influence the performance of both urban and rural domestic production systems.
Under these considerations, this article addresses the policy of food production in urban and rural households, mainly small-scale vegetable production. This policy is seen as a strategy that supposedly contributes to the food security of the poor and allows access to a diverse diet, as well as increases income, reduces the dependence on the purchase of vegetables, empowers women by having more control over family income, and, moreover, increases the number and the amount of vegetables consumed [12,19,34,35].
Thus, in order to contribute to a more objective assessment of the effectiveness of the public policy that places food self-production as a crucial alternative to food insecurity of low-income families, we propose to answer two basic questions. First, to what extent do home gardens promoted by three different government programs persist? Second, what factors explain their permanence or abandonment? Although many investigations address this issue and provide some partial explanations [27,36,37,38,39], they were done from a one-sided perspective, but without a multivariate approach. Besides, the fact of considering more than one program in different rural and urban settings allows us to assess key topics that are barely attended by literature, among them: the permanence of gardens in both urban and rural areas; policies designed and implemented in different government spheres, with different levels of social participation and target population; different technological models; the degree of coherence and complementarity of policies. By doing this, we look for evidence of the factors that foster and constrain home garden projects in different rural and urban settings, in which the main driver of their promotion was more political than productive.

2. Theoretical Framework

Public policies are a set of public decisions that go through a process, which goes from the establishment of the problem to be solved to its treating and conversion into decisions of authority within the operation rules of the political system itself. Therefore, an essential part of this process is the formation of an agenda. Casar and Maldonado [40] affirm that there are three types of agenda: (1) the public, defined by the set of topics that different groups of the society seek to place; (2) the politic, composed of political actors whose resources, influences, and power allow them to have a preference in the debate and; (3) the constituted government, which pursues a set of priorities to materialize in its mandate.
One of the main questions in this regard is how a particular topic, issue, or matter becomes part of the government agenda? For Kingdon [41], public policies arise as a result of the convergence of a stream that identifies problems, one that analyzes and proposes alternative solutions, and another that prioritizes the political possibilities of an idea. The central assumption of this approach is that there is a higher probability of a policy to emerge when a problem is recognized; there are available solutions and a favorable political environment, i.e., when linkages between the problem, policies, and politics are achieved.
A situation is defined as a problem and has a higher chance of being included in the governmental agenda when it is believed that something must be done to change it. Thus, for Wildavsky [42], a public problem is something that can reasonably have a public solution to define, involving the balance between the undesired facts to remove (objectives) and the means that make it possible (resources). For the definition of a problem, indicators, focal events, and feedbacks are determinant [41]. The former shows that there is a situation that violates fundamental values of society and whose magnitude and dynamic deserve the attention of decision-makers. The purpose of the focal events is to draw the attention of certain situations, for which there must be an indicator consistent with the problem that corresponds with a preexisting perception or a combination of other similar events: a crisis, a natural disaster, a pandemic, and so on. And finally, decision-makers are informed of the situation through formal or informal feedbacks that they receive from evaluations of the functioning of existing programs.
Meanwhile, in the development of alternatives to tackle the problem identified, some ideas collide with others, creating combinations and re-combinations, some other options are discarded, or new ones appear, and sometimes they converge and provide a proposal of public policy. This process Kingdon [41] calls “primitive soup of public policy,” which corresponds with the incrementalist approach [43], in which political decisions are made and reshaped endlessly throughout a process of successive approximations [44,45]. Therefore, the alternatives that are considered for a decision are those with technical and economic feasibility, are consistent with the values of the members of the community, anticipate future restrictions, and have public acceptance and receptivity of politicians.
The opportunities for a topic to be positioned on the governmental agenda can be reinforced if the question is promoted by different actors, including the president and high-level officials, members of Congress, governors and officials, mass media, political party leaders, international and business organizations, and social leaders, among others, but is weakened if denied by them. Not all issues become public nor should all the public problems be objects of governmental action [46]. In this sense, under Kingdon’s [41] approach, the likelihood that a subject or issue will ascend to the government agenda can dramatically increase if the three elements (problems, policies, and politics) converge, which depends on the predictable or unpredictable opportunities that appear in the current of problems or the current of policy.
Regarding our research topic, food security, how has the problem been defined? What alternatives have been formulated? And what process has followed the current of policy, so it can be included in the government agenda?
A person who is food insecure is considered poor and is defined as someone who does not have enough to eat. No other situation related to the most disadvantaged receives as much public attention and collective generosity as the subject of hunger, and particularly when famines occur [18]. Therefore, it is not a coincidence that the fundamental assumption of policies towards the poor rest in the firm conviction that a priority is the availability and access of food. However, as Sen [47] (p. 8) points out, “The mesmerizing simplicity of focusing on the ratio of food to the population has persistently played an obscuring role over centuries, and continues to plague policy discussions today much as it has deranged anti-famine policies in the past.”
Since food is not distributed for free, its consumption and availability depend on the set of property rights, which are defined, among other things, by the resources and qualities that a person owns, i.e., his or her labor, land, and holdings are used directly to produce or sell. It is also related to the opportunities that markets offer to the labor force, the belongings and services that can be traded, and the prices and availability of food that can be bought with the money earned [47]. Therefore, if a group of people or a person has enough food to eat or if they are forced to starve, it will depend on the qualities or talents they possess and the conditions of production and exchange that persist, which altogether determine the rights. Thus, the total food offered is only one factor among many others that determinate the rights of people [48].
The consequences of mechanical associations of the insufficiency of food production to hunger have generated poor public policies that deal with this situation. Therefore, it is necessary not to perceive food production as the only determinant factor, while not underestimating its importance. At the same time, one should not misunderstand and automatically associate the “right to food” with other concepts such as food availability and production. Although food production is an essential component that impacts people’s food security, various factors are involved; one of them is income.
Thus, “it is increasingly accepted that the nutrition of the majority of poor families depends more on their income and health conditions than whether or not they produce staple foods” [49] (p. 18). What happens in a situation of economic growth: do more people ingest enough food with the necessary calories? This question is extensively explored by Deaton [50,51], reaching three main conclusions: 1. Economic growth can occur unevenly, which could increase the incomes of those who are not food insecure or hungry; 2. As incomes grow, people are more likely to spend a more significant proportion of their incomes on other goods, rather than food and; 3. When people have more income, they can consume more expensive calories, for example, by replacing cereals with meat.
In this sense, Banerjee and Duflo [18] affirm that evidence suggests that people in poverty do not eat as much as they could and do not seem to behave as if they were hungry. By exploring the relationship between income and expenditure on food, they found that food expenditure does not increase at the same rate as total expenditure growth. Also, the money spent on food is not expended so the number of calories or micronutrients is maximized (that is, better quality), but to buy tastier meals, which implies the obtaining of expensive calories.
Therefore, as long as the government agenda focuses on the obsessive idea that the problem is quantity rather than food quality, other alternatives that could be more promising and are waiting for an opportunity to enter the government agenda, e.g., nutritional supplements [15] and new nutritious crops [18], are ignored.
However, as Kingdon [41] points out, classifying a situation into one category rather than another can limit it to one kind of problem. Therefore, food insecurity and hunger, for example, can be classified as a food problem or as a problem of rights, and the remedy is dramatically affected by the category used. Thus, if Sen’s [47,48] perspective is accepted, the problem in question originates in the involuntary deprivation related to the inability to exercise the property rights, so policy alternatives should be significantly expanded in order that they consider the entirety of those rights.

3. Materials and Methods

3.1. Study Area and Description of Government Programs

The study was conducted in the State of Tlaxcala, Mexico, which presents homogeneity in its climate, as 99% of the territory is temperate sub-humid [52]. In the year 2014, 58.9% of its population was in poverty and 24% had no access to food [11]. This meant that its population was more impoverished and in more food insecurity than the national average. In fact, Tlaxcala is among the poorest states in Mexico. Moreover, it was found during the development of the research that three different government programs operated simultaneously in the state, which meant that, although they had a common goal: to contribute to food security through the production of vegetables in the home, they presented differences that allowed us to valorize with greater detail the effectiveness of this type of intervention. They are briefly described below.
The Urban Agriculture (UA) program is financed and promoted by the Government of Tlaxcala since 2012. Its objective is to support families from urban and peri-urban localities to have access to the basic food basket and generate income from the home gardens.
The Special Program for Food Security (SPFS) aims to achieve food security through three actions: food production, malnutrition eradication, and income increase of people who are highly marginalized in rural localities. It is financed by the federal government and operated by each state, through Agencies of Rural Development that are constituted by a group of professionals that have the technical and methodological support of FAO.
The Integral Program for Rural Development (IPRD), in its component of Peri-urban Family Agriculture and Backyard (PFAB), started operating in 2014. Its objective is to contribute to food security by improving the diet of poor families located in rural, peri-urban, and urban localities.
In Table 1, the main similarities, differences, and the type of support given to the beneficiaries of the three programs are presented. The support provided by the programs was based mainly on the administrative follow-up to getting the home garden, installation of the gardens, technical advice, and some eventual training. It is important to note that the three programs were offered to families that were already part of cash transfers policies, which have extensive coverage in Mexico. In fact, 51%, 74%, and 73% of the beneficiaries of UA, SPFS, and PFAB, respectively, received cash from one of these policies.

3.2. Collection of Data and Variables of Interest

Since the three programs began operations in different years and their coverages are in different municipalities (see Table 1), it was necessary to use the list of beneficiaries to determine the sample size and achieve statistical representativeness in the study. Thus, an aleatory sample of the maximum variance proportions was performed, with 95% reliability and 10% accuracy. The sample size for each program is presented in Table 2; in total, 261 beneficiaries were sampled. Along with the determination of the sample size, the following criteria were considered:
  • The sample was distributed considering the percentage of home gardens installed each year by each program.
  • To have a representative number of municipalities and localities, the size of the population was used as a classification; the data were retrieved from INEGI [52]. Thus, and based on [53], the localities were classified into two categories: Urban–Peri-urban (>2500 inhabitants), and Rural (<2500 inhabitants). In Table 2, the percentage of the sample size regarding this variable is reported. From here on out, we refer to this variable as only Urban or Rural.
  • Also, the municipalities with the highest number of beneficiaries were selected; if fewer than nine beneficiaries were in a municipality, it was not chosen.
The information was collected with the beneficiaries through face-to-face field surveys and an in situ visit to the vegetable garden granted. In the field visits observations, measurements, photographic records of the condition of the home garden and its components were registered. The fieldwork was performed during July and December 2015 and in February and March 2016. This was done to observe the gardens in different seasons of the year.
Through the instruments and techniques of data collection, information on 75 variables was collected with different purposes: some were to characterize the beneficiaries, measure the status of the supports received, among others. Each variable was classified as Discrete (D), Continuous (C), and Dichotomous/Binary (B) to perform the respective statistical analyses and avoid errors of interpretation. All variables were classified into 12 categories; in Table 3, each variable is detailed.

3.3. Estimation of the Model that Explains the Permanence of the Home Gardens

A logistic regression model was used to identify the explanatory variables of the permanence of the vegetable gardens. Basically, each home garden was analyzed, considering whether it was operating or abandoned. Therefore, the status of the garden was considered a dichotomous variable (1/0).
The objective of this analysis was to discover the factors that influence the status of the home garden and, also, how much each factor affected this situation. In our case, a vegetable garden was considered as existing (1) when the production increased, decreased slightly or was maintained since the garden was installed. On the contrary, a garden was considered as abandoned (0) when the production had stopped, and it was corroborated during the visits. In this way, each visited beneficiary can be represented in a binary form as:
yi = 1, if the garden exists; 0, if the garden is abandoned.
With this definition, the expression of the logistic regression model that seeks to explain the factors that influence the status of the home gardens is generalized for k independent variables, according to the following equation [55]:
l n p q = α 0 + α 1 x 1 + α 2 x 2 + + α k x k = α 0 + α 1 X
where p represents the probability that the home garden exists and, q the probability that it is abandoned. Where the relation of both is p + q = 1. Therefore, q = 1 – p; based on the previous equation, it can be expressed that:
l n p p 1 = α 0 + α 1 X   p 1 p = e α 0 + α 1 X p = e α 0 + α 1 X 1 + e α 0 + α 1 X
Then, it is possible to calculate the probability of the binomial process for the different values of the vector X with the last expression if the coefficients α0 and α1 are known. It is also possible to estimate the change in probability (ΔP) for each of the changes in the observed variables (Δxi) while keeping the others as constants, that is, the marginal change of the observed variables (∂Pi/∂xi).
Before performing the logistic regression analysis, it was necessary to filter the variables. Of the 75 variables (see Table 3), 37 qualitative and 13 quantitative variables were selected, since they were present in both existing and abandoned home gardens. Afterwards, with the chosen variables, their means and standard deviations were estimated according to the status of the garden (existing or abandoned). For nominal variables, their frequencies were compared using the chi-square statistic. Meanwhile, for the quantitative variables, variance analysis was performed. Variables with statistically significant differences (p ≤ 0.1) between existing and abandoned gardens were selected and used in the study.
Furthermore, to avoid highly correlated variables within the model, a correlation analysis between variables was also performed. If two variables had a highly significant correlation (p ≤ 0.01), and its value was moderate (greater than 0.50), only one of them was introduced in the logistic regressions. To select which variable to introduce, we first based our decision on other references that assessed the factors that influence home gardening (see, for instance, [29,36,37]). Second, we chose that variable in which we had more interest; for example, the variables “Gender of the person who looks after the garden” and “Family participation” (see Table 3) were highly and positively correlated (0.913). In this case, we had more interest in the second variable to see how it influences in the permanence of the home gardens. Also, when one variable did not have any variation (for instance, it had a value of 0% or 100%), it was not included in the logistic regression of that program; for example, in Table 4, it is possible to see that the variable “Technical assistance always or regularly” was 100% in SPFS. Thus, different variables were used to analyze each program. This is shown with more detail in the results section.
In Table 4, the average and the standard deviation for the most important variables that were used in the logistic regressions are presented. These variables are shown depending on the existing and abandoned status of the home gardens.

3.4. Analysis of Existing Home Gardens

From the logistic model that explains the permanence of the home gardens, a complementary analysis was carried out, but only considering the existing gardens. The objective was to find different characteristics that could explain why some vegetable gardens were in better condition than others, and vice versa. To do so, a hierarchical cluster analysis was performed to group the gardens with similar conditions [55]. The squared Euclidean distance was used as a mean of dissimilarity and, as a grouping procedure, Ward’s method was applied to obtain groups with a minimum variance within them [56]. In order to perform the cluster analysis, four indicators derived from measurements and in situ observations of home gardens were used.
Two qualitative variables and two quantitative variables were evaluated (Table 5) to distinguish one vegetable garden from another. The first variable is the surface (m2) occupied to produce vegetables in the initial space. The second variable evaluates the conditions and usage of the components granted by the program. The third variable values the diversity of species; diseases and pests; the presence of medicinal, aromatic plants and ornamental flowers; soil status; the excessive presence of weeds and abandoned plants; and the health of the crops, which, as a whole, are essential to determine the performance and health of the garden. The fourth variable quantifies how many components, awarded by the programs, are being used.
It is worth mentioning that in the case of the program SPFS there was an atypical observation that distorted the analysis; therefore, as recommended by Pérez [55], the atypical observation was not included in the analysis, but afterwards, in a heuristic way, it was assigned to the conglomerate of higher similarity. The cutting height of the dendrogram was made depending on the similarity and dissimilarity between each group [57]. Basically, the cut was made where the hierarchical union from one group to another had a greater distance. To determine the differences between the formed clusters, an analysis of the 75 variables aforementioned (see Table 3) was performed. The analysis consisted of finding variables that were statistically different, for which chi-square tests and variance analysis were performed (see Table 3).

4. Results

4.1. Factors that Explain the Permanence of Home Gardens

Of the home gardens established by the three programs, UA, SPFS, and PFAB, only 53.4%, 49.4%, and 12.5%, respectively, remained in operation at the time of the visits, i.e., of the 261 gardens, only 100 (38.3%) were operating. Regarding the time that had elapsed since the establishment of the home gardens until the date of the field survey, an average of 1.4 years had passed for UA; for SPFS, 2.14 years; and PFAB, 2.0 years. So far, the elapsed time and the permanence of the garden seemed to have no relation.
Regarding the logistic regression models that explain the permanence of the vegetable gardens, the estimated coefficients of the parameters and the marginal effects of each variable are presented below. The results are summarized and presented by each program: UA (Table 6), SPFS (Table 7), and PFAB (Table 8). Regarding the significance, all three models were statistically significant (χ2 = p < 0.01), with a predictive power of 88.6%, 74.1%, and 95.5%, respectively.
As explained, for each program a procedure of filtering variables was followed to perform the analysis. In this sense, the logistic model for the UA program considered nine variables; SPFS, seven variables; and PFAB, five variables. This highlights the reason why each program was analyzed separately. However, when comparing the statistically more significant variables, they can be gathered into four characteristics that determine the permanence of home gardens, which are described below.
The first feature is the pleasure to cultivate. The verbal opinion was not the basis for evaluating this feature, but it was the status of the ornamental plants of the families, which were observed during the field visit. Thus, if the plants had better appearance and care, it would be more probable that the home gardens would persist. For example, in the home gardens of UA, was found that if ornamental plants were in good condition (see x8 in Table 6), there was 12.78 times more probability that the garden would continue. This characteristic was also present in SPFS (see x7 in Table 7) and PFAB (see x3 in Table 8), with probabilities of persisting of 6.1 and 924 times, respectively. Therefore, the likelihood of permanence would increase if families with this attribute were chosen.
The second feature is associated with home garden maintenance and family involvement. The obtained parameters indicated that family participation is essential, in UA the probability of permanence of the home garden increased 5.5 times (see x2 in Table 6), and in SPFS it was three times (see x1 in Table 7) if this condition occurred. This may be linked with the garden maintenance, which should not be a job performed by a single person or sex, which is usually female. If the maintenance was a family activity, according to UA and SPFS results, the marginal effect of this variable (probability of permanence) was 42% and 137%, respectively. Moreover, the number of family members proved to be significant for SPFS and PFAB; however, their effects were not the same. In SPFS, it had positive effects, and the probability of permanence increased 1.3 times (see x3 in Table 7). While in PFAB, the effect was negative, and the likelihood reduced 0.28 times (see x2 in Table 8). These results indicate the need for further research.
The third characteristic is the need to cultivate, which is associated with the variable of generating income for the family through the primary activity. In UA, it had a marginal effect of 1% (see x1 in Table 6); then, if the income from primary activity increased by 1%, the probability of permanence increased by 1%. This may be related to the fact that home gardening has the potential to be a buffering strategy for households where members perceive themselves to be in economic difficulties [58]. Also, the need to remain in the program to continue receiving support increases the probability of permanence; for example, with SPFS (see x4 in Table 7) it increased 54 times. This last aspect is consistent with findings reported by other authors that relate the need to remain in the program with the permanence and continuity of poultry projects [59,60]. However, the need to cultivate should not be confused with the need to stay in the program. In fact, this latter variable can be detrimental to the program’s continuity because, as mentioned, it generates an adverse incentive since the projects begin to disappear when they no longer receive support.
The fourth feature is related to the technological model; although this was only found in PFAB, it is worth mentioning because it was in this program where the lowest proportion of home gardens persisted. The obtained parameters suggest that the home gardens that continue are the ones with biointensive beds, increasing their probability of permanence by 235 times.
Other meaningful variables that are significant were found in the model of UA (see Table 6). The results indicate that the older the home garden project is, the higher the probability of abandonment. The marginal effect of this variable was almost 50% (see x4), i.e., if the lifetime of a garden increases by one year; its likelihood of persisting is reduced by 50%. This underlines the importance of not only considering asset endowment but also monitoring so that project inactivity can be avoided. The location of the home garden in an urban area is another interesting variable because the probability of being active increases 40 times when it is located in an urban locality (see x7). Still, interestingly, in PFAB there was the highest rate of abandoned gardens (see Table 4), and PFAB was an entirely urban program; this result calls for more research. This is also associated with the fact that compared to rural areas, in urban areas there are fewer possibilities for collection, production, knowledge, and consumption of edible fungi, insects, quelites, and plants (see for instance [61,62]). This situation is a characteristic feature of Mexican rural regions [54,61].

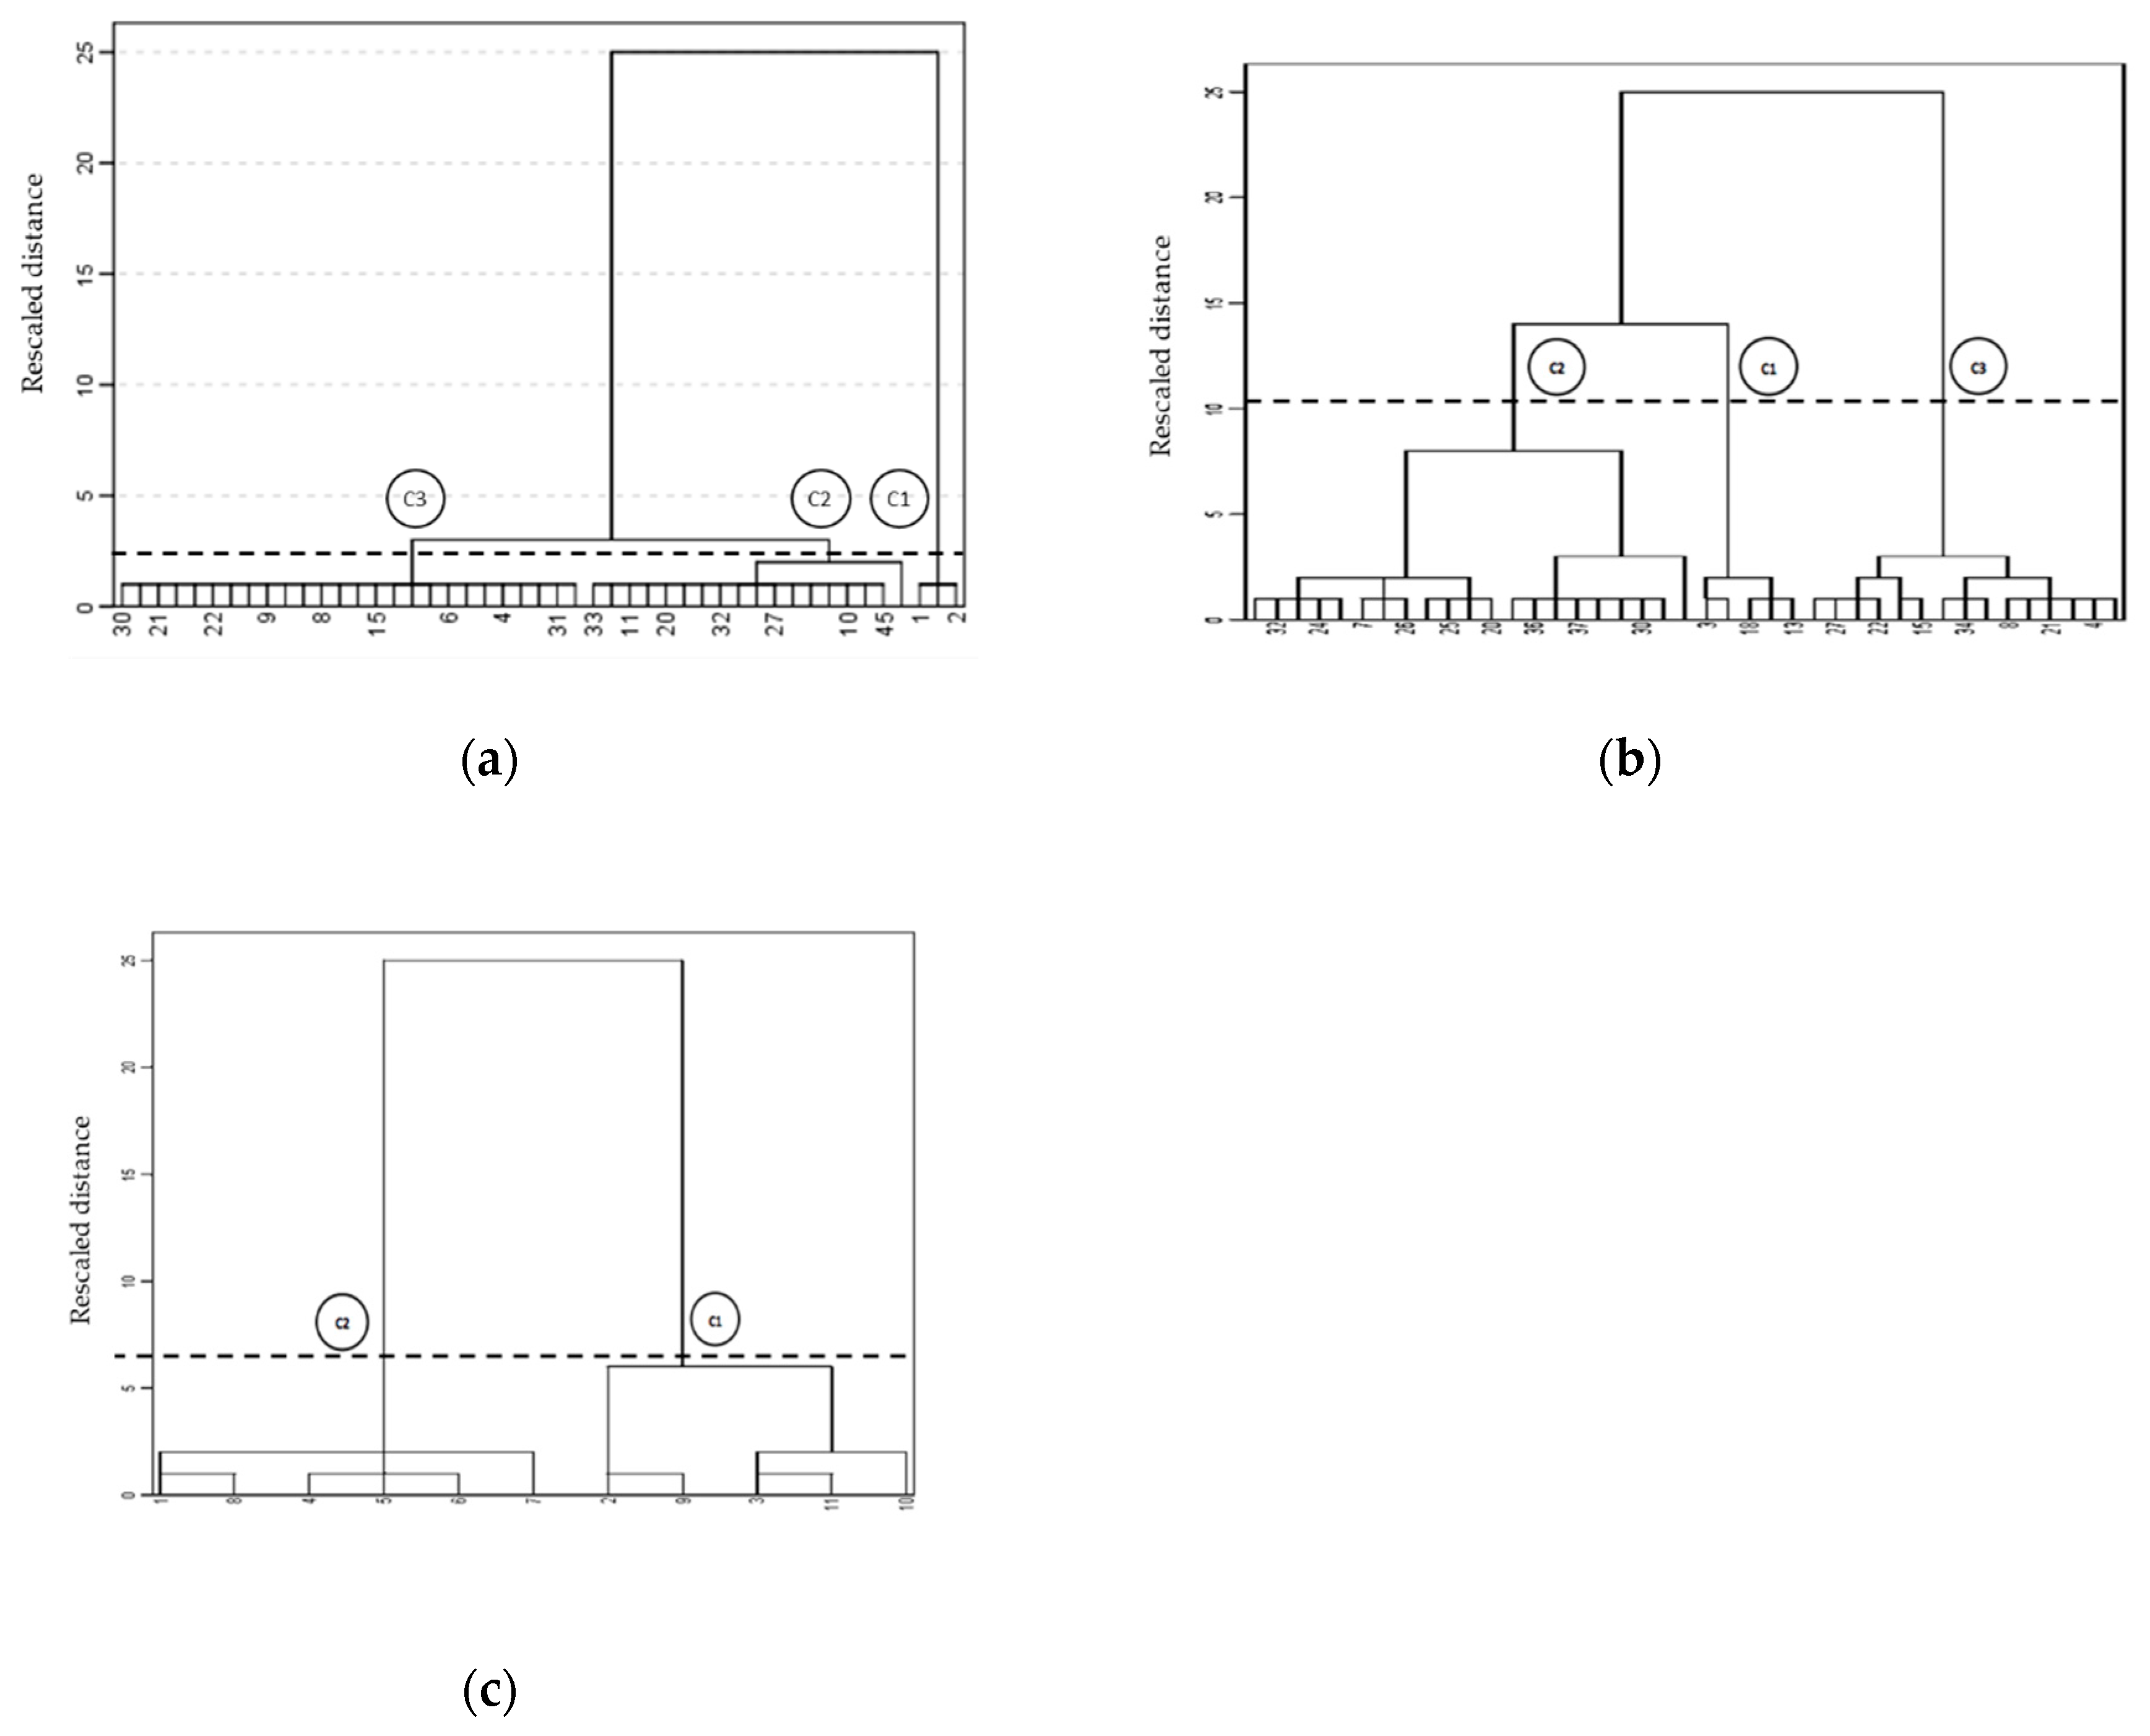
4.2. Differences Among Existing Home Gardens

The existing home gardens of each program were grouped through hierarchical cluster analysis to find variables that differentiated their status. We did this because, during the fieldwork, different levels of permanence were observed. Therefore, for the UA program (Figure 1a) and SPFS (Figure 1b) three groups were identified; but for PFAB (Figure 1c), there were only two groups.
The clustering of active home gardens by program (Figure 1) allowed an ordinal classification according to the main differences between groups that characterized their performance. Thus, home gardens with good performance and outstanding characteristics were discovered; therefore, they were named Good home gardens. This small group was found in both UA and SPFS, only three home gardens (7%) were in UA and six (14%) in SPFS; in PFAB, no gardens of this type were found. Other types of home gardens were classified as Regular home gardens because their conditions were not favorable; of these, 18 home gardens (38%) existed in UA, 21 (50%) in SPFS, and 5 (45%) in PFAB. Finally, Deficient home gardens were almost abandoned and barely producing; of these, 26 gardens (55%) were in UA, 15 (36%) in SPFS, and 6 (55%) in PFAB. The main differences between the groups of each program are mentioned in Table 9.
Based on the results of the three programs, PFAB had the worst performance since only 12.5% of their home gardens were active; besides, none of them was classified as a Good home gardens and more than half (55%) were Deficient home gardens. In contrast, 53% of the gardens of SPFS were still producing, from which 14% were Good home gardens, but a high proportion (50%) were Regular home gardens. Although UA had the highest permanence rate (53.4%), a high percentage was classified as Deficient home gardens (55%) and very few were Good home gardens (7%). These results suggest the importance of finding the means to improve the condition of the Regular home gardens and prevent the increase of Deficient home gardens in the near future.
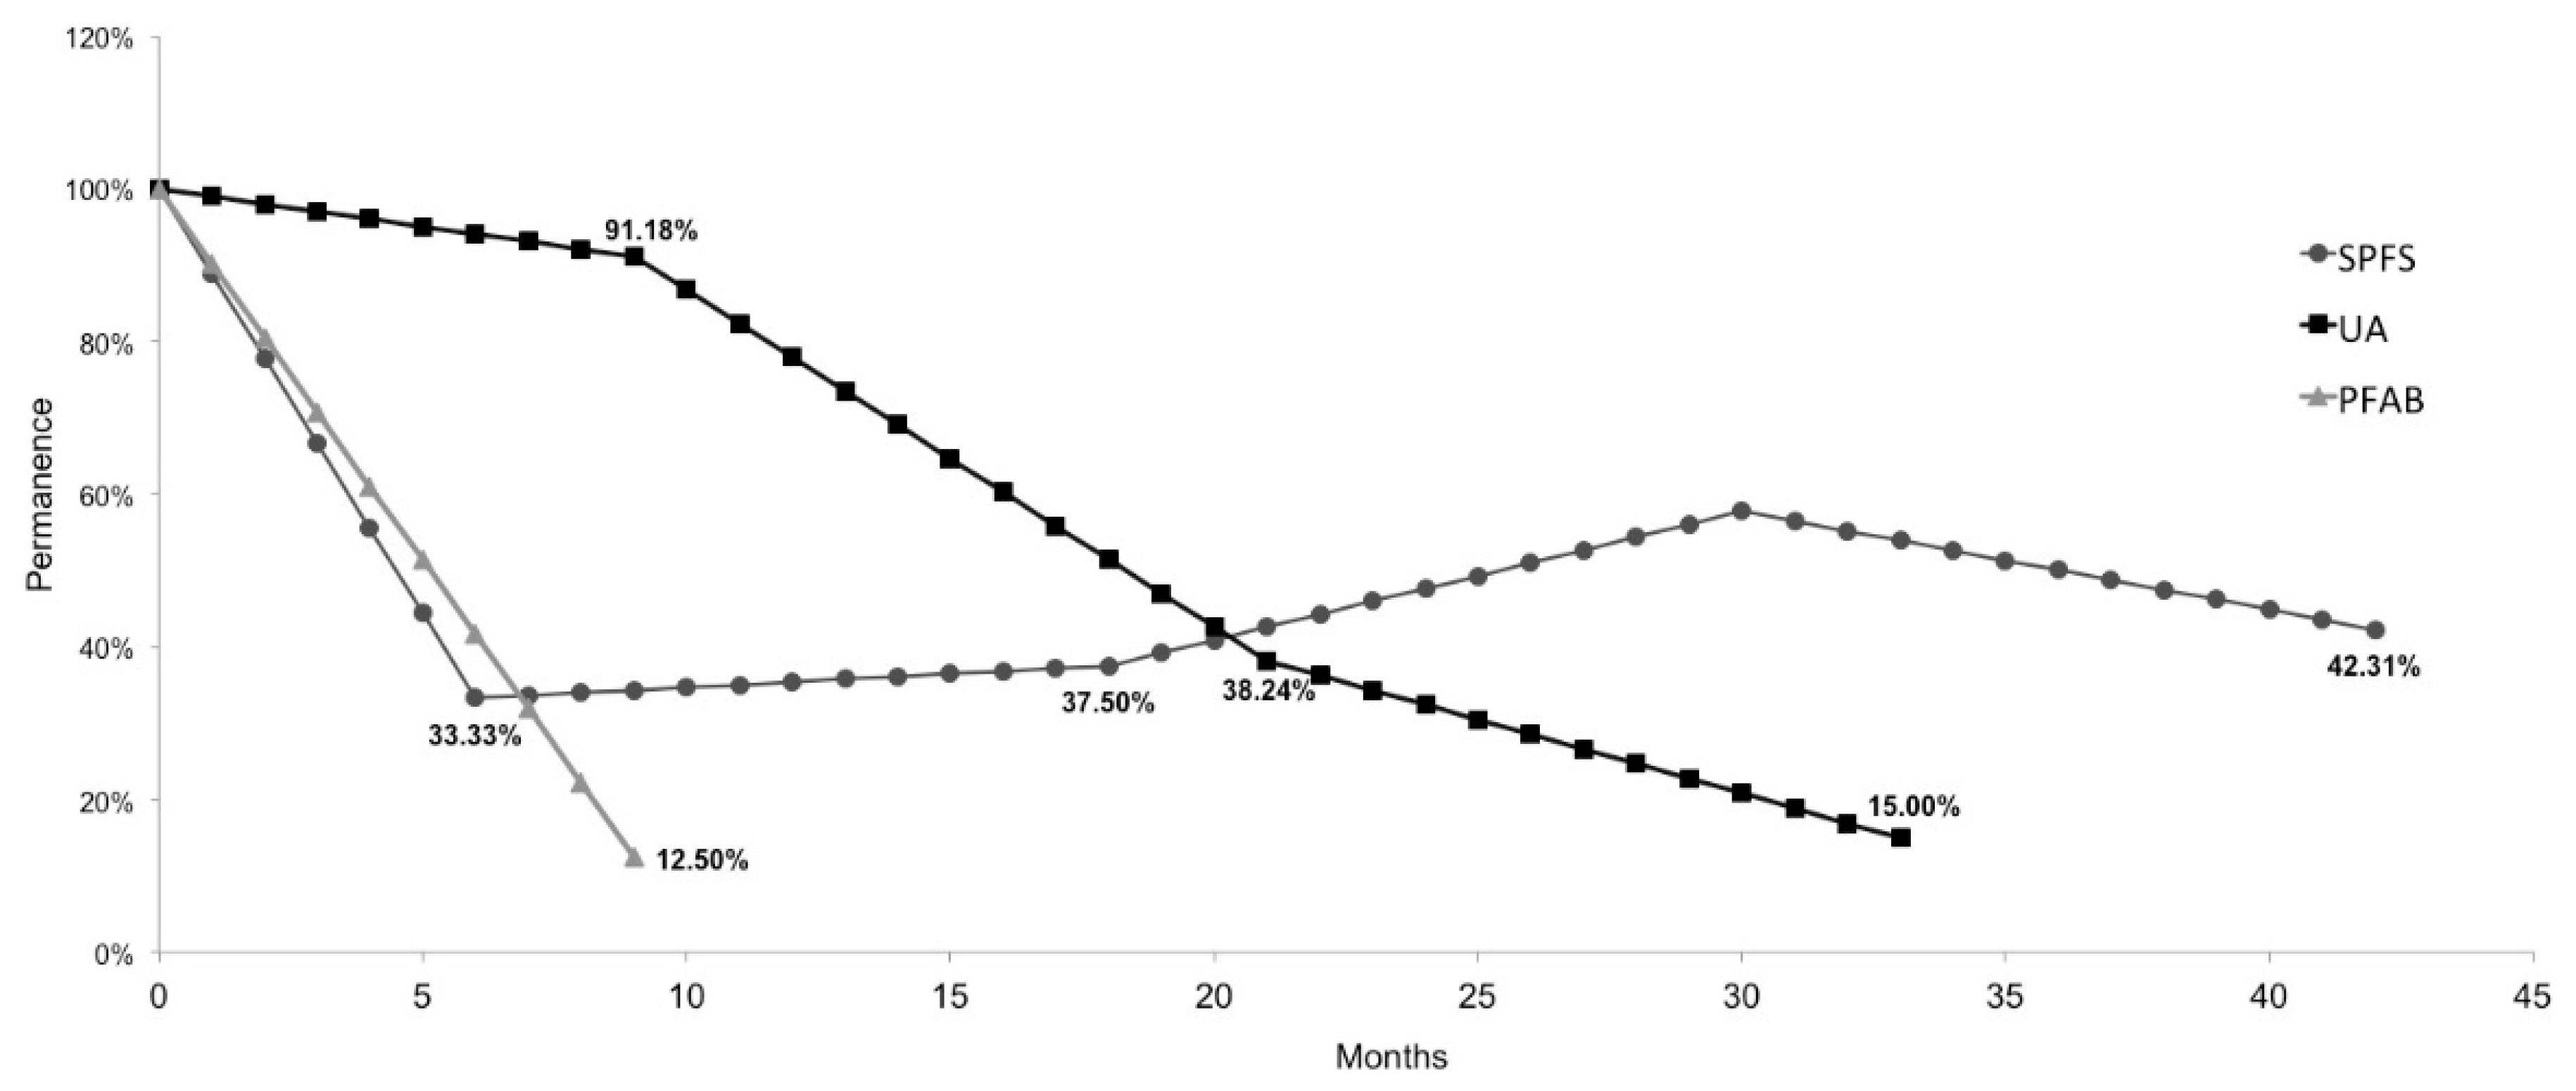
The previous idea was strengthened when the relationships between the percentage of permanence and the age of the home gardens were analyzed. This means the proportion of gardens that remained throughout the months of operation; we calculated, for each age of the gardens, what was the percentage of active gardens. Thus, the three programs started in the month zero of activity and with 100% of gardens functioning; however, the trend suggests (Figure 2) that, once the program’s intervention concluded or in the absence of promoters and technical advisors, most home gardens in regular and deficient categories (93% in UA, 86% in SFPS, and 100% PFAB) would be abandoned.
An additional factor that contributes to the abandonment of home gardens, and should be considered, is the incompatibility between the vegetables introduced by the programs and those consumed by families. This element was also observed by other authors [32], and in our study, it is also highlighted. Thus, of the total introduced vegetables, only 17% were of daily consumption. Vegetables such as chard (Beta vulgaris), broccoli (Brassica oleracea italica), cabbage (Brassica oleracea var. Capitata L.), carrot (Daucus carota), and spinach (Spinacia oleracea) were species contained within the “support seed package” of home gardens, but they are not traditionally consumed by families. However, the programs did not promote the consumption of 14 species of quelites that are usually consumed, two of which, quelite cenizo (Chenopodium album) and verdolaga (Portulaca oleracea), stand out as most consumed species. Quelites and verdolaga are edible plants that grow naturally, are part of the culinary culture, and are more abundant in micronutrients, vitamins, phytochemicals, and fiber [54,61,62,63].
With the previous results, we can state that these types of programs and implemented gardens do not reduce the purchase of vegetables and, therefore, the expenditure of families. Thus, by analyzing the expenditure of surveyed families, results show that less than 13% of families with active home gardens decreased their spending on vegetable purchases, and still spent more than USD 6 per week in vegetables. Only families with the best home gardens spent less than USD 6 per week on the acquisition of vegetables. Furthermore, it is worth mentioning that less than 31% of families from the three programs stated that they had problems accessing vegetables in good condition and quality before the start of the programs. For that reason, a large proportion of home gardens were abandoned, and those that kept producing were generally in a regular or poor situation, in terms of management and care. Therefore, it is recommended that vegetable gardens provide what families consume daily in order to reduce the expenditure of those products.
It was also found that the sale of vegetables in the local markets is not a variable that explains the permanence of the home gardens, because less than 14% of families mentioned this reason as an incentive to maintain the production. Only in the case of UA did the sale of vegetables appear to be a relevant motive to be interested in self-producing, but not to continue with the home garden production.

5. Discussion

By “opening the black box” of vegetable production in urban and rural households, of the three analyzed programs, two hard facts immediately emerged. First, of the 261 analyzed home gardens, only 100 (38.3%) were still working. The analysis of UA (see Table 6) provides evidence that urban home gardens have more probability of being in operation than rural gardens. But, interestingly, SPFS was a fully rural program, and the percentage of existing gardens was 49.4% (see Table 4). Moreover, PFAB was an entirely urban program and had the most significant rate of abandoned gardens (87.5%, see Table 4). Thus, these results show that other variables are affecting the performance of the home gardens besides urban/rural location. In this sense, the UA program provides a good starting point to consider that urban gardens can have more success than the rural ones. This does not imply that rural gardens should not be promoted, but it calls for considering other variables.
Second, no more than 7.5%, in the best of cases, of the home gardens originally established remained in production and good condition; the rest were abandoned or were in a regular or deficient state. However, based on the results, the trend indicates that in the short term, they could disappear. This argument is supported by findings of other authors [59,60], who show how the great majority of projects implemented in backyard livestock keep operating during the first 30 months of start-up, but only with the incentive of receiving more subsidies, and, despite that, they work with little or no economic benefit. The problem arose when the government intervention completed and the status of projects that do not operate had a drastic increase because there would be no more subsidy. This situation is expected to occur mainly in the SPFS program, where one of the key factors explaining the persistence of home gardens is the interest of families to stay in the program because of the provided aids (see Table 7); meanwhile, in UA the higher the age of the garden, the greater the probability of abandonment (see Table 6).
A finding of this nature confirms that public policies and debates about hunger or general malnutrition are often directed exclusively at difficulties in production, which can distort measures to confront and confuse the public. “There are many historical examples of the failure of public policies destined to solve these problems, arising from a misunderstanding of causes” [48] (p. 4).
The results support the argument that there is a tendency of assuming that the problem lies in the population lacking access to food and the solution is to guarantee access to food, either through cash transfers (as is already the case of more than 50% of the analyzed families) or through self-production. That is, it is assumed that the problem is explained by the difficulties of the poor to produce their food and that the means is to subsidize small projects to solve this problem.
But judging from the high proportion of abandoned home gardens and the deficient or regular status of those that keep producing only because of the incentive to receive more subsidies, one can think that government intervention is not coherent with a consistent definition of the public problem. Therefore, there is no logical connection and causal articulation between the definition of the problem, the policy instruments, and the expected solution. Thus, “when consistency in causal theory fails, intervention loses effectiveness because its implementation is based on false assumptions, in circumstances which, by not coinciding with reality, prevent the expected theory of change from being executed in accordance with the plan” [64] (p. 8).
Consequently, the proliferation of so many government programs that overlap as they focus on the same target populations, with the same instruments of public policy and for the same purpose, could be partially explained by what is called a “partial coupling” [41]: economic and political events (such as the increase in food prices and the manifestations of social discontent that derive from it) are met with proposals, but without the evidence that the problem is affecting so many people, as the results revealed in our research and in systematic reviews of various authors [20,21,22,23,24,25,26,27].
Therefore, the tendency to overestimate home food production as an alternative to food insecurity seems to be explained by tremendous public attention and generosity that is usually monopolized by the hunger issue, as mentioned previously [18], as well as the excessive promotion of urban and family agriculture in both literature [30] and the development agenda [29]. Besides, for a political context such as the Mexican, home gardens become very popular because they can channel small amounts of public resources (USD 197–392 per family) and reach broad population coverage. In this way, we agree with Dixit and Londregan [65] in the sense that it is common for citizens, especially those in poverty, to renounce de facto their political rights in exchange for obtaining goods that they consider valuable in the short term, but which do not fundamentally resolve their precarious socioeconomic condition.
With these arguments we are not suggesting the abandonment of public food security policies that focus on food production in the household. In any case, however, emphasis should be placed on ensuring that the political and governmental agendas set food production in the right place, not as the sole determining factor, but without incurring the opposite vision of thinking that it has no importance at all [48]. In fact, evidence provided by other studies indicates that children have a better nutritional status when farming is practiced at home, compared to when all food is purchased [66,67,68,69]. Obtaining fresh or healthy food is one of the primary reasons for producing food at home [70]. This does not mean that all households suffering from lack of access to food must be part of the target population of public policy based on the so-called agricultural interventions. Other relevant variables that are associated with the permanence of the implemented projects should be considered, and this research contributes to the identification of some of them. This reinforces our earlier argument that the performance of home gardens is not only affected by urban/rural location. In this way our paper contributes to showing that variables behave differently in different contexts (political, societal, economic, and cultural). At the same time, this calls for more complex or systemic approaches to exploring and understanding the topic of home gardens.
Finally, we agree that interventions should have a multidimensional approach [71] that identifies the population, culture, habits, potential, needs and resources (knowledge, natural, technical, technological, among others) to formulate policies aligned to the reality of each segment of families. This transcends the institutional arrangement that usually prevails at the moment of facing the problem, since on one side, the programs of monetary transfers are designed and implemented, at the same time on the other side, those of education and training, those of health, of credit and insurance, and for the promotion of production and generation of income.

6. Conclusions

This article sought to provide evidence to solve two fundamental issues about the permanence of the home garden impulse by different government programs and the factors that explain their persistence or abandonment. In this sense, the evidence suggests that the production of vegetables in the household is a viable alternative only for a small group of rural and urban low-income families whose proportion does not exceed 10% of the population traditionally benefited. Therefore, for good intentions (which usually characterize public policies for food security) not to lead to poor results, it is recommended focusing on beneficiaries with outstanding variables that can be easily identified before making them recipients of programs such as those analyzed. In this sense, this paper provides useful insights by showing that different variables should be considered for designing and implementing home gardens projects in both urban and rural agricultural settings. By comparing three programs, we showed that urban gardens have more probability of surviving. Still, this result is not conclusive, since one entirely urban program had more abandoned gardens than the other two programs. This implies that other variables influence the performance of the gardens.
Among these variables and depending on where urban/rural home gardens stand: at home, they should have ornamental plants in good conditions, which denotes the pleasure of cultivating; the participation of all members of the family should be assured; there should be a real need to grow their own food (i.e., unemployment, physical incapacity, women in charge of the family, and so forth); the type of technological model to be implemented should be considered, since the availability of space, soil, and water is vital. Once the intervention is focused, the technical assistance and support for the proper use of the awarded components are factors that must be taken care of, to ensure that projects will last and be in good condition, which can lead to the scaling of production units.
While these measures would contribute to avoiding the waste of public resources, they would only benefit less than a one-tenth of the population that lacks access to food because the majority of the population would be excluded by virtue of the nature of this policy, although it would probably be focused on the most impoverished people. Therefore, in line with other authors [19,48,71], we believe that this paper provides new knowledge that contributes to the debate about the necessity to recognize the multidimensional nature of the problem, accepting that food insecurity originates in involuntary deprivation related to the inability to exercise property rights in a broad sense.
In addition to the necessary linkage of the three elements suggested by Kingdon [41] (problems, policies, and politics) one more should be added that is related to the innovation of the institutional arrangement. In this way the design, implementation, and evaluation of a policy of food security can be possible in a coordinated way that also integrates the different components now dispersed in multiple ministries.
Finally, a limitation of our research is the temporality of the data that underlie the analysis. While evidence suggests a drastic growth in abandoned home gardens once external intervention ceases, it would be highly desirable to conduct other research after a few years to verify the state of the gardens that during field survey were found in regular or deficient status. Thus, the hypothesis of abandonment of the project because the beneficiaries no longer have the incentive to maintain the garden can be corroborated.

Author Contributions

Conceptualization, M.M.-R., C.F.-G. and M.V.G.-S.; methodology, M.M.-R., N.A.-G. and C.F.-G.; data collection, C.F.-G., M.V.G.-S. and M.M.-R.; validation, M.M.-R. and C.F.-G.; formal analysis, C.F.-G. and N.A.-G.; writing—original draft preparation, M.M.-R., C.F.-G., N.A.-G. and M.V.G.-S.; writing—review and editing, N.A.-G., C.F.-G. and M.M.-R.; supervision, M.M.-R. All authors have read and agreed to the published version of the manuscript.

Conflicts of Interest

The authors declare no conflict of interest.

References

  1. FAO. Seguridad Alimentaria; Food and Agriculture Organization of the United Nations: Rome, Italy, 2006. [Google Scholar]
  2. Chávez Zúñiga, M.C.; Madrigal Fritsch, H.; Villa, A.R.; Guarneros Soto, N. Alta prevalencia de desnutrición en la población infantil indígena Mexicana. Encuesta Nacional de Nutrición 1999. Rev. Esp. Salud Publ. 2003, 77, 245–255. [Google Scholar]
  3. Jha, M.K. Food security in perspective: The significance of social action. Community Dev. J. 2009, 44, 351–366. [Google Scholar] [CrossRef]
  4. Ratcliffe, C.; McKernan, S.-M.; Zhang, S. How much does the supplemental nutrition assistance program reduce food insecurity? Am. J. Agric. Econ. 2011, 93, 1082–1098. [Google Scholar] [CrossRef] [PubMed] [Green Version]
  5. Palar, K.; Lemus Hufstedler, E.; Hernandez, K.; Chang, A.; Ferguson, L.; Lozano, R.; Weiser, S.D. Nutrition and health improvements after participation in an urban home garden program. J. Nutr. Educ. Behav. 2019, 51, 1037–1046. [Google Scholar] [CrossRef] [Green Version]
  6. D’Souza, A.; Jolliffe, D. Food insecurity in vulnerable populations: Coping with food price shocks in Afghanistan. Am. J. Agric. Econ. 2014, 96, 790–812. [Google Scholar] [CrossRef] [Green Version]
  7. Gulliford, M.C.; Mahabir, D.; Rocke, B. Food insecurity, food choices, and body mass index in adults: Nutrition transition in Trinidad and Tobago. Int. J. Epidemiol. 2003, 32, 508–516. [Google Scholar] [CrossRef] [PubMed] [Green Version]
  8. Ortiz-Andrellucchi, A.; Peña-Quintana, L.; Saavedra-Santana, P.; Albino-Beñacar, A.; Monckeberg-Barros, F.; Serra-Majem, L. Facing malnutrition and poverty: Evaluating the CONIN experience. Nutr. Rev. 2009, 67, 47–55. [Google Scholar] [CrossRef] [PubMed]
  9. Yu, S.; Hannum, E. Food for thought: Poverty, family nutritional environment, and children’s educational performance in rural China. Sociol. Perspect. 2007, 50, 53–77. [Google Scholar] [CrossRef]
  10. FAO; FIDA; PMA. El Estado de la Inseguridad Alimentaria en el Mundo 2014. In Fortalecimiento de un Entorno Favorable Para la Seguridad Alimentaria y la Nutrición; Organización de las Naciones Unidas para la Alimentación y la Agricultura: Roma, Italy, 2014; ISBN 9789253069279. [Google Scholar]
  11. CONEVAL. Informe de Evaluación de la Política de Desarrollo Social en México 2014; Consejo Nacional de Evaluación de la Política de Desarrollo Social: Mexico City, Mexico, 2015; ISBN 978-607-9382-03-8. [Google Scholar]
  12. Maxwell, D.G. Alternative food security strategy: A household analysis of urban agriculture in Kampala. World Dev. 1995, 23, 1669–1681. [Google Scholar] [CrossRef]
  13. Mykerezi, E.; Mills, B. The impact of food stamp program participation on household food insecurity. Am. J. Agric. Econ. 2010, 92, 1379–1391. [Google Scholar] [CrossRef] [Green Version]
  14. Yen, S.T.; Andrews, M.; Chen, Z.; Eastwood, D.B. Food stamp program participation and food insecurity: An instrumental variables approach. Am. J. Agric. Econ. 2008, 90, 117–132. [Google Scholar] [CrossRef]
  15. González de Cossio, T.; López Acevedo, G.; Rivera Dommarco, J.; Rubio Soto, G.M. Nutrición y Pobreza: Política Pública Basada en Evidencia; Banco Mundial, SEDESOL: Mexico City, Mexico, 2008. [Google Scholar]
  16. Mayes, S.; Massawe, F.J.; Alderson, P.G.; Roberts, J.A.; Azam-Ali, S.N.; Hermann, M. The potential for underutilized crops to improve security of food production. J. Exp. Bot. 2012, 63, 1075–1079. [Google Scholar] [CrossRef] [Green Version]
  17. King, C.G. International nutrition programs. Science 1965, 147, 25–29. [Google Scholar] [CrossRef] [PubMed]
  18. Banerjee, A.V.; Duflo, E. Repensar la Pobreza: Un Giro Radical en la Lucha Contra la Desigualdad Global; Taurus: Bogotá, Colombia, 2012. [Google Scholar]
  19. Tweeten, L. The economics of global food security. Rev. Agric. Econ. 1999, 21, 473–488. [Google Scholar] [CrossRef]
  20. Masset, E.; Haddad, L.; Cornelius, A.; Isaza-Castro, J. A Systematic Review of Agricultural Interventions That Aim to Improve Nutritional Status of Children; EPPI-Centre, Social Science Research Unit, Institute of Education, University of London: London, UK, 2011; Volume 344, ISBN 9781907345098. [Google Scholar]
  21. Berti, P.R.; Krasevec, J.; FitzGerald, S. A review of the effectiveness of agriculture interventions in improving nutrition outcomes. Pub. Health Nutr. 2004, 7, 599–609. [Google Scholar] [CrossRef] [PubMed] [Green Version]
  22. Girard, A.W.; Self, J.L.; McAuliffe, C.; Olude, O. The effects of household food production strategies on the health and nutrition outcomes of women and young children: A systematic review. Paediatr. Perinat. Epidemiol. 2012, 26, 205–222. [Google Scholar] [CrossRef] [PubMed]
  23. Kawarazuka, N. The Contribution of Fish Intake, Aquaculture, and Small-Scale Fisheries to Improving Food and Nutrition Security: A Literature Review; The WorldFish Center: Penang, Malaysia, 2010. [Google Scholar]
  24. Leroy, J.L.; Frongillo, E.A. Can interventions to promote animal production ameliorate undernutrition? J. Nutr. 2007, 137, 2311–2316. [Google Scholar] [CrossRef] [PubMed]
  25. Ruel, M.T. Can Food-Based Strategies Held Reduce Vitamin A And Iron Deficiencies? A Review of Recent Evidence; International Food Policy Research Institute (IFPRI): Washington, DC, USA, 2001. [Google Scholar]
  26. The World Bank. From Agriculture to Nutrition: Pathways, Synergies, and Outcomes; The World Bank: Washington, DC, USA, 2007. [Google Scholar]
  27. Warren, E.; Hawkesworth, S.; Knai, C. Investigating the association between urban agriculture and food security, dietary diversity, and nutritional status: A systematic literature review. Food Policy 2015, 53, 54–66. [Google Scholar] [CrossRef]
  28. Ellis, F.; Sumberg, J. Food production, urban areas and policy responses. World Dev. 1998, 26, 213–225. [Google Scholar] [CrossRef]
  29. Zezza, A.; Tasciotti, L. Urban agriculture, poverty, and food security: Empirical evidence from a sample of developing countries. Food Policy 2010, 35, 265–273. [Google Scholar] [CrossRef]
  30. Artmann, M.; Sartison, K. The role of urban agriculture as a nature-based solution: A review for developing a systemic assessment framework. Sustainability 2018, 10, 1937. [Google Scholar] [CrossRef] [Green Version]
  31. Lin, B.B.; Philpott, S.M.; Jha, S. The future of urban agriculture and biodiversity-ecosystem services: Challenges and next steps. Basic Appl. Ecol. 2015, 16, 189–201. [Google Scholar] [CrossRef]
  32. Brun, T.; Reynaud, J.; Chevassus-Agnes, S. Food and nutritional impact of one home garden project in Senegal. Ecol. Food Nutr. 1989, 23, 91–108. [Google Scholar] [CrossRef]
  33. Diehl, J.A. Growing for Sydney: Exploring the urban food system through farmers’ social networks. Sustainability 2020, 12, 3346. [Google Scholar] [CrossRef] [Green Version]
  34. Birol, E.; Bela, G.; Smale, M. The role of home gardens in promoting multi-functional agriculture in Hungary. EuroChoices 2005, 4, 14–21. [Google Scholar] [CrossRef]
  35. Olney, D.K.; Talukder, A.; Iannotti, L.L.; Ruel, M.T.; Quinn, V. Assessing impact and impact pathways of a homestead food production program on household and child nutrition in Cambodia. Food Nutr. Bull. 2009, 30, 355–369. [Google Scholar] [CrossRef] [Green Version]
  36. Altieri, M.A.; Companioni, N.; Cañizares, K.; Murphy, C.; Rosset, P.; Bourque, M.; Nicholls, C.I. The greening of the “barrios”: Urban agriculture for food security in Cuba. Agric. Hum. Values 1999, 16, 131–140. [Google Scholar] [CrossRef]
  37. Crush, J.; Hovorka, A.; Tevera, D. Food security in Southern African cities: The place of urban agriculture. Prog. Dev. Stud. 2011, 11, 285–305. [Google Scholar] [CrossRef] [Green Version]
  38. Holmer, R.J.; Drescher, A.W. Empowering urban poor communities through integrated vegetable production in allotment gardens: The case of Cagayan de Oro city, Philippines. Available online: http://citeseerx.ist.psu.edu/viewdoc/download?doi=10.1.1.471.8237&rep=rep1&type=pdf (accessed on 21 May 2020).
  39. Thaman, R.R. Urban food gardening in the Pacific Islands: A basis for food security in rapidly urbanising small-island states. Habitat Int. 1995, 19, 209–224. [Google Scholar] [CrossRef]
  40. Casar, M.A.; Maldonado, C. Formación de agenda y procesos de toma de decisiones. Una aproximación desde la ciencia política. In Problemas, Decisiones y Soluciones: Enfoques de Política Pública; Merino, M., Cejudo, G.M., Eds.; Fondo de Cultura Económica. Centro de Investigación y Docencia Económicas: Mexico City, Mexico, 2010; pp. 207–235. [Google Scholar]
  41. Kingdon, J.W. Agendas, Alternatives and Public Policies; Little, Brown and Company: Boston, MA, USA, 1995. [Google Scholar]
  42. Wildavsky, A.B. Speaking Truth to Power: The Art and Craft of Policy Analysis; Little, Brown and Company: Boston, MA, USA, 1989. [Google Scholar]
  43. Lindblom, C.E. The Science of “Muddling Through”. Pub. Adm. Rev. 1959, 19, 79–88. [Google Scholar] [CrossRef]
  44. Gladwell, M. Outliers: The Story of Success; Little, Brown and Company: New York, NY, USA, 2008; ISBN 0316040347. [Google Scholar]
  45. Simon, H.A. The Sciences of the Artificial, 3rd ed.; MIT Press: Cambridge, MA, USA, 1996; ISBN 0262264498. [Google Scholar]
  46. Aguilar, L.F. El Estudio de Las Políticas Públicas; Miguel Ángel Porrúa: Mexico City, Mexico, 1995; Volume 1. [Google Scholar]
  47. Sen, A. Poverty and Famines: An Essay on Entitlement and Deprivation; Oxford University Press: New York, NY, USA, 1981. [Google Scholar]
  48. Sen, A. Why is There so Much Hunger in the World? Food and Agriculture Organization of the United Nations: Rome, Italy, 2013. [Google Scholar]
  49. FAO. Políticas de Desarrollo Agrícola: Conceptos y Principios; Organización de las Naciones Unidas para la Agricultura y la Alimentación: Roma, Italy, 2004; ISBN 9253052074. [Google Scholar]
  50. Deaton, A. Health, inequality, and economic development. J. Econ. Lit. 2003, 41, 113–158. [Google Scholar] [CrossRef]
  51. Deaton, A. Measuring poverty in a growing world (or measuring growth in a poor world). Rev. Econ. Stat. 2005, 87, 1–19. [Google Scholar] [CrossRef] [Green Version]
  52. INEGI. Mexico en Cifras. Available online: http://www.inegi.org.mx/app/areasgeograficas/?ag=29 (accessed on 29 June 2016).
  53. OECD. Estudios de Politica Rural: Mexico; Organización para la Cooperación y el Desarrollo Económicos: Paris, France, 2007; ISBN 9789264011526. [Google Scholar]
  54. Bye, R.; Linares, E. Los quelites, plantas comestibles de Mexico. Una reflexión sobre intercambio cultural. Biodiversitas 2000, 31, 11–14. [Google Scholar]
  55. Pérez López, C. Técnicas de Análisis Multivariante de Datos; Pearson Educación, S.A.: Madrid, Spain, 2004; ISBN 978-84-205-4104-4. [Google Scholar]
  56. Ward, J.H.J. Hierarchical grouping to optimize an objective function. J. Am. Stat. Assoc. 1963, 58, 236–244. [Google Scholar] [CrossRef]
  57. Núñez-Colín, C.A.; Escobedo-López, D. Uso correcto del análisis clúster en la caracterización de germoplasma vegetal. Agron. Mesoam. 2011, 22, 415–427. [Google Scholar] [CrossRef] [Green Version]
  58. Schupp, J.L.; Sharp, J.S. Exploring the social bases of home gardening. Agric. Hum. Values 2012, 29, 93–105. [Google Scholar] [CrossRef]
  59. Cruz-Sánchez, B.; Muñoz-Rodríguez, M.; Santoyo-Cortés, V.H.; Martínez-González, E.G.; Aguilar-Gallegos, N. Potencial y restricciones de la avicultura de traspatio sobre la seguridad alimentaria en Guerrero, Mexico. Agric. Soc. Desarro. 2016, 13, 257–275. [Google Scholar] [CrossRef] [Green Version]
  60. Martínez-González, E.G.; Muñoz-Rodríguez, M.; Santoyo-Cortes, V.H.; Gómez-Pérez, D.; Altamirano-Cárdenas, J.R. Lecciones de la promoción de proyectos caprinos a través del programa estratégico de seguridad alimentaria en Guerrero, Mexico. Agric. Soc. Desarro. 2013, 10, 177–193. [Google Scholar]
  61. Vieyra-Odilon, L.; Vibrans, H. Weeds as crops: The value of maize field weeds in the valley of Toluca, Mexico. Econ. Bot. 2001, 55, 426–443. [Google Scholar] [CrossRef]
  62. Ju, Y.; Zhuo, J.; Liu, B.; Long, C. Eating from the wild: Diversity of wild edible plants used by Tibetans in Shangri-la region, Yunnan, China. J. Ethnobiol. Ethnomed. 2013, 9. [Google Scholar] [CrossRef] [Green Version]
  63. Odhav, B.; Beekrum, S.; Akula, U.; Baijnath, H. Preliminary assessment of nutritional value of traditional leafy vegetables in KwaZulu-Natal, South Africa. J. Food Compos. Anal. 2007, 20, 430–435. [Google Scholar] [CrossRef]
  64. Cejudo, G.M.; Michel, C.L. Coherencia y políticas públicas. Metas, instrumentos y poblaciones objetivo. Gestión Política Pública 2016, 25, 3–31. [Google Scholar]
  65. Dixit, A.; Londregan, J. Redistributive politics and economic efficiency. Am. Polit. Sci. Rev. 1995, 89, 856–866. [Google Scholar] [CrossRef]
  66. Carletto, G.; Ruel, M.; Winters, P.; Zezza, A. Farm-Level pathways to improved nutritional status: Introduction to the special issue. J. Dev. Stud. 2015, 51, 945–957. [Google Scholar] [CrossRef] [Green Version]
  67. Hoddinott, J.; Headey, D.; Dereje, M. Cows, missing milk markets, and nutrition in rural Ethiopia. J. Dev. Stud. 2015, 51, 958–975. [Google Scholar] [CrossRef] [Green Version]
  68. Quandt, S.A.; Popyach, J.B.; DeWalt, K.M. Home gardening and food preservation practices of the elderly in rural Kentucky. Ecol. Food Nutr. 1994, 31, 183–199. [Google Scholar] [CrossRef]
  69. Slavchevska, V. Agricultural production and the nutritional status of family members in Tanzania. J. Dev. Stud. 2015, 51, 1016–1033. [Google Scholar] [CrossRef]
  70. Jehlička, P.; Daněk, P.; Vávra, J. Rethinking resilience: Home gardening, food sharing and everyday resistance. Can. J. Dev. Stud. 2019, 40, 511–527. [Google Scholar] [CrossRef]
  71. Banerjee, A.; Duflo, E.; Goldberg, N.; Karlan, D.; Osei, R.; Pariente, W.; Shapiro, J.; Thuysbaert, B.; Udry, C. A multifaceted program causes lasting progress for the very poor: Evidence from six countries. Science 2015, 348, 1260799. [Google Scholar] [CrossRef] [Green Version]
Figure 1. Dendrograms obtained from the cluster analysis of active home gardens of each program, through squared Euclidean distance and Ward grouping method. (a) UA Program (47 home gardens); (b) SPFS Program (42 home gardens); (c) PFAB Program (11 home gardens).
Sustainability 12 04316 g001
Figure 2. Relationship between age (months) and percentage of the permanence of the home gardens.
Sustainability 12 04316 g002
Table 1. Characteristics of the analyzed programs.
CharacteristicUrban Agriculture (UA)Special Program for Food Security (SPFS)Peri-urban Family Agriculture and Backyard (PFAB)
Coverage of the program48 rural, urban and peri-urban municipalities.21 rural municipalities.One urban municipality.
Target populationSingle mothers, elders, widows and handicap.Highly marginalized people.Women and older adults, with lack of access to food, service and housing.
Population benefitedWomen (81%), Men (19%)Women (85%), Men (15%)Women (98%), Men (2%)
Activities supportedProduction of vegetables.Production of vegetables, poultry, fruits and corn.Production of vegetables and poultry.
Size of vegetable garden30–100 m2 or 100 bags3–36 m230 m2 or 148 m2
Technological modelsPot (12%)Micro-tunnel (8%)Vertical garden (69%)
Biointensive beds (88%)Biointensive beds (92%)Biointensive beds (31%)
Involvement of the family in the installation of the vegetable gardenInstallation by suppliersParticipatory process: learning–doingParticipatory process
Technical accompaniment timeTwo yearsFive yearsOne year
Origin of resourcesState governmentFederal governmentFederal government
Requirements to receive supportsLocated in an urban area; access to water, space, and enough sunlight; interest and willingness to work.Time, water, space, and interest. Time, water, and interest
Components of the supportWater tank (450 L), shade mesh, drip irrigation system, plastic mulch or pots, chicken fence, a kit of seeds, germination tray, compost and seedling (1st cycle).Ferrocement water tank (5000 L) or plastic water tank (450 L), shade mesh, drip irrigation system, plastic mulch, chicken fence, a kit of seeds and germination tray. Micro tunnel: structure with all the components mentioned.Water tank (450 L), drip irrigation system, plastic mulch, chicken fence, a kit of seeds, germination tray, fumigated backpack. Vertical garden: 4 PVC tubes of 4 inches x 1.5 m with all the components mentioned.
Cost of technology packageUSD 197–246USD 246–295USD 172–392
Table 2. Sample size, beneficiary population, and year of operation of each program.
ProgramPeriod of OperationBeneficiariesSample SizeUrban Locality
UA2012–20149518836.36%
SPFS2012–2015723850.00%
PFAB2014101388100.00%
Table 3. Categories of analysis and variables.
CategoryVariables and Type (D: Discrete, C: Continuous, B: Dichotomous/Binary)
FamilyFamily with or without children (B); Economic activity, percentage of income from Primary, Secondary and Tertiary activities (three different variables, all are D); Single parent or extended family (B); Vulnerable groups (B); Number of family members (D).
LocalizationType of locality (OECD classification [53]) (B); Home garden sited next to the house (B).
Characteristics of the vegetable gardenGender of the person who looks after the garden (B); Family participation (B); Technical assistance received (B); Species planted (D); Objective of the production (B); Age of the garden (D); Technological model (B); Initial and actual surface (C); Management of the garden, own or others (B); Species of vegetables that are part of daily consumption (C) and; How much of these are produced (C).
Inputs for productionDifficulty in obtaining inputs (B); Inputs used to start production (D); Inputs produced by the family (D); Inputs produced or purchased (B); Place of purchase of the inputs (B).
Adversities of the gardenProblems with water, pests and diseases, animals, the inexperience of harvesting, plant nutrition, seed and meteorological, and planted area, all in nominal scale (B).
CommercializationPlace (B) and organization to sell (B); Profit of selling (B); Problems of selling (B).
Purchase and access to vegetablesDifficulty of buying vegetables (B); Purchase of vegetables in local centers (B); Weekly expenditure on the purchase of vegetables (B); Advantage of producing and not buying (B).
Consumption habitsConsumptions of vegetables, wild fungi, quelites1 and wild insects (D); Animals and plants that are produced for consumption (D); Previous knowledge of vegetable production (B); Vegetables produced before the program (D).
AttitudeAgency capacity (D); Fulfillment with the home garden (B); Status of other plants in their home (B); Innovations in technological models (B).
Government supportSupport of other government programs to produce vegetables (B) and other aid programs (B).
Reasons to have the vegetable garden in that stateLack of time, space, technical knowledge, and inputs; Desire to stay on the program and continue receiving support; Production for selling; Pest problems and diseases; Meteorological and edaphic factors; Health benefits and help for family finances; Necessity to cultivate; To have requested the garden; Malfunctioning of the technological model; all are binary (B).
Reasons to install the vegetable gardenDesire to have a garden; Fresh vegetables were required; The components of the garden were needed; As an experiment or a hobby; As a source of economic income; all are binary (B).
1 The name quelite is derived from the Nahuatl quilitl that refers to an edible wild herb, vegetable or is also associated with the term quilyollotli, which are tender stems, shoots, or buds of a plant [54].
Table 4. Descriptive statistics of the most important analyzed variables for the existing (Exist.) and abandoned (Aban.) home gardens of each program1.
Variable2UA (n = 88)SPFS (n = 85)PFAB (n = 88)
Exist. (n = 47)Aban. (n = 41)Exist. (n = 42)Aban. (n = 43)Exist. (n = 11)Aban. (n = 77)
Income from primary activity (%, D)35.53 (40.69)421.29 (37.95)453.93 (45.77)61.35 (42.41)26.36 (39.57)12.27 (30.27)
Number of family members (D)5.91 (3.59)6.10 (3.60)5.67 (2.98)44.58 (2.27)44.09 (1.38)45.45 (2.60)4
Urban locality (B)0.53 (0.50)40.17 (0.38)40.00 (0.00)0.00 (0.00)1.00 (0.00)1.00 (0.00)
Participation of all member of the family (B)0.64 (0.49)40.39 (0.49)40.52 (0.51)40.16 (0.37)40.55 (0.52)40.19 (0.40)4
Technical assistance always or regularly (B)0.57 (0.50)40.37 (0.49)41.00 (0.00)1.00 (0.00)0.45 (0.52)0.27 (0.45)
Age of the garden (years, D)1.40 (0.61)42.34 (0.62)42.14 (0.97)2.12 (0.99)2.00 (0.00)2.00 (0.00)
Production model in biointensive beds (B)0.89 (0.31)0.78 (0.42)0.93 (0.26)1.00 (0.00)0.72 (0.47)40.26 (0.44)4
Number of vegetables consumed (D)11.64 (3.03)49.95 (2.85)49.26 (2.37)9.49 (2.54)10.36 (3.14)9.35 (3.50)
Previous knowledge of vegetable production (B)0.66 (0.48)0.37 (0.49)0.45 (0.50)40.26 (0.44)40.45 (0.52)0.31 (0.47)
Good status of other plants in their home (B)0.64 (0.49)40.22 (0.42)40.64 (0.48)40.21 (0.41)40.82 (0.40)40.10 (0.31)4
Previous participation in home garden programs (B)0.13 (0.34)40.02 (0.16)40.86 (0.35)0.93 (0.26)0.00 (0.00)0.03 (0.16)
Availability of space (B)0.98 (0.15)40.78 (0.42)40.98 (0.15)1.00 (0.00)0.82 (0.40)0.86 (0.35)
Desire to stay in the program (B)3N/AN/A0.98 (0.15)40.70 (0.46)4N/AN/A
Desire to own one component (water tank) (B)3N/AN/A0.88 (0.33)40.98 (0.15)40.09 (0.30)0.10 (0.31)
Desire to experiment (B)0.26 (0.44)0.12 (0.33)0.76 (0.43)40.56 (0.50)40.18 (0.40)0.30 (0.46)
Fresh vegetables were required (B)0.19 (0.40)0.10 (0.30)0.12 (0.33)0.00 (0.00)0.27 (0.47)40.09 (0.29)4
1 Values in each cell represent the average or frequencies, and in parentheses the standard deviation. 2 Type of variable: Discrete (D), Dichotomous/Binary (B). 3 N/A: Not applicable because the program did not consider that variable. 4 Values marked with this number refer to that variable being used in the logistic regression models (see results section).
Table 5. Variables and descriptions of measurement to perform cluster analysis of existing home gardens.
VariableIndicatorDescription
Surface used ( S u r f a c e o c c u p i e d ( m 2 ) I n i c i a l   S u r f a c e ( m 2 ) ) 100 Percentage
Conditions of components ( S c o r e   o f   t h e   c o m p o n e n t s c o n d i t i o n s M a x i m u m   s c o r e o f   a l l   c o m p o n e n t s ) 100 Ordinal scale: Good (3 points): the component works perfectly. Regular (2 points): the component is deteriorated but is still used. Bad (1 point): the component is almost not used because it needs to be renewed.
Conditions of the vegetable garden ( S c o r e ( P P D C ,   C H ,   P M A O ,   D S ,   S S , P A P ,   E P W ) M a x i m u m   s c o r e ( P P D C , C H , P M A O , D S , S S , P A P , E P W ) ) 100 Each variable was assessed based on an ordinal scale: good (3 points), regular (2 points) and bad (1 point). PPDC: Presence of pests and diseases in crops. CH: Crops Health. PMAO: Presence of medicinal plants, aromatic or ornamental flowers. DS: Diversity of species. SS: Soil Status. PAP: Presence of abandoned plants. EPW: Excessive Presence of weeds.
Components Used ( T o t a l   o f   c o m p o n e n t s   u s e d T o t a l   o f   c o m p o n e n t s   g r a n t e d   b y   t h e   P r o g r a m ) 100 Percentage
Table 6. Logistic regression model for the UA program.
VariableCoefficient EstimatesOddsMarginal Effect
βSE1p2
Dependent variable: (1) the garden exists (0) the garden is abandoned.
Constant −8.234.780.090.00−2.04
Income from primary activity (x1)0.030.010.011.030.01
Participation of all members of the family (x2)1.700.870.055.480.42
Technical assistance always or regularly (x3)1.450.940.124.270.36
Age of the garden (x4)−1.970.650.000.14−0.49
Number of vegetables consumed (x5)0.200.170.251.220.05
Previous participation in home garden Programs (x6)1.701.350.215.450.42
Urban locality (x7)3.701.230.0040.410.92
Good status of other plants in their home (x8)2.550.950.0112.780.63
Availability of space (x9)5.363.610.14212.041.33
Prediction of 1s that were actual 1s (%)85.4Significance of model (χ2)0.00
Prediction of 0s that were actual 0s (%)91.5−2 log likelihood41.99
Power of prediction (%)88.6R2 of Cox and Snell0.60
1 S.E.: Standard error. 2 Data marked in bold show statistically significant differences, with p ≤ 0.1.
Table 7. Logistic regression model for the SPFS Program.
VariableCoefficient EstimatesOddsMarginal Effect
βSE1p2
Dependent variable: (1) the garden exists (0) the garden is abandoned.
Constant−6.711.790.000.00−8.29
Participation of all members of the family (x1)1.110.680.103.021.37
Previous knowledge of vegetable production (x2)1.020.680.132.771.26
Number of family members (x3)0.240.130.051.280.30
Desire to stay on the program (x4)3.991.340.0053.844.92
Desire to own one component (water tank) (x5) 0.630.630.321.880.78
Desire to experiment (x6)0.221.230.861.240.27
Good status of other plants in their home (x7)1.810.640.016.102.23
Prediction of 1s that were actual 1s (%)74.4Significance of model (χ2)0.00
Prediction of 0s that were actual 0s (%)73.8−2 log likelihood88.38
Power of prediction (%)74.1R2 of Cox and Snell0.29
1 S.E.: Standard error. 2 Data marked in bold show statistically significant differences, with p ≤ 0.1.
Table 8. Logistic regression model for the PFAB Program.
VariableCoefficient EstimatesOddsMarginal Effect
βSE1p2
Dependent variable: (1) the garden exists (0) the garden is abandoned.
Constant−3.061.880.100.05−0.01
Production model in biointensive beds (x1)5.462.570.03235.000.01
Number of family members (x2)−1.280.630.040.280.00
Good status of other plants in their home (x3)6.832.570.01924.470.01
Participation of all members of the family (x4) 2.601.710.1313.510.01
Fresh vegetables were required (x5)0.141.580.931.150.00
Prediction of 1s that were actual 1s (%)72.7Significance of model (χ2)0.00
Prediction of 0s that were actual 0s (%)98.7−2 log likelihood19.37
Power of prediction (%)95.5R2 of Cox and Snell0.78
1 S.E.: Standard error. 2 Data marked in bold show statistically significant differences, with p ≤ 0.1.
Table 9. Conglomerate characteristics of the remaining home gardens.
Classification of Home GardensUA (Figure 1a)SPFS (Figure 1b)PFAB (Figure 1c)
Good home gardens7%-C114%-C10%
Surface occupiedIncreased by 3 to 4 times the initial size0.5 and 4 times the initial size-
Home garden status1GoodGood-
Components used89%75%-
Components status1GoodGood-
Regular home gardens38%-C250%-C245%-C1
Surface occupiedSmaller than or 1.8 times the initial sizeSmaller than or initial sizeSmaller than or 1.8 times the initial size
Home garden status1Good (33%) and Regular (67%)Good (29%) and Regular (71%)Good (80%) and Regular (20%)
Components used86%75%33%
Components status1GoodRegularBad
Deficient home gardens55%-C336%-C355%-C2
Surface occupiedLess than initial size0–50% than initial size>= 50% than initial size
Home garden status1Regular and BadGoodRegular
Components used50%58%33%
Components status1RegularRegularBad
1 The status of the home garden and its components is denominated as: Good, when from a scale of 1 to 100, the evaluated variables give a score higher than 75; Regular, the evaluated variables have a score between 75–51; Bad, the evaluated variables have a score lower than 51.

