Transforming Housing to Commercial Use: A Case Study on Commercial Gentrification in Yeon-nam District, Seoul


1
Department of Civil and Environmental Engineering, Seoul National University, Gwanak-ro 1, Gwanak-gu, Seoul 08826, Korea
2
Smart City Research Center, Advanced Institute of Convergence Technology, Suwon 16229, Korea
*
Authors to whom correspondence should be addressed.
Sustainability 2020, 12(10), 4322; https://0-doi-org.brum.beds.ac.uk/10.3390/su12104322
Submission received: 14 April 2020
/
Revised: 12 May 2020
/
Accepted: 22 May 2020
/
Published: 25 May 2020
(This article belongs to the Section Sustainable Urban and Rural Development)
Abstract
:Commercial gentrification has had a significant impact on the urban environment, particularly in leading to the upscaling and expansion of food and beverage (F&B) commercial activities. F&B commercialization and proliferation has emerged from (a) the borders of newly provided urban open space and (b) seed points where small-sized commercial areas had already been formed. However, few studies have simultaneously explored the commercialization process of these different contextual sub-regions over a relatively long time period. This study of Yeon-nam district, Seoul, aims to demonstrate empirically (1) how the F&B commercial stores have been distributed over the past decade and (2) which of the factors that are the spreading center of the F&B store is the critical factor. Using kernel density estimation, the study discovered that the old–residential district has been entirely transformed to an F&B commercial district since the Gyeong-ui Line Forest Park opened in the district. Furthermore, through the analysis of standard deviational ellipses, we empirically verified that F&B commercialization was more substantial in the seed region. Based on the findings, policy recommendations for urban planning and design, especially urban gentrification management and regeneration, are provided.
1. Introduction
Gentrification is one of the most significant forces changing the contemporary urban environment [1]. Ever since Ruth Glass first conceptualized gentrification as the transformation of the inner-city’s housing, gentrification has changed the urban environments physically and socioeconomically [1,2]. The impacts on the urban environment have taken various forms, historically, from the initial residential gentrification referred to by Glass [1], entailing the shift of households and neighborhoods [2], changes of built environments [3], transition in characteristics of retail shops [4], privatization of public urban open space [5], and conversion of urban land uses [6]. Moreover, gentrification has gradually manifested globally [7,8,9,10,11].
In Seoul, the capital of South Korea, for about a decade, the frequent occurrences of gentrification have caused heated debates on gentrification [6,11,12,13]. Scholars and city government have reported that various types of gentrification have widely occurred in residential and commercial areas, and CBD of the metropolitan areas [6,14,15]. Local stores have transformed into upscale cafés and restaurants; moreover, even housing near the region where commercial gentrification occurred converts into the food and beverage (hereinafter; F&B) store [13,14].
This implies that the main issue arising from gentrification has been commercial gentrification [13], that is, the “boutiquing” of small retail stores in local neighborhoods [1,4,16]. Recently, commercial gentrification has not only changed the sociodemographic characteristics of neighborhoods, but also extensively transformed the urban physical and built environments [6,13], leading to increased attention and scholarly recognition of its importance and attention to it [4,17,18].
Commercial gentrification, that is, both upscaling commercialization and proliferation of stores occurs in two main ways. First, the provision of green open space led by government projects increases pedestrian volume and can bring about economic effects in nearby areas related to retail revenue [6,12,19]. The Cheonggye stream in CBD of Seoul was restored to an urban green park, increasing pedestrian volume and converting building use from industrial to commercial use [6]. This is an example of spread of commercial stores for visitors substituting the previous housing and stores in the vicinity of provided open space. Second, gentrification can occur centered around places where property is relatively inexpensive [20], such as old, traditional marketplace [17,21]. Near Pike Place Market in Seattle, there has been gentrification with upscale restaurants and retail spaces for high-end products emerging after a decline in its traditional retail use [22].
In Seoul, a unique place where the above two ways of gentrification have emerged lately is discovered. The commercial district in Yeon-nam dong which once was a residential area before the creation of the Gyeong-ui Line Forest Park has become a famous commercial area [23]. Some researchers have studied this site’s upsurge of retail sales and housing prices, and they have asserted that the occurrence of gentrification resulted from the provision of the park [10,12]. With gentrification proceeding, the district has two spatially distinguished commercial regions, Yeontral Park [23], the border of the park named after Central Park in New York, and Dong-jin market, the former traditional local market for the neighborhood, located on the opposite side of the district from Yeontral Park. Commercialization of buildings and proliferation of high-end F&B stores have been witnessed near both places. In this study, the commercial district in Yeon-nam dong, which once was a residential area, is used as a case study to understand the commercialization process in these two contexts. Moreover, there has been growing concern to explore changes in the urban environment due to gentrification based on spatial considerations, not restrained from the previous trend which is based on the existing sociodemographic perspective [6,10,13,24,25]. There is a need, therefore, for an empirical study to consider urban spatial change along with commercial gentrification. The purpose of this study is to analyze the gentrification process that comes with F&B commercialization from the perspective of spatial transformation and to demonstrate which of the two target regions, around which F&B stores have proliferated, is more affected by commercial gentrification. Specifically, we examine (1) how F&B commercial stores have been distributed over time in the recent decade by using kernel density estimation, and (2) which of the factors that are the spreading center of the F&B store is the key factor by computing the standard deviational ellipses. Two different contexts explaining the gentrification with F&B commercialization and proliferation will be presented in the literature review section that follows. The next section after that describes the study site, and the section following discusses the nature of the data and establishes the methods of the study. The paper then illustrates the process of gentrification by spatially depicting the conversion of land use to commercial use, and the increment of F&B stores. Then, we will demonstrate whether the two ways provide an empirically valid explanation and evaluate which context has a more significant impact on the formation of the commercial district. Finally, the findings and their political implications will be discussed.
2. Literature Review
2.1. Contextual Background of Commercial Gentrification with F&B Commercialization
In principle, a newly commercialized area with a demonstrable emergence of commercial stores can be located in two different regions. The first one is the region where passenger volume increases through the government’s urban projects, such as construction of linear green parks and the project of pedestrianization [6,24]. The second one is regions where several trendy cafés and restaurants are located based on low property value and rent, such as an old marketplace and the neighborhood commercial areas for local residents [4,17,25]. Both regions have distinct characteristics that may attract visitors, commercial capital, and retail stores.
On one hand, many scholars substantiate that an urban project provides an open space for pedestrians, increases pedestrian volumes, and also boosts the commercial activities of nearby regions [19,24,26,27,28]. In the recent times, urban open spaces, especially linear green parks, have become a popular trend, such as New York’s High line [29], Boston’s Bigdig [30], Atlanta’s Beltline [31], and Seoul’s Cheonggye stream restoration [6]. Such creation of urban parks led by government intends to enhance the physical and psychological health of citizens [32,33,34], as well as attract visitors from neighboring and other areas [6,35,36]. An example is the case of the High Line, for which two thirds of the 7.6 million visitors came to visit the renovated linear green park [29].
As the visitor volume increases near the provided urban open space, there is a higher probability that retail stores will be located in the vicinity. Some studies investigate the relationship between pedestrian volume and the distribution of commercial stores [6,19,24,37]. Kang [19] and Sevtsuk [37] verified that the appropriate location for retail stores—specifically for food, beverages, and services—are near streets with high pedestrian volume, as in Seoul and in Somerville and Cambridge. Moreover, Lim et al. [6] empirically demonstrated that urban green parks enhance walking volume in their proximity; as a result of this change, industrial use building massively converted to commercial use in the case of the Cheonggye stream restoration project. Thus, retail stores for visitors can agglomerate within regions where government-led projects that foster increase in walking volume are located.
At the same time, a novel trend of retail location has been widely witnessed alongside commercialization with commercial gentrification [4,17,38]. Commercial gentrification as a concept branched out from the original notion of gentrification in the 2000s, and generally means the “boutiquing” of small retail stores in residential neighborhoods [1,4,16]. Changed consumption propensity in the neighborhood and movements for local rehabilitation generally contribute to the opening of the cafés and restaurants for visitors and higher-income immigrants, substituting the store for local indigenous residents [4,38]. Such upscale commercialization can occur in areas with lower property values, like an inner city area with lower income neighborhoods [11,38], where decline had been proceeding [17,39].
There has been a gradual decline in traditional markets resulting from changes in consumption trends and several years of disinvestment in traditional markets [17,39,40]. In turn, the abandonment of the marketplace can lead to a rehabilitation investment changing it to a gentrified, upscale market, and making more profit by attaining the rent gap [39,41] that is the margin between the potential land value (the value when the land is best utilized) and the capitalized land value (the value of the current use) [21,42]. Though not all declining traditional markets are declining as a result of commercialization with commercial gentrification, some traditional marketplaces and nearby areas are soon gentrified into new types of retail stores, including trendy bars, cafés, and restaurants for non-local visitors [17,39,43]. Gentrification into the “new retail” has been witnessed in many cities of the world, for instance in Kirk Market, in Leeds, and Campo de Ourique, in Lisbon [39]. Moreover, the gentrified marketplace can be considered as a seed for the spread of upscale retail stores. An example is the famous region near Pike Place Market in Seattle, where retail stores, including upscale F&B and other services for those in the upper-income bracket, have emerged centered around the core of the market [22]. Thus, a seed region can form centered around a declining marketplace where pioneer F&B retail capital agglomerates and a small cluster of upscale retail stores emerge.
The literature, so far, has addressed emerging commercial regions, primarily F&B retail stores, with two different contexts. Meanwhile, intensification of F&B commercialization can occur in areas of increased pedestrian volume caused by government projects and in disinvested areas prone to upscaling commercialization. In general, almost all types of retail stores have the tendency to agglomerate near regions where the number of visitors is high, as previously mentioned [6,19,24,37].
However, this increment does not directly indicate agglomeration among the retail stores. On the type of goods that the retail stores sell, opposite distributional characteristics are observed. Sevtsuk [37] verified that stores selling quality-distinguished goods, such as clothing and F&B, form competitive agglomerations after analyzing fourteen thousand buildings in Somerville and Cambridge, Massachusetts. In Korea, empirical studies shed light on the agglomerating characteristic of F&B stores in the cases of the cultural district of Insa-dong, in Seoul [44]. In particular, the researchers pointed out a more powerful tendency of clustering and spreading in F&B type retail stores since the last one or two decades [13,14,45].
2.2. Spatial Consideration of the F&B Stores’ Distribution and Proliferation
To identify the spatial pattern of F&B commercialization, the distribution of F&B stores needs to be analyzed first. Previous studies have presented the distribution of retail stores (including F&B stores) using various spatial mapping methods.
Lim et al. [6] analyzed the commercialization and regeneration process of an area mainly composed of industrial land use, illustrating changes from industrial use to commercial use on the restored section of Cheonggye Stream in Seoul’s CBD. To trace out the patterns of land use change, they divided the study area into several blocks, all adjacent to the restored park. By marking land use change from the permit data recorded by Seoul Metropolitan Government on the map, the study found that the restored park had a positive impact on both commercialization and regeneration effects transforming land uses to more affluent ones. However, such a simple pointing method has limitations in terms of measurement of commercialization intensity and the difficulty in the comparison of more than two aspects.
More quantitative methods to depict retail stores distribution have been adopted in recent studies. Cui and Han [46] depicted the spatial distribution of retail stores in Zhengzhou, China, using the kernel density estimation and standard deviational ellipse. Using these two methods, the intensity of spatial concentration of retail stores and the direction of distribution of all retail stores in the city were computed, and then quantitatively compared with urban centrality values. Reigadinha et al. [47] conducted the kernel density estimation and standard deviational ellipse on retail stores in Oporto district, Portugal. Classical location theories were empirically confirmed with the analysis of the agglomeration patterns of retail stores and their hierarchy using these two methods.
Recent studies have tried to analyze the distribution of commercialized areas and proliferation of commercial stores, which includes not only F&B stores, but also clothing shops and cultural facilities, in the context of commercial gentrification. Kim and Park [45] identified a commercially gentrified area with retail stores in Bukchon, Seoul by analyzing the distribution of the stores and their characteristics, such as their architectural traits and business type. Using kernel density estimation, the study pointed out that the intensity of commercialization was generally stronger in previously existing commercial streets. Jin et al. [48] also studied the commercially gentrified area of Hongdae, the most popular commercial area in Seoul, by empirically investigating the locations of cafes, which are an important part of F&B retail’s business type. In particular, interpreting the standard deviational ellipses in a time series, they demonstrated that the café business type had proliferated irrelevant to proximity to the main road system. Moreover, the cafés in Hongdae agglomerated along the back road rather than the main road, and clustered influenced by diverse characteristics rather than land price, such as architectural type, narrower street, and small-sized commercial stores located nearby.
As mentioned above, most of existing literature on the spatial consideration of commercialization has focused on the distribution of the interest at one time section [46,47] or the sub-regions’ separative explanation on the development type and the business type [6,45]. On the contrary, few studies have tried to simultaneously compare the commercialization process of different contextual sub-regions over a relatively long period. Thus, our study bridges this gap in the literature by examining the spatial changes in the urban physical environment over time, from 2011 to 2019, specifically the transformation of housing for F&B commercial use. It also identifies the factors responsible for the F&B store proliferation, by comparing the border of the government-led urban open space and the seed point that was the origin of a previous small-sized commercial area.
3. Material and Method
3.1. Study Area
In order to enhance the urban life quality and utilize an unused space for the citizen, the Seoul Metropolitan Government (SMG) implemented the Gyeong-ui Line Forest Project, by which a linear-shaped area was obtained by putting the railroad underground and transforming that area into an urban green park. The Gyeong-ui rail line had functioned to connect Sinuiju, North Korea and Seoul before the division of Korea, but in the recent times, it has been utilized to transport passengers between Seoul and the Northern part of the Seoul metropolitan area. With the signing of the agreement to use the railroad’s ground-level part that is owned by the Korea Rail Network as an urban park, the SMG initiated and carried out the construction of the park over three periods: phase 1 (2009–2012), phase 2 (2013–2015), and phase 3 (2015–2016). From December 2009 to June 2016, an urban linear park 6.3 km long with an area of 101,668 m2 was provided in the Mapo-gu and Yongsan-gu, counties of Seoul, resulting in numerous visitors.
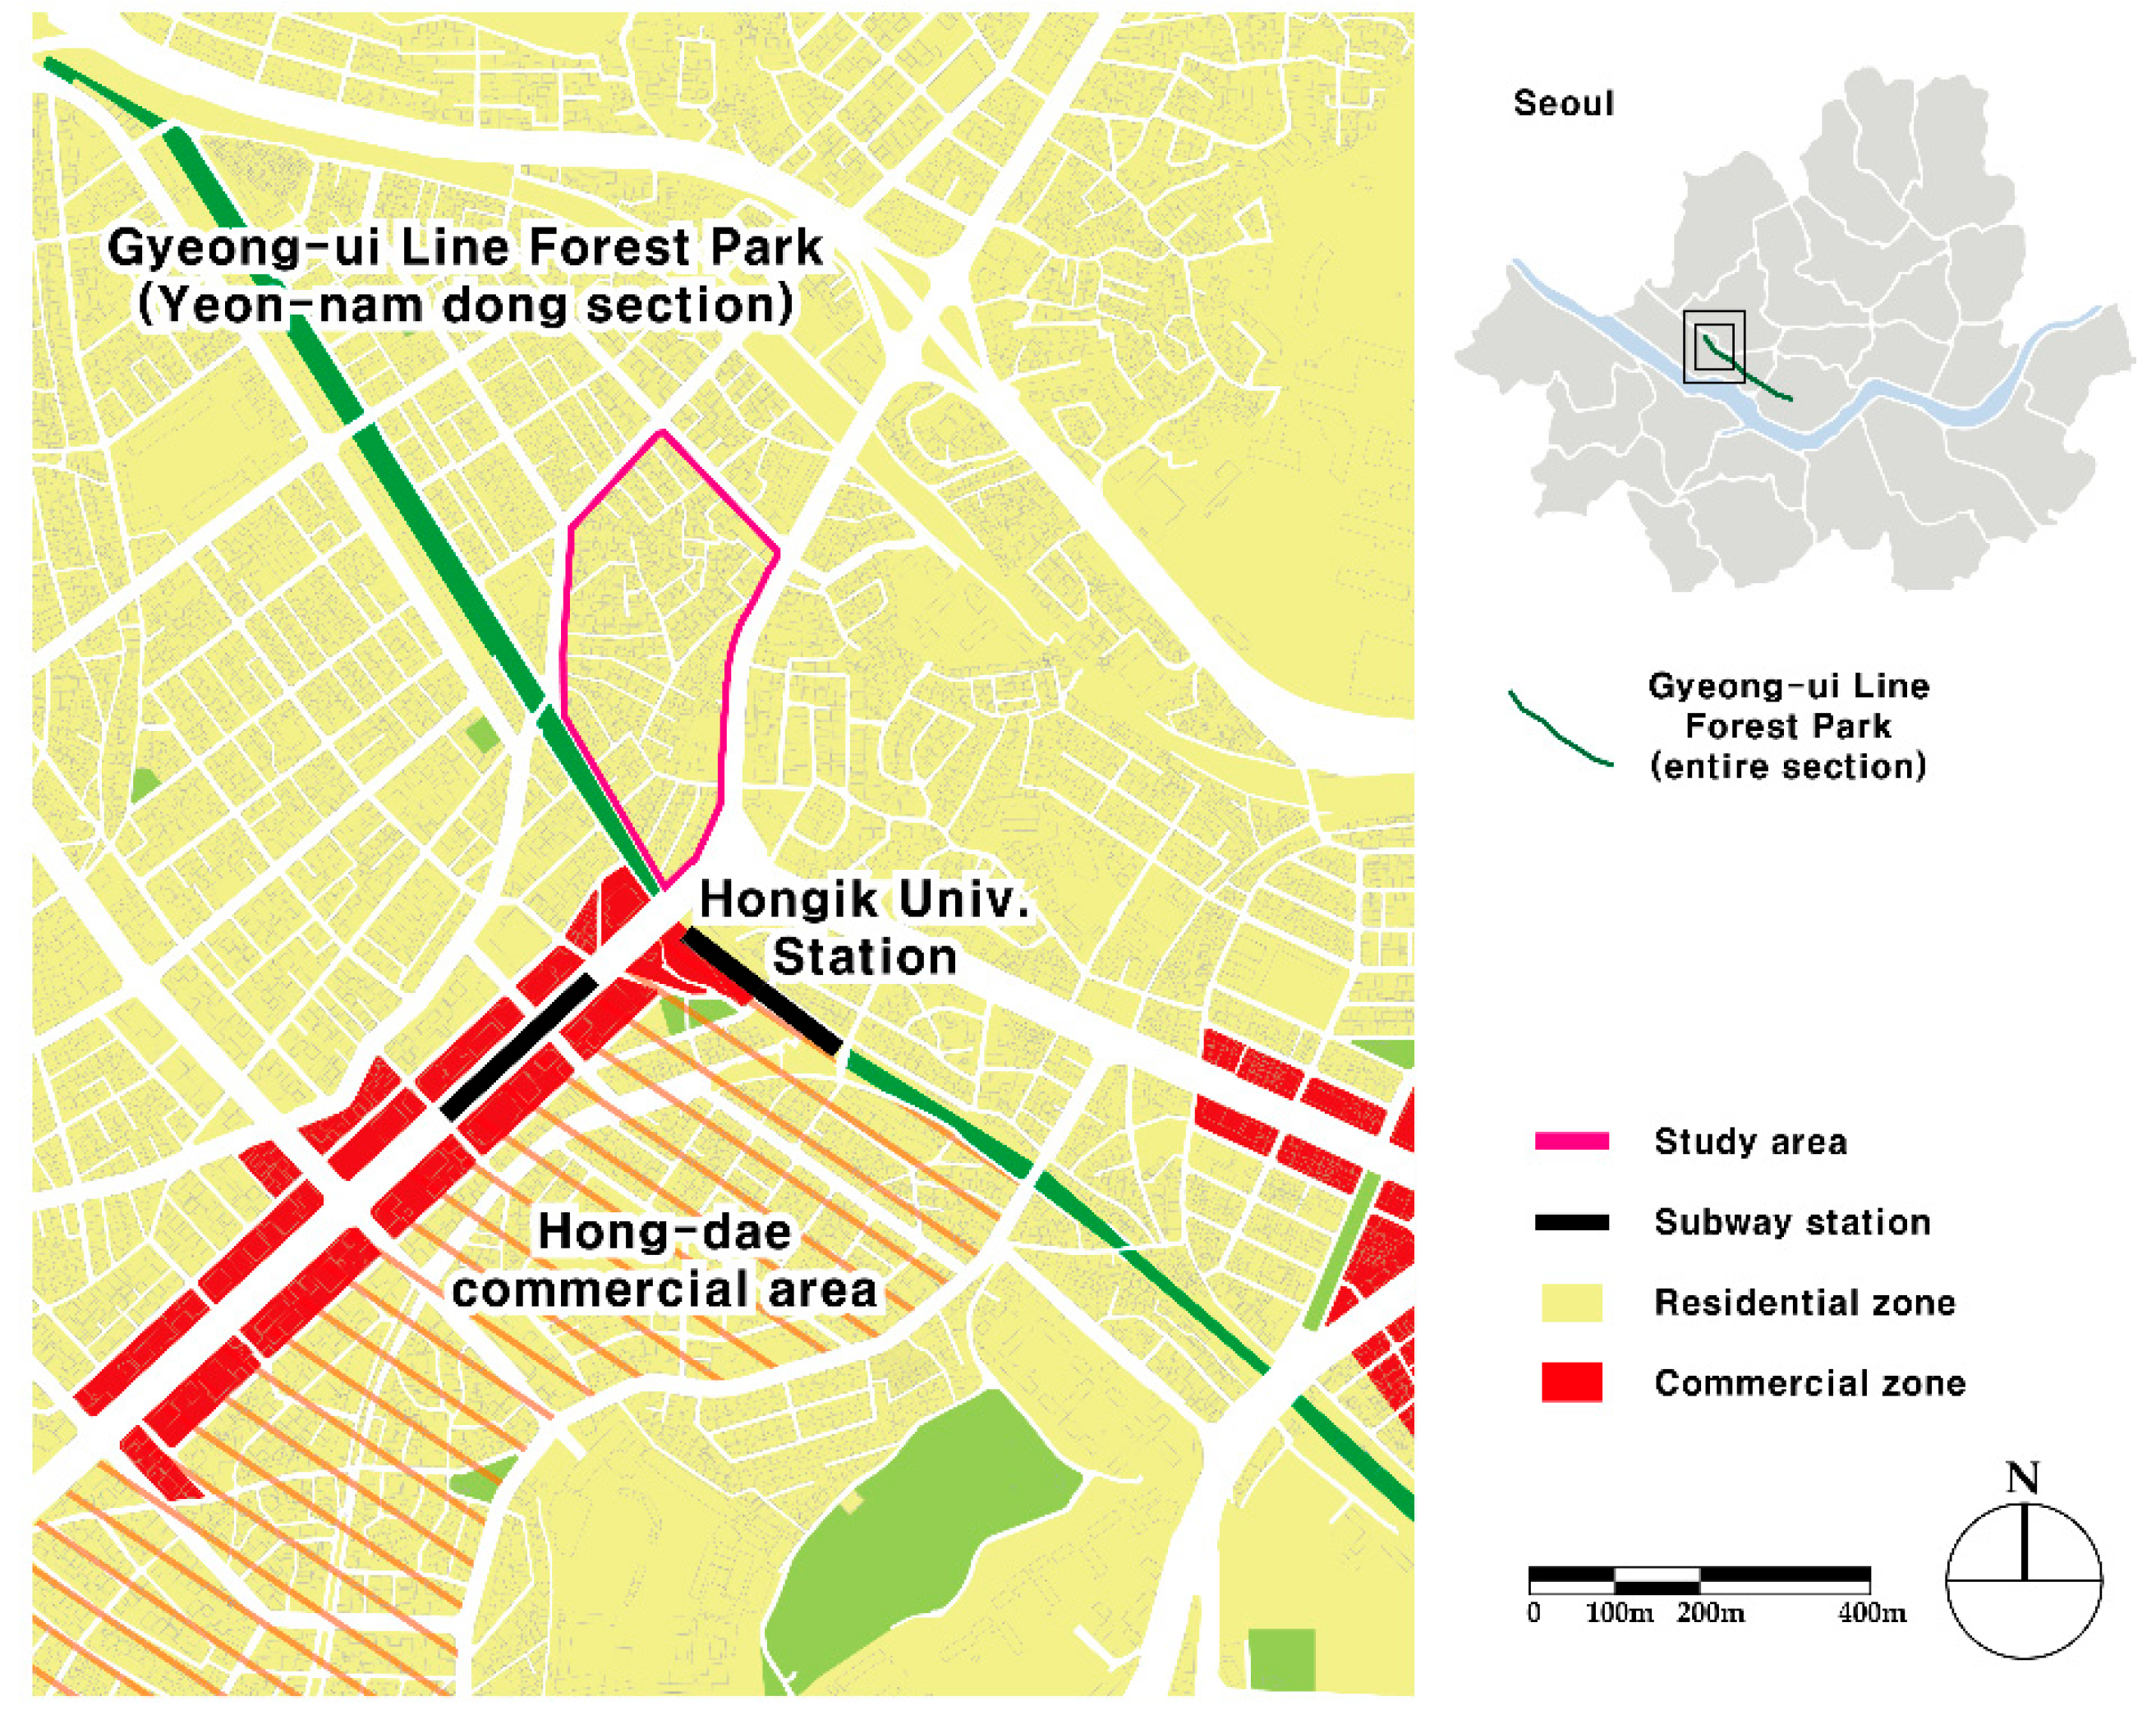
Among the sections of the park, attention was focused on the section and its nearby area in the Yeon-nam dong, which was soon called “Yeontral Park”, named after Central Park, New York. This section was finished in June 2015, which was developed in the second phase. As shown in Figure 1, the region near Yeontral Park, which is zoned as residential use, is located near Seoul’s most famous commercial area, Hongdae, and the station where subway line 2, Gyeong-ui line, and the Airport Railroad Express pass.
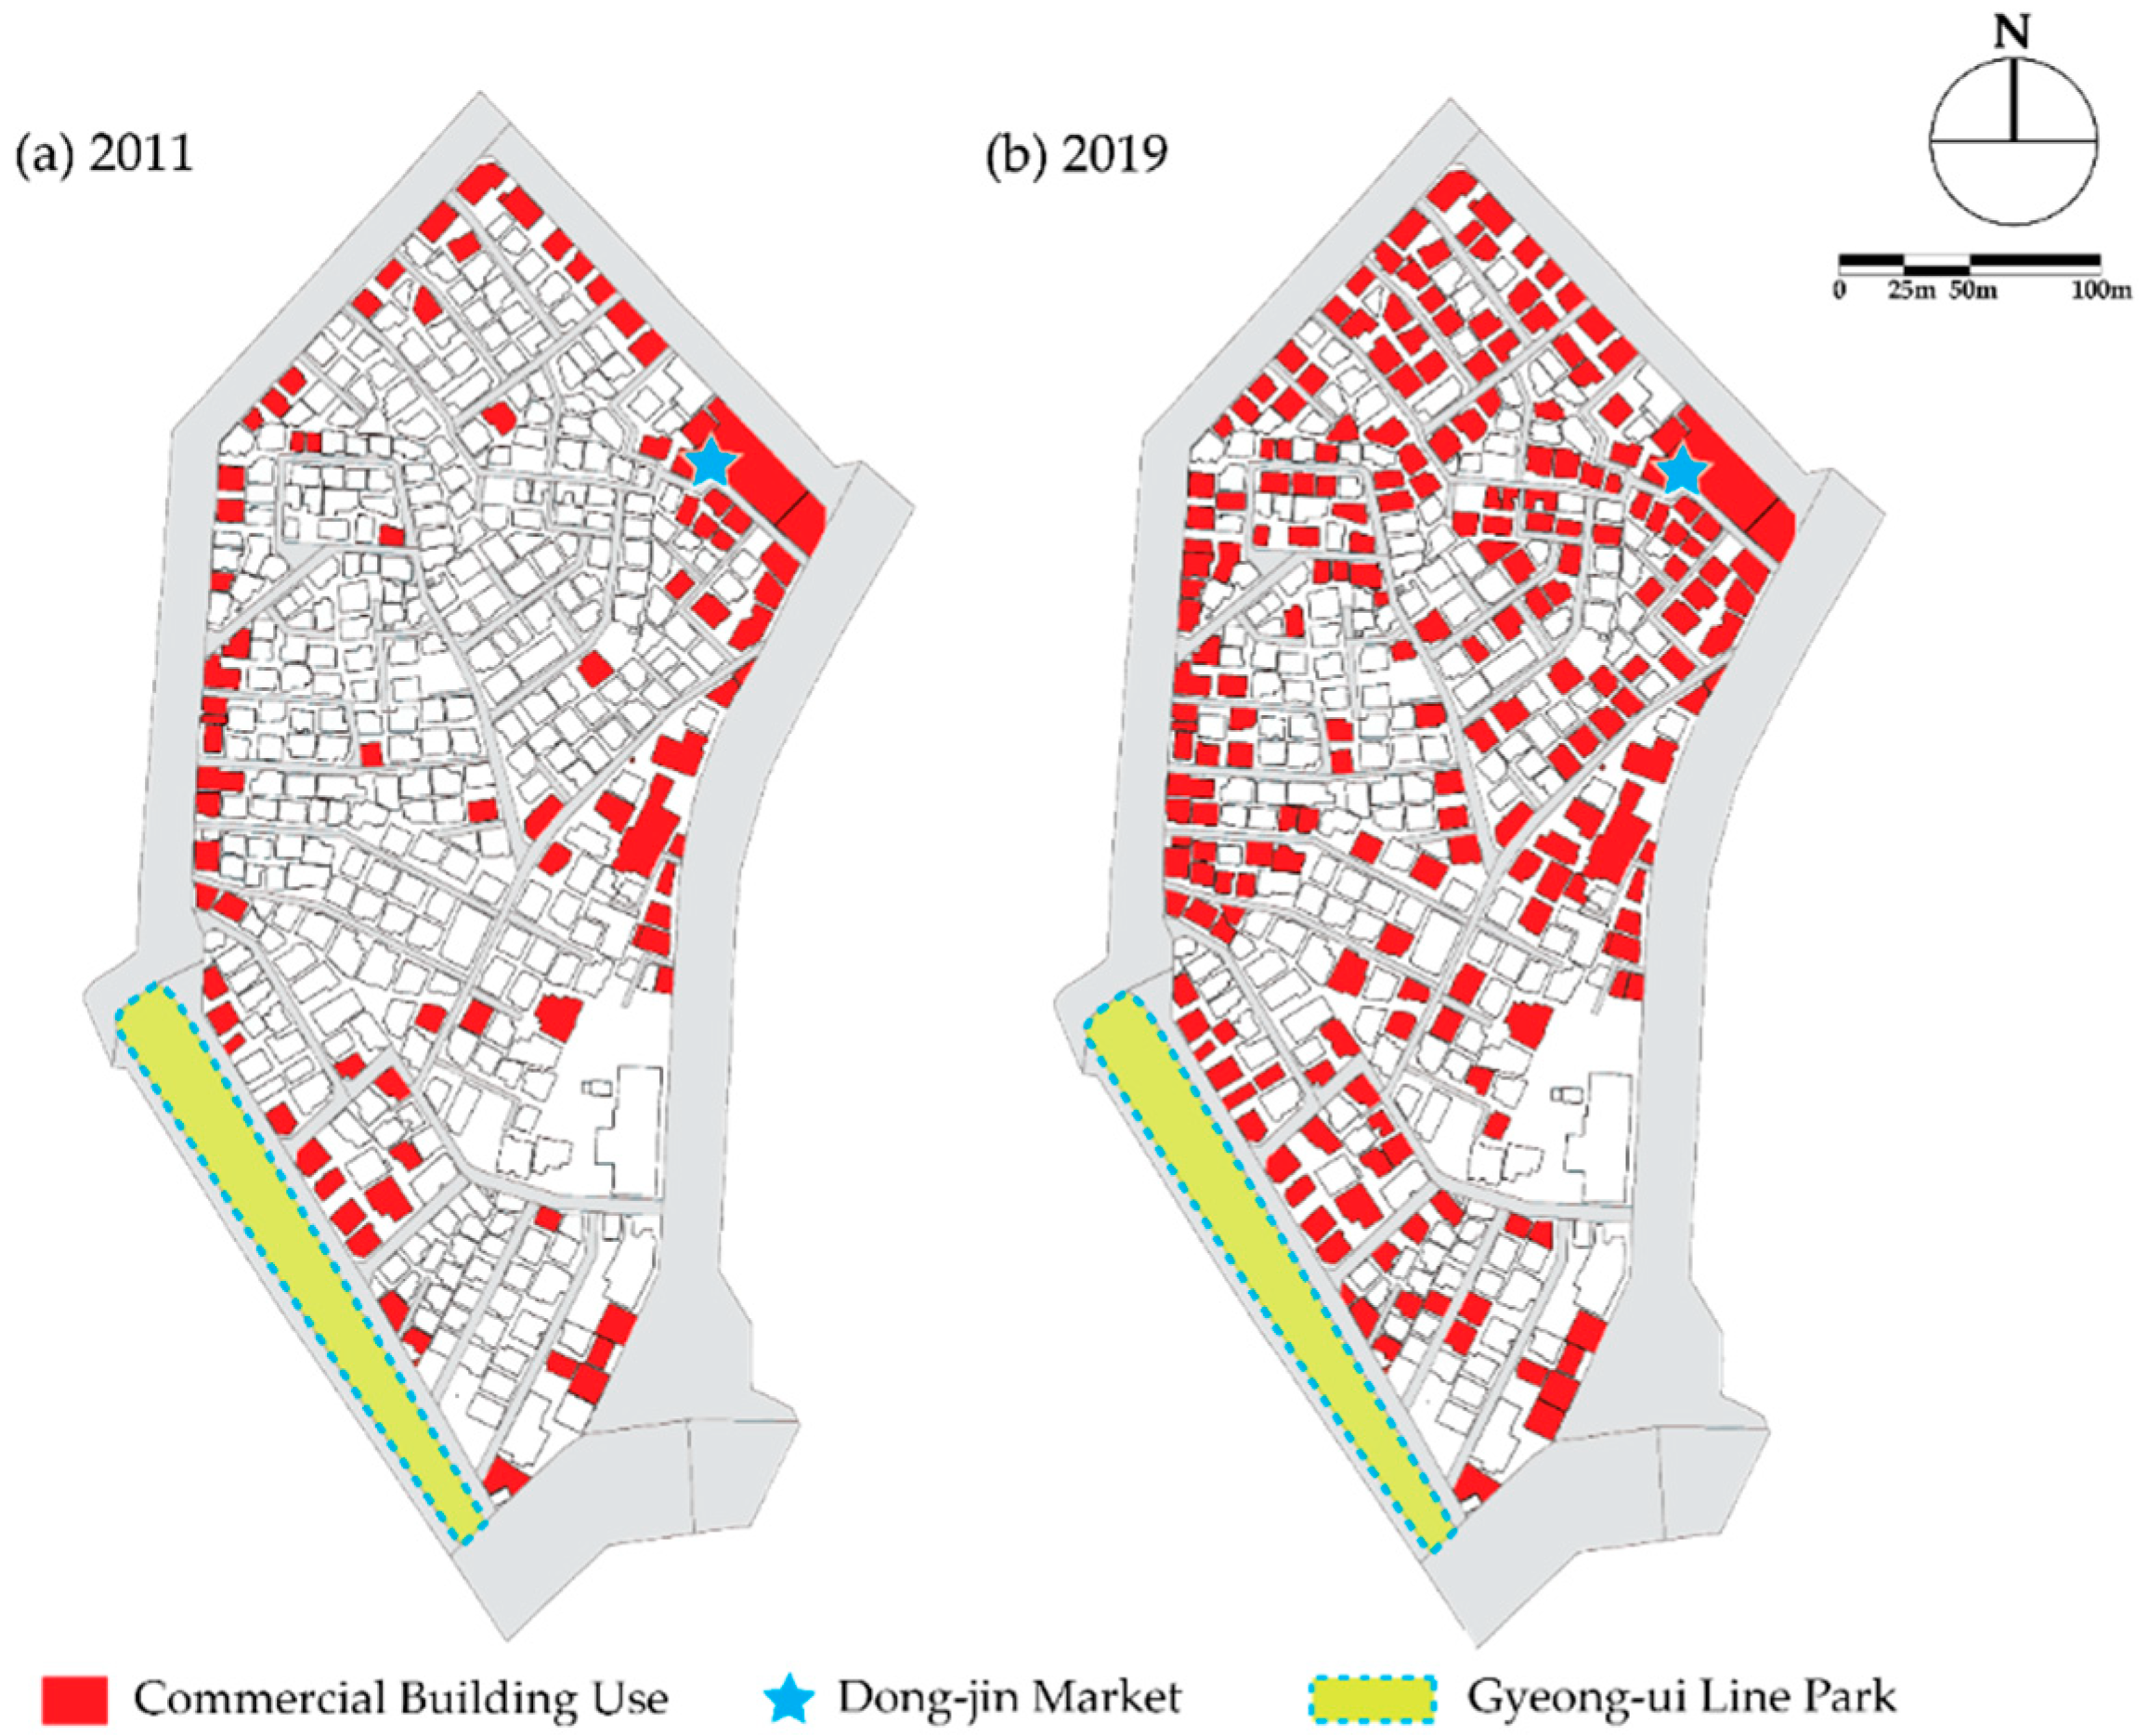
Before the construction, this region had retained the calm and peaceful residential environments, except for the commercialized area bordering Hongdae [49]. However, at about the time of the opening of this section in December 2015, the SMG announced that there are 11 gentrified regions in Seoul, and the Yeon-nam dong is one of them [50]. With gentrification proceeding, in addition to Yeontral Park, commercialization of buildings and proliferation of high-end F&B stores began near other areas, including areas near the Dong-jin Market (Figure 2).
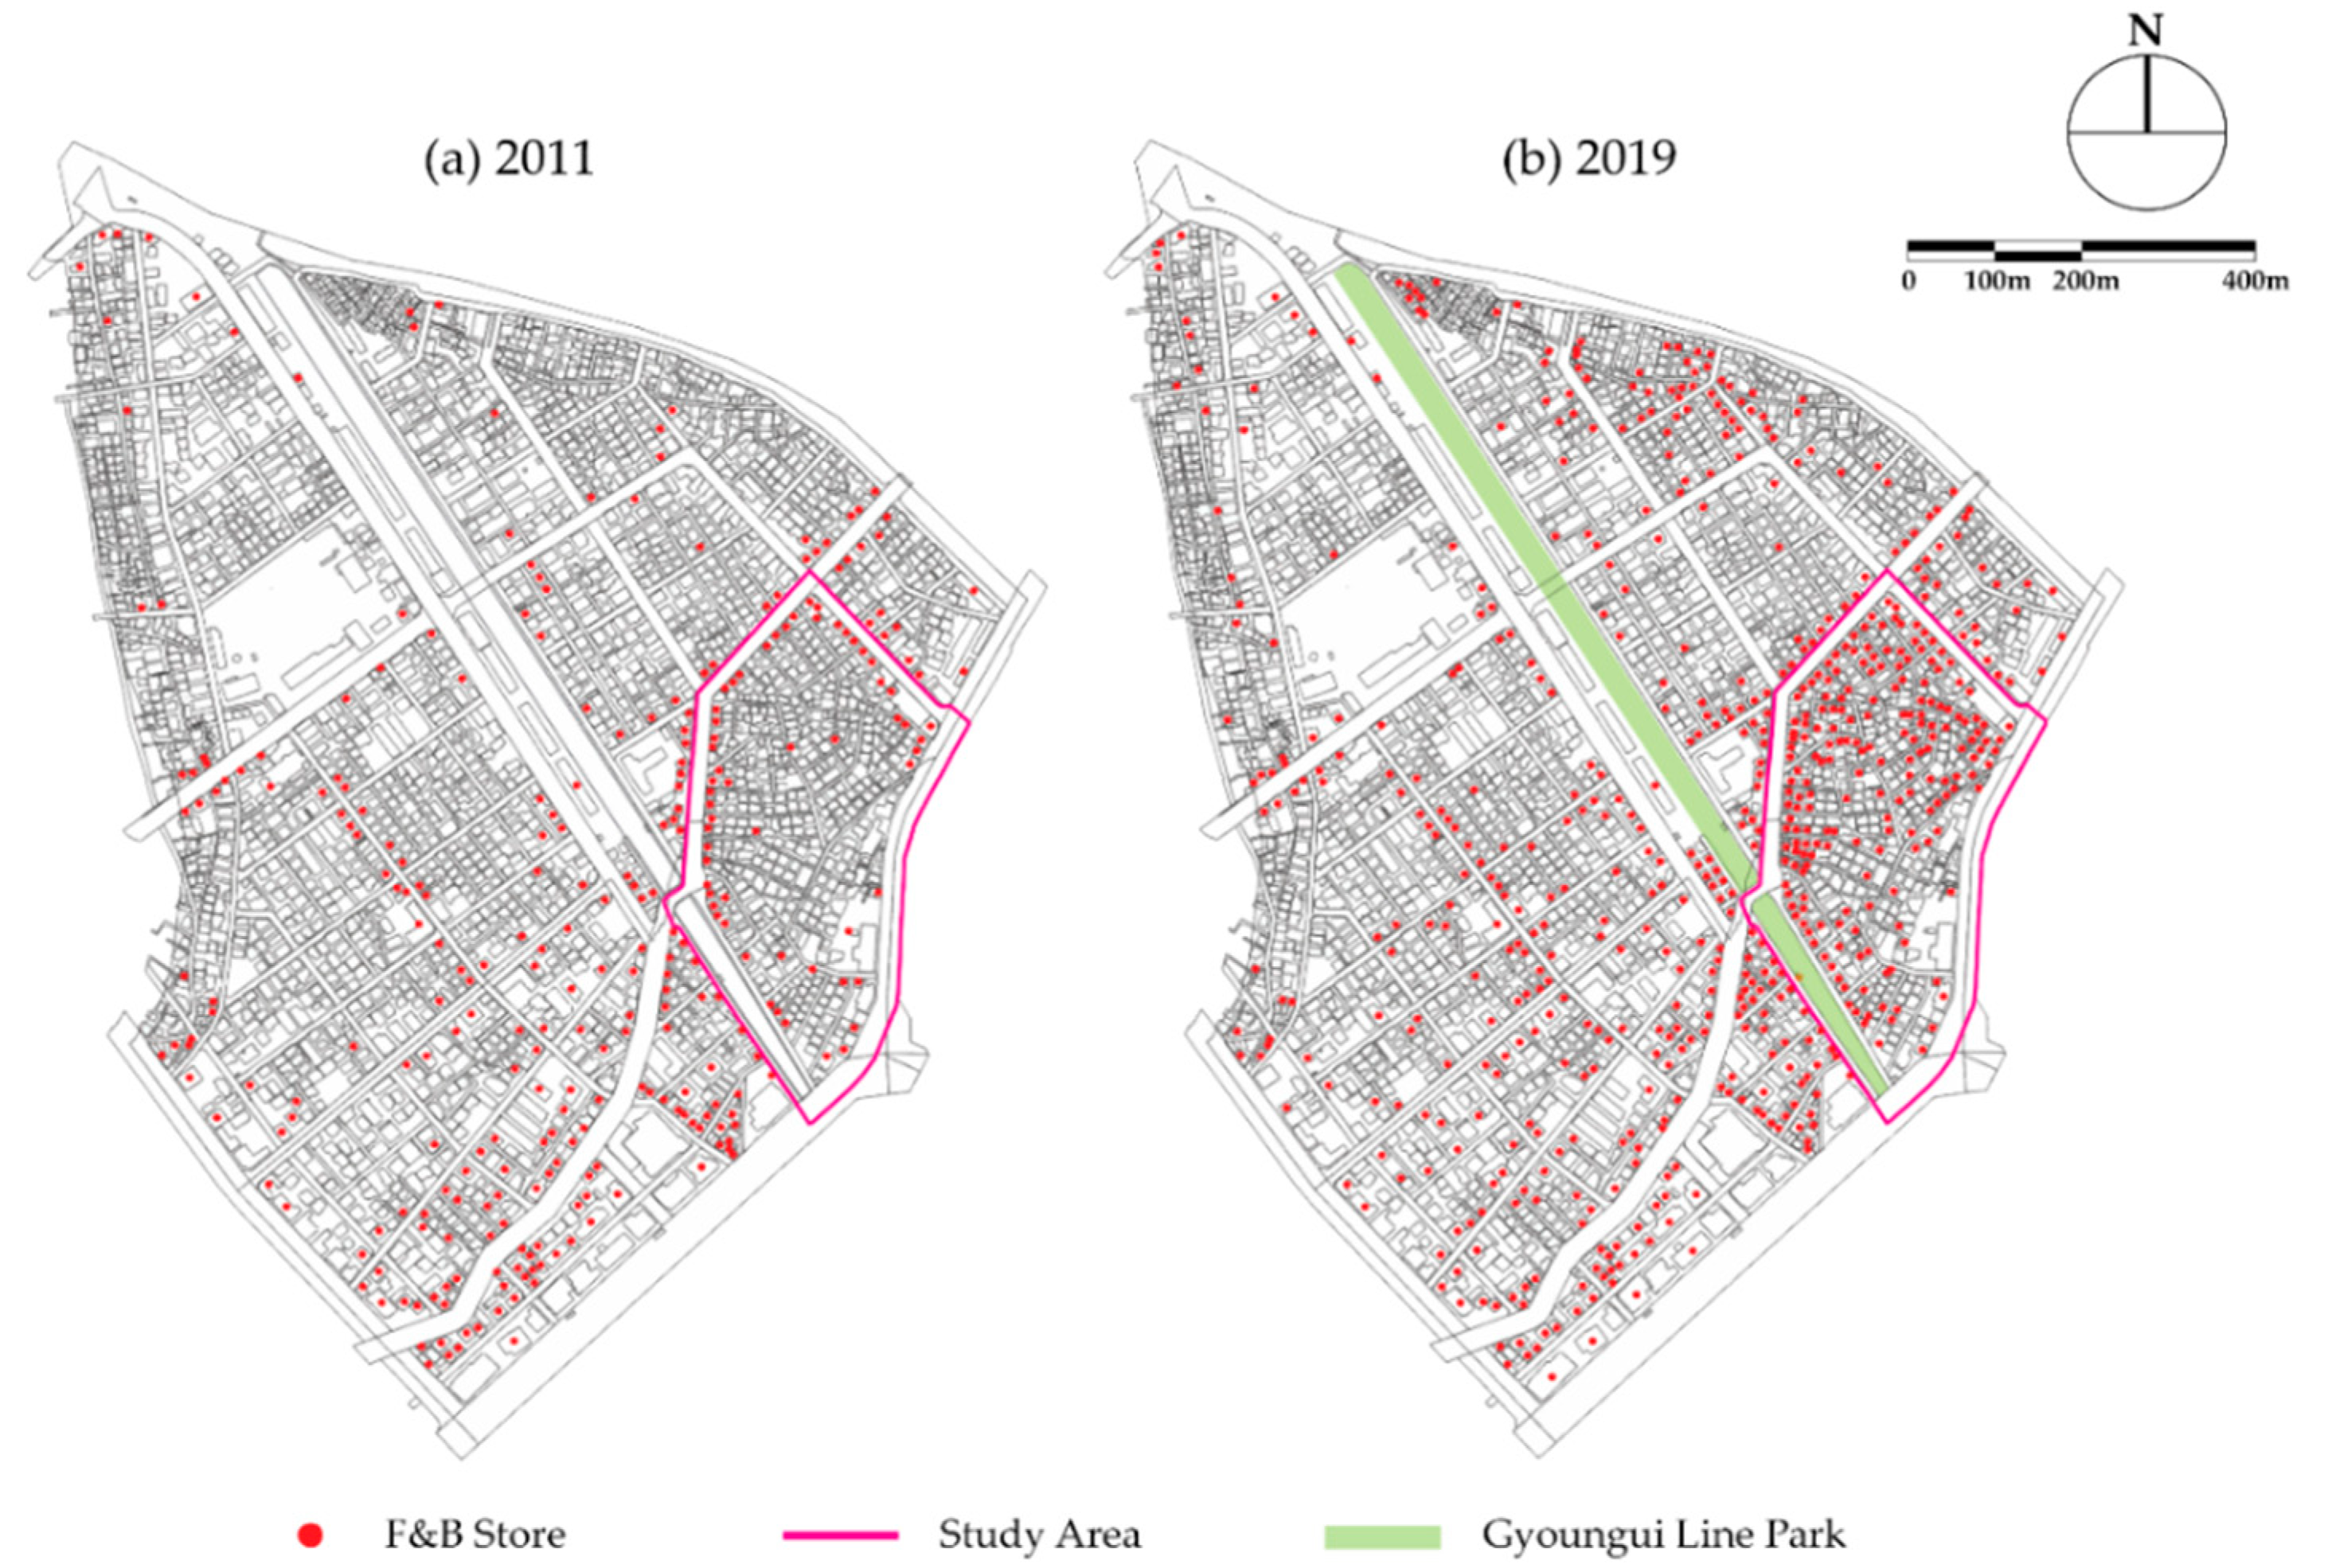
In order to accomplish our research goal, we narrowed down the study area by selecting the most commercialized area near the park in Yeon-nam dong. Meanwhile, by analyzing the stage classification and characteristics of Seoul’s commercial gentrification, Yoon & Park [13] asserted that the commercial gentrification process in Seoul tends to progress as the F&B stores increase. With this fact and the relationship between increment of pedestrian volume and F&B retail shops (previously discussed in chapter 2.1) [19,37], it is reasonable to establish the study area by comparing the F&B distributions of the past and present, in that the criterion by which the obvious distinction of the past and present is found purportedly reflects the extent of the most commercially gentrified. Therefore, we carried out a simple analysis by comparing F&B store distribution between 2011 and 2019, so that the study area (Yeon-nam district) was within the pink line (Figure 3). Meanwhile, Park and Kim [12] captured the economic impacts of urban open space by directly analyzing the local small businesses’ sales data instead of secondary outcomes like property value in this region. However, this study was confined to the economic perspective; it did not include attention to spatial commercialization and commercial gentrification.
3.2. Variables: Data
The data used in this study include, (a) first, building use in the Yeon-nam district from 2011 to 2019 to explore the status of conversion of building use from housing to commercial and (b) second, the permit history of the F&B stores in Yeon-nam district to investigate the distribution of the F&B stores representing commercialization and proliferation, using the kernel density estimation and the standard deviational ellipse.
3.2.1. Building Use: Exploring Conversion of Building Use to Commercial Use
The present building use and the record of its conversion were investigated through the Building Register records of the Ministry of Land, Infrastructure and Transport of Korea (https://www.eais.go.kr/) as of November 2019. The Building Registers of 416 buildings were examined. A building designated for commercial use in the register record or a building in which more than 50% is for commercial use is considered as commercial use. To examine the commercialization of building use, the entire building use for each year from 2011 to 2019 was mapped on the ArcGIS software by geocoding it to the shape file.
3.2.2. Permit History: Analyzing Spatial Distribution and Proliferation of F&B Stores
This study uses the Local Data of Administrative Permit as recorded by the Ministry of the Interior and Safety of Korea (http://www.localdata.kr/main.do) to investigate the permit history of F&B stores. The Local Data of Administrative Permit provides data on the permit history of each store, including its brand name, location, and business attributes, such as building floor area of the building. The permit history is in the form of a report on the establishment of the business (the time of start and closure of a store), renewed every end of the month. The reports on the establishment of business of 416 buildings totaled 2666 events as of November 2019. The stores that existed for each year from 2011 to 2019 were arranged by checking the time of start and closure of a store. The existing stores were geocoded to the shape file form based on each year and utilized to analyze F&B commercialization and proliferation by conducting kernel density estimation and standard deviational ellipse.
3.3. Analytical Methods
In this study, the progress of F&B commercialization and proliferation induced by commercial gentrification in the old-residential area of Yeon-nam dong was analyzed. As the project in our study area was completed in June 2015, the past time from this pivotal moment, which equals the time from completion to now, was included in the time range of the study to consider the project’s developmental impacts.
The research methods of the study were as follows: First, by mapping the commercialization of building use and the proliferation of F&B stores in the study area, the spatial distribution of commercial gentrification was illustrated. F&B stores were mapped yearly from 2011 to 2019 by means of kernel density estimation (hereinafter, KDE). Next, by examining the movements of F&B stores’ distributional centroids over time, the intensities of F&B commercialization and proliferation were analyzed. The standard deviational ellipses (hereinafter, SDE) were depicted to compute the centroid of F&B stores’ distribution during the three periods of 2011, 2015, and 2019.
First, to verify F&B commercial gentrification and illustrate its transformative effects on the urban physical environment, it is necessary to depict the spatial distribution of building use and F&B stores in the study area by year. The commercial use buildings in the study area were mapped in 2011 and 2019 to compare the impact before and after of commercial gentrification from when the urban green park was established (June 2015). F&B stores were illustrated through the KDE yearly from 2011 to 2019, computing the embedded KDE using the ArcGIS software. Using a kernel function, the extent of the scattered point’s density-per-unit area can be calculated for all of the raster. The estimation computes the raster value of a certain location (surface value) by accumulating the influence of each store in the study area. With the fixed raster unit area and the same search radius, we can compare the density distribution of scattered data by year for the same spatial influence of one store. The study applied a radius of 50 m, carrying out kernel density estimation from 2011 to 2019, yearly.
As previously mentioned (Section 2.2), the kernel density estimation (KDE) approach has been widely used to illustrate the density of scattered points of interest. Many studies have been conducted to express the quantified distribution of certain information using KDE, such as the distribution of retail stores or crime occurrence. Studies have tried to identify the delimitation of particular urban places, such as metropolitan boundaries [51] or CBD regions [52]. KDE computes the density of interests in fine increments, and therefore, it is suitable for studies requiring microscopic spatial analysis.
Second, factors that had a more significant impact in the vicinity of the provided large green linear open space or the previously formed commercial area on the formation of the commercial district across the entire study area were evaluated and compared. To trace the impact of F&B commercialization arising from commercial gentrification more quantitatively and objectively, standard deviational ellipses were conducted using the spatial data on F&B stores that were previously gathered, as in the KDE analysis. Computation was conducted using the embedded SDE in the ArcGIS software.
Standard deviational ellipses are applied to understand the dispersion or spread of scattered point data. A drawn ellipse with one standard deviation contains 63% of the features, with two equals 98%, and with three equals 99%. In principle, this polygon consists of 4 values—centroid, length of long and short axes, and direction of features. Except for the centroid, values are computed considering a certain percentage of the point data as equivalent to a selected standard deviation. Meanwhile, the value of the centroid is drawn containing the entire point data. Since the study is mainly concerned with the movement of the centroid and the information of the stores permeating into the block, we conducted a 63% standard deviation model from 2011 to 2019 in time series.
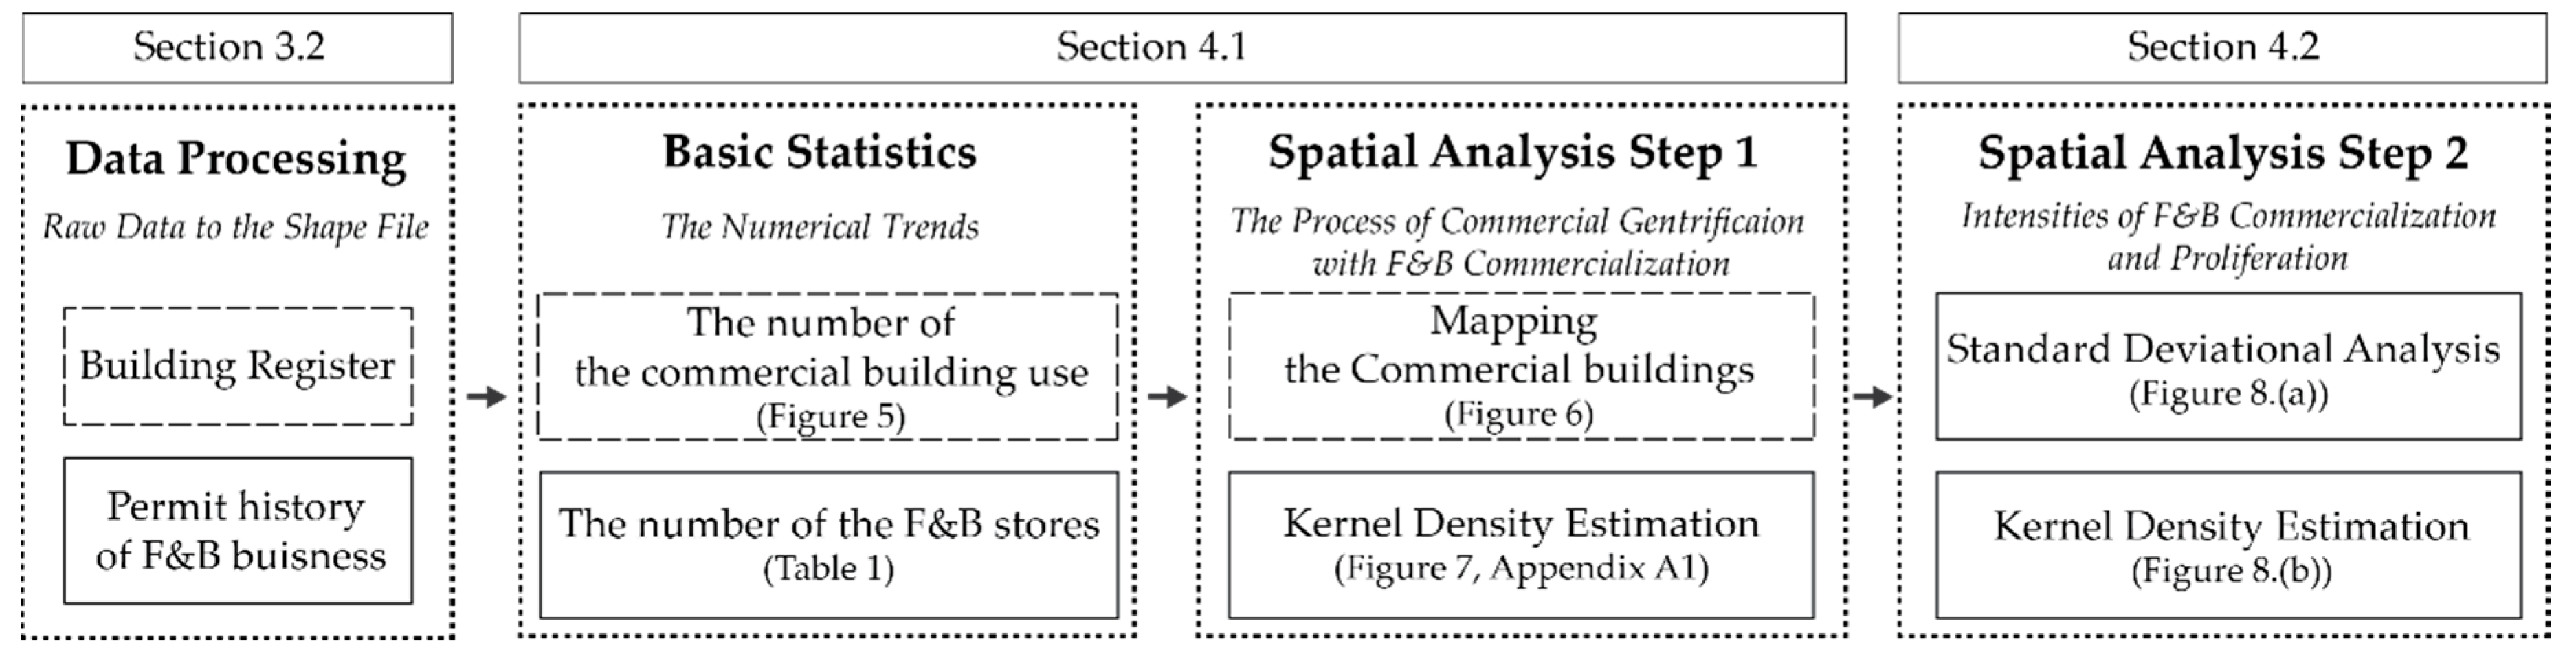
Researchers have used SDE to investigate the transformative characteristics of spatial distributions of interests by analyzing the movements of the ellipses’ centroids and change of ellipses’ size and angle, reflecting change of particular urban facilities’ distribution over time (e.g., cafés [48], cultural facilities [53], and retail markets [54]). To be specific, as points of interest become agglomerated in one particular region, the centroid of the ellipses moves to that region. Therefore, SDE is appropriate for researchers to compare intensities of agglomeration and proliferation for different regions in the study area (Figure 4).
4. Results
4.1. Commercial Gentrification with F&B Commercialization in Study Area
In order to quantify and interpret the commercial gentrification process intuitively, the rates of building uses by year since 2011 were investigated, and the locations of commercial use buildings were mapped in 2011 and 2019.
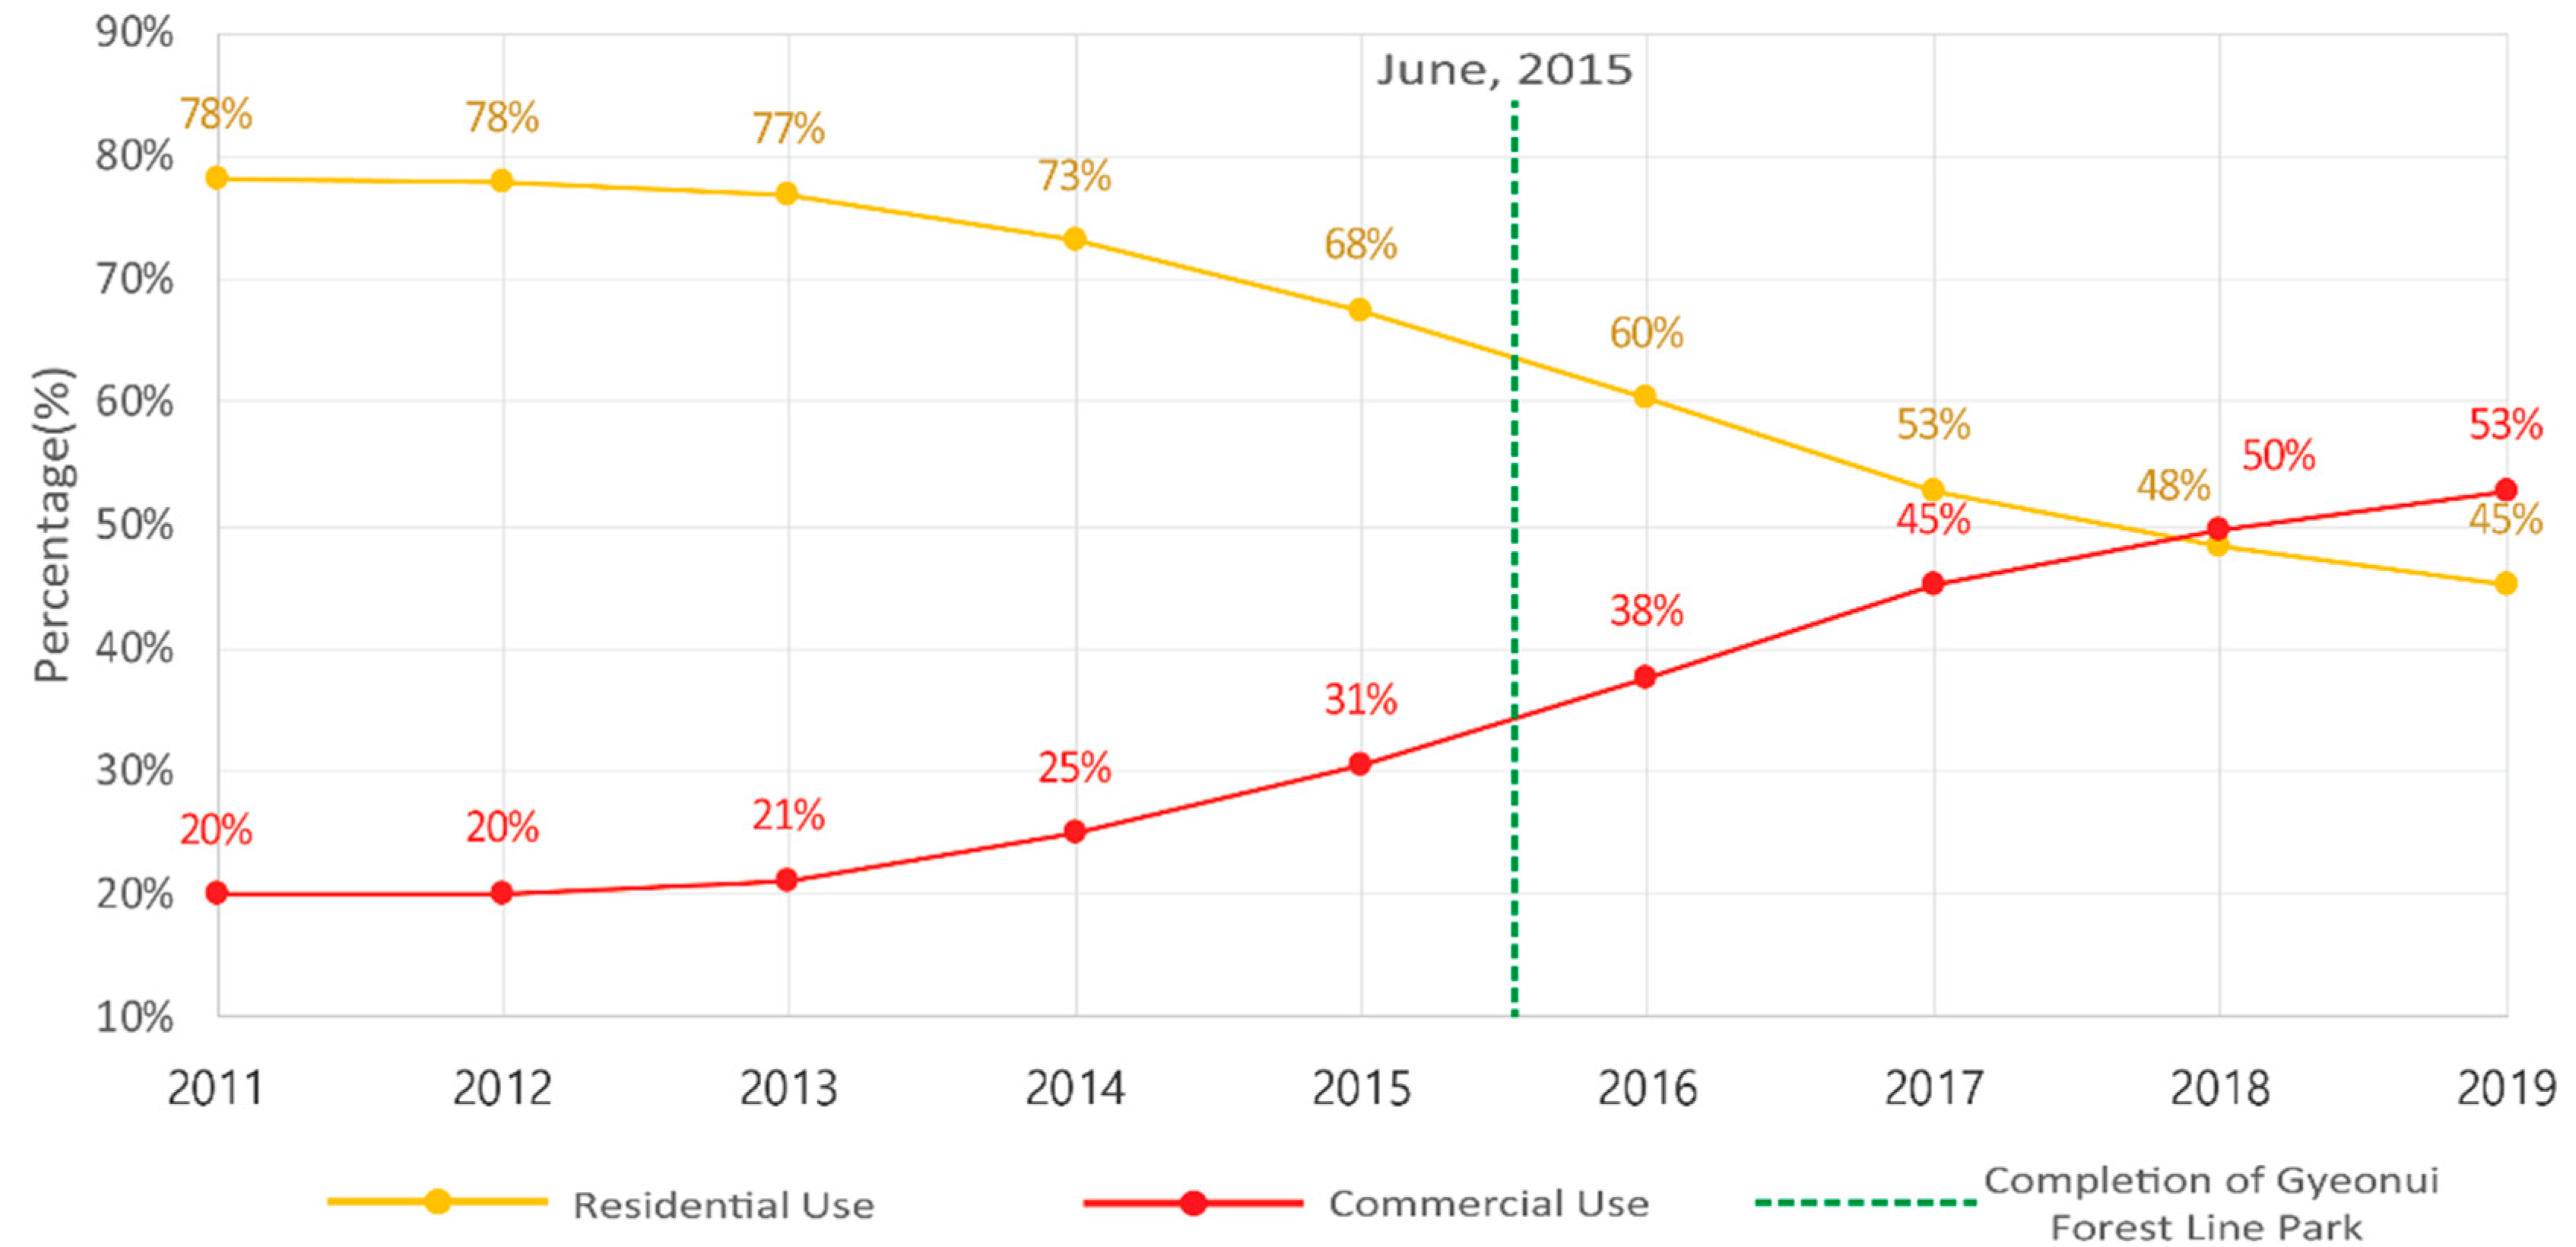
There has been a tremendous upheaval in building use since then. Figure 5 depicts this change during the study period for two main categories of building use, residential and commercial. For the first three years, residential and commercial use showed little change. However, since 2014, commercial use began skyrocketing; and the annual rate of commercial building use had risen by almost 6% between 2015 and 2017, while the same extent of decrease was seen in residential use. The greatest increase in commercial use was from 2015 to 2017, when the Gyeong-ui Forest Line Park was just completed, and the reversal in prevalence order of residential and commercial use finally occurred in 2018. Since then, the rate of commercial use has been increasing slowly.
Figure 6 reveals the impact of the commercialization of building uses in the study area in more detail, comparing the distribution of commercial buildings between 2011 and 2019. A widespread proliferation of commercial conversion occurred. In 2011, the commercial buildings were located mostly around the fringe of the study area, which had been characterized by neighborhood retail stores; in contrast, in 2019, the commercialization of the block has progressed considerably, and the area has been transformed into a definite commercial district.
Figure 6 shows that commercial permeation converted the space’s long-maintained residential identity to a commercial-mixed one, as commercial space replaced residential space. However, the effects of the provision of large green open spaces and the resultant process of commercial permeation characterized by commercial gentrification have not been sufficiently discussed.
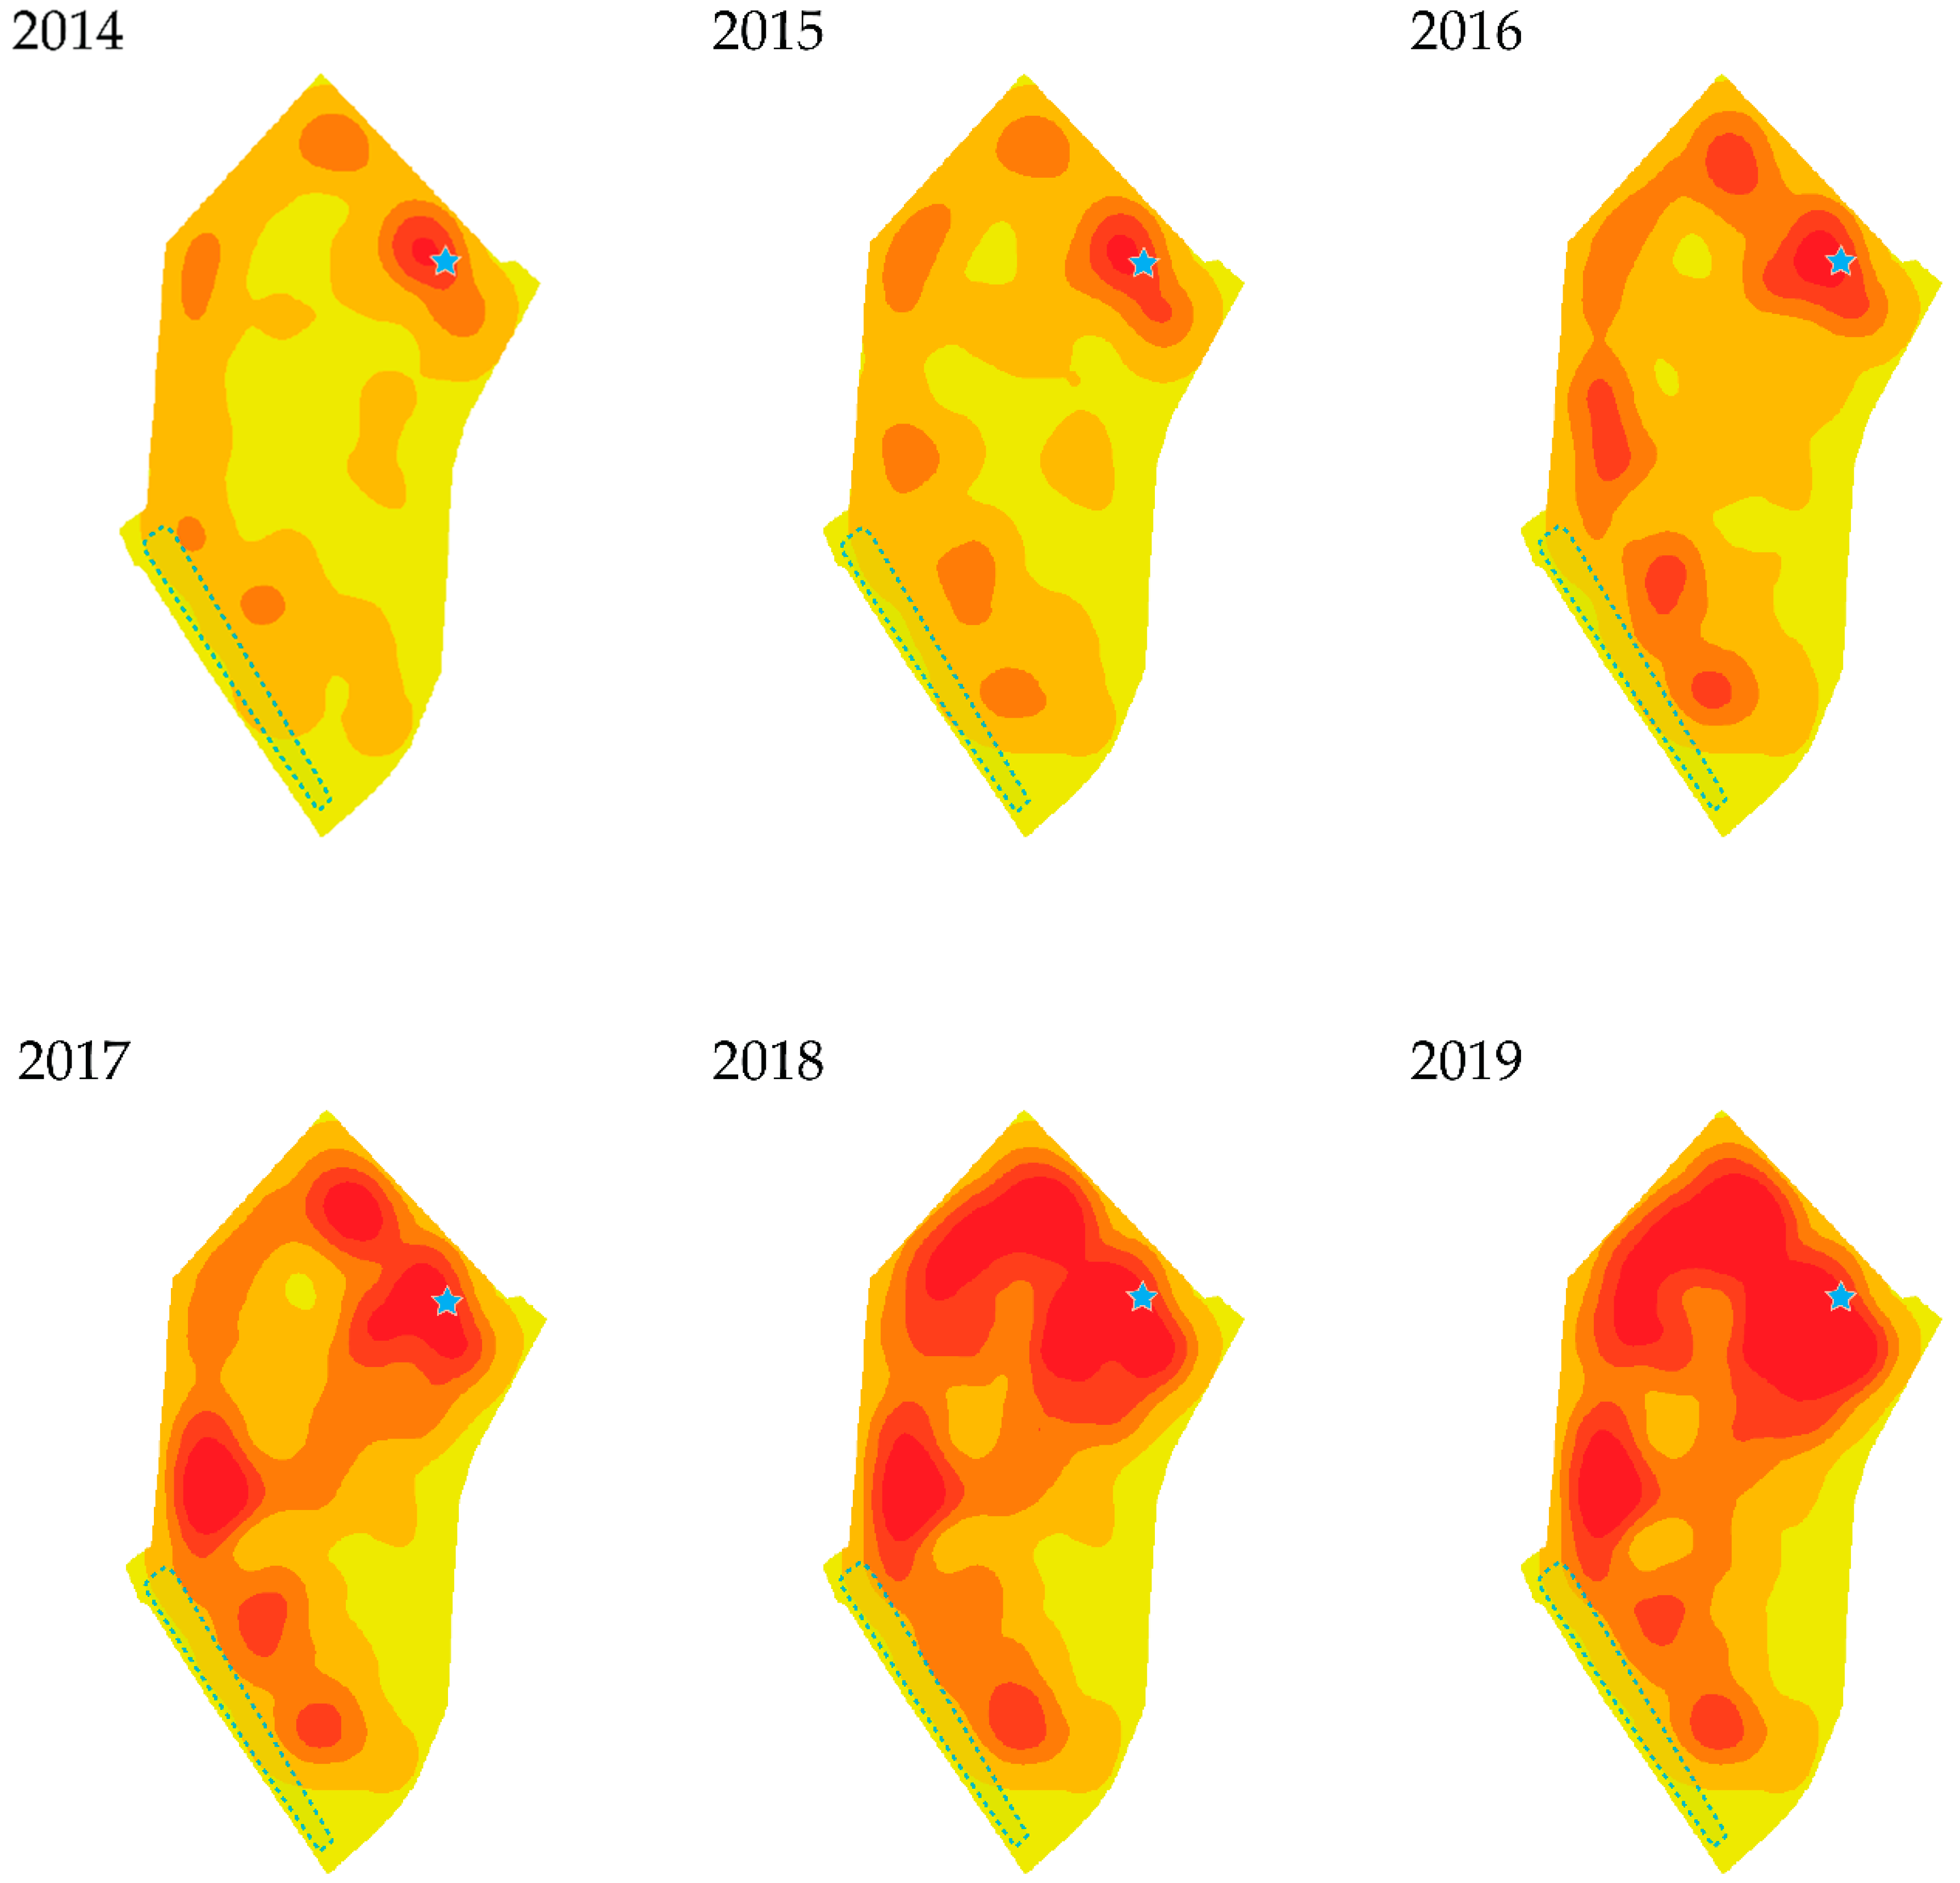
Meanwhile, commercial gentrification has occurred in the form of F&B commercialization. Table 1 depicts this progress during the study period, for increases in the number of F&B stores. Compared to the first year of the study, the number of F&B stores had increased by 432% in 2019. The first significant finding is that the number of F&B stores accelerated beginning 2 years before the completion of the Gyeong-ui Line Forest Park project; however, the increments expanded by 150% more from 2015 to 2018 compared with the period (2013–2015). In other words, the trend to F&B commercialization that emerged just before completion of the project, exploded after the completion of the project, leading the region’s identity to be defined by F&B retails.
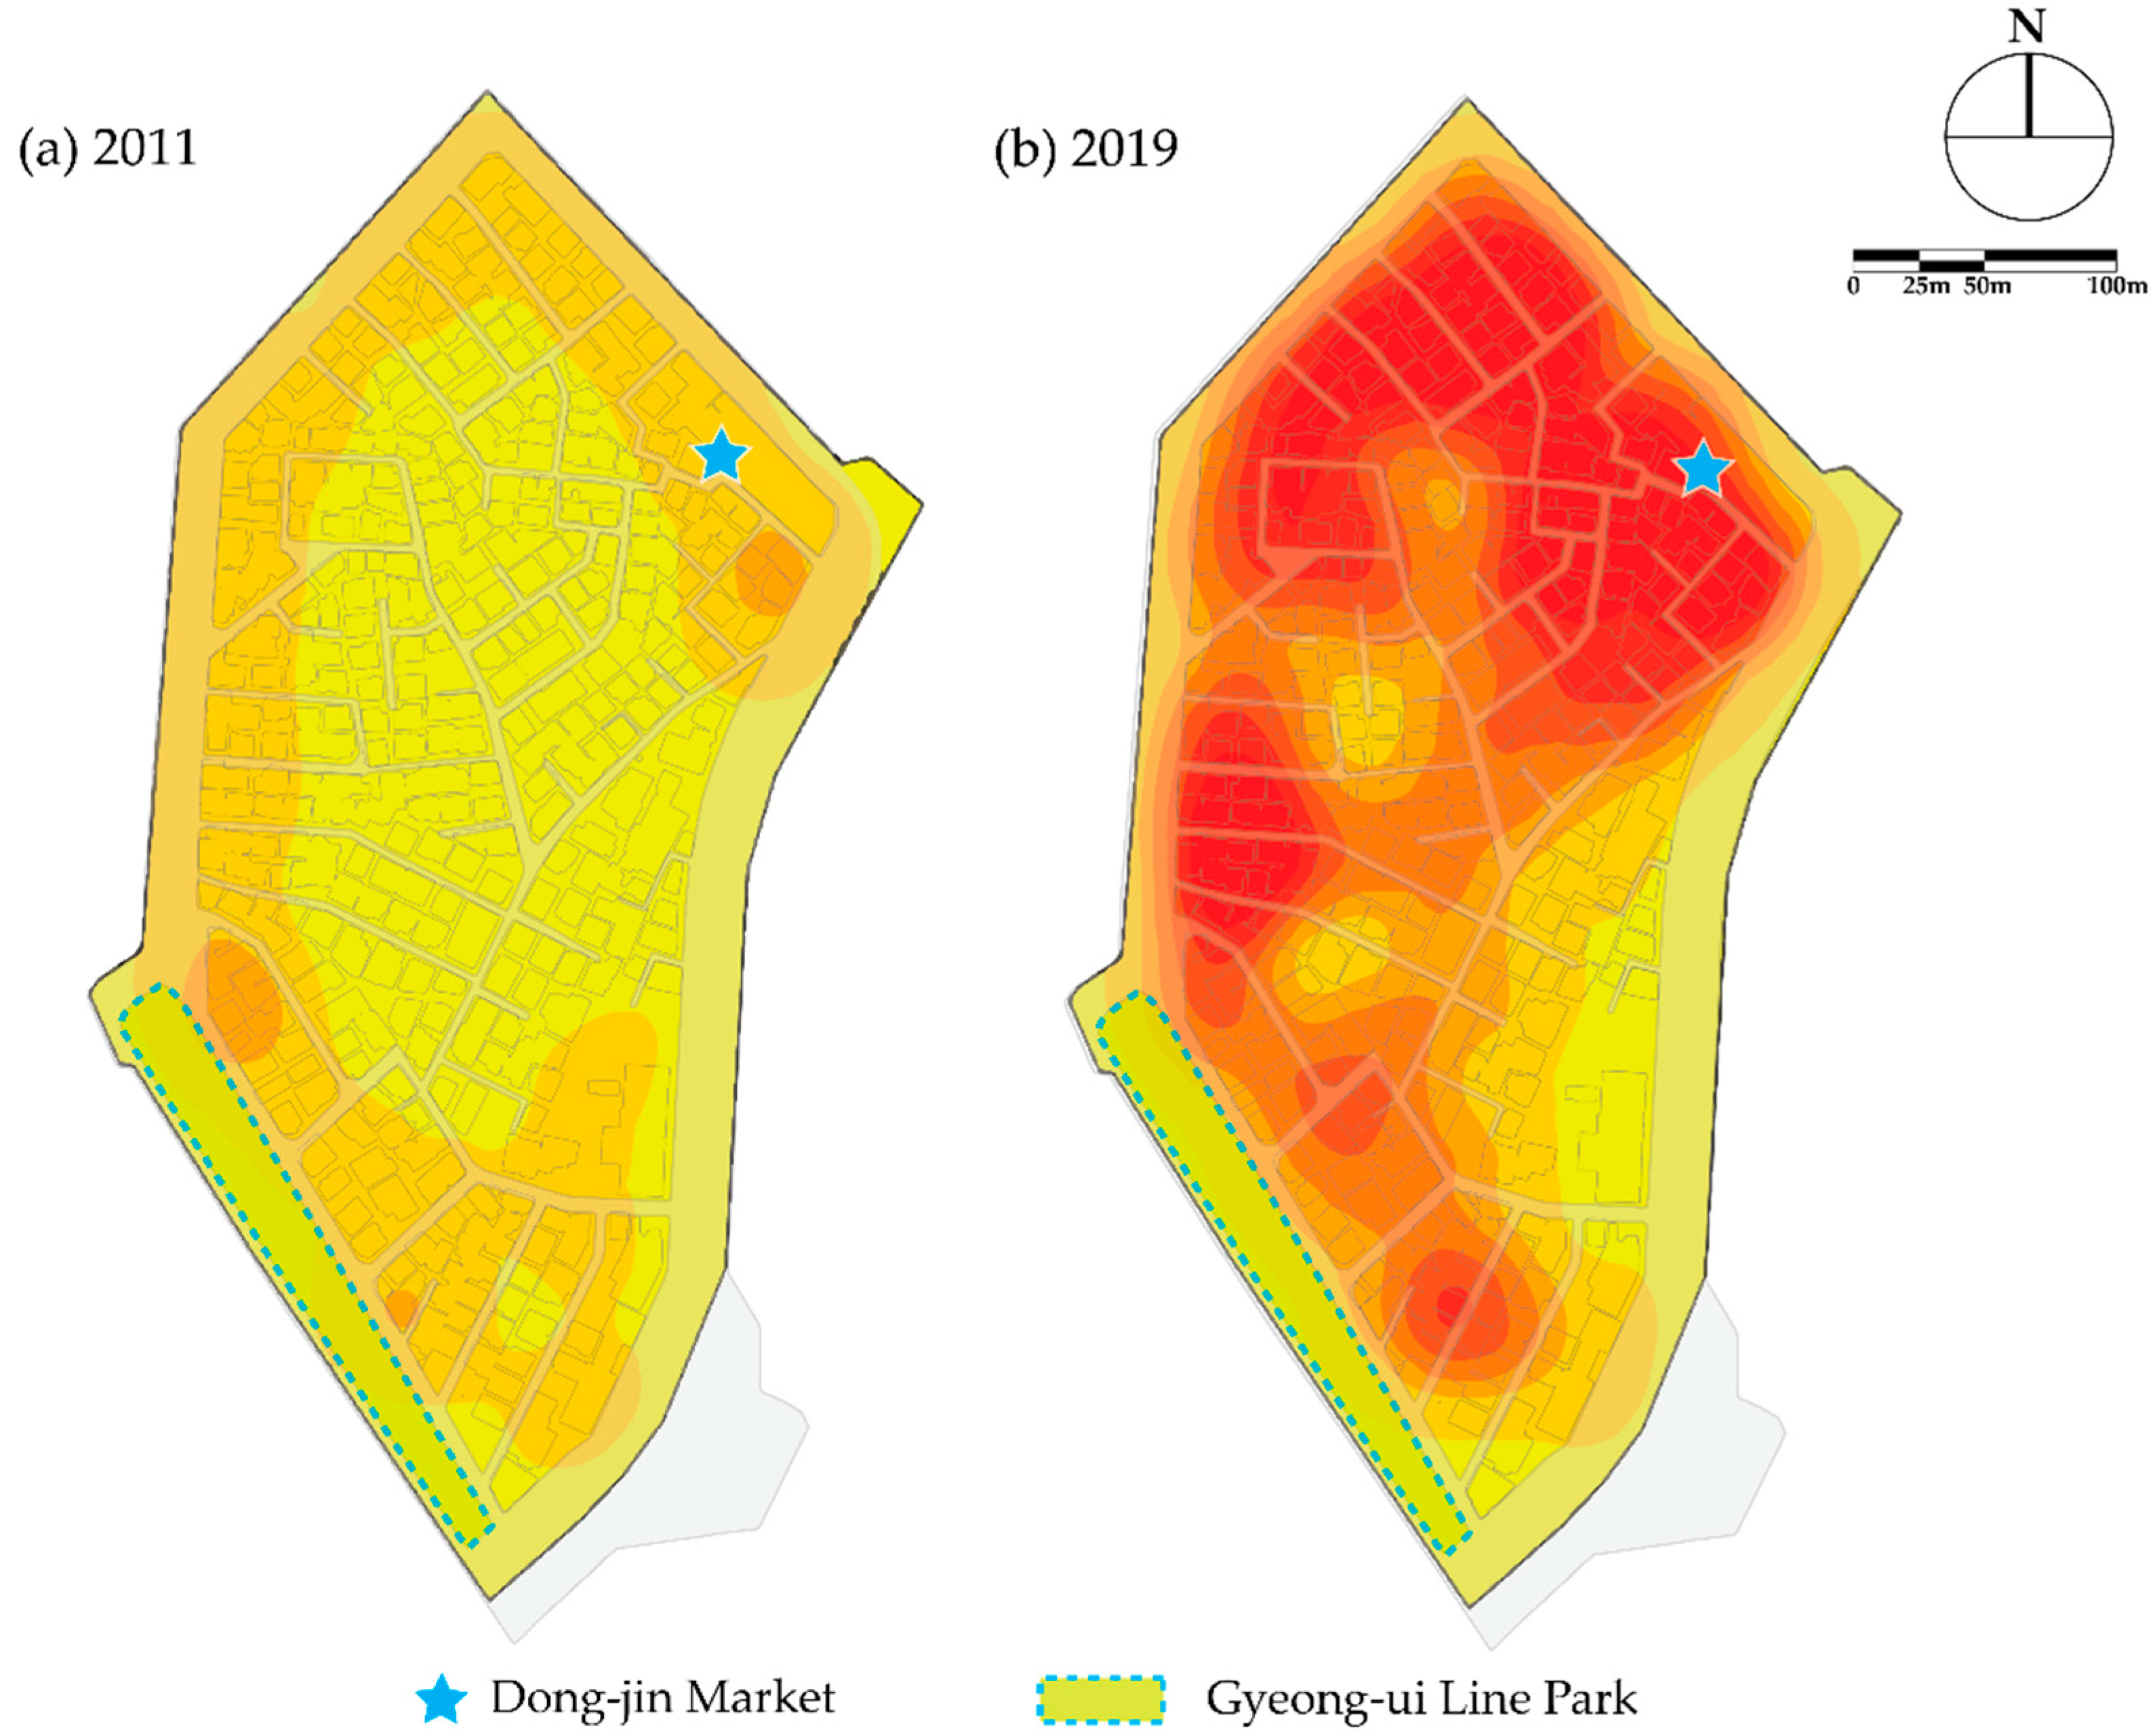
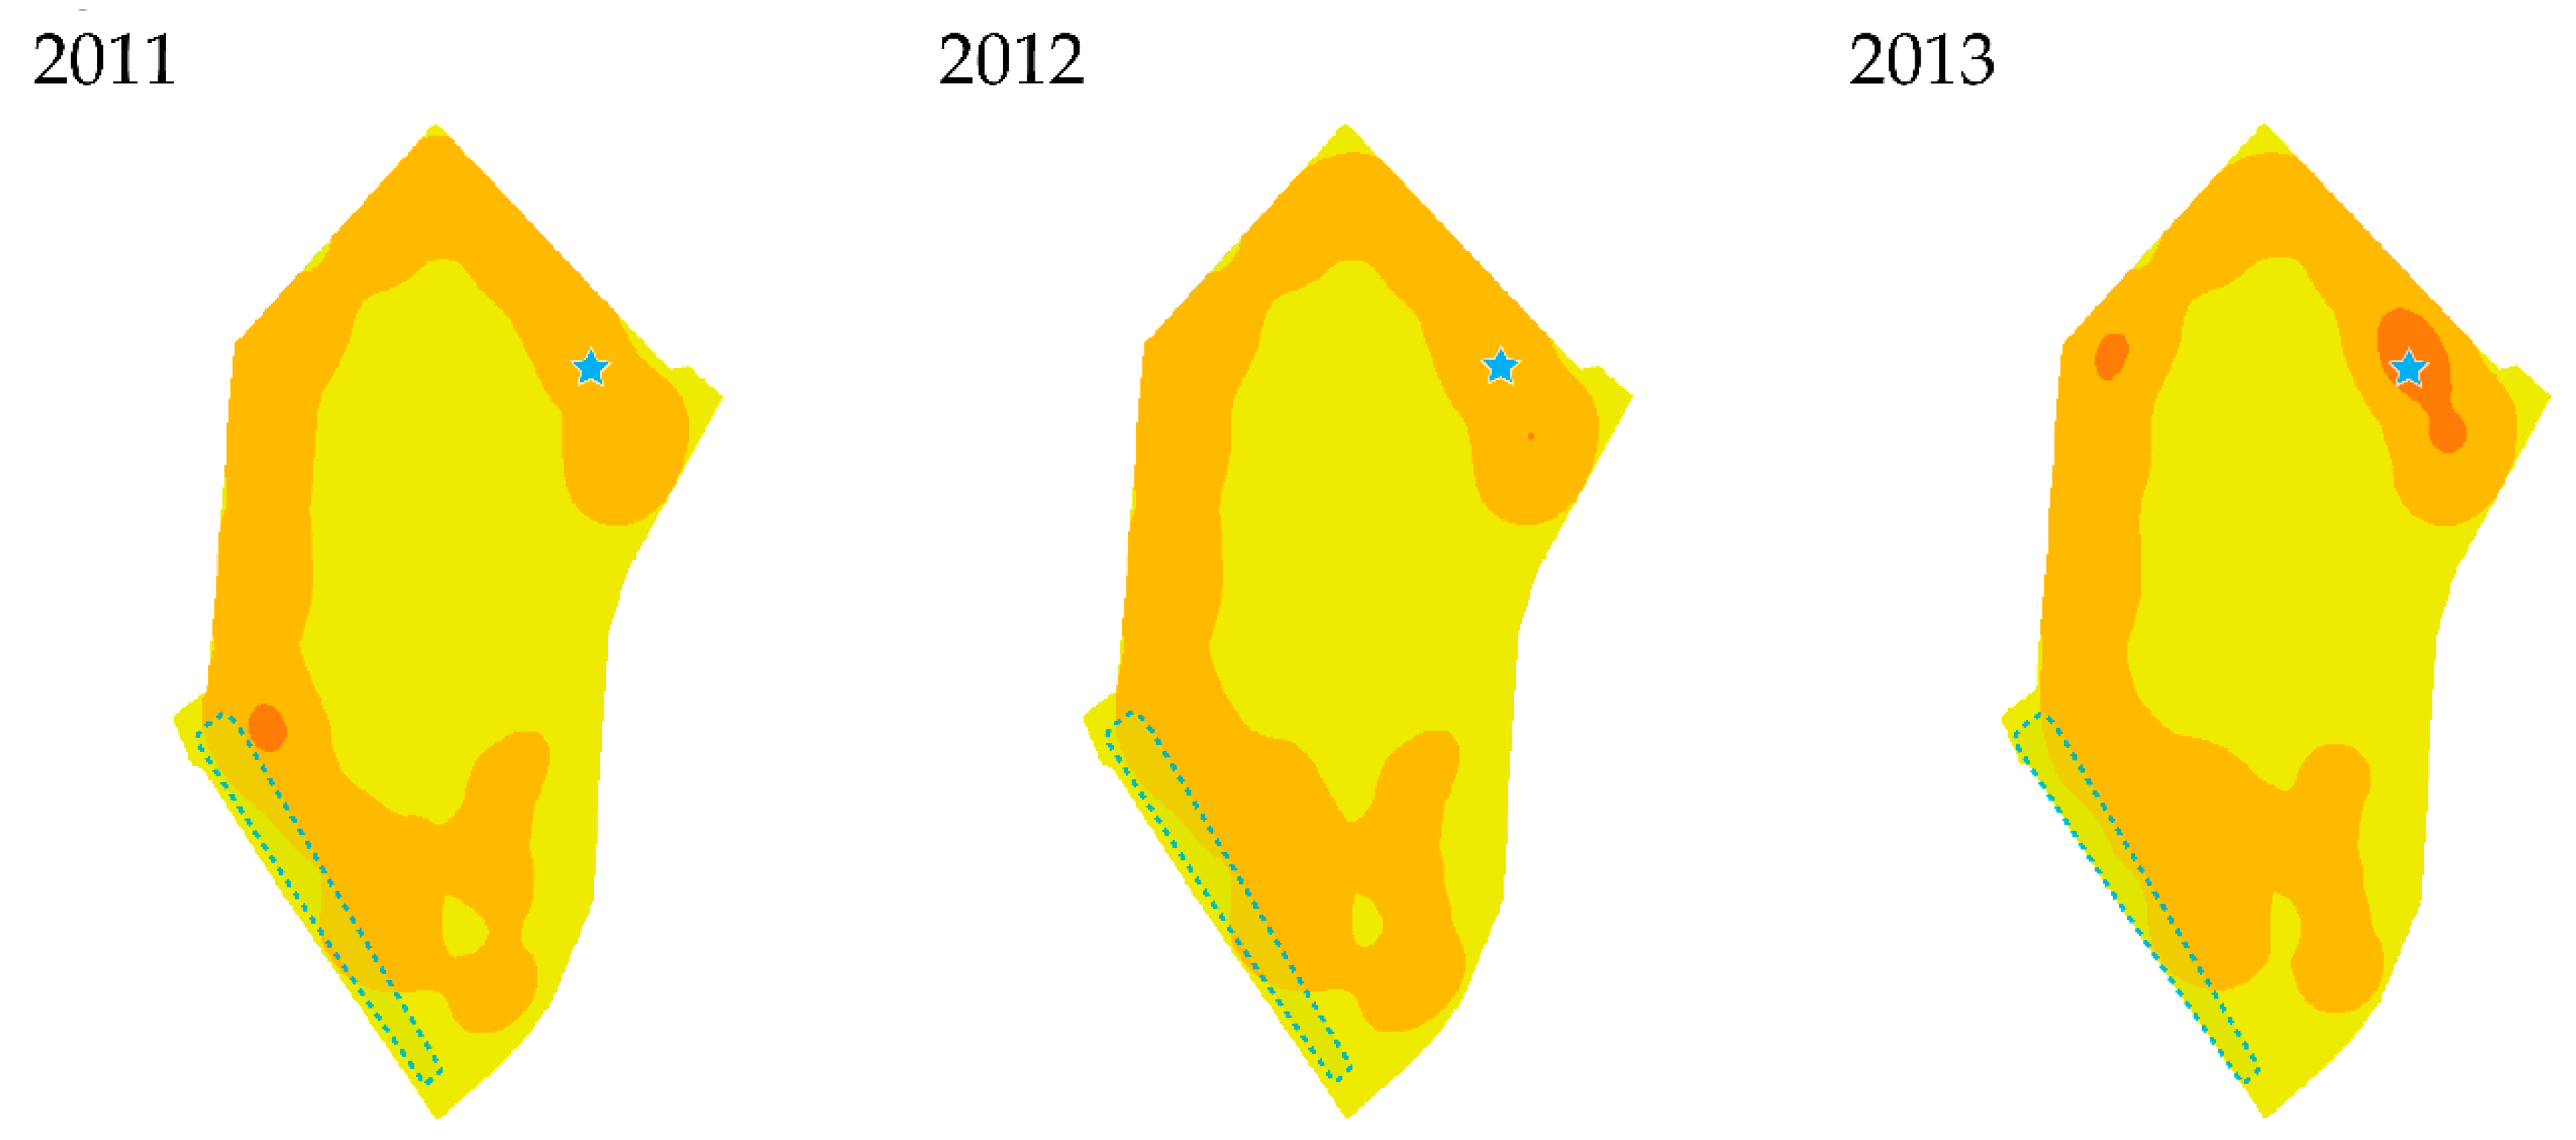
To trace out the F&B commercial gentrification affection, kernel density estimations (KDE) were conducted with F&B store point data in the study area (for more details, see Appendix A) by year. In 2011, F&B stores were distributed around the edge of the study area, like commercial changes of building use (compare Figure 7a with Figure 6a). In the meantime, in 2019, certain regions were denser than others; as we can see in Figure 7b, the regions near the Dong-jin market and upper regions are the most concentrated. This suggests that F&B stores did not spread homogeneously from where they were initially formed.
4.2. Spatial Analysis of F&B Proliferation: Comparing Two F&B Proliferation Regions
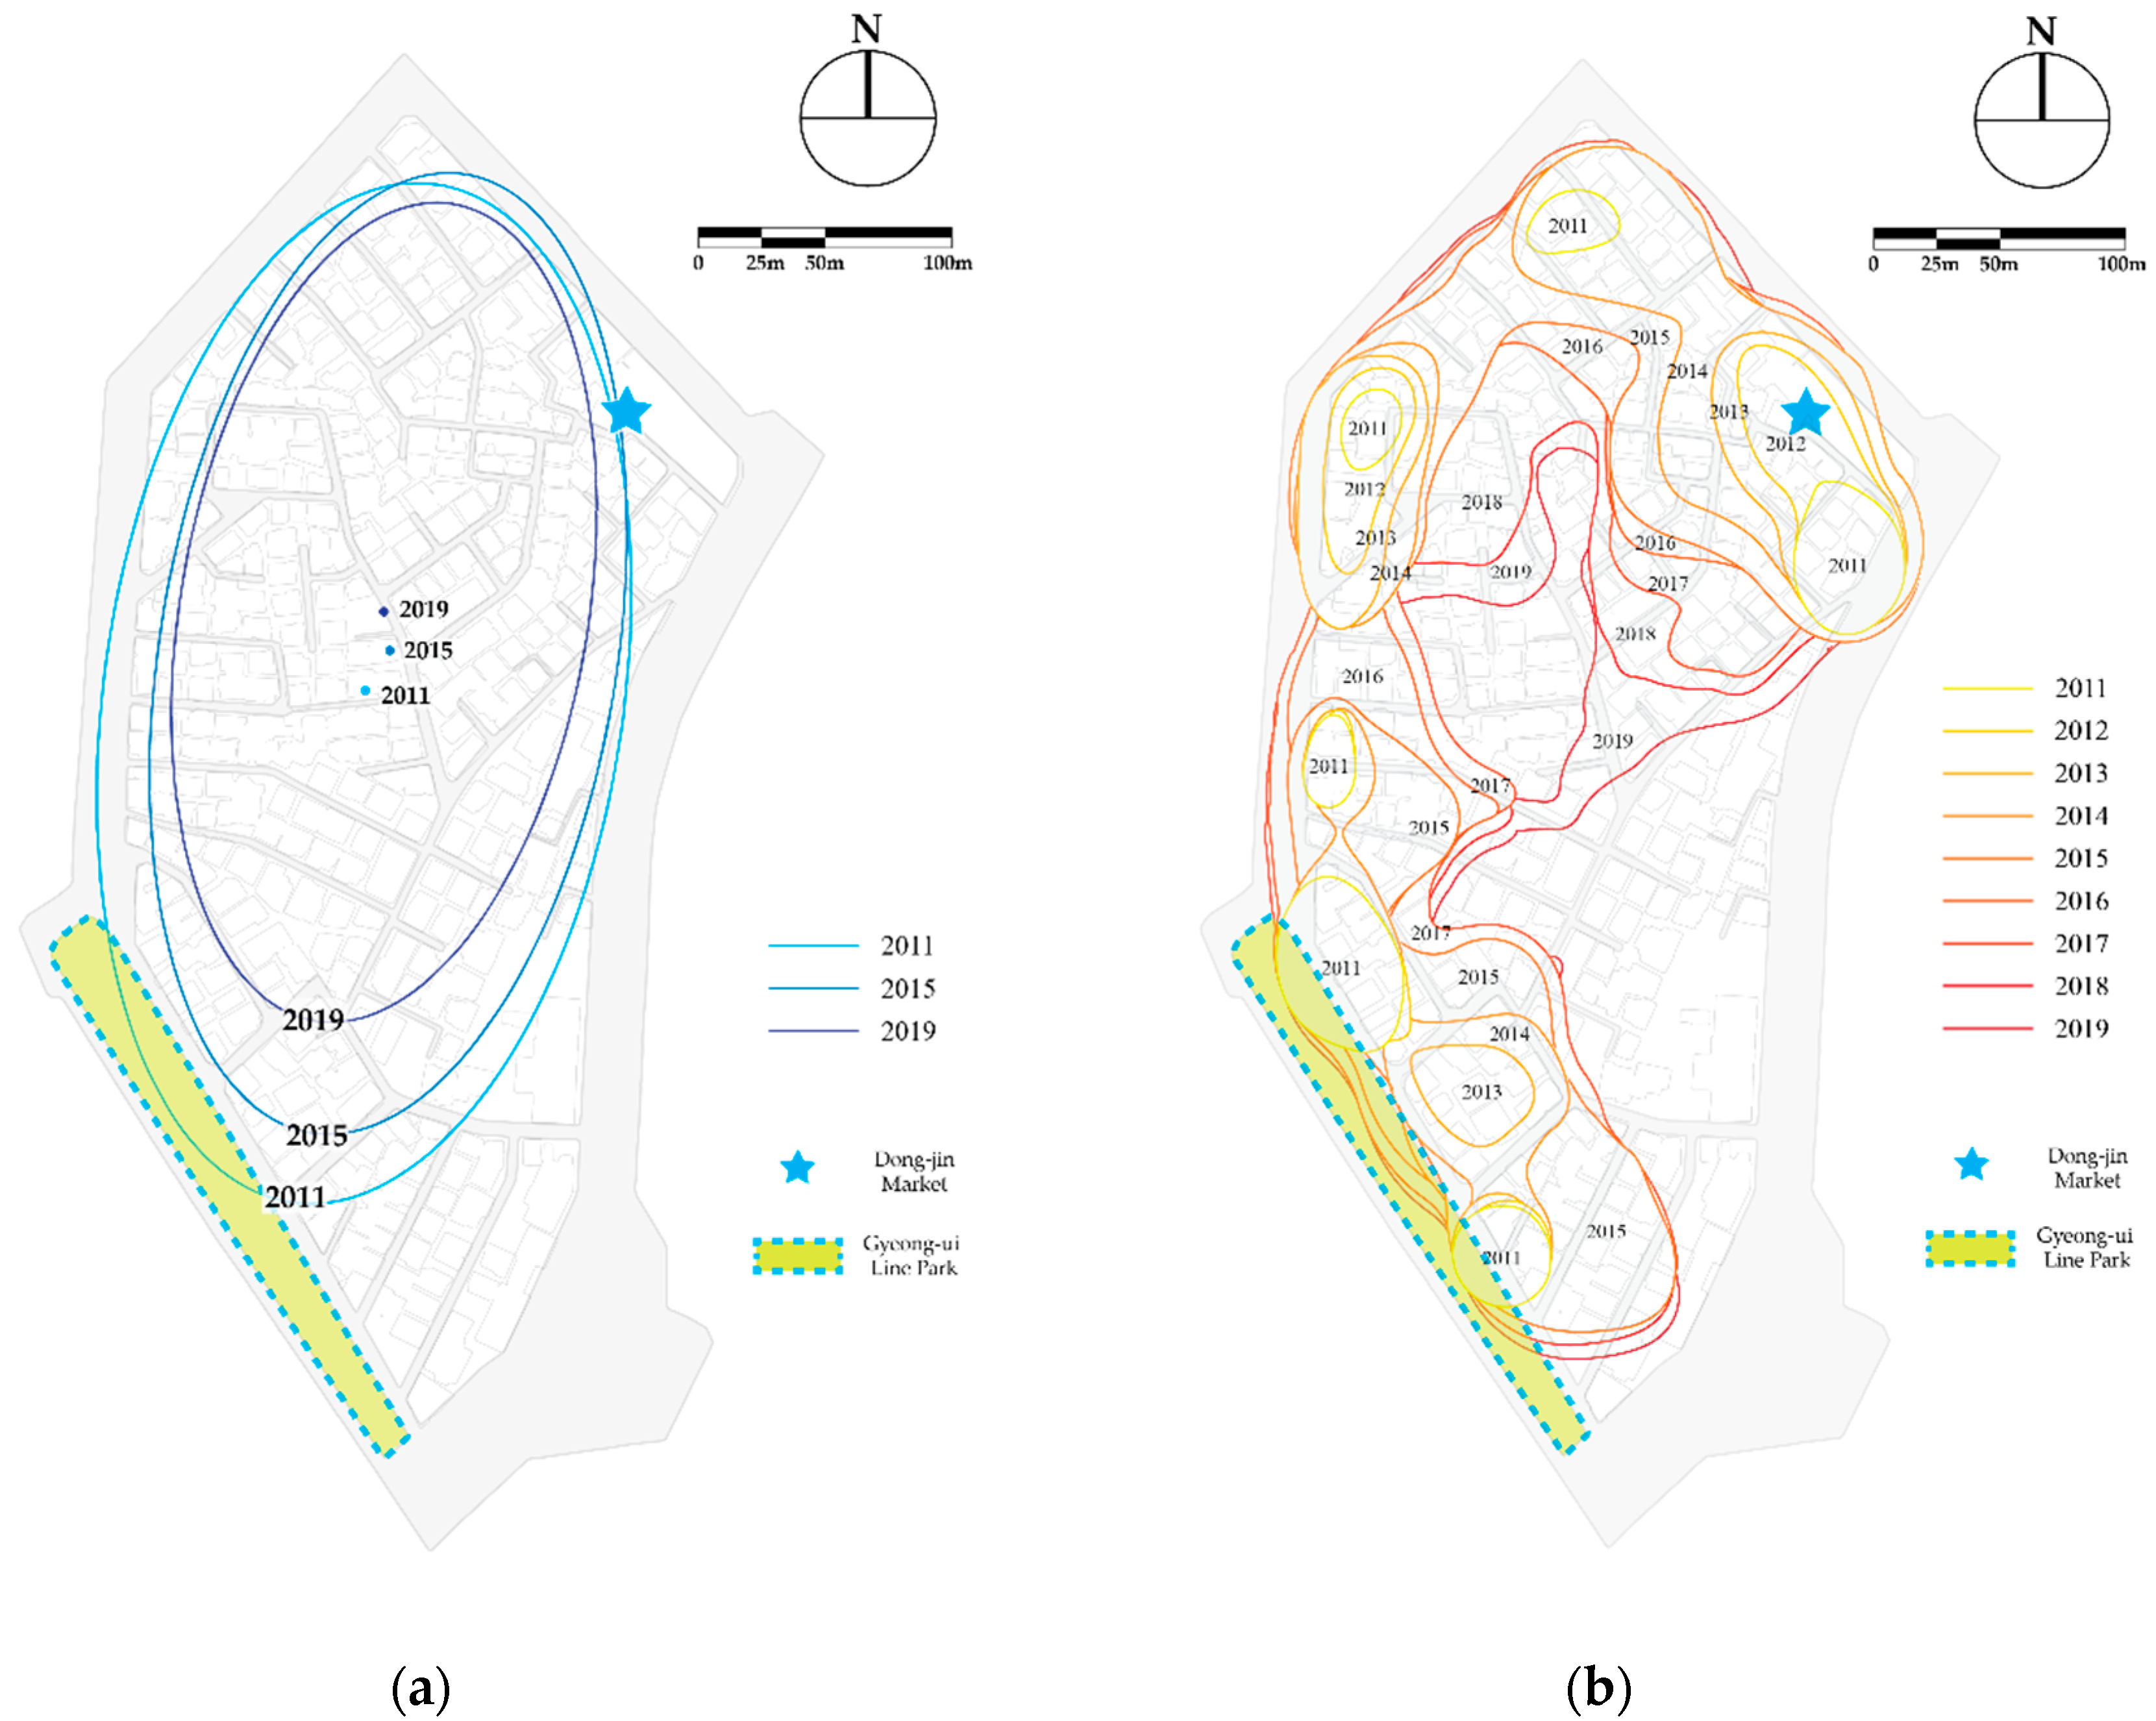
In order to quantify the impact of gentrification, standard deviational ellipses were depicted for each three years (Figure 8a). From 2011 to 2019, the length of the semi-major axis decreased by 19.4%, and the semi-minor axis also decreased by 21.6%. This means F&B stores have been concentrated inward compared to the first-year F&B distribution, suggesting that F&B stores have proliferated into the study’s district.
More importantly, the location of the centroid of the ellipse has significantly moved. From 2011 to 2015, the centroid moved +9.9 m latitudinally and +16.3 m longitudinally; then, from 2015 to 2019, the centroid moved −2.5 m latitudinally and +16.1 m longitudinally. Though such northward movements are not strictly heading for the Dong-jin Market, it is definitely demonstrated that the impact of proliferation in the two regions is not equivalent. Moreover, the power of proliferation was more potent in areas other than adjacent to the linear green park. However, it is difficult to say whether the Dong-jin Market comes under the region in the research question, in that a negative latitudinal movement was seen from 2015 to 2019.
In order to demonstrate the process more precisely, the contour lines of proliferation territories, indicating the area of proliferation each year, were illustrated by restructuring the raster illustration of KDEs (Appendix A). The highest density on the KDE rasters for the entire year is 8707, so that contour lines were depicted at an interval of 1000 units by each year, all at the same density. Then, by comparing the contour lines in time series, adaptable contour lines, considered to reflect as commercial proliferation, had sufficiently progressed, and were selected and drawn in the illustration (Figure 8b).
From 2011 to 2014, commercial spread seemingly path-shaped, was observed near the Dong-jin Market and the west side of the study area. There was no significant difference in the extension of the commercial area compared to the territory in 2011; however, rapid expansion was witnessed mainly on the fringe of the study area in both territories.
Since the Gyeong-ui line park opened (June 2015), substantial differences in proliferation patterns are identifiable between two regions. There is no meaningful change in the region near the Gyeong-ui Line Park since 2016; in contrast, significant commercial expansion has occurred near the Dong-jin Market during the same period, as previously described (Figure 7). Continuity of proliferation is found between the Dong-jin Market and west-side regions. Thus, it is suggested that the F&B commercial areas that have gradually expanded since 2016 are a continuous phenomenon of the Dong-jin Market’s proliferation that explains the Westside movement of the ellipse’s centroid from 2015 to 2019 more, so that it is deduced that the intensity of proliferation is stronger near the center of the previously formed F&B cluster.
5. Discussion
This study has shown the process of gentrification with F&B commercialization in a former residential district by analyzing building use and the distribution of F&B stores in the district, before and after the provision of a large linear urban park, Gyeong-ui Line Forest Park.
The results show, first, that by mapping the commercialization of building use and illustrating F&B stores’ distribution through the KDE method, commercial gentrification transforming the old-residential district into an F&B commercial area could be confirmed. Second, the number of F&B stores over time showed that the study area’s F&B commercialization had accelerated after the laying of the urban green park. Third, building use changes to commercial use and the related proliferation of F&B stores occurred both in the vicinity of the urban park provided by government-led projects and in that of the seed region where a cluster of F&B stores had previously been formed. Finally, analyzing the SDEs and the proliferation contour lines based on KDEs, F&B commercialization was found to be higher in the seed region.
First, the study confirmed that when a large green linear open space is provided, tourism that is linked to F&B commercial gentrification can occur, so that old-residential districts for local inhabitants transform into F&B commercial areas. Existing empirical studies on gentrification have been mostly conducted based on the shift from residential to retail commerce in the neighborhood as a decisive indicator. However, as can be seen in the results, it has been significantly demonstrated that when the power of gentrification intensifies, not only are neighborhood retail stores replaced by high-end stores, residential blocks are entirely converted into commercial districts by commercializing residential buildings. This finding contrasts with prior research mainly dealing with the transition of industrial areas and neighborhood commercial stores in residential area to gentrified forms [1,2,3,4], and highlights the broad influence of gentrification even outside its range of occurrence.
Second, other studies have analyzed the relationship between the provision of large green open space with gentrification [6,12], revealing a strong interrelationship between parks and gentrification in that the study area’s building use changes to commercial use—up to half of all the building use. As an attractor of external visitors [6,35,36], urban green park can trigger gentrification in nearby urban areas. The remarkable increment in F&B stores confirmed that gentrification with F&B commercialization had accelerated since the project was completed.
Third, building use changes to commercial use and the related proliferation of F&B stores occurred in both regions, spreading out from the nearby provided green linear park and from the center point of the previously formed small-sized commercial area. In addition, although commercialization at various points caused conversion of the local identity of the block into that of an F&B district, non-homogeneity of commercial proliferation was also found, in the area whereby the residential region remained amid the commercialized area. However, ultimately, regarding the main research question, the influence of proliferation was found to be greater in the previously formed small commercial area that had once been an old neighborhood market: the Dong-jin Market. These findings support possibilities for commercial gentrification with F&B commercialization in the two specific regions, reviewed in the literature review above (Section 2.1).
Finally, regarding the main research question, the influence of proliferation was found to be greater in the previously formed small commercial area. Proliferation of F&B stores does not just proceed from the vicinity of the park in an inward direction perpendicular to the park border, but also from seed points distant from the park, through within walking distance. Thus, it appears that areas in which small clusters of F&B stores were previously formed can see more proliferation than areas in the vicinity of the park. As previously mentioned (Section 2.2), Kim and Park [45] claimed that the intensity of commercialization was generally stronger in the previously existing commercial area in the case of Bukchon, Seoul. However, their case had limitations; their study area did not have plural factors causing commercial gentrification as in our case. Our finding confirmed that their argument can be applied even when the government-led urban green park is provided in an area away from the existing commercial area.
Nonetheless, there are a few limitations to our results; the agglomeration of F&B stores has been continuously expanding in space from the focused regions set by the study. It is sufficient to distinguish the pattern of proliferation by analyzing the contour lines of proliferation territories drawn from KDEs (Figure 8a); however, strictly speaking, the homogeneity of each F&B agglomeration should be inspected based on its inherent characteristics, like the architecture of the property, the type(s) of F&B store(s), and, in particular, whether they are franchise stores or not. Future studies to improve the preciseness of this work need to be developed.
6. Conclusions
This paper analyzed the commercial gentrification process with F&B commercialization from the perspective of spatial transformation. Specifically, the study identified the context that experiences more intense commercialization, comparing the region in the vicinity of the urban park established by a government-led project and the seed region where a cluster of F&B stores had previously formed. Our study discovered that an old-residential district transformed into an F&B commercial district after the urban green park was opened; and we empirically demonstrated that the seed region, which had a small, previously formed F&B store cluster, was more influenced by F&B commercialization.
Considering the spatial transformation aspect of commercial gentrification has its own limitations. First is the question of the mechanism in the context of each region that triggers F&B commercialization and its proliferation. Research to shed light on the accurate causes of commercialization and proliferation of F&B stores will be a meaningful topic for future studies. Further research incorporating architectural properties and land prices can lead to enriched results. Second, this study has limitations as a single case study, and hence, its validity must be verified by research conducted at other sites.
Nevertheless, by thoroughly examining the proliferation patterns, our finding offers a few insightful policy implications for urban planners and designers trying to understand the detailed spatial process of commercial gentrification and to predict the extent of commercialization under different location conditions with the provision of government-led urban green open spaces. Not just the region adjacent to the provided green open space, which is predicted to attract visitors, but also the rear regions, where property values are lower than the surrounding area, so that the small-scale agglomeration of F&B stores is prone to be formed, have to be considered as high-potential regions for gentrification. With this finding, planners and developers can consider the possibility of accelerating F&B commercialization and controlling the proliferation range by intentionally handling the previously formed seed. Careful planning is required regarding the internal space between the boundary of the provided urban green open space and places with cultural and historical background, which were previously commercialized to some degree.
This paper showed exactly how F&B commercialization spreads and functions given the different context of regions in the block-size districts where commercial gentrification occurred from the perspective of spatial change. More studies need to be conducted over the existing trend in order to view commercial gentrification socio-demographically. Hamnett [55] proclaimed that gentrification is a “double-edged sword”, with both positive and negative impacts on urban environments. One side of scholars has paid attention to its displacement impacts on indigenous neighborhoods; however, in contrast, the other side has focused on its regeneration impacts from the perspective of economic rehabilitation and rising property values [1]. Rather than deciding which view is correct, more neutral studies concentrating on gentrification’s spatial impacts on the urban environment are necessary.
Author Contributions
Conceptualization, W.C., H.K., and Y.K.; methodology, W.C., M.K., H.K., and Y.K.; software, W.C. and M.K.; validation, W.C. and H.K.; formal analysis, W.C., M.K., and H.K.; investigation, W.C. and M.K.; resources, W.C. and M.K.; data curation, W.C., M.K., and H.K.; writing—original draft preparation, W.C., M.K., and H.K.; writing—review and editing, W.C., H.K., and Y.K.; visualization, W.C. and M.K.; supervision, H.K. and Y.K.; project administration, Y.K.; funding acquisition, Y.K. All authors have read and agreed to the published version of the manuscript.
Funding
This research was supported by the Creative-Pioneering Researchers Program funded by Seoul National University and the Basic Science Research Program through the National Research Foundation of Korea funded by the Ministry of Education (2018R1D1A1B07048832).
Acknowledgments
This work is financially supported by Korea Ministry of Land, Infrastructure and Transport (MOLIT) as 「Innovative Talent Education Program for Smart City」. This research was also supported by the Institute of Construction and Environmental Engineering at Seoul National University. The authors wish to express their gratitude for the support.
Conflicts of Interest
The authors declare no conflict of interest.
Appendix A
Figure A1.
Kernel density estimation from 2011 to 2019 in the study area.


References
- Doucet, B. A Process of Change and a Changing Process: Introduction to the Special Issue on Contemporary Gentrification. Tijdschr. Voor Econ. Soc. Geogr. 2014, 105, 125–139. [Google Scholar] [CrossRef]
- Glass, R. Introduction to London: Aspects of Change; Centre for Urban Studies: London, UK, 1963. [Google Scholar]
- Hamnett, C.; Whitelegg, D. Loft conversion and gentrification in London: From industrial to postindustrial land use. Environ. Plan. A Econ. Space 2007, 39, 106–124. [Google Scholar] [CrossRef]
- Zukin, S.; Trujillo, V.; Frase, P.; Jackson, D.; Recuber, T.; Walker, A. New retail capital and neighborhood change: Boutiques and gentrification in New York City. City Community 2009, 8, 47–64. [Google Scholar] [CrossRef]
- Checker, M. Wiped out by the “Greenwave”: Environmental gentrification and the paradoxical politics of urban sustainability. City Soc. 2011, 23, 210–229. [Google Scholar] [CrossRef]
- Lim, H.; Kim, J.; Potter, C.; Bae, W. Urban regeneration and gentrification: Land use impacts of the Cheonggye Stream Restoration Project on the Seoul’s central business district. Habitat Int. 2013, 39, 192–200. [Google Scholar] [CrossRef]
- Delgadillo, V. Selective modernization of Mexico City and its historic center. Gentrification without displacement? Urban Geogr. 2016, 37, 1154–1174. [Google Scholar] [CrossRef]
- Ergun, N. Gentrification in Istanbul. Cities 2004, 21, 391–405. [Google Scholar] [CrossRef]
- Janoschka, M.; Sequera, J.; Salinas, L. Gentrification in Spain and Latin America—A critical dialogue. Int. J. Urban Reg. Res. 2014, 38, 1234–1265. [Google Scholar] [CrossRef] [Green Version]
- Kwon, Y.; Joo, S.; Han, S.; Park, C. Mapping the distribution pattern of gentrification near urban parks in the case of Gyeongui Line Forest Park, Seoul, Korea. Sustainability 2017, 9, 231. [Google Scholar] [CrossRef] [Green Version]
- Wang, S.W.H. Commercial gentrification and entrepreneurial governance in Shanghai: A case study of Taikang Road Creative Cluster. Urban Policy Res. 2011, 29, 363–380. [Google Scholar] [CrossRef]
- Park, J.; Kim, J. Economic impacts of a linear urban park on local businesses: The case of Gyeongui Line Forest Park in Seoul. Landsc. Urban Plan. 2019, 181, 139–147. [Google Scholar] [CrossRef]
- Yoon, Y.; Park, J. Stage classification and characteristics analysis of commercial gentrification in Seoul. Sustainability 2018, 10, 2440. [Google Scholar] [CrossRef] [Green Version]
- Lee, H.; Kwon, Y. Commercial Use Expansion patterns in the Cultural Quarter near Hongik University—With special emphasis on a residential district near the Cultural Quarter consisting mainly of detached, low-rise houses. J. Urban Des. Inst. Korea Urban Des. 2016, 17, 101–117. [Google Scholar]
- Shin, H.B. Property-based redevelopment and gentrification: The case of Seoul, South Korea. Geoforum 2009, 40, 906–917. [Google Scholar] [CrossRef]
- Cheshire, P. Why do birds of a feather flock together? Social mix and social welfare: A quantitative appraisal. Mix. Communities Gentrification Stealth 2011, 17–24. [Google Scholar] [CrossRef]
- Gonzalez, S.; Waley, P. Traditional retail markets: The new gentrification frontier? Antipode 2013, 45, 965–983. [Google Scholar] [CrossRef] [Green Version]
- Gotham, K.F. Tourism gentrification: The case of New Orleans’ vieux carre (French quarter). Urban Stud. 2005, 42, 145–176. [Google Scholar] [CrossRef]
- Kang, C.D. Spatial access to pedestrians and retail sales in Seoul, Korea. Habitat Int. 2016, 57, 110–120. [Google Scholar] [CrossRef]
- Smith, N. The New Urban Frontier: Gentrification and the Revanchist City; Routledge: London, UK, 1996. [Google Scholar]
- Smith, N. Commentary: Gentrification and the rent gap. Ann. Assoc. Am. Geogr. 1987, 77, 462–465. [Google Scholar] [CrossRef]
- Chalana, M. Balancing history and development in Seattle’s Pike/Pine neighborhood conservation district. J. Am. Plan. Assoc. 2016, 82, 182–184. [Google Scholar] [CrossRef]
- “Yeontral Park”, A New Hot Spot. Available online: http://english.visitseoul.net/nature/Yeontral-Park-A-New-Hot-Spot_/32164 (accessed on 3 April 2020).
- Özdemir, D.; Selçuk, İ. From pedestrianisation to commercial gentrification: The case of Kadıköy in Istanbul. Cities 2017, 65, 10–23. [Google Scholar] [CrossRef]
- Jeong, Y.; Heo, J.; Jung, C. Behind the bustling street: Commercial gentrification of Gyeongridan, Seoul. Procedia Soc. Behav. Sci. 2015, 170, 146–154. [Google Scholar] [CrossRef] [Green Version]
- Choi, M.J.; Shin, S.M. An empirical analysis of the effects of mergers on hospital performance. J. Korea Plan. Assoc. 2001, 36, 75–83. [Google Scholar]
- Cócola-Gant, A. Tourism and commercial gentrification. In Proceedings of the The Ideal City: Between Myth and Reality, Urbino, Italy, 27–29 August 2015; Available online: http://www.rc21.org/en/conferences/urbino2015/ (accessed on 7 April 2020).
- Litman, T.A. Economic value of walkability. Transp. Res. Rec. 2003, 1828, 3–11. [Google Scholar] [CrossRef] [Green Version]
- Ganser, A. Big Data & Parks. In The High Line Magazine; 2016; Available online: https://www.thehighline.org/blog/2017/01/18/high-line-magazine-b1g-daa-and-parks/ (accessed on 7 April 2020).
- Tajima, K. New estimates of the demand for urban green space: Implications for valuing the environmental benefits of Boston’s big dig project. J. Urban Aff. 2003, 25, 641–655. [Google Scholar] [CrossRef]
- Immergluck, D.; Balan, T. Sustainable for whom? Green urban development, environmental gentrification, and the Atlanta Beltline. Urban Geogr. 2018, 39, 546–562. [Google Scholar] [CrossRef]
- Ernstson, H. The social production of ecosystem services: A framework for studying environmental justice and ecological complexity in urbanized landscapes. Landsc. Urban Plan. 2013, 109, 7–17. [Google Scholar] [CrossRef] [Green Version]
- Maas, J.; Verheij, R.A.; De Vries, S.; Spreeuwenberg, P.; Schellevis, F.G.; Groenewegen, P.P. Morbidity is related to a green living environment. J. Epidemiol. Community Health 2009, 63, 967–973. [Google Scholar] [CrossRef] [Green Version]
- Villeneuve, P.J.; Jerrett, M.G.; Su, J.; Burnett, R.T.; Chen, H.; Wheeler, A.J.; Goldberg, M.S. A cohort study relating urban green space with mortality in Ontario, Canada. Environ. Res. 2012, 115, 51–58. [Google Scholar] [CrossRef]
- Ernst & Young. Analysis of Secondary Economic Impacts New York City Parks Capital Expenditures (Final Report); Ernst & Young: London, UK, 2003. [Google Scholar]
- Konijnendijk, C.C.; Annerstedt, M.; Nielsen, A.B.; Maruthaveeran, S. Benefits of Urban Parks—A Systematic Review; A Research Report for IPFRA; International Federation of Parks and Recreation Administration: London, UK, 2013. [Google Scholar]
- Sevtsuk, A. Location and agglomeration: The distribution of retail and food businesses in dense urban environments. J. Plan. Educ. Res. 2014, 34, 374–393. [Google Scholar] [CrossRef]
- Burnett, K. Commodifying poverty: Gentrification and consumption in Vancouver’s Downtown Eastside. Urban Geogr. 2014, 35, 157–176. [Google Scholar] [CrossRef]
- Guimarães, P.P.C. Exploring the impacts of gentrified traditional retail markets in Lisbon in Local Neighbourhoods. Soc. Sci. 2019, 8, 190. [Google Scholar] [CrossRef] [Green Version]
- Jones, P.; Hillier, D.; Comfort, D. Changing times and changing places for market halls and covered markets. Int. J. Retail Distrib. Manag. 2007, 35, 200–209. [Google Scholar] [CrossRef]
- Guimarães, P.P.C. The Transformation of Retail Markets in Lisbon: An Analysis through the Lens of Retail Gentrification. Eur. Plan. Stud. 2018, 26, 1450–1470. [Google Scholar] [CrossRef]
- Smith, N. Toward a theory of gentrification: A back to the city movement by capital, not people. J. Am. Plan. Assoc. 1979, 45, 538–548. [Google Scholar] [CrossRef]
- Jeong, Y.; Heo, J.; Jung, C. Retail gentrification in residential neighborhoods: Gyeongridan, Seoul. Asian J. Behav. Stud. 2018, 3, 125. [Google Scholar] [CrossRef]
- Hwang, H.; Baek, K.Y.; Byun, B. Urban Ecology and Urban Spatial Structure; Boseongkag: Seoul, Korea, 2002. [Google Scholar]
- Kim, D.; Park, J.A. Using space-time pattern analysis to detect commercial diffusion area in gentrified area-focused on the case of Bukchon in Seoul. J. Korea Plan. Assoc. 2018, 53, 23–37. [Google Scholar] [CrossRef]
- Cui, C.; Han, Z. Spatial patterns of retail stores using POIs data in Zhengzhou, China. In Proceedings of the 2015 2nd IEEE International Conference on Spatial Data Mining and Geographical Knowledge Services (ICSDM), Fuzhou, China, 8–10 July 2015; pp. 88–92. [Google Scholar]
- Reigadinha, T.; Godinho, P.; Dias, J. Portuguese food retailers—Exploring three classic theories of retail location. J. Retail Consum. Serv. 2017, 34, 102–116. [Google Scholar] [CrossRef] [Green Version]
- Jin, C.-J.; Park, H.-S.; Kang, J.-M. An empirical analysis of locational tendency of coffee shops around Hongik University. J. Urban Des. Inst. Korea Urban Des. 2012, 13, 71–82. [Google Scholar]
- Park, E. A Study on Regional Preference Factors of Creative Class: Focusing on the Creative Milieu Characteristics of Yeonnam-Dong, Seoul. Ph.D. Thesis, Seoul National University, Seoul, Korea, 2014. [Google Scholar]
- Seoul Metropolitan Government. A Comprehensive Plan for Gentrification in Seoul; Seoul Metropolitan Government: Seoul, Korea, 2015. [Google Scholar]
- Peng, J.; Zhao, S.; Liu, Y.; Tian, L. Identifying the urban-rural fringe using wavelet transform and kernel density estimation: A case study in Beijing City, China. Environ. Model. Softw. 2016, 83, 286–302. [Google Scholar] [CrossRef]
- Yu, W.; Ai, T.; Shao, S. The analysis and delimitation of Central Business District using network kernel density estimation. J. Transp. Geogr. 2015, 45, 32–47. [Google Scholar] [CrossRef]
- Lee, J.; Choi, S.-D. Spatial Distribution Characteristics analysis of cultural infrastructure in Seoul: A focus on distribution of population and density of use. J. Tour. Stud. 2018, 30, 61–80. [Google Scholar] [CrossRef]
- Shi, Y.S.; Wu, J.; Wang, S.Y. Spatio-temporal features and the dynamic mechanism of shopping center expansion in Shanghai. Appl. Geogr. 2015, 65, 93–108. [Google Scholar] [CrossRef]
- Hamnett, C. Unequal City: London in the Global Arena; Routledge: London, UK, 2003. [Google Scholar]
Figure 1.
Zoning of the study area’s surroundings.

Figure 2.
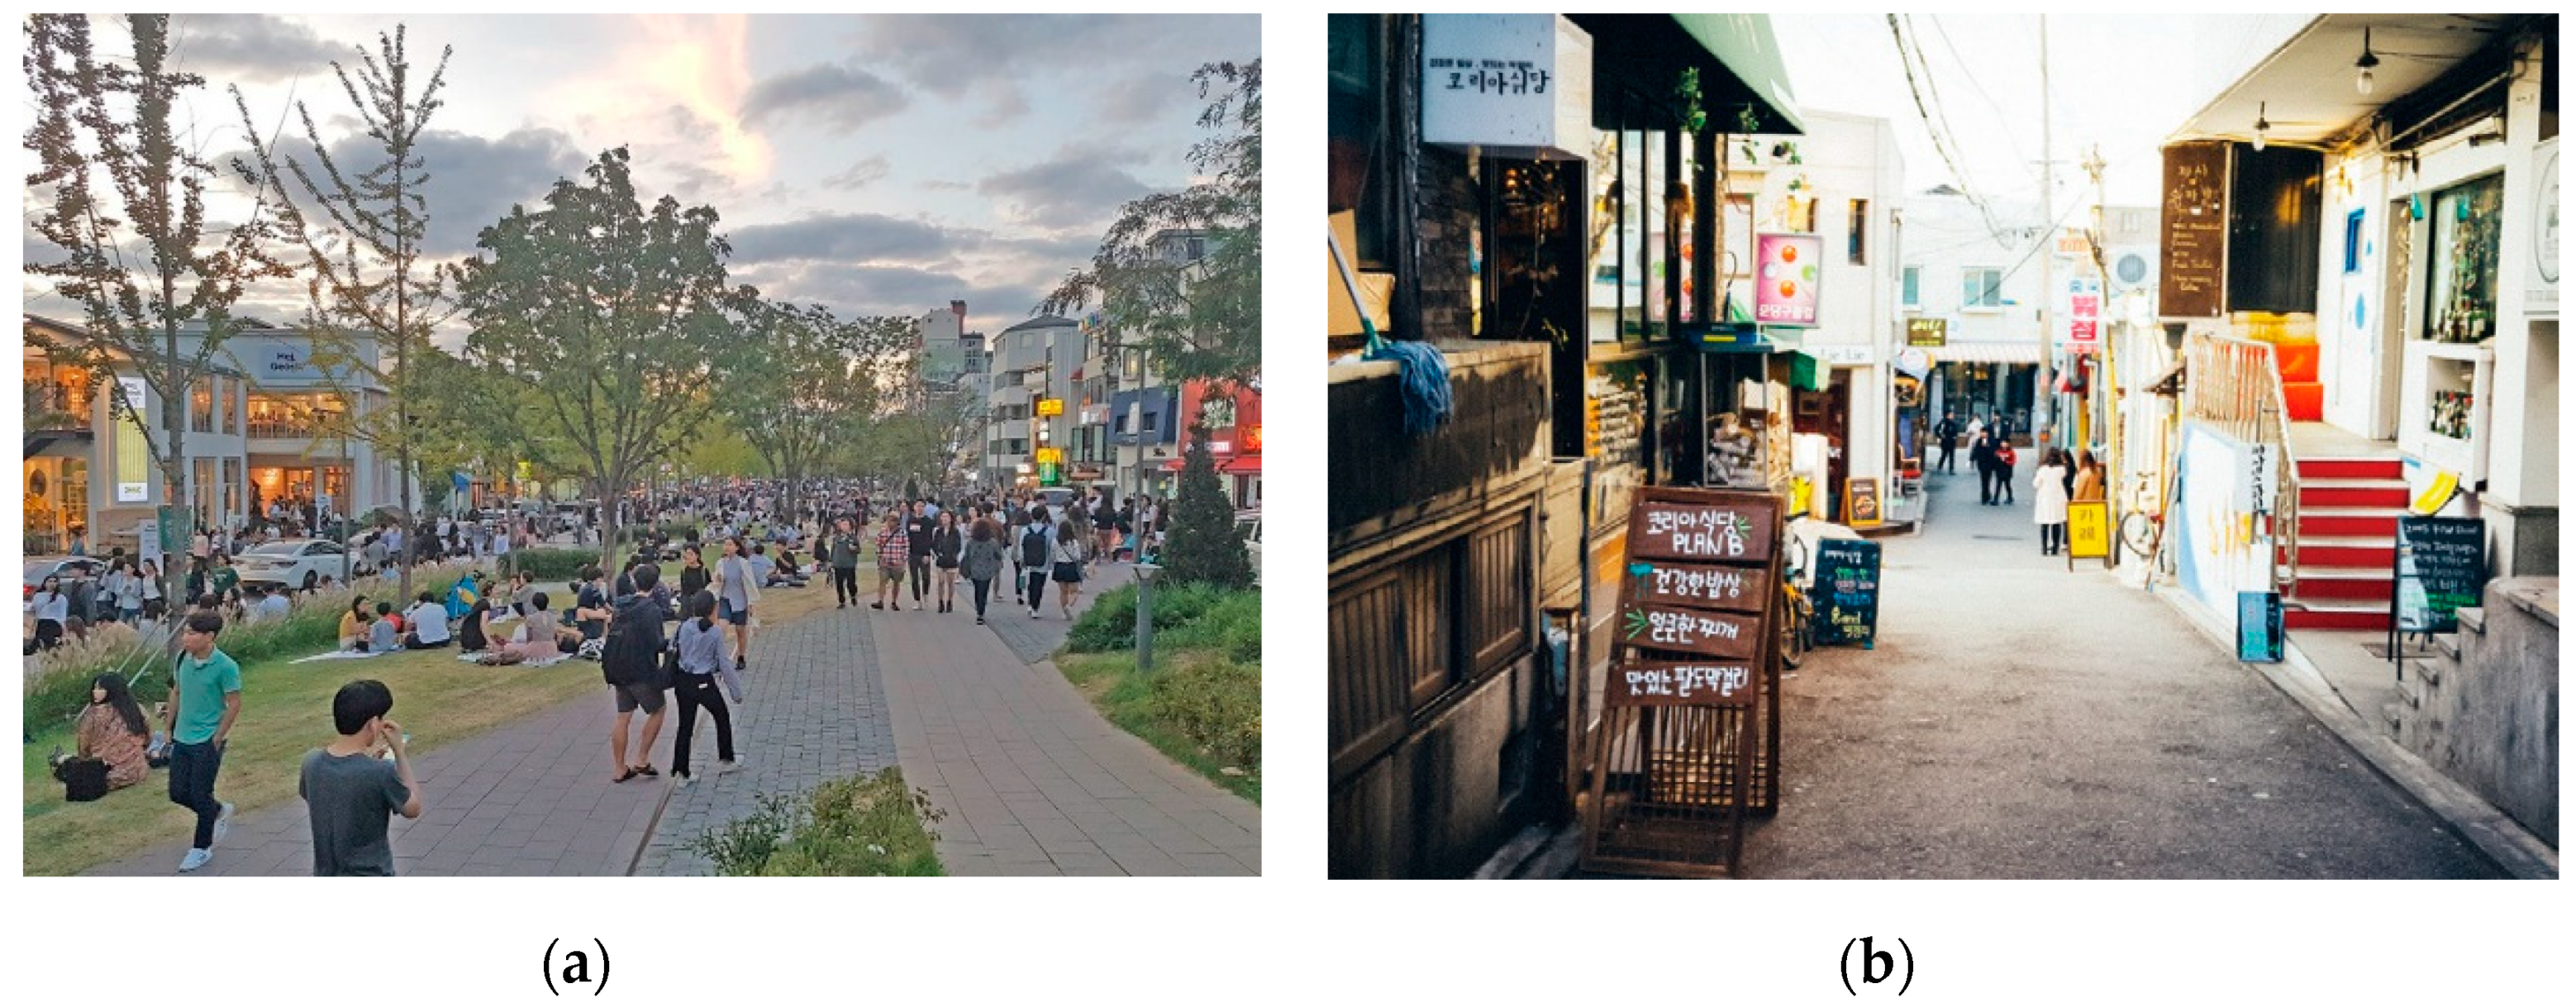
Yeon-nam dong, (a) Yeontral Park, boundary region of the Gyeong-ui Line Park (https://www.habkorea.net/6-fun-activities-for-valentines-day-in-seoul/), (b) nearby region of the Dong-jin Market (http://onsabo.daesang.co.kr:8080/article/241)
Figure 2.
Yeon-nam dong, (a) Yeontral Park, boundary region of the Gyeong-ui Line Park (https://www.habkorea.net/6-fun-activities-for-valentines-day-in-seoul/), (b) nearby region of the Dong-jin Market (http://onsabo.daesang.co.kr:8080/article/241)

Figure 3.
F&B store distribution of Yeon-nam dong, 2011 and 2019.

Figure 4.
The analytical framework of the study.

Figure 5.
The rates of residential and commercial building use in the commercial district in Yeon-nam dong (Total = 416).
Figure 5.
The rates of residential and commercial building use in the commercial district in Yeon-nam dong (Total = 416).

Figure 6.
Increase of commercial building use in the study area (Total = 416).

Figure 7.
Changes in F&B stores in 2019 compared to 2011, by kernel density estimations (KDE).

Figure 8.
(a) Standard deviation ellipses (s = 1) of F&B store in 2011, 2015, 2019, and (b) contour lines of proliferation territories by year (2011–2019).
Figure 8.
(a) Standard deviation ellipses (s = 1) of F&B store in 2011, 2015, 2019, and (b) contour lines of proliferation territories by year (2011–2019).


Table 1.
The number and increase of F&B stores.
| 2011 | 2012 | 2013 | 2014 | 2015 | 2016 | 2017 | 2018 | 2019 | |
|---|---|---|---|---|---|---|---|---|---|
| Number | 69 | 75 | 80 | 120 | 158 | 220 | 279 | 344 | 367 |
| Increase | - | +6 | +5 | +40 | +38 | +62 | +59 | +65 | +23 |
© 2020 by the authors. Licensee MDPI, Basel, Switzerland. This article is an open access article distributed under the terms and conditions of the Creative Commons Attribution (CC BY) license (http://creativecommons.org/licenses/by/4.0/).
Share and Cite
MDPI and ACS Style
Cho, W.; Kim, M.; Kim, H.; Kwon, Y. Transforming Housing to Commercial Use: A Case Study on Commercial Gentrification in Yeon-nam District, Seoul. Sustainability 2020, 12, 4322. https://0-doi-org.brum.beds.ac.uk/10.3390/su12104322
AMA Style
Cho W, Kim M, Kim H, Kwon Y. Transforming Housing to Commercial Use: A Case Study on Commercial Gentrification in Yeon-nam District, Seoul. Sustainability. 2020; 12(10):4322. https://0-doi-org.brum.beds.ac.uk/10.3390/su12104322
Chicago/Turabian StyleCho, Wonjun, Minho Kim, Hyunjung Kim, and Youngsang Kwon. 2020. "Transforming Housing to Commercial Use: A Case Study on Commercial Gentrification in Yeon-nam District, Seoul" Sustainability 12, no. 10: 4322. https://0-doi-org.brum.beds.ac.uk/10.3390/su12104322
Note that from the first issue of 2016, this journal uses article numbers instead of page numbers. See further details here.