Analysis of the Level of Service of Unloading Zones Using Diversity Measures in a Multiplex Network


Department of Transport and Geotechnical Engineering, Universidade Federal de Minas Gerais, Belo Horizonte 31515-212, Brazil
*
Author to whom correspondence should be addressed.
Sustainability 2020, 12(10), 4330; https://0-doi-org.brum.beds.ac.uk/10.3390/su12104330
Submission received: 10 April 2020
/
Revised: 13 May 2020
/
Accepted: 21 May 2020
/
Published: 25 May 2020
(This article belongs to the Special Issue Methods for Improving Sustainability of Passenger and Freight Transport)
Abstract
:Unloading zones are a fundamental part of the infrastructure of urban freight transport. The location and accessibility of unloading zones to commercial establishments reduce the operating time and, consequently, the transportation costs. In general, unloading zones are located on-street and allocated by local authorities. In this context, this paper aims to evaluate the level of service of unloading zones. The research approach uses the diversity measures in a multiplex network to identify the level of service and cargo accessibility of unloading zones. An analysis is developed for the central area of Belo Horizonte (Brazil). The results indicate that unloading zones located up to 25 m from the establishments have a high accessibility and low level of service. In contrast, unloading zones located up to 100 m from the establishments have a low accessibility and high level of service. These results allow us to conclude that the planning process of the location of unloading zones in Belo Horizonte is flawed. In addition, the maximum distance from unloading zones to establishments must be 75 m, so that there is a balance between the accessibility and level of service.
1. Introduction
Unloading zones (UZs) represent one of the most common solutions for achieving sustainable urban freight transport [1]. The insufficient number of UZs and the inappropriate use of UZs constitute two of the main problems of urban freight transport [2,3,4,5]. This fact, identified by [4] in Belo Horizonte (Brazil), extends to other Brazilian urban areas [6,7]. The unloading operations generally take place on public roads [5], with most cargo vehicles parked illegally (cargo vehicles often stop in a double queue to deliver their goods).
Illegal freight parking is stimulated by a lack of UZs [8,9], an inadequate spatial configuration of UZs [10], and a lack of enforcement [4,10,11,12]. The illegal parking contributes to congestion [1,11] and delays in deliveries [3,13], requiring more vehicles to deliver cargo, and, consequently, burdening urban distribution costs [3]. In the central area of Belo Horizonte, 57.7% of the UZs are inoperable because they are occupied by private vehicles [4], and the number of UZs in Latin American cities is low [2]. In contrast, European cities regard this activity as a priority, and the UZs are becoming larger [14]. As an example, in Paris, in order to facilitate parking and goods handling, an on-street UZ should be at least 10 m long. Additionally, there should be at least one UZ per 100 m of public road [14]. An optimized UZ network reduces the externalities caused by urban freight in the delivery process [11], including the pollutant emissions [1].
Considering the problems related to UZs, the literature presents approaches for addressing data collection [15], the number of UZs [3], the location of UZs [2,3,5,8,9,15,16,17,18,19], the parking type [8], the booking and control system [20], the sizing of UZs [10,17,21,22], the operation of UZs [9,13,23,24], and how to reduce double parking [11,25].
The research approaches considered by scholars to address the problems of UZs include optimization models [3,5,15,17,18,22], simulation models [1,3,5,8,9,13,17], an econometric model [8], spatial analysis [19], and traffic simulation [8,10,11,20,24,25]. A critical analysis of the state-of-the-art of methodologies for addressing UZs has been presented by [19].
This paper aims to analyze the level of service of unloading zones and cargo accessibility to establishments using the diversity measure in a multiplex network. A multiplex network consists of interconnected layered structures, where each layer is formed by a set of nodes, whose interactions are represented by edges [26]. In this paper, the nodes correspond to UZs; the layers represent the commercial sectors; and the edges represent the connection between the UZs (nodes) and commercial establishments, represented by the walking distance. The research approach is based on the diversity measures proposed by [26]. Diversity refers to the different configurations of connectivity between the elements (nodes and layers) of the network [26]. In this paper, diversity is related to the connection between a UZ and an establishment, where a high value of diversity indicates a high level of service (LoS) by a UZ.
This paper presents an alternative method to that presented by [22], which evaluated the relationship between the number of UZs and commercial establishments through spatial analysis. The evaluation was performed based on the level of service (LoS) of UZs, defined as the number of establishments served by one UZ within walking distance [22]. The counterpoint [22], in this paper, was considered as the point of view of the municipality, looking for the maximum occupation of public space—in this case, the road space represented by the on-street UZs. In this way, a UZ needs to serve a high number of establishments in order to present a high LoS. Therefore, UZs need to have a high value of diversity to provide a high LoS.
For this reason, this paper presents a methodological contribution, addressing the evaluation of the LoS of UZs in a multiplex network and offering an alternative method for spatial analysis and low data availability. Additionally, an analysis of the cargo accessibility from UZs to establishments is performed. Considering the lack of data, the alternative modeling presented in this paper could support public polices addressing urban freight transport.
In order to present the structure of the multiplex network, the measure of diversity, research approach, and results, this paper is structured in six sections: Section 2 defines the complex network, multilayer network, and multiplex network; Section 3 explains the concept of dissimilarity and diversity in multiplex networks; Section 4 describes the research approach; the results and discussions are reported in Section 5; finally, the conclusions are presented in Section 6.
2. Conceptualizing the Complex Network, Multilayers Network, and Multiplex Network
The analysis of complex networks arose from the social network in the 1930s and was consolidated in the 1970s. Complex networks are composed of many interdependent elements that interact in a complex way, usually in a nonlinear manner [27].
A multilayer network is one type of complex network [28], being a multilayer data structure represented by graphs with several layers of connections [29]. A multilayer network is important, since, through its representation and analysis, it is possible to obtain more realistic representations and interpret phenomena and interactions that simple networks cannot capture [28]. For example, an urban transportation system can be analyzed as a multilayer network: each mode of transport (metro, train, and bus) is one layer; the station acts as the nodes; and the edges represent the communication between the layers, interchanging flow between them. Multilayer systems allow the importance of layers and nodes in the system to be understood [28]. In recent years, some analyses have been carried out to analyze the urban transport system as a complex system [29,30,31].
According to [32], a multilayer network, , is defined as a pair , where denotes the set of graphs (directed or non-directed, weighted or unweighted) representing the layers of , i.e.,. Each layer α is expressed as a graph , where is the set of nodes of and is the intralayer connections of referring to . Set covers the interconnections between nodes of different layers, and , i.e., , where characterizes the interlayer connections of .
In a multilayer network, one node can connect with others in many layers, depending on the network being analyzed. Figure 1 shows an example, for which the coordinates identify nodes in layers 2 and 3: the nodes and are present in layers , respectively. In layer , the nodes and can be represented by Moreover, there is an edge between the nodes and in layer , indicating the connection between them. In addition, it is possible to have edges between layers, for example, .
One derivation of multilayer networks is multiplex networks [28], introduced for modeling complex real-world networks. A multiplex network is defined as a multilayer graph, where each layer contains the same set of nodes, but interconnected by different types of links [28,34]. Therefore, different layers configure the various types of interactions to be analyzed. Furthermore, a multiplex network is formed by a set of monolayer networks that represent a certain type of connection [35]. In this way, a multiplex network is a set of N nodes that are connected to each other through edges belonging to M layers [36].
A multiplex network can be defined by the trio , where V is a set of nodes; is the set of α edge types between nodes V, in which ; and C is a set of link pairs that represent the links between a node and itself through different layers. Note that where denotes one link between the node v on layer l and the node v on layer k [34]. Different layers configure the various types of connections in order to obtain an adjacency matrix in each network Gα, which is defined as , where , with and .
An example is represented by transport networks in a city: the network of public transport by a bus (layer 1) is different from the subway network (layer 2), yet people make use of the combination of both networks to travel from one point to another using common transshipment points [37].
The applications of complex networks are still limited in transportation engineering. The existing studies have focused on maritime transport [30], air transport [26,38], railway transport [39], public transport [39], subway transport [40], and freight vehicle movements [41]. The literature does not report applications of the multiplex network to urban freight transport, which is the research opportunity explored in this paper.
3. Network Diversity: Concepts and Measurement Procedure
Diversity is an important measure in multiplex networks, since it allows strategic nodes to be identified for maintaining the functionality of the network [26]. Diversity measures were proposed by [42] and reformulated by [43]. Based on these studies, [26] proposed a metric to calculate the diversity in multiplex networks and quantify the diversity of complex network connection patterns.
Two measures were proposed by [26] to quantify diversity:
- Global diversity refers to the diversity of connectivity configurations between the layers;
- Local diversity refers to the diversity of connections between a node and the layers.
The main idea of diversity measures is that the diversity of a network is defined by the distances between its nodes and layers [26]. In this way, the diversity of the network is obtained from the distance between the nodes, called the node difference (ND), and the distance between the layers, called the layer difference (LD). ND quantifies the differences in connectivity patterns of the node i in layers and , given by . For this, ND considers two sets of vectors, in which the elements are probability distribution functions (PDFs). The first component is the node distance distribution (NDD) and the second component is the transition matrix (TM). NDD calculates the distance between all nodes of the network. The transition matrix (TM) is determined by the adjacency matrix, where the elements of each column are divided by the degree of the respective node, representing the probability of any node i being reached by another. The orders of NDDs and TM arrays are determined by , having a direct relationship in the network being analyzed. In addition, it is assumed that the sum of any probability distribution (PDFs) of the vectors NDD and TM must be equal to 1.
- is the ND measure;
- p and q represent layers in the multiplex network;
- i is the node being analyzed;
- JS is the Jensen–Shannon divergence, which measures the distance between PDFs.
The results obtained with allow for the following analysis [26]:
- indicates that there is no difference in the connection between node i in layer p and q, meaning that there are similar connection patterns between nodes and layers;
- indicates that the node i is disconnected in one layer and connected to all other nodes in the other layers, indicating that there are different connection patterns between the nodes and layers;
- can be interpreted as the levels of ND.
The LD quantifies the average of and is obtained according to Equation (2) [26]:
The LD can be interpreted as follows [26]:
- 0 indicates that layers p and q have identical connectivity patterns;
- 1 indicates that one of the layers is fully connected, while the other is disconnected;
- can be interpreted as the levels of LD.
Examples from ND and LD are presented in [26].
In order to determine the diversity measure, let be the set of all nodes and layers in a multiplex network. Assuming that and that it is possible to calculate the distances between all elements of S, the distance between the element and the set S is the smallest distance between and any one of the elements of S, according to Equation (3) [26]:
where denotes the elements of S. In Equation (3), when the population of entities is the nodes, the distance is the ND, represented in Equation (1). Furthermore, when the entities are the layers, is the LD, represented by Equation (2) [26].
Following the recursive process, the diversity function is defined as for with , and for when 26]. According to [26], Ui refers to the diversity of the node i in the different layers, and U refers to the diversity of the set of layers. The diversity, U, decreases when an element is removed from the network.
Finally, a lexicographic-distance method is used to obtain a diversity ordered set, , indicating the elements in the order of their contribution to diversity as a whole set [26,42].
This procedure, proposed by [26] and presented in this section, is part of the research approach presented in the next section.
4. Research Approach
This paper evaluates the LoS of UZs and the cargo accessibility to establishments using the diversity measures in a multiplex network. The research approach has three steps: (i) study area and input data; (ii) creation of the multiplex network; and (iii) diversity measurement. These steps are detailed below.
4.1. Step 1: Study Area and Input Data
Belo Horizonte had a population of 2.51 million in 2016, with an area of 331 km2. This city has the fourth-largest Gross Domestic Product (GDP) in Brazil, with about 51.21 billion BRL GDP per capita of R$ 35,122.01 [44] (1 euro ≈ 5 BRL in 13 March 2020). The central area of Belo Horizonte was selected as the study area by concentrating on commercial, residential, and leisure areas.
The UZs and establishments by commercial sector located in the central area of Belo Horizonte were considered for the analysis. Data from UZs and commercial establishments were obtained from the municipality of Belo Horizonte, in spreadsheet format.
The selection of the commercial sectors considered their importance to urban freight movements in the study area [4]. In addition, the cargo profile (as, for example, transported in the box and with a high delivery frequency) was considered. Table 1 presents these commercial sectors classified by the Brazilian Classification of Economic Activities (CNAE) code, similar to the North American Industry Classification System (NAICS) and the European Classification of Economic Activities (NACE).
The Google Maps API (Google Geocoding API, Mountain View, United States) was used to geocode the location of UZs and establishments. A distance matrix was obtained using ArcGis® software 10.6. The distance matrix was based on the walking distance using Dijkstra’s algorithm, as detailed in [45]. In this procedure, the distances between all UZs and between UZs and establishments were obtained.
4.2. Step 2: Creation of the Multiplex Network
The UZs represent nodes, the sectors represent the layers, and the distances between UZs and UZs and layers represent the edges in the multiplex network. The distance matrix was partitioned by sector to generate the layers of the multiplex network.
The allocation of UZs to establishments considered a maximum user-defined distance. In this paper, thresholds of 25, 50, 75, 100, and 150 m were considered. These distances include some distances reported in the literature [5,9,11] and other distance-limits, to proceed with a sensibility analysis of LoS and cargo accessibility.
A UZ is allocated to one establishment if the first is located until k meters, resulting in a binary matrix by sector. If the distance from UZs to establishments is equal to or less than the maximum user-defined distance, a value of 1 is assigned; when its value is greater, a value of 0 is assigned. This procedure obtains an edge-layer list with the active UZs (nodes) in each layer, also called a monoplex network. Table 2 presents an example of an edge-layer list for layer 1: UZ 5 is located up until 100 m of the establishments 1711 and 1823, being active in this layer. Additionally, UZ 7, UZ 10, and UZ 11 are not active in this layer because they are not located up until 100 m for any establishment of sector 1.
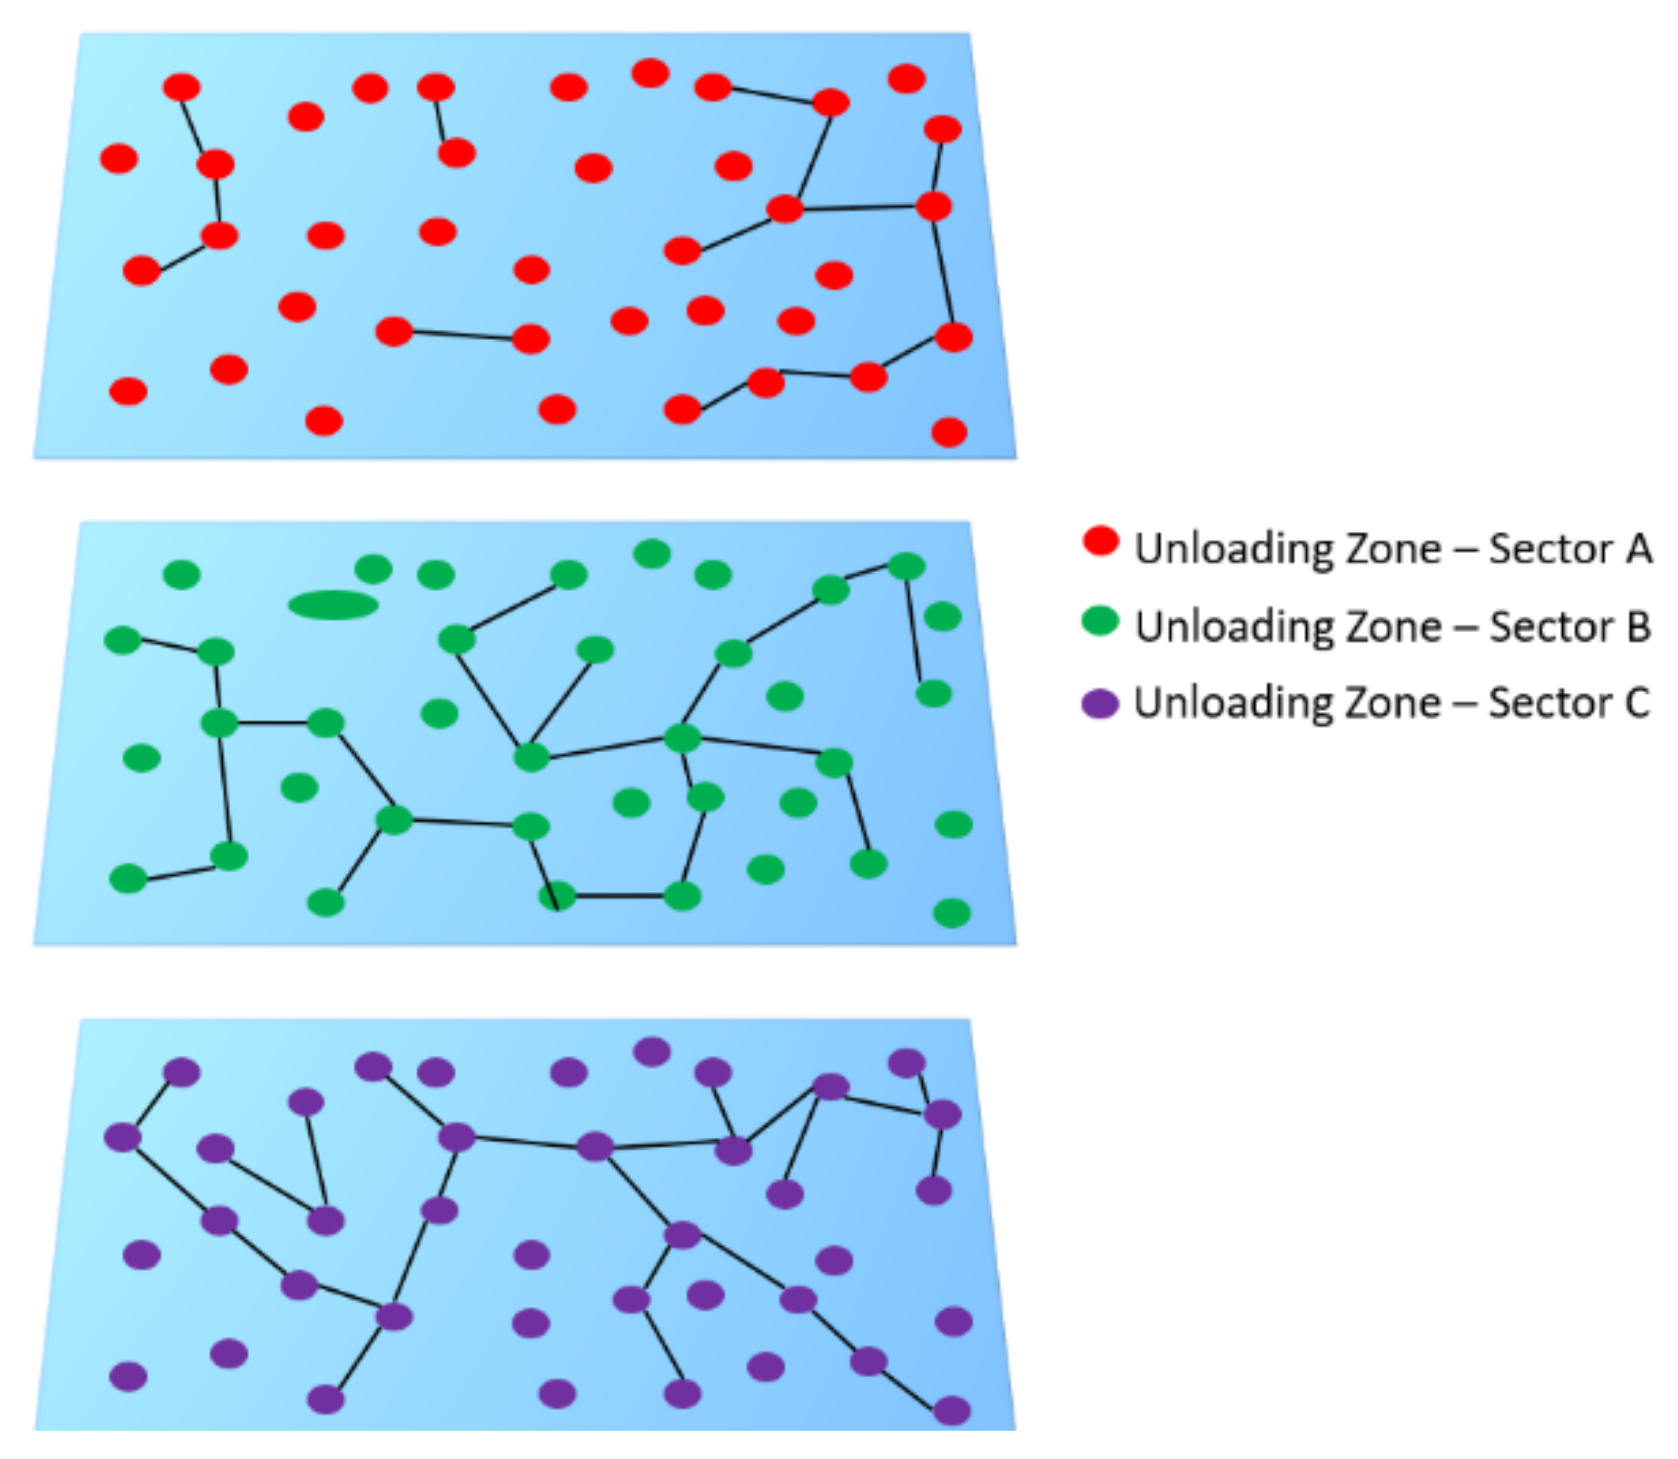
The connection between the UZs in a layer (edge-nodes) is obtained if a UZ presented as active by the edge-layer list is located up until the maximum user-defined distance. The overlap of the monoplex networks creates a multiplex network. Figure 2 illustrates the connection between the nodes (UZs), edges-nodes, and layers in the multiplex network.
4.3. Diversity Measurement
The local and global diversities for the multiplex network were calculated according to the measurement procedure presented in Section 3. The Supplementary Materials presents the script for this procedure for the software R (R Foundation, Wien, Austria).
5. Results and Discussion
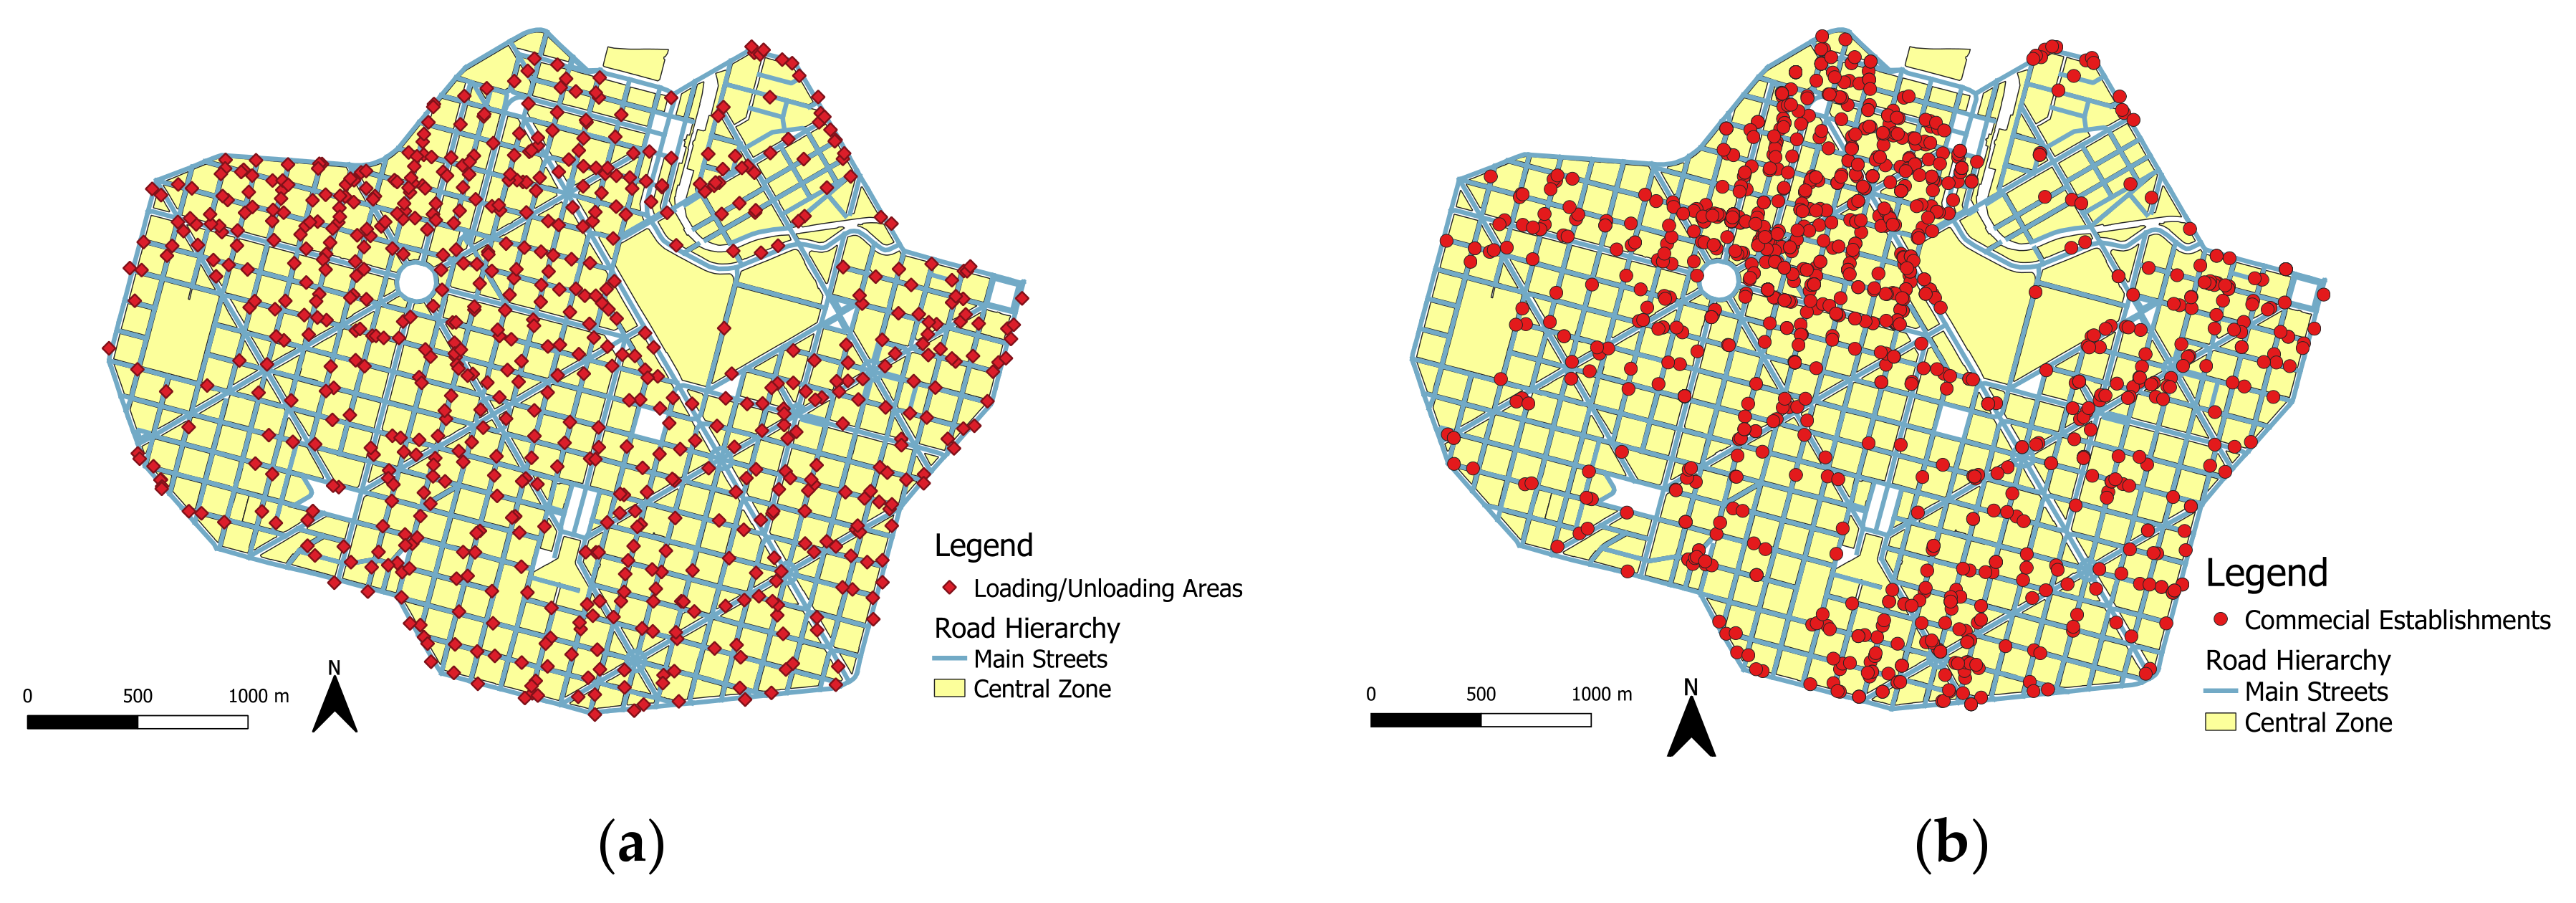
Figure 3 shows the location of the 698 UZs and the 1317 establishments in the central area of Belo Horizonte, with an average of 1.99 UZ per establishment. Analyzing Figure 3, it is possible to observe a concentration of UZs and commercial establishments in the northwest of the figure. Despite the high rate of UZ per establishment, it is possible to observe blocks with UZs and no establishments, and vice versa.
The implementation of UZs is foreseen in the Brazilian Traffic Code [46]. The local authorities are responsible for implementing UZs on public roads. In Brazil, there is no criterion to determine the location of a new UZ. In Belo Horizonte, retailers can request that the UZ be close to the establishment at the city hall. The request is received by the municipality, and it is verified whether another UZ exists near the store. If a UZ closer to the commercial establishment is not identified, a new UZ is included in the UZ network, at the retailer’s request.
Associated with this fallacious process, the lack of available data is another problem related to urban freight planning in Belo Horizonte. Until recently, the database of UZs was available in the form of spreadsheets, and information about the usage of UZs was old. Considering the lack of data, alternative modeling could support decision making and planning processes.
The results on diversity measurement are presented below considering the global diversity and local diversity.
5.1. Results of Global Diversity
The global diversity measure calculates the diversity between the UZs and the sectors. The results of global diversity ( evaluate the LoS of the UZs considering the connection between UZs and establishments. The global diversity measure is interpreted as follows:
- = 0 indicates a low global similarity between the layers (p, q) for a distance k. In our analysis, this result implies that there are few UZs serving the establishments of different sectors, and, consequently, the LoS is low due to the lack of connections between UZs and establishments;
- = 1 indicates a total global diversity between the layers for a distance k, indicating that there are many UZs serving establishments. In this case, the LoS of UZs is high;
- Intermediate values represent different degrees of global diversity between UZs and establishments from each sector, for a distance k.
Table 3 presents the results of global diversity for the distance limit of 25 m. It is possible to observe that the value of global diversity is low, indicating that there are few UZs serving the commercial establishments at this threshold. As a consequence, the LoS of the UZs is low, despite the cargo accessibility to the establishments being considered high. Similar global diversity results are observed for a threshold of 50 m (Appendix A). These results support the conclusion that UZs located in Belo Horizonte do not have a high LoS considering the threshold of 50 m, i.e., they do not serve many establishments until this distance and, consequently, do not present high cargo accessibility to the commercial establishments. The distance limit identified for Belo Horizonte is different from the recommendation of the literature, which indicates that a distance until 50 m is an acceptable walking limit from UZs and commercial establishments [5,22]. In this sense, this result shows that the planning process for freight parking is inadequate and does not consider the freight accessibility in the delivery operation.
In terms of the results presented in Table 3, it should be noted that the combinations of some sectors present low values of global diversity (observe the red values, such as , , and ), and others present a high global diversity (observe the green values, such as , , and ). This punctual result indicates that the combination of sectors 8 and 3, for example, does not have UZs close enough (until 25 m) to simultaneously serve the establishments of these sectors. In comparison, the combination of sector 8 and 6, for example, indicates that there are UZs closer to the establishments of these sectors.
Appendix A also presents the global diversity results for 75 and 100 m. Table 4 presents the results of global diversity for 150 m. Comparing Table 3 and Table 4, it is possible to observe an increase in the global diversity values in the sectors with an increment of the distance between the UZs and the establishments. This result indicates that the LoS of UZs is high with a threshold of 150 m. Therefore, a larger number of UZs does not imply a wide coverage area if the spatial distribution of UZs is not similar to that of the establishments. Some commercial sectors with a low number of establishments have a high global diversity, indicating that the proximity of the establishment to UZs can increase the network’s dissimilarity (regardless of the number of stores) and, consequently, the LoS of UZs. An example is observed from layer 3 (retail trade of sweets, candies, chocolates, and similar items) and layer 9 (retail trade of pharmaceutical products with formula manipulation): the number of establishments in these sectors represents 17.24% of the total establishments, and these sectors present 30% of the largest global diversity.
Another interesting result from the comparisons of the distance ranges refers to the proximity of UZs and establishments. Layer 8 (retail trade of pharmaceuticals with formula manipulation) has a low global diversity considering a distance of up to 25 and 50 m and a high global diversity up to a distance of 100 m. These results indicate that the location of UZs located up to 100 m from establishments contributes to the global diversity, indicating a high LoS of UZs and low cargo accessibility. This result needs to be considered in the implementation of UZs.
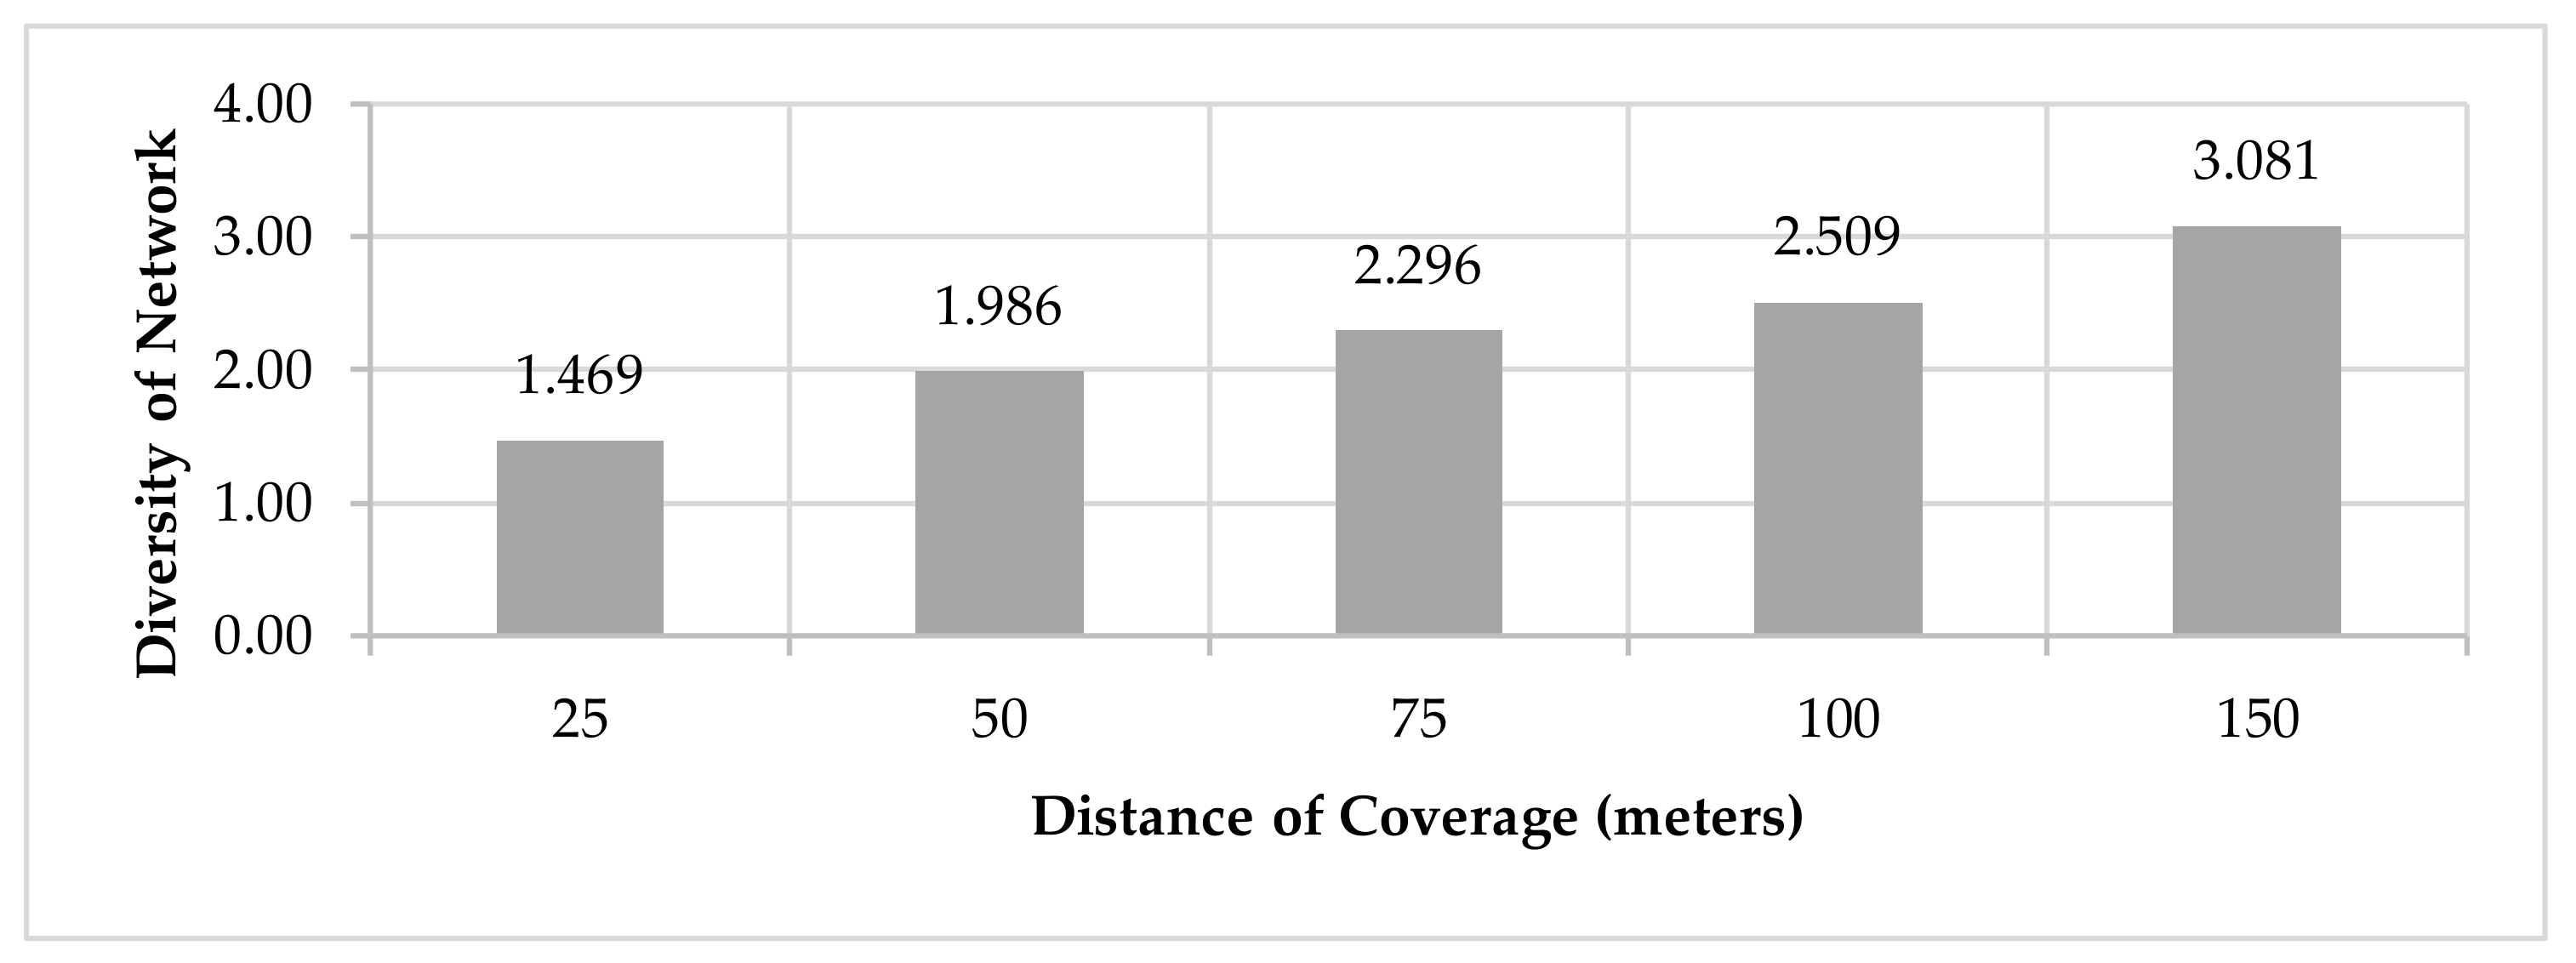
Regarding the global diversity of the network, the increase of the global measure of the network is associated with the increase of the maximum distance between the UZs and the establishments, as presented in Figure 4. This result indicates that the greater the global diversity of the network, the greater the number of establishments served by UZs. However, a larger distance between UZs and establishments implies a lower accessibility of cargo. However, the variation in the global diversity of the network for the different range distances between UZs and establishments is low. This result indicates that the variation in the service level is low for the different distances analyzed, while the cargo accessibility can be severely reduced with larger distances. This result corroborates the conclusion that distances up until 100 m could provide cargo accessibility and LoS to UZs. Nonetheless, there are no guidelines for UZs in the freight parking planning process in the Brazilian municipalities, which is the responsibility of local authorities, according to the Brazilian Traffic Code [45]. In general, the location of UZs does not consider the cargo accessibility to establishments, in addition to other issues essential to improving the delivery. However, cargo accessibility reduces the delivery operation time, making the delivery process more efficient and profitable, due to the reduction in delivery time. Moreover, cargo accessibility could reduce the parking time and, consequently, improve the LoS of UZs due to the rotation of vehicles in the UZs.
The different sectors ordered according to their global diversity are presented in Table 5. Sector 7 (retail trade of food products in general or specialized in other food products) is the sector which requires more UZs for delivery operation until 150 m. Sector 8 (retail trade of dairy products and precooked and cured meat) represents only 5.39% of the sample considered in this study (see the information in Table 1) and is the second sector which contributes to the global diversity of the network.
This result reinforces the previous conclusion that the number of establishments per sector does not influence the LoS of UZs. It is noteworthy that the delivery rate was not considered in the analysis carried out in this paper. Including the delivery rate as a variable could modify the results and indicate another sector that is more relevant in the analysis.
5.2. Results of Local Diversity
The local diversity provides measures of the diversity among UZs, making it possible to evaluate the importance of each UZ in the network for each range of distances considered. The diversity of UZs quantifies the differences in the connectivity patterns considering all sectors. The UZs with high values of local diversity serve multiple establishments in all sectors.
The local diversity value ( is analyzed as follows:
- = 0 indicates that the UZs i have a low LoS;
- = 1 indicates that the UZs i have a high LoS.
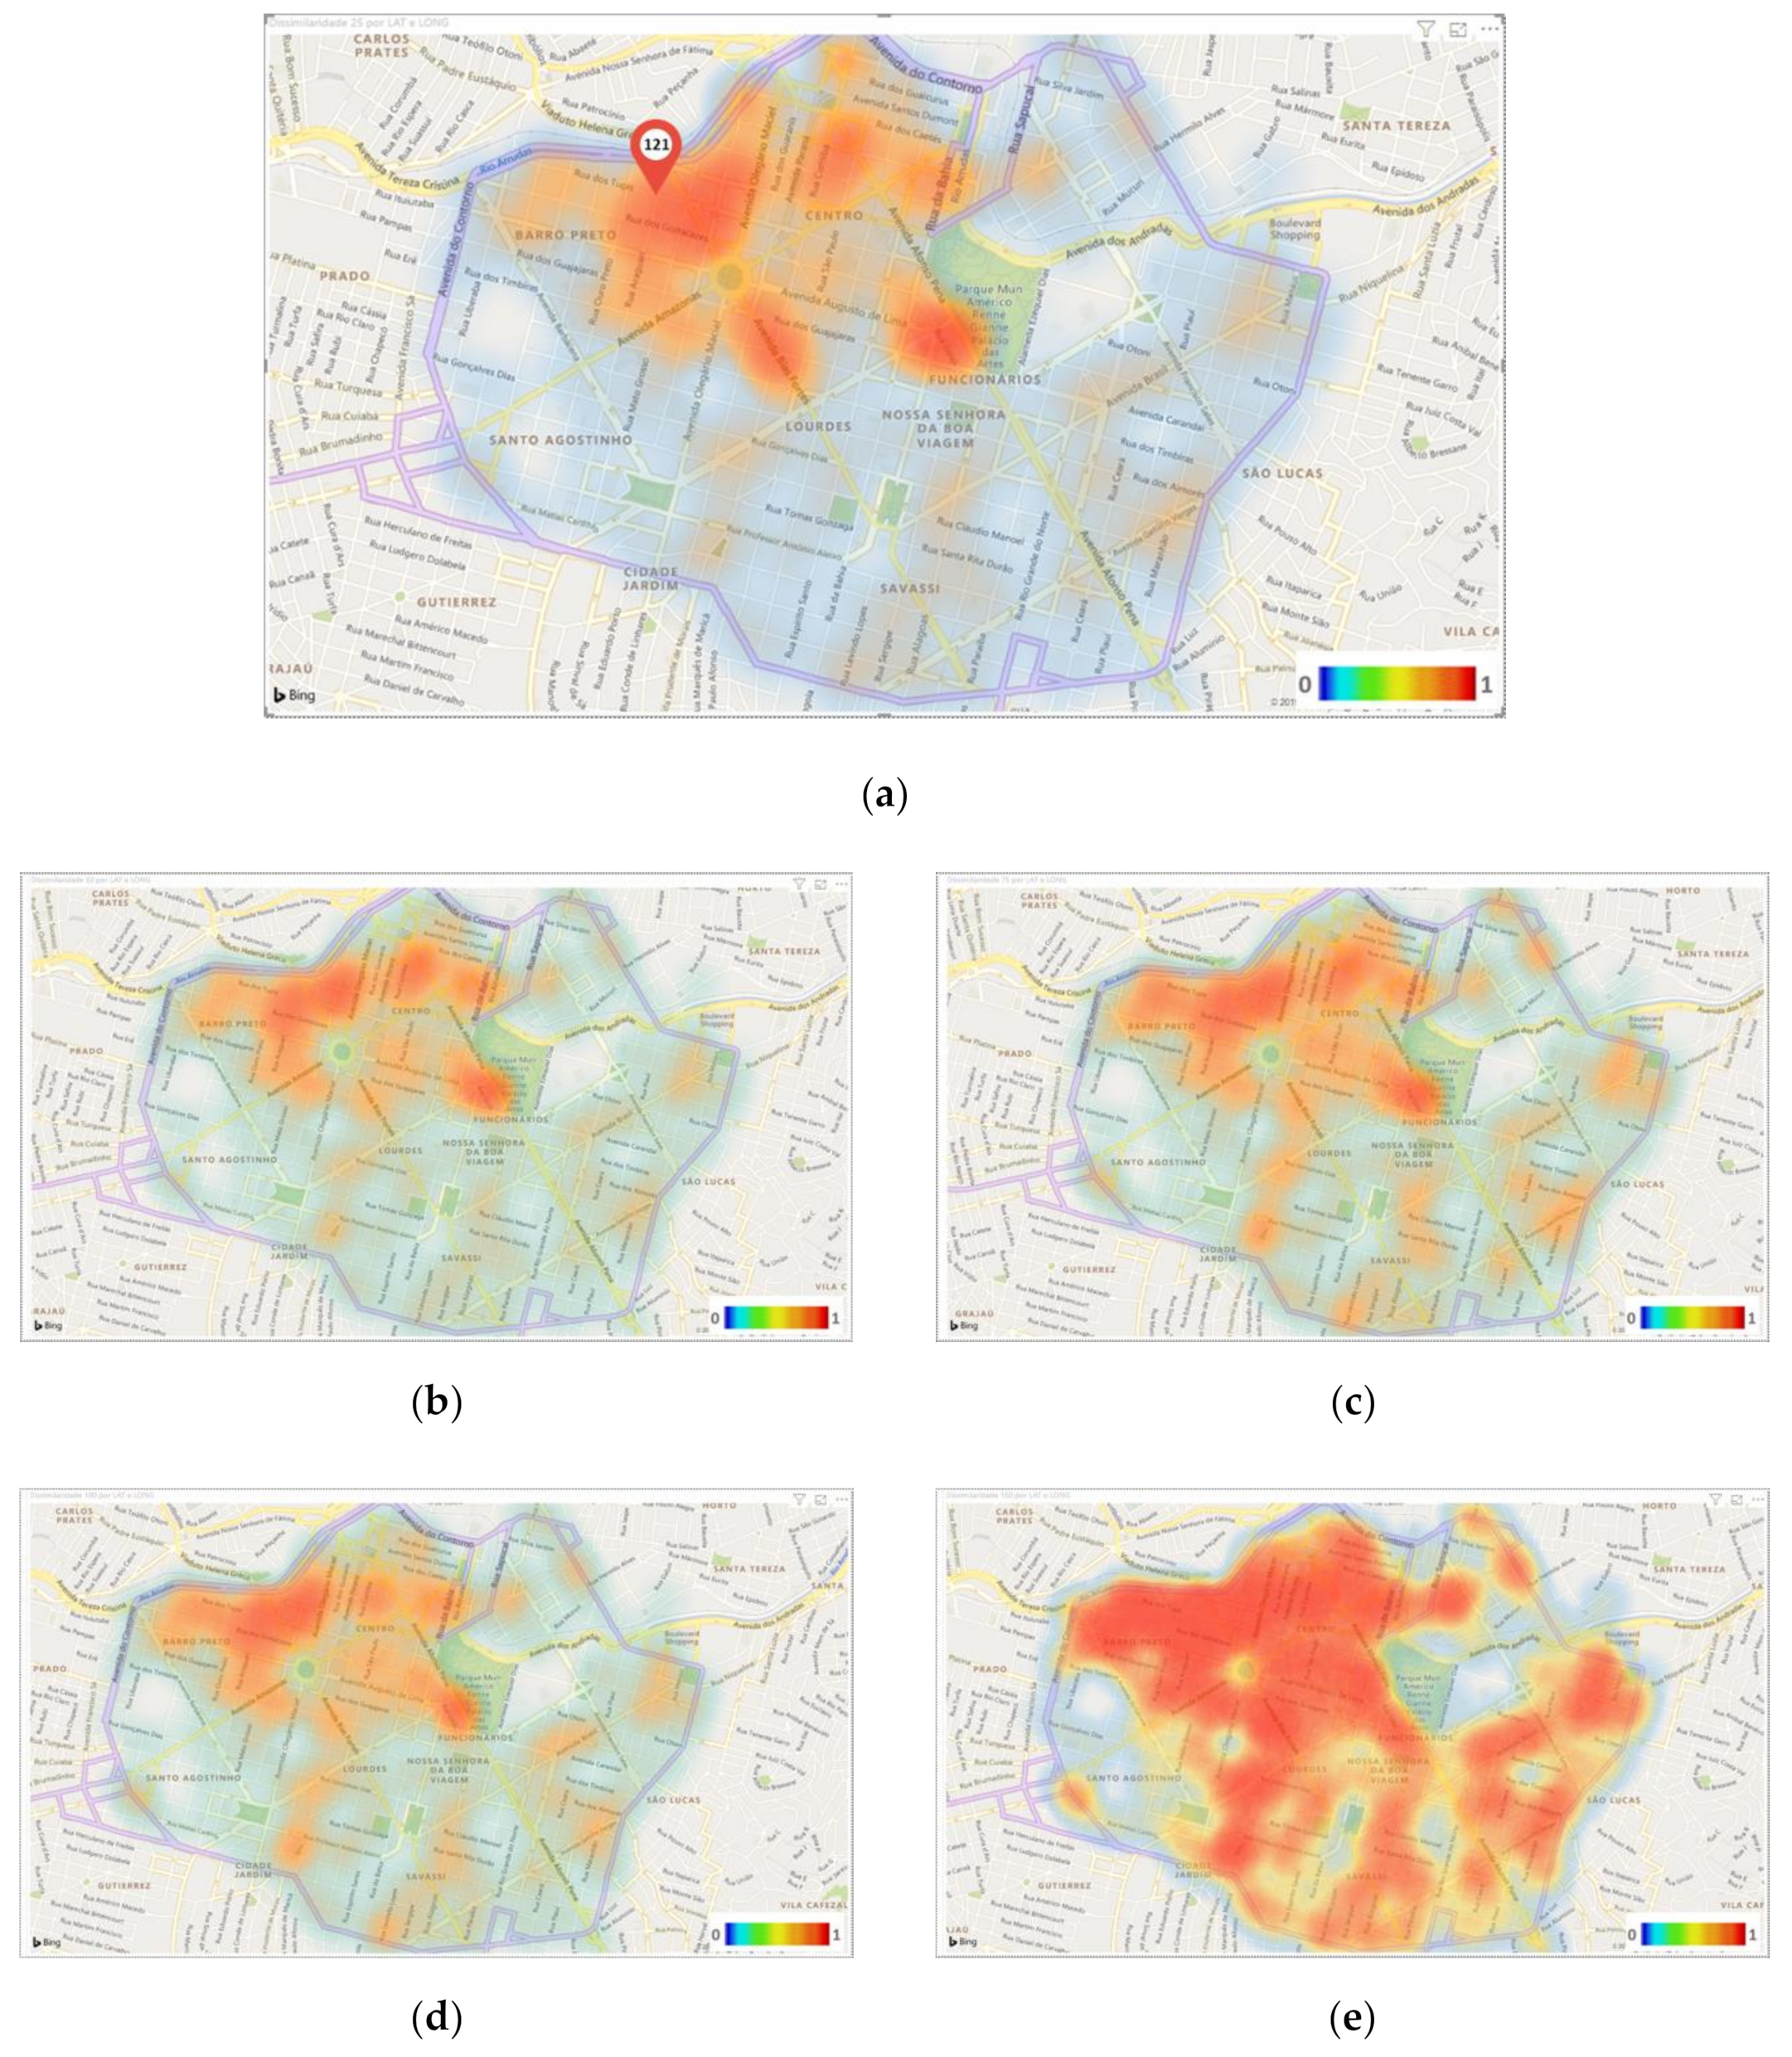
Figure 5 presents the results of local diversity for the different range distances considered in this paper. The local diversity values increase from 50 to 75 m, and the values increase slowly between 75 and 100 m. Considering the distance limit of 150 m between UZs and establishments, there is a larger coverage area of UZs and, consequently, a high LoS of UZs. In general, however, the local diversity values of UZs are below the average, indicating a low LoS for many UZs. This result shows that the wide coverage area implies a high local diversity of UZs, high level of service, and low cargo accessibility. Still, the results showed low variations in local diversity between 75 and 100 m. Considering that shorter distances contribute to cargo accessibility, this result allows us to conclude that the maximum distance of 75 m between UZs and a commercial establishment provides a good level of cargo accessibility service.
Table 6 presents the UZs with the highest values of local diversity. These UZs are close to the elevated concentration of establishments and contribute to elevated values of local diversity, even in low coverage areas. An interesting example is UZ 13, which has an inalterable local diversity value up to 100 m. However, the local diversity value increases with the increment of the range-distance, allowing for the conclusion that there is an increase in the number of establishments served by UZs with the increase of the range distance in regions with a concentration of establishments. UZ 121 has a high local diversity up to 25 m, which reduces with the increase of the range distance between UZs and establishments.
Comparing the results from the global diversity and local diversity, it can be observed that the location of UZs up until 100 m from commercial establishments provides useful measures of diversity. The coverage area lower than 50 m is positive for the cargo accessibility and negative for the level of service. On the other hand, a UZ with a 100 m coverage area could serve many establishments with low cargo accessibility. In this sense, we could conclude that the coverage distance of 75 m provides a balance between the level of service and accessibility.
From the point of view of the local authorities, the availability of UZs meets the Brazilian Traffic Code goals [46]. However, transport analysts often neglect the distance between the UZs and the commercial establishment. However, from the point of view of transport companies and logistics operators, accessibility is impaired over distance. In this scenario, a reduction of the distance between UZs and establishments is important for reducing the delivery time and, consequently, contributing to cargo mobility.
The results presented in this section lead us to conclude that low UZs present a high level of service. Additionally, the diversity measures allowed for an analysis of the trade-off between the LoS of UZs and cargo accessibility. The lack of use of, or the lack of proximity to, commercial establishments can lead to the misuse of these spaces, as reported by [4]. Therefore, the algorithm proposed in this paper is an efficient and easy manipulation method for assessing the LoS of UZs and the cargo accessibility to establishments from the calculation of diversity measures.
6. Conclusions
The objective of this paper was to evaluate the level of service of unloading zones using diversity measures in a multiplex network. Based on [26], a method was utilized to measure the diversity in a multiplex system.
The distances between the nodes and layers were initially defined. In this paper, the nodes were represented by UZs and the layers were represented by the commercial sectors. They were then used to define the diversity of the connectivity pathways of UZs in the different layers (commerce sectors) and the diversity of connectivity of the paths across the entire layer set. The concept of distance supports the analysis and was also used to evaluate the importance of UZs for the layers and for the network.
Global and local diversity analyses were performed. In the global diversity results, increasing values of diversity were observed with the increase of the coverage distance. This result was expected because the increase in the range of distance between UZs and establishments implies a larger network capillarity, and, consequently, a high level of service of UZs. The same UZ can serve a larger number of commercial establishments with the increase of the coverage area. Similarly, in local diversity results, an increase of the local diversity value of UZ was observed with an increasing distance range. However, distance limits between 50 and 100 m present a similar local diversity, indicating a similar level of service of the UZs. The comparison of the results of global and local diversity shows that the maximum distance of 75 m between UZs and an establishment provides a good level of cargo accessibility service.
Considering the results, the consideration of the maximum distance between a UZ and an establishment in the planning process of the freight parking network is a practical recommendation for practitioners. This distance-limit provides a good balance between cargo accessibility and level of service. Considering this distance, the future development of a practical procedure to define the location of UZs for urban freight planners in Brazil is suggested.
The analysis presented in this article has some limitations. First, the number of sectors analyzed can change the level of service obtained from unloading areas. Additionally, the inclusion of part of the sectors, as considered in this study, does not allow the impact of the insertion/exclusion of an unloading zone in the network to be assessed. However, in contrast, the sectors need to present similarity in the cargo characteristics (such as weight, dimensions, and frequency of delivery) to allow comparisons between them (carried out through the global diversity measure).
Considering that this paper also intended to analyze the applicability of the method for the case under study, some premises were adopted (such as the definition of the sectors considered in the analysis). For the inclusion of all commercial establishments in an area of study, it is important to include information about the cargo and delivery characteristics as parameters that influence the connectivity of the discharge zones and commercial establishments. In this way, the node difference and layer difference equations need to be adjusted.
Furthermore, for future work, some research questions are suggested: (i) What is the real need for on-street UZs? (ii) How does the freight trip generation rate impact the local and global dissimilarity measurement of the multiplex network? (iii) How can the locations of UZs impact the reduction of the delivery time? Considering these research questions, we suggest that future works include the freight trip generation rate in the analysis. Moreover, an assessment of the need for UZs on public roads and the impact of the location of UZs on the delivery time could be an interesting practical contribution to the planning process.
Finally, this paper includes an innovative aspect, since the use of complex networks in the analysis of urban freight transport had not been previously pursued. Therefore, there are still countless possibilities to be explored regarding this subject.
Supplementary Materials
The following are available online at https://0-www-mdpi-com.brum.beds.ac.uk/2071-1050/12/10/4330/s1, Script S1: Diversity measurement script.
Author Contributions
Conceptualization, J.L.d.S.J. and L.K.d.O.; methodology, J.L.d.S.J. and L.K.d.O.; software, J.L.d.S.J.; validation, J.L.d.S.J. and L.K.d.O.; formal analysis, J.L.d.S.J.; investigation, J.L.d.S.J.; data curation, J.L.d.S.J.; writing—original draft preparation, J.L.d.S.J. and L.K.d.O.; writing—review and editing, J.L.d.S.J. and L.K.d.O. All authors have read and agreed to the published version of the manuscript.
Funding
This research received no external funding.
Acknowledgments
This publication is supported by Pró-Reitoria de Pesquisa (PRPq) da Universidade Federal de Minas Gerais. Also, the authors would like to thank the Brazilian National Council for Scientific and Technological Development (CNPq) and the Brazilian Agency for Coordination of Improvement of Higher-Level Personnel (CAPES) for financially supporting this research. Additionally, the authors thank Laura Carpi, Renata L.M. Oliveira, and Gracielle G.F. Araújo, who provided help during the research.
Conflicts of Interest
The authors declare no conflicts of interest.
Appendix A
Global diversity results between UZs and establishments.

Table A1.
50 m.
| Sector | 1 | 2 | 3 | 4 | 5 | 6 | 7 | 8 | 9 | 10 |
|---|---|---|---|---|---|---|---|---|---|---|
| 1 | 0.000 | |||||||||
| 2 | 0.292 | 0.000 | ||||||||
| 3 | 0.285 | 0.258 | 0.000 | |||||||
| 4 | 0.414 | 0.229 | 0.237 | 0.000 | ||||||
| 5 | 0.253 | 0.158 | 0.260 | 0.241 | 0.000 | |||||
| 6 | 0.262 | 0.281 | 0.172 | 0.270 | 0.189 | 0.000 | ||||
| 7 | 0.360 | 0.346 | 0.336 | 0.314 | 0.362 | 0.324 | 0.000 | |||
| 8 | 0.209 | 0.239 | 0.231 | 0.321 | 0.144 | 0.129 | 0.364 | 0.000 | ||
| 9 | 0.319 | 0.150 | 0.303 | 0.187 | 0.256 | 0.317 | 0.313 | 0.316 | 0.000 | |
| 10 | 0.270 | 0.230 | 0.217 | 0.263 | 0.221 | 0.130 | 0.288 | 0.216 | 0.277 | 0.000 |
Table A2.
75 m.
| Sector | 1 | 2 | 3 | 4 | 5 | 6 | 7 | 8 | 9 | 10 |
|---|---|---|---|---|---|---|---|---|---|---|
| 1 | 0.000 | |||||||||
| 2 | 0.305 | 0.000 | ||||||||
| 3 | 0.313 | 0.256 | 0.000 | |||||||
| 4 | 0.273 | 0.174 | 0.311 | 0.000 | ||||||
| 5 | 0.269 | 0.343 | 0.294 | 0.326 | 0.000 | |||||
| 6 | 0.209 | 0.237 | 0.290 | 0.204 | 0.255 | 0.000 | ||||
| 7 | 0.376 | 0.343 | 0.323 | 0.344 | 0.302 | 0.340 | 0.000 | |||
| 8 | 0.297 | 0.240 | 0.263 | 0.301 | 0.318 | 0.302 | 0.302 | 0.000 | ||
| 9 | 0.260 | 0.277 | 0.317 | 0.248 | 0.317 | 0.249 | 0.380 | 0.250 | 0.000 | |
| 10 | 0.207 | 0.247 | 0.357 | 0.182 | 0.310 | 0.165 | 0.373 | 0.307 | 0.255 | 0.000 |
Table A3.
100 m.
| Sector | 1 | 2 | 3 | 4 | 5 | 6 | 7 | 8 | 9 | 10 |
|---|---|---|---|---|---|---|---|---|---|---|
| 1 | 0.000 | |||||||||
| 2 | 0.330 | 0.000 | ||||||||
| 3 | 0.361 | 0.326 | 0.000 | |||||||
| 4 | 0.270 | 0.267 | 0.362 | 0.000 | ||||||
| 5 | 0.262 | 0.327 | 0.228 | 0.367 | 0.000 | |||||
| 6 | 0.280 | 0.299 | 0.332 | 0.303 | 0.290 | 0.000 | ||||
| 7 | 0.305 | 0.350 | 0.346 | 0.323 | 0.284 | 0.291 | 0.000 | |||
| 8 | 0.246 | 0.370 | 0.286 | 0.295 | 0.164 | 0.320 | 0.303 | 0.000 | ||
| 9 | 0.341 | 0.335 | 0.250 | 0.350 | 0.296 | 0.334 | 0.364 | 0.298 | 0.000 | |
| 10 | 0.280 | 0.313 | 0.330 | 0.309 | 0.277 | 0.272 | 0.337 | 0.302 | 0.324 | 0.000 |
References
- Iwan, S.; Kijewska, K.; Johansen, B.G.; Eidhammer, O.; Małecki, K.; Konicki, W.; Thompson, R.G. Analysis of the environmental impacts of unloading bays based on cellular automata simulation. Transp. Res. Part D Transp. Environ. 2018, 61, 104–117. [Google Scholar] [CrossRef]
- Prata, B.; Oliveira, L.K.; Holanda, T. Locating on-street loading and unloading spaces by means of mixed integer programming. Transportes 2018, 26, 16–30. [Google Scholar] [CrossRef] [Green Version]
- Muñuzuri, J.; Cuberos, M.; Abaurrea, F.; Escudero, A. Improving the design of urban loading zone systems. J. Transp. Geogr. 2017, 59, 1–13. [Google Scholar] [CrossRef]
- Oliveira, L.K. Diagnóstico das vagas de carga e descarga para a distribuição urbana de mercadorias: Um estudo de caso em Belo Horizonte. J. Transp. Lit. 2014, 8, 178–209. [Google Scholar] [CrossRef]
- Aiura, N.; Taniguchi, E. Planning On-Street Loading-Unloading Spaces Considering the Behaviour of Pickup-Delivery Vehicles. J. East. Asia Soc. Transp. Stud. 2005, 6, 2963–2974. [Google Scholar] [CrossRef]
- Oliveira, L.K.; Barraza, B.; Bertoncini, B.V.; Isler, C.A.; Pires, D.R.; Madalon, E.C.; Lima, J.; Vieira, J.G.V.; Meira, L.H.L.; Bracarense, L.S.F.P.; et al. An overview of problems and solutions for urban freight transport in Brazilian cities. Sustainability 2018, 10, 1233. [Google Scholar] [CrossRef] [Green Version]
- Oliveira, L.K.; Nascimento, C.O.L.; Sousa, P.R.; Resende, P.T.V.; Silva, F.G.F. Transport Service Provider Perception of Barriers and Urban Freight Policies in Brazil. Sustainability 2019, 11, 6890. [Google Scholar] [CrossRef] [Green Version]
- Nourinejad, M.; Wenneman, A.; Habib, K.N.; Roorda, M.J. Truck parking in urban areas: Application of choice modelling within traffic microsimulation. Transp. Res. Part A 2014, 64, 54–64. [Google Scholar] [CrossRef]
- Delaitre, L. A new approach to diagnose urban delivery areas plans. In 2009 International Conference on Computers & Industrial Engineering; IEEE: Piscataway, NJ, USA, 2009; pp. 991–998. [Google Scholar] [CrossRef]
- Dezi, G.; Dondi, G.; Sangiorgi, C. Urban freight transport in Bologna: Planning commercial vehicle loading/unloading zones. Procedia Soc. Behav. Sci. 2010, 2, 5990–6001. [Google Scholar] [CrossRef] [Green Version]
- Alho, A.R.; Silva, J.A.; Sousa, J.P.; Blanco, E. Improving mobility by optimizing the number, location and usage of loading/unloading bays for urban freight vehicles. Transp. Res. Part D Transp. Environ. 2018, 61, 3–18. [Google Scholar] [CrossRef]
- Taniguchi, E.; Thompson, R.G.; Yamada, T.; Van Duin, R. City Logistics: Network Modelling and Intelligent Transport Systems; Pergamon: Oxford, UK, 2001. [Google Scholar]
- Voegl, J.; Fikar, C.; Hirsch, P.; Gronalt, M. A simulation study to evaluate economic and environmental effects of different unloading infrastructure in an urban retail street. Comput. Ind. Eng. 2019, 137, 106032. [Google Scholar] [CrossRef]
- Dablanc, L. Freight Transport: A Key for the New Urban Economy; World Bank: Washington, DC, USA, 2009. [Google Scholar]
- Tamayo, S.; Gaudron, A.; de La Fortelle, A. Loading/Unloading Space Location and Evaluation: An Approach through Real Data. In City Logistics 3: Towards Sustainable and Liveable Cities; Taniguchi, E., Thompson, R.S., Eds.; ISTE Ltd, John Wiley & Sons, Inc.: London, UK; Hoboken, NJ, USA, 2018; pp. 161–180. [Google Scholar] [CrossRef]
- Wilson, M.; Janjevic, M.; Winkenbach, M. Modeling a Time-Differentiated Policy for Management of Loading Bays in Urban Areas. In Proceedings of the 15th World Conference on Transportation Research, Mumbai, India, 26–31 May 2019. [Google Scholar]
- Pinto, R.; Lagorio, A.; Golini, R. The location and sizing of urban freight loading/unloading lay-by areas. Int. J. Prod. Res. 2019, 57, 83–99. [Google Scholar] [CrossRef]
- Letnik, T.; Farina, A.; Mencinger, M.; Lupi, M.; Božičnik, S. Dynamic management of loading bays for energy efficient urban freight deliveries. Energy 2018, 159, 916–928. [Google Scholar] [CrossRef]
- Alho, A.; Silva, J.A.; Sousa, J.P. A state-of-the-art modeling framework to improve congestion by changing the configuration/enforcement of urban logistics loading/unloading bays. Procedia Soc. Behav. Sci. 2014, 111, 360–369. [Google Scholar] [CrossRef] [Green Version]
- McLeod, F.N.; Cherrett, T.J. Loading bay booking and control for urban freight. Int. J. Logist. Res. Appl. 2011, 14, 385–397. [Google Scholar] [CrossRef] [Green Version]
- Jaller, M.; Holguín-Veras, J.; Hodge, S.D. Parking in the city: Challenges for freight traffic. Transp. Res. Rec. 2013, 2379, 46–56. [Google Scholar] [CrossRef]
- Alho, A.R.; Silva, J.A. Analyzing the relation between land-use/urban freight operations and the need for dedicated infrastructure/enforcement—Application to the city of Lisbon. Res. Transp. Bus. Manag. 2014, 11, 85–97. [Google Scholar] [CrossRef]
- Delaître, L.; Routhier, J.-L. Mixing two French tools for delivery areas scheme decision making. Procedia Soc. Behav. Sci. 2010, 2, 6274–6285. [Google Scholar] [CrossRef]
- Munuzuri, J.; Racero, J.; Larraneta, J. Parking Search Modeling in Freight Transport and Private Traffic Simulation. In Urban Transport VIII; Sucharov, L.J., Brebbia, C.A., Eds.; WIT Press: Southampton, UK, 2002; pp. 335–344. [Google Scholar] [CrossRef]
- Kladeftiras, M.; Antoniou, C. Simulation-based assessment of double-parking impacts on traffic and environmental conditions. Transp. Res. Rec. J. Transp. Res. Board 2013, 2390, 121–130. [Google Scholar] [CrossRef]
- Carpi, L.C.; Schieber, T.A.; Pardalos, P.M.; Marfany, G.; Masoller, C.; Díaz-Guilera, A.; Ravetti, M.G. Assessing diversity in multiplex networks. Sci. Rep. 2019, 9, 4511. [Google Scholar] [CrossRef]
- Furtado, B.A.; Sakowski, P.A.M. Complexity: A review of the classics. Policy Complex Syst. 2014, 1, 3–18. [Google Scholar] [CrossRef] [Green Version]
- Kivelä, M.; Arenas, A.; Barthelemy, M.; Gleeson, J.P.; Moreno, Y.; Porter, M.A. Multilayer networks. J. Complex Netw. 2014, 2, 203–271. [Google Scholar] [CrossRef] [Green Version]
- Mollgaard, A.; Zettler, I.; Dammeyer, J.; Jensen, M.H.; Lehmann, S.; Mathiesen, J. Measure of Node Similarity in Multilayer Networks. PLoS ONE 2016, 11, e0157436. [Google Scholar] [CrossRef] [PubMed] [Green Version]
- Kaluza, P.; Kölzsch, A.; Gastner, M.T.; Blasius, B. The complex network of global cargo ship movements. J. R. Soc. Interface 2010, 7, 1093–1103. [Google Scholar] [CrossRef]
- Chodrow, P.S.; Al-Awwad, Z.; Jiang, S.; González, M.C. Demand and congestion in multiplex transportation networks. PLoS ONE 2016, 11, 1–10. [Google Scholar] [CrossRef] [Green Version]
- Boccaletti, S.; Bianconi, G.; Criado, R.; Del Genio, C.I.; Gómez-Gardenes, J.; Romance, M.; Sendiña-Nadal, I.; Wang, Z.; Zanin, M. The structure and dynamics of multilayer networks. Phys. Rep. 2014, 544, 1–122. [Google Scholar] [CrossRef] [Green Version]
- Salehi, M.; Sharma, R.; Marzolla, M.; Magnani, M.; Siyari, P.; Montesi, D. Spreading processes in Multilayer Networks. IEEE Trans. Netw. Sci. Eng. 2015, 2, 65–83. [Google Scholar] [CrossRef] [Green Version]
- Kanawati, R. Multiplex Network Mining: A Brief Survey. IEEE Intell. Inform. Bull. 2015, 16, 24–27. [Google Scholar]
- Lee, K.M.; Min, B.; Goh, K.I. Towards real-world complexity: An introduction to multiplex networks. Eur. Phys. J. B 2015, 88, 1–20. [Google Scholar] [CrossRef] [Green Version]
- Nicosia, V.; Bianconi, G.; Latora, V.; Barthelemy, M. Growing multiplex networks. Phys. Rev. Lett. 2013, 111, 1–17. [Google Scholar] [CrossRef] [Green Version]
- De Domenico, M.; Solé-Ribalta, A.; Cozzo, E.; Kivelä, M.; Moreno, Y.; Porter, M.A.; Gómez, S.; Arenas, A. Mathematical formulation of multilayer networks. Phys. Rev. X 2014, 3, 1–15. [Google Scholar] [CrossRef] [Green Version]
- Halu, A.; Mukherjee, S.; Bianconi, G. Emergence of overlap in ensembles of spatial multiplexes and statistical mechanics of spatial interacting network ensembles. Phys. Rev. E 2014, 89, 1–11. [Google Scholar] [CrossRef] [PubMed] [Green Version]
- Aleta, A.; Meloni, S.; Moreno, Y. A Multilayer perspective for the analysis of urban transportation systems. Sci. Rep. 2017, 7, 44359. [Google Scholar] [CrossRef] [PubMed]
- Strano, E.; Shai, S.; Dobson, S.; Barthelemy, M. Multiplex networks in metropolitan areas: Generic features and local effects. J. R. Soc. Interface 2015, 12, 20150651. [Google Scholar] [CrossRef] [PubMed] [Green Version]
- Joubert, J.W.; Meintjes, S. Freight Activity Chain Generation Using Complex Networks of Connectivity. Transp. Res. Procedia 2016, 12, 425–435. [Google Scholar] [CrossRef] [Green Version]
- Weitzman, M.L. On Diversity. Q. J. Econ. 1992, 107, 363–405. [Google Scholar] [CrossRef]
- Bossert, W.; Pattanaik, P.K.; Xu, Y. The Measurement of Diversity. Annu. Rev. Ecol. Syst. 2001, 5, 285–307. [Google Scholar] [CrossRef]
- IBGE. Cidades@Belo Horizonte. 2019. Available online: https://cidades.ibge.gov.br (accessed on 25 October 2019).
- Karadimas, N.V.; Kolokathi, M.; Defteraiou, G.; Loumos, V. Municipal Waste Collection of Large Items Optimized with ArcGIS Network Analyst. In Proceedings of the ECMS 2007, 21st European Conference on Modelling and Simulation, Prague, Czech Republic, 4–6 June 2007. [Google Scholar] [CrossRef]
- BRASIL. Código de Trânsito Brasileiro. Lei No 9.503, de 23 de Setembro de 1997. 1997. Available online: http://www.planalto.gov.br/ccivil_03/leis/l9503.htm (accessed on 24 May 2020).
Figure 1.
Example of a multilayer network based on [33].
Figure 1.
Example of a multilayer network based on [33].

Figure 2.
Multiplex network example.

Figure 3.
Location of (a) unloading zones and (b) commercial establishments in the central area of Belo Horizonte.
Figure 3.
Location of (a) unloading zones and (b) commercial establishments in the central area of Belo Horizonte.

Figure 4.
Global diversity of network versus distance.

Figure 5.
Representation of the dissimilarity of unloading zones: (a) 25 m; (b) 50 m; (c) 75 m; (d) 100 m; (e) 150 m.
Figure 5.
Representation of the dissimilarity of unloading zones: (a) 25 m; (b) 50 m; (c) 75 m; (d) 100 m; (e) 150 m.

Table 1.
Commercial sectors considered in the analysis.
| Sector ID or Layer | CNAE Code | Description of the Sector | Number of Establishments in Central Area | Percentage |
|---|---|---|---|---|
| 1 | 4729699 | Retail trade of food products | 306 | 23.23% |
| 2 | 4771701 | Retail trade of pharmaceutical products without formula manipulation | 192 | 14.58% |
| 3 | 4721104 | Retail trade of sweets, candies, chocolates, and similar items | 156 | 11.85% |
| 4 | 4723700 | Retail trade of beverage | 146 | 11.09% |
| 5 | 4712100 | Wholesale trade with predominance of food products | 136 | 10.33% |
| 6 | 4724500 | Retail trade of fresh food | 102 | 7.74% |
| 7 | 4721102 | Resale-predominant bakery | 90 | 6.83% |
| 8 | 4721103 | Retail trade of dairy products and precooked and cured meat | 77 | 5.85% |
| 9 | 4771702 | Retail trade of pharmaceutical products with formula manipulation | 71 | 5.39% |
| 10 | 4693100 | Wholesale trade with no food or fresh food products | 41 | 3.11% |
Table 2.
Example of an edge-layer list, with a distance of 100 m, for layer 1.
| Unloading Zone (Node) | Establishment Id Sector 1 |
|---|---|
| 5 | 1711 |
| 5 | 1823 |
| 6 | 1615 |
| 7 | - |
| 8 | 1595 |
| 9 | 1615 |
| 9 | 1784 |
| 10 | - |
| 11 | - |
| 12 | 1720 |
| 13 | 780 |
Table 3.
Global diversity results for a distance of 25 m between UZs and sectors.
| Sector | 1 | 2 | 3 | 4 | 5 | 6 | 7 | 8 | 9 | 10 |
|---|---|---|---|---|---|---|---|---|---|---|
| 1 | 0.000 | |||||||||
| 2 | 0.283 | 0.000 | ||||||||
| 3 | 0.097 | 0.271 | 0.000 | |||||||
| 4 | 0.067 | 0.252 | 0.098 | 0.000 | ||||||
| 5 | 0.067 | 0.252 | 0.098 | 0.000 | 0.000 | |||||
| 6 | 0.441 | 0.239 | 0.395 | 0.375 | 0.375 | 0.000 | ||||
| 7 | 0.291 | 0.291 | 0.291 | 0.277 | 0.277 | 0.337 | 0.000 | |||
| 8 | 0.040 | 0.244 | 0.090 | 0.106 | 0.106 | 0.480 | 0.301 | 0.000 | ||
| 9 | 0.414 | 0.229 | 0.386 | 0.480 | 0.480 | 0.107 | 0.360 | 0.375 | 0.000 | |
| 10 | 0.227 | 0.372 | 0.172 | 0.161 | 0.161 | 0.256 | 0.309 | 0.225 | 0.321 | 0.000 |
Table 4.
Global diversity value for a distance of 150 m between UZs and sectors.
| Sector | 1 | 2 | 3 | 4 | 5 | 6 | 7 | 8 | 9 | 10 |
|---|---|---|---|---|---|---|---|---|---|---|
| 1 | 0.000 | |||||||||
| 2 | 0.381 | 0.000 | ||||||||
| 3 | 0.422 | 0.376 | 0.000 | |||||||
| 4 | 0.361 | 0.363 | 0.400 | 0.000 | ||||||
| 5 | 0.362 | 0.372 | 0.424 | 0.398 | 0.000 | |||||
| 6 | 0.378 | 0.387 | 0.419 | 0.386 | 0.329 | 0.000 | ||||
| 7 | 0.043 | 0.389 | 0.426 | 0.367 | 0.356 | 0.375 | 0.000 | |||
| 8 | 0.346 | 0.401 | 0.393 | 0.380 | 0.338 | 0.381 | 0.344 | 0.000 | ||
| 9 | 0.465 | 0.436 | 0.400 | 0.460 | 0.451 | 0.434 | 0.470 | 0.432 | 0.000 | |
| 10 | 0.383 | 0.386 | 0.416 | 0.395 | 0.330 | 0.378 | 0.379 | 0.348 | 0.436 | 0.000 |
Table 5.
Ranking of sectors contributing to the global diversity of the network until 150 m.
| Ranking | Sector | Description of the Sector |
|---|---|---|
| 1 | 1 | Retail trade of food products |
| 2 | 8 | Retail trade of dairy products and precooked and cured meat |
| 3 | 9 | Retail trade of pharmaceuticals with formula manipulation |
| 4 | 6 | Retail trade of fresh food |
| 5 | 4 | Retail trade of beverage |
| 6 | 5 | Wholesale trade with predominance of food products |
| 7 | 7 | Resale-predominant bakery |
| 8 | 3 | Retail trade of sweets, candies, chocolates, and similar items |
| 9 | 2 | Retail trade of pharmaceutical products without formula manipulation |
| 10 | 10 | Wholesale trade with no food or fresh food products |
Table 6.
Local diversity of some unloading zones in the distance-range analyzed.
| UZ ID | 25 m | 50 m | 75 m | 100 m | 150 m |
|---|---|---|---|---|---|
| 13 | 0.429 | 0.429 | 0.429 | 0.656 | 0.874 |
| 16 | 0.429 | 0.671 | 0.625 | 0.768 | 0.835 |
| 17 | 8.94 × 10⁻⁹ | 0.493 | 0.469 | 0.591 | 0.850 |
| 18 | 8.94 × 10⁻⁹ | 0.493 | 0.580 | 0.506 | 0.888 |
| 19 | 8.94 × 10⁻⁹ | 0.493 | 0.493 | 0.493 | 0.805 |
| 20 | 8.94 × 10⁻⁹ | 0.493 | 0.493 | 0.493 | 0.835 |
| 53 | 0.590 | 0.551 | 0.631 | 0.353 | 0.737 |
| 54 | 0.493 | 0.461 | 0.503 | 0.356 | 0.747 |
| 77 | 0.469 | 0.469 | 0.521 | 0.383 | 0.695 |
| 78 | 0.557 | 0.557 | 0.597 | 0.435 | 0.764 |
| 81 | 0.557 | 0.697 | 0.580 | 0.681 | 0.761 |
| 121 | 0.726 | 0.778 | 0.674 | 0.646 | 0.579 |
| 123 | 0.681 | 0.753 | 0.779 | 0.703 | 0.578 |
© 2020 by the authors. Licensee MDPI, Basel, Switzerland. This article is an open access article distributed under the terms and conditions of the Creative Commons Attribution (CC BY) license (http://creativecommons.org/licenses/by/4.0/).
Share and Cite
MDPI and ACS Style
Santos Junior, J.L.d.; Oliveira, L.K.d. Analysis of the Level of Service of Unloading Zones Using Diversity Measures in a Multiplex Network. Sustainability 2020, 12, 4330. https://0-doi-org.brum.beds.ac.uk/10.3390/su12104330
AMA Style
Santos Junior JLd, Oliveira LKd. Analysis of the Level of Service of Unloading Zones Using Diversity Measures in a Multiplex Network. Sustainability. 2020; 12(10):4330. https://0-doi-org.brum.beds.ac.uk/10.3390/su12104330
Chicago/Turabian StyleSantos Junior, Jorge Luiz dos, and Leise Kelli de Oliveira. 2020. "Analysis of the Level of Service of Unloading Zones Using Diversity Measures in a Multiplex Network" Sustainability 12, no. 10: 4330. https://0-doi-org.brum.beds.ac.uk/10.3390/su12104330
Note that from the first issue of 2016, this journal uses article numbers instead of page numbers. See further details here.