A Three Methods Proactive Improvement Model for Buildings Construction Processes


1
Department of Construction Management and Engineering, North Dakota State University, Fargo, ND 58108, USA
2
Gretel-Group de REcerca on Technology Enhanced Learning, La Salle, Ramon Llull University, 08022 Barcelona, Spain
3
Technology Department, Nortfolk State University, Nortfolk, VA 23504, USA
*
Author to whom correspondence should be addressed.
Sustainability 2020, 12(10), 4335; https://0-doi-org.brum.beds.ac.uk/10.3390/su12104335
Submission received: 6 March 2020
/
Revised: 18 May 2020
/
Accepted: 20 May 2020
/
Published: 25 May 2020
(This article belongs to the Special Issue Sustainable Construction and Building Materials for Environment)
Abstract
:This paper proposes a proactive model to improve the overall performance of construction processes. The main advantage is that potential waste and associate impacts could be identified in the early stages of a project before the construction phase. To accomplish that, the model combines three methods; Lean-to identify waste, Green to assess environmental impact, and Six-Sigma to measure and improve process performance (LG6). The LG6 model helps in evaluating processes one step at a time, identifying consumed resources, analyzing the environmental performance of all steps as well as highlighting generated impacts, applying improving alternatives if needed, and measuring process performance for evaluation. The functionality of LG6 is illustrated through a case study of woodpiles installation. In this case study, the LG6 model identified four steps out of eight that are considered potential waste or (non-value-added steps) according to the Lean principles. As a result, the LG6 model helped in reducing impact by 9% and expenses by 1%. The LG6 model can help to improve the performance of construction processes and reduces unnecessary waste.
1. Introduction
Construction industry-related activities have a significant environmental impact. Total construction and demolition waste in the United States only was estimated to be 569 million tons in 2017 [1]. In the construction industry, every project is unique and has a different purpose. Moreover, a project comprises of numerous tasks that are usually assigned to different groups of professionals involved with the project. Due to that, there is a good chance of creating waste at any point in the project phases [2]. Proactive steps could be taken to avoid waste from being generated instead of getting rid of it during construction, resulting in environmental and economic benefits [3].
Many organizations have established different rating systems to augment the environmental performance of the built environment. For example, the U.S. Green Building Council has put together a rating system named Leadership in Energy and Environmental Design (LEED). LEED gives buildings points under different categories to reduce the environmental impacts the built environment causes at any point in the life cycle. One way for buildings to be awarded points in LEED is to be innovative in the design and create new methods or tools to help improve environmental performance throughout the life cycle of the built environment [4]. This paper created an innovative model to identify and minimize waste in construction activities before the start of the construction phase by modifying a formerly developed framework by Banawi and Bilec [5,6]. Banawi and Bilec developed a framework which combines three methods-Lean, Green, and Six-sigma-to improve the construction process during the construction phase. It involves first defining possible waste in a chosen construction process, then measuring the environmental impact of the process, analyzing the root causes of waste, improving the waste root causes, and controlling the process performance to sustain success. Although this framework helps in reducing waste and improving performance, it works after construction started and waste already generated.
This research applies the Define, Measure, Analyze, and Improve, Control (DMAIC) process to develop a model that integrates the three methods Lean, Green, and Six-Sigma (LG6). This model help contractors identify potential waste in the construction process early and before the construction started. The hypothesis is that LG6 help reduces the occurrence of construction project waste. This paper discusses the main goal, and the objectives behind this research provide an essential background of the integrated methods, present an improvement model and its structure, implements a case study, and concludes with recommendations. The aim here is to create a systematic model with overall layouts applying the DMAIC model. This model integrates three methods: Lean-to identify waste, Green to calculate the environmental impact, and Six-Sigma to evaluate current process performance before the construction process. These are the paper objectives:
- To create an innovative model that helps stakeholders reduce the environmental impacts of the built environment preceding to the construction phase;
- To help decrease the overall environmental impact of the construction sector.
- To enhance the knowledge of the green initiative and applications in the construction industry.
Each of the three methods, Lean, Green, and Six-sigma, has a different purpose. To achieve a process that involves less potential waste, smaller environmental impact, and sustained performance, however, all three methods have to be combined. Some studies highlighted the importance of the methods Lean, Green, and Six-Sigma to construction performance. Hussain et al. discuss how construction sectors in most countries are struggling to implement sustainable and improved construction processes [7].
The main purpose of Lean is to eliminate waste in a process where waste been defined as anything which consumes resources and not adding value to the process such as moving materials around on job site [8,9]. Seven types of waste identified by Taiichi Ohno are recurrence transport, defects, waiting, unnecessary inventory, overproduction, motion, and excess processing [10]. Lean also is a method used to deliver products or services that are exactly what the customer needs, when the customer needs them, in the amount required while using the minimum of materials, equipment, space, labor, and time. Some studies have found that applying Lean to the construction industry does eliminate waste [11,12,13,14,15].
There are several studies completed that discuss the use of Lean strategies to identify waste in construction [16,17,18]. Garrett and Lee [19] concluded that incomplete or inadequate documentation raised problems during construction; through the application of Lean tools to reducing non-value added activities. Lapinski, Horman et al. [12] analyzed Toyota’s successful implementation of Lean strategies to build their buildings, specifically how lean can reduce the high initial expense of green buildings via eliminating waste occurrence. Another paper that discusses the use of lean at the specific process level is Rosenbaum et al. [20]. Who applied a Lean production tool called Value Stream Mapping (VSM) to simultaneously assess environmental and production waste over the execution stage of construction projects. Another study by Yu, Tweed et al. [15] who found that poorly managed production flows result in significant construction waste. VSM applied to analyze and restructure the system to minimize waste.
Green deals with minimizing the environmental impact of a product or service. Some main tools’ purpose is to help evaluate the green aspect of a product. One such green tool is Life Cycle Assessment (LCA), which helps assess the environmental impacts of a product, process, or action. LCA is a four-step system, including goal and scope definitions, life-cycle inventory analysis, life-cycle impact assessment, and interpretation. Tool for the Reduction and Assessment of Chemical and other environmental Impacts (TRACI), developed by the U.S. Environmental Protection Agency, is another such tool. TRACI supports life-cycle assessment, where it translates the total environmental loads from the products or services into environmental impacts. Some of the major environmental impacts include human health criteria–related effects, human health cancer effects, global warming, ozone depletion, and land-use effects. The LCA is a useful approach that enhances making decisions and forming prospects for better processes with better environmental performance. [21,22,23,24].
Concerning Greening, LCA has been used in previous studies to quantify the environmental impacts of construction [25,26,27,28]. A life-cycle study developed by Bilec, Ries et al. [29,30] shows that the construction phase generates less environmental impact compared to the other buildings phase, such as the use phase. However, the same study shows that construction activities generate a significant amount of Particulate Matter emissions. Liu et al. [31] utilized LCA to examine strategies for reducing the environmental impact of on-site construction activities, particularly minimizing and reusing temporary materials during construction. The study shows that a well maintained and new construction equipment have low environmental impacts. Aimed at better informing decision-makers seeking to add environmental quality and sustainable development to project goals, a study by Sharrard, Matthews et al. [32] developed an input-output LCA estimating the far-reaching environmental effects of processes. Also, a study by Li, Zhu et al. [33] applied process LCA to highlights the environmental impact of material and equipment used during the construction phase.
Six-sigma is a thorough method applied to help firms in achieving and sustaining continuous success. Sigma refers to the number of inconstancies occurring in the process, and Six-sigma equates in statistics to 3.4 defects per million opportunities (DPMO). DPMO simply indicates how many errors would show up if the activity were to be repeated a million times. The DMAIC is a five-phase model that is commonly used by organizations that adopt Six-Sigma to improve their performance. The DMAIC starts by defining the problem, then measures the current performance, analyzes the root causes, develops ideas to improve root causes, and establishes standard measures to control performance [34,35,36,37].
Concerning the quality of construction, Six-Sigma maintains consistent performance, and ensure a high-quality performance [38,39,40,41]. Han, Chae et al. study combined Six-Sigma with Lean and shows great benefits [42]. Six-Sigma evaluates the quality of the current operation and measures the stability of a targeted workflow to control the critical sources of variability. Defects Per Million Opportunities is the Six-Sigma process-performance metric applied by Pheng and Hui [43] to the internal finishing process for a residential construction project. The low process performance—2 sigma—encouraged the contractor to supervise its ongoing building projects more closely, better ensuring that the level of artistry for the internal finishes complies with overall quality standards. A model that helped enhance interactions between project teams, reduced project delays and provide a structured process-improvement strategy, DMAIC, was used by Stewart and Spencer [44] to improve the productivity of the beam construction process for a railway station. Moreover, DMAIC provides a solid procedure for a gathering of information and enabling process quality improvement. Despite a robust body of literature in these three distinct methods, there is a gap in the research combining Lean, Green, and Six-Sigma into one framework to comprehensively improve the construction processes impacts generated by construction activities while improving quality.
Previous studies have combined the three methods (Lean, Green, and Six-sigma) to identify and reduce waste during construction. These studies concluded that errors and mistakes happen most during construction due to the inherent complexity of the process or poor planning. Improved planning and enhanced control during the earliest phases of construction, has the potential to reduce waste. There is a gap in research that focuses on merging Lean, Green, and Six-sigma tools to prevent waste by diagnosing the planned processes likely to produce waste during the construction process. This study aims to close this gap by developing a Lean, Green, and Six-sigma (LG6) model which adopts a proactive approach to improving efficiency before construction [5,6,45,46].
2. Research Methodology
Contractors perform their jobs differently [47]. Contractors usually rely significantly on their own experience. Contractors define success as completing the job within the assigned limitations of money and time [36,48]. Even though the contractors complete projects on time and within the stipulated budget, the applied methods may produce a high amount of waste every year. This paper is proposing the development of a proactive model: The Lean, Green, and Six-sigma (LG6) model, which can help contractors reevaluate their construction methods and improve their efficiency before construction. Microsoft Excel was used in developing the LG6. Excel is a well-known, commonly used software that is easy to use. Excel was selected as a template to collect, manage, and organize data, which in the future linked to an interactive database for better and faster decision making. Moreover, Excel has an extension of Data Analysis that deals with any type of data analysis and comparison like Statistical Package for the Social Sciences (SPSS) [49]. The LG6 examined using a case study working with a local contractor in Pittsburgh, Pennsylvania, USA. Where a construction process was reevaluated in terms of waste produced using the LG6 model.
2.1. Lean Green Six-Sigma Model (LG6)
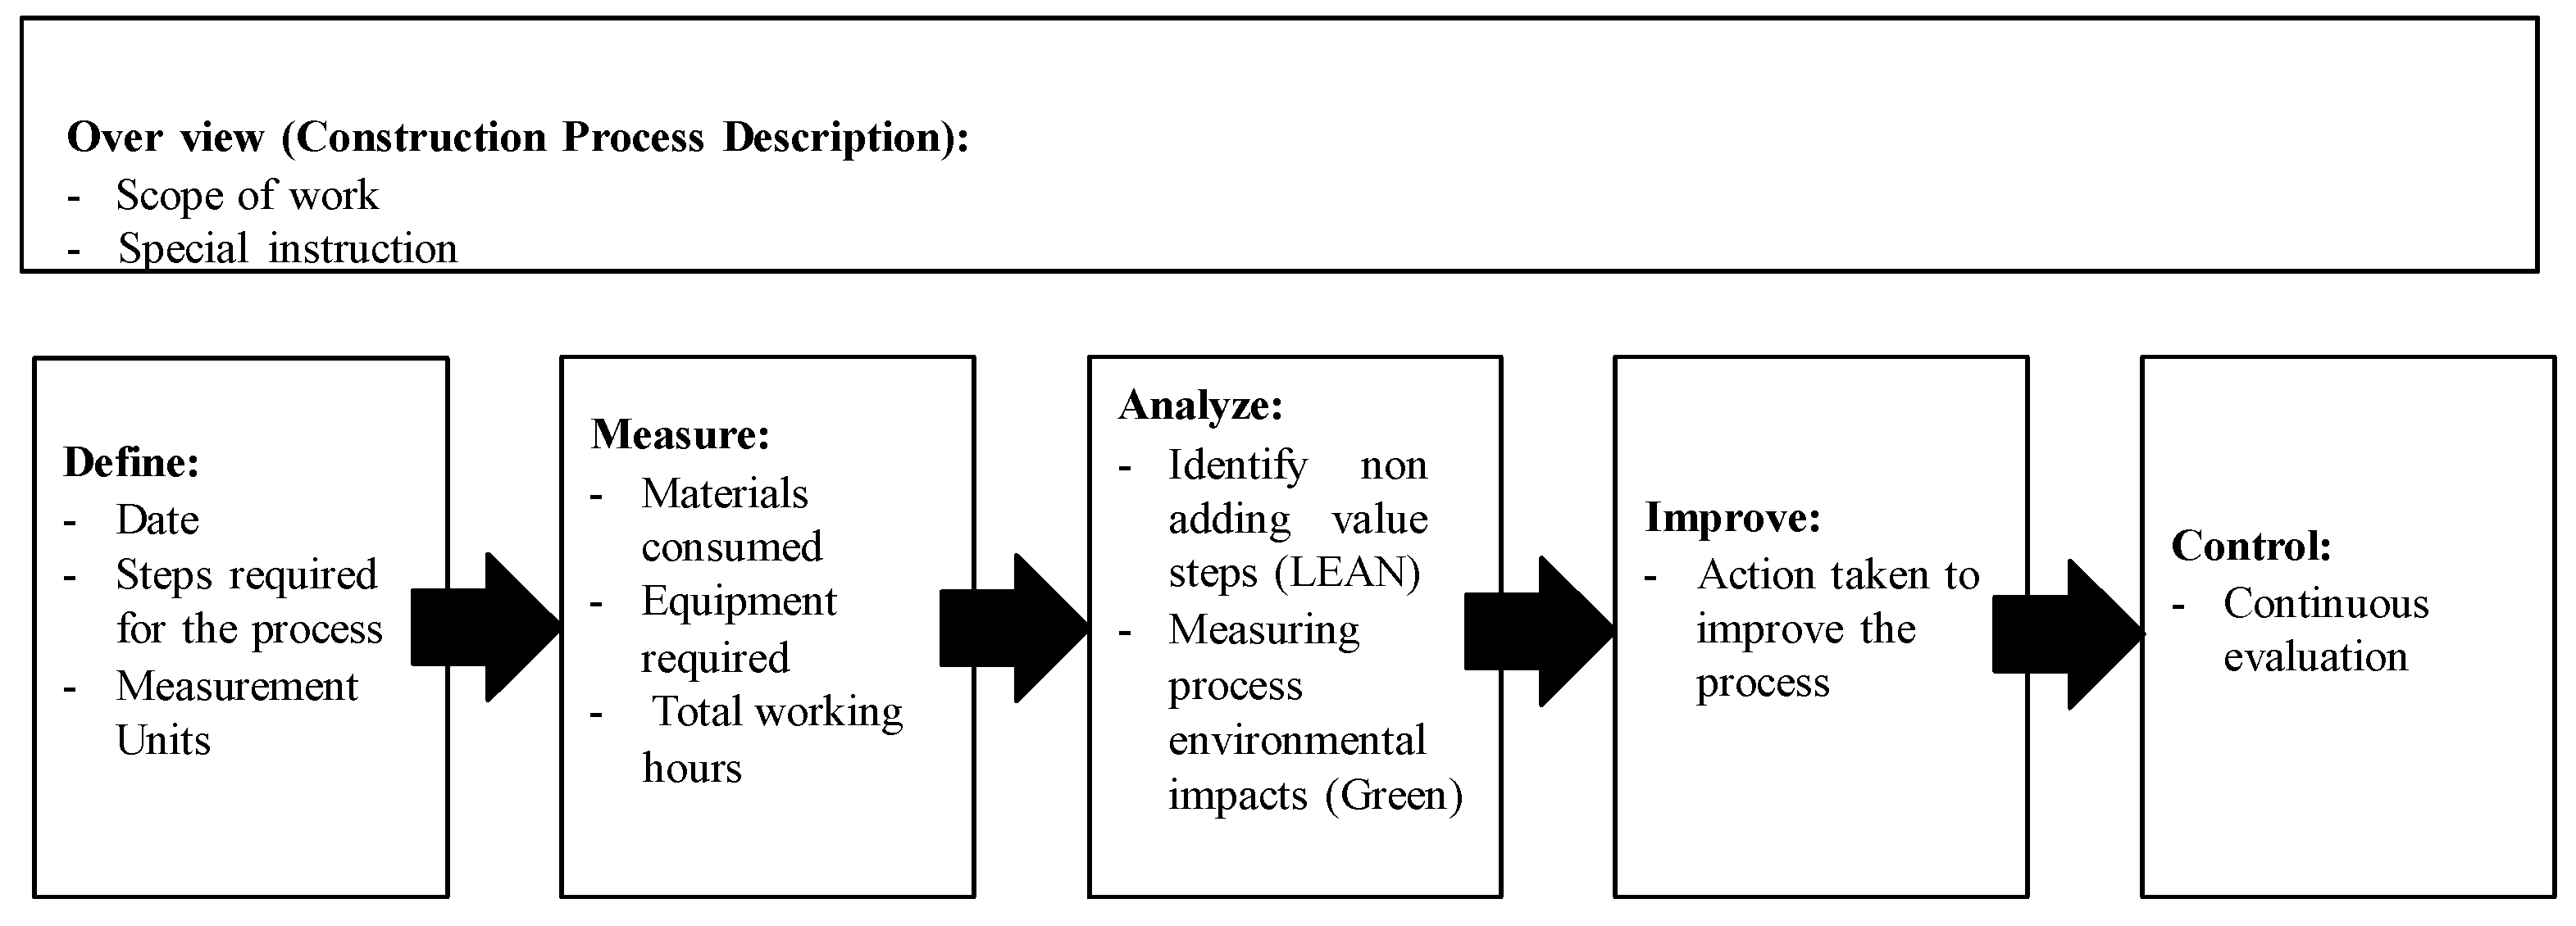
The LG6 model consists of two sections (see Figure 1 and Figure 2): Top section, which includes the primary process information, such as the scope of work, customer information, start date and duration, and client requirements. Moreover, a list of the primary objectives of the methods applied, Lean, Green, and Six-sigma are at the top section of LG6. It is vital to remind of what the purpose of each method is. Bottom Section: consists of five roles, following the DMAIC road map.
2.1.1. Define
Contractors should lay out all the steps they usually follow in finishing a specific job. This action helps evaluate each step individually and see to what extent it absorbs resources and generates waste. Proper planning help minimize waste and improve productivity. For this phase to work probably, a clear scope of work shall be formed in advance, which is a part of LG6. Studies show projects that ended up with errors and losses is due to poor planning [50,51]. Proper planning involves the definition of tasks, the choice of technology, and the relation between both [52].
The Define phase in LG6 aims to improve the planning. It also includes the starting date of each step, the duration it takes to complete each step and the total duration of the construction process.
2.1.2. Measure
It is essential to establish a collection system to determine the required resources for construction projects [53]. It helps in tracking, and benchmark projects to each other and lead to a reliable database for a better cost estimating. Highlight high-cost steps help project planners properly prioritize tasks and avoid potential risks. [54].
This LG66 phase consists of quantifying all consumed resources, including materials, equipment, and workers. Associated costs for each step in the process are calculated too. The quantity of consumed fuel was an addition under the equipment section to help to measure the environmental impact by the Analyze phase.
2.1.3. Analyze
At the Analysis part of the process tested by Lean and Green methods. This process consists of two steps:
- The use of the Lean concept, to guide the contractor to identify the steps at his construction project, which use resources without adding any value so that they can be removed or modified;
- The use of the LG6 model analyzes the environmental impact generated at each task performed, as each step we do produces CO2 emissions. To minimize this emission, LG6 features limited inventory containing most of the common materials that are used in construction, such as concrete, steel, and blocks. Along with their environmental impact. Becoming an excellent tool for the user. The absolute amount of environmental impact for one single unit can be calculated using this inventory; for example, the quantity entered for steel to be analyzed is impact per 1 kg. All data are generated using SimaPro7 software. This software implements the concept of LCA, which systematically assesses and manages the environmental impact of a product, process, or service through its entire life cycle.
2.1.4. Improve
In this phase, the process owner has the chance to try out various selections offering better performance if applicable to enhance the overall process. Looking back to the Define, Measure, and Analyze phases, the contractor can now quickly recognize which steps in the process are considered unnecessary. A suggestion might be to use more efficient equipment to produce fewer emissions; another suggestion might be to do business with local dealers instead of international firms to avoid waste related to long-distance travel.
2.1.5. Control
The control phase aims to keep the achievement performance level of the process at the desired standard. Here is where the LG6 uses the Defect per Million Opportunities formula to quantify (DPMO). Applying the DPMO provides a measurement of the process performance in concordance to the Six-sigma scale. The output from DPMO is adapted and adjusted to a sigma level, in which the more closely the number approaches the number 6, the fewer defects the process generates. The method DPMO works are first to calculate how much waste the process generates per unit using the formula:
and then apply the result to calculate the DPMO using the formula:
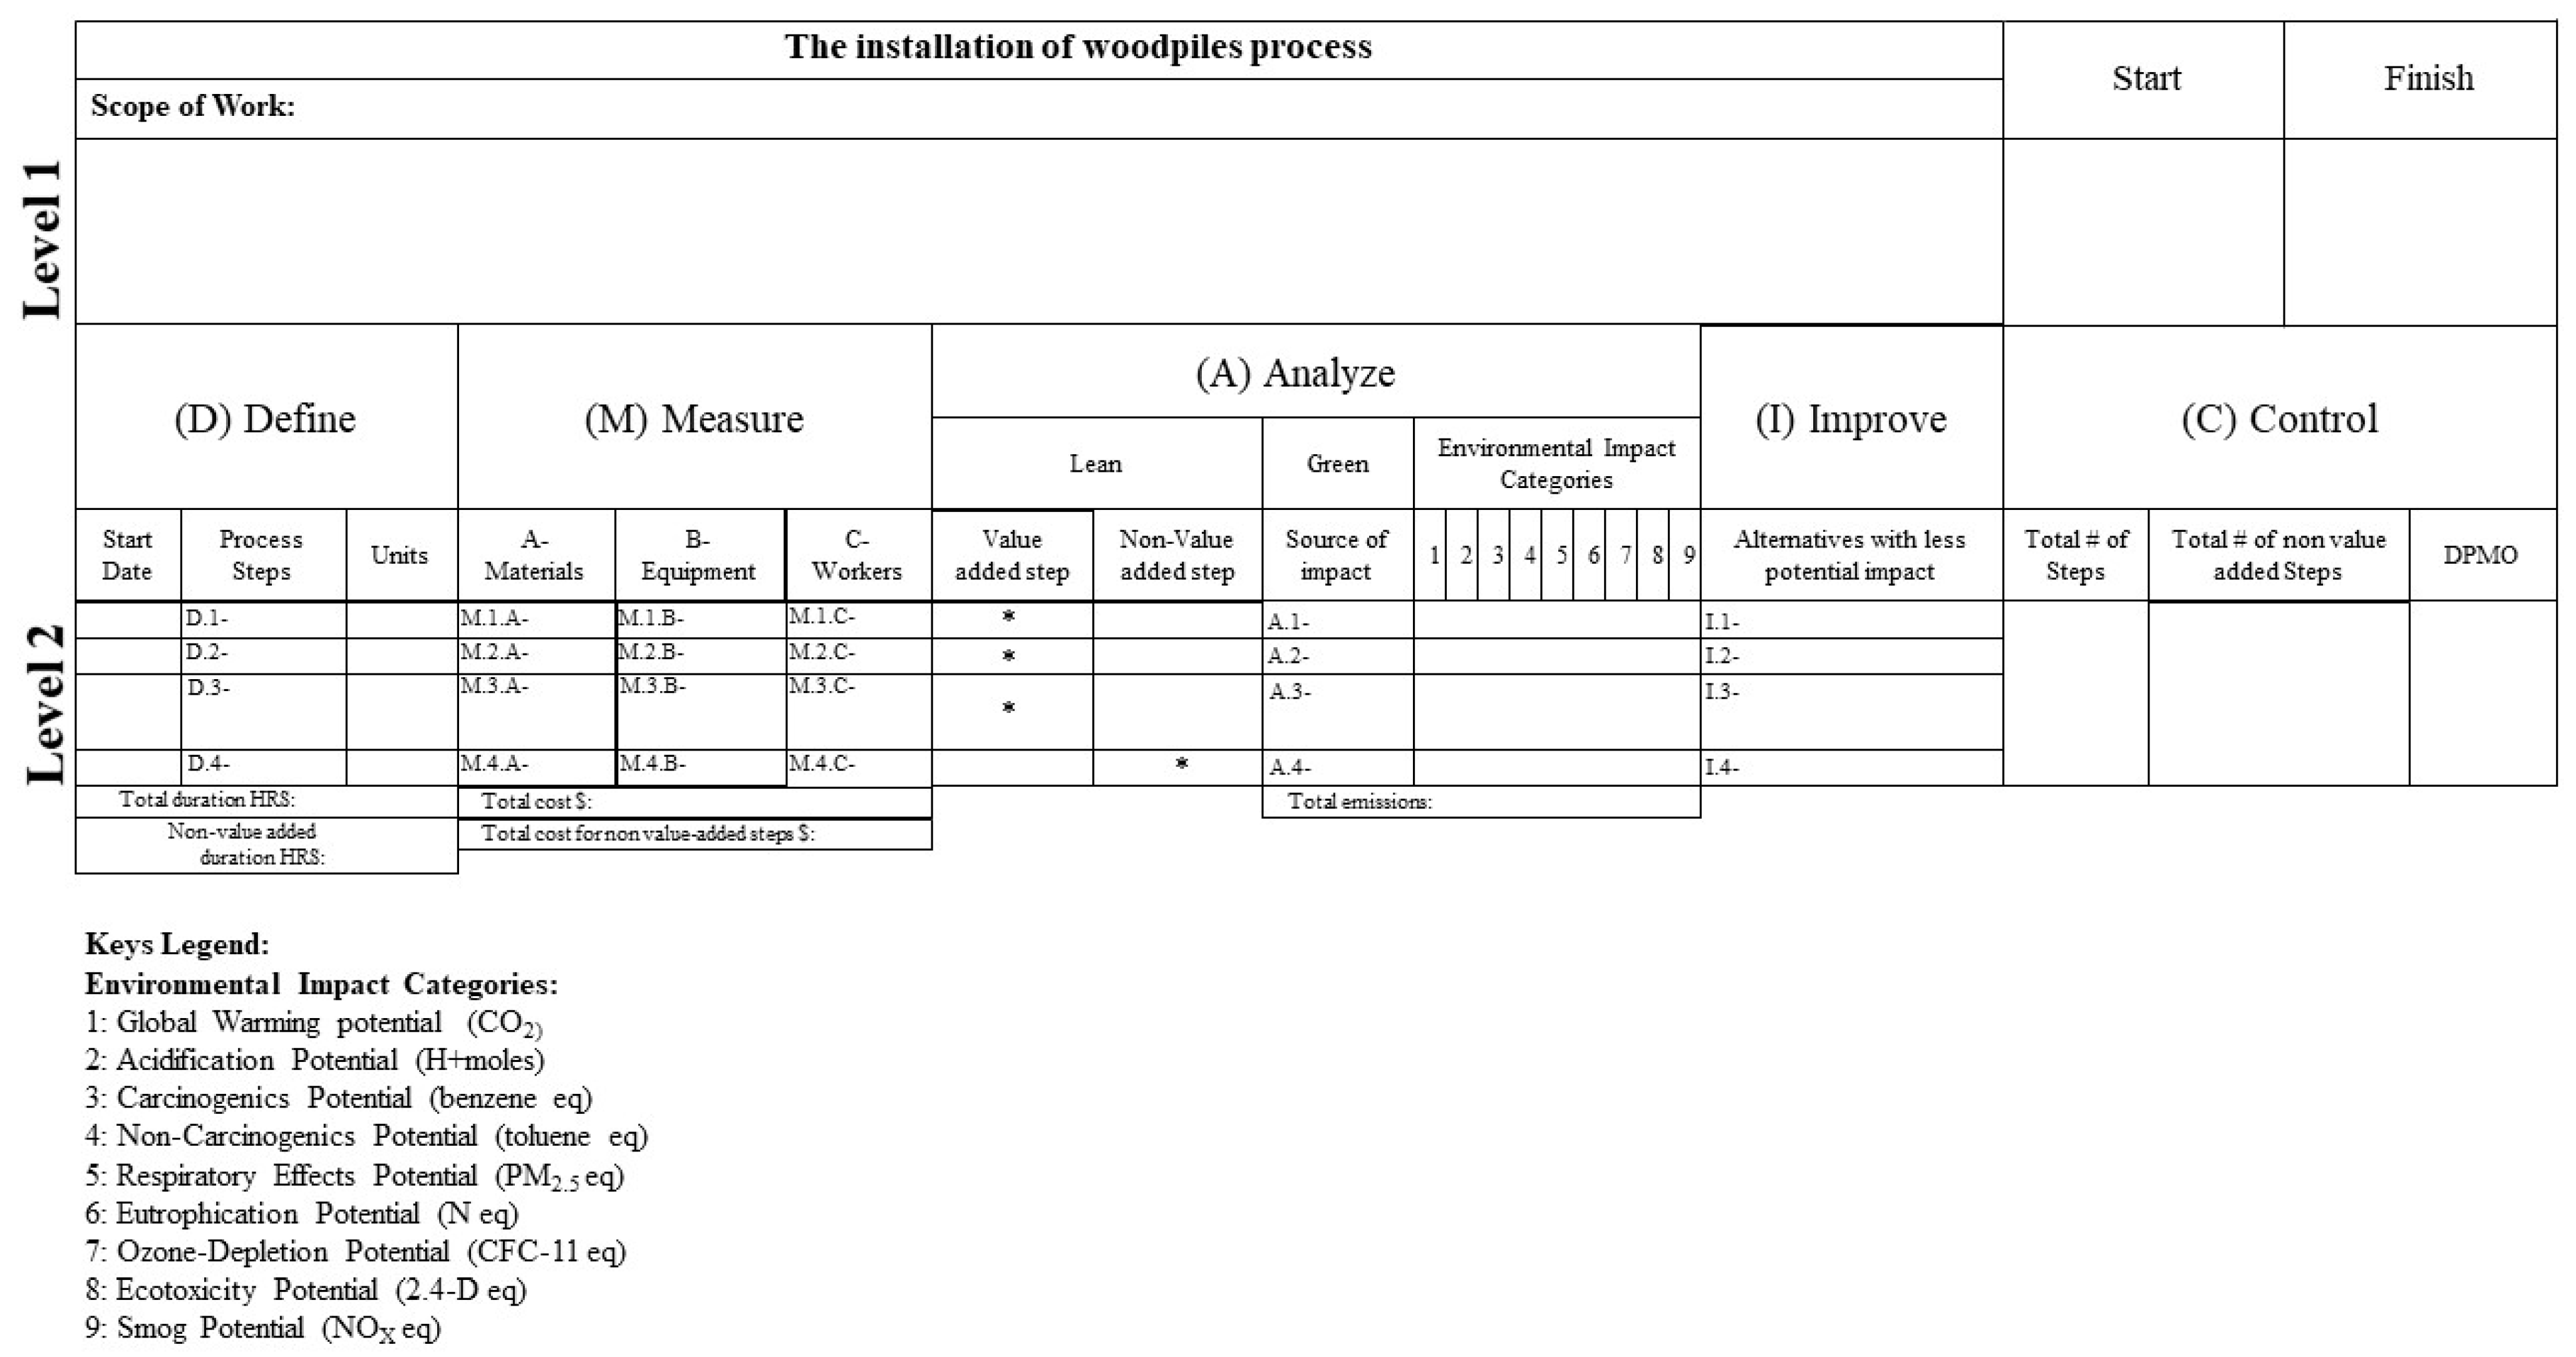
2.2. Case Study
A case study was completed to exemplify the use of the LG6 model. The LG6 model was used to measure the construction process for furnishing and driving about 160 woodpiles that are 40 ft long, 14 inches in diameter at the base, and 7 inches at the tip into regular soil. This case study was an actual construction job provided by a local contractor.
3. Research Findings and Results
3.1. Define (D)
In the define phase, all the steps taken to finish the job were recorded to determine which steps added value and which ones did not. A total of eight steps and 88 h were required to complete furnishing and driving the 168 woodpiles. These steps were: Delivering the materials to the site, driving the equipment to the site, setting up the equipment, taking down the equipment, moving out the equipment, driving the piles, cutting to length, and cleaning up the site. The step of driving the piles was significant, taking up 56 h, while adjusting the length came in second, involving 16 h of work (see Table 1).
3.2. Measure (M)
The next step in the LG6 model, as mentioned above, is to assess all assets used by each action in the construction process, including materials, equipment, and workers (See Table 2). Where in the construction industry, materials, labors, and equipment is the high cost for the project budget, representing 70% to 80% most of the time [55].
A- Materials: Quantities and Cost: the LG6 shows just one step (D.1) that consumed around 6720 ft. of woodpiles, and 168 of steel pile points at a total cost of $83,795. B- Equipment, fuel usage, and equipment cost: Both step D.1 and step D.2 need trucks to deliver the supplies (50 miles away) and the machinery (30 miles away) to the construction site. The cost of delivering the materials and the equipment was included in the final cost. The next step involving equipment was D.6, driving the piles. Most of the equipment operated in this step costs $6859 and uses a total of 4711 gallons of petrol. Then step D.7 used a concrete saw that cost $523.60 and consumed about 6 gallons of fuel. C- Workers: no workers were needed for both tasks D.1 and D.2; the remains of the tasks in the construction required workers. Step D.6 required a crane operator plus a general laborer. The final amount for the workers for this construction process was $5371. Different methods and variance in site conditions could add an extra layer of process steps that could lead to adding to the final cost [56].
3.3. Analyze (A)
Next in the LG6 model was to determine which steps do not provide extra benefits to the woodpile process according to the Lean concept. Also, in this phase (Analyze), the Life Cycle Assessment LCA calculated the environmental impact of the woodpile installation process (See Table 3). Lean: Four steps out of the total, eight steps were recognized as non-adding-value steps due to Lean principles. These four steps were: step D.3, “Setting up the equipment,” step D.4 “Taking down the equipment,” step D.5 “Moving out the equipment,” and step D.7 “Trimming the end of all piles to be matched in height.” Green: As shown in (Table 3), two leading causes of possible environmental impact in this process were recognized. First, the materials were consumed; both wood and steel have a meaningful environmental impact. Wood took the lead in some impact categories such as Carcinogenic potential, Respiratory effect, Eutrophication, Ecotoxicity, and Smog. The steel had a significant impact on the categories of Global Warming, Acidification, Non-carcinogenic, and Ozone depletion. The second source of impact in this process was petrol usage for both transportation and machinery. The crane operator was the primary source of CO2 in this process while driving the piles came after.
3.4. Improve (I)
In this phase, some alternatives were suggested to replace the actual steps to improve the environmental impact performance for the woodpile’s construction process (See Table 4). Replaced steps are not necessary; the objective was to let the process owner think about the process and see what other methods might be considered for better performance. For example, patronizing local vendors to acquire materials and equipment can reduce the number of trips to and from the job site. Another alternative was to standardize all piles, which could reduce the number of efforts to match all woodpiles to length after installing them.
3.5. Control (C)
This phase of the LG6 model evaluated how the contractor finished installing the woodpiles via DPMO. According to Lean, four steps were considered adding value to the process, while the other four are not. For that reason, the applied construction method would result in 500,000 defects in every million attempts (See Table 5). To calculate the sigma level using Excel, LG6 has integrated the formula:
where data in cell D2 is entered as a decimal. In this case, 50% error rate = 500,000, DPMO = 0.5, which calculate six sigma level as 1.5 (see Table 5)
At last, Table 6 displays a summary of the leading indicator for the construction process, such as necessary informative data, possible enhancements in environmental impact, and possible savings in terms of cost of the evaluated construction process.
According to the case study presented above, the LG6 model was able to quantify all processes and identified the processes which did not add value to the construction process. The model predetermined these non-value added processes and suggested alternatives that could decrease the occurrence of waste throughout the entire construction process. In contrast to previous studies that improve the construction process, this LG6 model was used to improve the construction process by using a predictive approach of diagnosing waste before the construction activity. It was evident in the case study the amount of waste prevented in terms of cost and environmental impact.
4. Conclusions
Managing and planning different resources to complete construction projects and meet client expectations and desired goals, moreover, need to do so in a cost-effective, yet minimally wasteful manner. Despite these objectives potentially conflicting with any given project, still, a variance can be applied at any time to the project for better performance.
This study developed an advanced model to help enhance the environmental impact and the bottom-line of a selected construction process. Avoiding waste before it occurs has more significant benefits than trying to dispose of it after construction. Achieving these benefits is the main objective of creating the LG6 model.
In this paper, a pro-active model LG6 was created to help contractors and stakeholders to re-evaluate their process to do construction jobs to using better ways. For further validation, the LG6 model was used to examine the installing of 160 woodpiles. Eight steps were required to finish this job, which took 88 h and a total cost of $96,547.76 to be completed.
Four out of the total eight steps in the woodpiles process were non-value-added steps so that eliminating or trading these steps with better options would increase the performance of the process. For example, in the case study, acquiring woodpiles with the same length would eliminate the equipment usage and money required to cut to length all of the woodpiles. Furthermore, a 1% price reduction and a 9% reduction in environmental impact would be realized if the original process is modified with the application of different methods.
The saving results might be insignificant in the case study, yet the woodpiles construction process is one construction process, among many other processes. Evaluation of all of the steps in a project, then, and the use of alternatives recommended by LG6 could result in more noteworthy savings. On the other hand, LG6 needs an attached pre-built database that has enough data to support planning and maintain a consistent decision process. This improvement should reduce any bias that LG6 could cause. For future work, the authors start to work on developing a database that collects and defines value and non-value-added activities. The data is collected through different channels, including site visits, case studies, and a close interview. We must have a fast-responsive linked database with extensive data, including environmental impact as well.
In conclusion, an LG6 model is a complete tool that can help any process owner to think about the process and help highlight any potential waste early so it can be avoided. The LG6 model is not complicated, provides concrete results, discusses all suitable alternatives, maintains a successful performance, and above all, is proactive. To apply a medical metaphor: An ounce of prevention is worth a pound of cure.
Author Contributions
Conceptualization, A.-A.B., J.F. and A.B.; methodology, A.-A.B.; software, A.B. and J.F.; validation, A.-A.B. and D.F.; formal analysis, J.F.; investigation, A.-A.B., A.B. and J.F.; resources, D.F.; data curation, A.-A.B. and J.F.; writing—original draft preparation, A.-A.B., A.B. and J.F.; writing—review and editing, A.-A.B., and D.F.; visualization, A.B. and J.F.; supervision, A.-A.B., and D.F.; project administration, A.-A.B., and D.F.; funding acquisition, D.F. All authors have read and agreed to the published version of the manuscript.
Funding
This research was funded by the support of the Secretaria d’Universitats i Recerca of the Department of Business and Knowledge of the Generalitat de Catalunya with the help of 2017 SGR 934.
Conflicts of Interest
On behalf of all authors, the corresponding author states that there is no conflict of interest.
References
- U.S. Environmental Protection Agency. Advancing Sustainable Materials Management: 2017 Fact Sheet; U.S. Environmental Protection Agency: Washington, DC, USA, 2019.
- Fuertes, A.; Casals, M.; Gangolells, M.; Forcada, N.; Macarulla, M.; Roca, X. An environmental impact causal model for improving the environmental performance of construction processes. J. Clean. Prod. 2013, 52, 425–437. [Google Scholar] [CrossRef]
- Albliwi, S.A.; Antony, J.; Arshed, N.; Ghadge, A. Implementation of lean six sigma in Saudi Arabian organisations. Int. J. Qual. Reliab. Manag. 2017, 34, 508–529. [Google Scholar] [CrossRef]
- US Green Building Council. LEED (Leadership in Energy and Environmental Design) Green building Rating System. Available online: http://www.usgbc.org/leed/leed_main.asp (accessed on 18 June 2017).
- Banawi, A.; Bilec, M.M. A framework to improve construction processes: Integrating Lean, Green and Six Sigma. Int. J. Constr. Manag. 2014, 14, 45–55. [Google Scholar] [CrossRef]
- Banawi, A.-A.; Bilec, M. Applying Lean, Green, and Six-Sigma Framework to Improve Exterior Construction Process in Saudi Arabia. J. Constr. Eng. Proj. Manag. 2014, 4, 12–22. [Google Scholar] [CrossRef]
- Hussain, K.; He, Z.; Ahmad, N.; Iqbal, M. Green, lean, six sigma barriers at a glance: A case from the construction sector of Pakistan. Build. Environ. 2019, 161, 106225. [Google Scholar] [CrossRef]
- Howell, G.A. What is lean construction-1999. Proc. IGLC 1999, 7, 1. [Google Scholar]
- Osmani, M.; Glass, J.; Price, A.D. Architects’ perspectives on construction waste reduction by design. Waste Manag. 2008, 28, 1147–1158. [Google Scholar] [CrossRef]
- Ohno, T. Toyota Production System: Beyond Large-Scale Production; CRC Press: Boca Raton, FL, USA, 1988. [Google Scholar]
- Pasqualini, F.; Zawislak, P.A. Value stream mapping in construction: A case study in a Brazilian construction company. In Proceedings of the 13th International Group for Lean Construction Conference: Proceedings, Sydney, Australia, 19–21 July 2005; p. 117. [Google Scholar]
- Lapinski, A.R.; Horman, M.J.; Riley, D.R. Lean processes for sustainable project delivery. J. Constr. Eng. Manag. 2006, 132, 1083–1091. [Google Scholar] [CrossRef]
- Salem, O.; Solomon, J.; Genaidy, A.; Minkarah, I. Lean construction: From theory to implementation. J. Manag. Eng. 2006, 22, 168–175. [Google Scholar] [CrossRef] [Green Version]
- Klotz, L.E.; Horman, M.; Bodenschatz, M. A lean modeling protocol for evaluating green project delivery. Lean Constr. J. 2007, 3. [Google Scholar]
- Yu, H.; Tweed, T.; Al-Hussein, M.; Nasseri, R. Development of lean model for house construction using value stream mapping. J. Constr. Eng. Manag. 2009, 135, 782–790. [Google Scholar] [CrossRef]
- Van den Bos, A.; Kemper, B.; de Waal, V. A study on how to improve the throughput time of Lean Six Sigma projects in a construction company. Int. J. Lean Six Sigma 2014, 5, 212–226. [Google Scholar] [CrossRef]
- Ko, C.-H.; Kuo, J.-D. Making formwork construction lean. J. Civ. Eng. Manag. 2015, 21, 444–458. [Google Scholar] [CrossRef]
- Xu, G.; Li, M.; Chen, C.-H.; Wei, Y. Cloud asset-enabled integrated IoT platform for lean prefabricated construction. Autom. Constr. 2018, 93, 123–134. [Google Scholar] [CrossRef]
- Garrett, D.F.; Lee, J. Lean construction submittal process—A case study. Qual. Eng. 2014, 23, 84–93. [Google Scholar] [CrossRef]
- Rosenbaum, S.; Toledo, M.; González, V. Improving environmental and production performance in construction projects using value-stream mapping: Case study. J. Constr. Eng. Manag. 2014, 140, 04013045. [Google Scholar] [CrossRef]
- Hill, R.C.; Bowen, P.A. Sustainable construction: Principles and a framework for attainment. Constr. Manag. Econ. 1997, 15, 223–239. [Google Scholar] [CrossRef]
- Guggemos, A.A.; Horvath, A. Decision support tool for environmental analysis of commercial building structures. In Proceedings of the Construction Research Congress 2005: Broadening Perspectives, San Diego, CA, USA, 5–7 April 2005; pp. 1–11. [Google Scholar]
- Ortiz, O.; Castells, F.; Sonnemann, G. Sustainability in the construction industry: A review of recent developments based on LCA. Constr. Build. Mater. 2009, 23, 28–39. [Google Scholar] [CrossRef]
- Rajagopalan, N.; Bilec, M.M.; Landis, A.E. Residential life cycle assessment modeling: Comparative case study of insulating concrete forms and traditional building materials. J. Green Build. 2010, 5, 95–106. [Google Scholar] [CrossRef]
- Sabnis, A.; Pranesh, M. Sustainability evaluation of buildings in pre-use phase using figure of merit as a new tool. Energy Build. 2017, 145, 121–129. [Google Scholar] [CrossRef]
- Al-Nuaimi, S.; Banawi, A.-A.A.; Al-Ghamdi, S.G. Environmental and Economic Life Cycle Analysis of Primary Construction Materials Sourcing under Geopolitical Uncertainties: A Case Study of Qatar. Sustainability 2019, 11, 6000. [Google Scholar] [CrossRef] [Green Version]
- Gardner, H.; Garcia, J.; Hasik, V.; Olinzock, M.; Banawi, A.; Bilec, M.M. Materials life cycle assessment of a living building. Procedia Cirp 2019, 80, 458–463. [Google Scholar] [CrossRef]
- Sabbagh, M.J.; Mansour, O.E.; Banawi, A.A. Grease the Green Wheels: A Framework for Expediting the Green Building Movement in the Arab World. Sustainability 2019, 11, 5545. [Google Scholar] [CrossRef] [Green Version]
- Bilec, M.; Ries, R.; Matthews, H.S.; Sharrard, A.L. Example of a hybrid life-cycle assessment of construction processes. J. Infrastruct. Syst. 2006, 12, 207–215. [Google Scholar] [CrossRef] [Green Version]
- Bilec, M.M.; Ries, R.J.; Matthews, H.S. Life-cycle assessment modeling of construction processes for buildings. J. Infrastruct. Syst. 2009, 16, 199–205. [Google Scholar] [CrossRef]
- Liu, C.; Ahn, C.R.; An, X.; Lee, S. Life-cycle assessment of concrete dam construction: Comparison of environmental impact of rock-filled and conventional concrete. J. Constr. Eng. Manag. 2013, 139, A4013009. [Google Scholar] [CrossRef]
- Sharrard, A.L.; Matthews, H.S.; Ries, R.J. Estimating construction project environmental effects using an input-output-based hybrid life-cycle assessment model. J. Infrastruct. Syst. 2008, 14, 327–336. [Google Scholar] [CrossRef] [Green Version]
- Li, X.; Zhu, Y.; Zhang, Z. An LCA-based environmental impact assessment model for construction processes. Build. Environ. 2010, 45, 766–775. [Google Scholar] [CrossRef]
- Setijono, D.; Al-Aomar, R. A lean construction framework with Six Sigma rating. Int. J. Lean Six Sigma 2012, 3, 299–314. [Google Scholar]
- Tchidi, M.F.; He, Z.; Li, Y.B. Process and quality improvement using Six Sigma in construction industry. J. Civ. Eng. Manag. 2012, 18, 158–172. [Google Scholar] [CrossRef]
- Lee, K.-L.; Su, Y. Applying six sigma to quality improvement in construction. J. Manag. Eng. 2012, 29, 464–470. [Google Scholar] [CrossRef]
- Taner, M.T. Critical success factors for six sigma implementation in large-scale Turkish construction companies. Int. Rev. Manag. Mark. 2013, 3, 212–225. [Google Scholar]
- Siddiqui, S.Q.; Ullah, F.; Thaheem, M.J.; Gabriel, H.F. Six Sigma in construction: A review of critical success factors. Int. J. Lean Six Sigma 2016, 7, 171–186. [Google Scholar] [CrossRef]
- Karakhan, A. Six sigma & construction safety: Using the DMAIC cycle to improve incident investigations. Prof. Saf. 2017, 62, 38. [Google Scholar]
- Negi, P.S.; Mandaliya, A.; Mahida, A.; Patel, A.; Patyal, V.S. Six Sigma in construction industry: A review. Int. J. Product. Qual. Manag. 2017, 22, 451–465. [Google Scholar] [CrossRef]
- Fernández-Solís, J.L.; Gadhok, N. Comparative Analysis of Lean and Six Sigma in Building Construction: Benefits, Obstacles and Opportunities; Texas A&M University Libraries: Killeen, TX, USA, 2018. [Google Scholar]
- Han, S.H.; Chae, M.J.; Im, K.S.; Ryu, H.D. Six sigma-based approach to improve performance in construction operations. J. Manag. Eng. 2008, 24, 21–31. [Google Scholar] [CrossRef]
- Pheng, L.S.; Hui, M.S. Implementing and applying Six Sigma in construction. J. Constr. Eng. Manag. 2004, 130, 482–489. [Google Scholar] [CrossRef]
- Stewart, R.A.; Spencer, C.A. Six-sigma as a strategy for process improvement on construction projects: A case study. Constr. Manag. Econ. 2006, 24, 339–348. [Google Scholar] [CrossRef]
- Hallam, C.; Contreras, C. Integrating lean and green management. Manag. Decis. 2016, 54, 2157–2187. [Google Scholar] [CrossRef]
- Cherrafi, A.; Elfezazi, S.; Govindan, K.; Garza-Reyes, J.A.; Benhida, K.; Mokhlis, A. A framework for the integration of Green and Lean Six Sigma for superior sustainability performance. Int. J. Prod. Res. 2017, 55, 4481–4515. [Google Scholar] [CrossRef]
- Beary, T.M.; Abdelhamid, T.S. Production planning process in residential construction using lean construction and six sigma principles. In Proceedings of the Construction Research Congress 2005: Broadening Perspectives, San Diego, CA, USA, 5–7 April 2005; pp. 1–10. [Google Scholar]
- Clough, R.H.; Sears, G.A.; Sears, S.K.; Segner, R.O.; Rounds, J.L. Construction Contracting: A practical Guide to Company Management; John Wiley & Sons: Hoboken, NJ, USA, 2015. [Google Scholar]
- Linoff, G.S. Data Analysis Using SQL and Excel; John Wiley & Sons: Hoboken, NJ, USA, 2015. [Google Scholar]
- Yassine, T.; Bacha, M.B.S.; Fayek, F.; Hamzeh, F. Implementing takt-time planning in construction to improve work flow. In Proceedings of the 22nd Annual Conference of the International Group for Lean Construction, Oslo, Norway, 25–27 June 2014; pp. 23–27. [Google Scholar]
- Baldwin, A.; Bordoli, D. Handbook for Construction Planning and Scheduling; John Wiley & Sons: Hoboken, NJ, USA, 2014. [Google Scholar]
- Zhang, S.; Boukamp, F.; Teizer, J. Ontology-based semantic modeling of construction safety knowledge: Towards automated safety planning for job hazard analysis (JHA). Autom. Constr. 2015, 52, 29–41. [Google Scholar] [CrossRef]
- Kozhevnikov, D. Building a system for efficient use of resources in construction. MATEC Web Conf. 2018, 193, 05014. [Google Scholar] [CrossRef]
- Raitu, C.; Anderson, B.B.; Sfakianaki, E. Resource-efficient construction: Rethinking construction towards sustainability. World J. Sci. Technol. Sustain. Dev. 2015, 12, 233–242. [Google Scholar]
- Shrestha, P.P.; Pradhananga, N.; Mani, N. Correlating the quantity and bid cost of unit price items for public road projects. Ksce J. Civ. Eng. 2014, 18, 1590–1598. [Google Scholar] [CrossRef]
- Ni, P.; Mangalathu, S.; Mei, G.; Zhao, Y. Permeable piles: An alternative to improve the performance of driven piles. Comput. Geotech. 2017, 84, 78–87. [Google Scholar] [CrossRef]
Figure 1.
Abstract, LG6 Model.

Figure 2.
Outline, LG6 Model.


Table 1.
Define phase explains start dates, process steps and units for the woodpile installation process.
Table 1.
Define phase explains start dates, process steps and units for the woodpile installation process.
| Define (D): | |||
|---|---|---|---|
| Date Start | Process Steps | Process Description | Units |
| 06/01 | D.1 | Delivering the woodpiles and the piles points to the job site. | 50 Mile |
| 06/01 | D.2 | Driving the equipment to the job site. | 30 Mile |
| 06/02 | D.3 | Setting up the equipment. | 4 Hrs. |
| 06/02 | D.4 | Taking down the equipment. | 4 Hrs. |
| 06/02,03 | D.5 | Moving out the equipment. | 4 Hrs. |
| 06/04 | D.6 | Driving the piles | 56 Hrs. |
| 06/12 | D.7 | Cutting to length | 16 Hrs. |
| 06/14 | D.8 | Cleaning up the site | 4 Hrs. |
| Total Process Duration in Hours | 85 | ||
| Non-Value-added Total Duration in Hours | 28 | ||
Table 2.
Measure phase explains all consumed resources for the woodpile installation process, including materials, equipment, and workers.
Table 2.
Measure phase explains all consumed resources for the woodpile installation process, including materials, equipment, and workers.
| Measure (M): | ||||
|---|---|---|---|---|
| Process Steps | A- Materials | Quantities | Unit Cost $ | Total Cost $ |
| M.1.A | 1. 168 wooden piles (40 lin. ft.) | 6720 ft. | 11 | 72,912 |
| 2. Pile points. | 168 pieces | 65 | 10,884 | |
| M.2.A | NA | |||
| M.3.A | NA | |||
| M.4.A | NA | |||
| M.5.A | NA | |||
| M.6.A | NA | |||
| M.7.A | NA | |||
| M.8.A | NA | |||
| Total Materials Cost | 83,795 | |||
| Total Materials Cost for Non-Value-Added Steps | 0 | |||
| B- Equipment | Fuel Usage in Gal. | Cost of Equipment Usage | ||
| Unit Cost $ | Total Cost $ | |||
| M.1.B | 1. NA | |||
| 2. NA | ||||
| 3. A truck for materials transportation. | Include with materials cost | |||
| M.2.B | 1. A truck for equipment transportation. | Include with equipment cost | ||
| M.3.B | NA | |||
| M.4.B | NA | |||
| M.5.B | NA | |||
| M.6.B | 1. Crane 800 HP, Diesel | 2688 | 82.4 | 4614.4 |
| 2. Leads for hummer | NA | 14.63 | 819.28 | |
| 3. Pile hummer 600 HP., Diesel | 2016 | 10.8 | 604.8 | |
| 4. Air compressor 3.0 HP., Gasoline | 6.72 | 14.65 | 820.4 | |
| M.7.B | 1. Concrete Saw, Gasoline 5.6 HP. | 5.4 | 9.35 | 523.6 |
| M.8.B | 1. Construction cleaning tools (brushes, brooms, etc.) | NA | NA | NA |
| Total Equipment Cost | 7382.5 | |||
| Total Equipment Cost for Non-Value-Added Steps | 523.6 | |||
| C- Workers | Working Hours | Unit Cost $/Hr. | Total Cost $ | |
| M.1.C | NA | |||
| M.2.C | NA | |||
| M.3.C | 1. (2) General laborers | 4 | 15.56 | 124.48 |
| M.4.C | 1. (2) General laborers | 4 | 15.56 | 124.48 |
| M.5.C | 1. (2) General laborers | 4 | 15.56 | 124.48 |
| M.6.C | 1. (1) Crane operator | 56 | 21.67 | 1386 |
| 2. (3) General laborers | 56 | 15.56 | 2987.52 | |
| M.7.C | 1. (2) General laborers | 7 | 15.56 | 497.92 |
| M.8.C | 1. (1) General laborers | 1 | 15.56 | 15.56 |
| Total Workers Cost | 5370.2 | |||
| Total Workers Cost for Non-Value Steps | 871.4 | |||
Table 3.
Analyze phase explains Value-Added steps and Non-Value-Added steps along with analyzing the environmental impact of the woodpile installation process.
Table 3.
Analyze phase explains Value-Added steps and Non-Value-Added steps along with analyzing the environmental impact of the woodpile installation process.
| Analyze (A): | |||||||||
|---|---|---|---|---|---|---|---|---|---|
| Lean | Green | ||||||||
| Process Steps | Value-Added Steps | Non-Value-Added Steps | Source of Potential Waste/Environmental Impact to be Analyzed by LCA | Inventories | |||||
| A.1 | A.1.1 Resources usage/wood | 6720 ft. | |||||||
| A.1.2 Resources usage/steel | 2016 kg | ||||||||
| A.1.3 Transportation/Diesel | 50 Mile | ||||||||
| A.2 | A.2 Transportation/Diesel | 30 Mile | |||||||
| A.3 | NA | ||||||||
| A.4 | NA | ||||||||
| A.5 | NA | ||||||||
| A.6 | A.6.1 Equipment usage/Diesel | 2688 Gal | |||||||
| NA | NA | ||||||||
| A.6.3 Equipment usage/Diesel | 2016 Gal | ||||||||
| A.6.4 Equipment usage/Diesel | 6.72 Gal | ||||||||
| A.7 | A.7 Equipment usage/Diesel | 5.4 Gal | |||||||
| A.8 | NA | ||||||||
| Green—Life Cycle Environmental Impact Categories | |||||||||
| Item | Global Warming (CO2 eq.) kg | Acidification Potential (H+moleseq.) kg | Carcinogenics Potential (Benzene eq.) kg | Non-Carcinogenics Potential (Toluene eq.) kg | Respiratory Effects Potential (PM2.5 eq.) kg | Eutrophication Potential (N eq.) kg | Ozone Depletion Potential (CFC-11eq.) kg | Eco Toxicity Potential (2.4-D eq.) kg | Smog Potential (NOX eq.) kg |
| A.1.1 | −1,065,098 | 93,808.84 | 98.9 | 97,0641.3 | 315 | 39.6 | 2.81 × 10⁻⁶ | 20,099.9 | 1279 |
| A.1.2 | 2116 | 1044 | 62 | 110,759 | 4 | 0.6 | 7.0825 × 10⁻⁶ | 249 | 10 |
| A.1.3 | 65 | 23 | 0.012 | 195 | 0.05 | 0.04 | 9.6911 × 10⁻⁶ | 9 | 0.5 |
| A.2 | 39 | 14 | 0.007 | 117 | 0.03 | 0.024 | 5.8146 × 10⁻⁶ | 5.4 | 0.3 |
| A.3 | NA | ||||||||
| A.4 | NA | ||||||||
| A.5 | NA | ||||||||
| A.6.1 | 4683 | 3227 | 11 | 239,336 | 5 | 2 | 1.3081 × 10⁻⁶ | 6646 | 32 |
| A.6.2 | NA | ||||||||
| A.6.3 | 3512 | 2420 | 9 | 179,502 | 4 | 1.7 | 9.8109 × 10⁻⁷ | 4985 | 24 |
| A.6.4 | 13 | 8.8 | 0.03 | 651 | 0.01 | 0.006 | 3.5594 × 10⁻⁹ | 18 | 0.09 |
| A.7 | 10 | 7 | 0.02 | 520 | 0.01 | 0.004 | 2.8444 × 10⁻⁹ | 14 | 0.07 |
| A.8 | NA | ||||||||
| TotalEmissions | (1,054,660.2) | 100,552.8 | 181.2 | 1,501,721.5 | 327.6 | 44 | 2.7696 × 10⁻⁵ | 32,027.3 | 1345.7 |
Table 4.
Improve offers alternatives to the process with less environmental and economic impact of the woodpile installation process.
Table 4.
Improve offers alternatives to the process with less environmental and economic impact of the woodpile installation process.
| Improve (I): | |
|---|---|
| Process Steps | Optional Alternatives (For Better Process Performance) |
| I.1.1 | |
| I.1.2 | |
| I.1.3 | Purchase materials a close providers (Less travel distance by) |
| I.2 | Purchase materials a close providers (Less travel distance by) |
| I.3 | |
| I.4 | |
| I.5 | |
| I.6 | |
| I.7 | Considered wood piles with same length |
| I.8 | |
Table 5.
Control phase explains the current performance level according to the Six-sigma scale for the installation of the woodpile process.
Table 5.
Control phase explains the current performance level according to the Six-sigma scale for the installation of the woodpile process.
| Control (C): | ||
|---|---|---|
| Total Number of Steps in The Process | Total Number of the Value-Added Steps in The Process | Defective Per Million Opportunities (DPMO) |
| 8 | 4 | 500,000 |
Table 6.
Major outputs for the woodpiles installation process.
| Outputs for Installation OF Woodpiles Process | ||||
|---|---|---|---|---|
| Division | Foundation | Process | Installation of Woodpiles | |
| Total number of steps in the process | 8 | |||
| Total number of non-value added steps in the process | 4 | |||
| Defective per million opportunities | 500,000 | |||
| Sigma level out of 6 | 1.5 | |||
| Total process time Hrs. | 85 | |||
| Time that might be saved in the process Hrs./Percentage | 28/33% | |||
| Total process cost $ | 96,547.76 | |||
| Total Savings cost $/Percentage | 1394.96/1% | |||
| Total savings in materials cost $ | 0 | |||
| Total savings in equipment cost $ | 523.6 | |||
| Total savings in workers cost $ | 871.36 | |||
| Total Environmental Impact | ||||
| Impact Category | Unit | Original Process Value-added Steps + Non-value Steps | Modified Process Value-added Steps Only | Percentage Saving |
| Global Warming | (CO2 eq.) | (1,054,660.2) | (1,054,670.3) | 1 |
| Acidification | (H+moles eq.) | 100,552.8 | 100,545.8 | 0.99 |
| Carcinogenics | (Benzene eq.) | 181.2 | 181.1 | 0.99 |
| Non-carcinogenics | (Toluene eq.) | 1,501,721.5 | 1,501,201.1 | 0.99 |
| Respiratory effects | (PM2.5 eq.) | 327.6 | 327.5 | 0.99 |
| Eutrophication | (N eq.) | 44.05 | 44.04 | 0.99 |
| Ozone depletion | (CFC-11 eq.) | 2.7696 × 10⁻⁵ | 2.7693 × 10⁻⁵ | 0.99 |
| Eco toxicity | (2.4-D eq.) | 32,027.3 | 32,012.8 | 0.99 |
| Smog | (NOX eq.) | 1345.78 | 1345.71 | 0.99 |
© 2020 by the authors. Licensee MDPI, Basel, Switzerland. This article is an open access article distributed under the terms and conditions of the Creative Commons Attribution (CC BY) license (http://creativecommons.org/licenses/by/4.0/).
Share and Cite
MDPI and ACS Style
Banawi, A.-A.; Besné, A.; Fonseca, D.; Ferrandiz, J. A Three Methods Proactive Improvement Model for Buildings Construction Processes. Sustainability 2020, 12, 4335. https://0-doi-org.brum.beds.ac.uk/10.3390/su12104335
AMA Style
Banawi A-A, Besné A, Fonseca D, Ferrandiz J. A Three Methods Proactive Improvement Model for Buildings Construction Processes. Sustainability. 2020; 12(10):4335. https://0-doi-org.brum.beds.ac.uk/10.3390/su12104335
Chicago/Turabian StyleBanawi, Abdul-Aziz, Alia Besné, David Fonseca, and Jose Ferrandiz. 2020. "A Three Methods Proactive Improvement Model for Buildings Construction Processes" Sustainability 12, no. 10: 4335. https://0-doi-org.brum.beds.ac.uk/10.3390/su12104335
Note that from the first issue of 2016, this journal uses article numbers instead of page numbers. See further details here.