Software Application for Organizational Sustainability Performance Assessment


1
Department of Industrial Engineering and Management, Lucian Blaga University of Sibiu, 550024 Sibiu, Romania
2
Department of Computer Science and Electrical Engineering, Lucian Blaga University of Sibiu, 550024 Sibiu, Romania
*
Author to whom correspondence should be addressed.
Sustainability 2020, 12(11), 4435; https://0-doi-org.brum.beds.ac.uk/10.3390/su12114435
Submission received: 3 May 2020
/
Revised: 23 May 2020
/
Accepted: 27 May 2020
/
Published: 29 May 2020
(This article belongs to the Collection Risk Assessment and Management)
Abstract
:Sustainability performance assessment is a challenge for many companies due to the heterogeneity of indicators and the lack of a standardized reporting framework. This paper describes a software solution that simplifies the sustainability reporting process and is useful for decisions concerning sustainable management. We analyzed various indicators from public sustainability reports of five companies and obtained some relevant results using the tool that we developed based on mathematic algorithms and an aggregation model of different indicators. The software application calculates a Global Sustainability Index based on the proposed model of the sustainable organization described in this paper. An optimal solution is very rare in the transition towards the sustainable organization and compromises are required most frequently between environmental, economic and social aspects on the one hand and the expectations of the stakeholders on the other hand. The proposed tool helps users to cope with these challenges and takes into consideration that information is not always available and precise. Another feature offered by the tool is that besides simplifying sustainability performance assessment, it highlights low performance indicators and offers suggestions for improvement based on a genetic algorithm.
1. Introduction
Over the last years, organizations have been facing an increased pressure to focus on sustainability and accountability in business performance, paying special attention to the three dimensions of sustainability: economy, society and environment [1,2]. There is a variety of sources that generate demands for sustainability management. These include fright of plummeting sales, societal mandates incorporated into regulations, and the possibility of altering the reputation if a company does not have a firm and tangible commitment to sustainability management [3,4].
Various methods and instruments are currently available to provide support for integrating and assessing sustainability into different levels and dimensions of organizational management [2,5]. The United Nations offers the CSD Indicators of Sustainable Development (UNCSD) [6] to give countries the possibility to measure their degree of sustainability. The literature shows numerous approaches for assessing organizational sustainability performance [2,5,7,8,9]. Nowadays, there are several frameworks of sustainability performance assessment. According to the authors in [2], the foundation of sustainability reporting stands in The World Business Council for Sustainable Development [10], the Global Reporting Initiative [11,12] and development of standards [13,14].
Several tools are available to assess organizational sustainability. These include the Dow Jones Sustainability Index, which focuses mainly on one of the three dimensions of sustainability, namely the economic one [15], the Global Sustainability Index [8], and the Global Report Initiative [11], for a holistic assessment of organizational sustainability. The abundance of approaches of sustainability performance assessment, both at country and organizational levels, shows that this is a hot topic and there is an increased interest in this area. Chen et al. [1] identify such approaches and practices that include suggestions of indicators [16], process and product metrics [17], and energy modelling and simulation [18,19,20].
The interrelated and complex challenges implied by systematic ecosystems degradation, constraints concerning the resources, social inequity and financial instability are redefining the business conditions for the twenty-first century. Organizations need to face new demands to address these challenges, but this context is also a great opportunity for innovation. Even if sometimes neglected, designing or redesigning business models is an important aspect of innovation.
According to França et al. [21], competitive advantage lasts longer when companies redesign their business models rather than when they decide to introduce new services or products. When organizations focused on the transition towards sustainability, most managers reported that this decision increased their profits and brought other benefits, and also led to changing their organizations’ business models.
Incorporating notions of sustainable development in business management has become an important and urgent issue that managers need to consider [22,23]. This paper proposes a software application for sustainability performance assessment in an organization.
Starting from the idea that the future generations would not be able to satisfy their own needs if the development for satisfying the present needs [24] is not being done in a sustainable way, the current paper aims to help managers and decision makers to compute the sustainability index of their organization and to increase the awareness related to it. Additionally, it could be a useful mechanism in monitoring and regulating the economic development.
The goal of the paper is twofold: implementing an online platform that allows decision makers to aggregate all indicators from their sustainability reports (economic, social, environmental, etc.) using a mathematical model, in a single indicator called Global Sustainability Index (GSI) and to analyze the companies based on it, on the one hand, and secondly, optimizing [25] the GSI to offer a future perspective of sustainable development within the organization [26].
We aim to meet the needs of decision makers who want to self-assess the sustainability of their organization and to see its progress in time, by using a numeric value (the GSI), that can be generated out of their sustainability reports by aggregating various indicators. The model presented in this paper respects the viewpoint that a sustainable organization includes sustainability in each decision, therefore, we proposed a triple approach: internal, external and operational. Each approach includes a set of indicators, suggested by the literature. There might be indicators that do not apply to some business sectors and must be excluded from the model, while there might be business sectors that require adding other indicators to the model. The purpose of this work is to build a flexible and adaptable software tool to simplify the sustainability reporting process, regardless of the industry, size or geographic location of the organization.
As the result may not be optimal, genetic algorithms will be applied to correct or improve the result, as follows: calculating the maximum degree of sustainability a company can achieve, but also offering some recommendations on how to modify its operations so that the maximum value of sustainability is reached.
Within the platform, there will be a reporting system that will allow companies to view and analyze the results in Excel format. The online platform will allow any company to register and be able to calculate their own sustainability index.
The project was carried out in four stages, each with its own objectives such as data collecting, front-end development, and back-end development using the main algorithm for computing the sustainability index and the integration of all layers.
The rest of the paper is organized as follows: Section 2 sets the context of this research by reviewing the literature that highlights the challenges of defining a sustainable organization, measuring sustainability progress, understanding composite indicators for sustainability assessment and presents the use of Business Intelligence (BI) tools for sustainability performance assessment. Section 3 presents a generic model of the sustainable organization, that serves as a baseline for the software application, which is flexible and easily adaptable to calculate custom composite sustainability indicators, according to the needs and particularities of the organization. The fourth section of the paper illustrates the mathematic apparatus that underlies the software application that integrates sustainability indicators and describes our approach based on an evolutionary algorithm to calculate the Global Sustainability Index. Section 5 presents the custom composite indicators of five companies, generated by our application based on data, available in their public annual sustainability reports. We also show the prediction of their future sustainability performance using the genetic algorithm. Limitations of the application and implications for practice are briefly described in Section 6. The final section presents general conclusions, together with the main contributions and further work.
2. Setting the Context
2.1. The Sustainable Organization
There is a vast literature that offers multiple definitions of a sustainable organization, most of them related to the triple approach of sustainability [27]. There are numerous innovative approaches of a sustainable company, that include incorporating sustainability in each decision [28,29,30,31], meeting the needs of current stakeholders without compromising the needs of future stakeholders as well [32], responding to customer needs while treating the environment well [33] or using renewable and recyclable resources while curbing pollution [34]. Bocken et al. [35] reviewed the literature and proposed eight archetypes of sustainable business models. These include adopting a stewardship role, creating value from waste, encouraging sufficiency, re-purposing the business to benefit the society and/or the environment, preferring renewables and natural processes, maximizing energy and material efficiency, delivering functionality, rather than ownership, and developing scale-up solutions.
Sustainability is a prescriptive notion that recommends how humans should behave with respect to the environment and highlights their responsibility towards each other and future generations [36]. Regardless of the definition, sustainability is about the long run, thus any organization that wants to be sustainable needs to consider its future development and to assess its sustainability performance in order to reduce risks and uncertainty.
2.2. Measuring Sustainability Progress
The global environmental footprint is considered to be caused significantly by the business sector, while it has a major influence on wider economic and social issues [37]. Therefore, it is crucial to improve the environmental and sustainability performance of businesses in order to achieve a more sustainable society [38]. The United Nations proposed 17 sustainable development objectives [39], but the assessment of the progress for achieving these goals was not included [40]. Thus, the literature shows a growing number of approaches [41] to measure sustainability performance and integrate the results [41,42], both at the corporate and society level. The attention given to integrating environmental, social and economic indicators [43,44] shows the importance of aggregated indexes for offering decision-makers an overview of the context, to help them analyze and choose actions required for a more sustainable society [45,46].
Parris and Kates [47] identify four major reasons why sustainability performance is evaluated: advocacy, building participation and consensus, research and management and decision making. Indicators have been defined to show progress towards sustainable development goals and to advise decision makers to monitor, manage and control complex systems [48,49].
Mori and Christodoulou [44] provide a critical review on major sustainability indices and indicators concluding that there are research areas for which no major indicator or index has been developed to satisfy all the requirements to assess specific issues. Thus, we propose in this paper a flexible software application that is based on a mathematical algorithm that allows the decision maker to adapt any sustainability index to their needs by effortlessly integrating multiple indicators that can have different measuring units.
2.3. Composite Sustainability Indicators
There are many controversies regarding the operationalization of sustainable development and therefore, there have been proposed many measuring methods to assess the progress of the process [43,50]. The sustainable development decision making process will always involve complex and dynamic phenomena, regardless of the focus of the analysis, therefore, complex tools are needed for sustainability performance assessment [51,52,53].
Freudenberg [54] argues that aggregated indicators have been the focus of sustainability related decision making as they are valued as political and communication instruments.
A composite index integrates multiple indicators that have different measuring units and there are no evident procedures to assign their weights [43]. Aggregated indexes are created for a specific purpose and every composite index can be considered a model [43,55,56,57]. According to Kondyli [43], an aggregated index needs to consider a theoretical framework, data selection, multivariate analysis, imputation of missing data, data normalization, weighting of compounding indicators, aggregation, robustness, structure and presentation, and dissemination of results. The Global Sustainability Index proposed in this paper is a generic composite index for sustainability assessment and has been developed as an example to demonstrate the viability of the software application. The aim of this work is to offer decision makers an easy to use instrument to assess sustainability performance by calculating custom indexes to evaluate specific issues. The Global Sustainability Index was developed based on a generic model for the sustainable organization, giving the proposed on-line tool the flexibility to be adapted into any of the 15 sustainability indicators reviewed by Mori and Christodoulou [44].
In [58], the authors propose a metric for determining human resource disclosures in corporate annual reports of insurance companies, using aggregation—weighting different features like size, number of employees, age, etc., they emphasize that the human resource disclosure decision is influenced by some company characteristics and suggest that sustainability reports could be similarly analyzed for organizational profiling. The instrument presented in this paper could simplify the research suggested by [58].
2.4. Using Business Intelligence Tools for Sustainability Performance Assessment
Business intelligence (BI), social responsibility and sustainable development each represent relevant research themes when viewed separately, but they have not been investigated in conjunction. This paper highlights that the tools and methods of BI can be relevant in sustainability performance assessment, as the use of computer science can improve the definition, gathering, analysis and dissemination of essential information for evaluating the progress of an organization in its transition towards sustainability and to highlight weak points and suggest directions for improvement [59].
Companies that fail to understand the dynamics of the business environment and adapt to the changes will be overpassed by the ones that are able to identify risks and trends, and adjust their organizational culture and mentality. Large and arrogant companies are the most likely to fail as it is more complicated for them to adapt to the changes that occur in the business environment. Lack of accountability and ignoring signs of risk are the major factors that lead to failure. Some managers only react when performance is low and the crisis is inevitable and, in most situations, it is too late for recovery at this point. The price of these management errors will be then paid by investors and employees and this is another argument for timely sustainability performance assessment and rigorous and honest reporting [60].
In order to avoid being taken by surprise by the changes of a dynamic business environment, managers need to know what type of information to require and who are the others that need to possess this knowledge. Therefore, the structures for collecting, analyzing and interpreting information should follow the same principles and be prepared to provide not only the information required by the management.
Decision making requires constant access to information, thus communication in the chain of command should be fluid and in both directions in order to prevent staggering, as any stumble in the information flow may cause total or partial closure of the system. A system that is able to sustain itself at risk needs to show openness to novelty, unconventional ideas and information besides focusing on tradition and innovation. A business intelligence tool that provides information regarding strengths and opportunities, but also threats and weaknesses enables management to assess risks and make informed decisions.
The popularity of business intelligence (BI) has been continuously growing in the past years due to analytical functionalities, user-friendly interfaces and easier access. From the analytical software from the 1970s, to the spreadsheets of the 1980s, to the management information systems of the 1990s, these tools have been increasingly used by managers as they ease the decision making process by offering access to relevant internal and external information [61].
According to Petrini and Pozzebon [62], from the managerial perspective, BI is considered to be a process of collecting internal and external data and analyzing and interpreting it in such a way that it can be used in the decision making process, thus having the role of creating an informational environment that can reveal ‘‘strategic” business dimensions. From the technical perspective, BI is considered to be a set of instruments that allow gathering data from outside and inside the organization and manipulating, analyzing and processing it into information relevant for the decision makers. Data mining, data warehousing and web mining technologies are considered challenging to integrate into a single business intelligence platform, by authors like Hackathorn [63] and Almozayen et al. [64].
Considering the technical and managerial perspectives of Business Intelligence, there can be observed differences and similarities. Both perspectives agree that BI has the purpose of supporting decision makers through collection, analysis, interpretation and processing of data. BI is mainly used for strategic decisions that are expected to have medium and long term impact on the organization [62,65].
3. Model of the Sustainable Organization
Many large companies have significantly changed their business models to incorporate social and environmental aspects of performance. Multiple innovative approaches to greening the business model may have positive effects to delivering sustainability, but there is not a unifying standard for sustainable business model innovation [35]. Corporate sustainability reporting is made mainly according to the triple bottom line concept [27], the UN Global Compact [40,42], the ISO14001 environmental management system standard [66] and the Global Reporting Initiative [67].
Bocken et al. [35] argue that despite the existence of a vast literature on how business model innovation can be efficient in delivering sustainability [68] and having examples of success stories of several companies [69,70], there is no comprehensive view of how companies should approach sustainability and there is a limited understanding of the options available for innovation for sustainability.
Using models to describe sustainability is related to a field of research called sustainometrics [71]. Todorov and Marinova [72] categorize sustainability models as quantitative models, conceptual models, physical models, standardizing models and pictorial visualization models. The requirements for a model to be considered scientific, according to [73] are respected by each of the categories and include criteria such as providing a simplified representation of reality, allowing the possibility of measurement, being fictive representations of the reality, allowing the explanation of the reality or representing what is considered to be essential to the reality.
As presented above, the literature shows a wide range of approaches to defining a sustainable organization [27,35], and to measure its progress [41,43,47]. The multitude of indicators [44], models [68,69] and reporting arguments might be confusing for decision makers who need to assess the progress of their organization in terms of sustainable development. Thus, we proposed a generic model of the sustainable organization that serves as a baseline for developing the Global Sustainability Index (GSI). This model and the GSI allowed the development of the mathematic algorithm that underlies the software application that we present in this paper. This model does not claim to become a reference or a standard for reporting sustainability progress and it was developed based on the literature, aiming to be as flexible to allow the software application to be adapted to specific tracking of progress.
One of the four main purposes for sustainability assessment, identified by Mori and Christodoulou, is decision making and management [44]. We aim to meet the needs of decision makers who want to self-assess the sustainability of their organization using a quantitative output that can be generated out of their sustainability reports by aggregating various indicators. The model presented in Figure 1 respects the viewpoint that a sustainable organization includes sustainability in each decision [28,29,30,31], therefore, we proposed a triple approach: internal, external and operational. Each approach includes a set of indicators, according to the literature. There might be indicators that do not apply to some business sectors and must be excluded from the model, while there might be business sectors that require adding other indicators to the model. The purpose of this work is to build a flexible and adaptable software tool to simplify the sustainability reporting process, regardless of the industry. The model is explained in detail in [60].
4. Methodology
4.1. BI and Information Planning Methods to Integrate Sustainability
The proposed on-line instrument for sustainability performance assessment respects the BI purposes and functionalities and it has been developed following the stages presented in Figure 2.
The development process started by reading the annual sustainability and economic reports made public by companies from various industries, sizes and geographic locations (a). Five companies were selected as targets for our study based on the amount of data extracted from their reports. In order to show the versatility of the instrument, there were selected multi-national companies from four different industries, with employees ranging from 46,000 to 400,100. The process continues by implementing a graphic interface in order to store easily the data into a database (b), (c). For the moment, the data is entered manually, but future development of the instrument will consider the automatic entry based on different file formats (Excel, XBRL, XML, JSON, etc.). The proposed mathematical model was implemented and tested in order to provide results (d). The output of the software application is valuable knowledge that offers details about the company’s evolution from a global sustainability perspective and provides recommendations for increasing sustainability performance in certain areas.
In order to be able to apply strategies to become sustainable, organizations need a report to measure and analyze their current status and see what they need to improve. This application helps companies know more about their current status and, more than that, will tell them what to improve in order to be sustainable, providing an efficient reporting system.
4.2. Mathematical Model for Integrating Sustainability Indicators
4.2.1. A Combinative Algorithm for a Multi-Criteria Decision Support System
The proposed software application aims to help managers and decision makers to effortlessly integrate heterogenous sustainability indicators into a single global index that shows the sustainability progress of the organization using a numeric format. Flexibility implies allowing users to add or delete indicators and also to change the weights of each indicator for the final results, based on their needs. Therefore, we propose an algorithm specific for decision support systems. The Sustainability Decision Support System (SDSS) is a tool that helps decision makers choose the best decision alternative out of several possible scenarios, based on a set of custom decision criteria. The mathematical algorithm that underlies the SDSS combines the advanced multi-criteria analysis based on the FRISCO formula with the hierarchical-analytical process [33].
The SDSS is customizable to the needs of the decision maker and allows the user to define an unlimited number of own decision alternatives and selection criteria. Table 1 lists those selection criteria used as an example to demonstrate the functionality of the system:
The user of the SDSS has the possibility to name the decision criteria and then to compare each criterion against all the others. The system will generate a matrix by attributing scores of 1, 0.5 or 0 if the criterion is more important, equally important or less important than the one that it is compared with [60]:
Depending on relation between criterion 1 (C1 in Equations (1) and (2)) and criterion 2 (C2 in Equations (1) and (2)) that shows the importance of each criterion relative to the other, the score functions score1 and score2 could be 0, 1 or 0.5. The score functions are complementary.
The SDSS simplifies the cross-comparison of criteria and auto completes the matrix by applying simple logic. If criterion 1 is more important than criterion 2, this implies that criterion 2 is less important than criterion 1. Table 2 shows the relationship matrix that has been generated after comparing the criteria [60].
In order to rank the criteria and assign a weight factor ) for each criterion, FRISCO formula was used because it is recognized worldwide as the best and most used for this type of analysis [74].
where:
- p or score—is the sum of points (per line) marked by the item being analyzed;
- Δp—represents the difference between the score of the item being analyzed and the score of the last level element; if the element considered is the element on the last level, Δp will be 0;
- m—is the number of outdated criteria (in terms of score) due to the criterion considered;
- Ncrt—is the number of criteria considered;
- Δp’—represents the difference between the score of the criterion considered and the score of the first criterion (resulting in a negative value); if considered criterion is on the first position on the first level then the result will be 0.
4.2.2. Normalizing the Indicators for Integration
To aggregate a significant number of sustainability indicators and reduce them to the Global Sustainability Index, they should first be normalized or, in other words, have the same unit of measure. The literature presents different approaches to integrate these indicators, but in order to create an application for this activity, the mathematical algorithm should be simplified to increase the operating speed of the application [60].
Krajnc and Glavič [75] suggest that the indicators be grouped primarily according to the three dimensions of sustainability: environmental, economic and social, and then analyzed based on their impact. There are indicators that have a positive impact on sustainability objectives when their values increase, and of course, there are indicators that have a negative impact when their values increase. These indicator assessments are essential for their integration into the Global Sustainability Index [76], but the main issue of aggregating these indicators is that they can be expressed in different units. Normalization, or bringing them to a common unity, is obligatory.
The normalization process has been discussed in the literature and various methods have been proposed. One method is to divide each indicator into its mean value over time (Equations (4) and (5)) [60].
where is the normalized indicator with positive impact over a period considered (year) and is the normalized negative impact indicator for the same period (year).
Another method of normalizing the indicators is expressed in the Equations (6) and (7) [60]:
where is the value of the positive impact indicator for the current year, represents the minimum value of the positive impact indicator for the period considered, and represents the maximum value of the period considered. This time period can be, for example, five years or more as new data is added.
The normalization of the current value is obtained by linear interpolation having as reference the minimum normalized to 0 and the maximum normalized to 1. The final formula is obtained by applying the Thales theorem, as described in Figure 3.
where ADE ABC ≥ = ≥ = so, we get the formula (4).
where is the value of the negative impact indicator for the current year, represents the minimum value of the negative impact indicator for the period considered, and represents the maximum value of the period considered.
The normalization of the current value is obtained by linear interpolation having, as reference, the minimum normalized to 1 and the maximum normalized to 0. The final formula is obtained by applying the Thales theorem, as described in Figure 4.
where ADE ABC ≥ = ≥ = so, we get the formula (6).
The minimum and maximum values of the indicators were normalized to 0 and 1, for positive impact indicators, and to 1 and 0, for negative impact indicators. All the intermediary values will fall in the [0,1] interval.
4.2.3. Determining Weight of Indicators
To determine the weights of the indicators, it is required to determine first the importance of each indicator, relative to the other factors considered to assess the sustainability of the organization (Figure 1) [60], using the criterial analysis presented in Section 4.2.1. Then, the FRISCO method will be applied to determine the weights.
The FRISCO formula and weighting algorithm have been presented in Section 4.2.1. However, the values obtained after applying the FRISCO formula are greater than 1, so they must be converted into subunit values to be further allocated as weightings of the importance coefficients of each indicator. Transformation should be done using Equation (8):
where represents the weight for each indicator, represents the corresponding value for each indicator after applying the FRISCO formula and n represents the number of indicators that are considered for calculating the index. Given the formula for calculating , it is obvious that [60].
4.2.4. Determining Weight of Indicators’ Domains
To complete the Global Sustainability Index calculation process, one needs to know to what extent each domain will participate in a company’s sustainability score. For this, one must determine the weights of each field.
We can assume that each domain has the same importance in determining the sustainability of a company, in which case the Global Sustainability Index of the company will result from the arithmetic mean of all the indexes of each field.
A second option is to perform a critical analysis as we have done on each criterion within a domain. As we know from the model of the sustainable organization (Figure 1), there are three types of approaches regarding a sustainable company: operational, external and internal approach.
The operational approach comprises three areas of indicators, requiring a critical analysis to determine the relevance of each field. In this respect, FRISCO formula, described in Section 4.2.1, will be used to rank the indicators of each approach based on the importance given by the user of our software application. This feature increases the versatility of the instrument, allowing decision makers to drop indicators that do not apply to the specific type of business, but also to add other indicators that might be relevant to the business sector.
4.2.5. Calculation of the Global Sustainability Index (GSI)
All the indicators presented in the model of the sustainable organization (Figure 1) are aggregated (Figure 5), using Equations (9) and (10), into the Global Sustainability Index by combining the indexes calculated for each sub-category, as shown in the model: internal, external and operational index.
The instrument that we propose in this paper is extremely flexible and allows the decision maker to assign different weights for each of these indexes when calculating the GSI, as shown in the previous paragraphs. It is important to note that the indicators presented in this model are not exhaustive and that the tool allows the integration of an unlimited number of indicators, given that the user of the instrument classifies the indicator into one of these three approaches: internal, external or operational [60].
GSI is the Global Sustainability Index, are triple approach indexes (operational, external and internal), and represents the weight of each sub-index calculated by the adapted FRISCO method.
The model presented in Figure 1 shows that the index for the operational approach is calculated by aggregating the indicators that have been classified as economic, environmental and social indicators, specific to the operations of each organization. It is calculated using Equations (11) and (12).
is the operational approach index and represents the index for a group of indicators i (social, i = 1, environment, i = 2, economic, i = 3) and is the weight of each sub-index, calculated using the method described in Section 4.2.1.
4.3. The Proposed Approach
4.3.1. Our Approach for Calculating the Global Sustainability Index
The full process of calculating the Global Sustainability Index is presented in Figure 6 and explains all the needed steps to calculate the GSI. The algorithm shows that our tool is scalable to an unlimited number of indicators and that the user can customize the software to match the needs of his/her organization.
Legend:
- I—sustainability indicator;
- d—(1, m)—sustainability indicators domain;
- c—(1, n)—criterion within a domain;
- W—weight;
- N—normalizing process;
- ||x||—normalized value;
- M—multiplication;
- SI—sustainability index;
- GSI—global sustainability index.
On the scheme, we marked with orange, blue, and green all the three stages in which the Global Sustainability Index calculation process has been divided.
In the first stage of the calculation process, the one marked with orange on the scheme, the weight of each criterion (total income, energy consumption, etc.) within a domain (economic, environment, etc.) is calculated using the FRISCO formula described in Section 4.2.1. Then, the values of the indicators as well as the values of the weights obtained with the FRISCO formula are normalized using the formulas described in Section 4.2.2 and Section 4.2.3. Having both the importance of the criterion and its normalized value, we generated a scalar product between them. The process continues with the repetition of these steps for each criterion and field.
Having calculated the scalar product between the weight and the value of the criterion, we can proceed with the second part of the modulation process on the blue scheme, where we add each result obtained previously, thus obtaining a sum for each domain. This sum is called the domain’s sustainability index. We will multiply this index by the share of the domain it belongs to. This may be equal for each domain or may vary, depending on the criterial analysis outlined in Section 4.2.5. We will obtain a scalar product again that we will use in the third stage. This process will be repeated for each field in order to be able to calculate the index of each.
In the last step, we will sum up all the indexes previously obtained from each domain, and the result will be called the Global Sustainability Index of the company.
4.3.2. Evolutionary Algorithm Approach
We developed this model based on the genetic algorithm because it can help companies to decide which indicators should be modified in order to obtain a better GSI.
The schema of the algorithm that we used in the application is presented in Figure 7 and it will be presented in the next paragraphs.
Initialize Population
In order to obtain better results and keep the bounds between the values of indicators, the initial population was not initialized with random values. We applied a formula that fills the candidates from the initial population with better values from the start of the algorithm.
The values for each candidate will be based on the impact of each indicator within a domain as follows:
- If the impact of the indicator is positive, we will use the following formula:(1-v) * random (0,1) + v, where v is the normalized value from company and random (0,1) is a random number between 0 and 1. The value generated based on this formula will be in range of [1, v];
- If the impact is negative, we will use the following formula:v * random (0,1), where v is the normalized value from company and random (0,1) is a random number between 0 and 1. The value generated based on this formula will be in range of [0, v].
In order to continue the algorithm, we need to multiply all the values that we obtained earlier by and the integer part of the result will be transformed in binary (see Table 3). The binary transformation will be performed on 8 bits and this is why the values are multiplied by .
If we want to increase the number of candidates form the population, the representation will become like in Table 4:
The first column of the matrix is used to store the year of the report.
Stop Condition
The stop condition is represented by the value given by the user through the graphic interface. This value represents the total number of generations used by the algorithm. If the value is reached, the program will stop and list the results.
Evaluation
The evaluation of each candidate from the population will be performed based on the arithmetic mean of the sustainability index of each of the six years that are described in the blue zone of Table 4. After calculating the mean of all candidates from the population, we sort by descending all the values.
Crossover
Selected candidates will be grouped by two and the recombination or crossover will be realized with some probability for each element from the candidate matrix. The crossover will use the two-point cutting process that is explained in Figure 8.
The condition to check the probability for crossover will be established by the formula: Random (0,1) > 1/BN, where random (0,1) represent a random floating-point number between 0 and 1 and BN represents the number of bits used, which, in our case, is 8. If this relation is evaluated to be true, the crossover will be realized; if not, the value of current element will not be changed.
Mutation
The mutation process will be applied to each element from all selected candidates as in the recombination phase. The mutation process that we used consists of complementing each bit from each element within an individual, with the same probability condition used for recombination. More precisely, if the condition is fulfilled, we will complement the current bit, otherwise, it will remain untouched.
For each element within a candidate, the probability condition for each of the 8 bits will be tested (Figure 9).
Final Evaluation
This stage evaluates the last generation of algorithm run. The best values for each year obtained by individuals according to the sustainability index are obtained and a higher individual is formed, whose values will be exposed in the report. Its binary values must be converted to real values to be relevant to companies.
The process of converting binary values into real values is made in several stages:
- Divide the converted binary value into an integer number by and obtain a value in the range [0,1];
- Calculate the percentage of increase or decrease between the normalized initial value and the new value obtained by the formula:Percent = (NewValue–NormalizedInitialValue)/NormalizedInitialValue;
- The real value is obtained using the initial values without normalization as follows:RealValue = InitialValue + InitialValue * Percent.
4.4. Software Application
4.4.1. Application Features
At this stage of the project, the application features are the following:
- Registering a company and logging-in;
- Adding data for economic, environment, social, external and workspace domains;
- Possibility to add or eliminate indicators, according to specific needs;
- Possibility to calculate the sustainability index;
- Showing and exporting the sustainability results;
- Optimizing the sustainability index;
- Viewing a top from sustainability point of view.
4.4.2. Graphic Interface
Being a web application, the graphical interface has been developed to meet the needs of any user. Figure 10 shows some of the forms that will be used by users, namely the registering stage (a) and the data input stage (b). The application contains five of these forms for adding data. This process does not require high digital skills from the user. The other functionalities of the application, specific for different types of users are described in Appendix A.
The aim of this work is to offer decision makers an easy to use instrument to assess sustainability performance by calculating generally accepted or custom indexes to evaluate specific issues. The Global Sustainability Index was developed based on a generic model for the sustainable organization, giving the software application the flexibility to be adapted into any sustainability indicator. According to the literature [47], one of the four reasons for measuring and reporting sustainability progress is decision making and management, and, as shown in [44], for certain areas or industries, custom reports are required. Therefore, an important feature of the tool is allowing the user to add or omit indicators, according to the particularities of the company or the purpose of the reporting process. This feature is illustrated in Figure 10b.
4.5. Dataset
After reviewing the literature and analyzing multiple sustainability and economic annual reports, we selected five companies to generate the results presented in paragraph 5 of this paper. All the selected reports are publicly available and can be provided by the authors upon request, therefore, are not included in this paper. Finding the same type of reported data for all the companies was a challenge, as there is not a standardized format for sustainability reports, but, as explained, the software application allows adding or omitting indicators to calculate the specific GSI of each company.
Table 5 shows general characteristics of the five companies that were analyzed. As shown by the industry, number of employees, revenue, areas served and locations of their production and distribution facilities, according to the data presented in their annual sustainability reports, we have chosen these companies to demonstrate the versatility of the software application, regardless of the industry, size or location. The data are publicly available, and we used the sustainability reports generated annually by each of the companies, to calculate the Global Sustainability Index, in order to show that the proposed tool can provide an integrative numeric output to easily assess the sustainability of the organization and to allow a comprehensive track of progress.
5. Results
5.1. Standard Results Based on Data from Reports
Figure 11 shows the results obtained using the operational indicators presented in the model of the sustainable organization (Figure 1). The operational index is the most complex because it contains indicators from three big domains (economic, environmental and societal). As indicated in Figure 11, companies 1, 2 and 3 show a growth of operational sustainability over the five years, while company 4 has a relative constant performance. According to the sustainability reports of company 5, its evolution showed a negative trend.
The score generated by the company’s relationship with its external community is presented in Figure 12. The indicators that were considered to calculate the external index are presented in the model of the sustainable organization (Figure 1).
The internal index is presented in Figure 13. It has been calculated by considering the indicators related to the workspace, as shown in Figure 1.
Figure 14 shows the inclusion of the three mentioned indices in a Global Sustainability Index.
As shown in the charts presented in Figure 11, Figure 12 and Figure 13, the sustainability indexes may vary between 0 and 100%, as they are calculated after normalizing every indicator considered when calculating the final result. The variations from one year to another can be explained by different values of the indicators that were analyzed. Figure 13 shows the least variation as the internal index considers indicators related to the workplace and the premises of the organization, and may include indicators related to water and energy efficiency, accessibility for disabled, ergonomics, dining services, etc. These are indicators that have typically a small or sometimes no variation from one year to another.
5.2. Optimized Results Using Genetic Algorithm
Figure 15, Figure 16, Figure 17 and Figure 18 present the optimized results using our genetic algorithm approach. The same steps have been taken in order to obtain a Global Sustainability Index.
The values obtained after applying the genetic algorithm show predictive sustainability performance of the organization. The input data was taken from reports published up to the year 2016, and the application generated predictions for the following six years based on statistical data and the evolutionary algorithm presented in Section 4.3.2.
6. Discussion
6.1. Interpretation of Results
The results show that the software application proposed in this paper can generate a numeric value by aggregating different indicators that companies usually present in their annual sustainability reports. Considering the challenges related to measuring and reporting sustainability progress, [40,41,42,43,44], we aimed to offer decision makers and managers an instrument that can assist them in this endeavor. The data used for generating the results presented in Section 5 were manually extracted from public sustainability reports. Since there is not a standard for sustainability reporting [40], there is a wide variety of reports [41], both in terms of format and content, and, therefore, the data input process was not automatized. We decided to present the results from five different companies, two of them from the automotive industry, and the others from fashion, electronics, and courier domain, in order to demonstrate the potential of the application to show an integrative view, regardless of the industry, size and geographic location of the company.
The results cannot be interpreted in a global way and must be interpreted separately, for each company, yearly. The results generated from standard data, presented in Section 5.1, illustrate the evolution of each company from one year to another. The behavior of the analyzed companies over a period of five years can be observed in Figure 11, Figure 12 and Figure 13. Figure 14 shows the variation of the Global Sustainability Index—the composite indicator that includes all the indicators reported by the company. The scores are relevant only when a company is compared against itself, as the GSI aims to illustrate the progress of the organization in time. As seen in Figure 14, company 1 shows relative constant results over time, or little variation, while companies 2, 3 and 4 show positive evolutionary trends, demonstrating progress in implementing sustainable practices. Company 5 has a sinusoidal variation with a slightly negative trend. The managers might have explanations for these variations, that can be translated into expanding on new markets, increasing production or greening the supply chain.
Having calculated the Global Sustainability Index for different companies that choose different indicators to include in their annual sustainability reports, we demonstrated the versatility of the instrument that can be adapted to any context, by adding or subtracting indicators, thus, the user of the software application can choose the perspective to focus on, according to the reasons of the sustainability performance assessment. Parris and Kates [47] identify four major reasons why sustainability performance is evaluated: building participation and consensus, research, advocacy, and management and decision making.
We tried to optimize the GSI, and Figure 15, Figure 16 and Figure 17 show that our genetic algorithm managed to find improvable indicators that could bring better sustainability indexes for the companies. We can observe a high increase of the indexes for all companies, which means that the managers now know the potential of their organization to improve its sustainability performance and which are the indicators that need to be addressed in order to achieve the desired outcomes.
6.2. Implications for Practice
The software application can help organizations to calculate their sustainability index and this may help them to focus more on sustainable development. The application not only helps to calculate the Global Sustainability Index, but also offers the calculation of the sub-indexes that can be customized to highlight perspectives chosen by the user. Viewpoints defined by composite indicators such as Human Development Index (HDI), Environmental Vulnerability Index (EVI), Ecological Footprint (EF), Environmental Sustainability Index (ESI), Welfare Index, Genuine Progress Indicator (GPI), Index of Sustainable Economic Welfare, Environmental Policy Index (EPI), and more, can be highlighted by adapting the proposed software application.
The application could be useful for banks. In order to provide a credit to a company, a bank needs some economic data about the company, data that could be found in the reports generated by our application; also, the bank can see how sustainable the company is and based on this factor, can decide if the credit is approved or not. Companies can see the results of the market competitors in a top generated by the application, based on public sustainability reports, and, thus, they can decide where they have to concentrate the investments in order to keep a good position on the market from a sustainable point of view, or they can decide with whom to collaborate in order to reduce some costs and become more sustainable while helping each other.
The mathematic algorithm that allows a variable number of indicators, and the approach of calculating sub-indexes by normalizing and aggregating clusters of indicators, assures the versatility of our instrument, which can be adapted to performance assessment in areas that are not necessarily related to sustainability. The users can introduce new indicators and calculate their own custom index without being influenced by the indicators proposed by us in the generic model illustrated in Figure 1.
6.3. Limitations and Future Research Directions
Some of the limits of our approach are related to the fact that we started this research by studying different sustainability reports of companies from different industries in order to see if we can find relevant data for our algorithm. Therefore, one limit of this study is that we did not test the application on multiple companies from a single domain of activity in order to perform a benchmarking analysis. Since we did not define a set of rules for the rising or dropping values on the genetic algorithm, we aim to equip this algorithm with a set of rules from experts in the field to limit sudden increases of some parameters.
The predicted values did not consider unexpected scenarios, such as the global crisis caused by COVID-19. For the calculation of the GSI, and especially for the workplace index, binary indicators have been used. For example, if the company has accessibility for people with disabilities, the indicator has the value 1, and if it does not have accessibility, the value of the indicator will be 0. Therefore, the values of the GSI could be more accurate if the binary indicators are transformed into continuous ones. The algorithm offers the user the possibility to define each indicator, but this will increase the time and difficulty to input the data.
7. Conclusions
Sustainability performance assessment is a challenge for many companies, as various sustainability indicators have different measurement units and there is not a standardized reporting framework. The proposed tool, based on a mathematic algorithm that combines several sustainability indicators, can be a valuable instrument for organizations that need to evaluate their sustainability performance. The software solution described in this paper simplifies the sustainability reporting process and allows decision makers to use the presented mathematical algorithm, without being required to calculate or even understand the mathematical grounds of generating a global index to highlight the progress of the organization regarding its sustainability objectives.
An optimal solution is very rare in the transition towards the sustainable organization and compromises are required most frequently between environmental, economic and social aspects on the one hand, and the expectations of the stakeholders on the other hand [77]. The proposed tool helps users to cope with these challenges and also takes into consideration that information is not always available and precise. Another feature offered by the tool is that besides simplifying sustainability performance assessment, it highlights low performance indicators and offers suggestions for improvement. The implementation of the sustainability performance assessment tool should be incremental and should follow a continuous improvement approach for each of the three dimensions of sustainability.
According to Merad et al. [77], sustainability performance assessment through a set of performance indicators is difficult and it implies a double challenge. First, the heterogeneity of the indicators that represent different entities (physical, economical, subjective, etc.), such as weight, size, price, color, etc., and whether it may be quantitative or not. This implies a difficulty to quantify or measure the indicators. The second challenge is that some of the indicators that are measured and reported might be conflicting or interacting in some way and it is difficult for decision makers to aggregate them to reach an overall perspective.
In this current phase of this project, we managed to extract data from the sustainability reports and calculate the GSI for five companies. We also applied a genetic algorithm containing the same data and we observed the evolution of the GSI in time.
For the future development of the instrument, we have, in plan, to introduce the following features:
- Correlate the values of the indicators during the implementation of the genetic algorithm;
- Release of green certificates based on the GSI of the company;
- Build a graph with different future trends for each indicator;
- Mapping sustainability with different colors so that one can see if the current or potential business partners of the analyzed company are sustainable and how doing business with them would affect the company’s sustainability index;
- Improve the granulation on certain indicators;
- Include the possibility to simulate the future GSI if different hazards occur;
- Collect data for the period 2017–2022 and make a comparison between the (optimal) values predicted by the implemented genetic algorithm and the sustainability index, obtained by applying the calculation model of sustainability on concrete data reported by companies in order to notice how far from an ideal optimal sustainability index companies are;
- Automatic loading data from different file formats like Excel, Json, XML, XBRL, etc.
Author Contributions
All authors contributed equally to the research presented in this paper and to the preparation of the final manuscript. All authors have read and agreed to the published version of the manuscript.
Funding
This research was funded by “Lucian Blaga University of Sibiu, research grants”—grant number LBUS-2018-04.
Acknowledgments
This work was partially developed under the ERASMUS+ KA2 project “The FOF-Designer: Digital Design Skills for Factories of the Future”, financing contract no. 2018-2553/001-001, project number 601089-EPP-1-2018-1-RO-EPPKA2-KA, web: https://www.digifof.eu/.
Conflicts of Interest
The authors declare no conflict of interest.
Appendix A
Use case description
Figure A1.
Application use case diagram.

In the case of the application case, we define the following actors:
1. Guest
This user role can be assigned to a company delegate or a simple citizen who wants to find out how this platform is used, without being registered. With this role, one can view details about the application by visiting Home, About Us, New Features, Security, Help, Privacy Policy, Recent Questions, and can opt for the registration process. It is also possible to contact the administrator to provide feedback, questions, or anything else that cannot be answered within the existing pages.
2. Company Management
The decision maker is the user who has completed the registration process, now having full access to the application’s features such as:
- ¯
- View the details of the application in the same way as the visitor;
- ¯
- Log in with a company unique code that has been registered and a password for this process;
- ¯
- View or modify the profile, i.e., the data entered in the registration process can be changed if there are any ongoing changes. The password can also be changed for security;
- ¯
- Data may be input for sustainability calculations; this process is divided into five steps across the indicator ranges presented in the previous chapters. The company has a standard set of data to be entered but additional indicators can be added if the company decides that the standard is not enough;
- ¯
- Can contact the administrator to send feedback, ask questions or request customized features;
- ¯
- Can view the Global Sustainability Index, calculated with the data he/she entered, and the spreadsheet will produce results of the normalizations described in Section 2.3 and will provide a report that can be viewed and exported;
- ¯
- Sustainability calculations can be made by opting for a Genetic Calculator that will deliver results for which the company should aim for during the next six years, providing a report for that purpose which can be viewed and exported.
3. Administrator
Administrator is a special account type because it has access to the database and can modify information within the database. The functionalities available for this account are:
- ¯
- Can log in to application;
- ¯
- View or change a profile in the company;
- ¯
- Receives emails from visitors and companies;
- ¯
- Manages the database by deleting or modifying data in the database based on requests from companies.
References
- Chen, D.; Thiede, S.; Schudeleit, T.; Herrmann, C. A holistic and rapid sustainability assessment tool for manufacturing SMEs. CIRP Ann. 2014, 63, 437–440. [Google Scholar] [CrossRef]
- Singh, R.K.; Murty, H.R.; Gupta, S.K.; Dikshit, A.K. An overview of sustainability assessment methodologies. Ecol. Indic. 2009, 9, 189–212. [Google Scholar] [CrossRef]
- Lee, K. Corporate Sustainability and the Value of Corporations; Pakyoungsa: Seoul, Kerea, 2005. [Google Scholar]
- Donald, S.S. Green Management Matters Only if it Yieds More Green: An Economic/Strategic Perspective. Acad. Manag. Perspect. 2009, 23, 5–16. [Google Scholar] [CrossRef] [Green Version]
- Rowley, H.V.; Peters, G.M.; Lundie, S.; Moore, S.J. Aggregating sustainability indicators: Beyond the weighted sum. J. Environ. Manag. 2012, 111, 24–33. [Google Scholar] [CrossRef]
- United Nations, Indicators for Sustainable Development. 2007. Available online: www.un.org/esa/sustdev/natlinfo/indicators/guidelines.pdf (accessed on 17 February 2020).
- Chaudhary, A.; Gustafson, D.; Mathys, A. Multi-indicator sustainability assessment of global food systems. Nat. Commun. 2018, 9, 848. [Google Scholar] [CrossRef] [Green Version]
- Grecu, V. The global sustainability index: An instrument for assessing the progress towards the sustainable organization. ACTA Univ. Cibiniensis 2015, 67, 215–220. [Google Scholar] [CrossRef] [Green Version]
- Søndergaard, G.L.; Binning, P.J.; Bondgaard, M.; Bjerg, P.L. Multi-criteria assessment tool for sustainability appraisal of remediation alternatives for a contaminated site. J Soils Sediments 2018, 18, 3334–3348. [Google Scholar] [CrossRef] [Green Version]
- World Business Council for Sustainable Development. Signals of Change: Business Progress toward Sustainable Development; World Business Council for Sustainable Development: Geneva, Switzerland, 1997. [Google Scholar]
- GRI. The Global Reporting Initiative—An Overview; Global Reporting Initiative: Boston, MA, USA, 2002; Available online: https://www.globalreporting.org/Pages/default.aspx (accessed on 20 December 2012).
- GRI. Sustainability Reporting Guidelines 2002 on Economic and Social Performance; Global Reporting Initiative: Boston, MA, USA, 2002; Available online: https://www.aeca.es/old/comisiones/rsc/documentos_fundamentales_rsc/gri/guidelines/gri_guidelines_2002.pdf (accessed on 7 September 2015).
- OECD. Organisation for Economic Co-Operation and Development. An Update of the OECD Composite Leading Indicators. Short-Term Economic Statistics Division, Statistics Directorate/OECD. 2002. Available online: http://www.oecd.org/sdd/leading-indicators/2410332.pdf (accessed on 12 March 2020).
- OECD. OECD Guidelines for Multinational Enterprises; Annual Report; 2002; Available online: https://www.oecd.org/daf/inv/mne/15941397.pdf (accessed on 27 April 2016).
- Joung, C.B.; Carrell, J.; Sarkar, P.; Feng, S.C. Categorization of indicators for sustainable manufacturing. Ecol. Indic. 2013, 24, 148–157. [Google Scholar] [CrossRef]
- Fan, C.; Carrell, J.D.; Zhang, H.-C. An investigation of indicators for measuring sustainable manufacturing. In Proceedings of the 2010 IEEE International Symposium on Sustainable Systems and Technology, Arlington, VA, USA, 17–19 May 2010; pp. 1–5. [Google Scholar] [CrossRef]
- Lu, T.; Gupta, A.; Jayal, A.D.; Badurdeen, F.; Feng, S.C.; Dillon, O.W., Jr.; Jawahir, I.S. A Framework of Product and Process Metrics for Sustainable Manufacturing. In Advances in Sustainable Manufacturing; Seliger, G., Khraisheh, M.M.K., Jawahir, I.S., Eds.; Springer: Berlin/Heidelberg, Germany, 2001; pp. 333–338. [Google Scholar] [CrossRef]
- Herrmann, C.; Thiede, S.; Kara, S.; Hesselbach, J. Energy oriented simulation of manufacturing systems–Concept and application. CIRP Ann. 2011, 60, 45–48. [Google Scholar] [CrossRef]
- Millward-Hopkins, J.; Busch, J.; Purnell, P.; Zwirner, O.; Velis, C.A.; Brown, A.; Hahladakis, J.; Iacovidou, E. Fully integrated modelling for sustainability assessment of resource recovery from waste. Sci. Total Environ. 2018, 612, 613–624. [Google Scholar] [CrossRef]
- Smith, L.; Ball, P. Steps towards sustainable manufacturing through modelling material, energy and waste flows. Int. J. Prod. Econ. 2012, 140, 227–238. [Google Scholar] [CrossRef] [Green Version]
- França, C.L.; Broman, G.; Robert, K.-H.; Basile, G.; Trygg, L. An approach to business model innovation and design for strategic sustainable development. J. Clean. Prod. 2017, 140, 155–166. [Google Scholar] [CrossRef]
- Birkin, F.; Polesie, T.; Lewis, L. A new business model for sustainable development: An exploratory study using the theory of constraints in Nordic organizations. Bus. Strategy Environ. 2009, 18, 277–290. [Google Scholar] [CrossRef]
- Silvestre, B.S.; Ţîrcă, D.M. Innovations for sustainable development: Moving toward a sustainable future. J. Clean. Prod. 2019, 208, 325–332. [Google Scholar] [CrossRef]
- Federal Office for Spatial Development ARE. 1987: Brundtland Report. Available online: https://www.are.admin.ch/are/en/home/nachhaltige-entwicklung/internationale-zusammenarbeit/agenda-2030-fuer-nachhaltige-entwicklung/uno-_-meilensteine-zur-nachhaltigen-entwicklung/1987--brundtland-bericht.html (accessed on 14 April 2020).
- Dogaru, V.; Brandas, C.; Cristescu, M. An Urban System Optimization Model Based on CO2 Sequestration Index: A Big Data Analytics Approach. Sustainability 2019, 11, 4821. [Google Scholar] [CrossRef] [Green Version]
- Cioca, L.-I.; Ivascu, L.; Turi, A.; Artene, A.; Găman, G.A. Sustainable Development Model for the Automotive Industry. Sustainability 2019, 11, 6447. [Google Scholar] [CrossRef] [Green Version]
- Hasan, M.M.; Nekmahmud, M.; Yajuan, L.; Patwary, M.A. Green business value chain: A systematic review. Sustain. Prod. Consum. 2019, 20, 326–339. [Google Scholar] [CrossRef]
- Bergquist, A.-K. Business and Sustainability: New Business History Perspectives; Harvard Business School General Management Unit Working Paper, No. 18-034; 2017; Available online: https://ssrn.com/abstract=3055587 (accessed on 3 February 2020). [CrossRef] [Green Version]
- Cooney, S. Build a Green Small Business: Profitable Ways to Become an Ecopreneur; McGraw-Hill: New York, NY, USA, 2009. [Google Scholar]
- Molenaar, J.; Kessler, J. The Business Benefits of Using Sustainability Standards: A Meta Review. Aidenvironment 2017. Available online: https://www.isealalliance.org/sites/default/files/resource/2019-05/Aidenvironment%20report%20business%20benefits%20of%20standards.pdf (accessed on 12 April 2020).
- Sarkis, J.; Koo, C.; Watson, R.T. Green information systems & technologies–this generation and beyond: Introduction to the special issue. Inf. Syst. Front. 2013, 15, 695–704. [Google Scholar]
- Hockerts, K. Corporate sustainability management, towards controlling corporate ecological and social sustainability. In Proceedings of the Greening of Industry Network Conference, Bangkok, Thailand, 21–25 January 2001; pp. 21–24. [Google Scholar]
- Rennie, E. Growing Green, Boosting the bottom line with sustainable business practices. APICS Mag. 2008, 18, 2–18. [Google Scholar]
- Keijzers, G. The transition to the sustainable enterprise. J. Clean. Prod. 2002, 10, 349–359. [Google Scholar] [CrossRef]
- Bocken, N.M.P.; Short, S.W.; Rana, P.; Evans, S. A literature and practice review to develop sustainable business model archetypes. J. Clean. Prod. 2014, 65, 42–56. [Google Scholar] [CrossRef] [Green Version]
- Baumgärtner, S.; Quaas, M. What is sustainability economics? Ecol. Econ. 2010, 69, 445–450. [Google Scholar] [CrossRef] [Green Version]
- Robinson, Z. Greening business: The ability to drive environmental and sustainability improvements in the workplace. Chapter 2009, 19, 130–136. [Google Scholar]
- Scorza, F.; Grecu, V. Assessing sustainability: Research directions and relevant issues. In Proceedings of the International Conference on Computational Science and Its Applications, Beijing, China, 4–7 July 2016; pp. 642–647. [Google Scholar]
- Griggs, D.J.; Smith, M.S.; Gaffney, O.; Rockström, J.; Öhman, M.C.; Shyamsundar, P.; Steffen, W.; Glaser, G.; Kanie, N.; Noble, I. Sustainable development goals for people and planet. Nature 2013, 495, 305–307. [Google Scholar] [CrossRef]
- Bebbington, J.; Unerman, J. Achieving the United Nations Sustainable Development Goals: An enabling role for accounting research. Account. Audit. Account. J. 2018, 31, 2–24. [Google Scholar] [CrossRef]
- Staszkiewicz, P. Search for Measure of the Value of Baltic Sustainability Development: A Meta-Review. Sustainability 2019, 11, 6640. [Google Scholar] [CrossRef] [Green Version]
- Leal Filho, W.; Azeiteiro, U.; Alves, F.; Pace, P.; Mifsud, M.; Brandli, L.; Caeiro, S.S.; Disterheft, A. Reinvigorating the sustainable development research agenda: The role of the sustainable development goals (SDG). Int. J. Sustain. Dev. World Ecol. 2018, 25, 131–142. [Google Scholar] [CrossRef] [Green Version]
- Kondyli, J. Measurement and evaluation of sustainable development: A composite indicator for the islands of the North Aegean region, Greece. Environ. Impact Assess. Rev. 2010, 30, 347–356. [Google Scholar] [CrossRef]
- Mori, K.; Christodoulou, A. Review of sustainability indices and indicators: Towards a new City Sustainability Index (CSI). Environ. Impact Assess. Rev. 2012, 32, 94–106. [Google Scholar] [CrossRef]
- Devuyst, D. Linking impact assessment and sustainable development at the local level: The introduction of sustainability assessment systems. Sustain. Dev. 2000, 8, 67–78. [Google Scholar] [CrossRef]
- Ness, B.; Urbel-Piirsalu, E.; Anderberg, S.; Olsson, L. Categorising tools for sustainability assessment. Ecol. Econ. 2007, 60, 498–508. [Google Scholar] [CrossRef]
- Parris, T.M.; Kates, R.W. Characterizing and Measuring Sustainable Development. Annu. Rev. Environ. Resour. 2003, 28, 559–586. [Google Scholar] [CrossRef]
- Meadows, D.H. Indicators and Information Systems for Sustainable Development; The Sustainability Institute: Hartland, VT, USA, 1998; Available online: https://www.racialequitytools.org/resourcefiles/IndicatorsInformationdmeadows.pdf (accessed on 11 July 2017).
- Veleva, V.; Ellenbecker, M. Indicators of sustainable production: Framework and methodology. J. Clean. Prod. 2001, 9, 519–549. [Google Scholar] [CrossRef]
- Hodge, T. Toward a conceptual framework for assessing progress toward sustainability. Soc. Indic. Res. 1997, 40, 5–98. [Google Scholar] [CrossRef]
- Atkisson, A.; Hatcher, R.L. The compass index of sustainability: Prototype for a comprehensive sustainability information system. J. Environ. Assess. Policy Manag. 2001, 3, 509–532. [Google Scholar] [CrossRef]
- Lee, Y.-J.; Huang, C.-M. Sustainability index for Taipei. Environ. Impact Assess. Rev. 2007, 27, 505–521. [Google Scholar] [CrossRef]
- Shi, C.; Hutchinson, S.; Xu, S. Evaluation of coastal zone sustainability: An integrated approach applied in Shanghai Municipality and Chong Ming Island. J. Environ. Manag. 2004, 71, 335–344. [Google Scholar] [CrossRef]
- Freudenberg, M. Composite Indicators of Country Performance: A Critical Assessment; OECD Science, Technology and Industry Working Papers; OECD Publishing: Paris, France, 2003. [Google Scholar] [CrossRef]
- Jacobs, R.; Smith, P.C.; Goddard, M.K. Measuring Performance: An Examination of Composite Performance Indicators: A Report for the Department of Health; Centre of Health Economics, University of York: York, UK, 2004; Available online: https://www.york.ac.uk/che/pdf/tp29.pdf (accessed on 21 October 2019).
- OECD. Handbook on Constructing Composite Indicators Methodologyand User Guide; OECD Publishing: Paris, France, 2008; Available online: https://www.oecd.org/sdd/42495745.pdf (accessed on 11 January 2019).
- Saisana, M.; Tarantola, S. State-of-the-Art Report on Current Methodologies and Practices for Composite Indicator Development; Citeseer: Ispra, VA, Italy, 2002; Volume 214, Available online: https://op.europa.eu/en/publication-detail/-/publication/9253d939-b47b-4428-b792-619e6b6c8645 (accessed on 16 February 2019).
- Sürdü, F.B.; Çalışkan, A.Ö.; Esen, E. Human Resource Disclosures in Corporate Annual Reports of Insurance Companies: A Case of Developing Country. Sustainability 2020, 12, 3452. [Google Scholar] [CrossRef] [Green Version]
- Grecu, V.; Nate, S. Managing Sustainability with Eco-Business Intelligence Instruments. Manag. Sustain. Dev. 2014, 6, 25–30. [Google Scholar]
- Grecu, V. Managing Sustainability in Organizations with EcoBusiness-Intelligence; LAP-LAMBERT Academic Publishing: Saarbrücken, Germany, 2015. [Google Scholar]
- Rasmussen, N.H.; Goldy, P.S.; Solli, P.O. Financial Business Intelligence: Trends, Technology, Software Selection, and Implementation; John Wiley & Sons: New York, NY, USA, 2002. [Google Scholar]
- Petrini, M.; Pozzebon, M. Managing sustainability with the support of business intelligence: Integrating socio-environmental indicators and organisational context. J. Strateg. Inf. Syst. 2009, 18, 178–191. [Google Scholar] [CrossRef]
- Hackathorn, R.D. Web Farming for the Data Warehouse; Morgan Kaufmann Publishers Inc.: San Francisco, CA, USA, 1999. [Google Scholar]
- Almozayen, N.A.; Othman, M.K.B.; Gani, A.B.; Alharethi, S.Z. Data mining techniques: A systematic mapping review. In Proceedings of the International Conference of Reliable Information and Communication Technology, Johor Bahru, Malaysia, 23–24 April 2017; pp. 66–77. [Google Scholar] [CrossRef]
- Steiss, A.W. Strategic Management for Public and Nonprofit Organizations; Routledge: Basel, Switzerland, 2019. [Google Scholar]
- Oliveira, J.A.; Oliveira, O.J.; Ometto, A.R.; Ferraudo, A.S.; Salgado, M.H. Environmental Management System ISO 14001 factors for promoting the adoption of Cleaner Production practices. J. Clean. Prod. 2016, 133, 1384–1394. [Google Scholar] [CrossRef] [Green Version]
- Sethi, S.P.; Rovenpor, J.L.; Demir, M. Enhancing the quality of reporting in corporate social responsibility guidance documents: The roles of ISO 26000, global reporting initiative and CSR-sustainability monitor. Bus. Soc. Rev. 2017, 122, 139–163. [Google Scholar] [CrossRef]
- Stubbs, W.; Cocklin, C. Conceptualizing a ‘sustainability business model’. Organ. Environ. 2008, 21, 103–127. [Google Scholar] [CrossRef]
- Schaltegger, S.; Lüdeke-Freund, F.; Hansen, E.G. Business cases for sustainability: The role of business model innovation for corporate sustainability. Int. J. Innov. Sustain. Dev. 2012, 6, 95–119. [Google Scholar] [CrossRef]
- Baines, T.S.; Lightfoot, H.W.; Evans, S.; Neely, A.; Greenough, R.; Peppard, J.; Roy, R.; Shehab, E.; Braganza, A.; Tiwari, A.; et al. State-of-the-art in product-service systems. Proc. Inst. Mech. Eng. Part B J. Eng. Manuf. 2007, 221, 1543–1552. [Google Scholar] [CrossRef] [Green Version]
- Todorov, V.; Marinova, D. Modelling sustainability. Math. Comput. Simul. 2011, 81, 1397–1408. [Google Scholar] [CrossRef] [Green Version]
- Todorov, V.; Marinova, D. Sustainometrics: Measuring sustainability. In Proceedings of the MODSIM 2009 International Congress on Modelling and Simulation, Cairns, Australia, 13–17 July 2009; pp. 1223–1229. [Google Scholar]
- Franck, R. The Explanatory Power of Models: Bridging the Gap between Empirical and Theoretical Research in the Social Sciences; Springer Science & Business Media: New York, NY, USA, 2013. [Google Scholar]
- Bonbacu, S. Using the multi-criteria analysis (mca) in the drafting of doctorate papers. Ann. Oradea Univ. Fascicle Manag. Technol. Eng. 2008, 7, 1933–1936. [Google Scholar]
- Krajnc, D.; Glavič, P. A model for integrated assessment of sustainable development. Resour. Conserv. Recycl. 2005, 43, 189–208. [Google Scholar] [CrossRef]
- Rada, E.C.; Zatelli, C.; Cioca, L.I.; Torretta, V. Selective Collection Quality Index for Municipal Solid Waste Management. Sustainability 2018, 10, 257. [Google Scholar] [CrossRef] [Green Version]
- Merad, M.; Dechy, N.; Serir, L.; Grabisch, M.; Marcel, F. Using a multi-criteria decision aid methodology to implement sustainable development principles within an organization. Eur. J. Oper. Res. 2013, 224, 603–613. [Google Scholar] [CrossRef] [Green Version]
Figure 1.
Model of the sustainable organization [60].
Figure 1.
Model of the sustainable organization [60].

Figure 2.
Development stages: (a) Data collecting; (b) Building graphic interface to save data; (c) Data saved into the database; (d) Algorithmic stage; (e) Knowledge extraction.
Figure 2.
Development stages: (a) Data collecting; (b) Building graphic interface to save data; (c) Data saved into the database; (d) Algorithmic stage; (e) Knowledge extraction.

Figure 3.
Thales Theorem for similar triangles (positive impact indicators).

Figure 4.
Thales Theorem for similar triangles (negative impact indicators).

Figure 5.
Aggregation of the external, internal and operational indexes into Global Sustainability Index [60].
Figure 5.
Aggregation of the external, internal and operational indexes into Global Sustainability Index [60].

Figure 6.
Full process of calculation of the Global Sustainability Index.

Figure 7.
Schema of genetic algorithm that is used in the application.

Figure 8.
Crossover with two-point cutting.

Figure 9.
Process of mutation.

Figure 10.
Forms: (a) Register form and (b) Add data form.

Figure 11.
Standard results for operational index.

Figure 12.
Standard results for external index.

Figure 13.
Standard results for internal index.

Figure 14.
Standard results for Global Sustainability Index.

Figure 15.
Optimized results for operational index.

Figure 16.
Optimized results for external index.

Figure 17.
Optimized results for internal index.

Figure 18.
Optimized results for Global Sustainability Index.


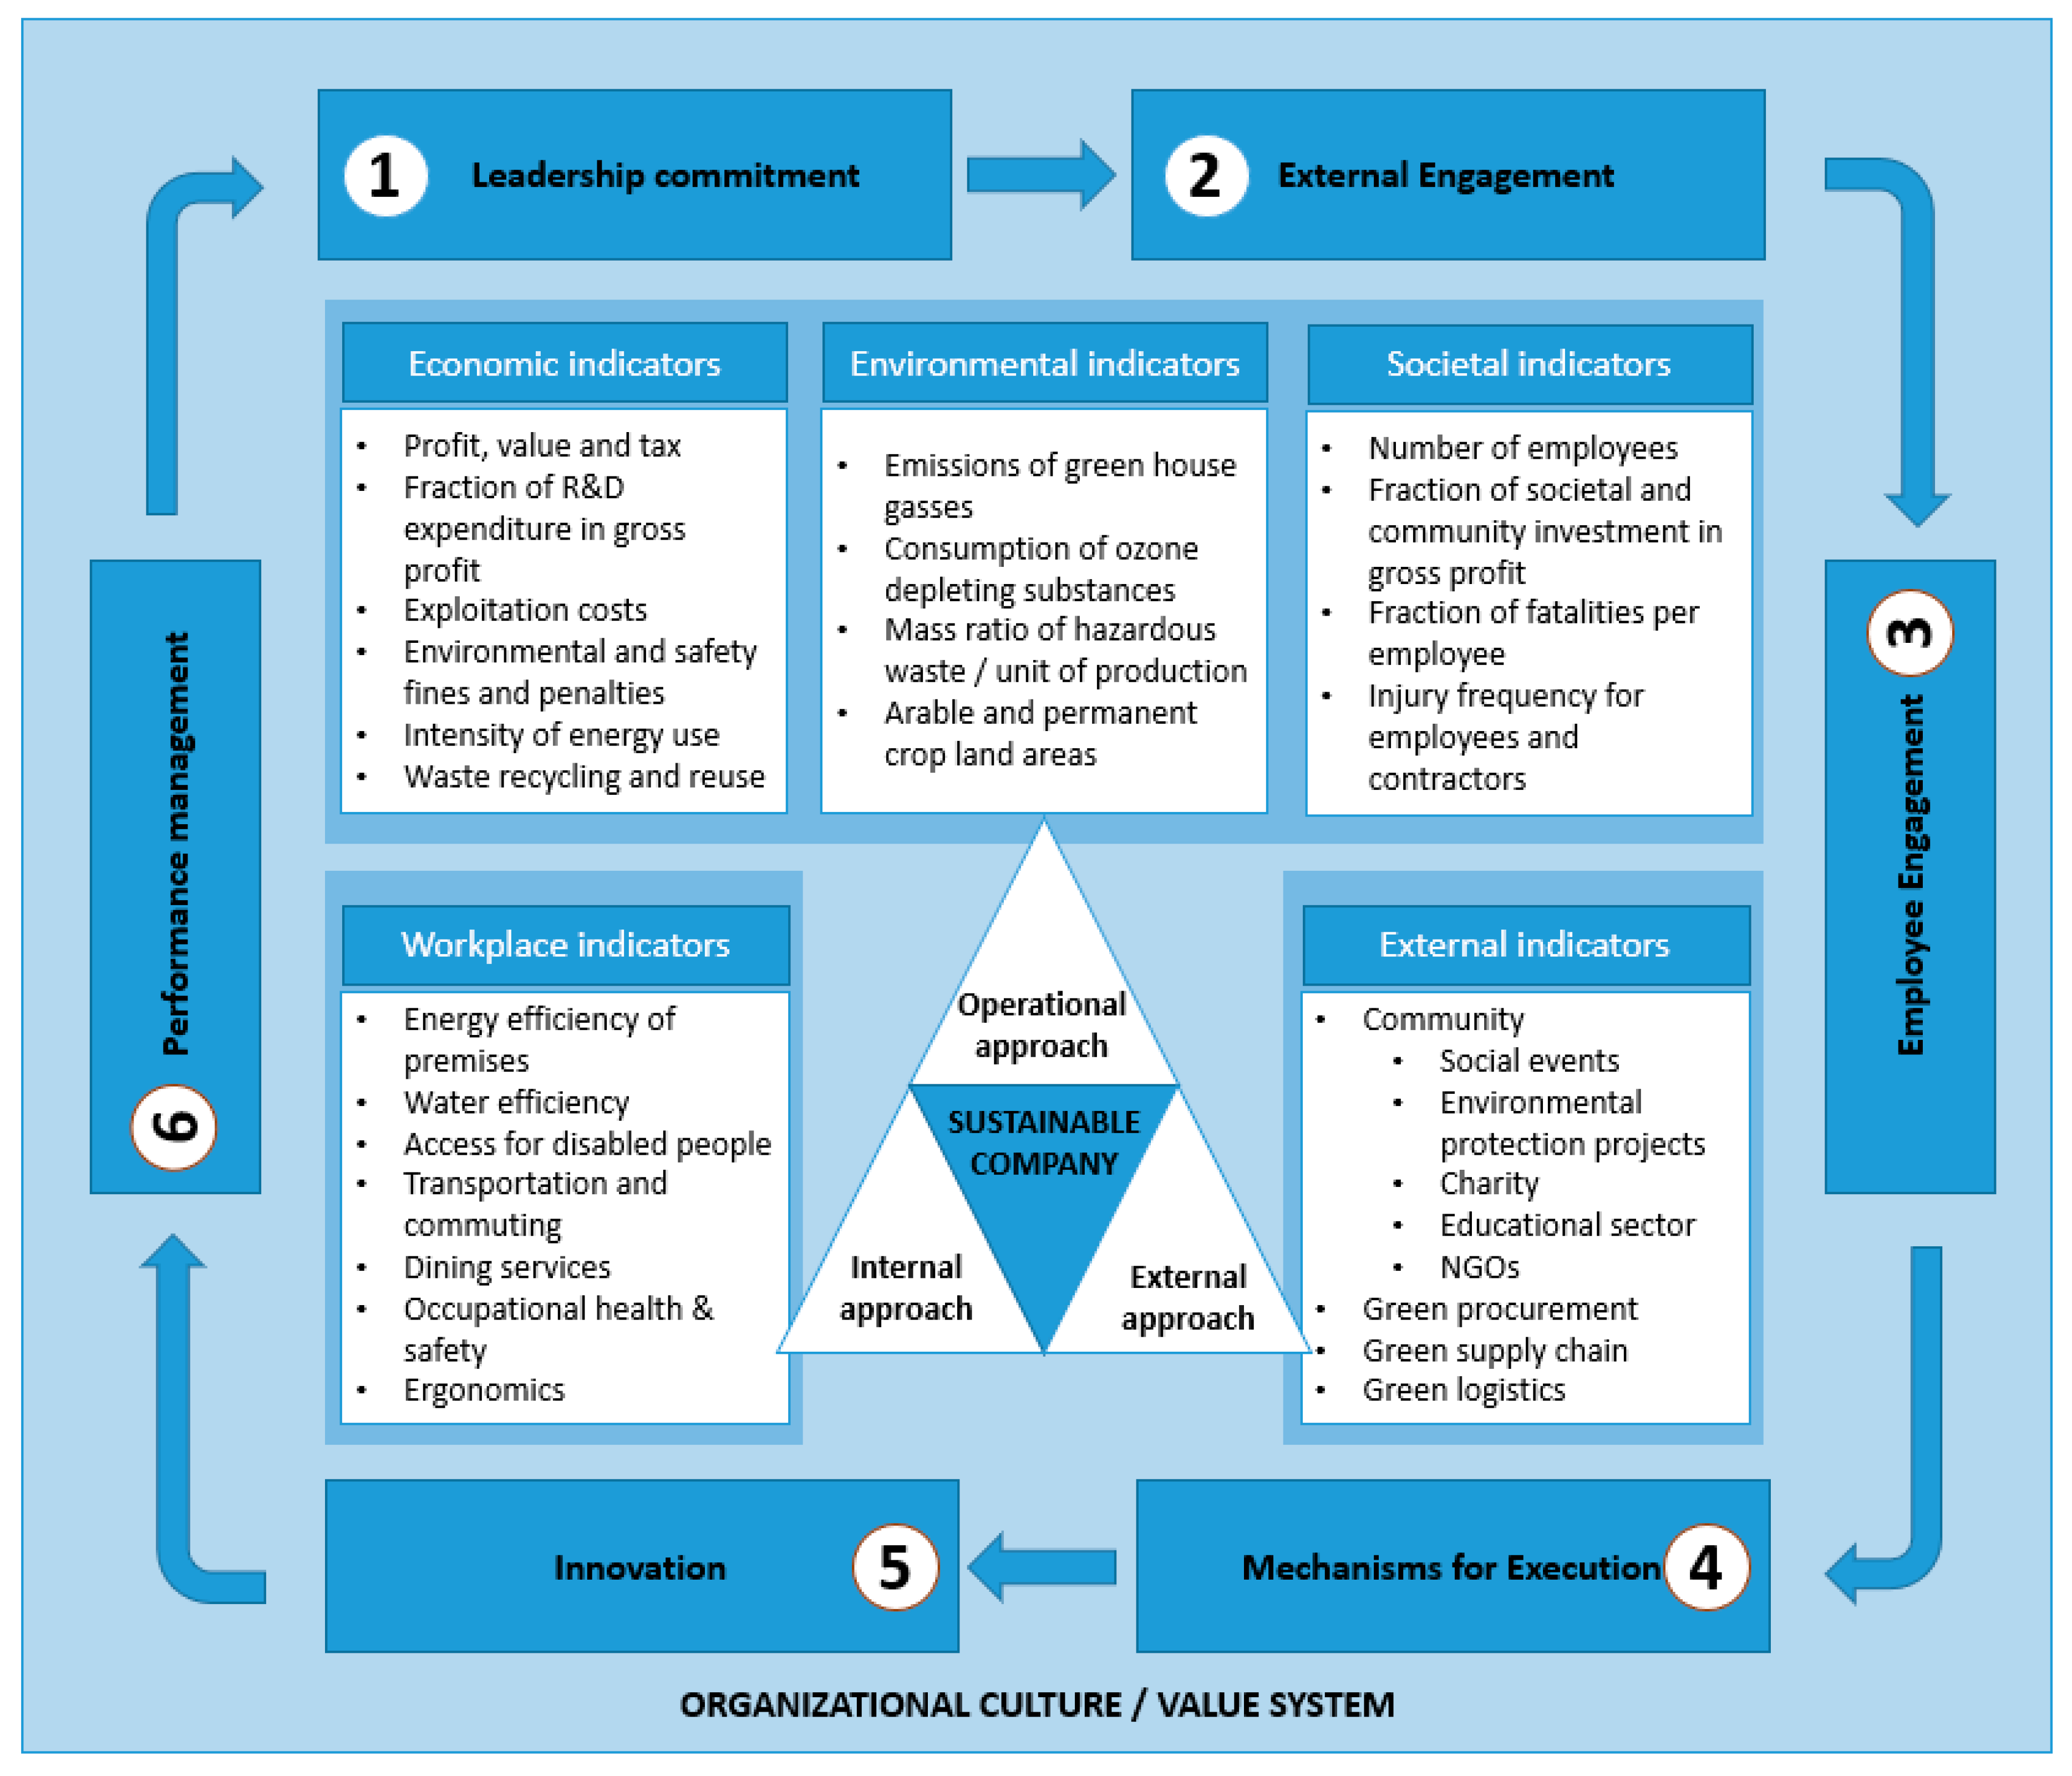
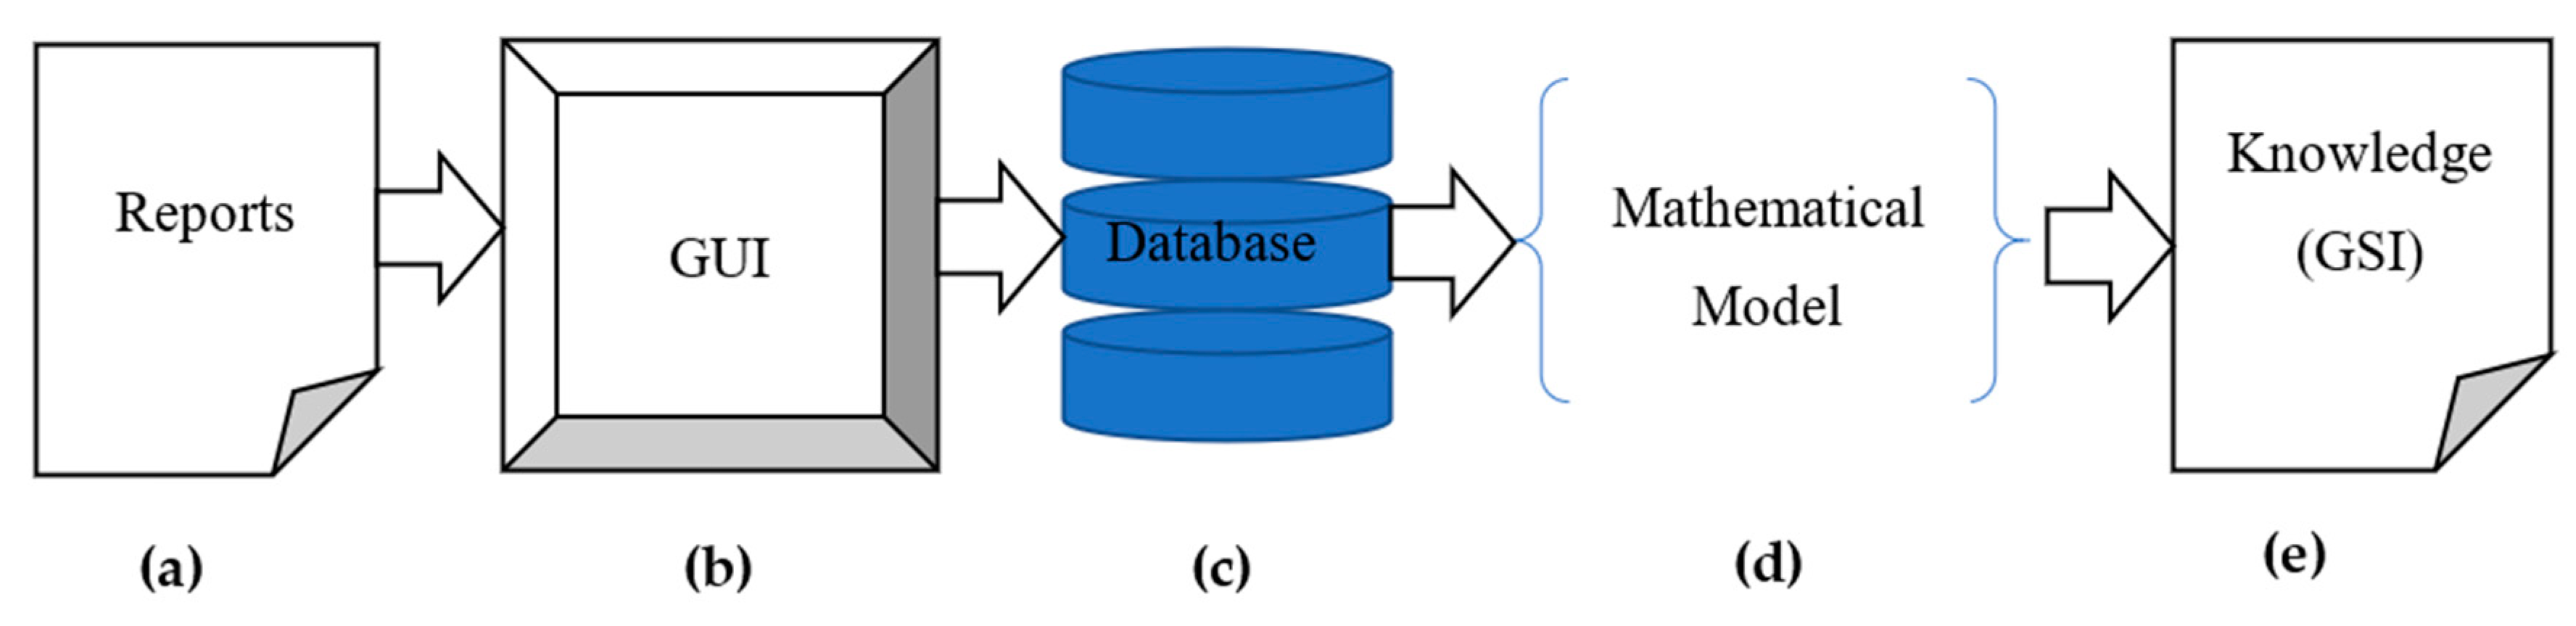
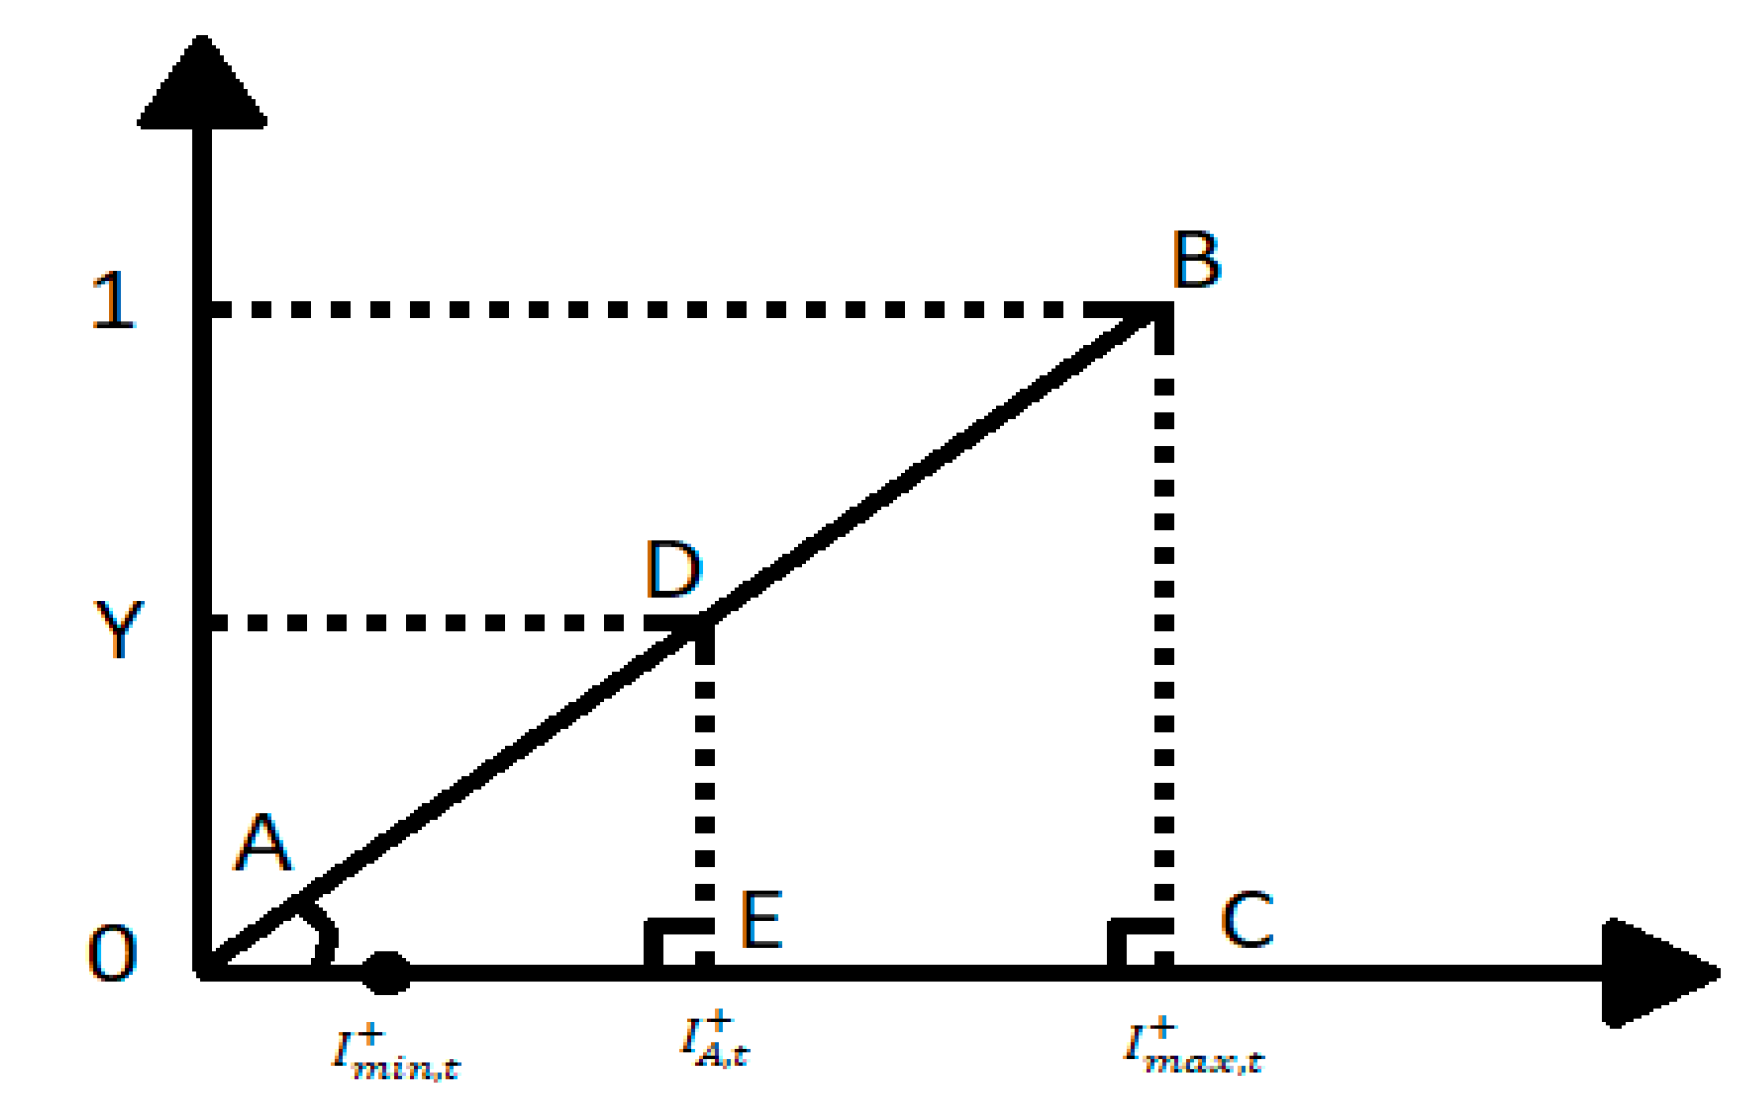
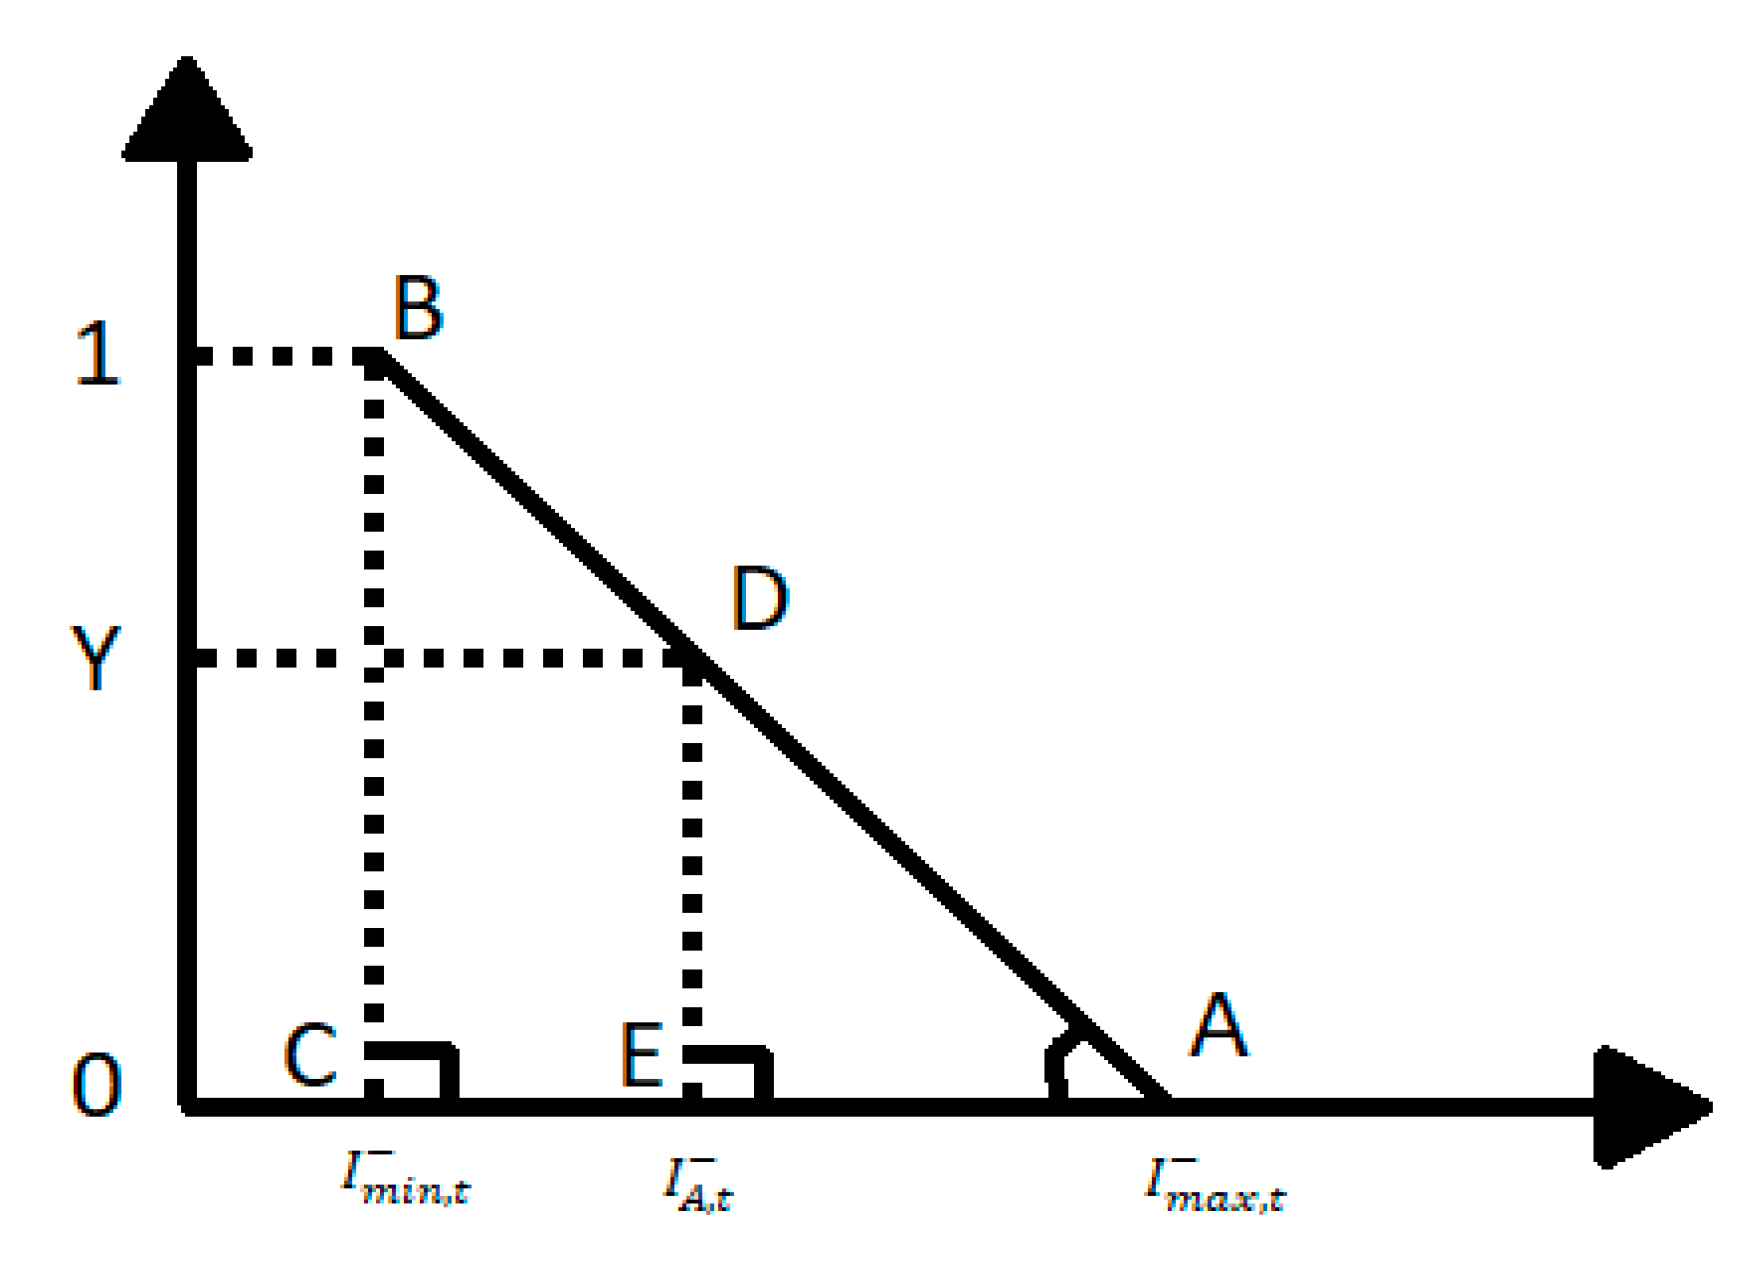
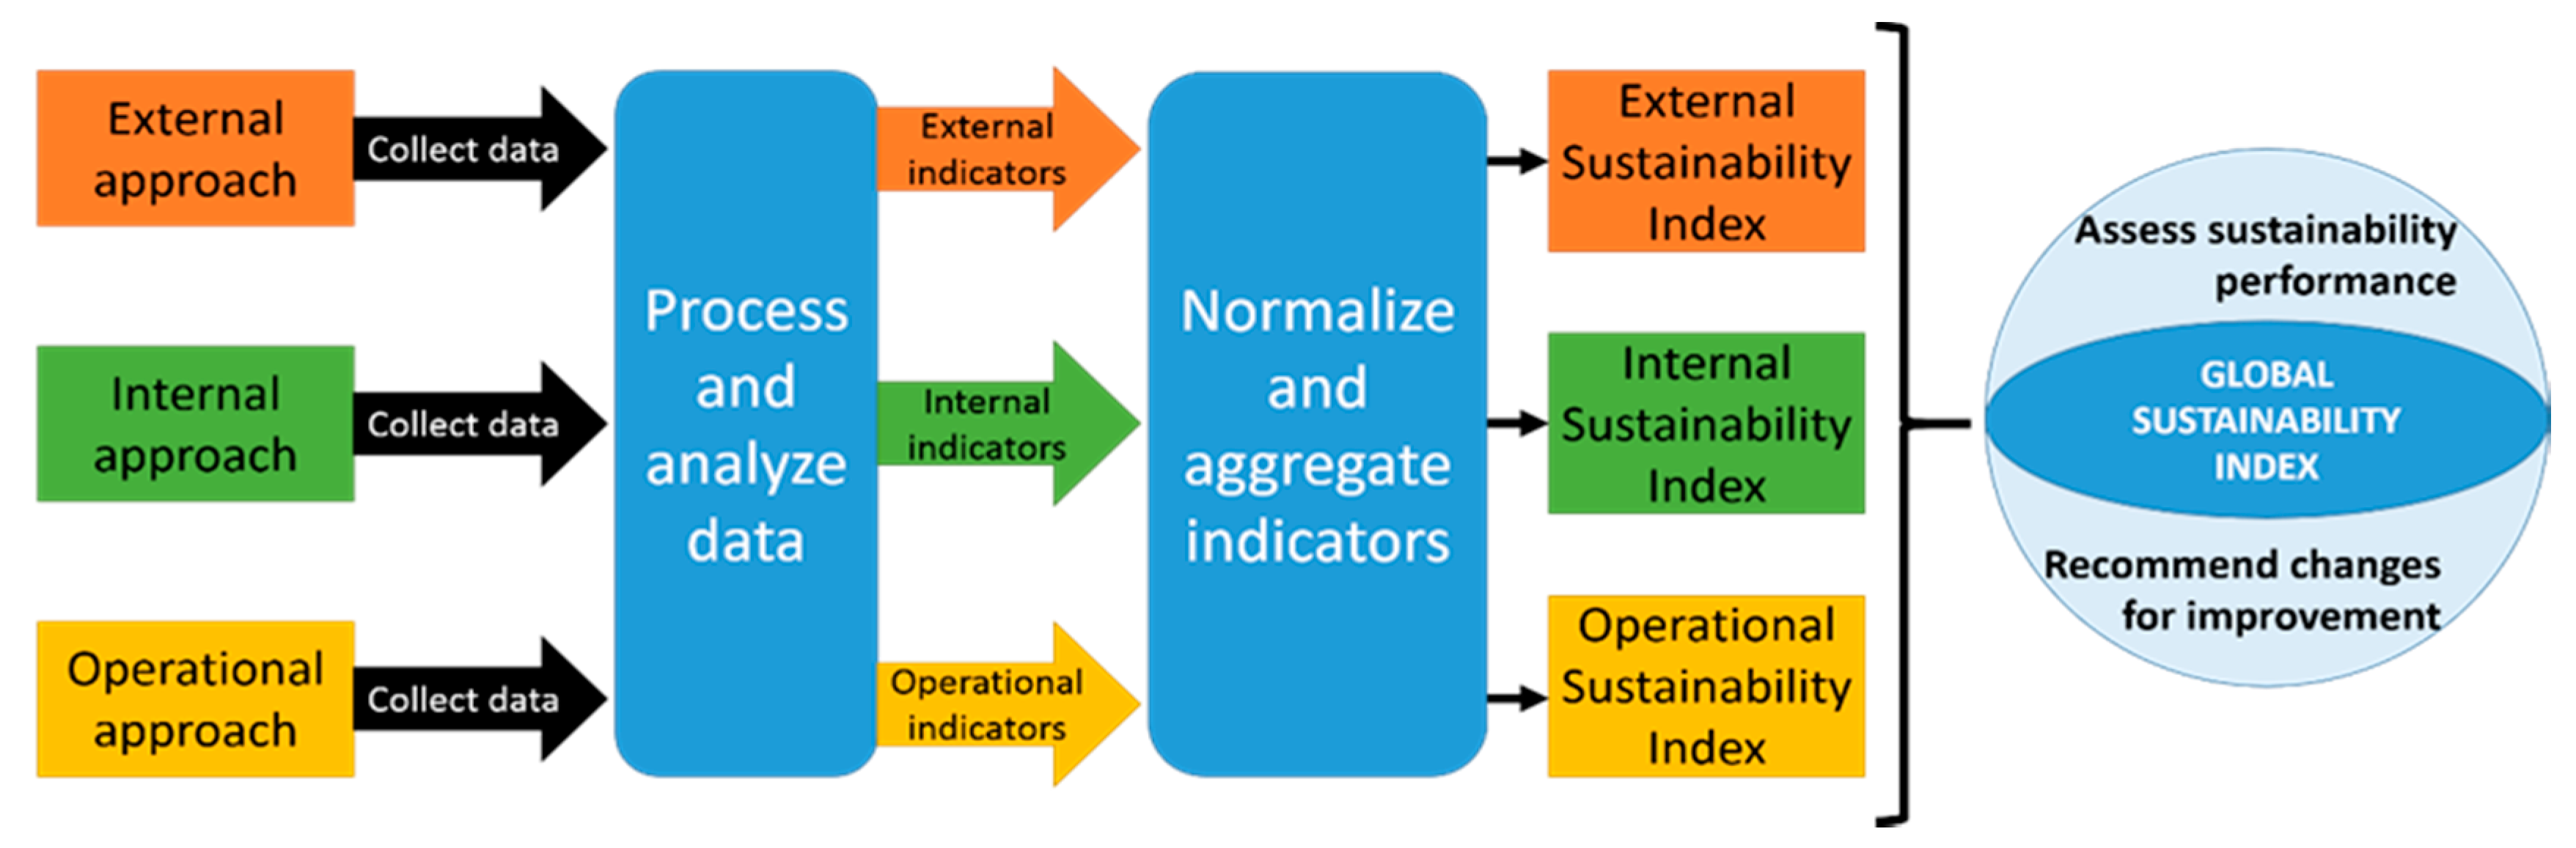
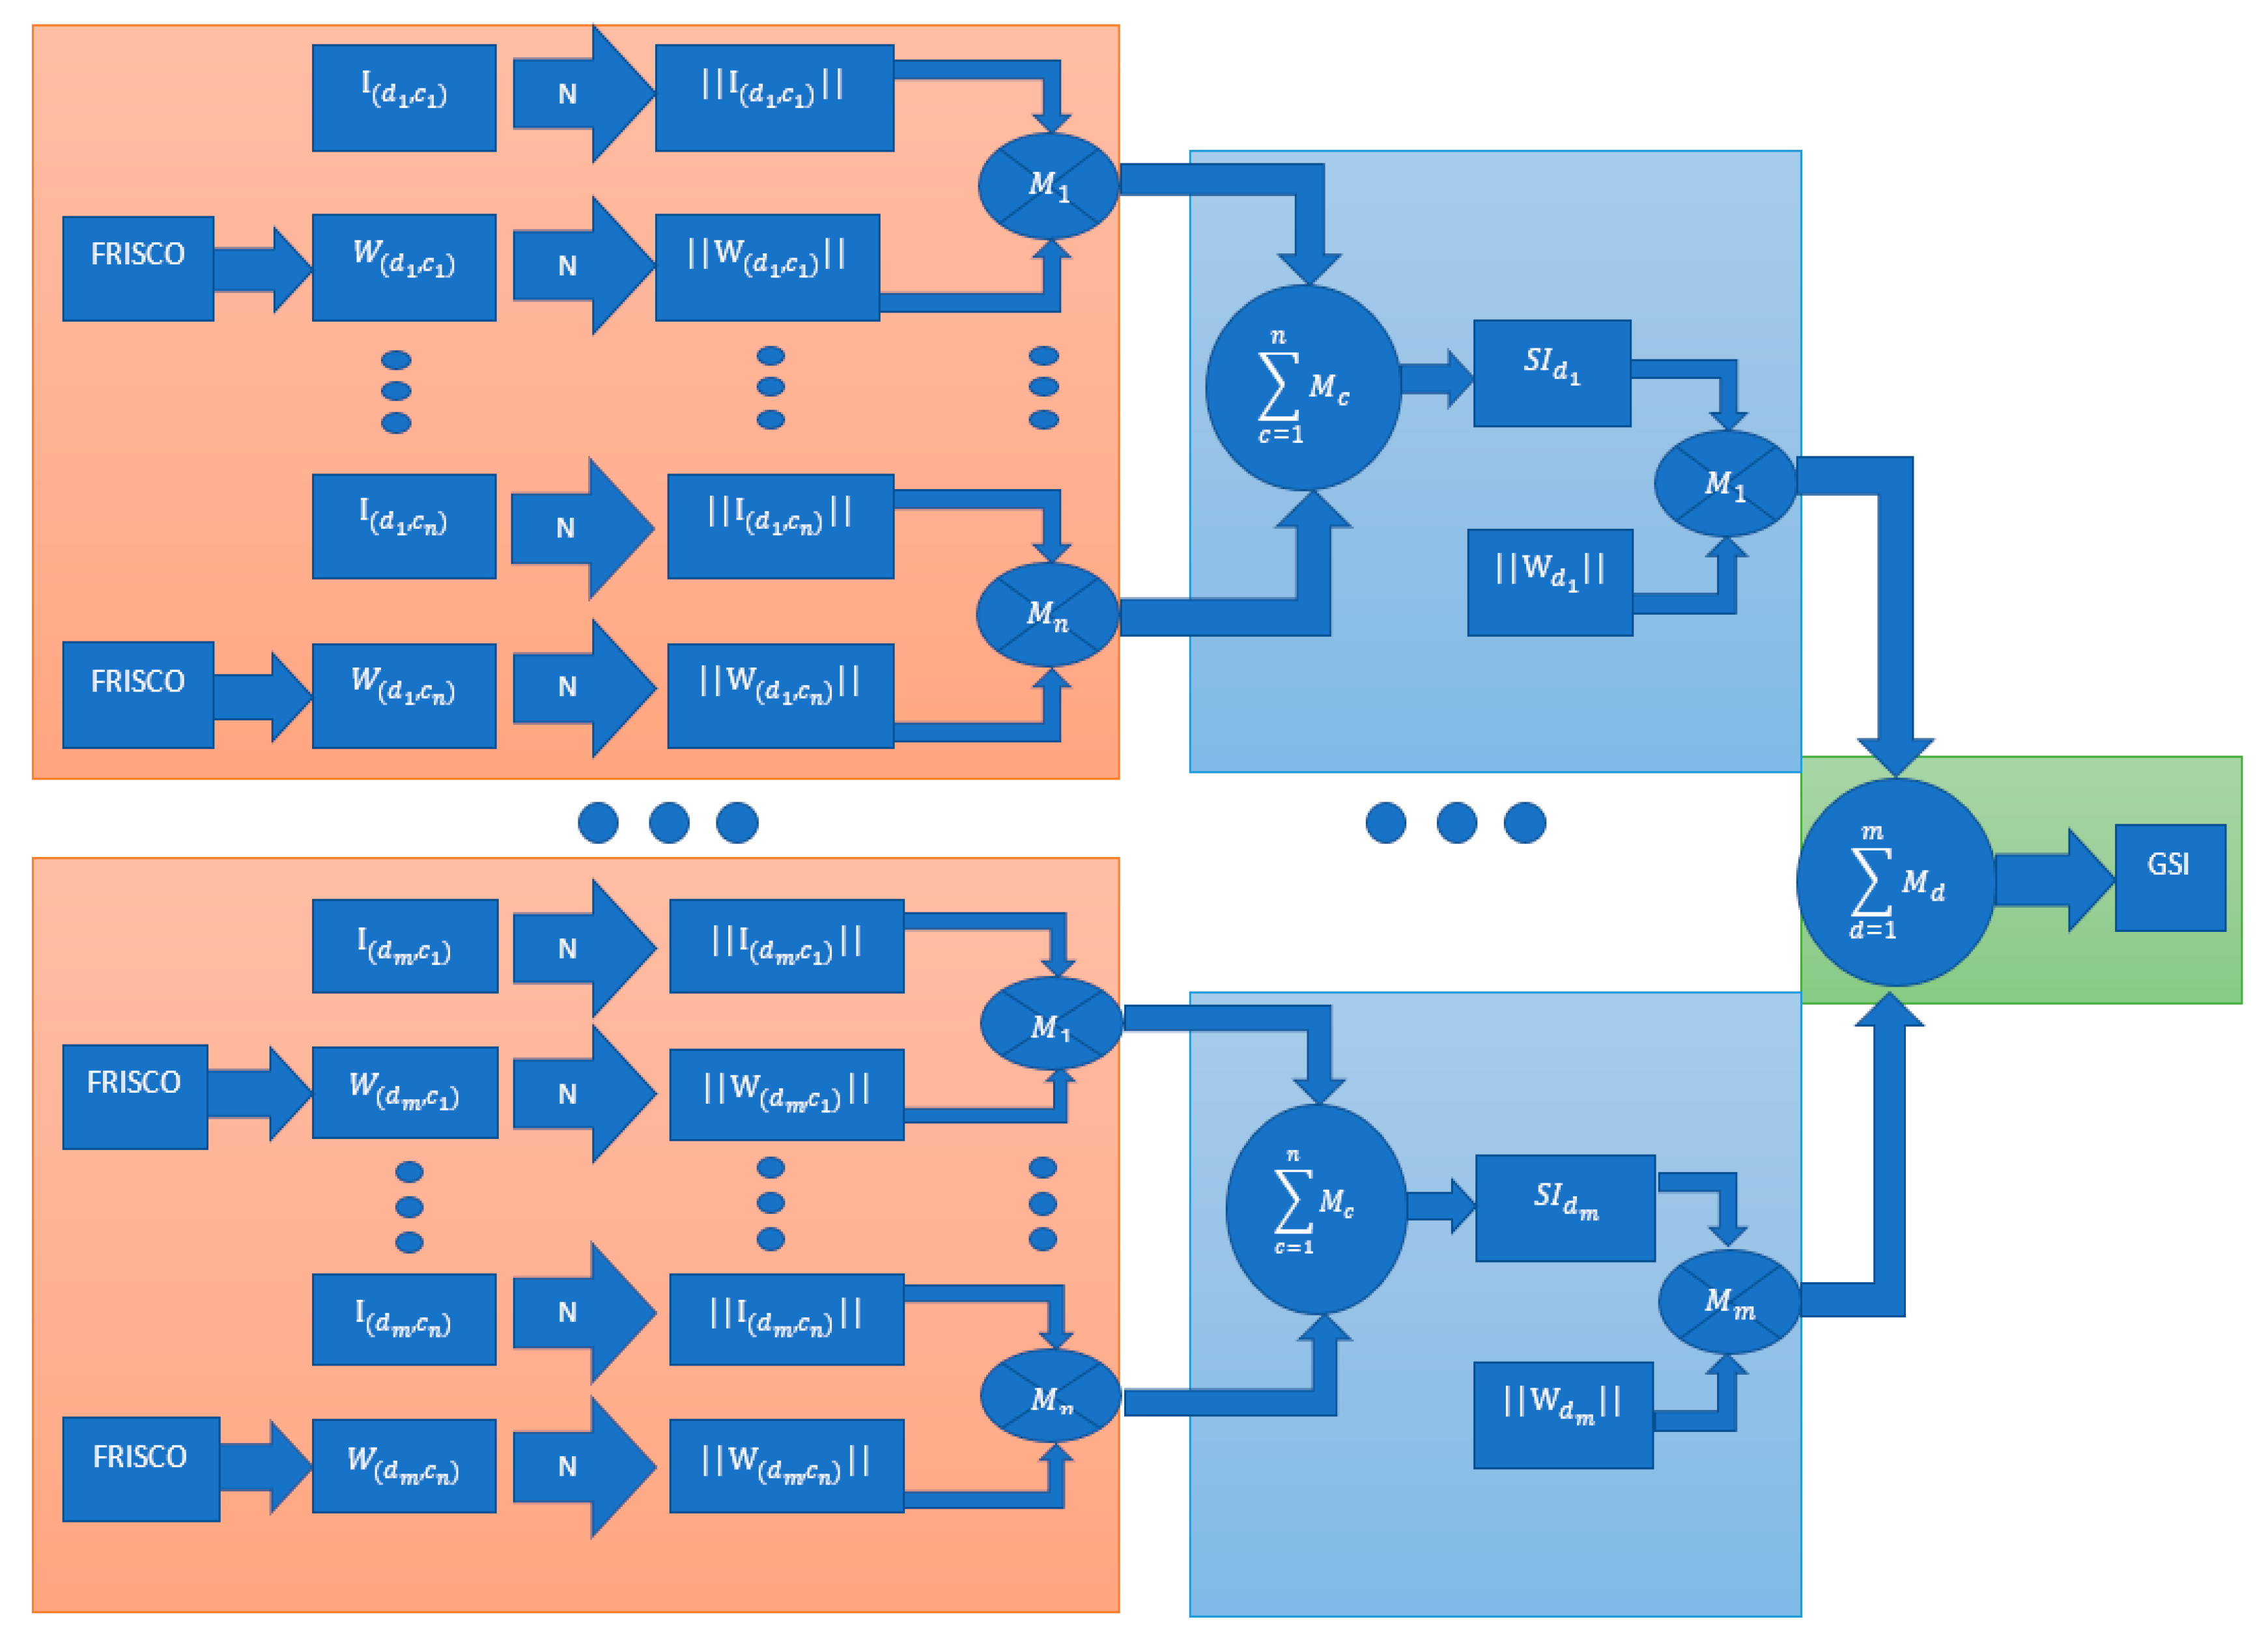
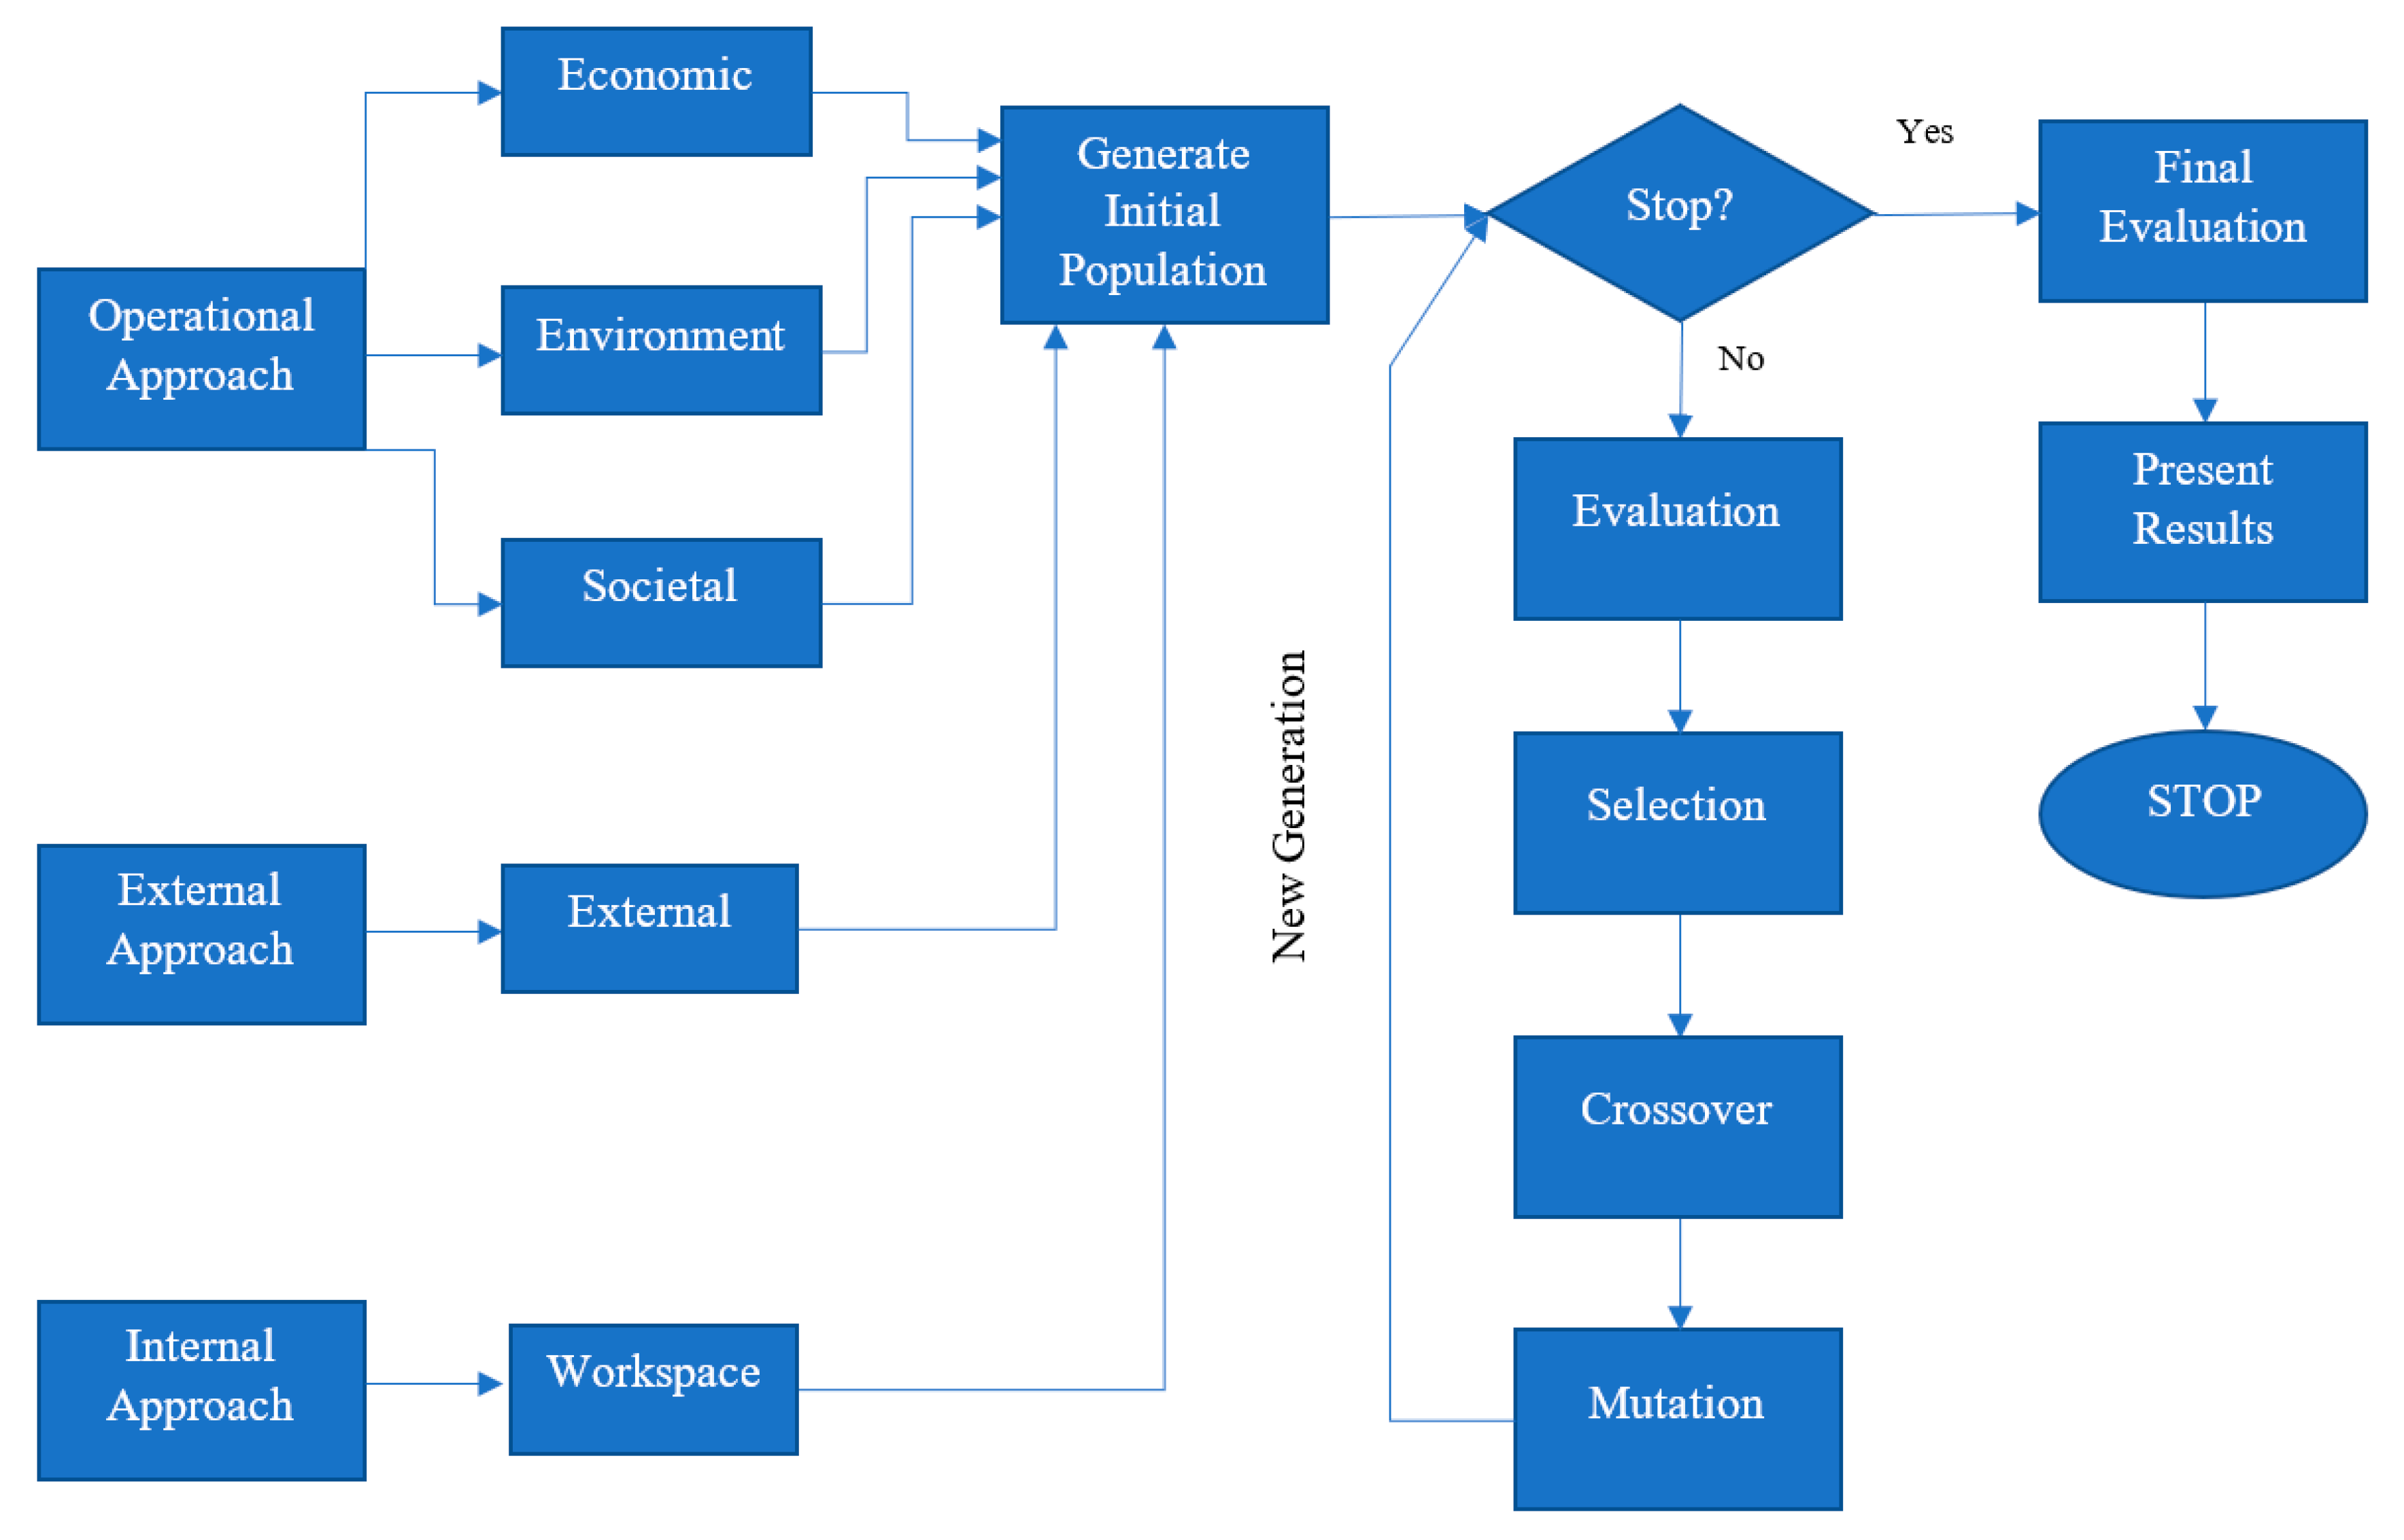
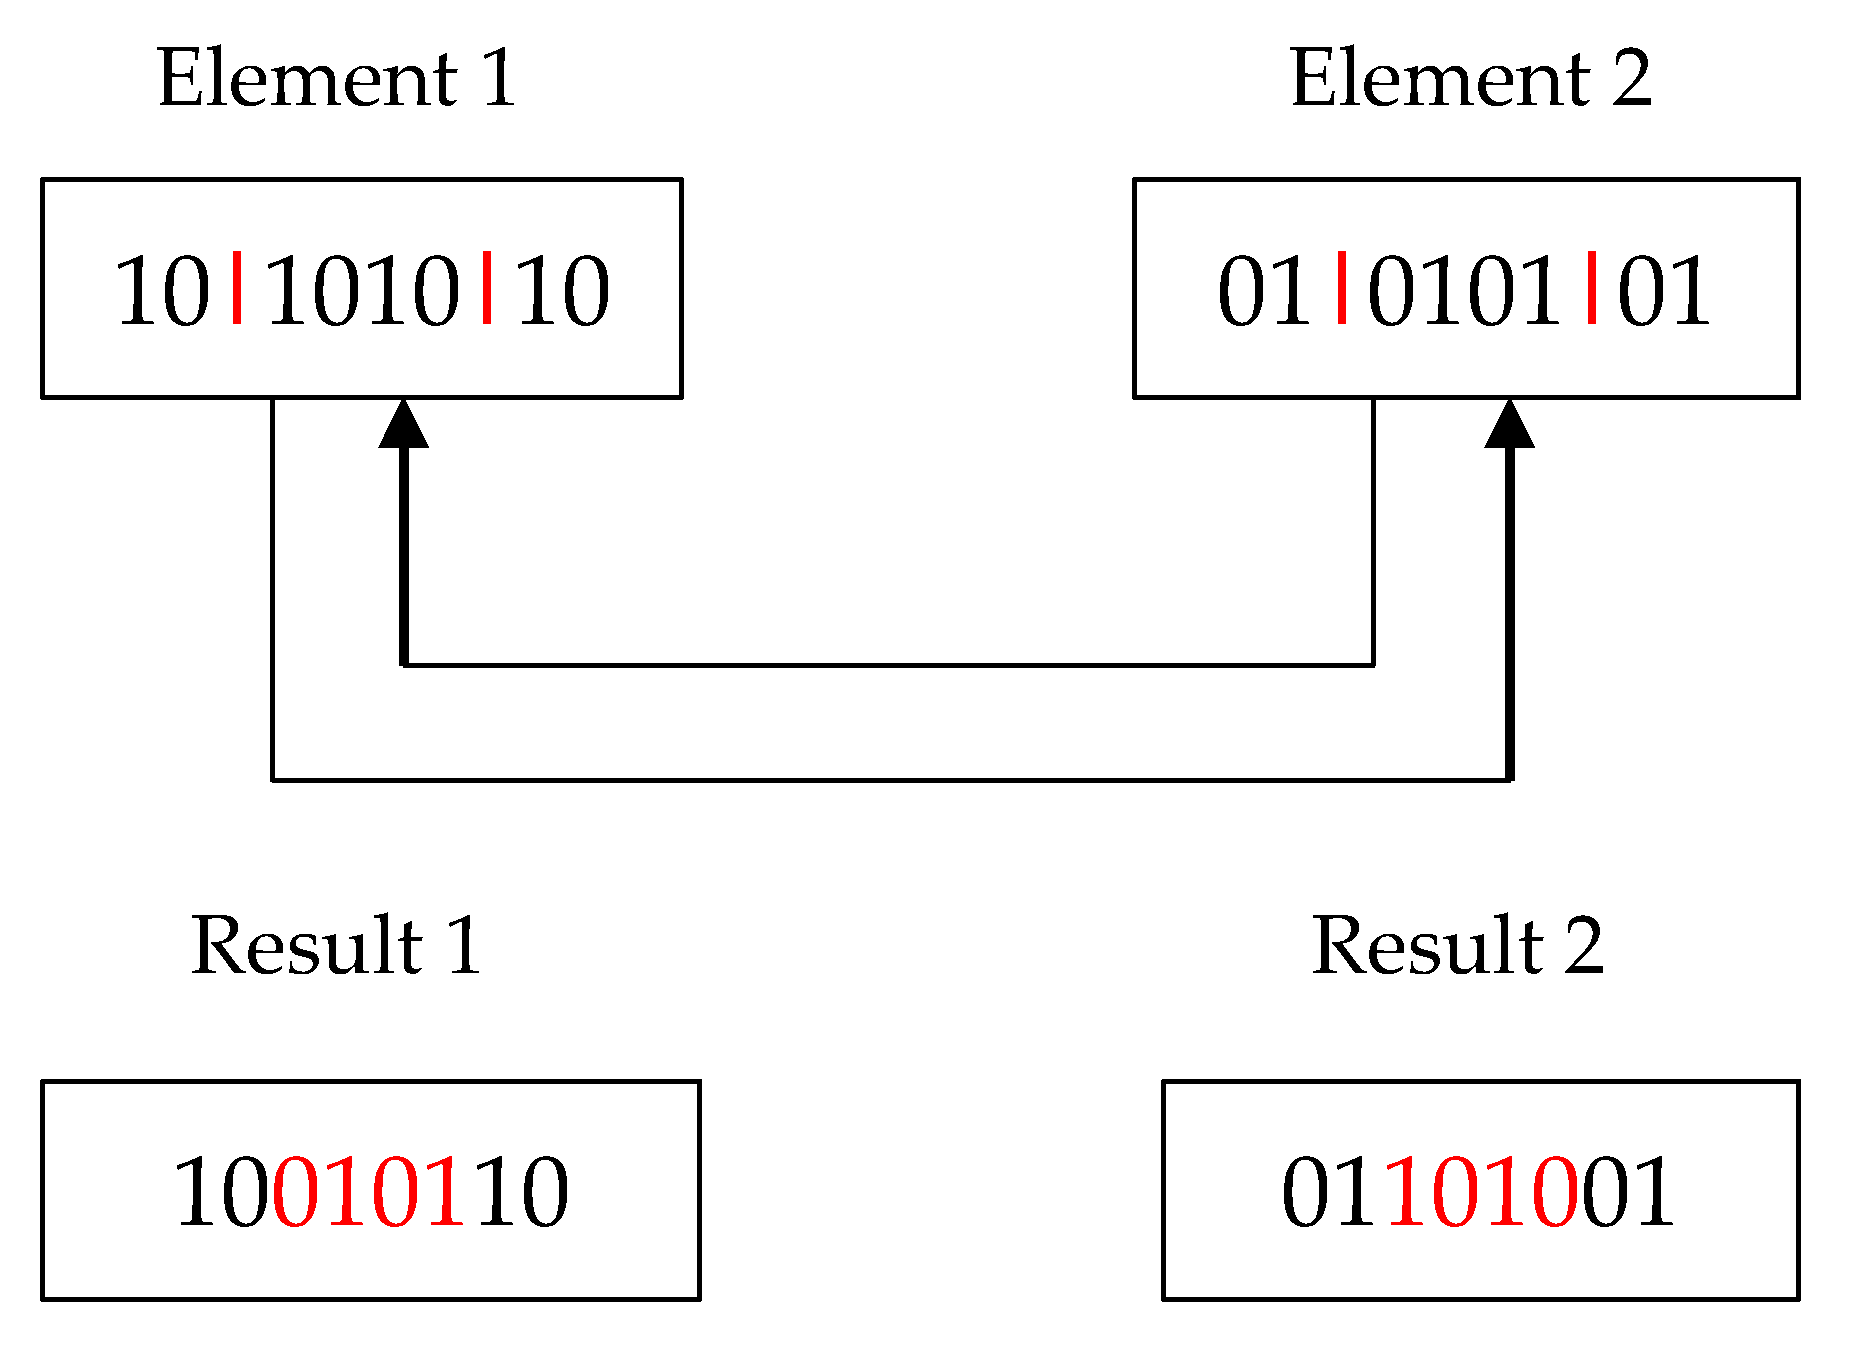
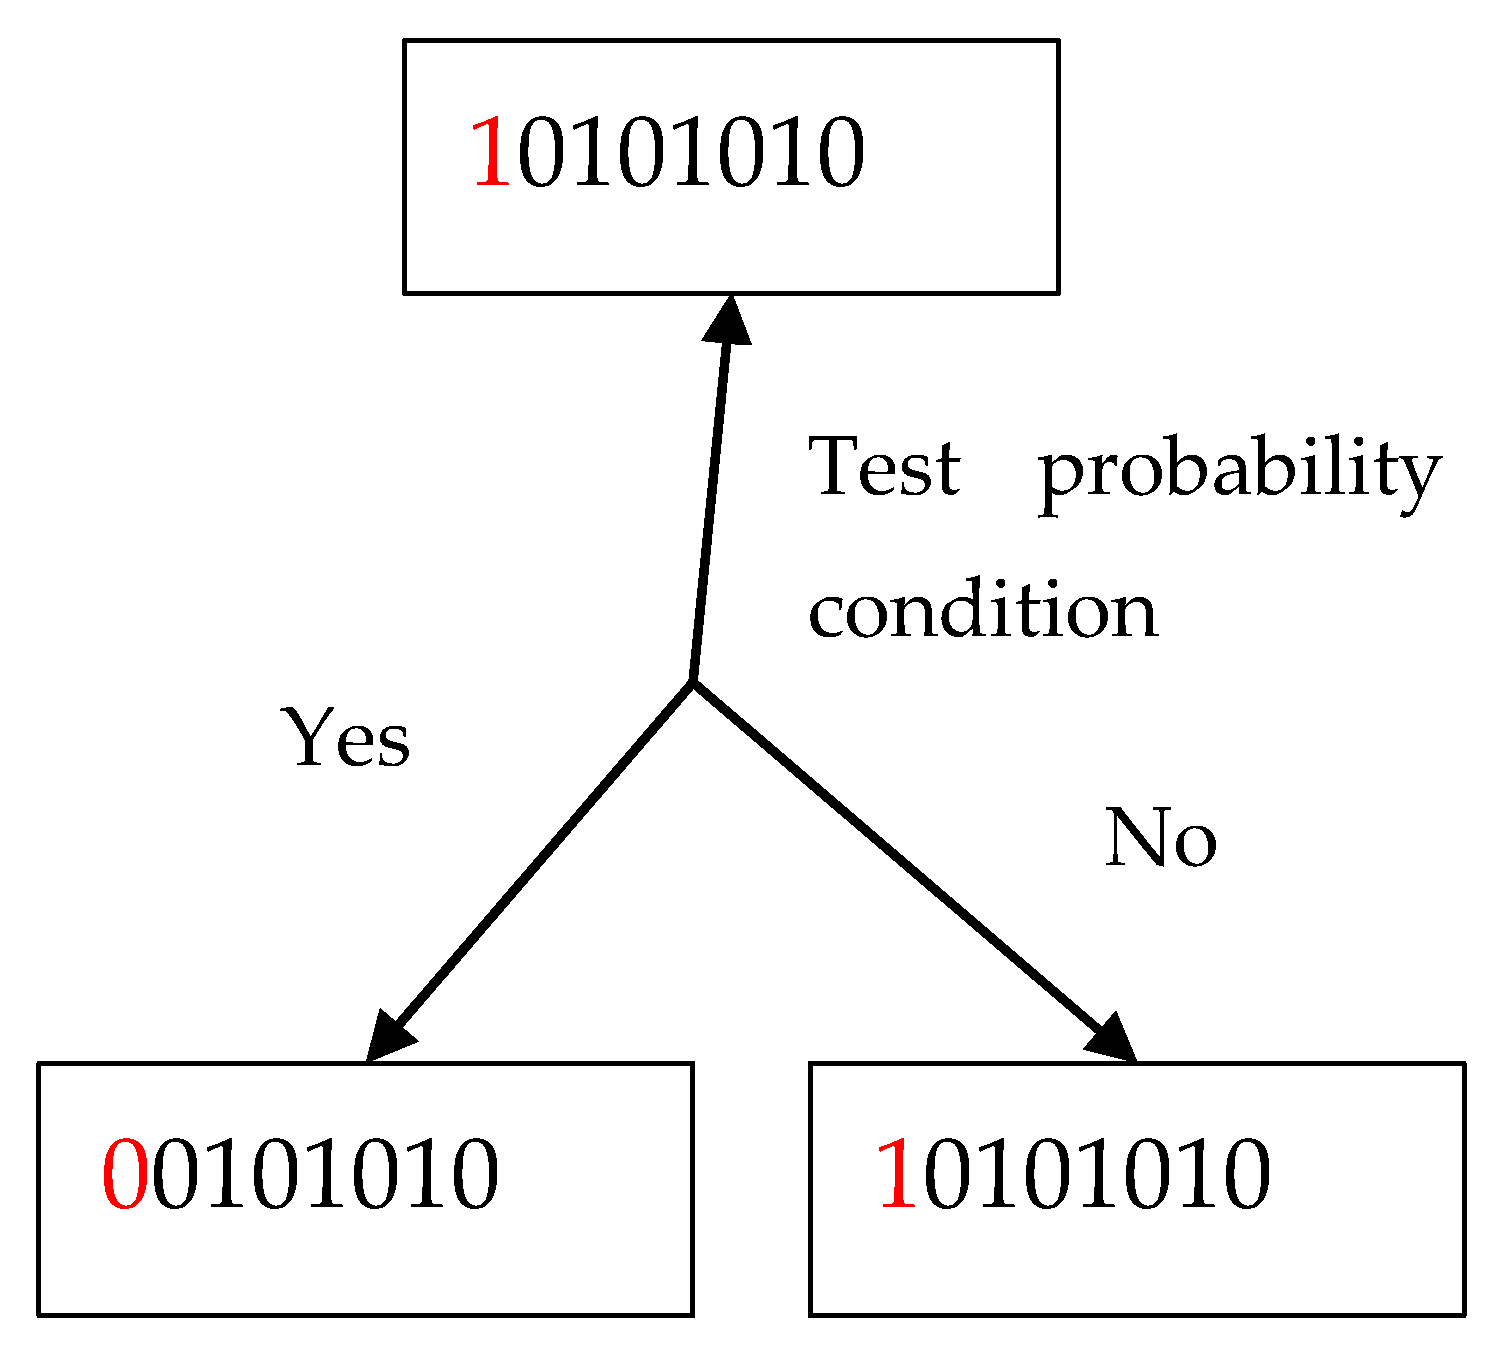
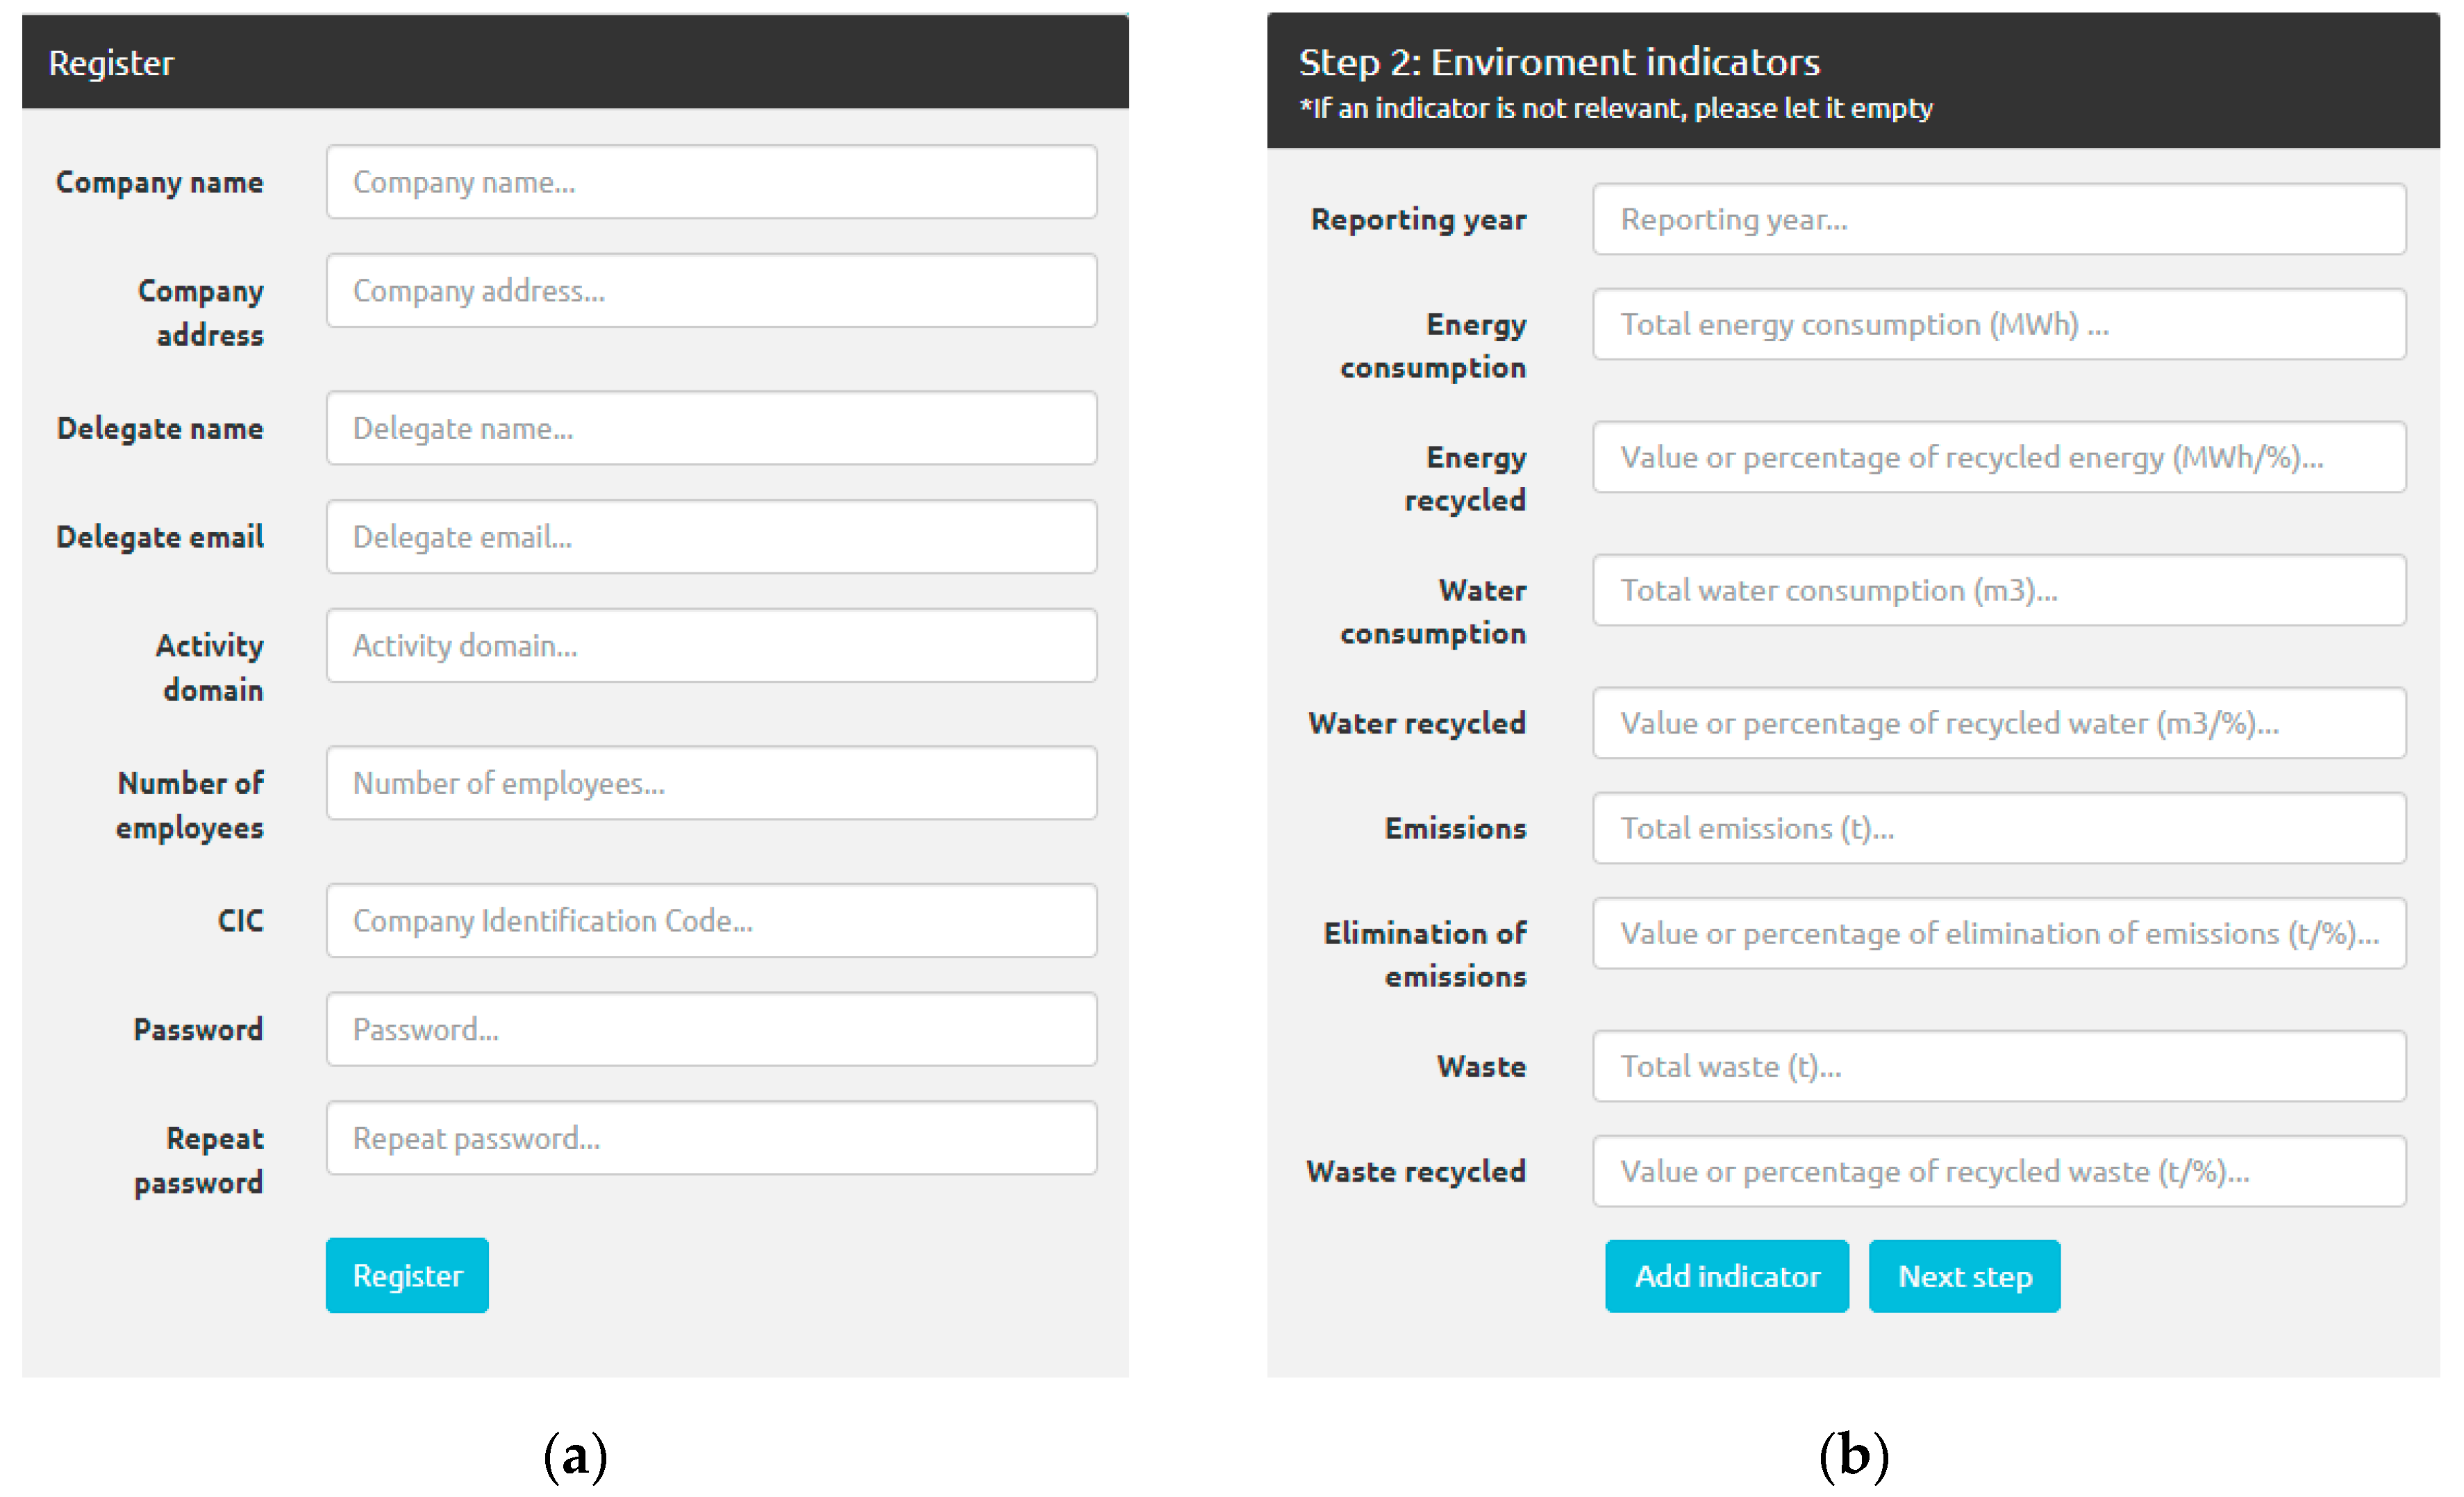
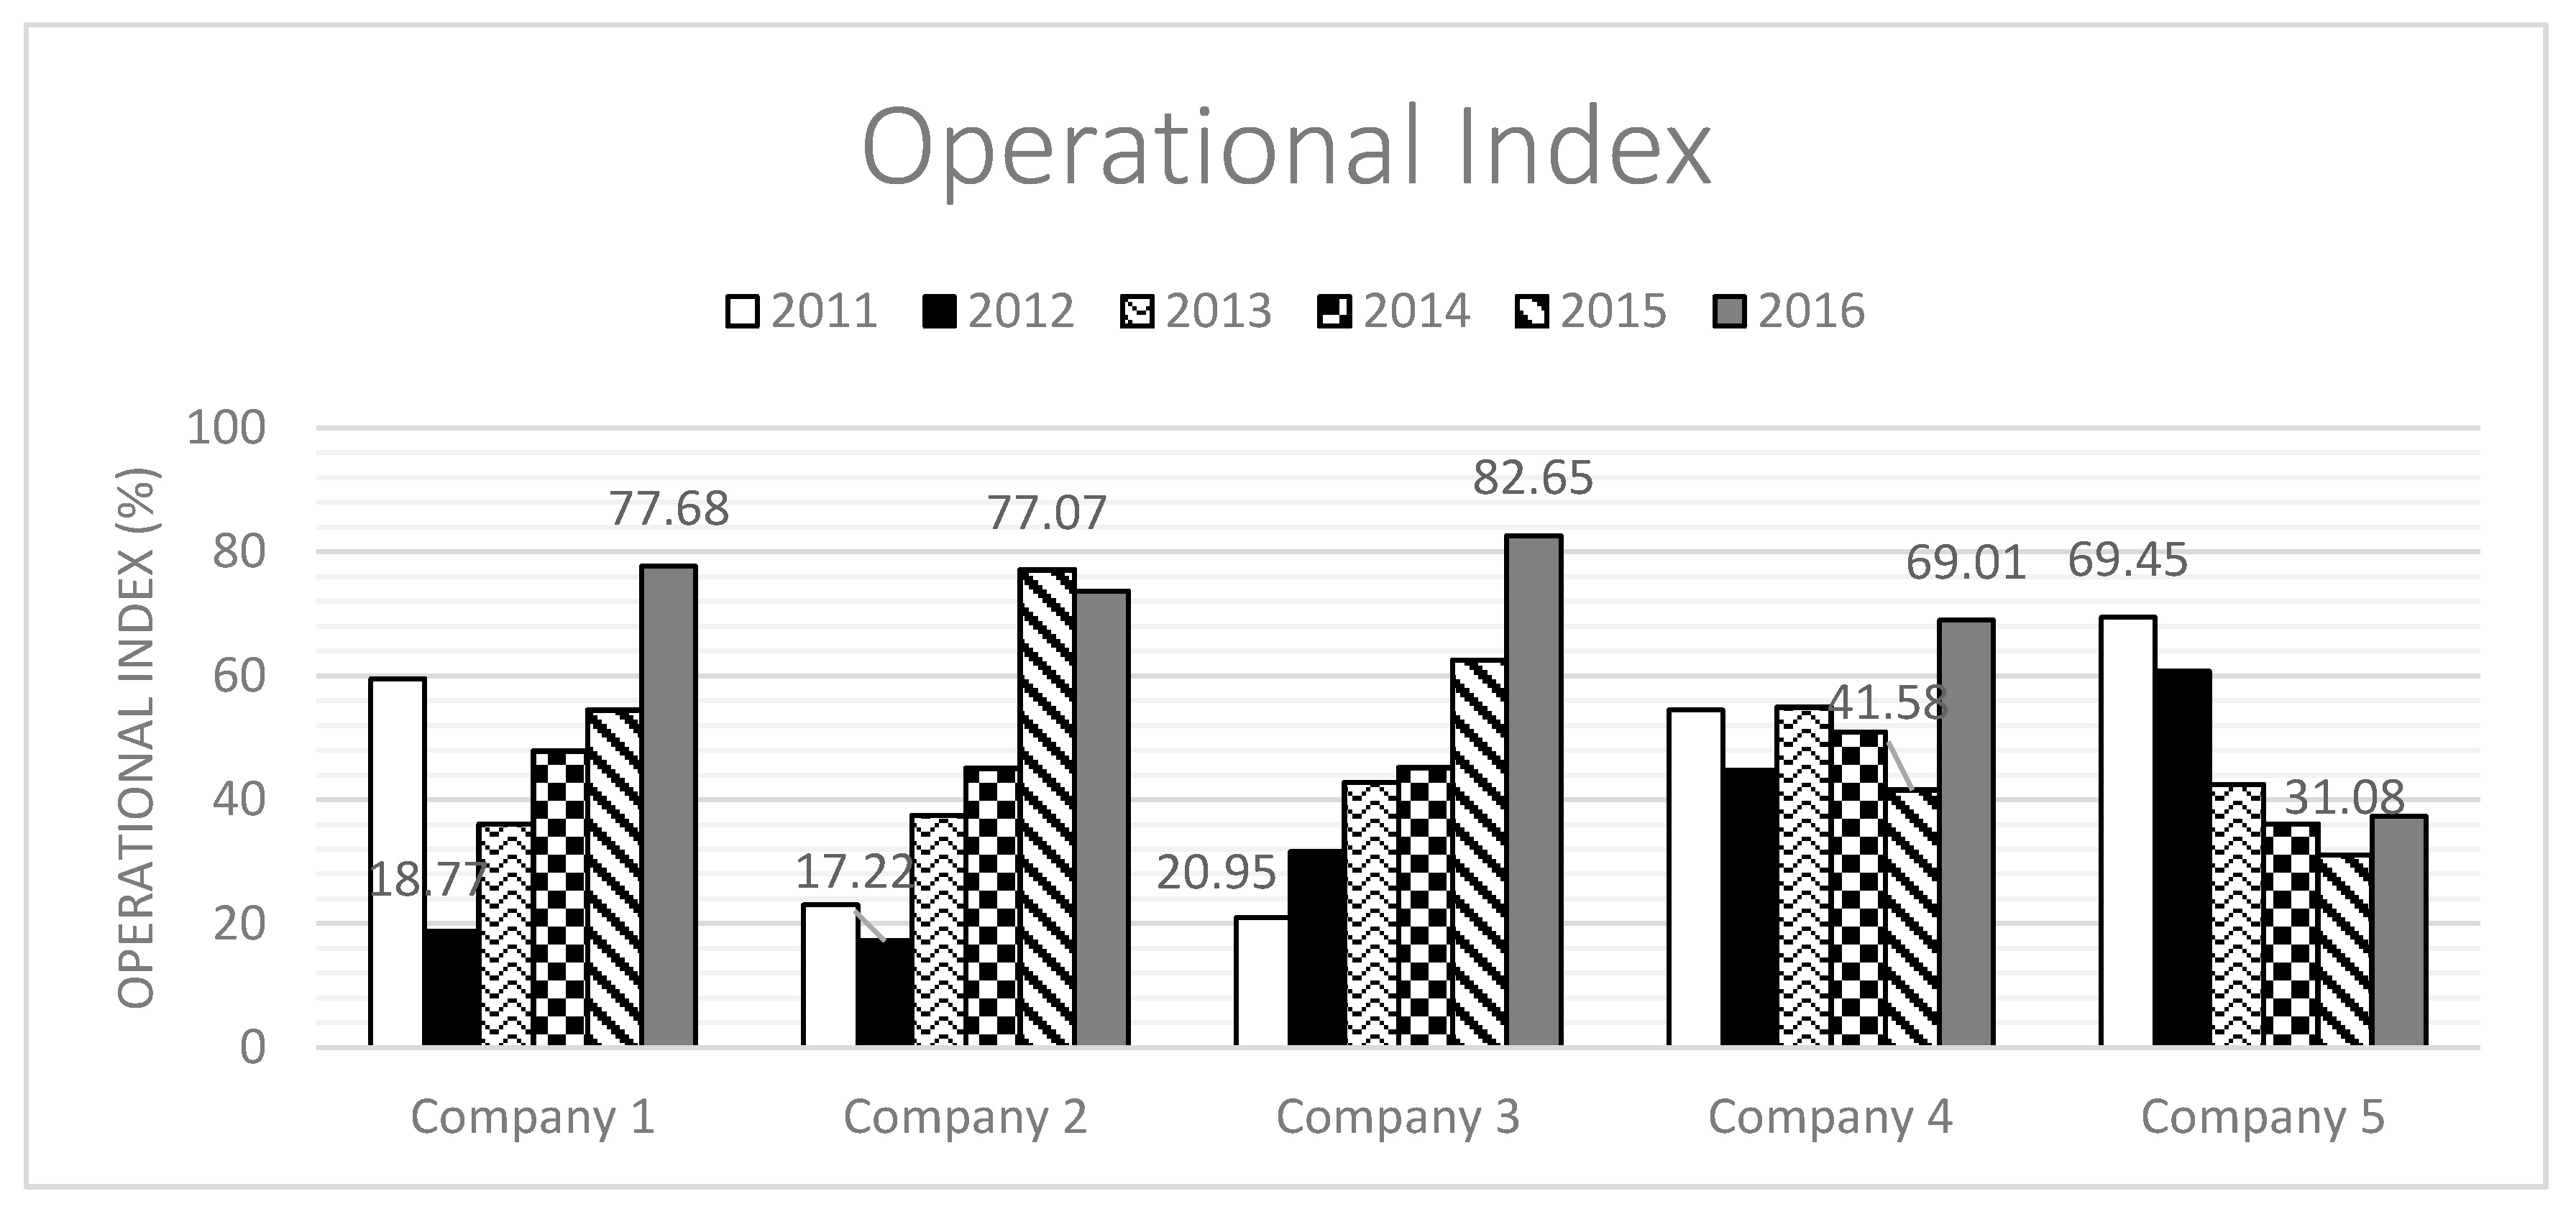
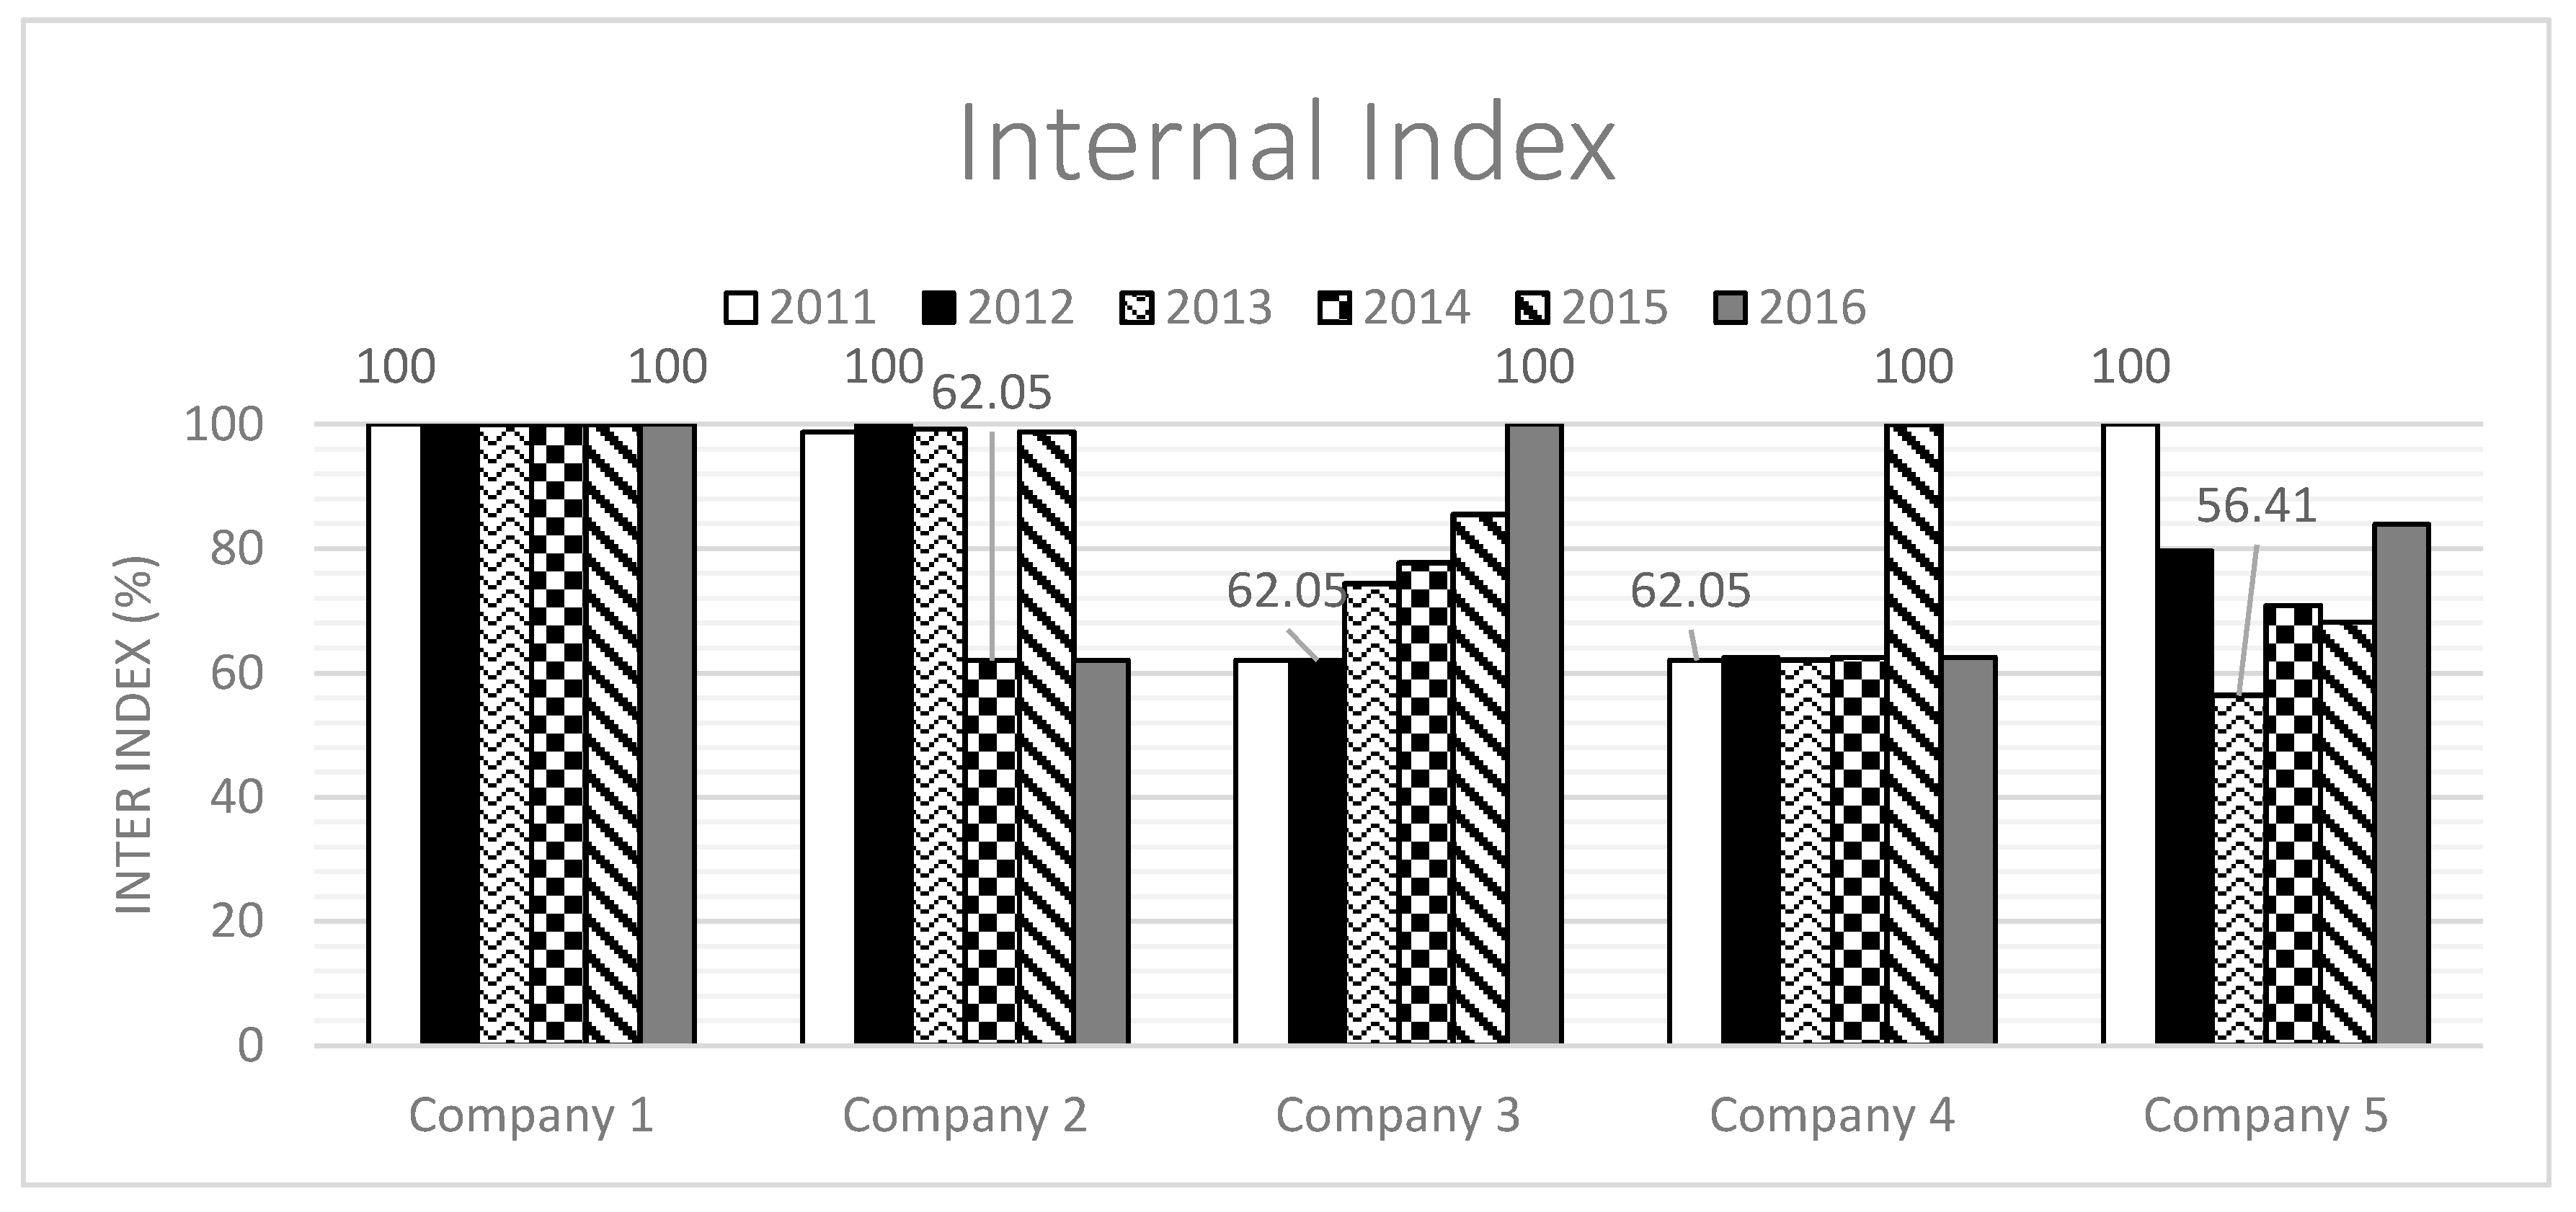
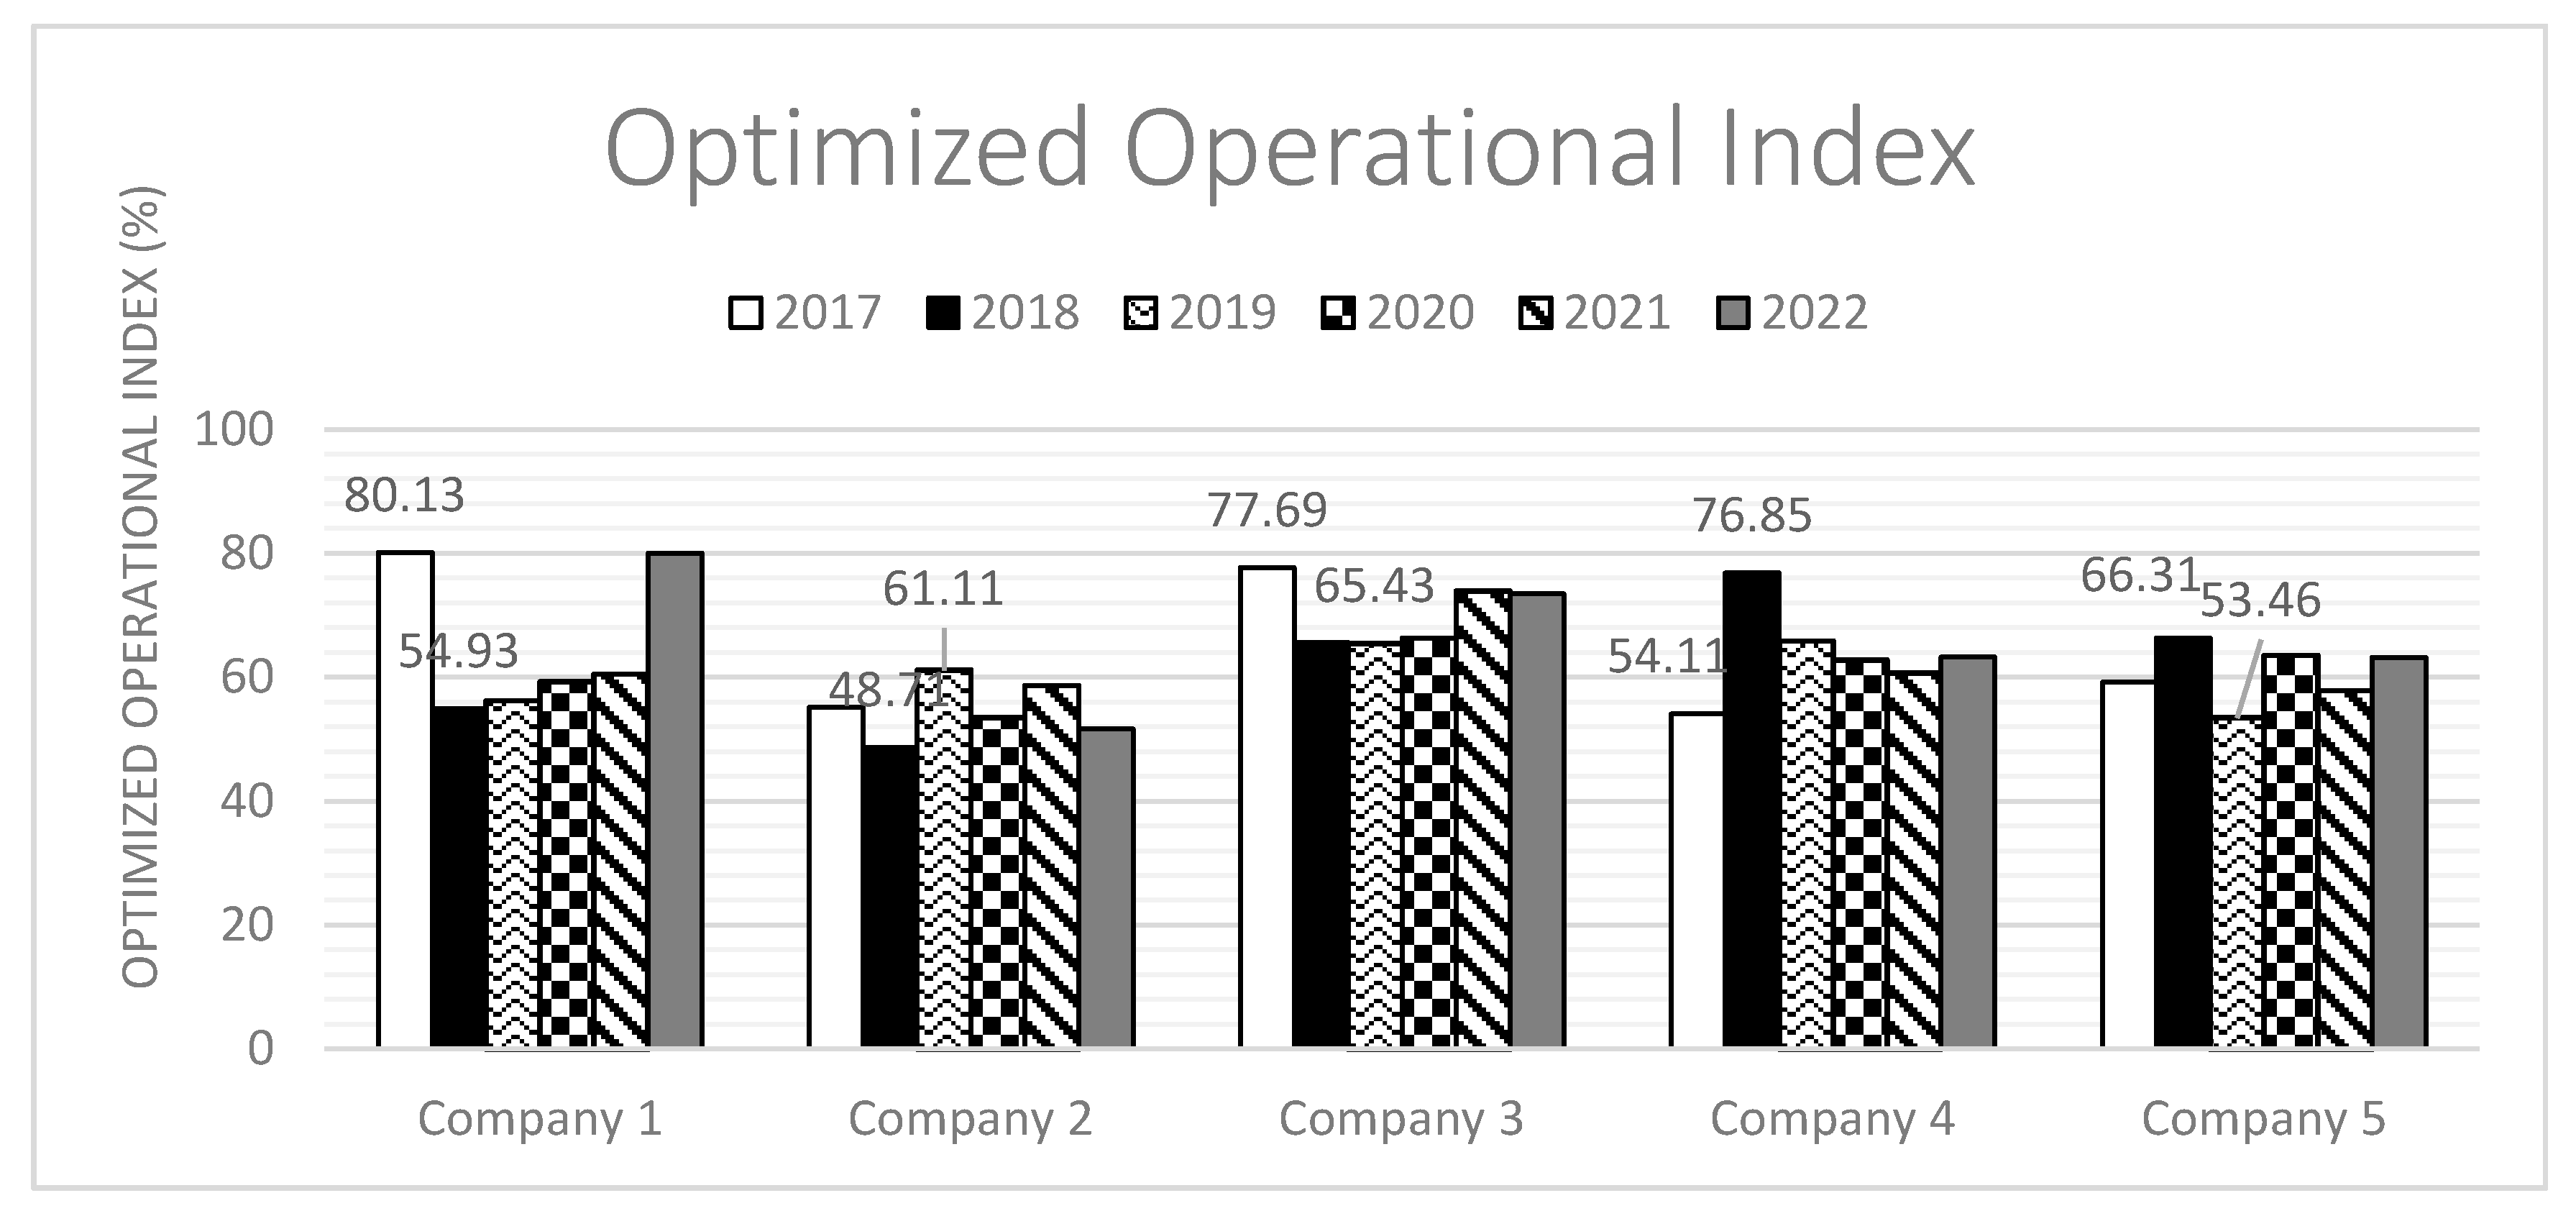
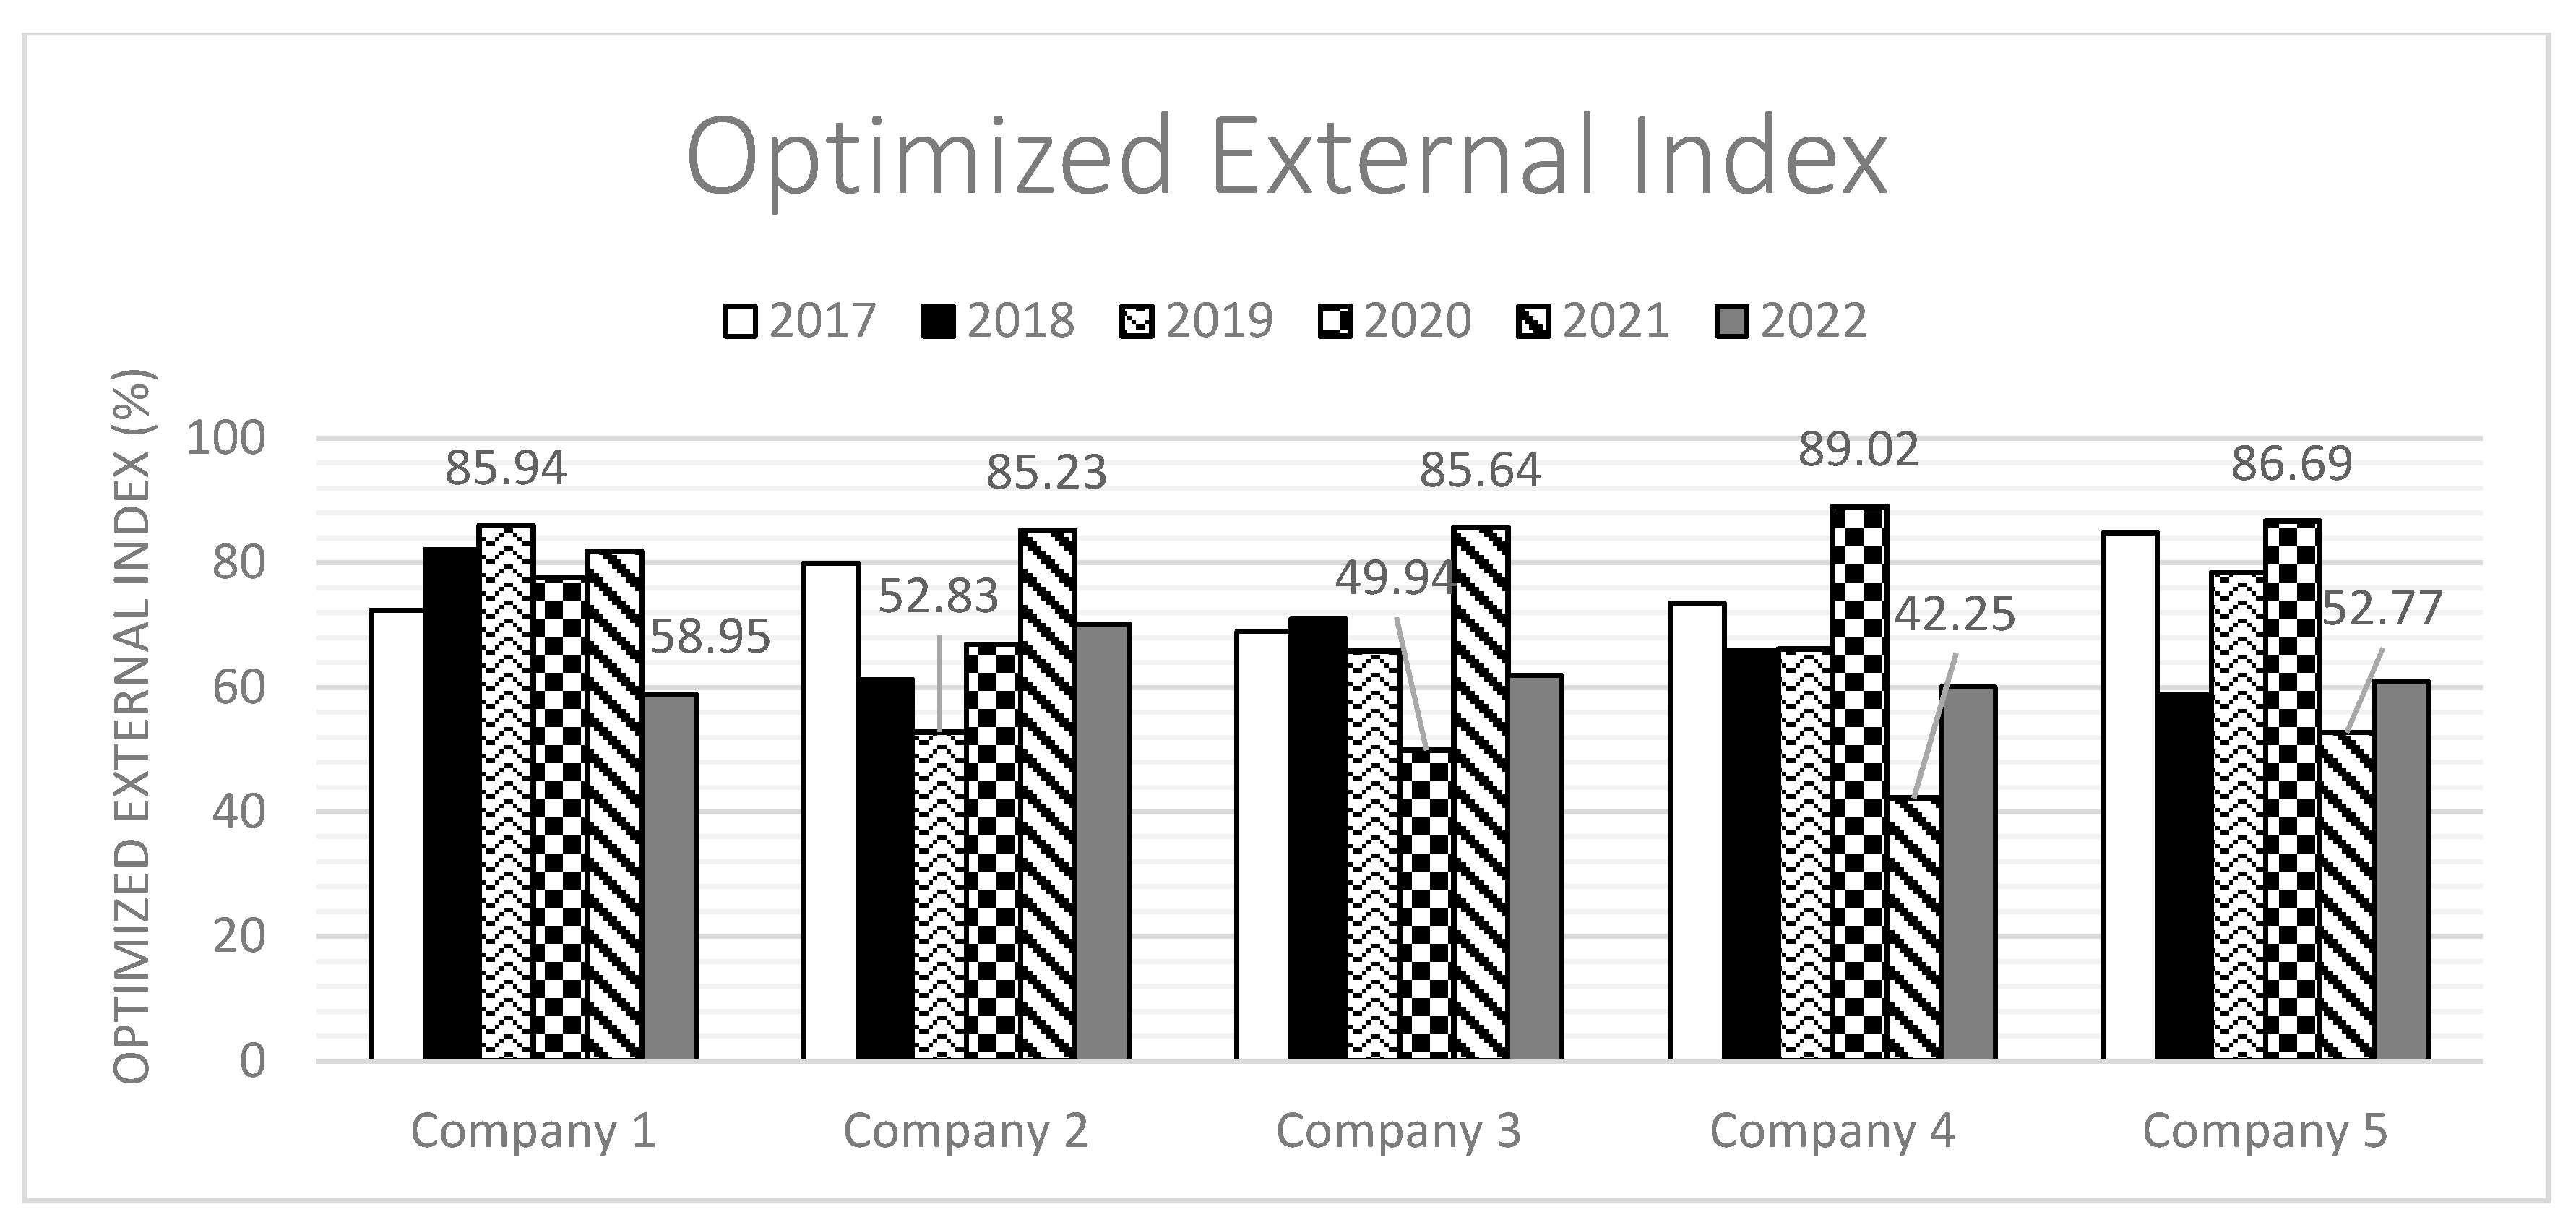
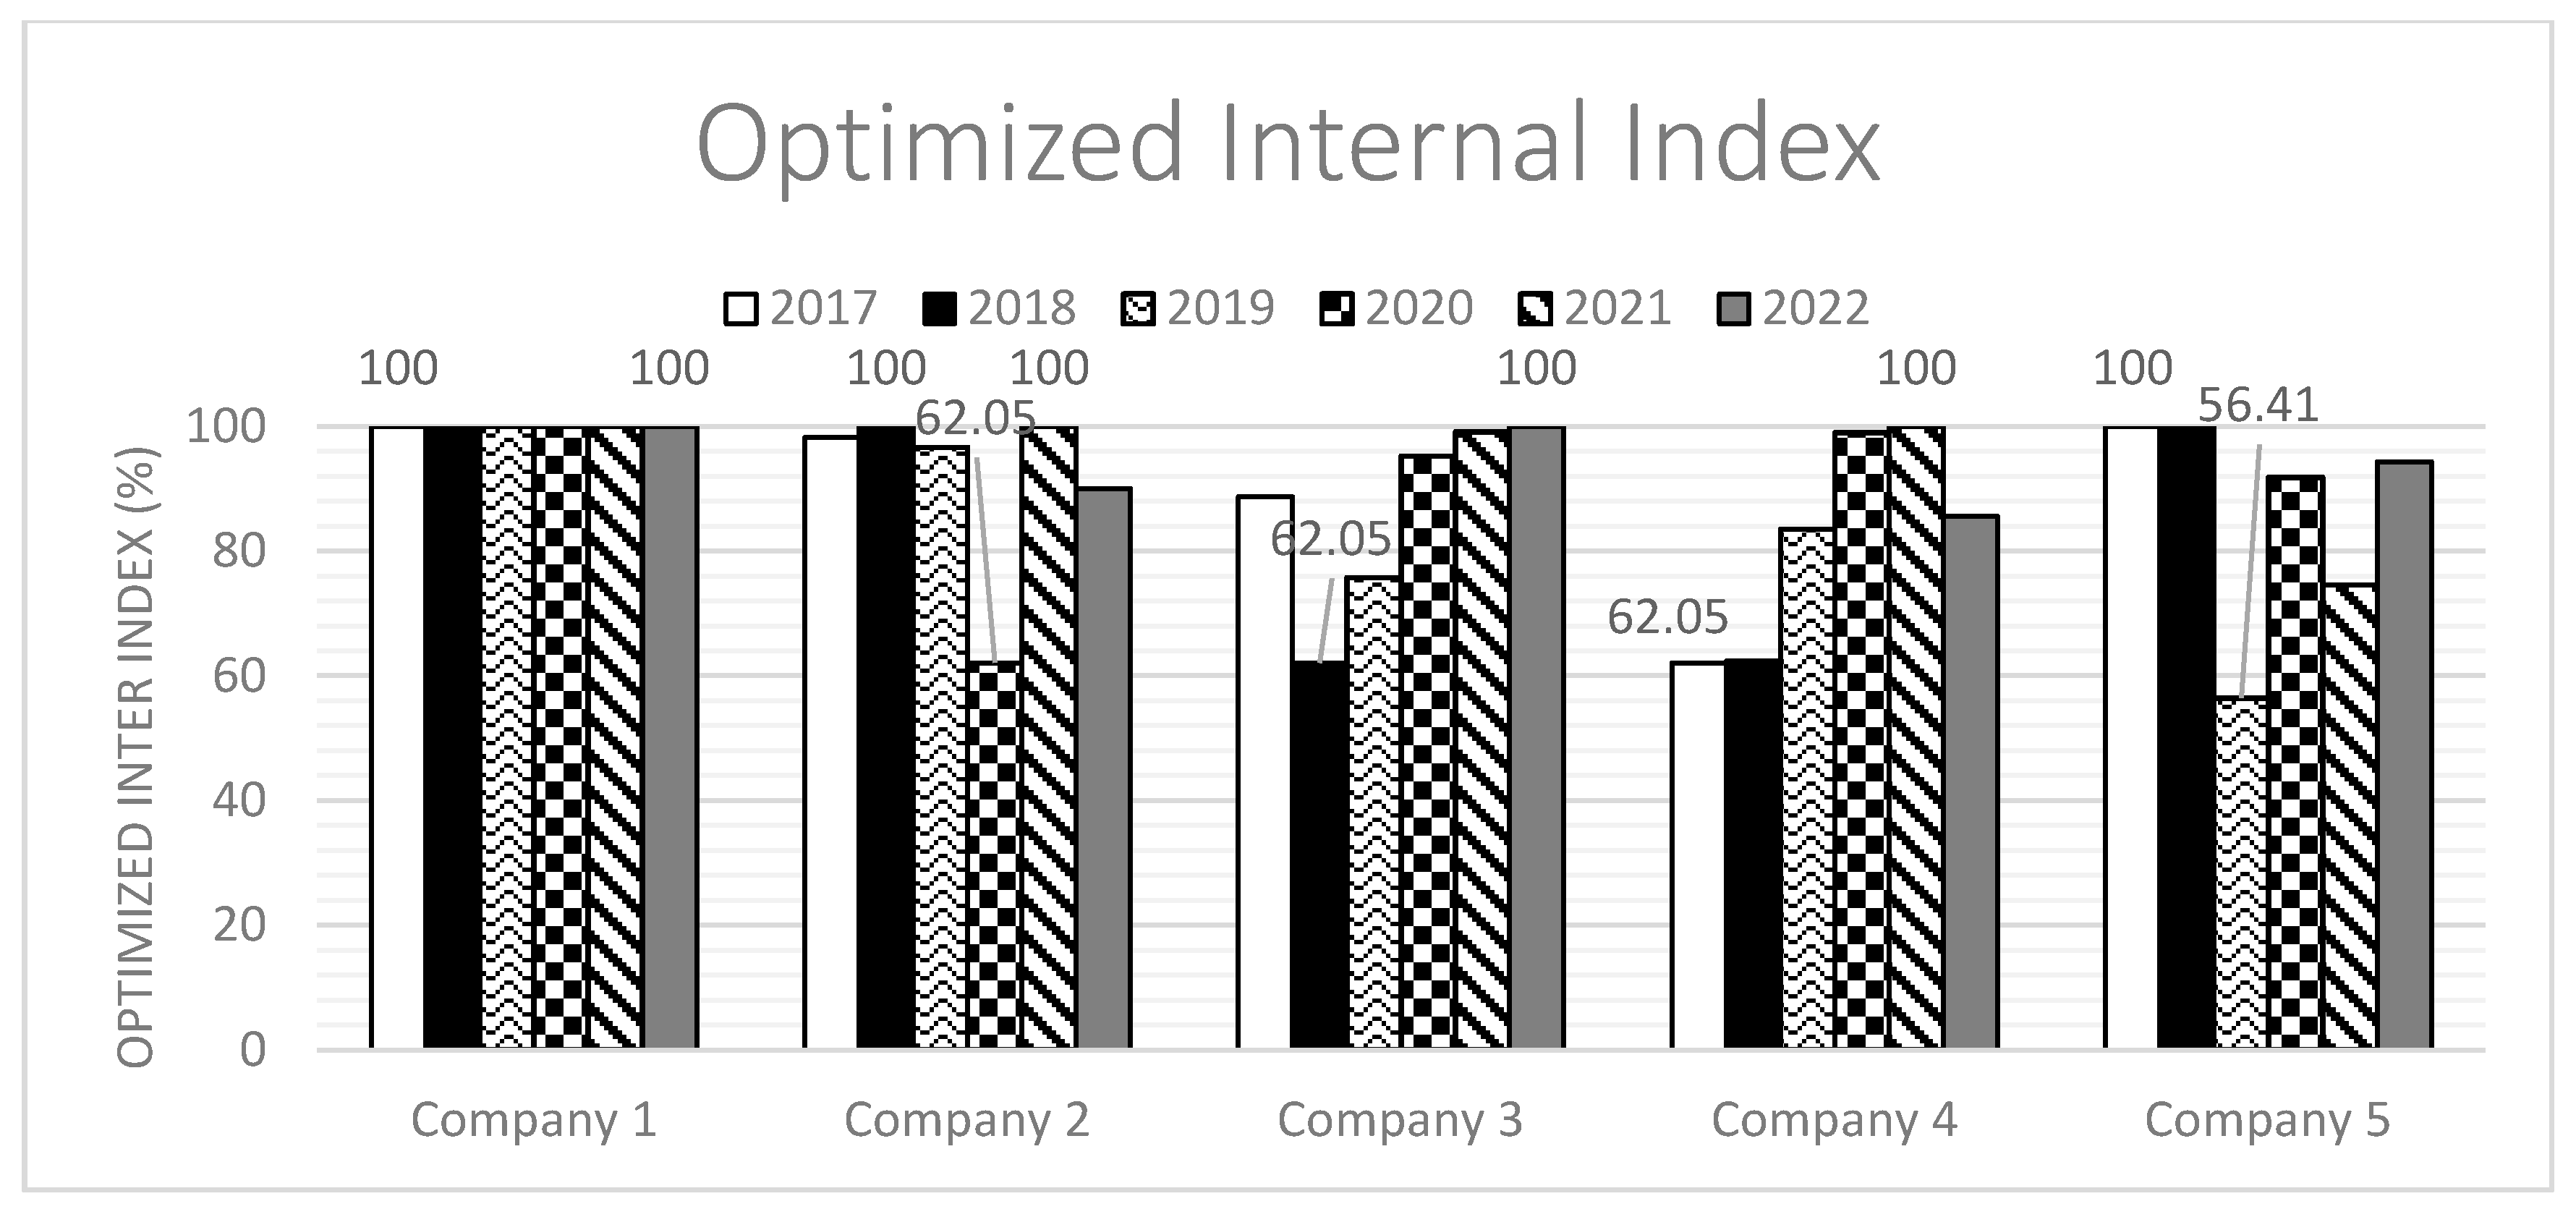
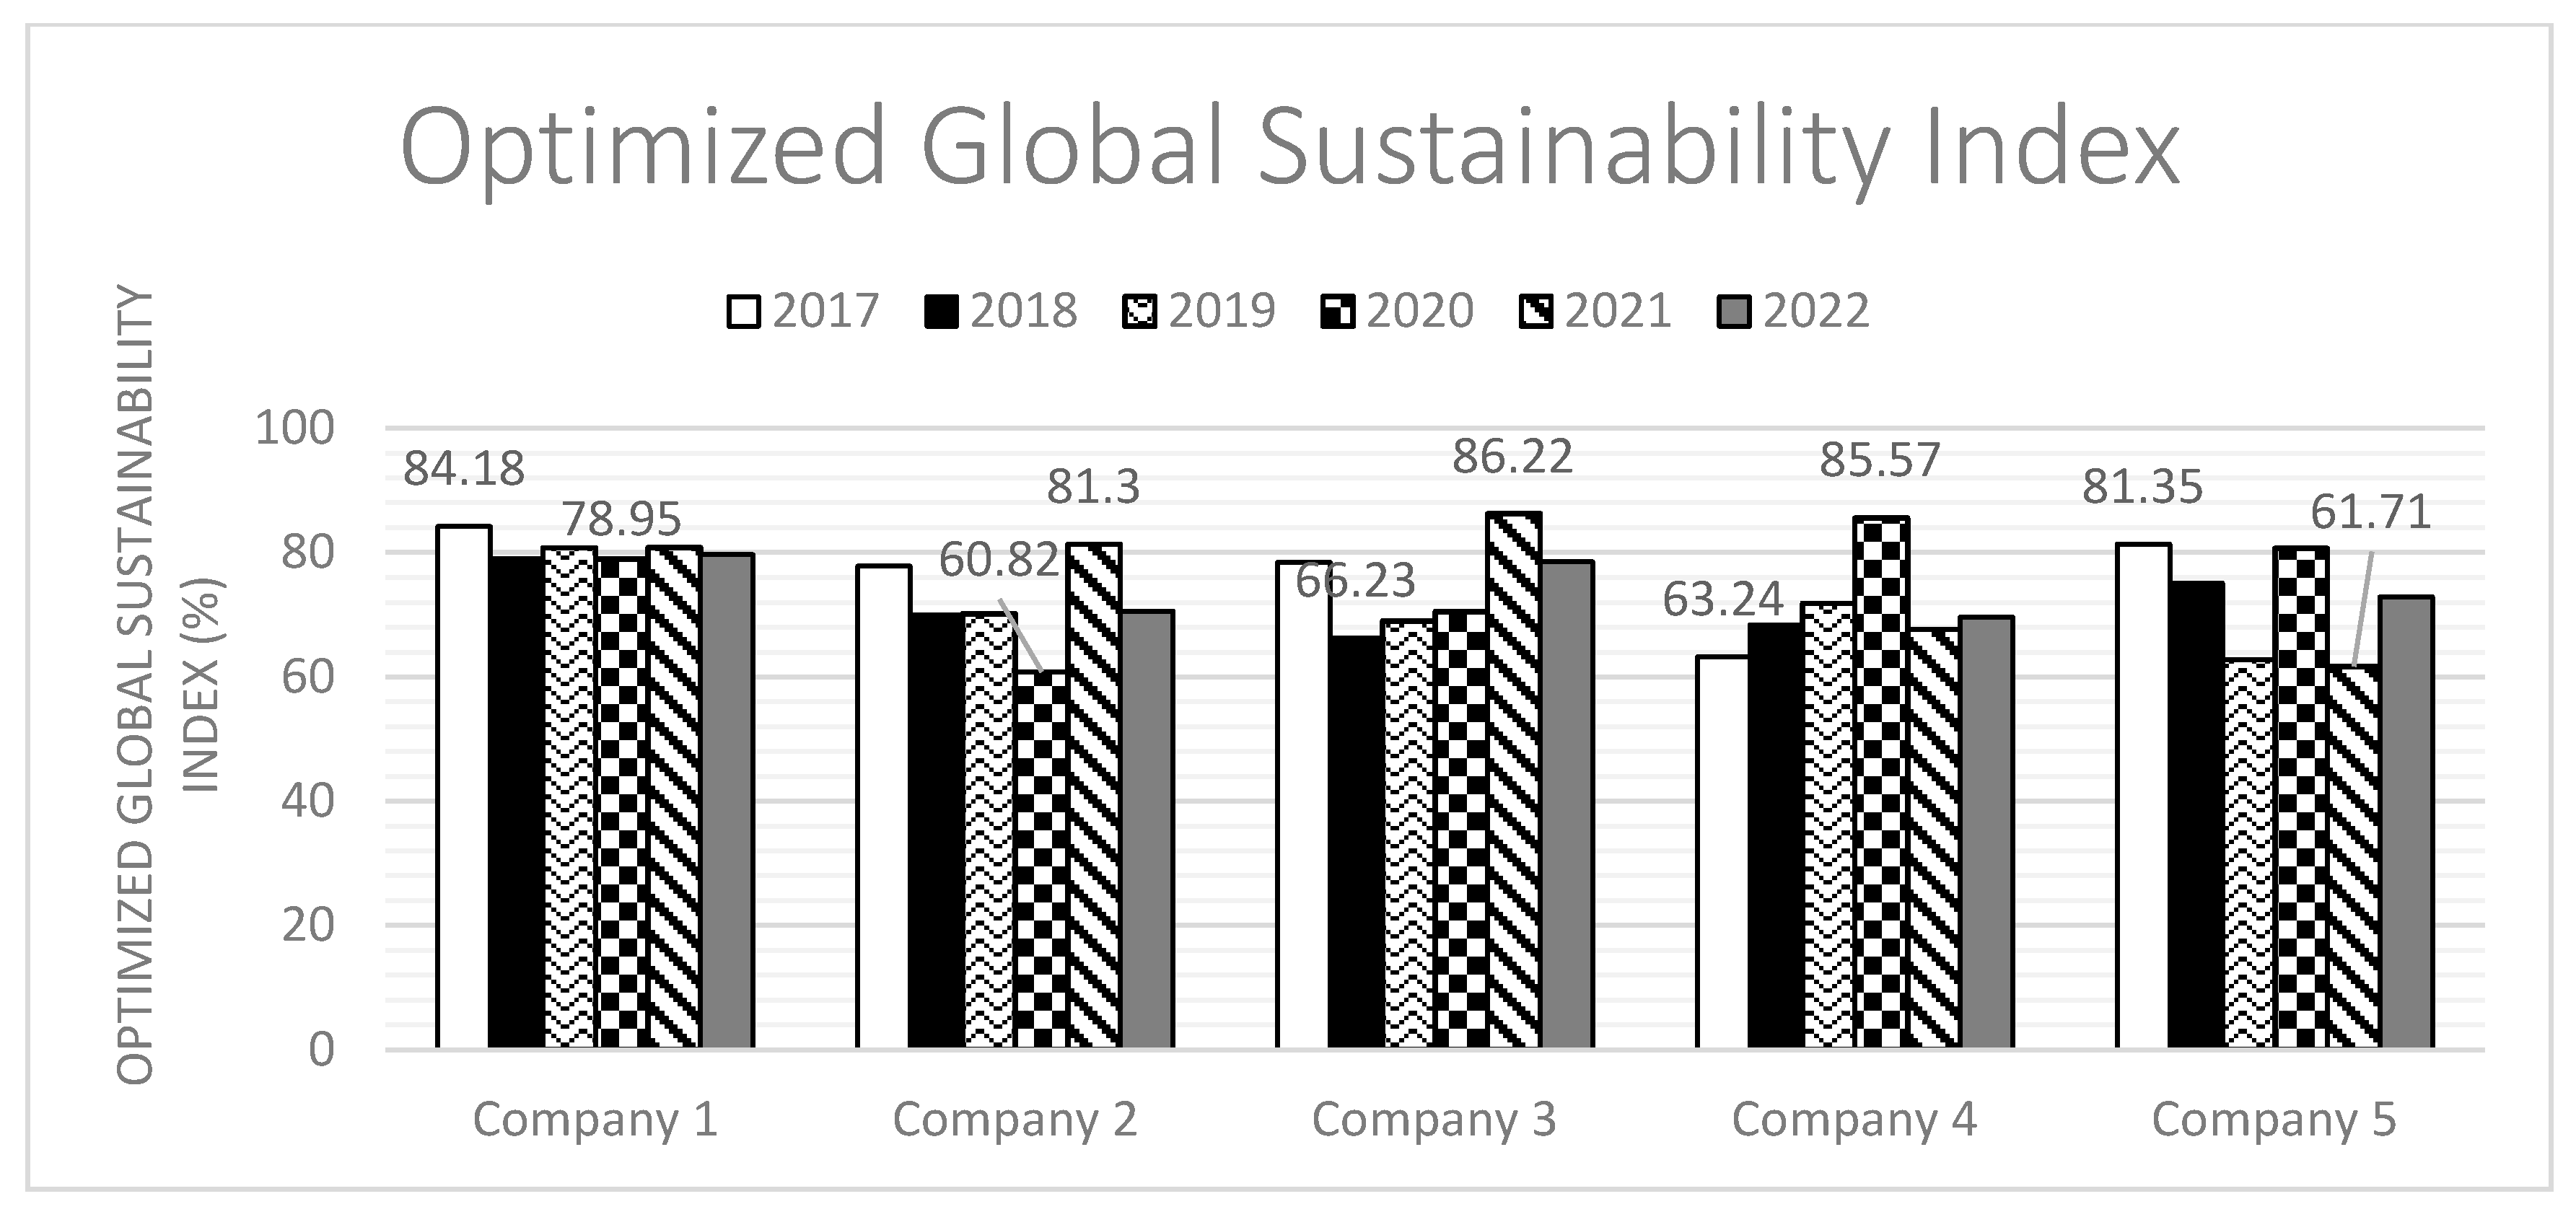
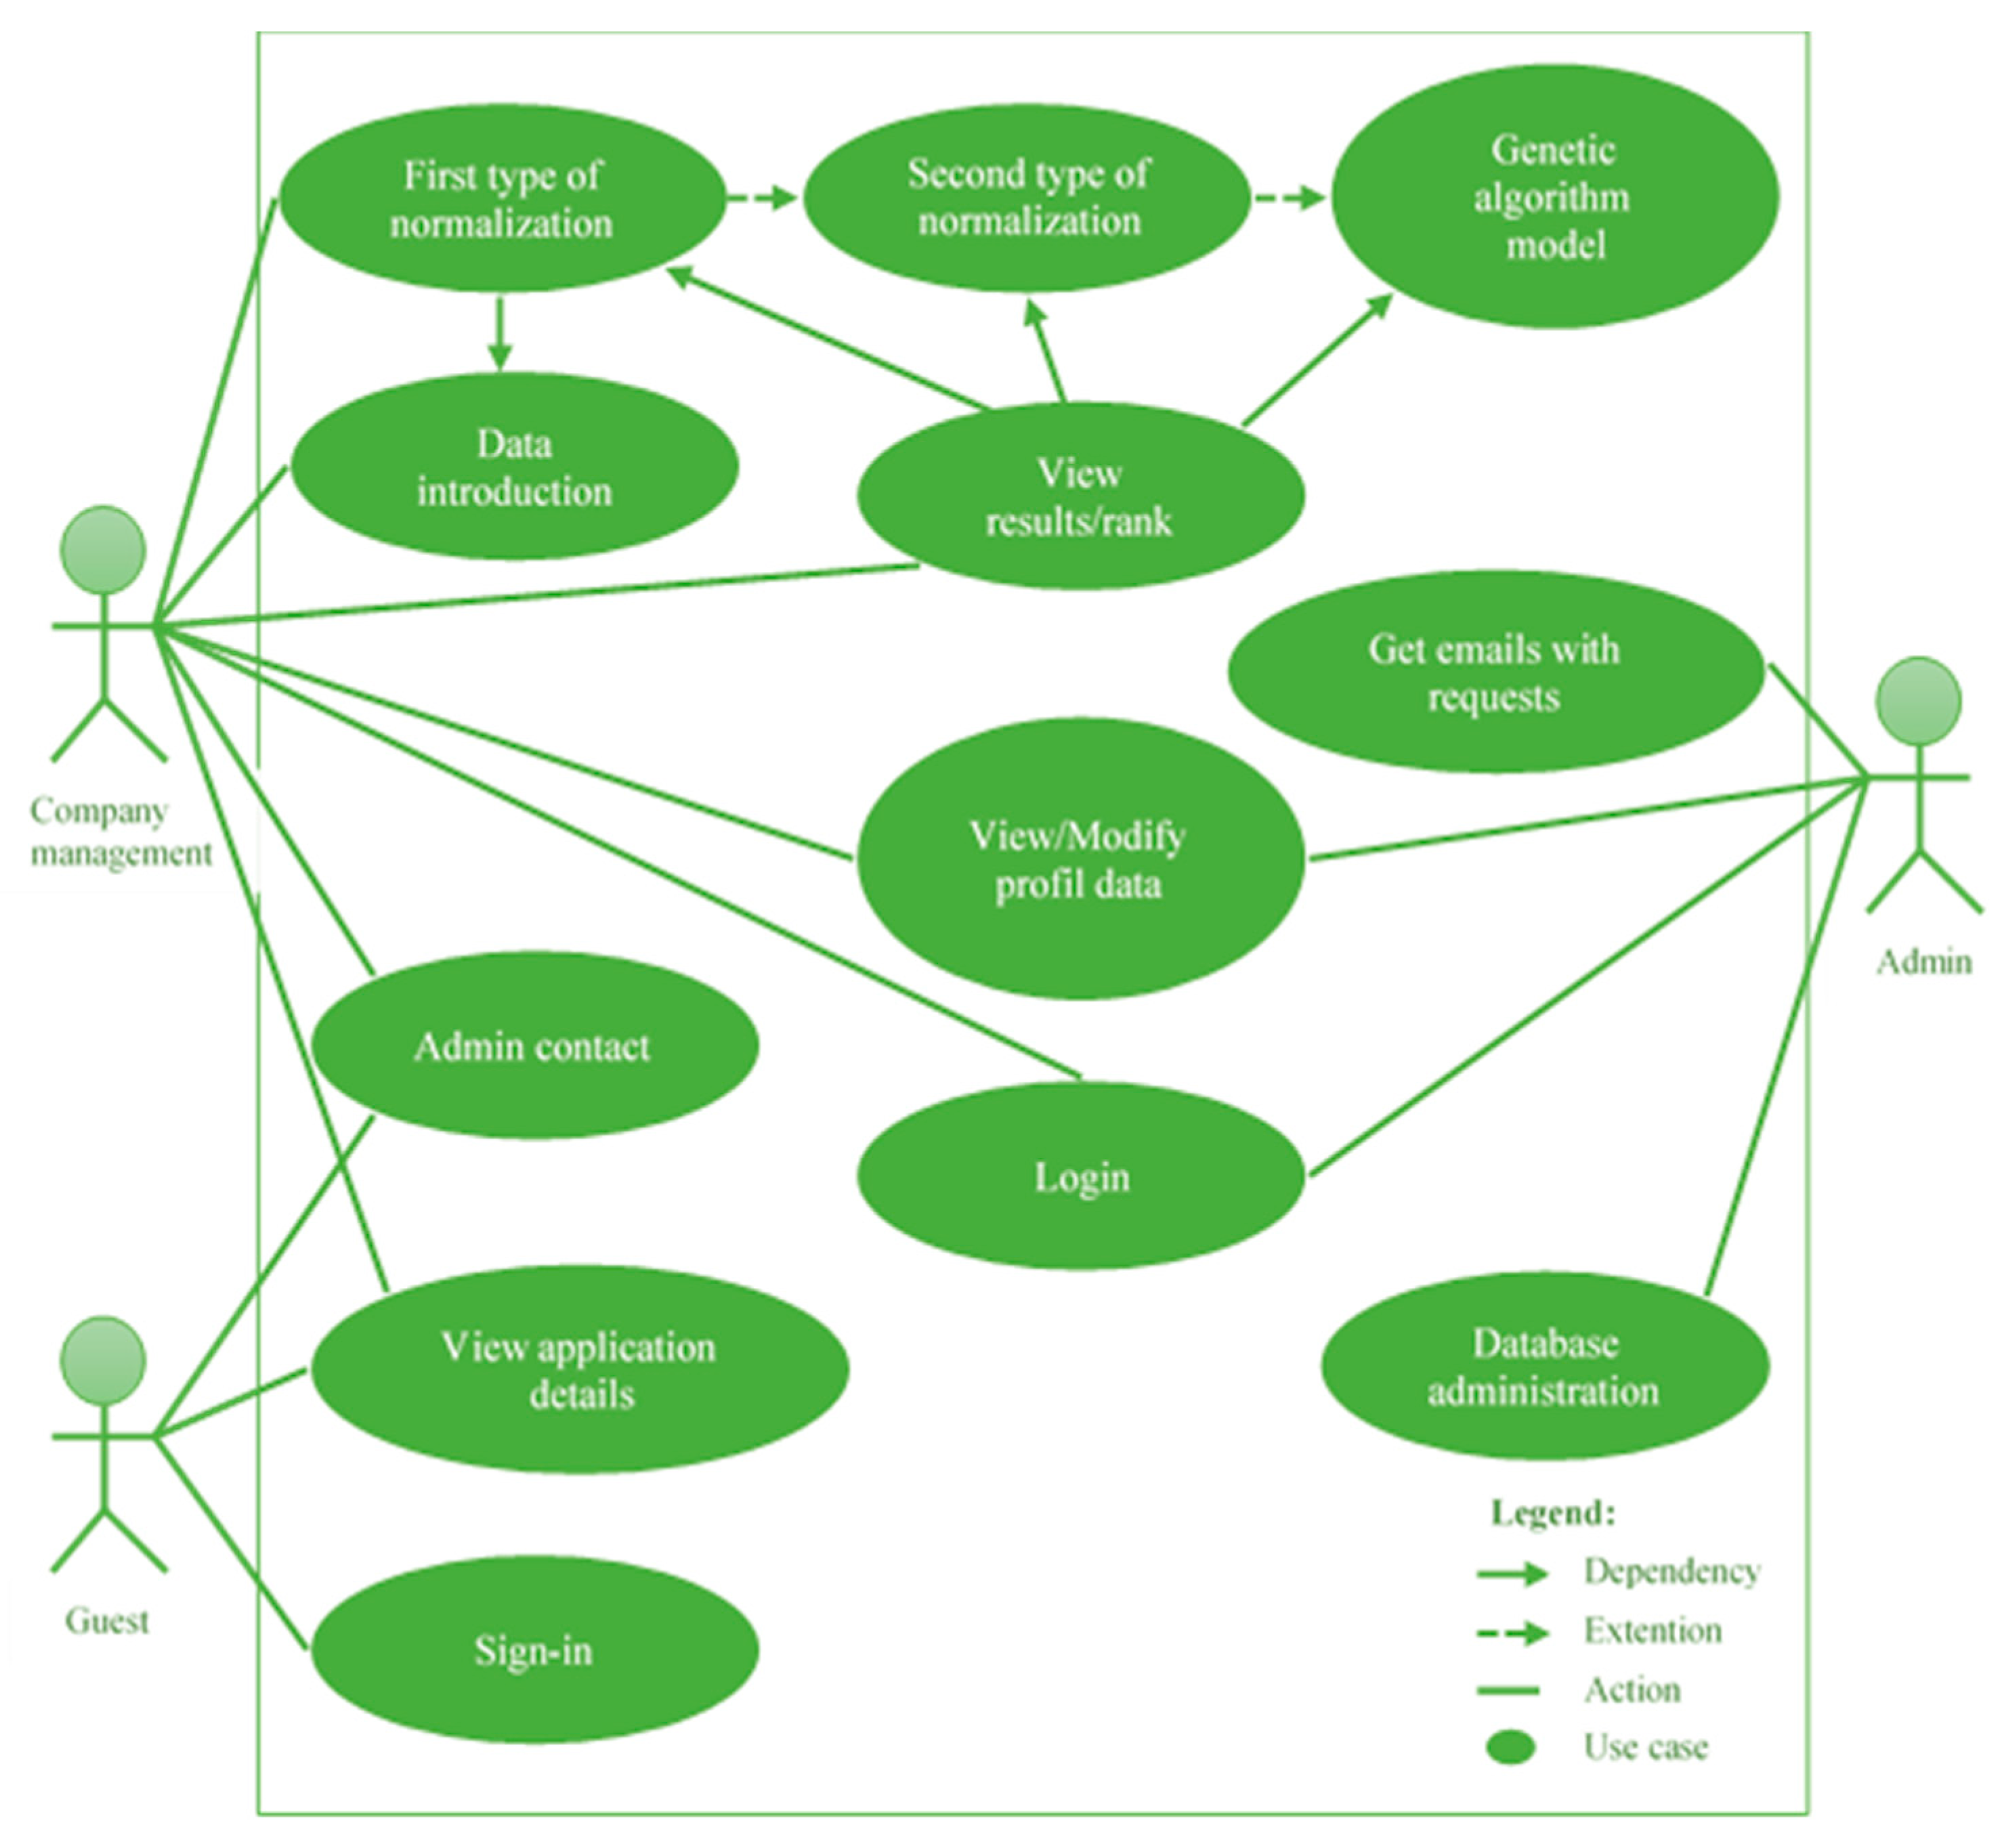
Table 1.
Selection criteria [60].
Table 1.
Selection criteria [60].
| Selection Criteria | Code |
|---|---|
| Costs | C1 |
| Environment impact | C2 |
| Social benefits | C3 |
| Employee implication | C4 |
| Complexity of intervention | C5 |
Table 2.
Relationships matrix [60].
Table 2.
Relationships matrix [60].
| Section Criteria | C1 | C2 | C3 | C4 | C5 | |
|---|---|---|---|---|---|---|
| Costs | C1 | 0.50 | 0.50 | 0.00 | 1.00 | 1.00 |
| Environment impact | C2 | 0.50 | 0.50 | 0.00 | 0.00 | 0.00 |
| Social benefits | C3 | 1.00 | 1.00 | 0.50 | 1.00 | 1.00 |
| Employee implication | C4 | 0.00 | 1.00 | 0.00 | 0.50 | 1.00 |
| Complexity of intervention | C5 | 0.00 | 1.00 | 0.00 | 0.00 | 0.50 |
Table 3.
Representation of a candidate—with generated values (decimal and binary representations).
| Year | Candidate | ||
|---|---|---|---|
| 2017 | 205 | 85 | 250 |
| 2018 | 204 | 65 | 245 |
| 2019 | 230 | 75 | 247 |
| 2020 | 224 | 72 | 254 |
| 2021 | 189 | 45 | 242 |
| 2022 | 225 | 55 | 239 |
| Year | Candidate | ||
| 2017 | 11001101 | 01010101 | 11111010 |
| 2018 | 11001100 | 01000001 | 11110101 |
| 2019 | 11100110 | 01001011 | 11110111 |
| 2020 | 11100000 | 01001000 | 11111110 |
| 2021 | 10111101 | 00101101 | 11110010 |
| 2022 | 11100001 | 00110111 | 11101111 |
Table 4.
Representation of a population with three candidates.
| Year | Candidate 1 | Candidate 2 | Candidate 3 | ||||||
|---|---|---|---|---|---|---|---|---|---|
| 2017 | 205 | 85 | 250 | 206 | 82 | 196 | 166 | 33 | 173 |
| 2018 | 204 | 65 | 245 | 155 | 69 | 192 | 220 | 59 | 250 |
| 2019 | 230 | 75 | 247 | 167 | 30 | 251 | 209 | 100 | 225 |
| 2020 | 224 | 72 | 254 | 179 | 71 | 253 | 214 | 52 | 181 |
| 2021 | 189 | 45 | 242 | 161 | 65 | 233 | 240 | 77 | 222 |
| 2022 | 225 | 55 | 239 | 171 | 48 | 226 | 205 | 31 | 210 |
Table 5.
Companies’ general characteristics.
| Company | Domain | Employees | Revenue | Area Served | Location of Facilities |
|---|---|---|---|---|---|
| Company 1 | Fashion | 57,016 | €21.915 billion | Worldwide | Africa (7 countries), Asia (23 countries), Australia and New Zealand, Europe (24 countries), America (14 countries) |
| Company 2 | Automotive | 400,100 | €78.5 billion | Worldwide | Africa (35 countries), Asia (55 countries), Australia, French Polynesia, New Zealand, Europe (38 countries), America (14 countries) |
| Company 3 | Automotive | 244,582 | €44.40 billion | Worldwide | Africa (6 countries), Asia (15 countries), Australia, Europe (28 countries), America (10 countries) |
| Company 4 | Mail order | 49,787 | €500,000 | 20 countries | Germany, Spain |
| Company 5 | Electronics | 46,000 | $9.56 billion | Worldwide | Africa (2 countries), Asia (12 countries), Australia, Europe (10 countries), America (3 countries) |
© 2020 by the authors. Licensee MDPI, Basel, Switzerland. This article is an open access article distributed under the terms and conditions of the Creative Commons Attribution (CC BY) license (http://creativecommons.org/licenses/by/4.0/).
Share and Cite
MDPI and ACS Style
Grecu, V.; Ciobotea, R.-I.-G.; Florea, A. Software Application for Organizational Sustainability Performance Assessment. Sustainability 2020, 12, 4435. https://0-doi-org.brum.beds.ac.uk/10.3390/su12114435
AMA Style
Grecu V, Ciobotea R-I-G, Florea A. Software Application for Organizational Sustainability Performance Assessment. Sustainability. 2020; 12(11):4435. https://0-doi-org.brum.beds.ac.uk/10.3390/su12114435
Chicago/Turabian StyleGrecu, Valentin, Radu-Ilie-Gabriel Ciobotea, and Adrian Florea. 2020. "Software Application for Organizational Sustainability Performance Assessment" Sustainability 12, no. 11: 4435. https://0-doi-org.brum.beds.ac.uk/10.3390/su12114435
Note that from the first issue of 2016, this journal uses article numbers instead of page numbers. See further details here.