Developing Citylab Post-Construction—A Swedish Certification System to Evaluate the Sustainability of Urban Areas


1
Sweden Green Building Council, Långholmsgatan 34, 117 33 Stockholm, Sweden
2
Department of Sustainable Development, Environmental Science and Engineering (SEED), KTH Royal Institute of Technology, SE-100 44 Stockholm, Sweden
3
Department of Urban and Rural Development, SLU Swedish University of Agricultural Sciences, P.O. Box 7012, SE-750 07 Uppsala, Sweden
*
Author to whom correspondence should be addressed.
Sustainability 2020, 12(11), 4454; https://0-doi-org.brum.beds.ac.uk/10.3390/su12114454
Submission received: 14 April 2020
/
Revised: 28 May 2020
/
Accepted: 29 May 2020
/
Published: 30 May 2020
(This article belongs to the Collection Indicators, Assessment Tools, and Rating Systems for Mainstreaming Sustainability in Urban Planning and Development)
Abstract
:This paper describes the development of Citylab Post-Construction, a Swedish certification system for evaluating the sustainability performance of urban areas in a post-construction phase once the area is inhabited. The process design was based on transdisciplinary and research-through-design approaches, and involved experts and practitioners within Swedish urban planning, real estate and construction sector. This paper is not highlighting the certification system per se, but rather the process of developing it, with the aim of increasing the understanding of such design processes. A previously developed, but so far untested, framework of key considerations for certification systems was used to clarify benefits and drawbacks of different design decisions. The framework was used in all steps of the process, from defining the overall structure, to selecting indicators, formulating detailed requirements and assessing comments of the open consultation of a draft version. The framework of key considerations proved useful in supporting this process, by highlighting conflicts as well as synergies and creating transparency with respect to trade-offs needed between being e.g., scientifically credible but still practical enough. While it is difficult to separate the framework from the process in which it was put to use, we believe that the framework can be supportive also in other processes, both for developing new certification systems or for refining and evaluating existing ones.
1. Introduction
An increasing share of the global population is living in urban areas [1], meaning that drivers of resource use are increasingly concentrated to cities [2]. Consequently, cities are widely recognised as providing opportunities to reduce environmental impacts at global scale [1,3], while also providing healthy living environments [1]. The growing importance of cities for sustainable development has led to formulation of global goals regarding sustainable cities [4,5] and local initiatives to monitor the sustainability of cities and communities [6,7,8,9]. Certification systems focusing on neighbourhoods have also been introduced, e.g., LEED for Neighbourhood Development, BREEAM Communities, CASBEE, etc. [10,11,12]. These certification systems were developed within different national contexts, but some are also promoted as international systems [12] and used accordingly [13]. How certification systems for urban sustainability are constructed, including choice of indicators, is crucial for their impact on the practice of sustainable urban planning [12]. Existing certification systems have been widely analysed regarding their structure and content, including use of criteria, scoring, weighting, different types of indicators etc., and consequences of such choices, e.g., bias towards ecological aspects of sustainability and vagueness of certification results due to too few mandatory indicators [10,11,12,13,14]. This critique shows a need for also analysing the process of developing certification systems, to better understand such processes, including trade-offs regarding benefits and drawbacks with different design decisions.
In the beginning of the 2010’s, Swedish actors in the urban planning, real estate and construction sector also started to see a need for a certification system for urban areas, and as a first step, the international version of BREEAM Communities (BREEAM-C) was tested in 22 different urban development projects. The process was initiated and driven by the Sweden Green Building Council (SGBC) [15,16]. However, there are several known difficulties with using certification systems in different countries and contexts [12,13,17] which soon surfaced in the testing of BREEAM-C, and the Swedish practitioners testing BREEAM-C found that it did not fit the Swedish urban planning context. Due to the differing legislative contexts in Sweden compared to UK, the planning process which BREEAM-C is built on does not fit the Swedish context. In addition, the types and levels of requirements did not mirror what was considered as best practice of sustainable urban development in Sweden. Thus, BREAAM-C was deemed to not provide the support needed for further sustainable urban development [15,16]. The practitioners called for a tool for creating a collaborative working process for actors throughout the urban development process, from vision to detailed planning, construction, and follow-up and evaluation post-construction [15,16]. In the end it was decided to instead develop a new certification system, with the Swedish context as starting-point. As a first step towards this, SGBC developed the “Guide for sustainable urban development” consisting of voluntary guiding parts and mandatory certification requirements for the planning phase [16,18]. SGBC also developed accompanying professional training courses, which together with the guide created an entire package called ‘Citylab’. However, Citylab still lacked a certification system focusing on follow-up and evaluation of the sustainability of urban areas post-construction [16]. The term post-construction of urban areas is used in this context with a similar meaning as the term post-occupancy of buildings, but with a wider scope to also include the use of outdoor space in an urban area. In 2017, the process of developing such a system begun.
In a previous article, a framework of key considerations for developing certification systems for sustainable urban areas was presented [19]. This paper continues on that work and describes how the framework was used to guide the development of the certification system ‘Citylab Post-Construction’. Using this process as an illustrative example, the aim of this paper is to increase the understanding of the design decisions involved in developing certification systems, how such a process could be designed, and how the previously developed framework can be put to use.
While the development of the framework of key considerations has been reported in detail elsewhere [19], it forms such an important part of the development process so that omitting it entirely from this paper would have made the process hard to follow. Thus, the article starts off with a brief introduction to the framework in Section 2. Section 3 presents the methodological approach applied and the process used to develop Citylab Post-Construction. Section 4 comprises a detailed chronological description of development of Citylab Post-Construction. Section 5 summarises key lessons and reflects on the process of developing Citylab Post-Construction.
2. Background to Development of Citylab Post-Construction
2.1. A Framework for Developing Certification Systems for Urban Sustainability
The first step in the development of Citylab Post-Construction was to see what we could learn from previous studies on how to develop certification systems. However, we found that despite the existence of a wide range of research on sustainability indicators (e.g., [6,7]), and the structure, content, and use of certification systems for urban sustainability (e.g., [12,13]), there was a lack of research on the process of developing certification systems. Thus, we started off by constructing a framework of our own, comprised by key considerations for when developing a certification system for urban sustainability. The process of the developing the framework is presented in detail in [19], so here we just provide a summary. We based the framework on existing research on certification systems (e.g., [11,12]), local indicator sets for cities (e.g., [6]) and communities (e.g., [8]), and on sustainability indicators in a broader context (e.g., [20,21,22]). The overarching aim of the framework was to support a development process that allowed for transparency and active decision-making, and that helped to identify both conflicts and synergies. Table 1 presents the resulting framework.
The framework first defines three benefits a certification system should provide in order for it to be used and useful in furthering urban sustainability: (1) There must be benefits to the organisation using the certification as a marketing tool (e.g., a municipality, real estate owner(s) or developers); (2) It must provide benefits to practitioners who use the certification system in supporting strategic and structured sustainability work; and (3) it must provide benefits to the urban area by making it more sustainable.
The framework then defines three main principles, with several subprinciples, which the certification system needs to deliver in order to provide the benefits. Principle 1 concerns scientific credibility of the system, it includes comprehensiveness, i.e., the system must cover all relevant sustainability aspects. Furthermore, aspects must be handled in an integrative way and with high validity and reliability. Principle 2 states that the certification system must be practical, i.e., it needs to be intelligible and simple for those using it, by not including too many indicators or demanding expensive investigations. It also relates to selecting sustainability aspects and indicators for which the organisations using the system have influence over. Principle 3 concerns that the certification system should drive change, by defining the level of performance considered sustainable or good-enough and by guiding stakeholder discussions on sustainability ambitions, priorities and possible actions. The system should also include a variety of indicators for monitoring cause-and-effect chains, and should present results in a way that enable action to be taken. The third and overriding part of the framework is that, in order to comply with these principles, stakeholder and public participation is essential.
These three principles and their subprinciples together make up what could be seen as a ‘wish-list’ for the perfect system. However, some of these (sub-)principles are in conflict, for example those on validity and influence. Validity in this context means choosing indicators that are close to the end-problem, e.g., an indicator that measures people’s health, rather than features in the urban environment that are important for human health. However, urban planning has little influence over people’s health compared with other factors, but high influence over features in the urban environment which can support health, e.g., walkability and greenery. Because of such conflicts, the choices required in development of a certification system must be based on finding a balance and sometimes prioritise between the (sub-)principles. The (sub-)principles can thus be regarded as coordinates in a design space that permits different outcomes, depending on how the (sub-)principles are prioritised. The way such conflicts were handled in the process of developing Citylab Post-Construction is elaborated on in Section 2.2 and Section 4.
2.2. Four Alternatives for Citylab Post-Construction According to Practitioners
One first step to get a better understanding of how the conflicts could play out in practice was to interview urban development practitioners (municipalities, construction companies, real-estate owners) what they though should be followed up in a post-construction phase regarding sustainability, and what of such a follow-up should be reviewed and assessed by a third-party certification organisation. This was an important first step in defining what role and function the system could have. As with the framework, the interviews are presented in detail in [19], and in this paper we only provide a summary by presenting four distinct alternatives for what the respondents thought that Citylab Post-Construction should assess. The alternatives are:
- (1)
- Focus on sustainability performance: The certification system reviews and assesses whether the urban area is sustainable in relation to the criteria set up by the system.
- (2)
- Focus on what was built: The certification system reviews and assesses whether planned measures to strengthen sustainability have been implemented in the urban environment.
- (3)
- Focus on what was learnt: The certification system reviews and assesses whether the stakeholders involved have drawn important learnings from being involved in the project and identified what they will do differently when working with sustainability in future projects.
- (4)
- Focus on operation and maintenance: The certification system reviews and assesses whether the operation and maintenance continue to strive for the sustainability objectives set in the planning phase.
3. Methodology and Process of Developing Citylab Post-Construction
3.1. Methodological Approach
The development of Citylab Post-Construction was based on research through design (RtD), where knowledge is gained primarily through the “making of an artefact with the intended goal of societal change” [23]. This is quite different from conventional approaches to research aimed at describing or analysing aspects in the past or present to find what is generally applicable. Design-based approaches are instead future-oriented, aiming at inventing something new (e.g., a product, service, or product-service-system) which might be very context-specific [24]. In that way, design-based research is quite similar to technological science (see [25]), although usually uses a multidisciplinary combination of methods and data. In the process of developing a certification system, knowledge can be gained that would not be achievable by merely analysing a system or process from an outside perspective. Koskinen et al. describes it as follows: “When researchers actually construct something, they find problems and discover things that would otherwise go unnoticed. These observations unleash wisdom, countering a typical academic tendency to value thinking and discourse over doing.” [26] (p. 2) RtD can also generate theory, not only regarding how and why design is done but also how design should be done [23], in the present case regarding certification systems for sustainable urban areas.
RtD is a methodological approach, i.e., an “attitude to doing work” [23] (p. 311), rather than a certain set of methods or a certain process. The methods and processes used should always be tailored to the specific project, making RtD a useful approach in the issue-driven and interdisciplinary research needed to develop a certification system for the complex case of sustainable urban development. The methods used in the present work include document analysis, interviews, focus groups, workshops and interviews. Design research principles typically also include an emphasis on the importance of working iteratively and of involving potential future users [23,24], both of which were present in the process of developing Citylab Post-Construction. As designers and managers of this process, we researchers played an active part that can be described as head designers of the certification system. Development and testing of the framework promoted continuous reflection on the ongoing process by identifying conflicts between principles and raising consequences of different design decisions, i.e., the principle/s we prioritised in each decision taken when designing the certification system.
3.2. The Development Process
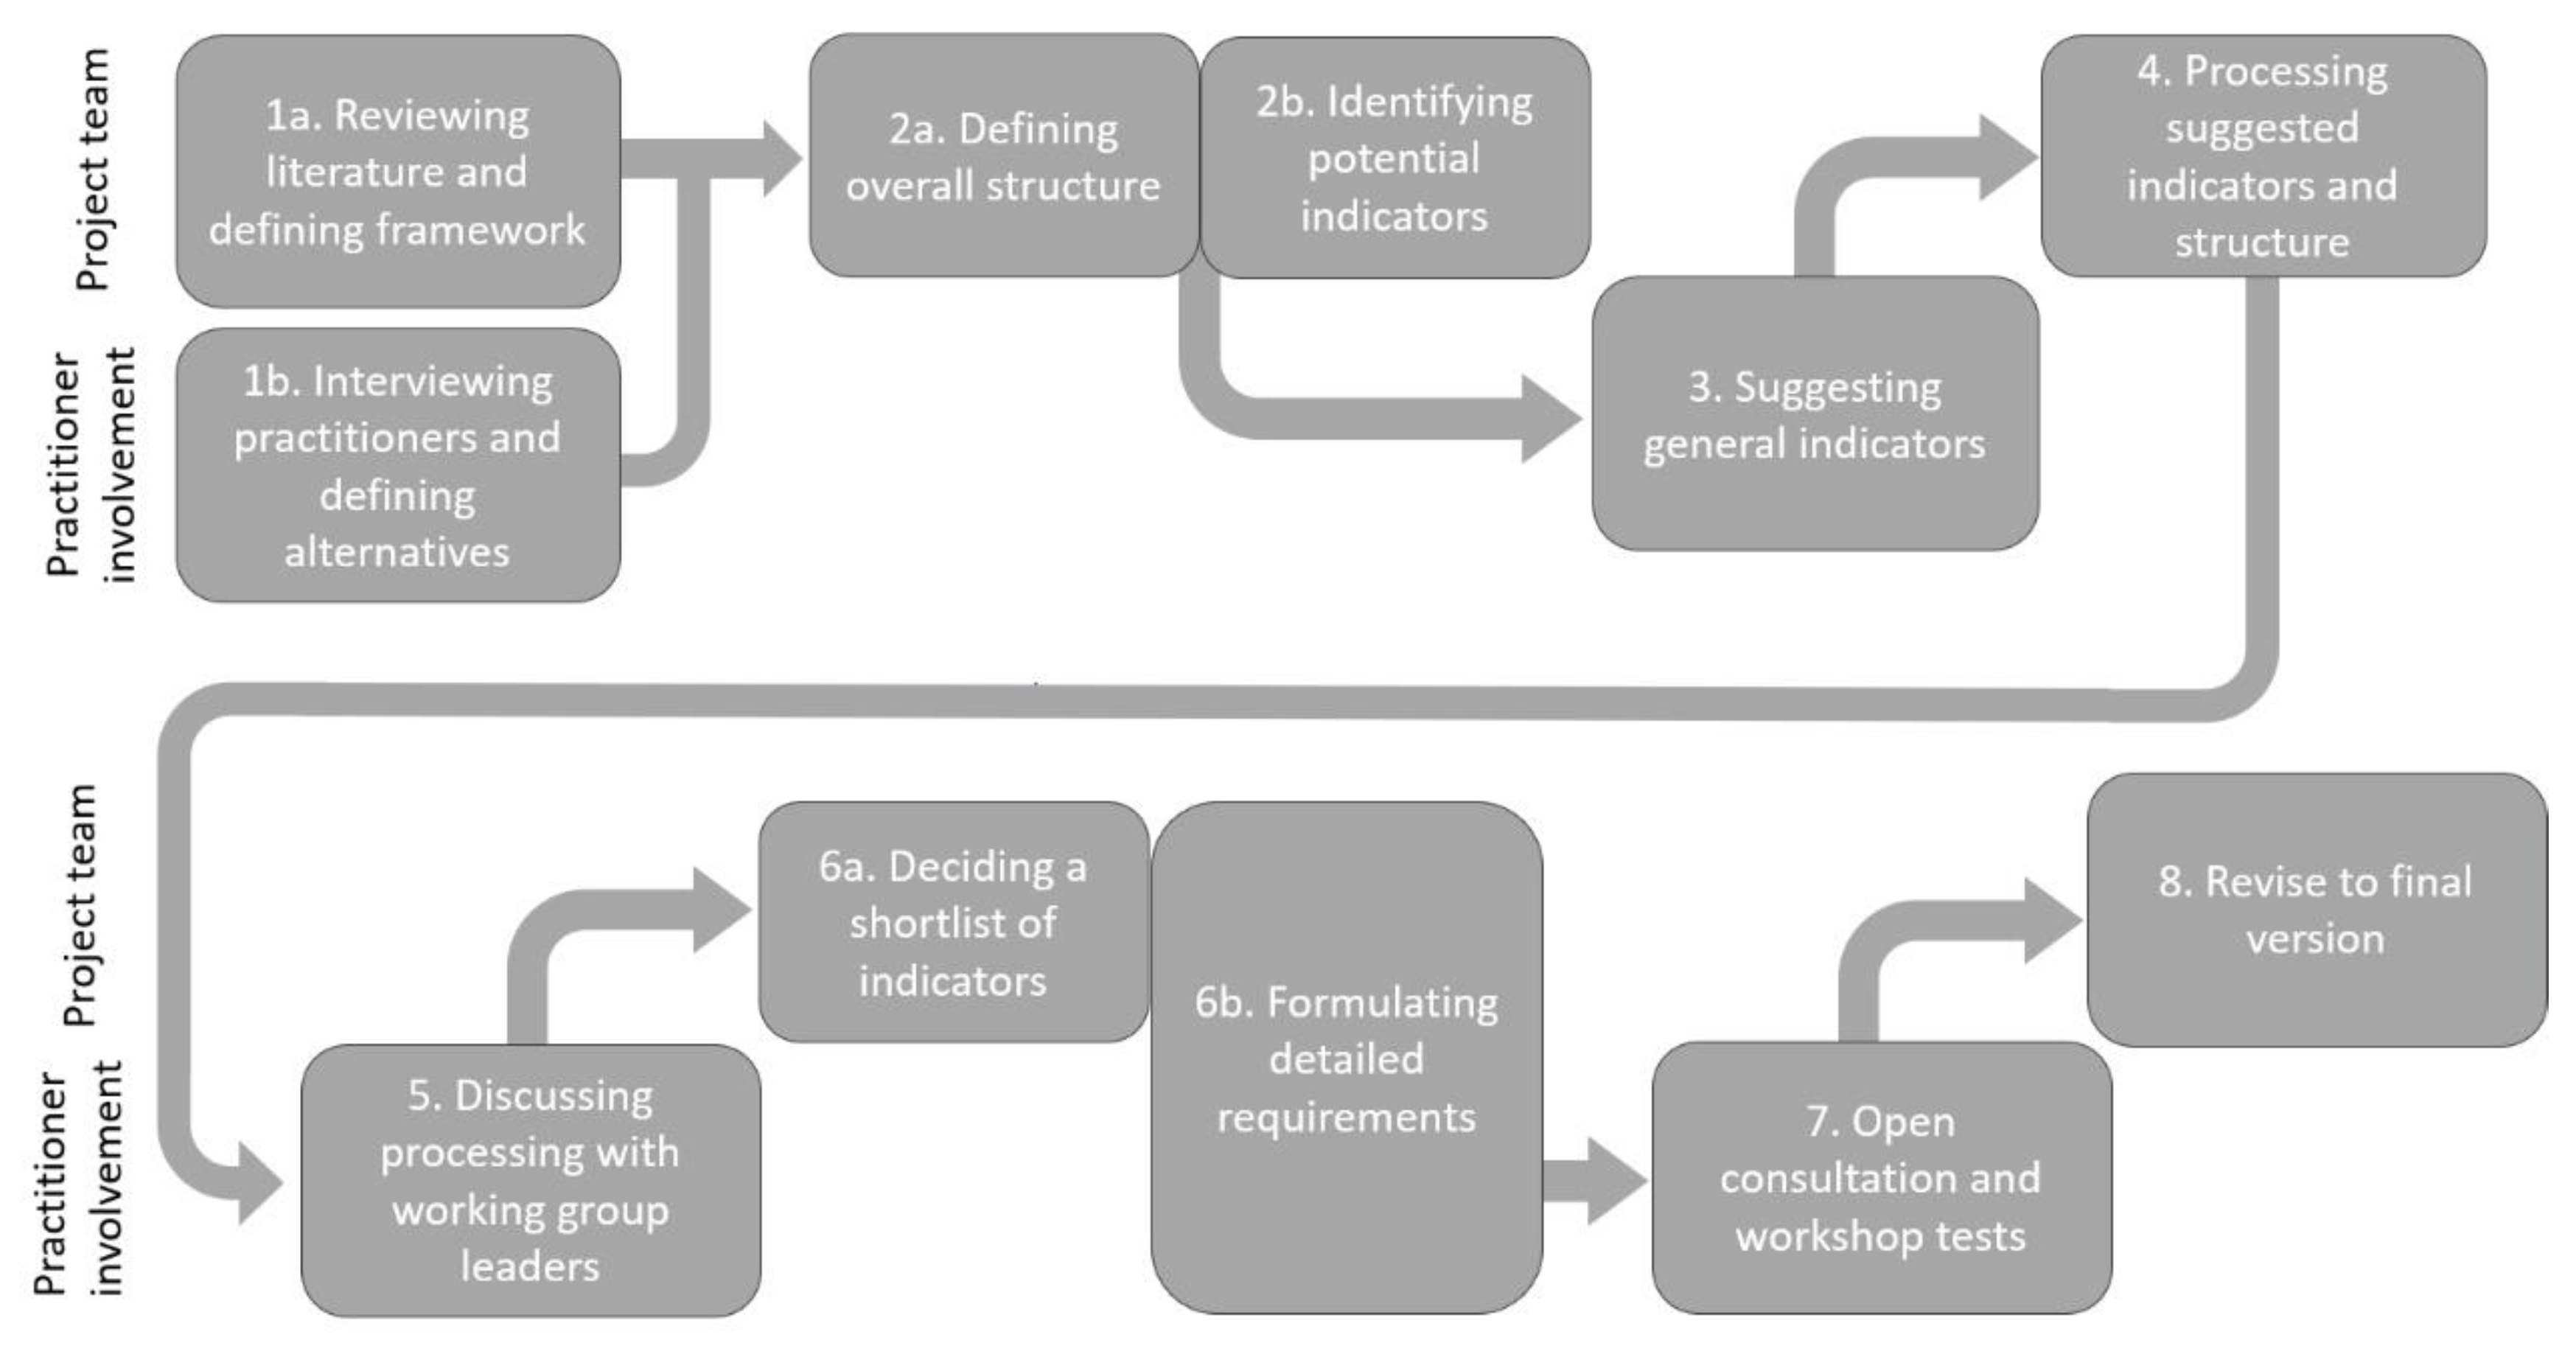
The development process of Citylab Post-Construction comprised eight steps, with the structure and content of the certification system becoming more detailed with each step. The process is summarised in Figure 1. The previously defined framework and alternatives served as starting points (steps 1a and 1b). Based on that, the overall structure of the certification system (2a) and a list of potential indicators (2b) were defined. These were then presented to thematically organised working groups of practitioners, who were asked to suggest indicators to be included in the certification system based on the list om potential indicators (3). After processing the suggestions in the project team (4) and with working group leaders (5), a shortlist of indicators was decided on (6a). With the help of additional experts, more detailed requirements regarding criteria and methods for collecting data were developed for each shortlisted indicator (6b). The suggested indicators, together with criteria and data collection methods, were compiled to a suggested beta-version of the certification system, which was then evaluated through an open consultation and workshop tests on the proposed certification system (7). Based on feedback from the open consultation and workshop tests, the system was revised and the final version of Citylab Post-Construction could be formulated (8). Thus, the process included steps with practitioner involvement and steps where the project team either prepared for the next practitioner involvement (e.g., 2b) or processed an earlier involvement to generate new ideas (e.g., 4). In step 6b, the details of each indicator were worked on mainly by project team members, with support from practitioners and other experts outside the project team.
This iterative approach facilitated continuous reflection on, and revision of decisions made early in the process as their consequences became clear when formulating details in the system. A reference group of 12 representatives from real-estate owners, developers and municipalities were invited to provide comments on six occasions during the process (steps 1b, 2a, 6a, 6b, 7 and 8). On each occasion the reference group was informed on what challenges the project team was facing, and benefits and drawbacks with different decisions were discussed. Reference group members provided comments, new ideas and perspectives, ultimately contributing to making the design decisions more informed and better anchored in industry priorities.
4. Developing Citylab Post-Construction
In this section the process of developing Citylab Post-Construction is fleshed out. Concepts from the framework of key considerations are written in italics to facilitate cross-referencing between the framework and the process.
4.1. Defining the Overall Structure of the Certification System
The overall structure of the certification system (step 2a) was created following a discussion about the relations between (sub-)principles in the framework and the four different alternatives for what the system could focus on. This soon made it evident that the four alternatives represented different priorities between the conflicting principles validity and influence. According to the Swedish practitioners taking part of the testing of BREAAM-C, assessment of whether implemented measures improve sustainability performance is one of the components lacking in BREEAM-C [24] and was identified as a desirable component of a Swedish system [27]. There is also a need to ensure that high sustainability ambitions early in urban development projects actually achieve sustainability outcomes (discussed by [28,29,30,31]. Moreover, there is a general lack of certification systems for urban sustainability that addresses sustainability performance [12,17]. Thus, we decided to prioritise validity over influence.
Relating this to the four alternatives, this decision meant that Citylab Post-Construction was to be developed primarily in line with alternative 1 “Focus on sustainability performance”, as it includes high validity through its focus on defining a good-enough level for the urban environment, rather than focusing on what the stakeholders involved have/have not done (alternatives 2-4). However, we did not want to neglect influence completely, as that would risk resulting in a system no-one was willing to use, so we maintained the balancing act between validity and influence throughout the development process and sought to strengthen influence at later stages.
Another subprinciple with substantial impact on the overall structure of the certification system was comprehensiveness, i.e., to include sustainability aspects of both local and global relevance. This was a tricky balance to strike, and in the end, we came up with a design suggestion that includes two kinds of indicators in the system: (1) general indicators for use in all urban areas in Sweden, and (2) site-specific indicators that highlight sustainability aspects of local importance. The general indicators define a good-enough level of sustainability performance and are mandatory for all urban areas seeking to be certified, preventing credit-chasing, an aspect criticised with other systems [10,11,12]. For the site-specific indicators, the certification system includes criteria for how these are developed for each urban area, including a participatory approach with a bottom-up perspective and with specific local conditions in mind. This provides a more comprehensive assessment and also supports the subprinciple guiding a discussion between the different stakeholders as well as the overriding requirement of stakeholder and public participation.
Furthermore, the subprinciple of including different kinds of indicators was found to be of fundamental relevance to deal with early in the process. Niemeijer and de Groot [20] suggest including indicators that track all parts of cause-and-effect chains, i.e., driving force, pressure, state, impact and response (DPSIR). However, this quickly increases the number of indicators and risks making the certification system difficult to comprehend and expensive to use [21], thus going against the principle of that the system should be practical. Since we had already prioritised validity over influence, we saw a risk of the system becoming too biased towards scientific credibility. To balance this, we deemed it important to this time prioritise the principle of the system being practical. In practice, this meant that we decided to aim for the sub-principle of simplicity and not use the DPSIR approach.
The last aspect to consider in creating the overall structure was how the results of the assessment should be presented. For example, BREEAM Communities and LEED for Neighbourhood Development award one aggregate score. CASBEE Urban Development awards two scores, one reflecting the ‘internal sustainability’ of the area assessed and one the ‘external sustainability’, or external load, of the area. The main benefit with such approaches is that the result is easy to communicate and that they facilitate benchmarking. Aggregated results are thus intelligible [7], at least in a superficial way. But there are also drawbacks, such as that the aggregation of sustainability aspects into one index obscures the real meaning of the score and also that risk promoting credit-chasing [10,11,12,21]. This counteracts the subprinciples of presenting the result in a way that enables action and scientific credibility. The German system, DNGB, instead uses a radar diagram, as also suggested in [21]. With less aggregation of different sustainability aspects and clear presentation, a radar diagram helps present the result in a way that enables action and guide a discussion between the different stakeholders. By prioritising these last principles, we decided that each general indicator in Citylab Post-Construction would have a baseline level which all urban areas need to fulfil in order to become certified. The result presentation will therefore be in the form of a radar diagram similar to Figure 2. Thus, the Citylab Post-Construction avoids aggregated/weighted scoring or grading.
4.2. Identifying Potential Indicators
The process of indicator selection was framed by Citylab’s sustainability goals (Table 2), as defined in the Citylab “Guide for sustainable urban development” [18]. This guide was developed with broad stakeholder involvement of about 400 people from the urban planning, real estate and construction sector in Sweden, to define what sustainable urban development would currently and contextually mean in Sweden, based on both national sustainability goals and UN’s sustainable development goals [16]. These goals define the long-term vision for urban development projects in Sweden, and thus form the link between the Citylab guide, which focuses on the planning phase, with Citylab Post-Construction. As the goals are broadly formulated, they are to be seen as key sustainability aspects or categories for contemporary urban planning in the Swedish context, and there are several possible indicators that could be used to assess the performance of an urban area with regard to each goal.
To identify appropriate indicators, potential indicators (step 2b) were harvested from about 40 different international (e.g., UN Sustainable Development Goals), national (e.g., Sweden’s Environmental Quality Objectives) and local (e.g., monitoring sustainability aspects of municipalities and urban areas) sources. Using these international, national and local sources contributed to the principle of being comprehensive. However, not all indicators listed in the sources had a clear connection to urban development. Citylab’s Guide for sustainable urban development was used for judging what sustainability aspects are related to urban development. Indicators excluded because of this include those similar to “average grades in elementary schools”. The process resulted in around 1200 individual indicators, which were grouped into around 100 categories of indicators measuring a similar aspect of sustainability. Table 3 shows an excerpt from the list.
4.3. Practitioner Suggestions for General Indicators
In the next step (step 3), we brought urban planning practitioners in Sweden together in working groups to get their suggestions on general indicators to include in the certification system. This was the most collaborative part of the project, with a number of interdisciplinary practitioners involved.
4.3.1. Establishing the Working Groups
Four working groups, involving in total 22 practitioners, were tasked with formulating general indicators to measure sustainability performance in an urban area. Practitioners were recruited through open calls on SGBC’s website and newsletters, and mainly represented consultancy and architectural firms, but also developers, one municipality, one real-estate company, one university and the Swedish Environmental Protection Agency. The uneven allocation was because some goals were expected to demand more work than others, and also because some sustainability goals had more in common than others, implying a possibility of using one indicator for more than one sustainability goal.
4.3.2. Preparing for the Working Groups
The working groups were instructed to decide on the most important sustainability aspects to measure through indicators (maximum of five) for each of their assigned sustainability goals. This meant that the groups had to discuss how to comply with the subprinciple of being comprehensive and at the same time with the subprinciple of simplicity by not including too many indicators. The groups were also introduced to the identified conflict between validity and influence and encouraged to discuss aspects they saw as relevant to measure in order to get high validity, but without causing too little influence. The groups were also asked to consider other subprinciples of importance for the formulation of indicators, i.e., how to make the indicators intelligible and simple and achieve high reliability.
Besides instructions for the work, the working groups were also given the list of potential indicators described in Section 4.2. One reason for this was to provide inspiration, but the main reason was to facilitate using data and/or data collection methods that are already in use, as this would make data collection cheaper, thus contributing to simplicity. Using proven methods can also be a way to increase scientific credibility, as these can be assumed to have high reliability.
4.3.3. Work Process in Working Groups
All working groups used the list of indicators as a starting point and eliminated indicators in several rounds of discussions until there were about 3–5 indicators per sustainability goal. However, on a few occasions, the working groups felt that important sustainability aspects were absent from the list and either formulated new indicators or modified and combined indicators from the list to better capture that sustainability aspect. To support the working groups and facilitate sharing of ideas between the groups, at least one representative from the project team was present at every group meeting. The representative primarily played a passive role, asking questions to make statements and arguments more explicit and answering questions from the group members regarding the project. This made it possible to follow the discussions and understand the thoughts behind the suggested indicators, while still giving the practitioners scope to influence the process and results.
4.4. Processing Suggested Indicators to a Final List
4.4.1. Categorising Suggested Indicators
In total, the working groups suggested 45 indicators. These were processed by the project team to identify overlaps and check whether they were in line with the overall structure of the certification system and with each other (step 4).
One insight gained at this stage was that the working groups had come to different conclusions regarding the balance between validity and influence. Group 1 claimed that it would not be relevant to measure the health of the residents, even if that would give high validity, and instead suggested indicators focused on aspects that stakeholders have more influence over, i.e., enabling conditions in the outdoor environment to have a healthy life, such as good possibilities to use a bicycle and good access to services. Group 4, on the other hand, deemed it important to measure how the urban environment is actually used and thus suggested indicators with high validity, but lower influence, such as how much drinking water is used and how much household waste is recycled.
To get a deeper understanding, the suggested indicators were analysed and categorised based on how much they contributed (or not) to validity and influence (Table 4). Some indicators, like energy use, had both high validity and high influence. Other indicators focused on features implemented in the urban area where stakeholders have a high level of influence, e.g., proportion of impermeable ground, but with low validity in terms of measuring low flood risk and purification of stormwater. Some other indicators had high validity and low influence, for example perceived safety, which is affected by more than the urban design, but is still an important aspect to address with urban design.
4.4.2. Discussion of Categorisation with Working Group Leaders
The two leaders for each working group were invited to a workshop (step 5) to discuss the categorisation of indicators made by the project team. It became evident that environmental sustainability aspects are often easier to measure on a performance basis with high validity, while still retaining a high level of influence, than social sustainability aspects. Social sustainability aspects tend to be more complex in relation to their root-causes, exacerbating the conflict between validity and influence. Thus, the certification system needs to include different indicator types for different sustainability aspects. One suggestion was to determine a good-enough level for some indicators and not for others, i.e., not demand a certain performance level regarding indicators with low influence. However, this means that indicators with a determined good-enough level risk being prioritised higher than indicators without such a level, even if the sustainability aspects are equally important. For example, all urban areas would need to be energy-efficient, since that is possible to measure, but would not need to have recreative green spaces, simply because that is more difficult to measure with both high validity and influence. Another option discussed was whether the certification system should have good-enough levels at all, in order to treat all sustainability aspects in the same way. However, the certification would then assess whether relevant information has been gathered, rather than assessing whether the sustainability goals have been met.
Following this discussion, the working group leaders and the project team prioritised indicators through a voting process. The prioritisation was based on two considerations, the importance of the aspect addressed by the indicator for urban areas and whether the aspect is handled satisfactorily in most urban areas in Sweden today.
4.4.3. Deciding a Shortlist of Indicators
To create a shortlist of indicators (step 5), the project team continued to process the indicators based on the discussions and prioritisations in the group leader workshop. One conclusion from the work was that indicators with low influence often, but not always, do not measure the consequences of urban planning, but can still be relevant to inform the future development of an urban area, e.g., economic status of residents and share of children living in poverty. This insight provided important feedback to the overall structure of the certification system and helped to clarify that the focus of the system was on assessing sustainability aspects that could be addressed by urban planning and design, rather than providing a complete understanding of an urban area.
Some indicators were excluded because they were judged to be better dealt with on another scale than that of an urban area, and were thus not under the influence of the intended goal group. For example, access to locally grown food or emissions of nutrients are primarily regional or national concern and not issues handled on an urban area level. There were also some indicators that overlapped in respect of the sustainability aspect addressed and could therefore be excluded, thus making the system more simple. Identifying such connections between indicators also helped make the certification system more integrative. The majority of indicators shortlisted connected to more than one of the Citylab sustainability goals (Table 5).
4.5. Formulating Detailed Requirements
The next step in the process (step 6b) was to develop the indicator aims in Table 5 regarding three decisions: (1) the scope of the criteria, i.e., what should be measured, quantitatively or qualitatively, in order for the aim to be fulfilled, e.g., what pollutants should be measured to assess air quality. (2) The level of performance considered as a good-enough level, e.g., how much of measured pollutant(s) in the air is acceptable. (3) The method(s) that should be used for making the assessment, e.g., whether the pollutant should be measured using field measurements or computer modelling. The process of narrowing down the aims of each indicator to specific criteria was primarily done by the project team, but in close cooperation with experts from e.g., Swedish Environmental Protection Agency, Swedish Meteorological and Hydrological Institute, the National Board of Housing, County Governments etc. which are all important stakeholders as official monitoring and expert authorities regarding sustainability aspects. Officials working at municipalities, consultants and researchers deemed to represent best practice were also involved to comment on what was formulated. The work also comprised desk-based reviewing of laws, research projects, government reports and guidelines etc.
4.5.1. Considerations When Formulating Criteria for Certification
When formulating the criteria, it became evident that there were two main balancing acts between conflicting (sub-)principles. In one, the criterion had to be comprehensive in relation to the defined aim, but at the same time simple. In the other, the criterion had to have a good-enough level that could drive change towards sustainability, but at the same time be influenceable (achievable). As an example of the first balancing act, many kinds of air pollutants can be measured and having indicators for all these would increase the comprehensiveness. However, requiring all air pollutants to be measured would decrease the simplicity substantially. In the second balancing act, for the system to drive change, the defined good-enough level of air pollutants should be low, but there is an inflection point where the defined level becomes so difficult to reach that it risks making the certification system less attractive to use. As guidance in these balancing acts, we decided to make use of politically or otherwise agreed societal goals. For several indicators, there were quantitatively defined societal sustainability goals, while for other indicators, we identified industry-specific agreements or best practice or data on national averages (see Table 6).
An example of a societal sustainability goal used as reference was the Environmental Quality Objectives of Sweden [32]. Regarding air quality, nitrogen dioxide and particle levels are more likely to be exceeded in Swedish cities [33]. The good-enough level for air quality was based on the Environmental Quality Objectives.
An example of an industry-specific agreement is the New Urban Agenda [5], which we used to define the indicator ‘Places’ and the good-enough level regarding, e.g., share of free public space. Another example of an agreement that we drew on, this time to develop the indicator for climate impact, was Fossil-Free Sweden [34], which sets strategies for making different industrial sectors in Sweden fossil fuel-free by 2045.
Best practice was used as reference when we could not find any societal sustainability goals or agreements to use. For example, in some municipalities the demands on flood risk management or purification of stormwater are quite ambitious and replicating those demands in Citylab Post-Construction would widen their use. Basing the requirements on ambitions formulated earlier by the industry itself increases the chances of the indicator being perceived as practical. In these specific examples, the criterion for purification of stormwater is based on the requirements set by the City of Stockholm [35] and the criterion for flood risk management follows the regional requirements in different parts of Sweden, e.g., [36,37], and suggested legal requirements by the National Board of Housing [38].
For indicators where urban planning was deemed as having low influence, national averages were used as reference when defining the good-enough level, e.g., how many feel safe walking alone late at night. Using national averages is a compromise between comprehensiveness and influence, because important aspects are included but with a low level of demand, mirroring the level of influence and gaining acceptance for including such sustainability aspects.
4.5.2. Considerations When Choosing Methods for Indicator Assessment
When deciding the assessment methods to prescribe for each indicator, the key concern was to make the assessment as simple as possible without losing reliability. For some indicators for which enough trustworthy statistical data already exist and only need to be compiled, this is less problematic, although it is important to be aware whether data are trustworthy and up-to-date. This includes statistics which a municipality, real estate owner or energy supplier has already compiled, e.g., energy use in buildings mapped through implementation of the EU Energy performance of buildings directive.
For other indicators, new data may need to be gathered, which must be done at a low cost. For example, air quality and noise field measurements were judged too costly, i.e., not simple enough. Model calculations were judged as reliable, and by approving the use of simpler freeware under certain conditions, the certification system will not generate unnecessary costs. Another example is use of questionnaires for some assessments, e.g., regarding whether people feel safe and travel behaviours. Here, a conflict emerges since the reliability of a questionnaire is dependent on a large number of respondents, while simplicity relies on a small number of respondents.
To increase the reliability of model calculations of purification of stormwater and flooding risk, it was judged that they should be combined with site visits, to confirm the accuracy of certain aspects in the models. Site visits were also included for other indicators when a qualitative assessment of the urban environment and green spaces was needed. To assure reliability in such qualitative assessment, detailed instructions were needed and e.g., a Swedish standard for natural value inventory [39] was used for biodiversity.
For all indicators, the reference used to define the good-enough level impacted the choice of method. For example, to compare a value for an urban area against a national average or national Environmental Quality Objective, the same method would need to be used, e.g., questions used to assess experienced safety should be the same as in the national survey by the Swedish National Council for Crime Prevention [40].
4.6. Open Consultation, Workshop Test and Final Version
For a final evaluation of the suggested certification system, including indicators, SGBC invited its member organisations to submit written comments in an open consultation (step 7). Responses were obtained from a total of 25 organisations representing different parts of the urban development sector, e.g., developers, real-estate companies, consultancy and architect firms, energy suppliers and municipalities.
One group of comments focused on sustainability aspects missing, including aspects which the working groups had not prioritised, and thus not included, and also aspects which were fully or partly covered by other indicators. An example of the latter is some aspects of ‘Acoustic environment’, which are included in the indicators ‘Places’ and ‘Indoor environment’. This shows the importance of clearly demonstrating how indicators relate to the sustainability goals. Other comments concerned the good-enough level defined for each indicator and included suggestions that the good-enough level should be more context-based to ensure that the urban area complements the greater city. Some commented that the levels were not demanding enough, particularly for indicators where the level defined was based on national averages because of low influence. However, while an individual indicator might be “too easy” for some urban areas, the challenge lies in meeting the criteria for all indicators, simultaneously and in the same area.
In two workshops with people from outside the project, the indicators were tested on two urban areas. The tests were based on rough estimates, but gave more insights on the availability of data and need for clearer instructions. They also confirmed some of the comments from the open consultation.
The open consultation and workshop tests were constructive ways to get feedback on the proposed system, particularly on issues of key importance for the system to be perceived as credible and practical by the main target groups. The outcomes of the open consultation and workshops were discussed within both the project team and reference group. Based on the reasoning presented throughout this paper regarding each step and decision, it was decided that no new indicators should be included, but changes were made within some indicators, e.g., perceived safety was extended to include children. For some missing indicators mentioned in the public consultation, a complementary mapping was included when they were of high influence for urban planning, but it was still difficult to set a good-enough level, e.g., mapping of unutilised excess energy was added to the indicator “Energy use in buildings”.
The final version of the certification system is available in Swedish at the homepage of Sweden Green Building Council [41].
5. Discussion with Concluding Reflections
This paper unfolds the process of developing Citylab Post-Construction, to evaluate the sustainability performance of urban areas in Sweden. The paper focuses on the development process and lessons learnt from this process which future similar processes can use, rather than the end product with its many details. The main certification criteria of Citylab Post-Construction are presented in Appendix A to provide concretisation and clarification regarding the result of the process. Thus, the idea is not that Citylab Post-Construction should spread and be implemented in other countries than Sweden, but to provide new knowledge on how such a certification system can be developed. With that said, parts of the certification system or the overall structure might be useful also in other contexts, if known difficulties with using a certification system in a new context [12,13,17] can be overcome.
The paper is a continuation of earlier research presented in another paper [19], and thus uses the framework (Table 1) constructed in [19], to gain understanding of key considerations when developing a certification system for sustainable urban areas.
As stated in [19], the framework does not aim to make choices easier, but to clarify choices to be made and their consequences for design and functionality of the certification system. This is argued to increase transparency on key considerations and thus enables stakeholder participation in decisions taken [19]. Applying the framework in developing Citylab Post-Construction confirmed that it fulfils this function. In each step in the development process, presented in this paper, the framework supported and reminded us to consider principles and conflicts between principles that might otherwise be overlooked. This had a clear effect on the process, in that it supported reflection, debate and iterations, and thus possibly on the resulting system. Some conflicts between principles or subprinciples reappeared in several steps of the process, e.g., valid vs. influenceable and comprehensive vs. simple, as these are relevant to consider when setting the overall structure, when selecting indicators and when formulating criteria. These conflicts could not be handled by making an initial prioritisation between principles and adhering to that. Instead, it was important to be aware of the principles, and thus understand the implications of each choice made and consider how to prioritise or balance principles in each decision. Thus, these conflicting principles dominated the discussions throughout the whole development process. Other conflicting principles were handled ‘once and for all’, e.g., the conflict between simplicity and including different kinds of indicators, where it was decided early that the certification system would not track cause-and-effect chains. However, with other choices made early in the process, other conflicts might have recurred throughout the project. By using the subprinciples to motivate and explain decisions taken throughout the development process, the decisions taken become more transparent and explicit; both for us in the project and in external communication. Even if the framework was developed for the specific case of developing Citylab Post-Construction its generality enables use in similar development processes, no matter the geographic or cultural context. The framework could also be used in future research to analyse existing certification systems. It can thus enable a more general discussion on the fundamental ideas, logic and priorities on which different certification systems are built, and thus also a general discussion on what should be prioritised in different types of certification systems and in different contexts.
To understand the consequences (i.e., what principles get prioritised) with different designs of the overall structure, the four alternatives presented in Section 2.2 were important. The differences between the alternatives show that it was not obvious from the start what the role and function of the certification system should be. By formulating the alternatives, different possible roles and functions became clearer, which in turn made it possible to make a deliberative decision on the kind of certification system to be developed. Thus, the alternatives acted as the foundation for the coming design process, not only regarding what Citylab Post-Construction would be (alternative 1), but also what it would not be (alternatives 2–4). Without this foundation, it would have been difficult to be consistent throughout the iterative research process, with the many people involved, regarding the purpose of the certification system, and consequently what kind of indicators to include. In the development of other certification systems, it is recommended to formulate similar alternatives regarding the role and function the certification system. The alternatives presented in this thesis can be used and elaborated on in such work, but new alternatives can also be developed.
As the framework points out, involvement of different stakeholders is important to balance the conflicting principles [19]. To ensure an anchored proposal, co-production with a large number of stakeholders was prioritized in the development of Citylab Post-Construction. This included the workshops to develop Citylab “Guide for sustainable urban development” [16] (including formulating Citylab’s sustainability goals), interviews to develop the alternatives [19], working groups to suggest indicators, experts interviewed regarding specific indicators, open consultation and workshop tests of draft versions of the certification system and the reference group following the whole development process. Through this process of involving different people from different stakeholders in numerous ways, each design decision got reviewed from different perspectives which helped to reduce bias from a certain stakeholder group or a single person. Both the framework and the alternatives helped in this work by functioning as heuristic devices and sources of joint terminology, facilitating communication and deliberation. Based on these experiences, we believe that without the framework and alternatives, the design of the certification system would have been much more difficult to explain, motivate and understand and would most possibly have resulted in a different end-product. At the same time, there are other difficulties with stakeholder participation that is left without guidance in the framework, e.g., lack of time from participants which is essential to creating a deep understanding of principles, alternatives and their implications. When developing Citylab Post-Construction, we derived great benefit from working with SGBC, as this provided a good network of stakeholders and an established model for setting up working groups, reference groups and open consultations. The members of the working groups all came from SGBC member organisations, which helped legitimise use of work time in developing the system. The group leaders also got some of their work paid for by SGBC. The involvement of practitioners is however a risk as it may result in a system which is too practical or built on what consultants see as future potential business opportunities. Therefore, importance was placed on the involvement of individuals from the field of academia in this process, as well as transparency in regard to the reasoning behind each criteria, what indicators are included, and what overarching sustainability goals the work is based on, which is not always clear for these kinds of certification systems.
The final verdict on whether the certification system has a good balance between principles and thus provides the intended benefits, will not be revealed until the certification system is used. There may be unforeseen issues to clarify, simplify or regulate, or other changes to be made. Use of the system in practice will also reveal whether assumptions about what is scientifically credible and practical enough and what drives change in a sustainable direction were correct. As some indicators currently do not define a sustainable level, e.g., climate impact, some levels will need to be raised over time to drive change.
To make the design decisions (and reasoning behind them) available to future users and other stakeholders, these were summarised in a background report [42], published in Swedish and easily retrievable from the Citylab website. The report presents arguments on the design of the overall structure, selection of indicators and formulation of criteria in more detail than what is possible in this type of paper. The background report also presents alternative structures and indicators that were excluded, as well as the reasons for their exclusion.
Author Contributions
Conceptualization, J.L.; methodology, J.L.; investigation, J.L., T.M. and J.W.; writing—original draft preparation, J.L.; writing—review and editing, J.L., T.M. and J.W.; supervision, T.M., J.W. All authors have read and agreed to the published version of the manuscript.
Funding
This research was funded by FORMAS—A Swedish research council for sustainable development, grant number 942-2015-140.
Conflicts of Interest
The authors declare no conflict of interest. The funders had no role in the design of the study; in the collection, analyses, or interpretation of data; in the writing of the manuscript, or in the decision to publish the results.
Appendix A
Appendix A.1. Safety
- 1.1.
- A maximum of 25% of women and men, respectively, state that they feel insecure when walking alone late at night in the urban area.
- 1.2.
- A maximum of 15% of children, aged 10–15, state that they feel unsafe when walking alone in the urban area.
Methods to use for the indicator: Questionnaire survey including at least 100 people for each category (women, men and children) living, working or going to school in the urban area.
Appendix A.2. Trustful Community
- 2.1.
- A maximum of 10% of residents in the urban area state that they do not trust other people living in their neighbourhood.
Methods to use for the indicator: Questionnaire survey including at least 100 people living in the urban area.
Appendix A.3. Places
- 3.1.
- At least 15% of the total area of the urban area is public free space.
- 3.2.
- At least 80% of the residential and nonresidential buildings in the urban area have access to the following:
- Place for social interaction outdoors within 200 m.
- Quiet and peaceful place within 200 m.
- Place for movement and exercise within 500 m.
- Walkable paths within the urban area.
- 3.3.
- At least 80% of the residential buildings in the urban area also have access to the following:
- Playground within 200 m.
- Large flexible green space within 500 m.
- Greater nature area (e.g., nature reserve) within 2500 m.
- Outdoor place with flow of people within 500 m.
- Place indoors without obligation for commerce within 1000 m.
- Cultural offerings within 500 m.
Methods to use for the indicator: Criteria 3.1 is investigated through desktop investigation using maps of the urban area. Criteria 3.2 and 3.3 are investigated by a trained architect through site visits.
Appendix A.4. Service Range
- 4.1.
- At least 80% of residential buildings in the district have access to the following basic level of various forms of public and commercial service:
- a.
- Supermarket within 500 m.
- c.
- Preschool within 500 m.
- d.
- Elementary school within 1000 m.
- e.
- Service for repairing, sharing or reusing within 1000 m.
- b.
- Package pick-up and drop-off within 1000 m.
- f.
- Pharmacy within 1000 m.
- g.
- Medical centre, hospital, dentist or similar within 1000 m.
- h.
- Public toilet within 1000 m.
Methods to use for the indicator: Desktop investigation using maps of the urban area, with possibly complementary site visits.
Appendix A.5. Mixture of Dwellings
The dwellings in the urban area consist of:
- 5.1.
- At least 10% with one room and a kitchen.
- 5.2.
- At least 20% with two rooms and a kitchen.
- 5.3.
- At least 20% with three rooms and kitchens or more.
- 5.4.
- At least 25% of tenant owned or owner-occupier dwellings.
- 5.5.
- At least 25% rental dwellings.
- 5.6.
- At least 12.5% rental dwellings with a rent per m2 corresponding to a maximum of the following percentage of the average rent for newly produced rental housing in Sweden:
- 85% in Greater Stockholm;
- 80% in Greater Gothenburg;
- 75% in municipalities with more than 75,000 inhabitants;
- 60% in municipalities with less than 75,000 inhabitants.
- 5.7.
- At least 2.5% rental dwellings with a rent of maximum SEK 950/m2, year (adjusted according to the CPI from 2018).
Methods to use for the indicator: Desktop investigation using statistics from official sources.
Appendix A.6. Acoustic Environment
The urban area has a maximum of 50 dBA daily equivalent sound level and a maximum of 70 dBA maximum sound level at:
- 6.1.
- Preschool, elementary and secondary schools.
- 6.2.
- 80% of patios (including balconies) adjacent to housing.
If a dwelling has access to several patios adjacent to the building (for example, a balcony and a common patio on the courtyard), only one has to be silent enough.
Methods to use for the indicator: Desktop investigations using computer simulations, with possibility to use simplified calculations in uncomplicated contexts with low risks of noise.
Appendix A.7. Air Quality
The air within the urban area reaches at most the following threshold levels:
- 7.1.
- Nitrogen dioxide: hourly average value of more than 60 µg/m3 may not exceed 175 times per year.
- 7.2.
- Nitrogen dioxide: annual average value of 20 µg/m3 or lower.
- 7.3.
- Particles PM10: daily average value of more than 30 µg/m3 may occur no more than 35 times/year.
- 7.4.
- Particles PM10: annual mean of 15 µg/m3 or lower.
Methods to use for the indicator: Desktop investigations using computer simulations, with possibility to use simplified calculations in uncomplicated contexts with low risks of polluted air.
Appendix A.8. Indoor Environment
- 8.1.
- At least 80% of all buildings (calculated in heated area, Atemp) are certified or have had a municipal supervision which included an approved assessment on the indoor environment.
Alternatively, a survey has been conducted which shows that 80% of residents and/or workers state they have an ‘acceptable’ indoor environment.
- 8.2.
- At least 80% of all buildings (calculated in heated area, Atemp) have measured radon levels below 100 Bq/m3.
- 8.3.
- At least 80% of all new buildings (calculated in heated area, Atemp), completed after 1 January 2020, can show that environmentally and health hazardous substances only exist to a limited extent.
- 8.4.
- Floor mats with DEHP are not used in pre- and primary school buildings, or alternatively very low values of DEHP have been measured.
Methods to use for the indicator: Criteria 8.1 is investigated through certifying buildings or having the municipality make supervisions of buildings. Alternatively, a questionnaire survey is conducted, including at least 100 people living, working or going to school in the urban area. Criteria 8.2 is investigated through site measurements. Criteria 8.3 and 8.4 are investigated by using a logbook of materials used.
Appendix A.9. Residual Waste
- 9.1.
- The amount of residual waste from households in the urban area is maximum 110 kg per person, per year.
Or if there are more nonresidential buildings in the urban area:
- 9.2.
- The amount of household-like residual waste from businesses is measured.
- 9.3.
- The amount of waste sorted as combustible from operations in the urban area is measured.
Methods to use for the indicator: Desktop investigations using statistics from waste contractor.
Appendix A.10. Travel Habits
The proportion of trips with sustainable modes of transport (expressed in person kilometres) made within Sweden by people living and working in the urban area is at least:
- 10.1.
- 65% for urban areas in municipality group A1.
- 10.2.
- 35% for urban areas in municipality groups A2 and B3.
- 10.3.
- 20% for urban areas in municipality groups B4, B5, C6 and C8.
- 10.4.
- 10% for urban areas in municipality group C9.
Municipal group is based on size of municipality and closeness to major city.
Methods to use for the indicator: Questionnaire survey including at least 100 people living, working or studying in the urban area.
Appendix A.11. Energy Use in Buildings
- 11.1.
- At least 80% of the buildings (calculated in heated building area, Atemp) are low-energy buildings, which means energy class B for buildings completed 1 January 2020 or later, and energy class C for buildings completed before 1 January 2020.
- 11.2.
- Surplus energy in the urban area and its vicinity is mapped.
- 11.3.
- Opportunities for collaboration between stakeholders in the urban area regarding energy storage, energy balancing and load management are mapped.
Methods to use for the indicator: Criteria 11.1 is investigated through statistics from the implementation of EU EPBD (energideklarationer). Criteria 11.2 and 11.3 are based on a collaborating discussion between stakeholders within the urban area.
Appendix A.12. Climate Impact
- 12.1.
- Climate impact from the construction phase of new residential buildings in the urban area:
- is mapped for at least 80% of the buildings completed after 1 January 2020 (calculated in gross area);
- on average less than 14 tonnes of CO2e/inhabitant, for buildings completed after 1 January 2020.
- 12.2.
- Climate impact from the construction phase of new nonresidential buildings in the urban area:
- is mapped for at least 80% of the buildings completed after 1 January 2020 (calculated in gross area);
- on average less than 290 kg CO2e/m2 gross area, for buildings completed after 1 January 2020.
- 12.3.
- Climate impact from energy use in the operation of residential buildings is less than 250 kg CO2e/inhabitant and year.
- 12.4.
- Climate impact from energy use (excluding operational electricity) in nonresidential buildings is less than 6 kg CO2e/m2 Atemp and year.
- 12.5.
- Climate impact (CO2e) from public consumption and from municipally procured activities in the urban area from the following is mapped:
- food;
- operational electricity;
- transport fuel;
- infrastructure investments (e.g., roads and squares) completed after 1 January 2020.
- 12.6.
- Climate impact (CO2e) from consumption-related emissions from residents of the urban area is mapped and compared with the national average.
Methods to use for the indicator: Criteria 12.1 and 12.2 are investigated through life cycle assessments in the planning phase of new buildings. Criteria 12.3 and 12.4 are investigated through statistics from indicator 11 and statistics from the energy supplier. Criteria 12.5 is investigated through calculations based on statistics from the municipality. Criteria 12.6 is investigated through a questionnaire survey including at least 100 people living, working and studying in the urban area.
Appendix A.13. Biodiversity
- 13.1.
- Two inventories of values for nature conservation (in accordance with SS 199000: 2014), with at least three years in between, show that natural value classes 1, 2 and 3 have retained their classification or received a higher classification.
- 13.2.
- Two analyses of the green structure within and around the urban area, with at least three years in between, show that the ecological distribution to and from the surrounding area has been maintained or strengthened.
Methods to use for the indicator: Investigations of the values and green structure are made by trained ecologist, including site visits.
Appendix A.14. Stormwater Purification
- 14.1
- Stormwater flowing over impermeable surfaces is purified according to local requirements applicable at the time of construction.
If there are no local requirements, stormwater flowing over impermeable surfaces (completed after 1 January 2020) should be delayed and cleaned so that the urban area can manage to store at least 20 mm of rainfall in such a way that the stormwater is purified by more extensive purification than sedimentation (e.g., infiltration).
- 14.2
- The need for purifying stormwater that flows over all impermeable surfaces in the urban area has been mapped.
Methods to use for the indicator: Desktop investigations using computer simulations; if special measures are taken in the urban area these should be validated through site visits.
Appendix A.15. Flood Risks
- 15.1.
- All buildings are situated higher in the terrain than local guidelines for new construction with regard to height above sea level.
- 15.2.
- The building’s foundation is above the ‘calculated highest water level’ in watercourses and lakes, taking into account climate change until the year 2100.
- 15.3.
- All buildings are situated outside flooded areas, including runways, in the case of rainfall with a return period of 100 years, taking into account climate change until 2100.
Methods to use for the indicator: Desktop investigations using computer simulations; if special measures are taken in the urban area, these should be validated through site visits.
Appendix A.16. Site-Specific Indicators
At least three site-specific indicators must be formulated for the urban area, which:
- 16.1.
- Evaluate the urban area based on sustainability aspects that are important to the specific location and that are not covered by the general indicators within Citylab.
- 16.2.
- Have been formulated and anchored through a dialogue with local actors and residents.
- 16.3.
- Have a clear (quantitative or qualitative) target level that is relevant based on the practices that apply to sustainability issues and local conditions.
- 16.4.
- Have been used to assess the urban area.
- 16.5.
- Have a designated responsible for future follow-up activities.
Methods to use for the indicator: No specific methods are prescribed beside the criteria.
References
- UN. World Urbanization Prospects: The 2018 Revision; United Nation: New York, NY, USA, 2018. [Google Scholar]
- UNEP. City-Level Decoupling—Urban Resource Flows and the Governance of Infrastructure Transitions; United Nation: New York, NY, USA, 2013. [Google Scholar]
- Girardet, H. Creating Sustainable Cities, Schumacher Briefings; Green Books Ltd.: Dartington, UK, 1999. [Google Scholar]
- UN. Transforming Our World: The 2030 Agenda for Sustainable Development; United Nation: New York, NY, USA, 2015. [Google Scholar]
- UN. New Urban Agenda; United Nation: New York, NY, USA, 2017. [Google Scholar]
- AtKisson, A. Developing indicators of sustainable community: Lessons from sustainable Seattle. Environ. Impact Assess. Rev. 1996, 16, 337–350. [Google Scholar] [CrossRef]
- Tanguay, G.A.; Rajaonson, J.; Lefebvre, J.-F.; Lanoie, P. Measuring the sustainability of cities: An analysis of the use of local indicators. Ecol. Indic. 2010, 10, 407–418. [Google Scholar] [CrossRef]
- Turcu, C. Re-Thinking sustainability indicators: Local perspectives of urban sustainability. J. Environ. Plan. Manag. 2012, 56, 695–719. [Google Scholar] [CrossRef] [Green Version]
- Lynch, A.J.; Mosbah, S.M. Improving local measures of sustainability: A study of built-environment indicators in the United States. Cities 2017, 60, 301–313. [Google Scholar] [CrossRef]
- Haapio, A. Towards sustainable urban communities. Environ. Impact Assess. Rev. 2012, 32, 165–169. [Google Scholar] [CrossRef]
- Sharifi, A.; Murayama, A. A critical review of seven selected neighborhood sustainability assessment tools. Environ. Impact Assess. Rev. 2013, 38, 73–87. [Google Scholar] [CrossRef]
- Wangel, J.; Wallhagen, M.; Malmqvist, T.; Finnveden, G. Certification systems for sustainable neighbourhoods: What do they really certify? Environ. Impact Assess. Rev. 2016, 56, 200–213. [Google Scholar] [CrossRef]
- Ameen, R.F.M.; Mourshed, M.; Li, H. A critical review of environmental assessment tools for sustainable urban design. Environ. Impact Assess. Rev. 2015, 55, 110–125. [Google Scholar] [CrossRef]
- Gouda, A.A.; Masoumi, H.E. Certifications systems as independent and rigorous tools for assessing urban sustainability. Int. J. Urban Sci. 2018, 22, 308–321. [Google Scholar] [CrossRef]
- Sweden Green Building Council. Slutrapport Betatester—Resultat från stadsutvecklingsprojekt som har testat och utvärderat BREEAM Communities; Sweden Green Building Council: Sundbyberg, Sweden, 2014. [Google Scholar]
- Lind, J.; Wangel, J.; Belkert, A.-K.; Malmqvist, T. Citylab Action: Guiding Sustainable Urban Development. In Proceedings of the WSBE17 Hong Kong—Transforming Our Built Environment through Innovation and Integration: Putting Ideas into Action, Conference Proceedings, Hong Kong, China, 5–7 June 2017; Construction Industry Council; Hong Kong Green Building Council Limited: Hong Kong, China, 2017. [Google Scholar]
- Cole, R.J. Building environmental assessment methods: Redefining intentions and roles. Build. Res. Inf. 2005, 33, 455–467. [Google Scholar] [CrossRef]
- Sweden Green Building Council. Citylab Guide—hållbar stadsutveckling i planering och genomförande; Sweden Green Building Council: Stockholm, Sweden, 2019. [Google Scholar]
- Lind, J.; Malmqvist, T.; Wangel, J. Key Considerations When Designing Certification Systems for Urban Sustainability and Implications for The Swedish Post-Construction System Citylab. Sustainability 2019, 11, 2673. [Google Scholar] [CrossRef] [Green Version]
- Niemeijer, D.; de Groot, R. A conceptual framework for selecting environmental indicator sets. Ecol. Indic. 2008, 8, 14–25. [Google Scholar] [CrossRef]
- Bell, S.; Morse, S. Sustainability Indicators—Measuring the Immeasurable; Earthscan: London, UK, 2000. [Google Scholar]
- Sustainable Development Solutions Network (SDSN). Indicators and a Monitoring Framework for the Sustainable Development Goals—Launching a Data Revolution for the SDGs; the Leadership Council of the Sustainable Development Solutions Network: New York, NY, USA, 2015. [Google Scholar]
- Zimmerman, J.; Stolterman, E.; Forlizzi, J. An analysis and critique of Research through Design: Towards a formalization of a research approach. In Proceedings of the 8th ACM Conference on Designing Interactive Systems, Aarhus, Denmark, 16–20 August 2010. [Google Scholar]
- Maher, R.; Maher, M.; Mann, S.; McAlpine, C.A. Integrating design thinking with sustainability science: A Research through Design approach. Sustain. Sci. 2018, 13, 1565–1587. [Google Scholar] [CrossRef] [PubMed]
- Hansson, S.O. What is technological science? Stud. Hist. Philos. Sci. Part A 2007, 38, 523–527. [Google Scholar] [CrossRef]
- Koskinen, I.; Zimmerman, J.; Binder, T.; Redstrom, J.; Wensveen, S. Design Research through Practice; Morgan Kaufmann: Waltham, MA, USA, 2011. [Google Scholar]
- Sweden Green Building Council. Beslutsunderlag till Sweden Green Building Council; Sweden Green Building Council: Sundbyberg, Sweden, 2012. [Google Scholar]
- Pandis Iverot, S.; Brandt, N. The development of a sustainable urban district in Hammarby Sjöstad, Stockholm, Sweden? Environ. Dev. Sustain. 2011, 13, 1043–1064. [Google Scholar] [CrossRef]
- City of Malmö. Uppföljning av Hållbarhet i Projekt Fullriggaren; Malmö stad: Malmö, Sweden, 2015. [Google Scholar]
- Holmstedt, L.; Brandt, N.; Robèrt, K.-H. Can Stockholm Royal Seaport be part of the puzzle towards global sustainability?—From local to global sustainability using the same set of criteria. J. Clean. Prod. 2017, 140, 72–80. [Google Scholar] [CrossRef]
- City of Gothenburg. Hållbar stadsutveckling i Kvillebäcken—Uppföljning av hållbarhetsprogrammet 2010–2017; City of Gothenburg: Gothenburg, Sweden, 2018. [Google Scholar]
- The Environmental Objectives System. Available online: http://www.sverigesmiljomal.se/environmental-objectives/ (accessed on 3 September 2019).
- Swedish Environmental Protection Agency (Naturvårdsverket). Inledande kartläggning och objektiv skattning av luftkvalité; National Environmental Protection Agency: Stockholm, Sweden, 2018. [Google Scholar]
- Fossil-Free Sweden. Roadmap for Fossil Free Competitiveness—A Summary of Roadmaps from Sweden Business Sectors; Fossil-free Sweden: Stockholm, Sweden, 2018. [Google Scholar]
- City of Stockholm. Dagvattenhantering—Riktlinjer för kvartersmark i tät stadsbebyggelse; City of Stockholm: Stockholm, Sweden, 2016. [Google Scholar]
- Stockholm County Council. Rekommendationer för lägsta grundläggningsnivå längs Östersjökusten i Stockholms län; Stockholm County Council: Stockholm, Sweden, 2015. [Google Scholar]
- Skåne County Council. Handbok för klimatanpassad vattenplanering i Skåne; Skåne County Council: Malmö, Sweden, 2012. [Google Scholar]
- National Board of Housing, Building and Planning (Boverket). Tillsynsvägledning avseende översvämningsrisker; Boverket: Karlskrona, Sweden, 2018. [Google Scholar]
- Swedish Institute for Standards (SIS). SS 199000:2014 Naturvärdesinventering avseende biologisk mångfald; Swedish Institute for Standards: Stockholm, Sweden, 2014. [Google Scholar]
- Söderström, M.; Lifvin, S.; Viberg, J. Nationella trygghetsundersökningen 2018: Om utsatthet, otrygghet och förtroende; The Swedish National Council for Crime Prevention (BRÅ): Stockholm, Sweden, 2018. [Google Scholar]
- Sweden Green Building Council. Available online: www.sgbc.se (accessed on 1 November 2019).
- Lind, J.; Malmqvist, T.; Granath, A.; Fauré, E.; Wangel, J.; Walve, S. Bakgrund och motiveringar i utvecklingen av Citylab manual för certifiering av en stadsdels hållbarhet; Sweden Green Building Council: Stockholm, Sweden, 2020. [Google Scholar]
Figure 1.
Development of Citylab Post-Construction from overall structure to detailed composition, in eight steps with/without practitioner involvement. This paper focuses on steps 2–8. For details on steps 1a and 1b see [19].
Figure 1.
Development of Citylab Post-Construction from overall structure to detailed composition, in eight steps with/without practitioner involvement. This paper focuses on steps 2–8. For details on steps 1a and 1b see [19].

Figure 2.
Conceptual image of a radar diagram for presenting the result of a certification assessment. The dotted line shows the minimum level to be achieved for each indicator.
Figure 2.
Conceptual image of a radar diagram for presenting the result of a certification assessment. The dotted line shows the minimum level to be achieved for each indicator.


Table 1.
Framework of important considerations when designing a certification system for urban areas [19].
Table 1.
Framework of important considerations when designing a certification system for urban areas [19].
| Benefits to be Provided | Principles Guiding Development | Overriding Requirement for Compliance with the Principles | |
|---|---|---|---|
| Principles | Subprinciples | ||
| Beneficial for the organisation Beneficial for practitioners Beneficial for the urban area | Scientifically credible | Comprehensive | Stakeholder and public participation |
| Integrative | |||
| Valid | |||
| Reliable | |||
| Practical | Intelligible | ||
| Simple | |||
| Influenceable | |||
| Driving change | Determining what is good enough | ||
| Guiding a discussion among relevant stakeholders | |||
| Including different kinds of indicators | |||
| Presenting the results in a way that enables action | |||
Table 2.
Citylab’s sustainability goals.
| 1. Good health and well-being | 6. Attractive city life |
| 2. Gender equality, equal opportunities and social cohesion | 7. No negative impact on the climate |
| 3. Participation and influence | 8. Resource management |
| 4. Safe and secure living environment | 9. No negative impact on the environment |
| 5. Good conditions for supporting a living | 10. Resilience and flexibility |
Table 3.
Excerpt showing how a certain sustainability aspect, in this example waste, is measured and assessed through different kinds of indicators from different sources.
Table 3.
Excerpt showing how a certain sustainability aspect, in this example waste, is measured and assessed through different kinds of indicators from different sources.
| Indicator Categories (in Bold) and Examples of Indicators | Sources for Each Indicator |
|---|---|
| Amount of Unsorted Waste | |
| Total amount of collected residual waste | City of Stockholm. Avfallsmängder och behandlingsmetoder. Available online: http://miljobarometern.stockholm.se/avfall/avfallsmangder-och-behandlingsmetoder/ (Accessed on: 17 04 2018) |
| Amount of household waste sent to incineration | Statistics Sweden. Om statistikbaserad uppföljning av Agenda 2030. Statistics Sweden: Stockholm, Sweden, 2017. |
| Collected household waste kg/capita | Kolada. Available online: https://www.kolada.se/ (Accessed on: 05 04 2018) |
| Share of Recyclable Waste Recycled | |
| Share of collected food waste in total amount of food waste | City of Malmö. Avfallet ska återvinnas. Available online: http://miljobarometern.malmo.se/miljoprogram/i-malmo-ar-det-latt-att-gora-ratt/avfallet-ska-atervinnas/ (Accessed on: 18 04 2018) |
| Percentage of the city’s hazardous waste that is recycled | International Organization for Standardisation. ISO 37120:2014. Sustainable development of communities—indicators for city services and quality of life. ISO: Geneve, Schweiz. |
| Share of households and businesses sorting food waste | Växjö Municipality. Miljömål och utfall 2016. Växjö Municipality: Växjö, Sweden 2017. |
| Satisfaction of Inhabitants with Waste Collection and Sorting Infrastructure | |
| Share of inhabitants satisfied with opportunities to sort waste | City of Stockholm. Åsikter och attityder avfall. Available online: http://miljobarometern.stockholm.se/avfall/asikter-och-attityder-avfall/. (Accessed on: 17 04 2018) |
| Share of inhabitants satisfied with maintenance and cleaning in waste rooms in buildings | City of Stockholm. Åsikter och attityder avfall. http://miljobarometern.stockholm.se/avfall/asikter-och-attityder-avfall/ (Accessed on: 17 04 2018) |
| Share of inhabitants satisfied after visit to recycling centre | Kolada. Available online: https://www.kolada.se/ (Accessed on: 05 04 2018) |
Table 4.
Relation between validity and influence with examples of indicators.
| Validity | High | Low | |
|---|---|---|---|
| Influence | |||
| High | e.g., kWh/m2 building area | e.g., share of impermeable ground | |
| Low | e.g., perceived safety | (Irrelevant indicator) | |
Table 5.
Short list of general indicators and how they relate to Citylab sustainability goals.
| Name of Indicator | Aim of Indicator, i.e., to Promote Urban Areas… | Citylab Sustainability Goals (Table 2) |
|---|---|---|
| Safety | … where people feel safe. | 1, 2, 4, 6 |
| Trustful community | … with a trustful community. | 1, 2, 3, 4, 10 |
| Places | … with a diversity of places for different groups of people at different times of the day and during the whole year. | 1, 2, 3, 6 |
| Functions and services | … where everyone has access to basic service functions. | 2, 5, 6 |
| Mixture of dwellings | …that counteract segregation through a diversity of dwellings. | 2, 4, 5 |
| Noise | … with a good acoustic environment outdoor. | 1 |
| Air quality | … with good air quality outdoor. | 1, 9 |
| Indoor environment | … with a healthy indoor environment. | 1, 9 |
| Household waste | … with little generated waste and high degree of waste sorting. | 7, 8, 9 |
| Travel behaviour | … where a high share of personal travel is by walking, cycling or public transport. | 1, 7, 8, 9 |
| Energy use in buildings | … with buildings with low energy use. | 7, 8, 9 |
| Climate impact | …with a mapped and low climate impact. | 7, 8, 9 |
| Biodiversity | … where the biodiversity and nature values are kept and developed from an ecosystem perspective. | 9, 10 |
| Purification of stormwater | … where stormwater does not contaminate recipient waters. | 9 |
| Flooding risk | … where flooding results in minor consequences. | 10 |
Table 6.
General indicators included in Citylab Post-Construction. The indicators are subdivided by method used for data collection (first row). In brackets, the type of reference for each good-enough level is presented. For example, the acoustic environment in the urban area is evaluated through model calculation and the noise levels should be equivalent to the National quality objective or better.
| Model Calculations | Site Visit | Questionnaire | Statistical Data |
|---|---|---|---|
| Acoustic environment (National quality objective) | Places (Consensus document) | Travel behaviour (National quality objective) | Mixture of dwellings (National average) |
| Air quality (National quality objective) | Functions and services (Consensus document) | Safety (National average) | Household waste (National average) |
| Biodiversity (Best practice) | Trustful community (National average) | Energy use in buildings (Best practice) | |
| Purification of stormwater (Best practice) | Indoor environment (National quality objective) | ||
| Flooding risk (Best practice) | Climate impact (Consensus document and best practice) | ||
© 2020 by the authors. Licensee MDPI, Basel, Switzerland. This article is an open access article distributed under the terms and conditions of the Creative Commons Attribution (CC BY) license (http://creativecommons.org/licenses/by/4.0/).
Share and Cite
MDPI and ACS Style
Lind, J.; Malmqvist, T.; Wangel, J. Developing Citylab Post-Construction—A Swedish Certification System to Evaluate the Sustainability of Urban Areas. Sustainability 2020, 12, 4454. https://0-doi-org.brum.beds.ac.uk/10.3390/su12114454
AMA Style
Lind J, Malmqvist T, Wangel J. Developing Citylab Post-Construction—A Swedish Certification System to Evaluate the Sustainability of Urban Areas. Sustainability. 2020; 12(11):4454. https://0-doi-org.brum.beds.ac.uk/10.3390/su12114454
Chicago/Turabian StyleLind, Jonas, Tove Malmqvist, and Josefin Wangel. 2020. "Developing Citylab Post-Construction—A Swedish Certification System to Evaluate the Sustainability of Urban Areas" Sustainability 12, no. 11: 4454. https://0-doi-org.brum.beds.ac.uk/10.3390/su12114454
Note that from the first issue of 2016, this journal uses article numbers instead of page numbers. See further details here.