1. Introduction
In 2020, the whole world is struggling against the SARS-COV-2 coronavirus pandemic. Public Health authorities have implemented isolation policies to reduce the loss of human lives, restricting, among others, all the non-essential economic activities. Thus, in addition to the sanitary effects, the virus will have a substantial impact on worldwide economies. A reduction of global economic growth by 2.0% per month of the outbreak is expected, while global trade could also fall between 13% and 32% [
1]. Although the full economic impact will not be known until the crisis ends, it will strongly depend on how safe the economic activities reactivation at the workplaces is developed after the lockdown to prevent further outbreaks.
Workplaces have a role in disease transmission, with a substantial impact on public health [
2]. As an example, in Singapore, among the first 25 locally transmitted COVID-19 cases, 17 of them (68%) were probably related to occupational exposure outside hospitals [
3]. The workers’ exposure to infection has been considered a key factor for containing the risk of COVID-19 infection also in the United States, where at least 18% of the total number of workers are expected to be exposed to COVID-19 at their workplaces at least once per month [
4]. The interest of preventing sickness presenteeism at work, which was already an emerging concern of the organizations [
5], is now one of their primary key challenges, highlighted by the fact of the asymptomatic COVID-19 cases contagion capacity, the silent spreaders.
In the context of the global COVID-19 pandemic, companies and institutions all over the world, supported by their Occupational Health Services, are trying to find the best ways to reorganize their activity to minimize the contagion risk among their employees, so as to protect their health and prevent internal SARS-COV-2 outbreaks. The rules and guidelines provided by the Health Authorities, as well as the organizational measures recently proposed by different authors [
6], are the starting point, but they do not consider customized measures to be implemented at each entity attending to its activity, organization, and business particularities.
The employees of an entity interact among them, constituting a social network in which their contacts are driven by the work organization, the entity structures, the management procedures, or the people habits. This social network, through which COVID-19 could be spread, can be represented by a graph [
7], that may be constructed relying on the data from the Enterprise Resources Planners (ERP) of the companies. Social Network Analysis (SNA) studies the underlying conditions of such social networks to identify patterns of interaction between the network’s actors to understand their connections and the implications of their relationships [
8]. There is an opportunity for applying SNA to the social network constituted by the employees of an entity to identify those critical nodes in which preventive measures may have the biggest impact in reducing the risk of contagion among employees.
Therefore, a methodology for guiding the design and evaluation of tailor-made preventive measures to contain internal outbreaks within each entity is still a gap that can be covered by the application of the Social Networks Analysis (SNA) techniques. This paper aims at covering this gap, also providing the results from a real demonstration case of this methodology applied in a Spanish Research Center.
2. Methodology
2.1. Concept and Approach
This paper addresses the gap in the application of SNA for preventing internal outbreaks within workplaces, providing a methodology to support Occupational Health and Safety Services in the design and selection of preventive measures ready to reduce the risk of outbreaks. To achieve this goal, the authors conceptualize how the employees of a company interact among them, forming a network in which outbreaks may be triggered by many factors or circumstances, such as sharing an office space, or participating in the same management board. Considering that the SARS-COV-2 is spread not only by direct contact between individuals, but also by fomites [
9], a 2-mode network is required.
In this 2-mode network, every employee is tied to those triggers that may imply a close contact with another employee. As an example, these triggers may be working at the same office, participating in the same management body, sharing a collective transport, or collaborating in a given project. The 2-mode network composed of employees and triggers can be transformed into two 1-mode networks, one of the employees and one of the triggers. In the network of employees, the employees are the nodes, which are connected among them by shared triggers. In the network triggers, the nodes are the triggers, which are linked by those employees that participate in both. Both 1-mode networks are weighted considering a tie as strong as the number of links between the two connected nodes.
An analysis of both 1-mode networks can be performed with a twofold approach, on the one hand identifying the employees’ network cohesion, which is related to the overall outbreak risk and, on the other hand, detecting those nodes, either employees or triggers, that are the most significant contributors to the network integration, thus with the highest probability to foster internal outbreaks. The identification of these critical nodes will support the design of different high impact sets of preventive measures.
The evaluation of the effect of the different sets of measures designed, as separating spaces, telework assignment to critical employees, management bodies virtualization, elimination of collective transports, etc., is then developed to select those actions with the most significant contribution to decreasing the risk of contagion, thus, the employees’ network cohesion.
This paper aims to propose a quick methodology for designing and prioritizing actions able to minimize the risks of outbreaks within workplaces, also providing a simple example for its illustration, together with a real case of a given entity, with anonymized actual data.
2.2. Background
The social network approach has been used in epidemiology since 1985 [
10]. In the last decade, SNA has become of great interest [
11,
12] due to two main advantages [
13]: Firstly, a network provides a representation of the social contacts between individuals that are known to significantly influence the disease spread [
14,
15], and secondly, the analysis of the network structure itself supports the design of efficient plans of intervention or awareness [
16]. Usually, each node of the network represents an individual, but also may represent groups or even locations, and it is described by a vector of attributes to understand the network dynamics. Two main types of contacts can be considered in the network construction, depending on the virus transmission paths: Personal contacts and geographical contacts. Indeed, in the case of SARS, with similar transmission paths to SARS-COV-2, it was demonstrated how the use of geographical contacts in the network construction provided valuable results [
17], as its inclusion highlighted the network properties affecting the disease transmission. In this paper, a wider concept of the geographical location is proposed, considering all the triggers that may cause a close contact.
Several studies have assessed the relation of the properties of the networks—cohesion metrics—and its nodes—centrality metrics—with the infection dynamics in large populations [
18]. Considering that although transmission tends to occur more rapidly in small-world networks, the final outbreak size tends to be smaller in these cases [
18], so maybe for this reason, no focus has been placed at the population forming a business or an organization. Nevertheless, the relevance of the network properties in the outbreak spread in small networks has already been demonstrated [
19].
The application of SNA in epidemiology has relied on tools designed to support Public Health Authorities [
20,
21,
22] that provide simulations of the disease spread over time in large populations from urban to international levels.
Some studies on healthcare workers’ occupational health have been conducted regarding the prevention of infectious diseases, but they represent only 13% of a sample of 402 papers published between 1992 and 2019 on this matter. Besides, most of them are surveillance studies [
23]. The authors have not identified any study addressing the use of SNA for the support of Occupational Health and Safety Services in the prevention of outbreaks within workplaces.
3. Process
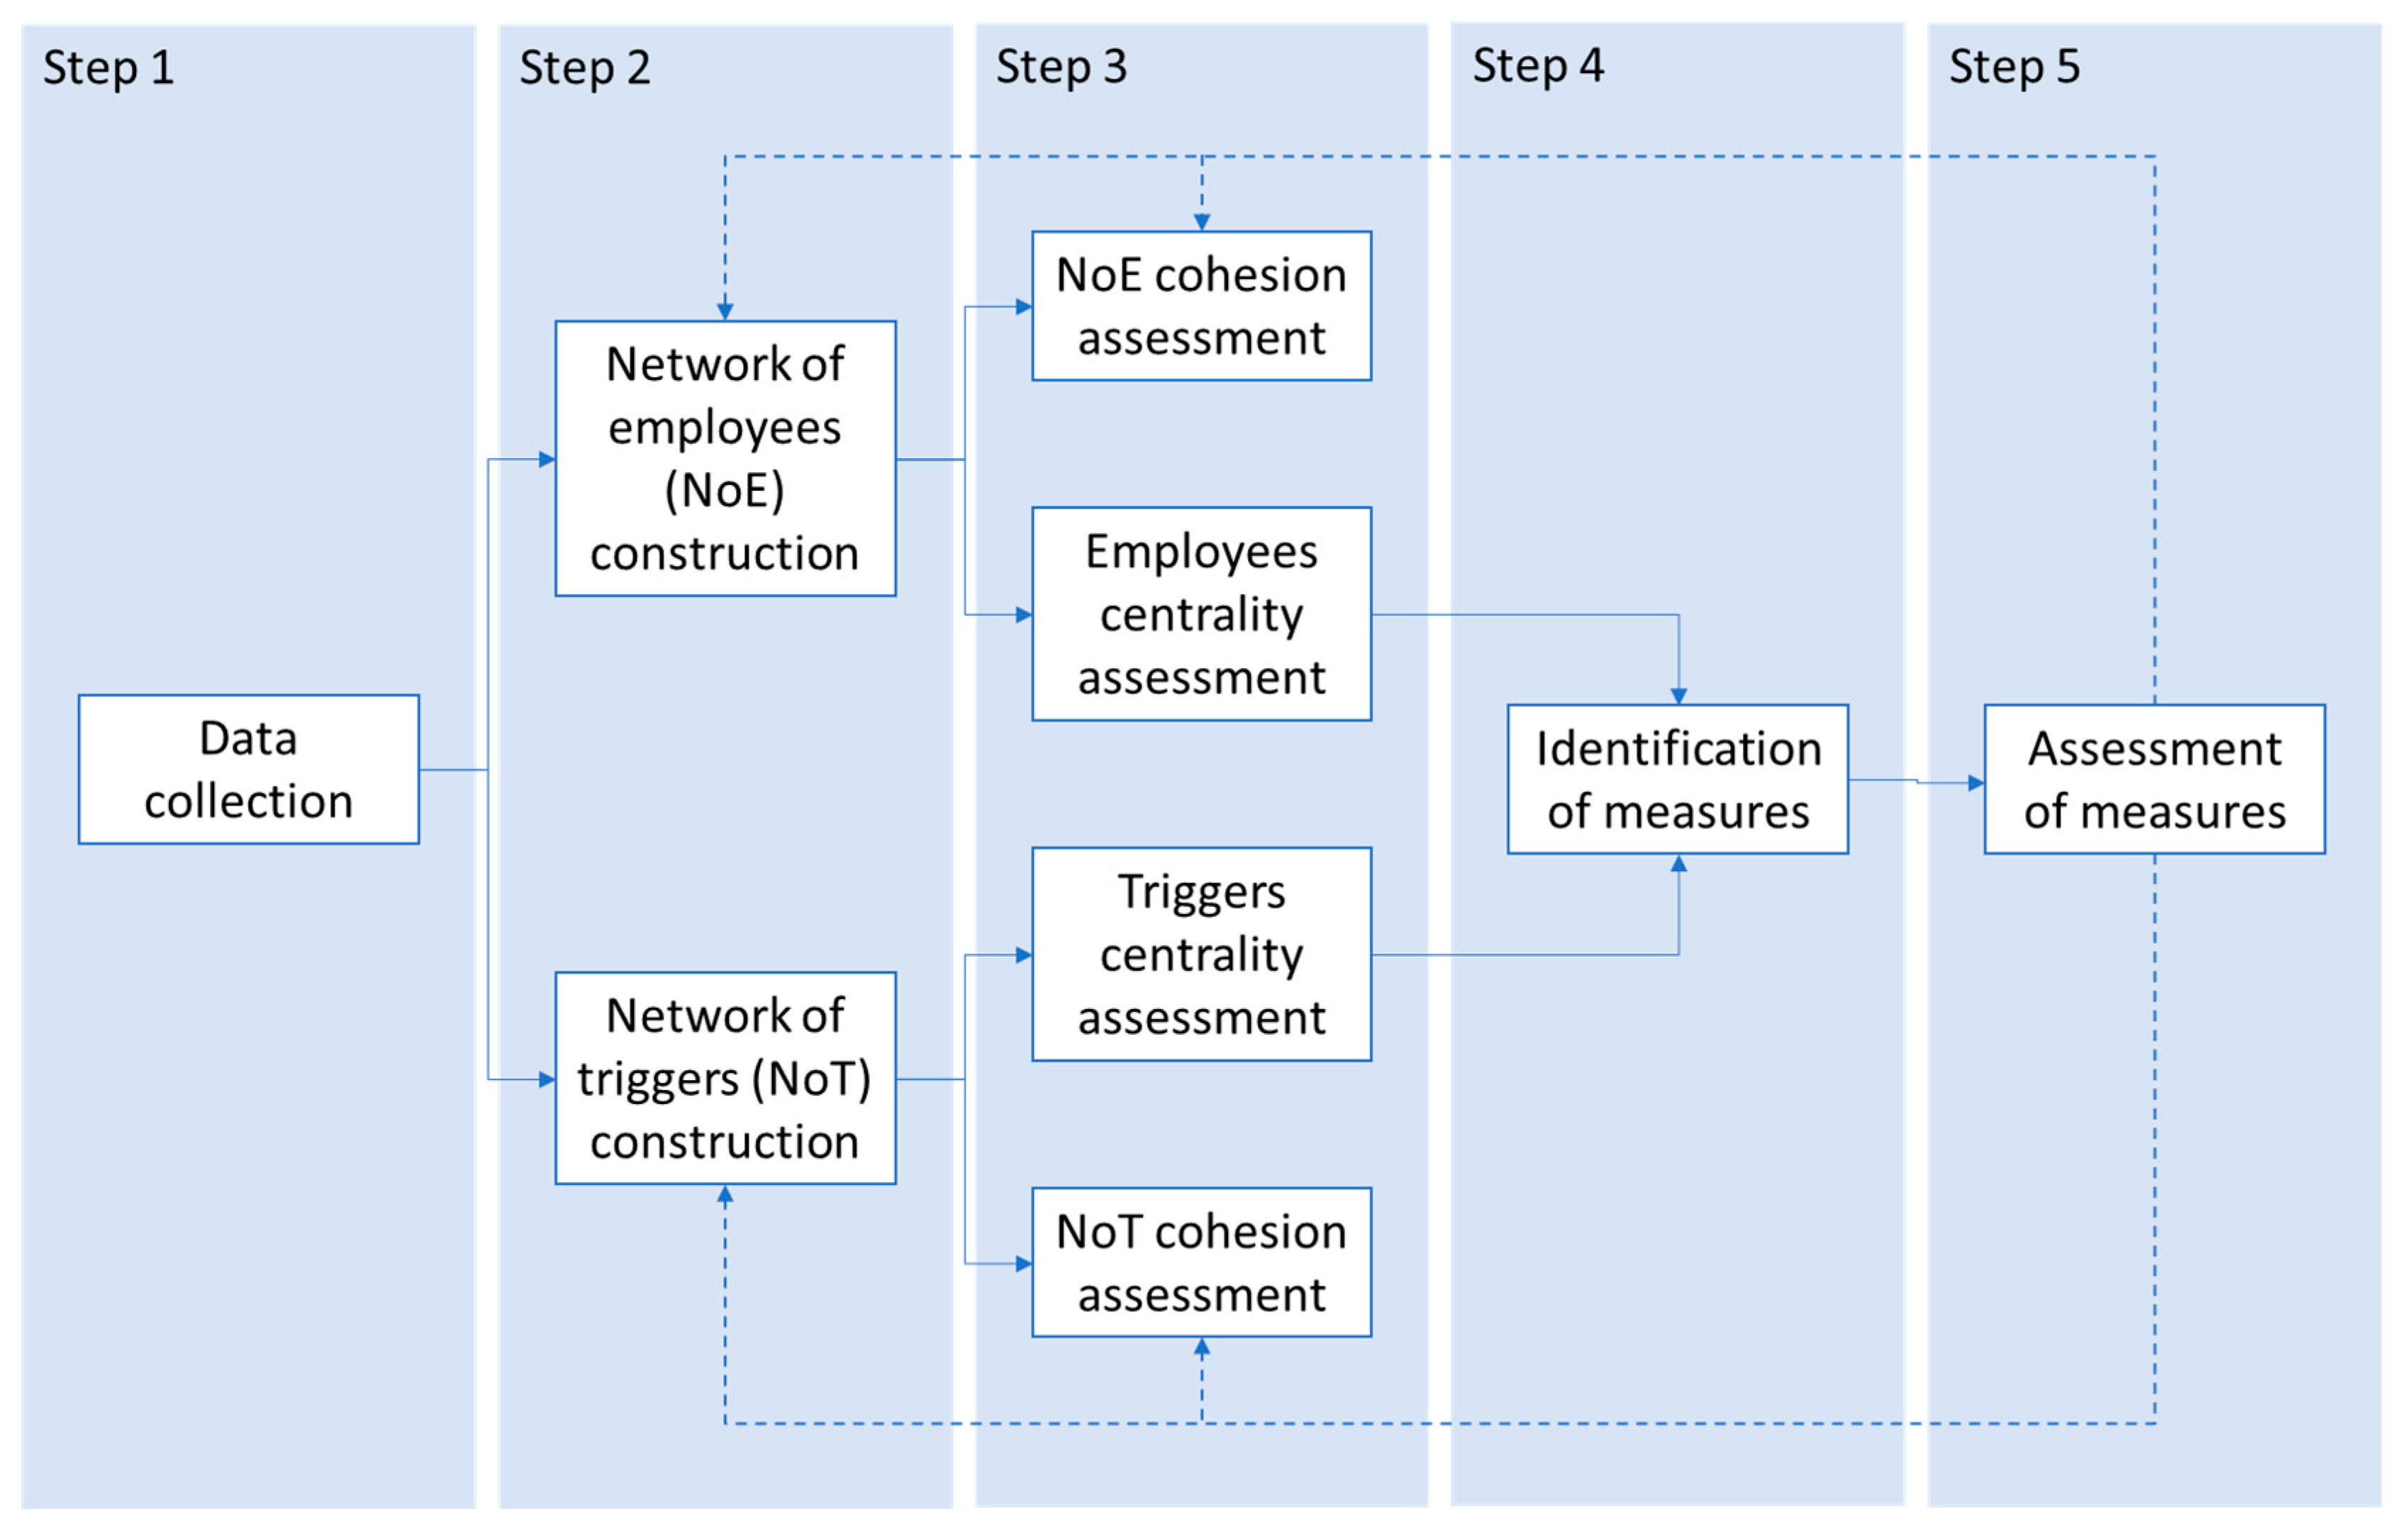
This paper proposes a five steps methodology to identify and evaluate preventative measures within the entities based on the use of Social Network Analysis. It is an iterative methodology in which, once guidance on the design of those preventive measures with the most significant impact is given, an evaluation of the resulting situation is performed to assess the achieved effects and to identify possible additional measures to implement.
Figure 1 presents an overview of the methodology, including the key points of each step together with their relations. In the following subsections, each step is defined together with a simple example to illustrate the proposed methodology.
3.1. Step 1: Data Collection
The main objective of this step is to collect, from the entity management systems or Enterprise Resource Planning (ERP), the nodes that will compose the network, employees and triggers, together with their connections. Firstly, all the people that constitute the entity population should be identified, including, in addition to the direct employees, all the external in-house persons. Secondly, all the triggers that are documented should be identified. Considering that a trigger is a common circumstance shared between two or more employees that can kick-off an outbreak, each company should identify those that are registered in their systems. As an example, some trigger categories that usually exist in the ERPs, and that can be easily extracted are:
Permanent locations: Employees in shared offices will have close contact daily, so the permanent location of the employee is one of the key factors.
Work shifts or other established time slots in which employees share spaces, like meals or coffee breaks, if they are scheduled.
Locations with access: Those employees having access rights to a given part of the facilities, e.g., laboratories, warehouses, lockers’ rooms, etc., may be in close contact and spread the virus from one part of the entity to another.
Structural or functional areas or groups: Employees in the same organizational area usually are more prone to interact.
Participation in projects: Employees participating in the same project will be more likely to work together, thus, having contacts.
Management bodies: People that participate in the same management bodies are usually connected as they participate in meetings, etc.
Company transport means: Some companies provide collective transports to their employees that may be a focus for contagion.
There is a non-exhaustive list, and it should be completed and revised for each entity attending to their specificities and available data.
With all the collected data, it is possible to construct an affiliation matrix in which each employee is tied to those triggers that affect him or her. Employees are placed in rows, and triggers in columns. In
Table 1, a simple affiliation matrix is presented for an illustrative purpose of the methodology.
3.2. Step 2: Networks Construction
The affiliation matrix is a representation of a 2-mode network, in which the nodes “employees” are tied with the nodes “triggers”.
Figure 2 represents the 2-mode network coming from the affiliation matrix presented in
Table 1. Affiliation matrix.
This 2-mode network can be transformed into two different 1-mode networks, one constituted by the employees and one constituted by the triggers. In the first case, the employees will appear as nodes, and they will be linked by a tie that will be weighted depending on the common triggers shared by them. In the second case, the triggers will appear as nodes, and they will be linked by a tie that will be weighted depending on the common employees shared by these triggers.
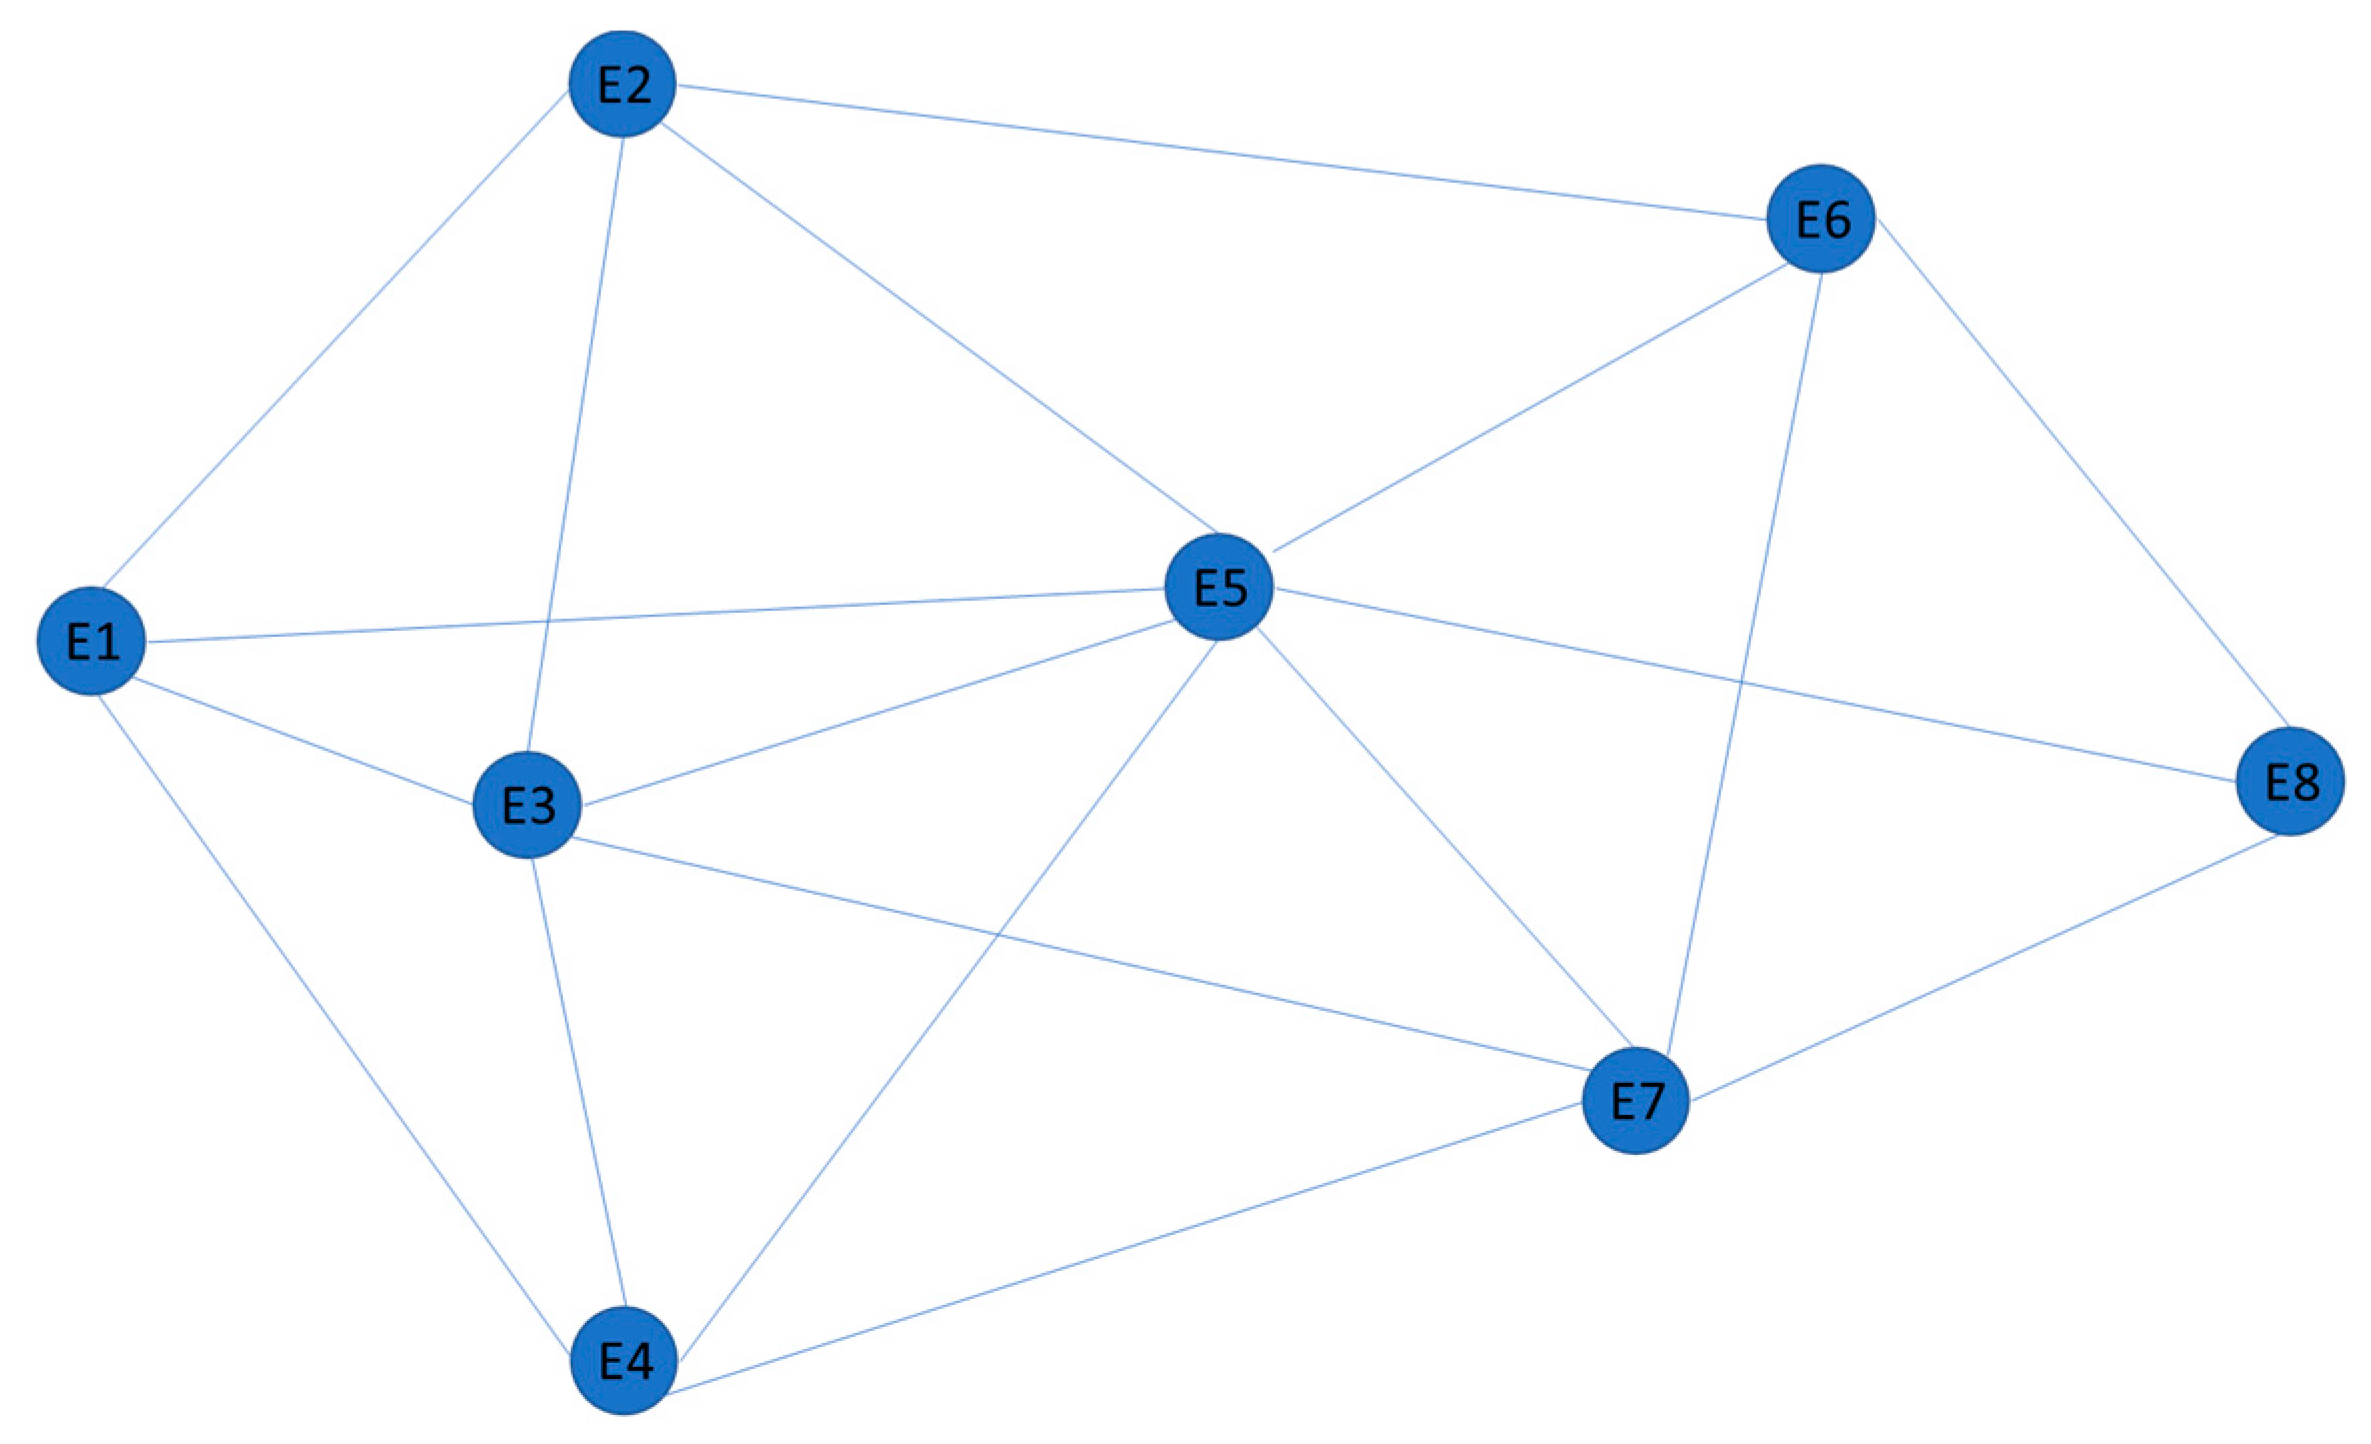
The network of employees is represented in
Figure 3.
This network is weighted depending on the number of triggers in which each pair of employees participates. The matrix of weights is presented in
Table 2, and they represent a measure of how strongly linked two employees are, and thus how likely the virus may be transmitted between them, thus spreading an outbreak.
This matrix may already be used to trace the contagion chains if a case of COVID-19 is detected. As an example, if employee E2 tests positive for the virus, the prevention systems may test employee E5 firstly, as he or she holds the most significant risk of being also infected.
In addition to the network of employees, the network of triggers can be depicted. It is presented in
Figure 4.
This network is also weighted depending on the number of employees that participate in each pair of triggers. The weights are presented in the matrix presented in
Table 3, and they represent a measure of how strongly linked two triggers are, and thus how easily the virus may be transmitted between triggers, thus spreading an outbreak.
3.3. Step 3: Networks Assessment
Networks can be assessed with a twofold perspective. From one side, the overall network characteristics can be assessed, most of them related to its cohesion. From the other, the role that each node plays within the network contributing to its overall cohesion, and thus to the virus spread, can be assessed.
In general, the cohesion metrics of the network of employees will provide a reference value to assess how the different measures taken on the nodes influenced these values; thus, contributing to lowering the outbreak risks. The absolute values of these network metrics are not so representative, as they are strongly influenced by the quantity of data, mainly triggers that can be extracted from the entity information systems. They should serve as a reference to compare the effect of the different preventative measures that are considered in the assessment.
The main cohesion metrics to be calculated from the network of employees are:
Average Degree: It represents the number of ties per node, so how many other people are tied, on average, to an employee. The lower this rate, the better for reducing the contagion risk.
H-Index: The largest number “h”, such that there are “h” nodes with a degree (number of connections to other nodes) of at least “h”. It gives an approximation of the number of super-spreaders, so it is related to the speed that a possible outbreak may have. The lower this rate, the better for reducing the contagion risk.
Density: It calculates the rate of actual ties between the maximum potential ties in the network. So, it represents the number of tied employees divided by the maximum number of possible connections. The lower this rate, the better for reducing the contagion risk.
Fragmentation: It gives the proportion of pairs of employees that are unreachable among them. The higher this rate, the better for reducing the contagion risk.
Compactness: Calculated as the average of all the reciprocal distances between employees, it gives an idea of the overall tendency of employees to stay in proximity. The lower this rate, the better for reducing the contagion risk.
In
Table 4, the calculated cohesion metrics of the network of employees in the baseline scenario are presented.
Once the cohesion metrics of the overall network of employees are calculated for the baseline scenario, then the centrality metrics of the nodes of both 1-mode networks, triggers, and employees should be calculated to identify those critical spots to which preventative actions should be directed. The proposed metrics have already demonstrated their representativeness for identifying high-risk individuals in previous studies [
18].
For both networks, the following centrality measures should be calculated for each node, either a trigger or an employee:
Degree: It represents the number of nodes to which a given node is connected. The nodes with the higher rates are the ones more likely to spread an outbreak.
Eigenvector: It gives a measure of the influence of a node within a network. Relative scores are given to all the network nodes considering their connections, then considering that the nodes connected to the high-scoring nodes are those with the most significant influence. The nodes with the higher rates are the ones more likely to spread an outbreak.
Betweenness: It measures the number of times that a node is part of a geodesic path between all the reachable pairs of nodes. The nodes with the higher rates are the ones more likely to spread an outbreak.
DwFrag: It represents the geodesic distance-weighted of the network fragmentation when the considered node is removed. The nodes with the higher rates are the ones more likely to spread an outbreak.
These centrality metrics have been calculated for each node and are presented in
Table 5.
Looking at the centrality measures of the network of employees, it is remarkable how E3 and E5 are the core of the network, being high contributors to the network cohesion. In particular, the employee that may have the most significant influence on the virus spreading is E5 (highest score on Eigenvector), while the one that serves as the unique connector between employees, and thus the one with more capacity to serve as a barrier for outbreaks, is E3 (highest score in betweenness). The measures of Degree and DwFrag are in line with the previous conclusions, so actions involving these two employees may be the ones with the most significant impact.
If the network of triggers centrality measures, presented in
Table 6, are reviewed, it is noticeable how sharing the space at Office H is the condition that may have the most significant impact on the virus spreading among employees, followed closely by using the entity bus. Besides, both conditions are the ones with the highest scores of betweenness, DwFrag and Degree, so the measures with the highest impact should be directed to these two events.
As a summary, at this step, the cohesion metrics of the network of employees should be assessed to serve as a reference for the ulterior measurement of the impacts of the different possible preventive measures. Additionally, the centrality metrics of each node at both networks, employees, and triggers should be calculated to guide the definition of the preventive measure, whose identification will take place in the following step of the methodology.
3.4. Step 4: Preventive Measures Design
Starting from the centrality measures of the different nodes, a selection of those nodes with the highest contribution to the network’s integration should be made. Then, all the possible actions to reduce their influence should be assessed considering the entity particularities, which may highly differ from one entity to another.
On the one hand, regarding those employees with the highest impact, four main lines of action may be considered. Firstly, to reduce their presence and interaction with other employees to increment their social distance (not using collective transport, participating virtually in project meetings, establishing a separate office space or, the most strict, teleworking). Secondly, to establish a close follow up of their health conditions (e.g., increasing test frequency). Lastly, to increase their level of Individual Protection Equipment (masks, screens, suits, etc.).
On the other hand, regarding the triggers, the actions will mainly depend on the triggers’ nature. For spaces, splits through compartmentalization or distance augmentation between employees may be an option, together with enhanced access restrictions to some places. Additionally, an intensification of the disinfection measures in those spaces with the highest impact should be considered. Regarding turns, augmenting the number of turns or moving employees from one turn to another could be considered. Collective transport may be substituted by individual ones that may be subsidized to the employee. Regarding internal meetings, those related to management boards or projects that may have the most significant influence could be virtualized. All in all, each entity should carefully assess all the possible available means to reduce the effect of those triggers or employees that may have the most significant impact on the virus spread.
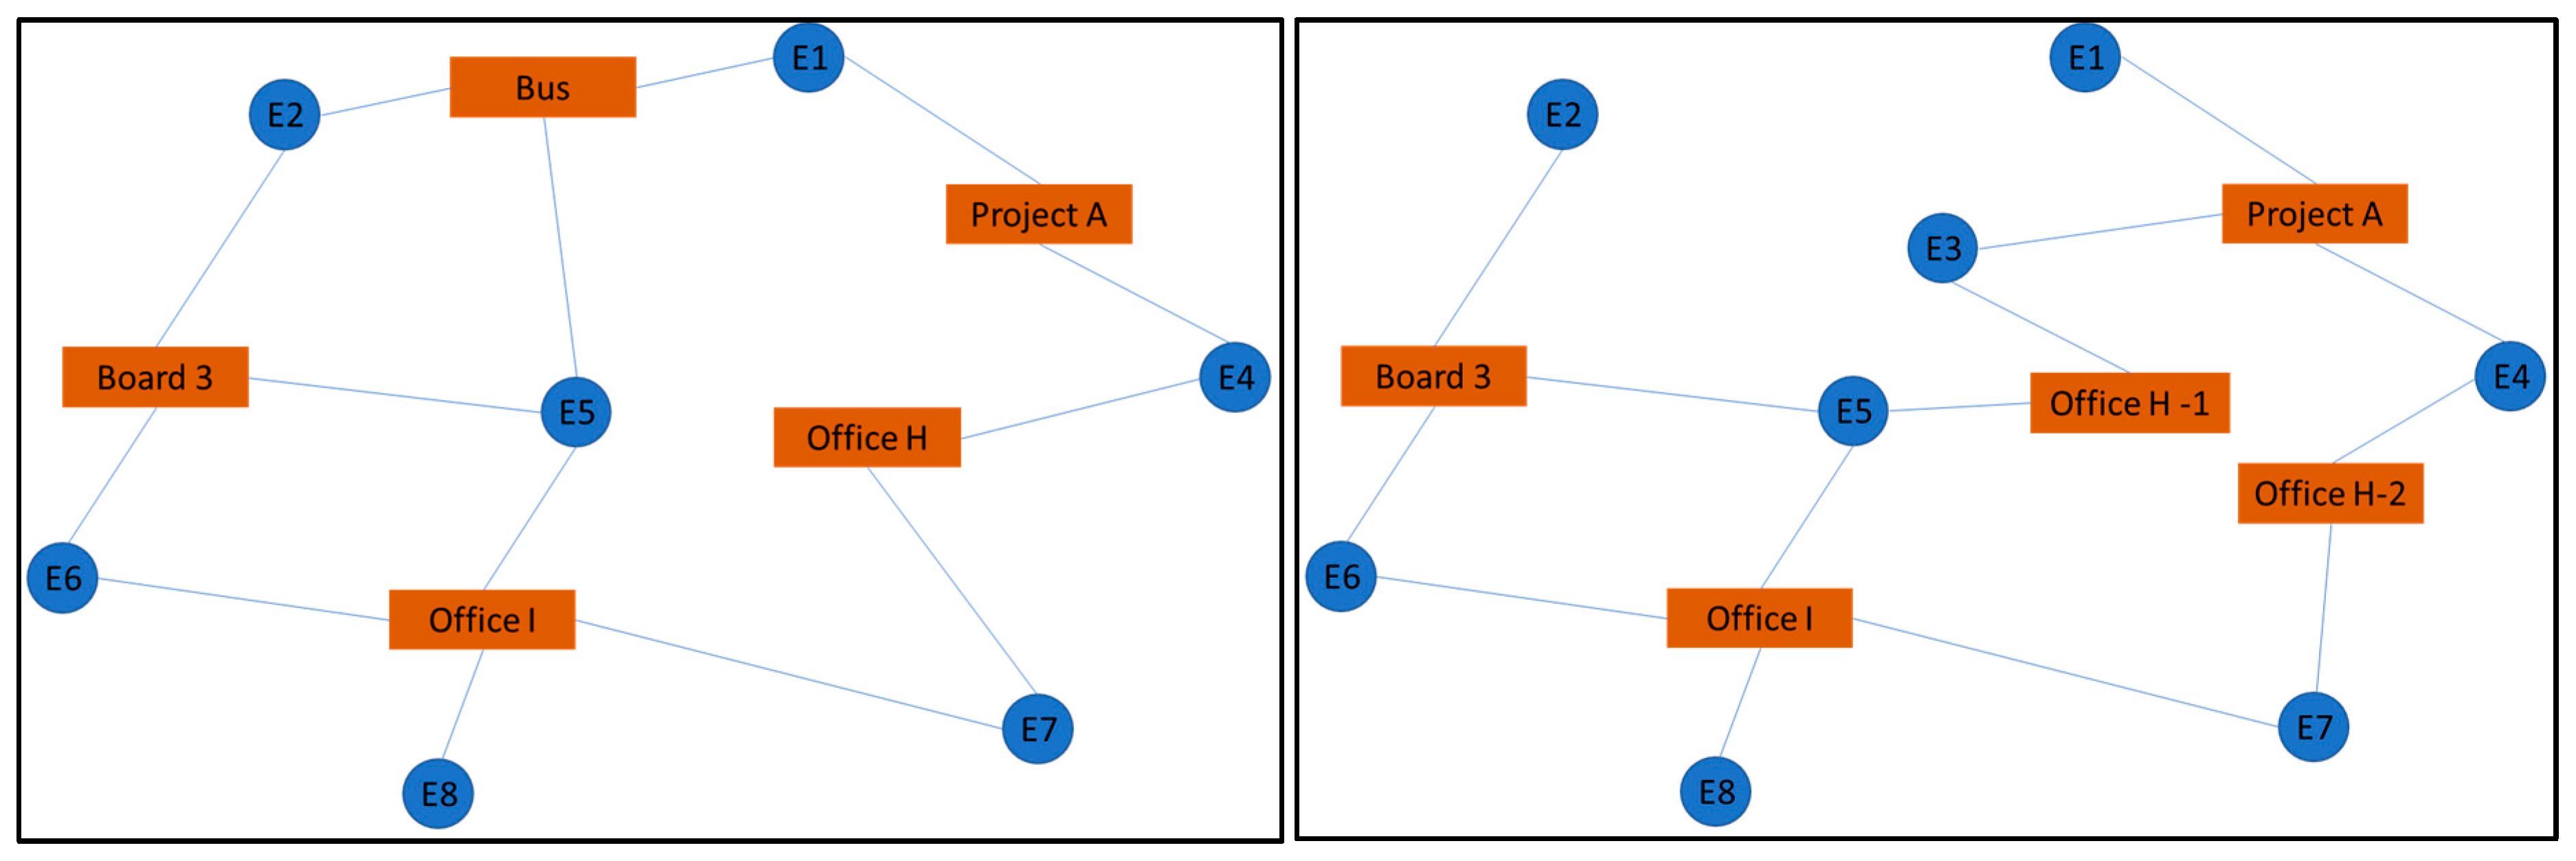
Following our previous example, let us suppose that the entity detects two possible sets of measures that may be implemented:
Option A: E3 goes to telework, and E5 is moved from Office H to an individual office.
Option B: The bus is eliminated, and Office H is split into two parts using screen walls.
Each of these options will configure a different network, as it is presented in
Figure 5, which will be assessed in the next step of the method.
3.5. Step 5: Assessment of the Preventive Measures
Once that the effect of the preventive measures has been reflected in the networks, the process of constructing the 1-mode network of employees for the options considered and then calculating the cohesion measures should be followed. In
Table 7, the different metrics for each of the two options are presented, together with baseline situation ones.
An overview of the cohesion metrics shows how both options improve the ratios compared to the baseline situation. Nevertheless, Option A shows a better performance than Option B, reaching a fragmentation level of 0.25 and lowering the compactness up to 0.59. So, from an SNA point of view, Option A (telework for E3 and an individual office for E5) has a higher impact on preventing an internal outbreak than Option B.
At that point, an iterative process should start, proposing new complementary measures over Option A, which may be identified by looking to the centrality metrics of the newly generated networks. This way, the iteration process should continue until the managers find a set of actions that is suitable for the company’s operations. For sure, the results from the proposed SNA methodology should be considered together with other variables, like costs of the proposed measures, deployment easiness, or implementation time.
4. Real Case Example
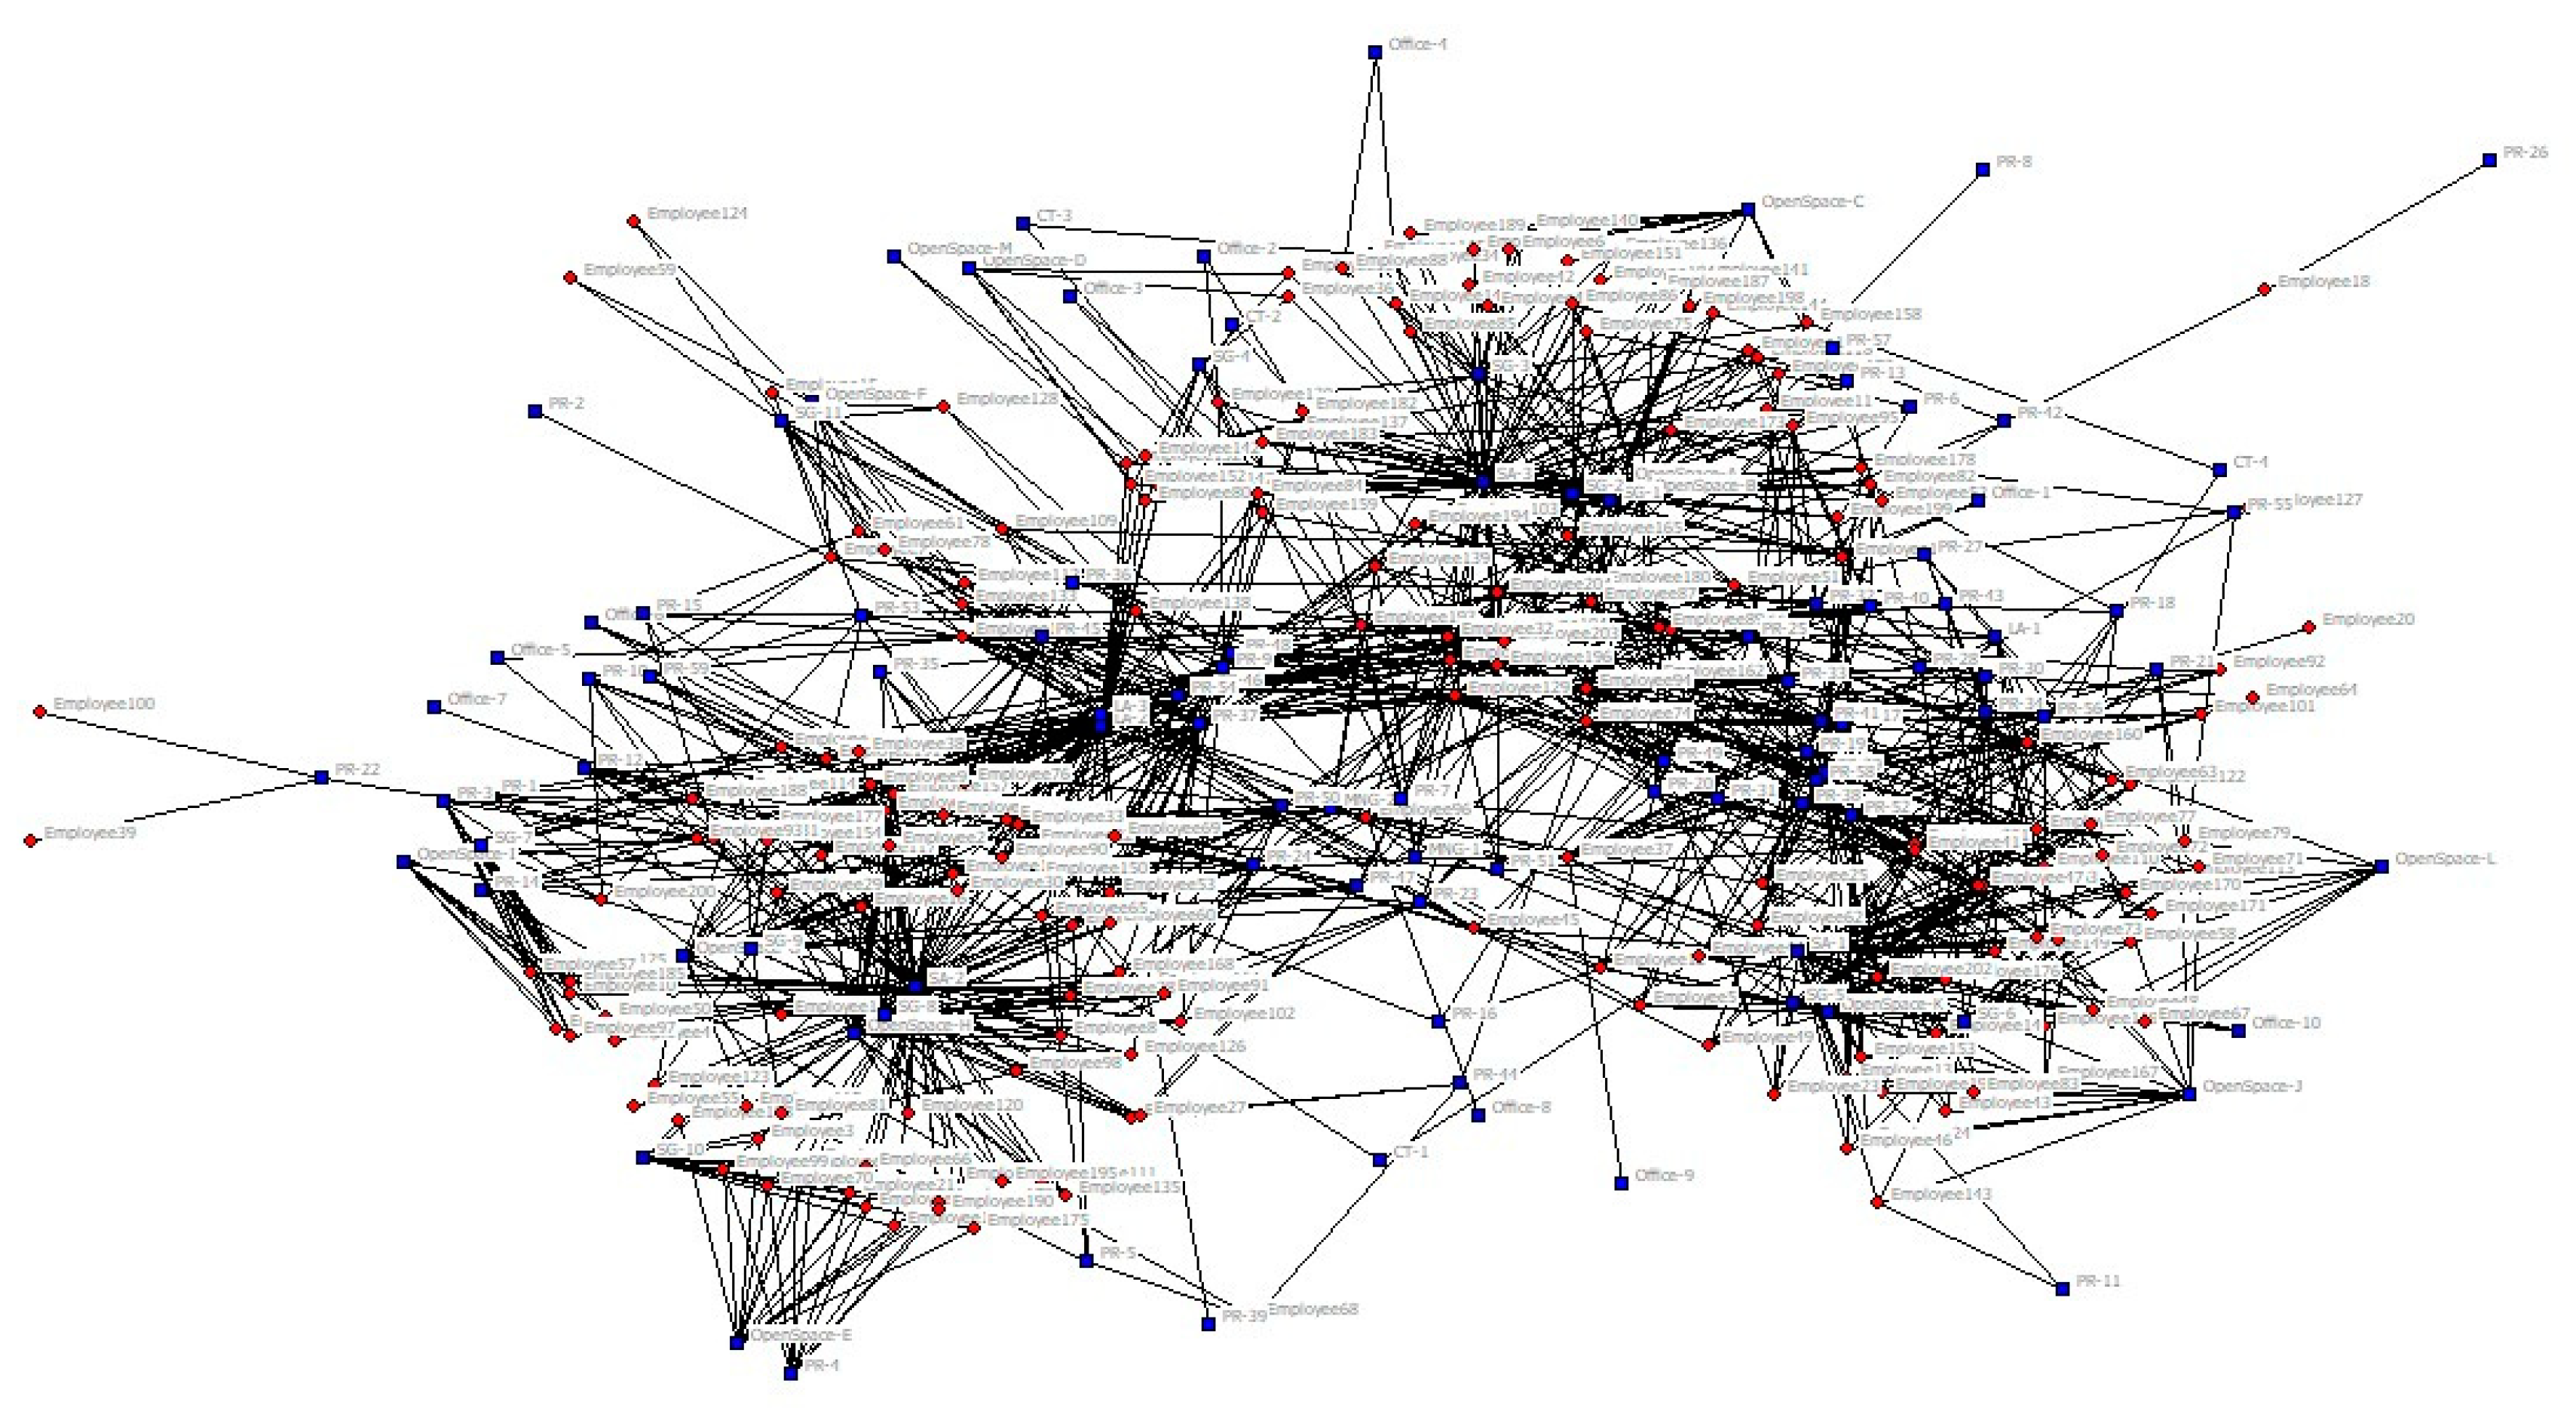
The proposed methodology has been developed and already applied in a Spanish Research Center, CIRCE Foundation-Research Center for Energy Resources and Consumption-, considering actual data.
4.1. Step 1: Data Collection
This center is composed of 204 people, including employees and external in-house persons. In the ERP, seven categories of triggers have been identified, ready to be exported, involving a total of 105 different triggers. The 204 employees have 1266 ties to the 105 triggers. The distribution of triggers between categories together with the number of ties between employees and trigger categories is presented in
Table 8.
4.2. Step 2: Networks Construction
The 2-mode network, constructed using the software UCINET [
24], can be plotted, as it is presented in
Figure 6.
4.3. Step 3: Networks Assessment
From this 2-mode network, the network of triggers and the network of employees can be deducted. The cohesion measures from the network of employees are presented in
Table 9.
Regarding the centrality values of the Triggers network, the items from each category with the highest scores at the metrics Degree, Eigenvector, Between, and DwFrag have been identified. They are presented in
Table 10.
Besides, the centrality measures of the nodes of the network of employees have been calculated.
Table 11 present the most critical employees that have been identified considering the top-5 scores at each of the four centrality measures considered.
4.4. Step 4 and 5: Preventive Measures Design and Assessment
Considering the operations particularities of the research center and the centrality metrics obtained, the following set of six measures were initially designed:
Measure 1: Employees 74 and 94 will telework.
Measure 2: Employee 31 will telework, except for developing tests at the laboratory, where he will maintain the access.
Measure 3: Open Space B will be divided into two parts, with different entrance and exit access.
Measure 4: The access to laboratory LA-3 will be restricted to employees 129, 32, 37, and 96.
Measure 5: The management body MNG-2 will only have virtual meetings.
Measure 6: The projects PR-37 and PR-42 will only have virtual meetings.
In
Table 12, the cohesion metrics of the baseline scenario, together with the initial set of measures, are presented.
Although the proposed measures seem to improve all the values, a reinforced set of measures was designed to improve the prevention of outbreaks further. For this purpose, after a new calculation of the centrality metrics, different sets of measures where designed and assessed. Finally, the following set of seven additional measures was added to the previous one:
Measure 1: Employee 203 will telework.
Measure 2: Employees 26, 38, and 53 will telework, except for developing tests at the laboratory, where they will maintain access.
Measure 3: Employees taken part in the management bodies will not attend any project meeting, participating only virtually.
Measure 4: Access to LA-3 will only be permitted for the essential employees and restricted to visitors, thus only allowing Employees 2, 9, 30, 31, 33, 38, 65, 69, 76, 90, 117, 147, 150, 155, and 177.
Measure 5: Access to LA-2 will only be permitted for the essential employees, thus only allowing Employees 69, 147, 150, 161, and 177.
Measure 6: OpenSpace H will also be divided into two zones as was done in OpenSpace B.
Measure 7: Projects PR-46, PR-50, PR-24, PR-9, PR-29, PR-41, and PR-54 will only have virtual meetings.
The calculations of the network of employees’ cohesion measures that may be achieved by the set of reinforced measures are presented in
Table 13. It can be seen how the final measures have a substantial effect on the cohesion metrics of the network.
In addition to these measures directly affecting the composition of the network, additional preventive measures are appointed by the networks metrics, like reinforcing the disinfection of OpenSpace-A and OpenSpace-K, as well as specific awareness campaigns for the employees belonging to the groups SG-2, SG-1, SG-8, and SG-3, which are the biggest contributors to the high metrics of the structural areas SA-2 and SA-3. Finally, tests of those employees with the highest centralities score may contribute to early detection of those cases with the highest probability of kicking-off an internal outbreak.
Although some of the preventive measures designed were intuitive, many other critical employees or triggers have been detected using the proposed methodology. Once identified, they seem reasonable considering the entity operations, but it could be almost impossible to identify all of them with an intuitive approach.
5. Discussion
In order to cope with the COVID-19 pandemic, general recommendations have been given to prevent COVID-19 in the workplaces considering different risk levels and targeting organizational, environmental, and individual measures [
6,
25]. These measures can be reinforced with additional tailor-made preventive interventions relying on the company data able to represent the social network of employees. The proposed methodology contributes to developing a kind of precision-medicine approach in the field of preventive healthcare, which is of an increasing interest in recent years [
26,
27].
SNA is a powerful tool to extract knowledge from massive and unstructured data [
28] related to social networks. In recent years, SNA involving two-mode networks has been successfully used at country-level to model and analyze outbreaks [
29]. Similarly, the methodology proposed in this paper of applying SNA in workplaces for reducing risks of contagion has revealed significant insights regarding cross-correlations between contagion triggers and workers, including non-intuitive ones. The concept of reducing the cohesion metrics of the network by acting on those nodes—triggers or employees—with the highest centrality metrics, has been illustrated and demonstrated with actual data in a real case study: A medium-size Spanish research center.
The proposed methodology has resulted to abstract the structure and dynamics of the relations between the employees and to identify those critical workers or triggers to which preventive measures should be addressed to achieve the highest impacts. The demonstration of the proposed methodology has provided relevant non-intuitive information: Spaces with the highest risk, people with the greatest potential to spread the virus, meetings or projects serving as a driver for the virus to move around the organization, etc. Interventions addressing these critical nodes have been designed to resume the center activity in a safer way.
6. Conclusions and Future Perspectives
It has been seen how SNA may be a complementary tool contributing to the design and selection of tailor-made preventing measures for reducing the risk of internal outbreaks in companies and institutions of the human-to-human transmitted virus, like SARS-COV-2. An easy to follow methodology, ready to be adapted to each entity information system and particularity has been defined. This methodology provides quick results that should be interpreted by specialists on Occupational Health and Safety with basic training on SNA focused on those concepts involved in the methodology.
Although valuable results for guiding the design and definition of preventative measures are achieved, the methodology is limited by many aspects that have not been considered. The two main aspects that could be further integrated into the analysis are the power of the triggers and the employee’s likelihood of spreading the virus. Additionally, the effects of a potential contagion on each employee, i.e., the vulnerability of the employee or cohabitation with vulnerable people, could be a crucial point to incorporate into the methodology.
The possibility of assigning attributes to the nodes is seen as the most promising solution for overcoming the limitations established. For the triggers, attributes regarding their power could be evaluated for each category. As an example, a shared location with enlarged space between people, which is disinfected daily, is less likely to be a contagion trigger than the same location crowded and without regular disinfection. The development of indicators and its evaluation for standardized circumstances for each trigger category will be key for the assignation of attributes to the trigger nodes.
Regarding the employees, attributes regarding their likelihood of spreading the virus could be considered. As an example, if they already overcame the disease and are now immune, their likelihood of contagion should be lowered. Additionally, data related to the employee residential address, like the number of cases in his or her postcode, may also be considered. Finally, the health conditions of the employee regarding its vulnerability, as well as the social ones, like his or her cohabitation with vulnerable people, could be an interesting point to consider. Nevertheless, the collection and use of this information are regulated by personal data protection laws, which may hamper its utilization.


