Socio-Economic and Environmental Analyses of Sustainable Public Transport in the Philippines


1
Copernicus Institute of Sustainable Development, Utrecht University, Princetonlaan 8a, 3584 CB Utrecht, The Netherlands
2
Utrecht University School of Economics, Utrecht University, Kriekenpitplein 21-22, 3584 EC Utrecht, The Netherlands
3
Research Center for Human Development Studies, University of Science and Technology of Southern Philippines-Cagayan de Oro Campus, Misamis Oriental 9000, Philippines
4
Mindoro State College of Agriculture and Technology, Calapan City Campus, Masipit, Calapan City, Oriental Mindoro 5200, Philippines
*
Author to whom correspondence should be addressed.
Sustainability 2020, 12(11), 4720; https://0-doi-org.brum.beds.ac.uk/10.3390/su12114720
Submission received: 18 May 2020
/
Revised: 3 June 2020
/
Accepted: 5 June 2020
/
Published: 9 June 2020
(This article belongs to the Special Issue Electrification for The Automotive Sector Towards Sustainable Mobility)
Abstract
:Electric vehicles are regarded as energy transition technology towards more sustainable and environment-friendly transportation systems. Despite the benefits of reducing the dependence on fossil fuels and greenhouse gas emissions, the adoption of electric vehicles faces several obstacles ranging from financing issues, government policies, and public acceptance. This study aims to identify the economic, environmental, and social impact of the adoption of electric vehicles for public transportation. Using the Philippines as a case study, the findings highlight the economic advantage of investing in electric public transportation with high public acceptance. The results further identify significant decrease in air pollution, reduction of greenhouse gas emissions and encourage lowering the reliance on imported fossil fuels by shifting the public transport from conventional to electric transport system. This study recommends stricter implementation of government policies on modernized public transportation, stronger government support on financing mechanisms, establishment of charging stations in public and private terminals, and boosting programs for developing local-made electric vehicles. To make electric vehicle more environment-friendly, the government must accelerate the energy transition by increasing the electricity share from renewable sources and investing in more sustainable sources of energy.
1. Introduction
Environmental problems relating to air pollution and greenhouse gas (GHG) emissions from combustion of fossil fuels have prompted different countries and regions to find more sustainable modes of transportation. Electric vehicles (EVs) have emerged as highly promising technology that are expected to play a major role in energy transition towards a sustainable transport system in the next decades. In 2018, over two million EVs were sold worldwide and this number is expected to rise to 56 million by 2040 [1]. With this trend, EVs are expected to significantly reduce GHG emissions, improve air quality, lessen dependence on fossil fuels, and enable the transition to renewable energy and sustainable transportation [2,3]. In most developed countries, governments are giving financial incentives including subsidy schemes, purchase tax incentives, rebates and specific local extra-regulatory benefits for EVs owners; providing legal measures and privileges that support EVs; and developing public charging infrastructures to make the adoption of electric mobility more attractive [4,5,6,7]. On the other hand, in developing countries, governments give modest incentives like import duty reductions and purchase subsidy; encourage shifting to non-motorized vehicles and biofuel blending for transportation and industrial uses; battery swapping and charging stations; and adaptation of EVs that suits the local settings such as electric scooters in India, electric “tuk-tuks” in Thailand and Kenya, and electric jeepney (e-jeepney) and electric tricycle (e-trike) in the Philippines [8,9,10]. Despite its promise, investment in EVs in developing countries is challenged by high overnight cost, availability of charging infrastructure, policy support, and low public acceptance. These challenges give us the motivation to make a study that analyzes the adoption of EVs for public transportation focusing on developing countries.
Numerous works discuss the investment in EVs for public transportation from various perspective. The most common economic indicators include total cost of ownership (TCO), least cost, net present value (NPV), payback period (PBP), internal rate of return (IRR), and return on investment (ROI) [11,12,13,14]. For instance, [12] compared the TCO of battery EVs and internal combustion vehicles for local health authorities, municipalities, and special purpose authorities between passenger cars and mixed-use small light commercial vehicles. The research highlights economic sense to adopt EVs for a positive although relatively small percentage of the public sector fleet under the current price and cost structure. In another study, [13] proposed a dynamic model based on the TCO from well to wheel, together with NPV, IRR, and PBP for the three groups of transportation, namely diesel, compressed natural gas, and electric buses in Turkey. The results identified that the electric bus concept with a charging station depot achieving sustainable and zero-emission goals drive the advancement of electric bus concept for Istanbul Public Transport. Further, [14] analyzed the difference in costs of two types of buses serving urban public transportation systems in Latvia: diesel-fueled internal combustion engine bus and battery electric bus. The findings showed that initial investments of changing public transportation fleet to electric buses and the costs of battery replacement still outweigh the monetary advantages gained from lower operational costs and additional environmental benefits. Considering the market price uncertainty as a factor that affects investment, [15] extended the TCO into a real option model to identify the optimal timing of adoption of EVs. The results found that even without subsidies, EVs are more cost-effective than internal combustion engine vehicles and as the fluctuation of fuel price becomes more stable, consumer preference to EV products increases. Another study used the real option model to analyze the adoption of EVs under uncertainty in fuel prices [10]. Their results identified a more optimal decision to invest in EVs over diesel-fueled vehicle in the current business environment.
As public transportation is a “public good”, its evaluation from purely private cost basis will always be uneconomic. The social benefits arising from better public transport system such as GHG emissions reduction, social inclusion, development opportunities, and public acceptance should also be accounted for. Several studies integrate economic analysis with social and environmental impacts of the adoption of EVs for public transportation. For instance, [16] evaluated an optimal bus fleet combination for different driving conditions that minimize life cycle cost, GHG emissions, and conventional air pollutant emission impacts. The research found that electric bus is the dominant vehicle type for heavily congested driving cycles, the hybrid bus has more balanced performances due to lower initial investment compared to electric buses, while petroleum buses have seldom been selected in the model. In another study, [17] proposed a holistic, reliable, and transparent comparison of battery EVs and fuel cell EVs considering their environmental impacts (EI) and costs over their whole life cycle. Applying the life cycle assessment (LCA) and a life cycle costing, the findings show that battery EVs achieve lower environmental impact and TOC compared with fuel cell EVs. Considering the public acceptance, [18] examined the prevailing obstacles for market diffusion which encumber the development of EV technology adoption. Their results demonstrate that EVs acceptance in the case of Malaysia can be explained as being significantly related to social influences, performance attributes, financial benefits, environmental concerns, demographics, infrastructure readiness, and government interventions.
This paper aims to contribute to the existing literature by proposing a more inclusive valuation framework for the adoption of EVs for public transport using the Philippines as a case study. The main objective of this research is to compare EVs and combustion vehicles for public transportation in terms of economic and environmental impacts as well as social acceptance. Economic indicators include the NPV, PBP, ROI, public utility vehicle (PUV) driver salary, and owner profit. Environmental impact analysis includes GHG emissions, electricity demand, fossil fuel demand, and air pollutants such as particulate matter (PM), nitrogen oxides (NOx), sulfur oxides (SOx), and carbon monoxide (CO) emissions. The social acceptance takes the perspective and outlook of various transportation stakeholders including PUV driver and passengers, other stakeholders (business owners, investors, gas/electricity distributors, PUV manufacturers), and experts (law, policy, governance, environment, labor, engineering, academe). This study finally aims to suggest government policies to support the adoption of EVs and to realize the government’s goal of a more sustainable public transport system.
2. Methodology
2.1. Case Study Background
The Philippines is a developing country in Southeast Asia with a population of 109 million people. Transportation is a key sector in the country that links population and economic centers across the islands, consisting of road, water, air, and rail transport. Due to the archipelagic nature of the country, air and water transport play a crucial role in transportation; however, road transport dominates the subsector accounting for 98% of passenger traffic and 58% of cargo traffic [19]. Among the PUV in the country, the jeepneys, refurbished American vehicles left after the Second World War, are the most popular with around 270,000 franchised units on the road across the country [10]. Another common mode of public transportation is the tricycle, like a three-wheeled rickshaw or “tuk-tuk”, that is a motorcycle with attached side car for carrying passengers [20]. In 2017, there are around 6.16 million registered motorcycles and tricycles in the country. Other modes of public transport include light rail transit (LRT), buses, all-utility vehicles, taxis, and pedicabs (non-motorized rickshaws) [21].
Due to the country’s fast economic growth, the PUV are expected to rise in numbers and contribute to more traffic congestion, GHG emissions, and pollution. According to the Manila Aerosol Characterization Experiment (MACE) in 2015, old technology diesel PUV, particularly jeepneys being only 20% of total vehicular fleet, contribute up to 75% and 94% of total roadside emitted refractory particle number and soot mass in Metro Manila, respectively [22]. To address this problem, the government signed the Clean Air Act, which aims to maintain clean air that meets the National Air Quality guideline values for criteria pollutants while minimizing the possible associated impacts to the economy [23]. This law requires all private motor vehicles and PUV to update engines and allows the renewal of registration upon the approval of the Land Transportation Office (LTO) or other authorized vehicle inspection center. To reduce GHG emissions, the government launched the PUV Modernization Program (PUVMP) which aspires to make the public transportation system more efficient and environment-friendly by phasing out old PUVs that are at least 15 years old and replacing them with safer, more comfortable and more sustainable alternatives. These include electric jeepney (e-jeepney), electric bus (e-bus), electric tricycle (e-trike), and their EURO-4 diesel vehicles counterpart or better. Compared with conventional PUV (c-PUV), electric PUVs (e-PUV) and modernized diesel vehicles are compliant with EURO-4 standards or better, in accordance with the emission standards set by the Department of Environment and Natural Resources; have convenience and comfort features such as priority seats for senior citizens and persons with disabilities as well as onboard Wi-Fi and USB ports; and other features such as automated fare collection system, global positioning system (GPS) tracking system, and closed-circuit television (CCTV) cameras [24]. The PUVMP aims to employ around 100,000 e-trikes annually and 200,000 e-jeepney or EURO-4 jeepney (or better) in the next six years. Currently, the price of e-trikes ranges from USD 3500 to USD 9500 and USD 25,000 to USD 30,800 for e-jeepneys which are relatively more expensive than their counterparts. To support operators and owners adopting the PUVMP, the government gives “5-6-7-8” financial incentives, including 5% subsidy for each unit of vehicle, 6% interest rate for purchase loan payable in 7 years, and maximum PHP 80,000 (USD 1500) equity subsidy.
Another issue that PUVMP intends to address is the elimination of the “boundary system”. In this system, the individual PUV drivers pay a daily rental fee called “boundary” to the PUV owner or operator. To maximize the 12-hour/day rent, the drivers tend to wait for passengers to ensure that PUVs are full at the terminal stations before they start the route and not according to a timetable [25]. The introduction of PUVMP aims to abolish this system and reform the entire public land transportation industry. For instance, PUV drivers will have a standardized income for an 8-hour working day with regular employment benefits; single unit operators will no longer be eligible for a franchise but required to have a minimum of 40 PUV units. Compared to the current franchising system where jeepney operators propose the routes of jeepneys, the PUVMP franchising system will be fully regulated by the government [24].
2.2. Financial Valuation
We divided the financial analysis into two PUV system operations: boundary and PUVMP. In the “boundary system”, the driver rents a PUV and pays the owner or company a fixed amount “boundary” for driving a PUV. The driver’s take-home pay is equal to the earnings from passenger fares minus the “boundary” , and gas or diesel cost, terminal fee, and a tip for the “dispatcher“, or the person who calls for passengers to ride the PUV. The driver’s take-home pay or “salary” is shown in Equation (1).
where and are price and quantity of gas, diesel, or electricity; and is other cost as described above. On the other hand, the owner’s or company’s annual profit is equal to the total boundary payed by the driver minus the operations and maintenance costs which include registration, maintenance, and insurance as shown in Equation (2).
In the PUVMP system, the drivers get fixed salaries, social and health insurance benefits, 13th-month pay and optional bonus, and are entitled to vacation and sick leaves. The owner or company’s annual profit is then equal to annual earnings from passenger fares minus fuel costs and the operations and maintenance costs which include the driver’s salary and benefits, registration, insurance, and other fees as shown in Equation (3).
To compare the financial viability of c-PUV and e-PUV, we applied the NPV, PBP, and ROI. First, the NPV of the project is the value of all future cash flows over the entire life e-PUV operation discounted to the present period [10,26] as described in Equation (4).
where is the type of vehicle; is the period of transport operation up to ; is the discount rate for the project; is the investment cost equal to the purchase cost and franchise cost minus subsidy for e-PUV; and is the salvage value for scrapping the vehicle unit after the period of operations.
The PBP refers to the amount of time it takes to recover the cost of e-PUV investment. This is equal to the cost of the investment divided by the annual net cash flow [10], as described in Equation (5).
2.3. Environmental Impact Assessment
An environmental impact assessment (EIA) is a process predicting the consequences of a project’s development on the environment, natural resources, and public health [28]. In this study we compared the environmental impacts of c-PUV and e-PUV in terms of GHG emissions, air pollution, and energy demand.
As described in Equation (7), we estimated the GHG emissions for c-PUV from the annual fuel consumption and the emission factor for the fuel used. On the other hand, the GHG emissions for e-PUV was estimated from the annual electricity consumption and the summation of the product of emission factors and the percentage of each energy source from the country’s power generation mix. For the estimation of GHG emissions, energy mix, and emission factors, we used the data from [29,30,31].
For the air pollution, we considered the compounds produced from direct combustion of fuel from c-PUV and the indirect emission from electricity consumption of e-PUV. We focused our analysis on four compounds including particulate matter (PM), nitrogen oxides (NOx), sulfur oxides (SOx), and carbon monoxide (CO). PM is a mixture of extremely small solids and liquid droplets emitted with the combustion of fossil fuels which poses major risks, such as asthma, lung cancer, heart disease, stroke, type 2 diabetes, and loss of cognitive function [32]. The NOx are pollutants, including nitrogen dioxide, nitric oxide, nitrous acid, and nitric acid, which cause a range of respiratory and pulmonary complications such as ischemic heart disease, stroke, chronic obstructive pulmonary disease, and lung cancer [33]. The SOx are formed from the combustion of sulfur-containing fuels along with volcanic activities and industrial processes which cause respiratory irritation and dysfunction, aggravation of existing cardiovascular disease, and damage to the eyes, mucous membranes, and skin [34]. Moreover, SO2 reacts with water in the atmosphere to form acid rain which destroys forests and ecology, disrupts the acidic balance of the aquatic environment, and causes corrosion on building materials [35]. CO is an odorless, colorless, and poisonous gas formed from the incomplete combustion of fossil fuels which may block oxygen from the brain, heart, and other vital organs. Once it reaches the blood cells, it attaches to the hemoglobin in place of oxygen, diminishes the quantity of oxygen that reaches the organs, and reduces physical and mental abilities which may rapidly lead to death [36].
For the estimation of each air pollutant where is PM, NOx, SOx, and CO, we multiplied the average annual fuel consumption for c-PUV or average electricity consumption for e-PUV ; the fuel economy for each type of vehicle; and air pollutant factor as described in previous literatures [37,38]. The estimation of each air pollutant is shown in Equation (8).
Finally, we identified the impact of the adoption of e-PUV on the country’s energy resources. Using Equation (9), we estimated how much electricity is needed to supply the fleet of e-PUV, as well as the fuel saved from shifting technologies from c-PUV to e-PUV.
2.4. Social Acceptance
Public perception towards EV and general willingness to use EV play an important role to promote a more sustainable transport system [39]. In this study, we conducted a survey on (a) the PUV driver’s willingness to drive or commuter’s willingness to ride e-PUV over c-PUV; (b) the respondent’s outlook on full electrification of public transport system; and (c) policy recommendations for a more sustainable public transport system. The survey was conducted from July to September 2019. An online survey was used for PUV commuters. As most stakeholders, particularly PUV drivers, had no access to online surveys, a face-to-face interview was conducted to explain the purpose of the survey, the anonymity of the respondents, the confidentiality of the responses, and ask consent for publishing the result of the survey. We randomly collected 1371 responses and used 1319 as some responses were rejected due to incompleteness. The respondents covered various aspects of transport operation from the demand side to producer, service, business, technical, and legal perspectives, and are categorized into commuters, drivers, other stakeholders, and experts as shown in Table 1. The passengers and drivers are those who ride or drive public transport vehicles such as bus, van, jeepney, taxi, uber, grab, tricycle, and scooter. Other stakeholders include transport operators, investors, and businesses affected by PUVMP such as PUV manufacturers, auto parts sellers, mechanic shop, financial institution, gas station, and electricity distributors. The transportation experts include policy makers, economists, public officials, lawyers, engineers, environmentalists, urban planners, labor group leaders, transportation consultants, and university professors. In conducting the survey, we adhered to the Research and Publication Ethical Guidelines set by the publisher. All respondents gave their informed consent for inclusion before they participated in the study. The study was conducted in accordance with the Declaration of Helsinki, and the protocol was approved by the Research School of the University of Science and Technology of Southern Philippines.
3. Results and Discussion
Table 2 and Table 3 summarize the results of financial analysis between c-PUV and e-PUV with different systems. The results show positive NPVs which indicate positive returns for all types of investment projects. Despite the high investment cost, results reveal the best investment opportunity for e-jeepney with up to USD 62,000 of NPV for 10 years of operation. In terms of ROI and PBP, results favor e-trike over other alternatives with an investment recoverable within 10 months of operation and returns of 11 to 12 times of the initial investment in 10 years of operation. Our results imply that e-jeepney is the best investment option if the investor can pay the huge initial cost of USD 25k-USD 30k per unit (USD 10k to USD 15k per unit for traditional jeepney), otherwise they should invest in e-trike at USD 3.5k-USD 9.5k per unit (USD 1.2k to USD 2k per unit traditional tricycle). From the perspective of drivers, transport operators and owners, e-PUVs yield higher take home pay compared with c-PUVs. The main reasons for these results include higher earnings from larger seating capacity of e-PUVs, more energy efficient EVs, and cost savings from using electricity. These support previous claims that investing in e-PUVs in the Philippines is more profitable than c-PUVs due to higher passenger capacity, lower fuel consumption, energy efficiency, and safer body design [10,20,40].
We also found that from operators’ and investors’ point of view, the PUVMP system favors investment in e-PUVs with higher annual profits for owners, higher NPV, lower PBP, and higher ROI. For instance, despite the high investment cost, e-PUVs have higher NPV due to fuel cost savings and higher revenues from increased base fare. On the other hand, the PUVMP disfavors the drivers with lower take home pay. This is because with the current boundary system, the drivers work as many hours as they can, subtract the fuel costs from the daily earnings, pay the owner a fixed amount called “boundary”, and the remaining money is their take home pay or daily salary. Further, this system promotes on-street competition and disinclines drivers to comply with designated stops, which generates more revenue compared to a system operating on a reliable schedule, which promotes more public transport use [41]. With this system, a driver can earn as much as USD 2500 for tricycle, USD 5470 for e-trike, USD 4670 for jeepney, and USD 6710 for e-jeepney per year. However, the drivers have no benefits other than daily take home pay. With the PUVMP, the drivers work for 8 h per day, receive a monthly salary, and enjoy regular employment benefits under the law including vacation and sickness leave, 13th month pay, optional Christmas bonus, health insurance, social security, and pension contribution. These benefits make the drivers still better off with PUVMP compared with the boundary system which the government aims to eliminate in the next few years.
3.1. Environmental Impact
The results of GHG estimations in Table 4 show a 75% decline in emissions for tricycles and 87% for jeepneys. These sum up to an 85% GHG emission reduction of the whole fleet, from 14.98–21.23 Mt CO2 eq/year to 2.23–3.13 Mt CO2 eq/year. The reduction in GHG emissions is due to higher energy efficiency of e-PUV and lower GHG emission factor of 0.56 kg CO2 eq/kWh electricity consumed compared to 2.7 kg CO2 eq/L fuel for combustion vehicles. This supports previous claims that EV has lower GHG emissions compared to internal combustion engines [42,43,44]. It should be noted that emissions from e-PUV are still larger compared with the results from the literature and other countries. This is due to the energy generation mix in the Philippines being dominated by coal and natural gas, which have high GHG emissions [45]. The findings highlight two important points: Adoption of EV does not guarantee zero net emissions but a significant emission reduction, and that emissions can further be reduced if the electricity used by e-PUV comes from renewable energy sources [43].
In terms of energy demand, adoption of e-PUV will save up to 5.28–7.93 million barrels of gasoline per year and 8.81–12.33 million barrels of diesel per year for the PUV fleet. As the country is importing 52% of its 118.8 million barrels of gasoline demand and 65.3% of its 205.2 million barrels of diesel oil demand [46], the estimated energy savings implies a reduction of imported gasoline to 37.42%, and 33.39% for diesel. On the other hand, adoption of e-PUV increases the electricity demand by 1950–2670 GWh per year. Currently the country has 6592 MW dependable generating capacity from renewable energy sources producing 23,326 GWh of electricity per year [31]. With the PUVMP, adoption of e-PUV requires an additional 750 MW of dependable generating capacity from renewable energy sources. This demand implies huge investments in renewable energy infrastructures, which further supports the country’s goal of increasing its renewable energy capacity to 60% by 2030 [47].
In terms of air pollutants, the adoption of e-PUV decreases the PM, NOx, SOx, and CO emissions by an average of 96%, 82%, 59%, and 93%, respectively. Our estimated results are relatively higher compared with previous studies [48,49] as our case study analyzed the conventional public transport which are less energy efficient, dilapidated, and smoke-belchers. Hence, the adoption of e-PUV significantly reduces the air pollution and its associated health effects, particularly ischemic heart disease, stroke, lung cancer, chronic obstructive pulmonary disease, and acute lower respiratory infections [50].
3.2. Social Acceptance and Outlook
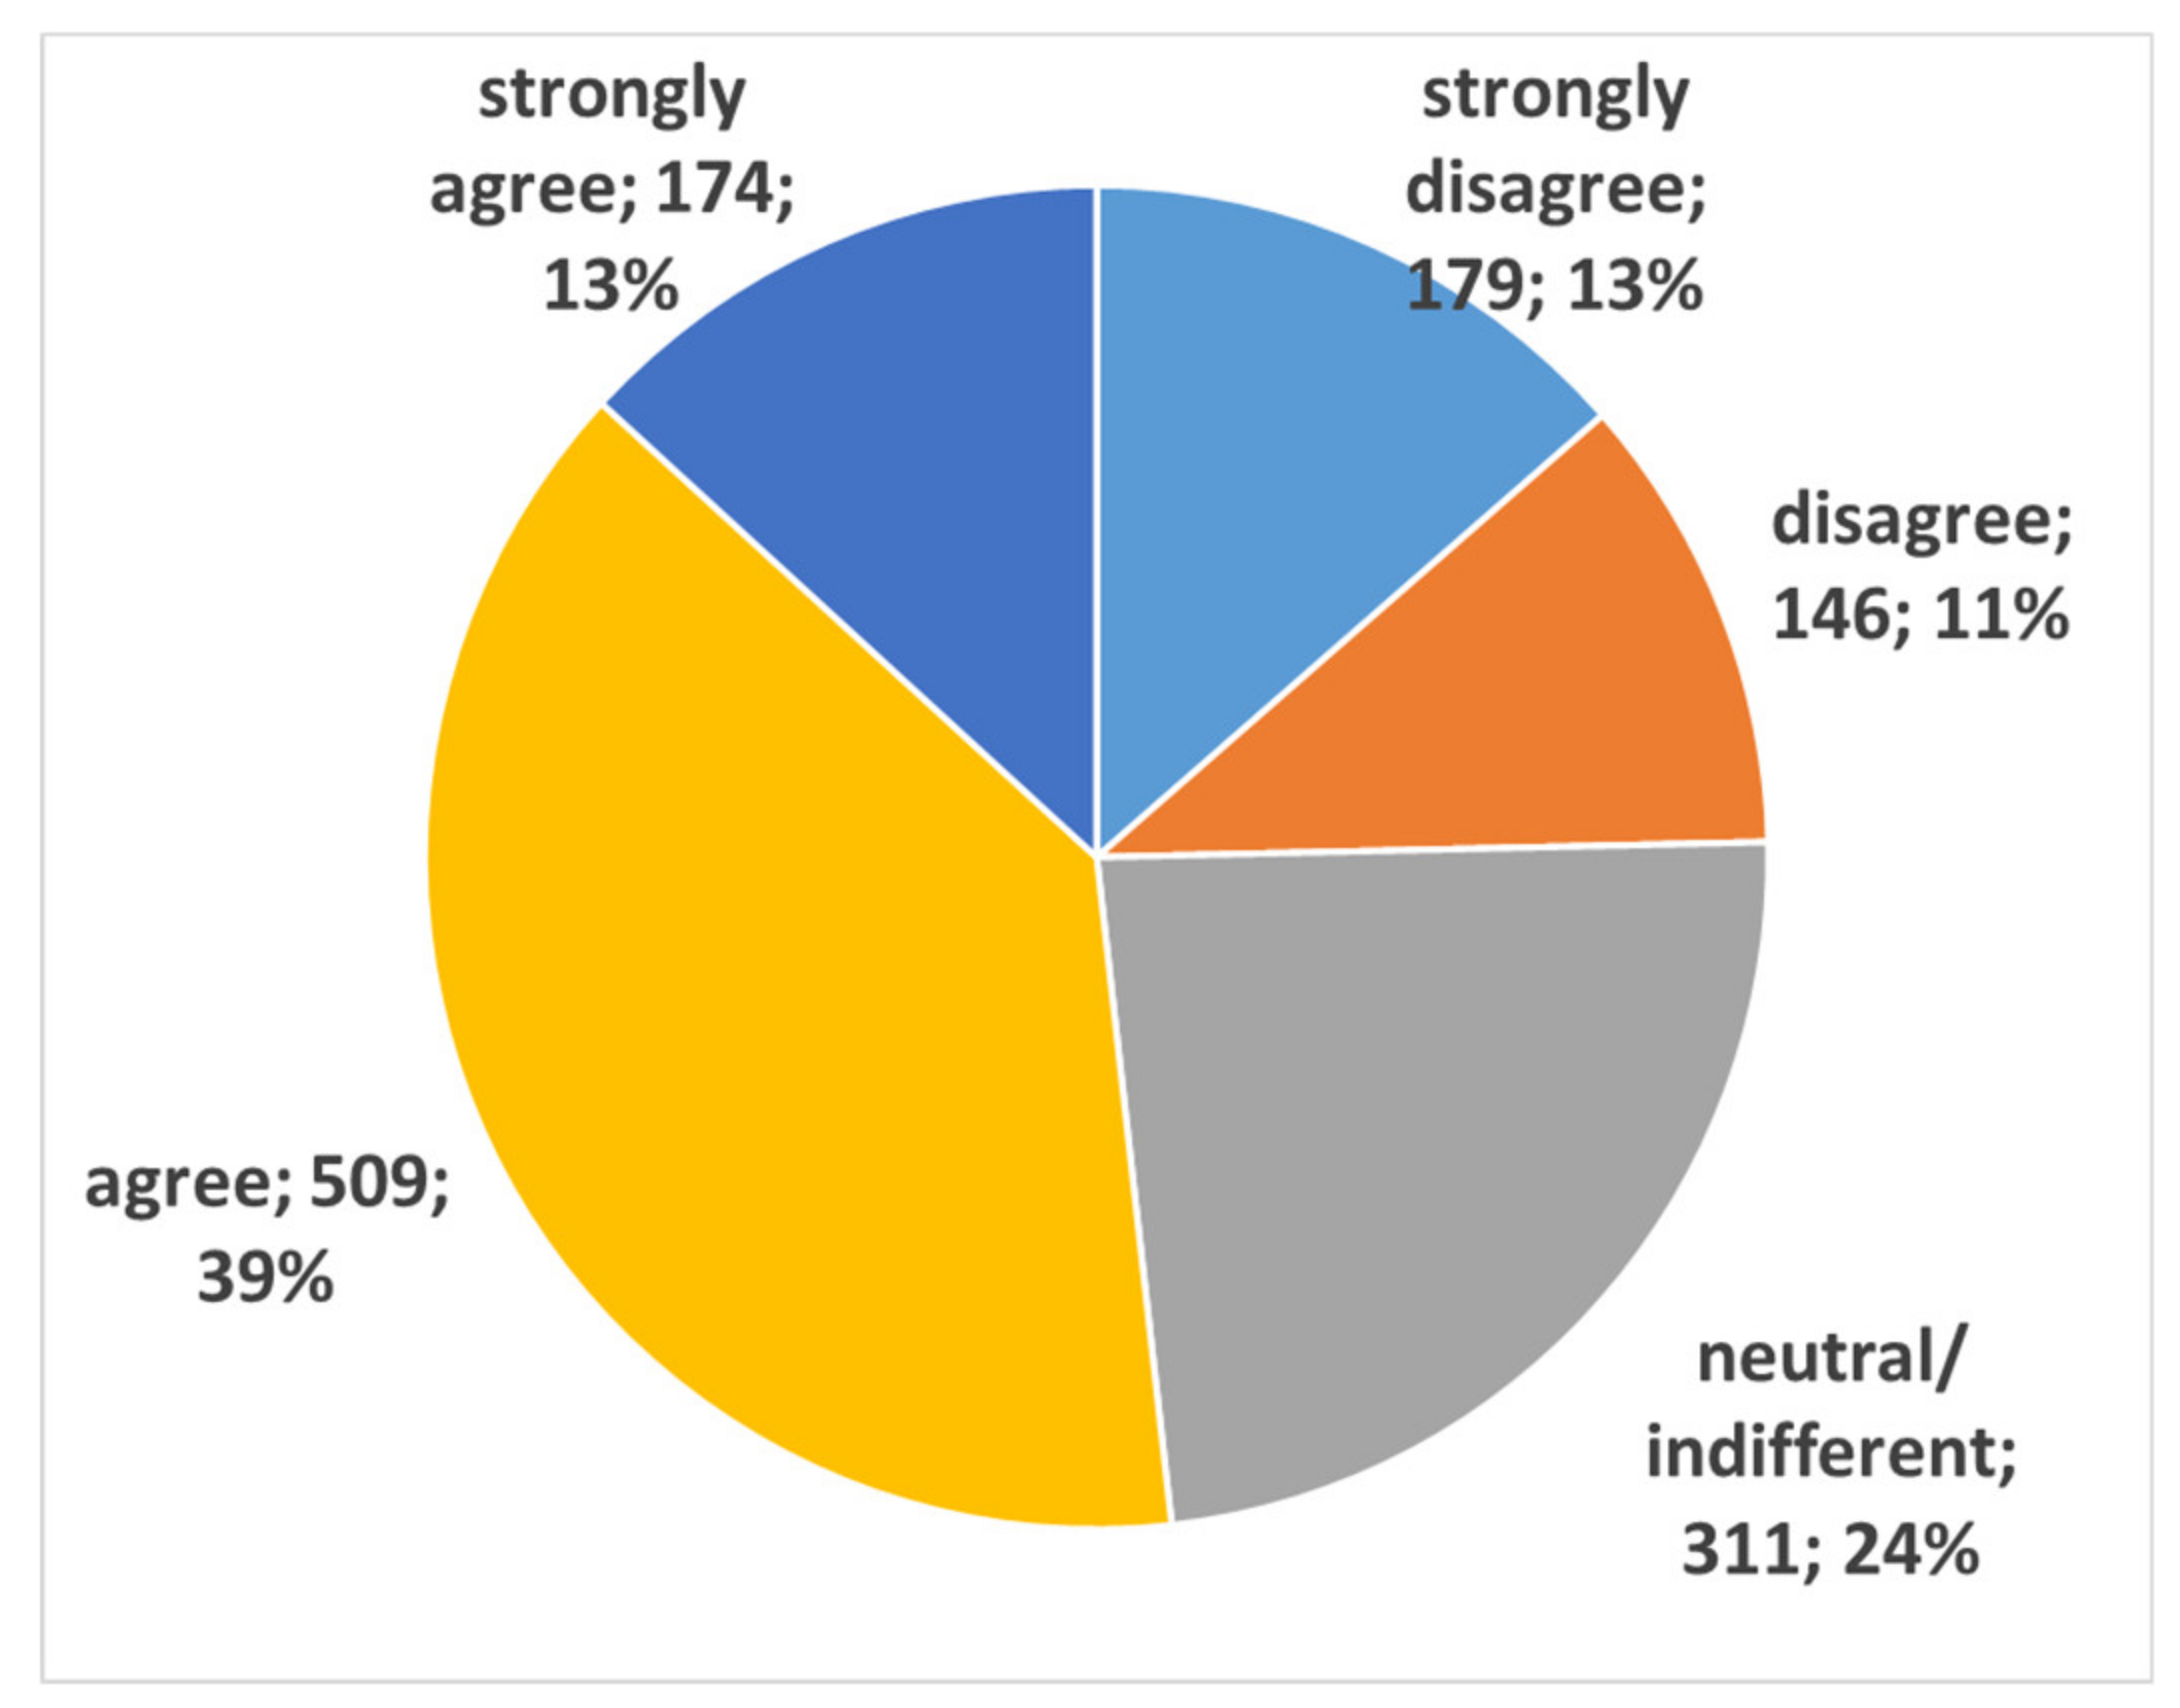
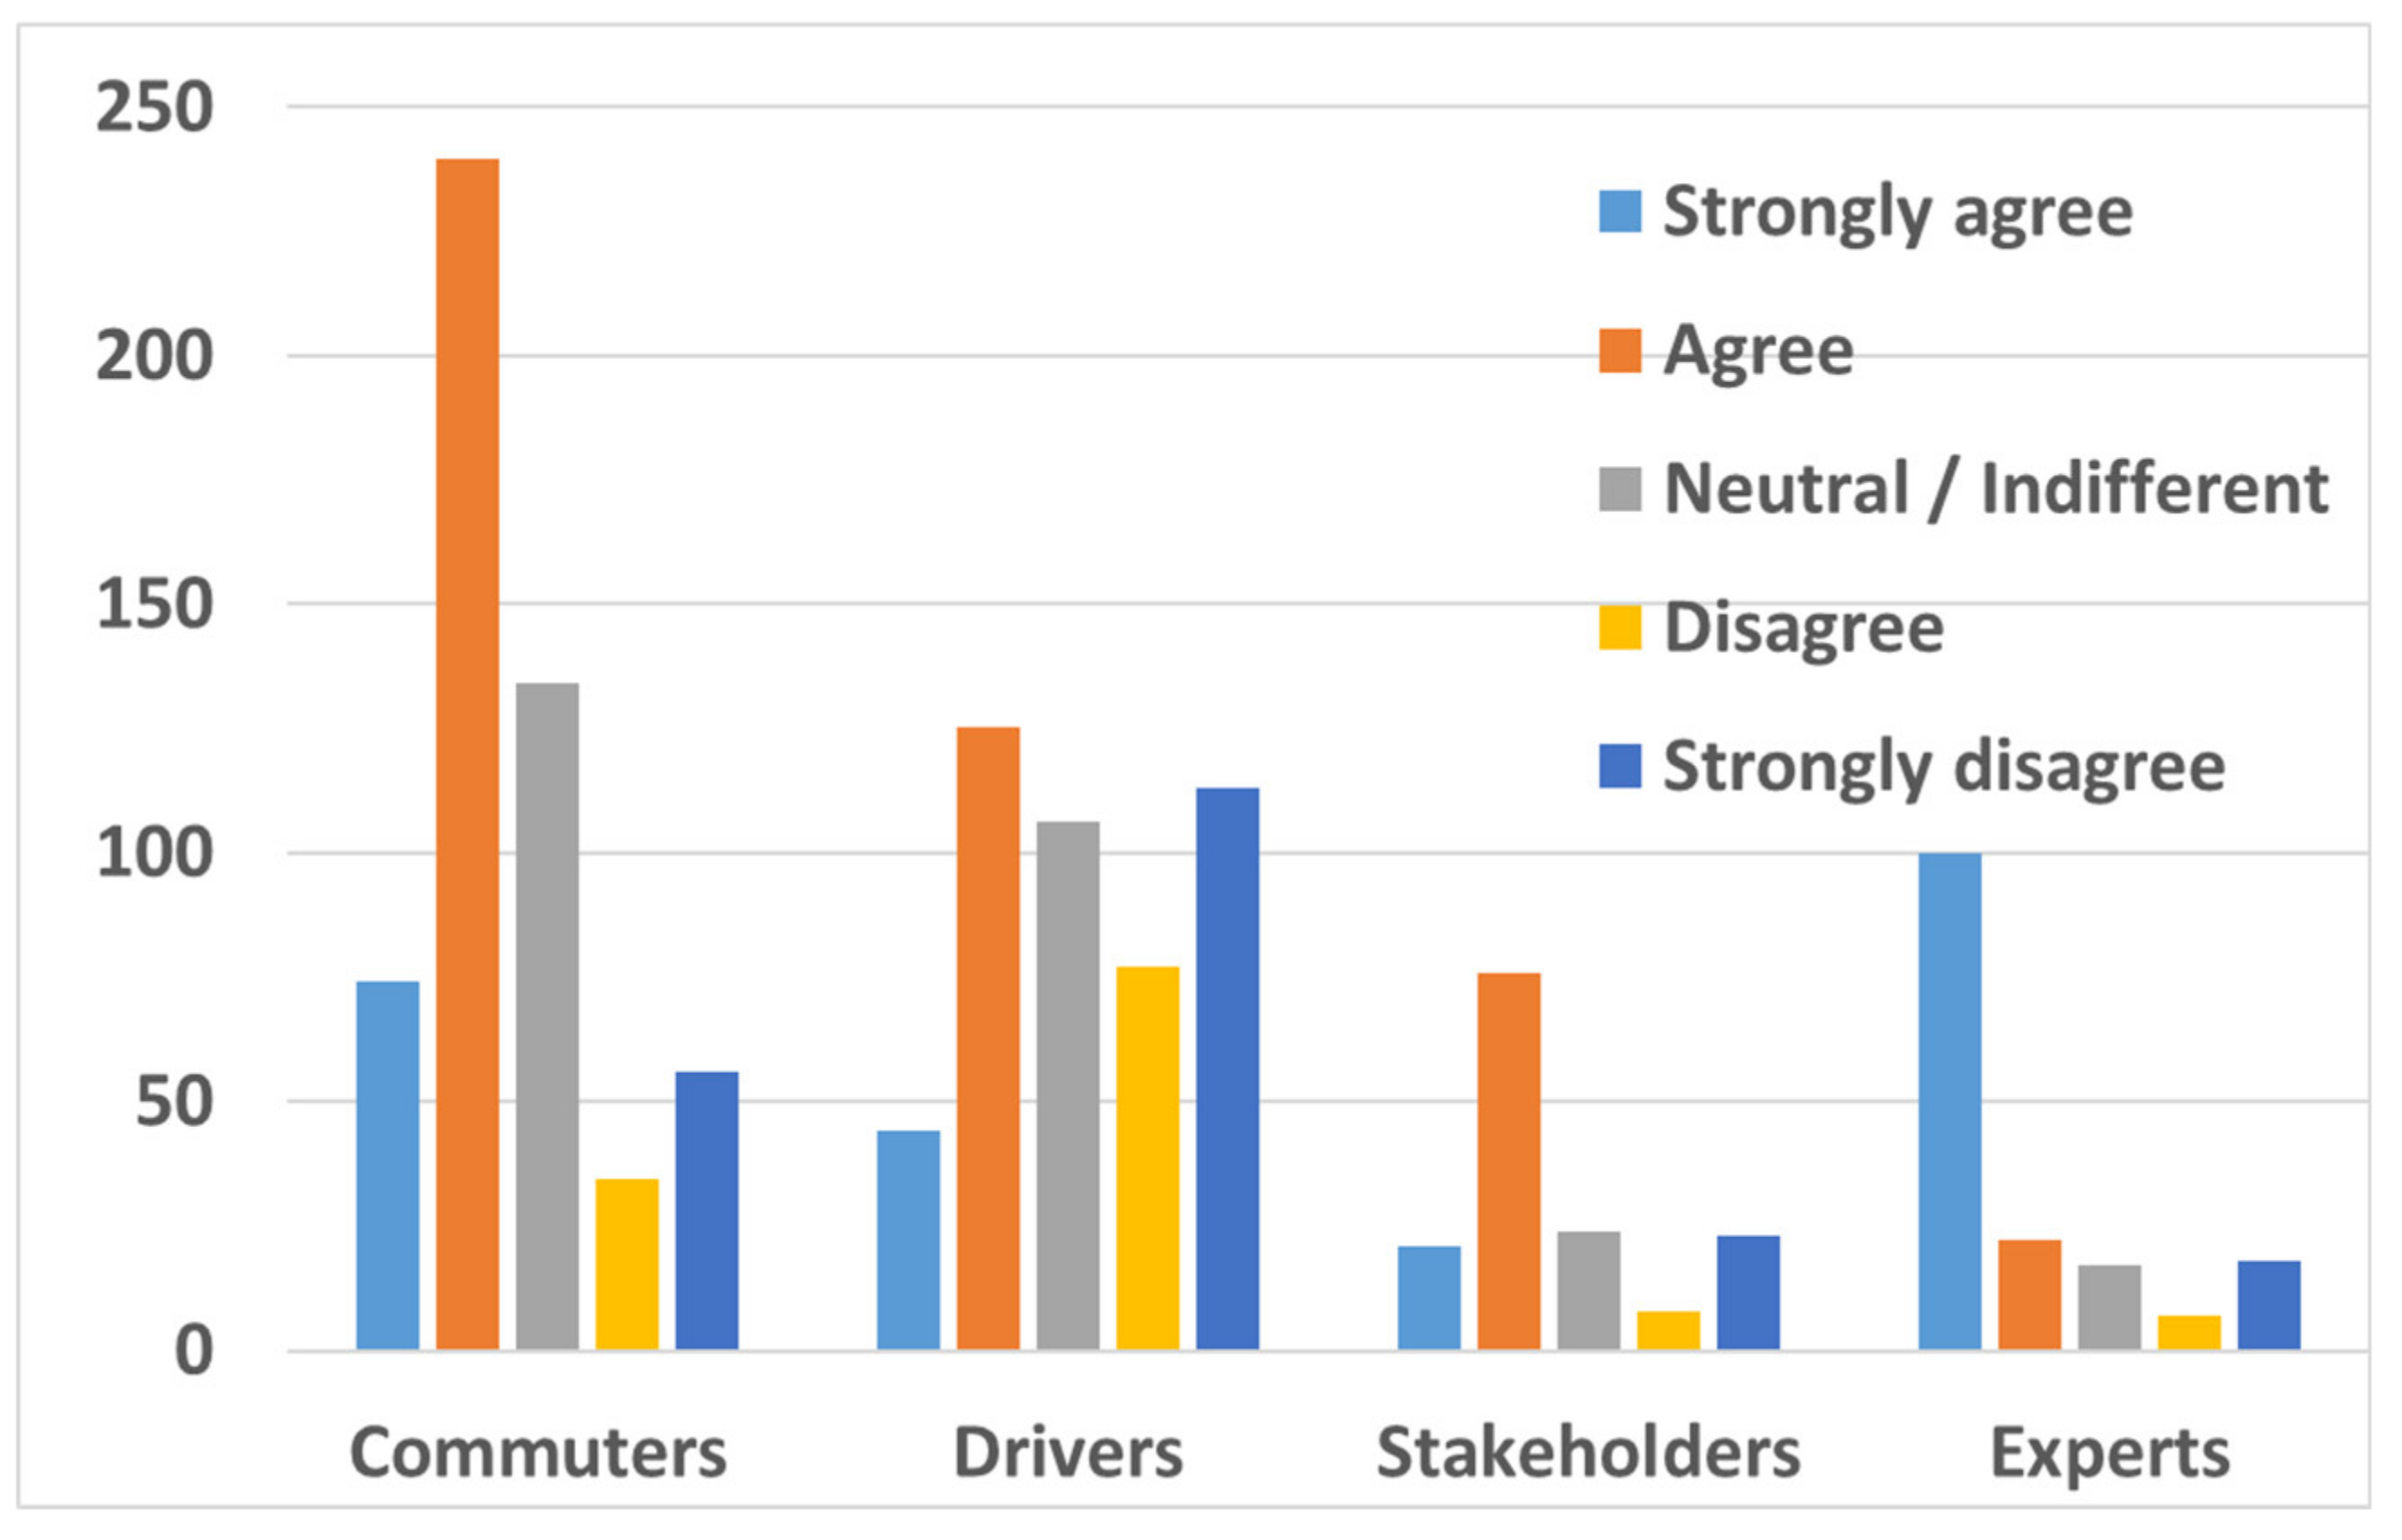
The results from Figure 1 show that the respondents prefer e-PUV over c-PUV. This finding confirms a previous study that among neighboring Asian countries, the Philippines has the highest public perception, with 46% of Filipinos expressed interest in owning or driving an e-vehicle (e-jeepney or e-trike) while more commuters preferred to ride EVs than the conventional transportation in areas where EVs are available [51]. Our results are slightly higher than previous study as the present government is eagerly pushing the full implementation of PUVMP, active discussion in various forms of media on pros and cons of EVs, and Filipinos’ environmental awareness is now increasing with the adoption of more sustainable modes of public transport [10]. As shown in Figure 1, most commuters, stakeholders, and experts favor e-PUV. On the other hand, PUV drivers favor conventional vehicles due to investment cost and technological issues as shown in Figure 2.
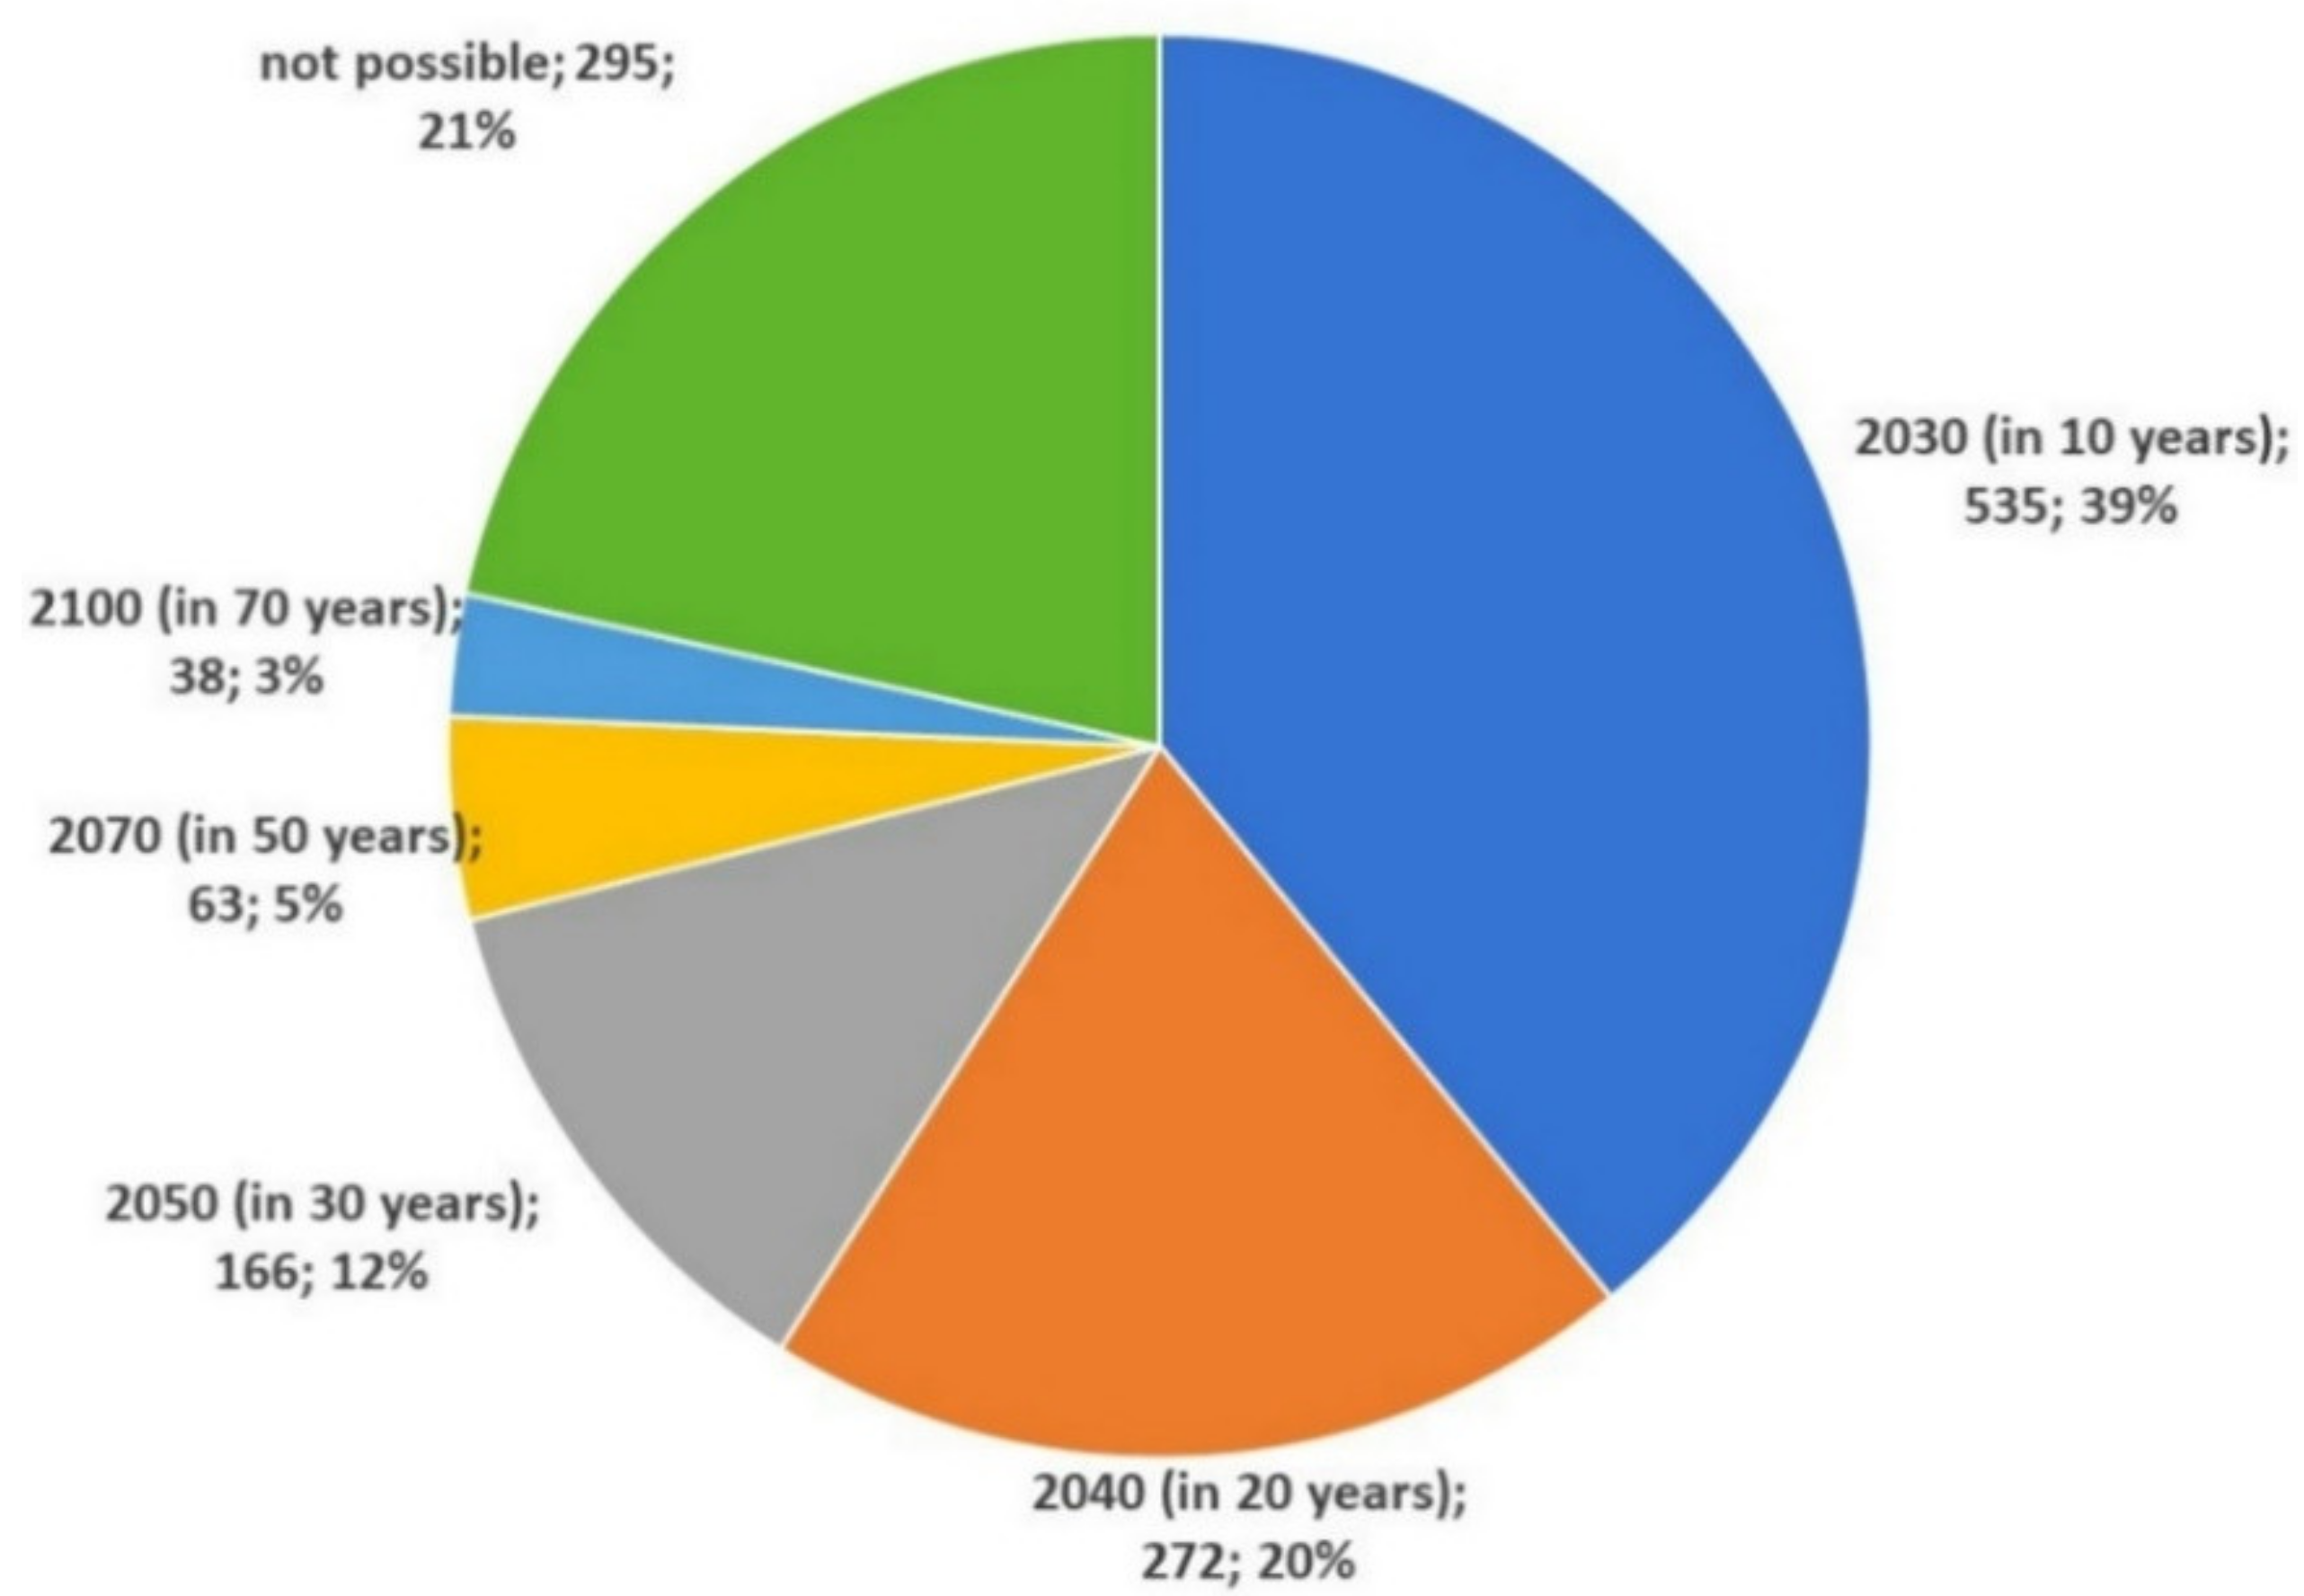
The results in Figure 3 show that 38% of respondents think that electric public transportation will be fully implemented and that c-PUV be fully phased out in the country within 10 years; 20% answered within 20 years; and 15% within 30 years. On the other hand, 20% of the respondents are pessimistic, and believe that full transport electrification in the country is not totally possible.
We finally asked the respondents what other solutions and programs they could suggest for the government to adopt cleaner, environment-friendly, and more sustainable modes of transportation. Of the total respondents, 20% provided suggestions particularly on the implementation of government policies (58); various modes of transportation and infrastructure development (56); information dissemination and skills training (43); and technology innovation (26). The policy recommendations included tax incentives and purchase subsidy for adopters of EVs and strict implementation of the existing laws such as the Clean Air Act, no garage no car, old vehicle replacement, no car sharing, and the PUVMP.
Respondents also suggested other modes of transportation particularly with mass transportation. Currently, the country’s railway footprint is only 212.4 kilometers from four train lines in Metro Manila. Under the “Build, build, build” program, the current administration is now building five of nine additional railway projects across the country, including the first subway line in Metro Manila. Other modes of transportation suggested are walking bicycle and “kalesa”, an iconic two-wheeled vehicle drawn by a horse. These are also backed-up with suggestions on massive railway infrastructures, road widening projects, bike lanes, and pavements for pedestrians to encourage walking/cycling.
While EVs have been regarded as a promising solution to address the pressure to reduce GHG emissions in the transportation sector, gaining and processing EV-related information as the foundation for adoption have been ignored, hence, social media play a significant role in promoting information dissemination and innovation diffusion [52]. Responses from the survey support this claim by expressing the importance of media on informing the public about the benefits of EVs and its relevance in energy transition and climate change. Responses also emphasize the need to update the skills of the drivers as well as to review the basic traffic rules and regulations. Further, the respondents were hoping that the government boost its programs on developing and manufacturing localized EV technologies, which will also benefit not only the transport sector but the economy as well.
4. Conclusions
Electric vehicles appear to be the future of public transportation, addressing global issues including greenhouse gas emissions, pollution, and energy sustainability. An increasing number of studies discuss investments in electric public transport ranging from economic points of view to technological and environmental perspectives. We contribute to the existing literature by offering a more inclusive approach to evaluate whether electric vehicles are better modes of transportation than combustion vehicles in the perspectives of stakeholders, experts, and the commuting public. Using the case of the Philippines, we applied various methodologies including economic analysis, environmental impact assessment, and social acceptance comparing electric and conventional public transport.
Our findings show a better opportunity for transport operators and investors to benefit from investing in electric tricycle and electric jeepneys. When the boundary system is abolished and the public utility vehicle modernization program is fully implemented, the drivers are worse off in terms of daily take home pay but better off from regular employment benefits. With public acceptance, our findings show that respondents prefer to ride or drive electric than combustion vehicle. The respondents are optimistic that electrification of public transport will be fully implemented in the next 10 years. Finally, the environmental impact analysis highlights the benefits of using electric vehicles in terms of significant reduction of air particulates and decreased dependence on imported fossil fuels. While electric vehicles are not totally zero emissions due to the current power generation mix, the significant decrease in greenhouse gas emissions from adopting electric public transport encourages the government to rely on more sustainable sources of energy.
Applying the proposed methodology to developed countries, we expect a highly favorable result towards the adoption of electric vehicles due to better government support, financing, maturity of technology, availability of charging infrastructures, stricter environmental policies, and public acceptance. On the other hand, relatively similar results are expected compared to other developing countries in transition to a more sustainable public transport system. In the Philippines, a total of 1403 units of electric tricycles and jeepneys are deployed over the country as of 2019 [53]. This value is still far from the target number of units and the penetration rate of electric vehicles for public transportation as the adoption is challenged by the limited charging and road infrastructures, a lack of a developed supply chain for batteries and parts, uncertainty regarding standards and requirements, and ownership and usage control restrictions. To facilitate the adoption of electric vehicles, our results recommend the following government policies:
- Stronger financing supporting mechanisms such as investment subsidy, tax benefit for using electric vehicle, and old vehicle scrapping scheme.
- Establishing strategic areas for the adoption of electric public transport in short and flat routes in central business districts, using combustion vehicles with EURO-4 emission standards or better in routes where electric vehicles cannot initially be adopted.
- Investing in public charging infrastructures optimally located in strategic places such as public terminals, parking areas, and gas stations.
- Clearer and stricter implementation of government policies related to fleet consolidation and management, public utility vehicle operational age limit, emissions test, route rationalization, loading and unloading areas, traffic rules and regulations, and labor codes.
- Upgrading the drivers’ and mechanics’ skills on operating electric vehicles and traffic rules.
- Information dissemination on the benefits of using more sustainable modes of transportation and its relevance on energy transition and climate change.
- Developing locally made electric vehicles to boost the economy, lower the investment costs, and create more jobs.
- Promoting non-motorized mode of transportation such as cycling and walking by assigning pedestrian and bicycle lanes.
- Intensifying the investment in mass transportation infrastructures such as light trains, trams, and subway trains.
- Increasing the percentage of renewables in the power generation mix by investing in more sustainable sources of energy.
In this research, we focused our analyses on jeepneys and tricycles as these are the most common modes of public transportation in the case study. Future studies may also consider other land transportation modes such as public buses, scooters, cars, taxis, and trains, and water transportation such as water taxi, ferries, and cargo ships. These will be relevant particularly to archipelagic countries composed of islands that are not connected by bridges. In terms of sampling, this study used 1319 respondents from the survey which may still not be a representative of the whole population. For instance, there are 435,619 public utility vehicle drivers throughout the country [54], but we only have 465 responses from the drivers. While our results conform with previous works on the social acceptance of electric vehicles for public transportation in the country, we set this as a limitation and propose to increase the number of respondents in future surveys to better represent the population. Another limitation is the static financial valuation which estimated the value of investments in public transport discounted at the present period. One of the concerns of drivers and investors included the timing of investment and adoption of electric vehicles. In this case, the real options approach is a more appropriate method which will give value on the flexibility in making investment decisions and identify the optimal timing of investment. Despite these limitations, we believe that this study could be a good benchmark for further analysis of the adoption of cleaner and more sustainable modes of public transportation.
Author Contributions
Data curation, A.A.C. and C.S.G.; formal analysis, C.B.A.; investigation, A.A.C. and C.S.G.; methodology, C.B.A.; project administration, A.A.C.; validation, C.S.G.; visualization, C.B.A.; writing—original draft, C.B.A.; writing—review & editing, A.A.C. and C.S.G. All authors have read and agreed to the published version of the manuscript.
Funding
This research received no external funding.
Acknowledgments
The authors acknowledge the support from Utrecht University, University of Science and Technology of Southern Philippines-CdO Campus, and Mindoro State College of Agriculture and Technology. The authors would like to thank our research assistants: Earl John L. Cabigon and Anniefhiel C. Amo.
Conflicts of Interest
The authors declare no conflict of interest.
References
- Bloomberg New Energy Finance (BNEF). Electric Vehicle Outlook 2019. Available online: https://about.bnef.com/electric-vehicle-outlook/ (accessed on 18 August 2019).
- Onat, N.C.; Kucukvar, M.; Aboushaqrah, N.N.; Jabbar, R. How sustainable is electric mobility? A comprehensive sustainability assessment approach for the case of Qatar. Appl. Energy 2019, 250, 461–477. [Google Scholar] [CrossRef]
- Dominković, D.F.; Bačeković, I.; Pedersen, A.S.; Krajačić, G. The future of transportation in sustainable energy systems: Opportunities and barriers in a clean energy transition. Renew. Sustain. Energy Rev. 2018, 82, 1823–1838. [Google Scholar] [CrossRef]
- Van der Steen, M.; Van Schelven, R.M.; Kotter, R.; Van Twist, M.J.W.; Peter van Deventer, M.P.A. EV policy compared: An international comparison of governments’ policy strategy towards e-mobility. In E-Mobility in Europe; Springer: Cham, Switzerland, 2015; pp. 27–53. [Google Scholar]
- Bjerkan, K.Y.; Nørbech, T.E.; Nordtømme, M.E. Incentives for promoting battery electric vehicle (BEV) adoption in Norway. Transp. Res. Part D Transp. Environ. 2016, 43, 169–180. [Google Scholar] [CrossRef] [Green Version]
- Taefi, T.T.; Kreutzfeldt, J.; Held, T.; Fink, A. Supporting the adoption of electric vehicles in urban road freight transport–A multi-criteria analysis of policy measures in Germany. Transp. Res. Part A Policy Pract. 2016, 91, 61–79. [Google Scholar] [CrossRef]
- O’Neill, E.; Moore, D.; Kelleher, L.; Brereton, F. Barriers to electric vehicle uptake in Ireland: Perspectives of car-dealers and policy-makers. Case Stud. Transp. Policy 2019, 7, 118–127. [Google Scholar] [CrossRef]
- Fulton, L.; Mejia, A.; Arioli, M.; Dematera, K.; Lah, O. Climate change mitigation pathways for Southeast Asia: CO2 emissions reduction policies for the energy and transport sectors. Sustainability 2017, 9, 1160. [Google Scholar] [CrossRef] [Green Version]
- Jhunjhunwala, A.; Kaur, P.; Mutagekar, S. Electric Vehicles in India: A Novel Approach to Scale Electrification. IEEE Electrif. Mag. 2018, 6, 40–47. [Google Scholar] [CrossRef]
- Agaton, C.B.; Guno, C.S.; Villanueva, R.O.; Villanueva, R.O. Diesel or Electric Jeepney? A Case Study of Transport Investment in the Philippines Using the Real Options Approach. World Electr. Veh. J. 2019, 10, 51. [Google Scholar] [CrossRef] [Green Version]
- Carpenter, T.; Curtis, A.R.; Keshav, S. The return on investment for taxi companies transitioning to electric vehicles. Transportation 2014, 41, 785–818. [Google Scholar] [CrossRef] [Green Version]
- Danielis, R.; Scorrano, M.; Giansoldati, M.; Alessandrini, S. The Economic Case for Electric Vehicles in Public Sector Fleets: An Italian Case Study. World Electr. Veh. J. 2020, 11, 22. [Google Scholar] [CrossRef] [Green Version]
- Topal, O.; Nakir, İ. Total cost of ownership based economic analysis of diesel, CNG and electric bus concepts for the public transport in Istanbul City. Energies 2018, 11, 2369. [Google Scholar] [CrossRef] [Green Version]
- Laizāns, A.; Graurs, I.; Rubenis, A.; Utehin, G. Economic viability of electric public busses: Regional perspective. Procedia Eng. 2016, 13, 316–321. [Google Scholar] [CrossRef] [Green Version]
- Moon, S.; Lee, D.J. An optimal electric vehicle investment model for consumers using total cost of ownership: A real option approach. Appl. Energy 2019, 253, 113494. [Google Scholar] [CrossRef]
- Ercan, T.; Zhao, Y.; Tatari, O.; Pazour, J.A. Optimization of transit bus fleet’s life cycle assessment impacts with alternative fuel options. Energy 2015, 93, 323–334. [Google Scholar] [CrossRef]
- Bekel, K.; Pauliuk, S. Prospective cost and environmental impact assessment of battery and fuel cell electric vehicles in Germany. Int. J. Life Cycle Assess. 2019, 24, 2220–2237. [Google Scholar] [CrossRef]
- Sang, Y.N.; Bekhet, H.A. Modelling electric vehicle usage intentions: An empirical study in Malaysia. J. Clean. Prod. 2015, 92, 75–83. [Google Scholar] [CrossRef]
- Asian Development Bank (ADB). Philippines Transport Sector Assessment, Strategy, and Road Map. 2012. Available online: https://www.adb.org/sites/default/files/institutional-document/33700/files/philippines-transport-assessment.pdf (accessed on 14 August 2019).
- Balaria, F.E.; Pascual, M.P.; Santos, M.D.; Ortiz, A.F.; Gabriel, A.G.; Mangahas, T.L.S. Sustainability of e-trike as alternative mode of public transportation system: The case of Cabanatuan City, Philippines. Open J. Civ. Eng. 2017, 7, 362. [Google Scholar] [CrossRef] [Green Version]
- Fillone, A.M.; Mateo-Babiano, I. Do I walk or ride the rickshaw? Examining the factors affecting first-and last-mile trip options in the historic district of Manila (Philippines). J. Transp. Land Use 2018, 11, 237–254. [Google Scholar] [CrossRef]
- Kecorius, S.; Madueño, L.; Vallar, E.; Alas, H.; Betito, G.; Birmili, W.; Cambaliza, M.O.; Catipay, G.; Gonzaga-Cayetano, M.; Galvez, M.C.; et al. Aerosol particle mixing state, refractory particle number size distributions and emission factors in a polluted urban environment: Case study of Metro Manila, Philippines. Atmos. Environ. 2017, 170, 169–183. [Google Scholar] [CrossRef]
- Vilar, D.A.; Ngilangil, L.E.; Andrada, J.C.; Lucena, J.J. “Bantay Tambutso” Project Implementation for Reducing Air Pollution: The DMMMSU-NLUC, Philippines Experience. Chem. Eng. Trans. 2018, 63, 97–102. [Google Scholar] [CrossRef]
- Department of Transportation (DoTr). Omnibus Guidelines on the Planning and Identification of Public Road Transportation and Franchise Issuance. 2017. Available online: https://drive.google.com/file/d/0Bx283SS6qJi2ZmQ0RTdWYlZqc2M/view (accessed on 3 June 2020).
- Mateo-Babiano, I.; Recio, R.B.; Ashmore, D.P.; Guillen, M.D.; Gaspay, S.M. Formalising the jeepney industry in the Philippines–A confirmatory thematic analysis of key transitionary issues. Res. Transp. Econ. 2020, 100839. [Google Scholar] [CrossRef]
- Grande, L.S.; Yahyaoui, I.; Gómez, S.A. Energetic, economic and environmental viability of off-grid PV-BESS for charging electric vehicles: Case study of Spain. Sustain. Cities Soc. 2018, 37, 519–529. [Google Scholar] [CrossRef]
- Balacco, G.; Binetti, M.; Caporaletti, V.; Gioia, A.; Leandro, L.; Iacobellis, V.; Sanvito, C.; Piccinni, A.F. Innovative mini-hydro device for the recharge of electric vehicles in urban areas. Int. J. Energy Environ. Eng. 2018, 9, 435–445. [Google Scholar] [CrossRef] [Green Version]
- Bai, Y.; Bai, Q. Subsea Pipeline Integrity and Risk Management; Gulf Professional Publishing: Houston, TX, USA, 2014. [Google Scholar]
- Environmental Protection Agency (EPA). Emission Factors for Greenhouse Gases Inventories 2014. Available online: https://www.epa.gov/sites/production/files/2015-07/documents/emission-factors_2014.pdf (accessed on 21 August 2019).
- Sumabat, A.K.; Lopez, N.S.; Yu, K.D.; Hao, H.; Li, R.; Geng, Y.; Chiu, A.S. Decomposition analysis of Philippine CO2 emissions from fuel combustion and electricity generation. Appl. Energy 2016, 164, 795–804. [Google Scholar] [CrossRef]
- Department of Energy (DOE). Power Statistics. 2018. Available online: https://www.doe.gov.ph/sites/default/files/pdf/energy_statistics/01_2018_power_statistics_as_of_29_march_2019_summary.pdf (accessed on 21 August 2019).
- Loxham, M.; Nieuwenhuijsen, M.J. Health effects of particulate matter air pollution in underground railway systems–a critical review of the evidence. Part. Fibre Toxicol. 2019, 16, 1–24. [Google Scholar] [CrossRef] [PubMed] [Green Version]
- Chossière, G.P.; Malina, R.; Allroggen, F.; Eastham, S.D.; Speth, R.L.; Barrett, S.R. Country-and manufacturer-level attribution of air quality impacts due to excess NOx emissions from diesel passenger vehicles in Europe. Atmos. Environ. 2018, 189, 89–97. [Google Scholar] [CrossRef]
- Ghorani-Azam, A.; Riahi-Zanjani, B.; Balali-Mood, M. Effects of air pollution on human health and practical measures for prevention in Iran. J. Res. Med Sci. Off. J. Isfahan Univ. Med Sci. 2016, 21, 65. [Google Scholar] [CrossRef]
- Akyuz, E.; Kaynak, B. Use of dispersion model and satellite SO2 retrievals for environmental impact assessment of coal-fired power plants. Sci. Total Environ. 2019, 689, 808–819. [Google Scholar] [CrossRef]
- Ehsani, M.; Gao, Y.; Longo, S.; Ebrahimi, K. Modern Electric, Hybrid Electric, and Fuel Cell Vehicles; CRC Press: Boca Raton, FL, USA, 2018. [Google Scholar]
- National Economic Development Agency (NEDA). Roadmap for Transport Infrastructure Development for Metro Manila and its Surrounding Areas. Technical Report No. 1, Environment and Hazard Risk Reduction Analysis. 2014. Available online: http://www.neda.gov.ph/wp-content/uploads/2015/03/FR-TR1-ENVI-AND-RISK-12149621.pdf (accessed on 29 August 2019).
- Biona, J.B.; Mejia, M.; Tacderas, M.; dela Cruz, N.; Dematera, K.; Romero, J. Alternative Technologies for the Philippine Utility Jeepney: A Cost-Benefit Study; Blacksmith Institute and Clean Air Asia: Pasig City, Philippines, 2017; Available online: https://cleanairasia.org/wp-content/uploads/2017/04/Jeepney-CB-Study.pdf (accessed on 12 August 2019).
- Jena, R. An empirical case study on Indian consumers’ sentiment towards electric vehicles: A big data analytics approach. Ind. Mark. Manag. 2020. [Google Scholar] [CrossRef]
- Lopez, N.S.; Soliman, J.; Biona, J.B.M. Life cycle cost and benefit analysis of low carbon vehicle technologies. In Sustainable Energy Technology and Policies; Springer: Singapore, 2018; pp. 131–146. [Google Scholar]
- Ranosa, L.; Villaraza, C.M.; Fillone, A.; Guillen, M.D.; Biona, J.B. Providers’ and Users’ Assessment of Public Transport and Facilities: Baguio City, Philippines. In Proceedings of the Eastern Asia Society for Transportation Studies 2017, Ho Chi Minh City, Vietnam, 18–21 September 2017; Volume 11. [Google Scholar]
- Moro, A.; Lonza, L. Electricity carbon intensity in European Member States: Impacts on GHG emissions of electric vehicles. Transp. Res. Part D Transp. Environ. 2018, 64, 5–14. [Google Scholar] [CrossRef]
- Holmberg, K.; Erdemir, A. The impact of tribology on energy use and CO2 emission globally and in combustion engine and electric cars. Tribol. Int. 2019, 135, 389–396. [Google Scholar] [CrossRef]
- Weber, N.D.A.B.; da Rocha, B.P.; Schneider, P.S.; Daemme, L.C.; Neto, R.D.A.P. Energy and emission impacts of liquid fueled engines compared to electric motors for small size motorcycles based on the Brazilian scenario. Energy 2019, 168, 70–79. [Google Scholar] [CrossRef]
- Agaton, C.B.; Karl, H. A real options approach to renewable electricity generation in the Philippines. Energysustainability Soc. 2018, 8, 1. [Google Scholar] [CrossRef] [Green Version]
- Agaton, C.B. A Real Options Approach to Renewable and Nuclear Energy Investments in the Philippine (Vol. 71); Logos Verlag Berlin GmbH: Berlin, Germany, 2019. [Google Scholar]
- Agaton, C.B. Use coal or invest in renewables: A real options analysis of energy investments in the Philippines. Renew. Wind. Sol. 2018, 5, 1. [Google Scholar] [CrossRef] [Green Version]
- Shi, S.; Zhang, H.; Yang, W.; Zhang, Q.; Wang, X. A life-cycle assessment of battery electric and internal combustion engine vehicles: A case in Hebei Province, China. J. Clean. Prod. 2019, 228, 606–618. [Google Scholar] [CrossRef]
- Xiao, P.; Wen, Q. Environmental Impact Analysis of the Whole Life Cycle of Pure Electric Vehicles. In IOP Conference Series: Earth and Environmental Science; IOP Publishing Ltd.: Bristol, UK, 2019; Volume 300, p. 032053. [Google Scholar]
- World Health Organization (WHO). Climate and Health Country Profile 201, Philippines. Available online: https://apps.who.int/iris/bitstream/handle/10665/208868/WHO_FWC_PHE_EPE_15.14_eng.pdf (accessed on 3 September 2019).
- Frost & Sullivan. The Future of Electric Vehicles in Southeast Asia: Position Paper. 2018. Available online: https://asia.nissannews.com/en/releases/release-568d250ed392364df4a81d7c61017eee/images/074b20d9e25174eab8146462b7be1932083d9d3a (accessed on 12 August 2019).
- Yan, J.; Zhou, Y.; Wang, S.; Li, J. To share or not to Share? Credibility and Dissemination of Electric Vehicle-Related Information on WeChat: A Moderated Dual-Process Model. IEEE Access 2019, 7, 46808–46821. [Google Scholar] [CrossRef]
- Biona, J.B.M. Philippine Electric Vehicle Policy Analysis Report—Draft Report; Mitsubishi Motors Corporation: Manila, Philippines, 2019. [Google Scholar]
- Philippine News Agency. LTFRB targets over 400K PUV Drivers for Cash Aid. Available online: https://www.pna.gov.ph/articles/1099164 (accessed on 3 June 2020).
Figure 1.
Respondents’ preference to ride/drive/own e-PUV over c-PUV.

Figure 2.
Preference to ride/drive/own e-PUV over c-PUV according to the profile of respondents.

Figure 3.
Respondents’ outlook on full electrification of public transport system.


Table 1.
Survey respondents.
| Profile | Number |
|---|---|
| Commuters | 538 |
| Drivers | 465 |
| Other Stakeholders | 152 |
| Experts | 164 |
| TOTAL RESPONDENTS | 1319 |
Table 2.
Financial analysis of tricycle (gas) and e-trike at public utility vehicle (PUV) Modernization Program (PUVMP) and boundary systems.
Table 2.
Financial analysis of tricycle (gas) and e-trike at public utility vehicle (PUV) Modernization Program (PUVMP) and boundary systems.
| Tricycle | e-Trike | ||||
|---|---|---|---|---|---|
| Unit | Boundary | PUVMP | Boundary | PUVMP | |
| Driver salary | USD/yr | 1360–2500 | 1300–2250 | 3090–5370 | 1610–2250 |
| Owner profit | USD/yr | 970–1250 | 1200–1600 | 1300–1920 | 2800–5170 |
| Net present value (NPV) * | USD | 7450–9500 | 9600–12800 | 8600–10350 | 21,620–37,760 |
| Payback period (PBP) * | Year | 1.05–1.12 | 0.83–0.86 | 2.12–3.33 | 0.99–1.42 |
| Return on investment (ROI) * | % | 890–950 | 1160–1200 | 300–50 | 706–1010 |
* Evaluated in 10-year period of tricycle operation.
Table 3.
Financial analysis of jeepney (diesel) and e-jeepney at PUVMP and boundary systems.
| Jeepney | e-Jeepney | ||||
|---|---|---|---|---|---|
| Unit | Boundary | PUVMP | Boundary | PUVMP | |
| Driver salary | USD/yr | 3180–4670 | 2580–3540 | 4410–6710 | 2580–3540 |
| Owner profit | USD/yr | 2580–3540 | 4470–6210 | 5300–6560 | 7190–9850 |
| NPV * | USD | 25,500–33,330 | 30,980–42,070 | 27,240–33,500 | 43,720–62,150 |
| PBP * | Year | 2.26–2.34 | 1.79–1.84 | 3.58–3.62 | 2.41–2.64 |
| ROI * | % | 427–442 | 540–560 | 276–280 | 380–420 |
* Evaluated in 10-year period of jeepney operation.
Table 4.
Environmental impact assessment of conventional PUV (c-PUV) and electric PUV (e-PUV).
| Unit | Tricycle | e-Trike | Jeepney | e-Jeepney | |
|---|---|---|---|---|---|
| Greenhouse gas (GHG) emissions | t CO2 eq/yr per vehicle | 4.16–6.24 | 1.08–1.51 | 20.81–29.14 | 2.78–3.70 |
| GHG fleet emissions * | Mt CO2 eq/yr | 2.50–3.75 | 0.65–0.91 | 12.49–17.48 | 1.67–2.22 |
| Electricity demand * | GWh/yr | 1050–1470 | 900–1200 | ||
| Fuel demand * | Million barrels/yr | 5.28–7.93 | 8.81–12.33 | ||
| Particulate matter (PM) | Kg CO2 eq/yr | 68.35–102.52 | 2.45–3.43 | 18.23–25.53 | 1.08–1.44 |
| Nitrogen oxides (NOx) | Kg CO2 eq/yr | 6.83–10.25 | 1.47–2.02 | 61.38–85.93 | 10.95–14.60 |
| Sulfur oxides (SOx) | Kg CO2 eq/yr | 1.37–2.05 | 0.49–0.69 | 4.79–6.70 | 2.11–2.82 |
| CO | Kg CO2 eq/yr | 88.85–133.28 | 4.85–6.79 | 111.5–156.0 | 9.80–13.06 |
* The fleet is according to the PUVMP replacing 600,000 tricycles and 200,000 jeepneys in the next six years.
© 2020 by the authors. Licensee MDPI, Basel, Switzerland. This article is an open access article distributed under the terms and conditions of the Creative Commons Attribution (CC BY) license (http://creativecommons.org/licenses/by/4.0/).
Share and Cite
MDPI and ACS Style
Agaton, C.B.; Collera, A.A.; Guno, C.S. Socio-Economic and Environmental Analyses of Sustainable Public Transport in the Philippines. Sustainability 2020, 12, 4720. https://0-doi-org.brum.beds.ac.uk/10.3390/su12114720
AMA Style
Agaton CB, Collera AA, Guno CS. Socio-Economic and Environmental Analyses of Sustainable Public Transport in the Philippines. Sustainability. 2020; 12(11):4720. https://0-doi-org.brum.beds.ac.uk/10.3390/su12114720
Chicago/Turabian StyleAgaton, Casper Boongaling, Angelie Azcuna Collera, and Charmaine Samala Guno. 2020. "Socio-Economic and Environmental Analyses of Sustainable Public Transport in the Philippines" Sustainability 12, no. 11: 4720. https://0-doi-org.brum.beds.ac.uk/10.3390/su12114720
Note that from the first issue of 2016, this journal uses article numbers instead of page numbers. See further details here.