Article

Comparison of the Effects of the Kahoot Tool on Teacher Training and Computer Engineering Students for Sustainable Education

by
María Luisa Pertegal-Felices
1,
Antonio Jimeno-Morenilla
2,*,
José Luis Sánchez-Romero
2 and
Higinio Mora-Mora
2
1
Department of Developmental Psychology and Didactics, University of Alicante, 03690 Alicante, Spain
2
Department of Computer Technology, University of Alicante, 03690 Alicante, Spain
*
Author to whom correspondence should be addressed.
Sustainability 2020, 12(11), 4778; https://0-doi-org.brum.beds.ac.uk/10.3390/su12114778
Submission received: 24 April 2020 / Revised: 1 June 2020 / Accepted: 10 June 2020 / Published: 11 June 2020
(This article belongs to the Special Issue Teacher Training in Active Methodologies for Ecosystem Learning)

Abstract

:
Gamification has proved to be a methodology that increases the likelihood of success and sustainability of educational institutions. This methodology has recently revealed itself as one of the most efficient teaching methodologies in the student body, proving useful at all educational levels. One of the most frequently mentioned properties is its ability to “reset” the student’s attention clock: the key is collective learning, an attractive way of remembering new content. The experience described below has been developed in the context of a generalist university in two very different degrees: Degree in Teacher Training and Degree in Computer Engineering. To develop the theoretical sessions, the master class was combined with the use of the Kahoot tool. The observations made by the teachers in relation to the dynamics of the theoretical classes show that the use of Kahoot at the end of the theoretical sessions increased the students’ attendance at class, in addition to their involvement in the sessions and they kept their attention for longer. This study has also shown that there are significant differences in the level of satisfaction shown by the students of both degrees with these tools.

1. Introduction

One of the most used activities in university teaching, despite the criticism it receives [1], is the master class as a traditional teacher-centered teaching method. Its use is widespread, especially in terms of the presentation of theoretical content, so much so that it continues to be the main methodological resource of an expository type used at university level. Theoretical classes are usually based on an exposition in which communication flows in a single sense: from the teacher to the student. For this reason, the major criticisms of this method focus above all on the purely receptive role attributed to the student, the scarce student–teacher interaction, and the lack of feedback on the acceptance of teaching, not allowing results to be analyzed until the evaluation phase [2]. This lack of flexibility makes it difficult to adapt to different types of learning and its efficiency depends on the qualities of each teacher. Today new technologies offer a new framework that can affect both positively and negatively different aspects of our lives [3], including education. This scenario is causing serious problems in educational institutions since students’ motivation is one of the keys to successful learning [4]. Thus, for the sake of the sustainability of education, new approaches and educational strategies are needed that place the focus on recovering the motivation to learn.
Criticism of the master class derives more from the large number of students to whom the class is addressed than from the method itself, which is a method of direct teaching, a method of those who have proven to be more efficient and economical in training. It also allows a more adapted approach to students in subjects that are difficult to understand, as well as the asking of questions that clarify any difficulties that may arise.
As a valid method currently in use, one of the most severe criticisms that the master class receives is the loss of attention that it provokes in students [1]. According to various studies, the average human attention does not exceed 20 min [5,6,7]. Thus, from that time on, it is very difficult for the student to focus on the explanations of the teaching staff. Other problems arise from the lack of attention, since the continuous, orderly and clear exposition, constructing meanings step by step, leads to a loss of the common thread, resulting in a lack of understanding of new knowledge, even when the attention has been recovered afterwards.
Precisely in order to avoid the lack of attention in class and to recover motivation on the exposed topic, strategies of diverse nature have been examined; in particular, gamification is revealing itself as one of the most effective options. In this work we present one of these tools and the repercussions of its use on a master class.
The work is structured as follows: Firstly, recent studies related to gamification and its application in teaching are analyzed. Secondly, the methodology carried out in class is explained. Then, the results of the students’ experience are shown and, finally, the main conclusions of the study are discussed.

2. Literature Review

Hattie’s meta-analytical reviews [8,9] take into consideration about 1000 meta-analyses of factors affecting student performance and include about 60,000 studies, some of which are based on five million students and cover a total of 245 million students. The conclusions of these investigations establish a model on the explanatory factors of academic performance that includes: (1) the student, (2) the teaching staff, (3) the teaching methods, (4) the school, (5) the family context, and (6) the educational system. These studies reveal that the individual characteristics of the student, fundamentally his or her intellectual capacity and motivation, are among the variables that contribute most to academic performance. In fact, the loss of motivation of the student is one of the most pressing problems of the present time and one which endangers the sustainability of educational systems [10].
Education is expected to respond to the problems and processes triggered by the current technological revolution in developing countries. It is a revolution that affects society in a transversal way, including all agents (teachers, students, and staff). Managing technological advances in the education sector is today a necessity to ensure the sustainability of that sector in the future [11,12].
Gamification is a novel trend within the education sector whose main quality lies in trying to reset the motivation clock through playing. This game is conceived as an interactive tool that improves students’ motivation and involvement levels in class [13].
There is scientific evidence from neurodidactics that reveals that learning occurs when we are able to activate the so-called brain reward system, associated with dopamine [14]. When gamification is introduced, a whole series of chemical substances, such as neurotransmitters dopamine, and serotonin, increase motivation, improve mood, and strengthen the bond which is essential for learning [15].
Experiments conducted over six years by Wang, Zhu, and Sætre [16] identified the benefits of this technique in three areas: in class dynamics (more concentrated and involved students); in learning (greater interaction between students, lessons can be modified in real time depending on students’ learning problems); and in assessment (students can compare their results with those of the rest of the class and this encourages them to improve). The authors concluded that students learn more than with traditional classes, it is more fun, and the attendance rate increases. The key is collective learning, an attractive way of remembering new content. When this type of activity is used, the teacher no longer has value as a transmitter of information but becomes a designer of new learning experiences.
Kaufmann’s recent article [17] presents a reflective description of how gamma chemistry can help students overcome complex academic challenges. Thus, the dissertation process and other elements of higher learning are nourished by its benefits. A positive impact on the completion of academic tasks has also been documented by increasing the elements which the student can experience during the learning process.
A study by Chung, Shen, and Qiu [18] explored gamification in university courses by collecting surveys and analyzing factors that influence the acceptance of gamification at the university. This study revealed that performance expectation is the most important factor influencing a student’s acceptance of gamification as an educational tool. Other factors, such as expectation of effort, social influence, facilitation conditions, participation, ability, or control, are also important factors.
As previously mentioned, student motivation is one of the most important factors influencing academic performance. Research by Costello and Lambert [19] offers a novel and innovative approach to gamification in university students. In this research the authors proposed a model that is based on the perceptions and views of students as they take their courses at a higher education institute in the north-east of the United Kingdom. The model used proved useful in helping to build emotions and motivational influences that improved retention, engagement, motivation, and problem solving.
Similar research is presented in the compilations of Majuri, Koivisto, and Hamari [20], and Subhash and Cudney [21] who concluded that gamification research and application are widespread at all educational levels and improve students’ academic outcomes. In relation to the types of studies analyzed, there is a greater application in engineering, probably due to the fact that teachers are accustomed to using Information and Communication Technologies (ICT) tools and it takes less effort to create these game experiences. It is precisely this last affirmation that has motivated this work, since there exists a certain lack of analysis of the use of this type of tool and its effect on degrees beyond the field of engineering. In the field of engineering, Fuster et al. [22] proposed an educational intervention based on the use of Kahoot, which shows an increase in the academic performance of computer engineering students, as well as an increase in their level of motivation. In the field of education, similar experiences have also been carried out in which the academic performance and motivation of teaching students have also increased [23].
The research presented above, although with various nuances, gives gamification excellent qualities for learning. However, at the university level, there are few studies that compare the impact that these methodologies have on students according to the type of studies undertaken [21]. Therefore, this paper aims to analyze whether there are differences in the level of student satisfaction with these methodologies depending on the degree chosen by the student: Degree in Teacher Training and Degree in Computer Engineering. The following section presents the methodology and the instrument used in this research. The third section presents the results of the study. Finally, the fourth section discusses the results obtained.

3. Materials and Methods

3.1. Participants

Two types of participants from different scientific fields were available for the present research:
The first sample was 54 students in the field of Social Sciences, specifically, students in their 1st year of the Degree in Teacher Training at the University of Alicante. The second sample was 55 students in the field of Engineering, also in their 1st year, but in the Degree in Computer Engineering at the University of Alicante. Participants by gender are listed in Table 1.

3.2. Instruments

In order to evaluate the degree of student satisfaction with the implementation of gamification through the Kahoot® [24] tool in the classroom, a questionnaire was elaborated whose objective was to know the perceptions that students in higher education have about the usefulness of gamification through Kahoot® in relation to their learning process and the methodology employed in the classroom. The items addressed in this questionnaire and their response options are shown in Table 2.
The validation of the instrument was carried out using the content validity index (CVI) proposed by Lawshe [25] according to the equation:
C V I = n e N / 2 N / 2
where ne is the number of experts who rated the item favorably; N is the total number of experts valuing the item.
Lawshe’s CVI requires a value greater than 0.75 to be validated by nine experts. In this case the value was 0.78 for all elements, so the instrument was validated. In this sense, nine experts from outside the research validated the instrument: eight experts rated all the items favorably and one expert rated all the items positively except for item 5.
Due to the characteristics of the items, the researchers established two categories. On the one hand, items 1, 2, 3, and 7 are directly related to the experience of student satisfaction regarding the use of Kahoot, while items 4, 5, and 6 are more related to organizational aspects of its use within the classroom (time of completion, duration, and use with other techniques). For the first category, a Likert-type numerical scale (1–4) was assigned according to their level of satisfaction with the experience. For the second category, the items have a nominal type and therefore are analyzed differently.

3.3. Reliability Analysis

To assess the degree of reliability, an analysis on the scale variables (items 1, 2, 3, and 7) was used, using Cronbach’s alpha statistic. The first analysis showed a value of 0.70; therefore the statistic was re-evaluated by eliminating some of the items in case the reliability of the statistic was increased. Table 3 shows that the elimination of item 1 significantly increased the reliability of the scale variables, with an alpha value of 0.774, an acceptable value for measuring student satisfaction.
As a result of the analysis, item 1 was removed from the group of scale variables and incorporated to be examined separately with the nominal type variables. Regarding this result, the researchers believed that item 1, although related to satisfaction, did not measure satisfaction as effectively as the other items since the values, “I don’t enjoy, but I learn” and “I enjoy, but I don’t learn” are of subjective interpretation, depending on whether the student attaches more importance to the motivation of the game or to learning.

3.4. Procedure

First, the methodology of the subjects involved in the research was designed. Both subjects have a total of 15 theoretical sessions of two hours. The gamification through the Kahoot® tool was incorporated into these sessions as a complement to the teaching of the theoretical concepts of the subjects.
Once the games were designed and after starting the classes, the teachers applied the games developed throughout different sessions.
In order to finish the study, once the teaching period was over and the schedule of subjects was applied with the incorporation of the new methodology, the degree of satisfaction of the students in their learning process was evaluated, with the use of gamification through Kahoot®. The questionnaire was administered during class hours and data collection was carried out at the end of the subjects’ first four-month period of the course.

4. Results

4.1. Satisfaction Profile Analysis

As mentioned above, a profile of student satisfaction for Kahoot was established through the scores given in the questionnaire for the dependent variables represented by items 2, 3, and 7. To carry out the comparison of the profiles, statistical analysis was used through the General Linear Model of Repeated Measurements of the SPSS statistical package version 24.0. Profile analysis is a special application of multivariate analysis of variance (MANOVA) to a situation where there are several dependent variables (DVs), all measured on the same scale. The set of DVs can either come from one DV measured several different times, or several different DVs all measured at one time [26]. Used this way, profile analysis offers a multivariate alternative to the univariate F test for the within-subjects effect and its interactions; in our case, student satisfaction for items 2, 3, and 7. The approach is also quite robust to violations of normality [27]. Thus, under normal conditions of use, one can consider the multivariate test “exact” for repeated measures designs while the univariate approach can only be considered “approximate” due to the additional assumption of sphericity it carries [28]. Many other works recommend the multivariate approach in this type of analysis [29,30,31,32].
In order to carry out the analysis, the dependent satisfaction variables were treated as intra-subject variables, and the independent variable “type of student” (i.e., computer engineering students or teacher training students) was the inter-subject variable. Table 4 shows the description of the scores of each variable for each group of students.
The assumption of normality was tested by means of Box’s M test. The result of this test (M = 36.67) did not show homogeneity of the covariance variance matrices (p = 0.000). However, violation of this assumption has minimal impact if the groups are approximately equal in size [33] or the highest ratio of variance between the groups does not exceed 1:10 [26]. In this case the highest ratio between groups was obtained for item 7 with a ratio of 1:3.65 which allows the non-normal condition to be avoided.
Table 5 shows the analysis of the intra-subject test. In the profile analysis this table indicates the nature of the profiles according to if they are flat (flatness test) and if they are parallel between the groups (parallelism test). The effects of flatness (satisfaction) and parallelism (satisfaction*group) of the intra-subject test have been found to be non-significant (intra-subject effect p = 0.545; effect of interaction p = 0.141). Therefore, it can be stated that there is no significant difference in the satisfaction levels of each variable (flatness) for each group. Furthermore, there would be no significant difference between the changes that each profile has with its own variables (parallelism).
In profile analysis, the inter-subject test allows us to measure whether there is a significant difference in the profiles of the groups studied. Table 6 shows this test. The analysis was significant (p = 0.030) and can therefore ensure that there are significant differences in the satisfaction profile of the groups. The profiles can be seen in Figure 1, where both the flatness and the parallelism of the profiles and a higher level of satisfaction in the computer science students can be observed. The difference between the two groups ranges from 0.22 to 0.29 points, that is, between 7.3% and 9.6% higher in computer science students.

4.2. Analysis of Nominal Items

The category of items with nominal type response (items 1, 4, 5 and 6) was carried out by examining the proportions in the responses of both groups, using the Chi-squared statistic (χ2) (see Table 7). The results show that there were differences between the groups in 2 of the 4 questions asked. In order to avoid possible gender biases, a similar comparative analysis was carried out considering the gender of the students, such analysis did not reveal significant differences in the students according to their sex for any item.
Item 1 explores the tool’s ability to entertain and teach. This item was removed from the scale category in the reliability analysis and incorporated into this test. Both teachers (83.3%) and computer students (80.0%) expressed as a majority option the one that identifies both capacities in the tool. Both in this option, as in the rest of the options, there were no statistically significant differences between both groups.
Items 4, 5, and 6 focus on organizational aspects: the time when the Kahoot® was carried out as well as duration and combination of this learning methodology with others. In item 5, related to the duration of the contest in classroom, there was no significant difference between the teacher training and computer engineering groups. The most common option chosen was the average duration (between 5 and 15 min), which was selected by 61.1% of the teacher training students and 47.3% of the computer engineering students.
Item 4 asks about Kahoot’s moment of realization. There was no significant differences in the majority option. It was “at the end of the class” in both groups (61.1% in teaching and 58.2% in computer engineering). However, the Chi-squared test revealed significant differences in the rest of the options (p < 0.01). While the distribution in the “in the middle of the class” and “at the beginning of the class” options were similar for teacher training students (16.7% and 22.2%, respectively), computer students practically rejected the “at the beginning of the class” option with only 3.6% of the students choosing this. Figure 2 shows the distribution of the options in both degrees for this item.
Item 6 ask for the combination of Kahoot with other forms of teaching in class. The Chi-squared test revealed significant differences (p < 0.01) in the majority option: “explanation combined with Kahoot and practical exercises”, with a higher incidence in computer science students (89.1%) than in teacher training students (72.2%). Differences were also observed in the option “his oral explanation combined with Kahoot” which was the second most numerous option for the students of teaching (20.4%), while that option was not selected by any student of computer science. The most uncommon option was “exclusively his oral presentation” for both groups for which no significant differences were found. Figure 3 shows the distribution of responses for this item.

5. Discussion

To increase the chances of success and sustainability, organizations must change their positioning and try to modify existing processes or create new products and services. Educational institutions are not an exception and new educational strategies such as gamification have proven useful for this goal [34].
Gaming tools are increasingly used for teaching at all educational levels. Many studies show that they can increase motivation and “reset” the student’s attention clock [35]. For the sake of the sustainability of the higher education system, it seems a good choice to design policies that include this style of learning in the curriculum so that students can benefit from its effects. However, in the university world few studies investigate whether this effect has the same proportions depending on the nature of the study in which it is applied.
In this work, a comparative study was carried out to verify the effect of the tool on two very different university degrees: Degree in Teacher Training (Social Sciences branch) and Degree in Computer Engineering (Engineering branch). The results, in line with other research that focuses on degrees, show that students find the tool very useful and give it a good level of influence on their learning. However, this study has detected nuanced differences in the level of satisfaction between the two student groups. The computer students experienced the highest level of satisfaction when playing Kahoot® as a tool for enjoyment and learning. The explanation that can be given to this result could be the novelty in the use of the tool. While for the Degree in Teacher Training, students are instructed to use different means of teaching as future teachers, in the Degree in Computer Engineering the tool is much more innovative. In any case, in order to test this hypothesis, both the study and the measuring instrument should be extended.
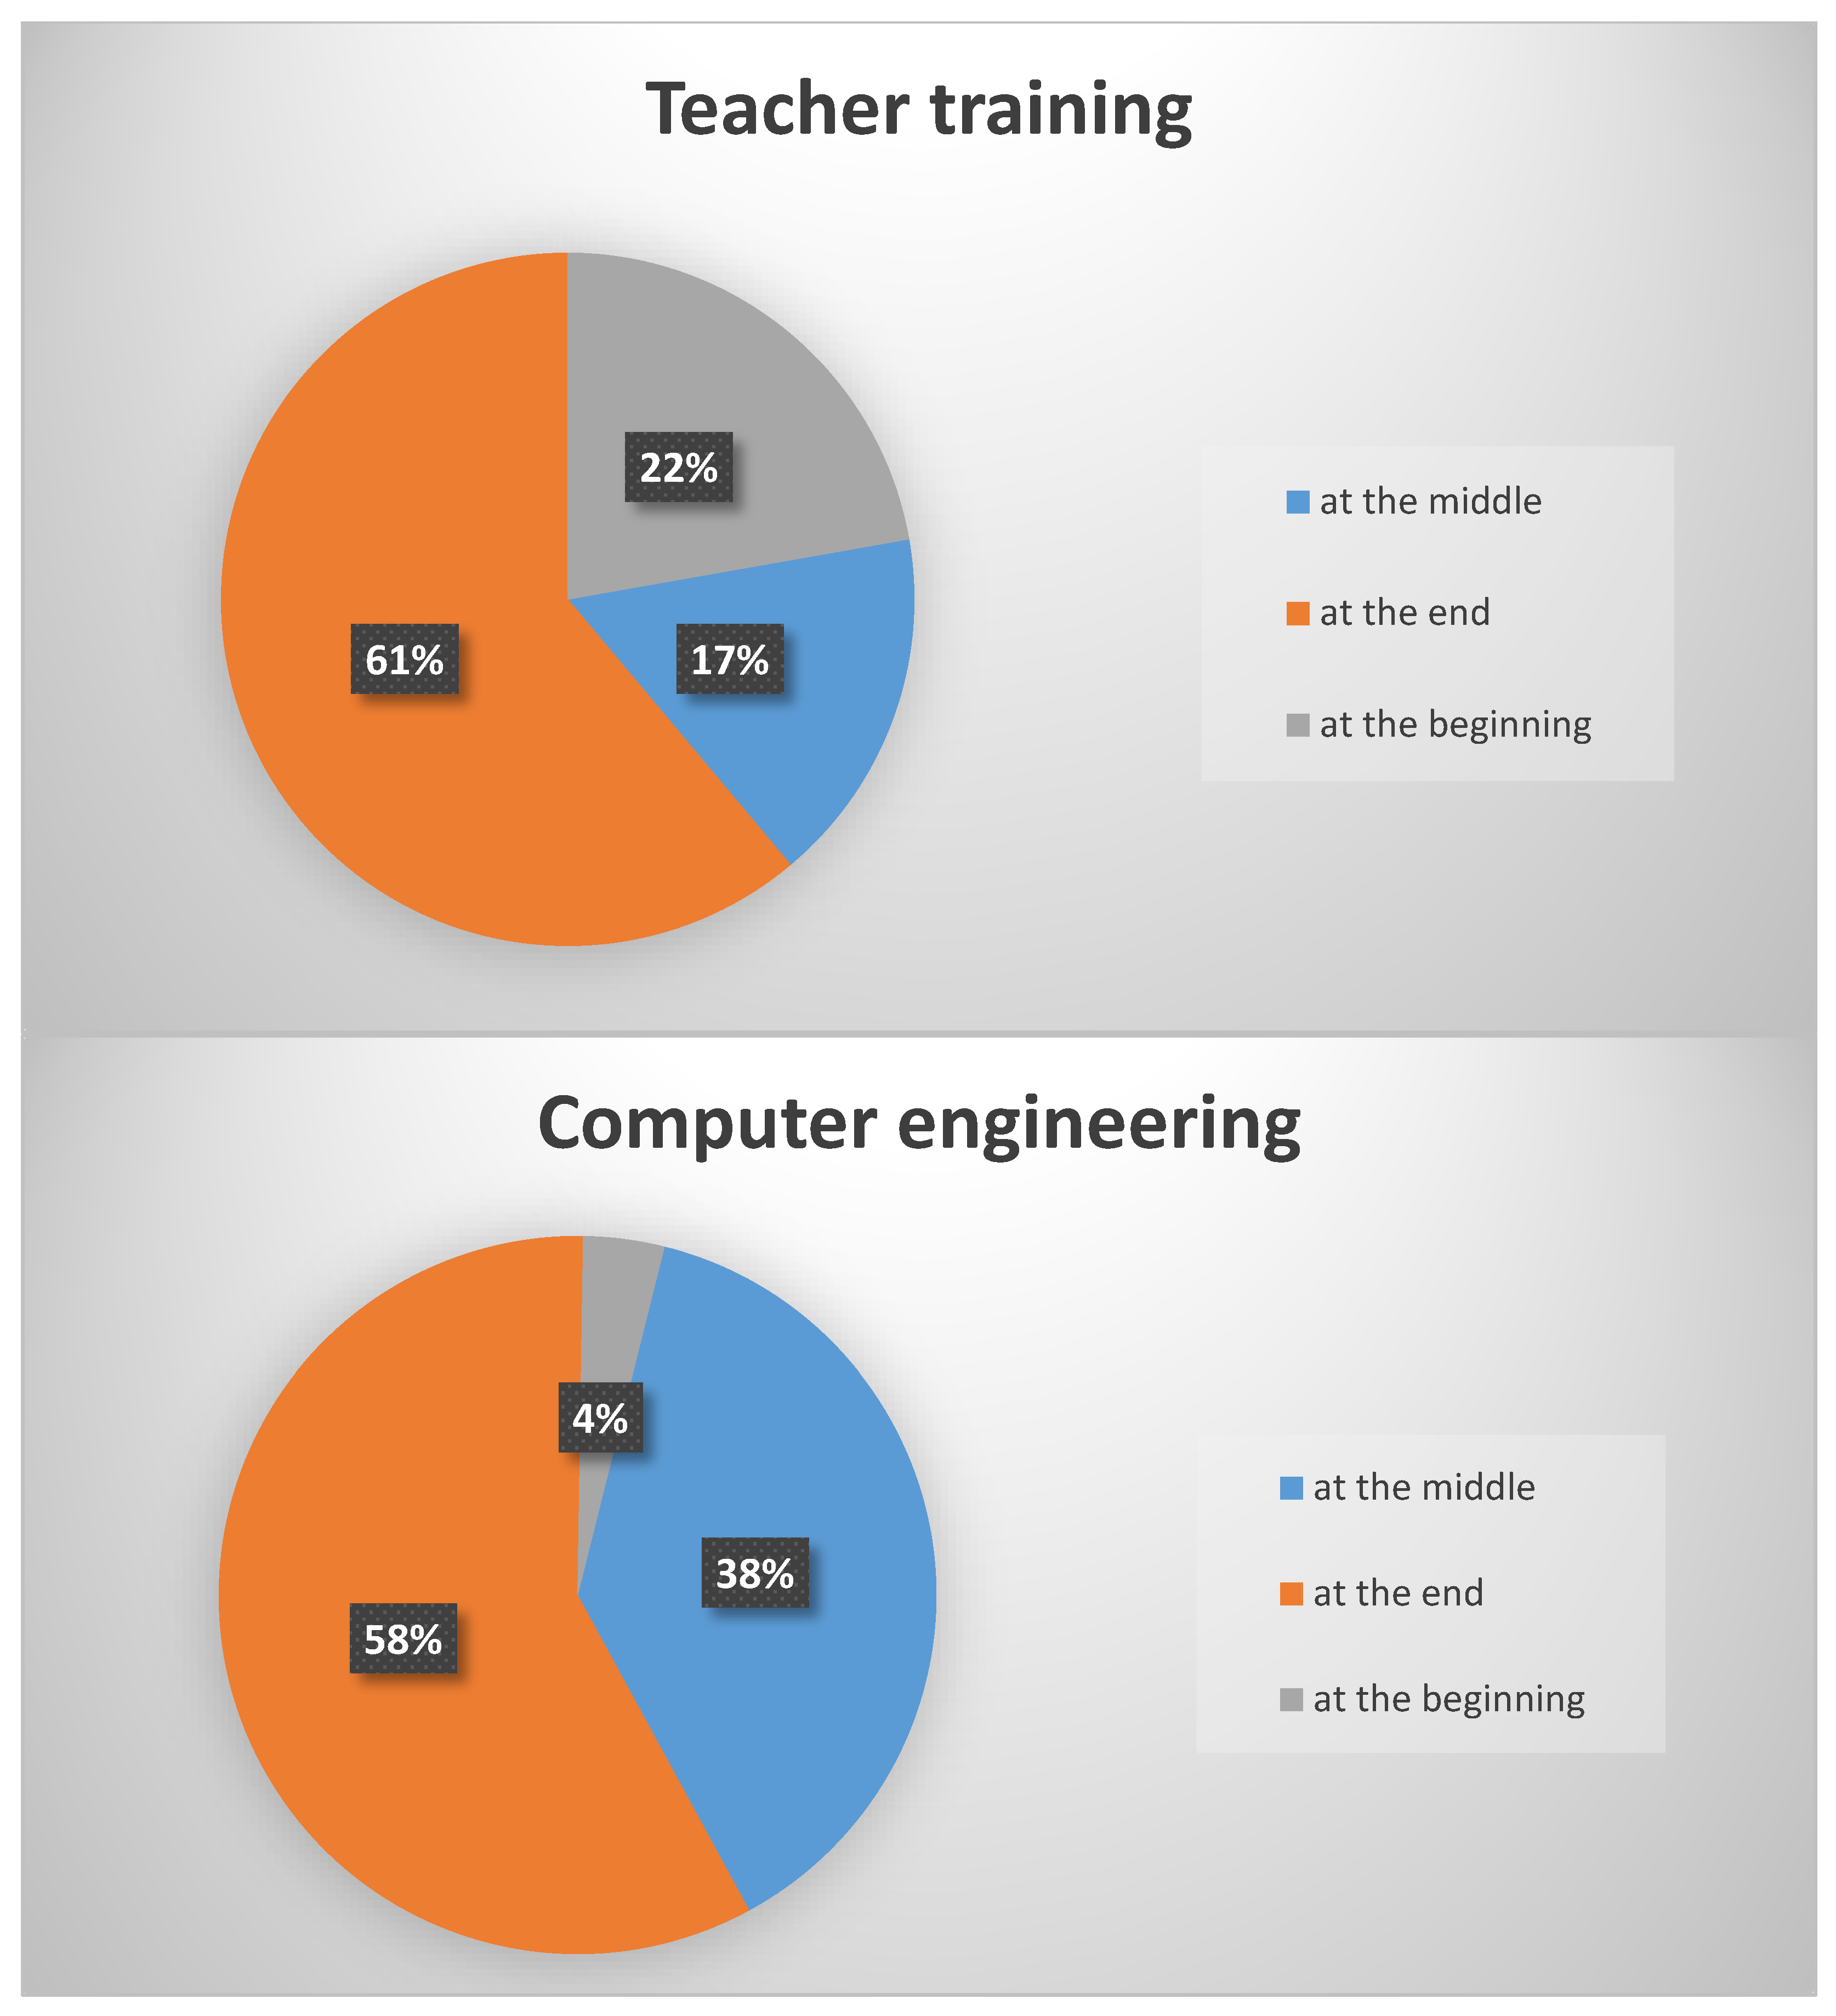
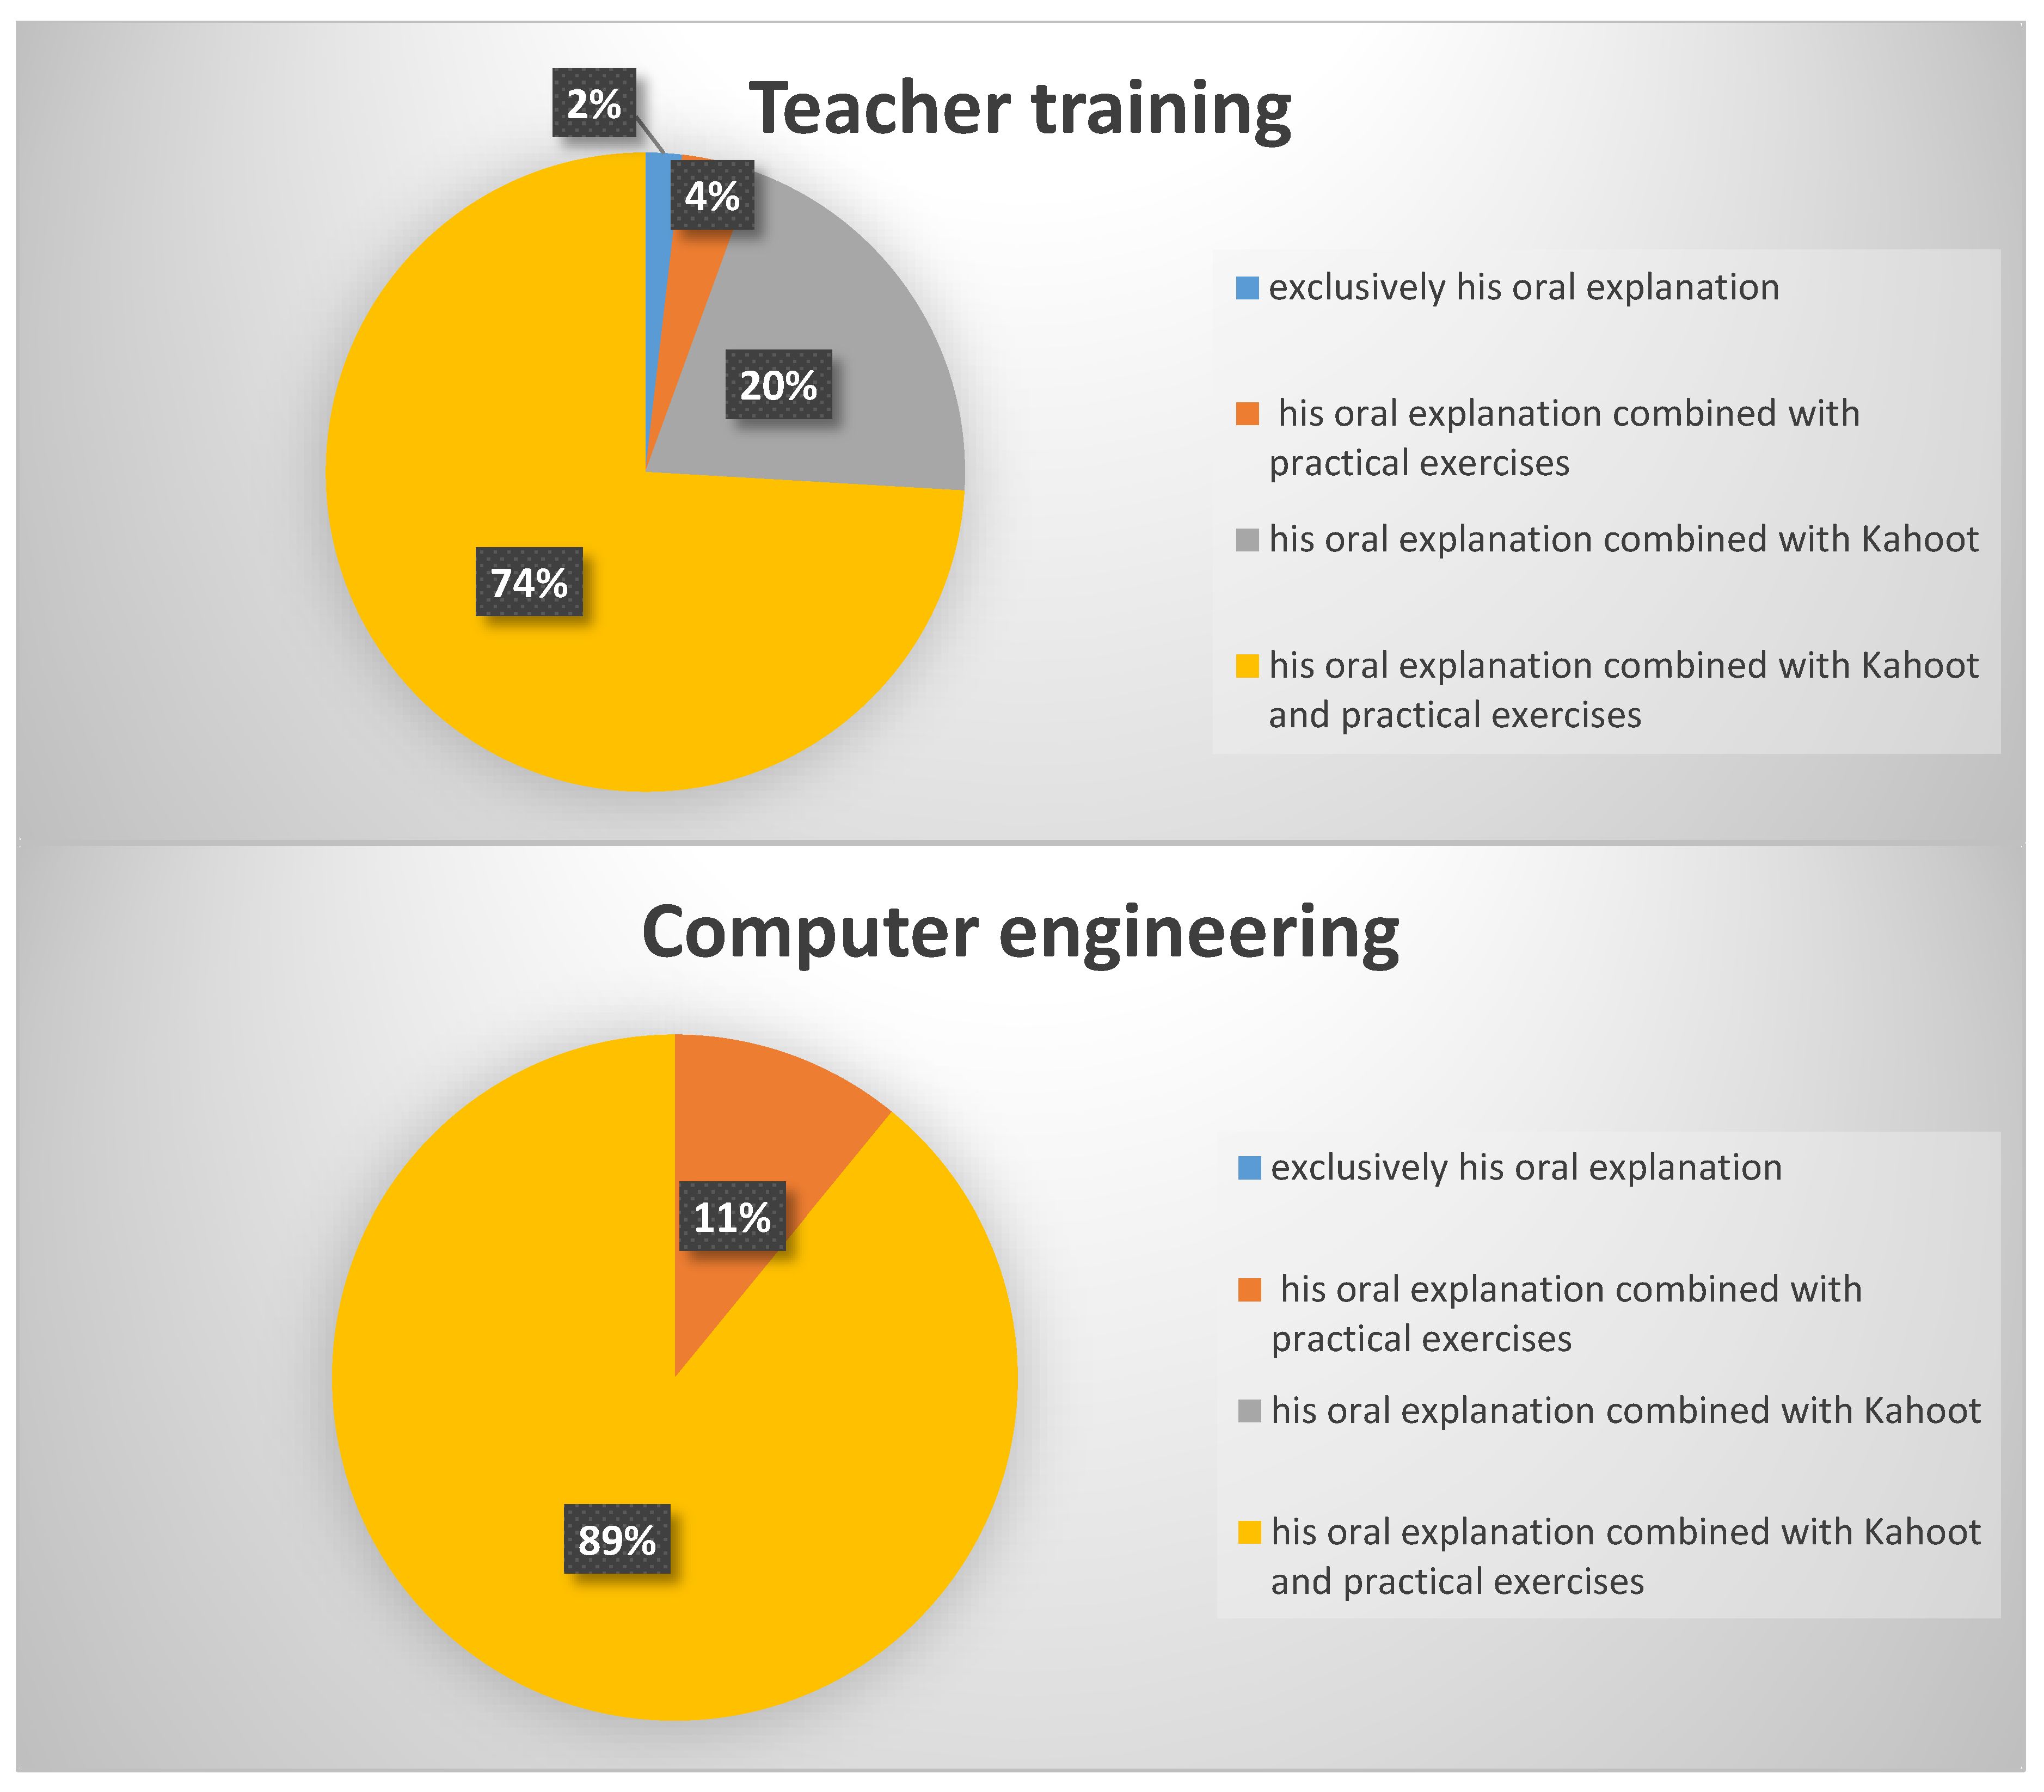
As for other organizational aspects, some differences were also detected. As for the moment of realization, it is remarkable the high percentage of students who prefer to do Kahoot at the beginning of the class, when the content has not yet been taught. Computer science students give more value to the realization of practical exercises combined with Kahoot and the explanation of the teacher. This can be explained by the more instrumental nature of computer studies.
The conclusions of this study therefore suggest that it does not seem appropriate to integrate gamification tools into all disciplines in the same way. Instead, a more in-depth study is needed to understand the effect of gamification on each type of study. In order to respond to the previous conclusions, as future work, the aim is to broaden the range of degrees in which to apply the study and determine which is the general trend according to the branch of study (Social Sciences, Engineering, Health Sciences, Experimental Sciences, Humanities, etc.), as well as to widen the number of items in the instrument. It is also necessary to include tests of academic performance to find out if there are differences in the impact of such performance according to the discipline of the university courses carried out.

Author Contributions

Conceptualization and formal analysis, M.L.P.-F.; investigation, M.L.P.-F., A.J.-M., and J.L.S.-R.; methodology, A.J.-M.; supervision, M.L.P.-F., J.L.S.-R., and H.M.-M.; writing—original draft, A.J.-M.; writing—review and editing, J.L.S.-R. and H.M.-M. All authors have read and agreed to the published version of the manuscript.

Funding

This work was supported by the I3CE Network Program of research in university teaching at the Institute of Educational Sciences at the University of Alicante (ICE call 2018-19) under Grant 4331.

Conflicts of Interest

The authors declare no conflict of interest.

References

  1. Finkel, D.L. Teaching with Your Mouth Shut; Heinemann: Portsmouth, NH, USA, 2000. [Google Scholar]
  2. Weimer, M. Learner-Centered Teaching: Five Key Changes to Practice; John Wiley & Sons: Hoboken, NJ, USA, 2002. [Google Scholar]
  3. Hinojo-Lucena, F.-J.; Aznar-Díaz, I.; Cáceres-Reche, M.-P.; Trujillo-Torres, J.-M.; Romero-Rodríguez, J.-M. Sharenting: Internet addiction, self-control and online photos of underage children. Comunicar Rev. Cient. Comunicación Educ. 2020, 28. [Google Scholar] [CrossRef]
  4. Williams, K.C.; Williams, C.C. Five key ingredients for improving student motivation. Res. High. Educ. J. 2011, 12, 1. [Google Scholar]
  5. Lloyd, D.H. A concept of improvement of learning response in the taught lesson. Vis. Educ. 1968, 21, 23–25. [Google Scholar]
  6. Wilson, K.; Korn, J.H. Attention during lectures: Beyond ten minutes. Teach. Psychol. 2007, 34, 85–89. [Google Scholar] [CrossRef]
  7. Risko, E.F.; Anderson, N.; Sarwal, A.; Engelhardt, M.; Kingstone, A. Everyday attention: Variation in mind wandering and memory in a lecture. Appl. Cognit. Psychol. 2012, 26, 234–242. [Google Scholar] [CrossRef]
  8. Hattie, J. Visible Learning: A Synthesis of over 800 Meta-Analyses Relating to Achievement; Routledge: Abingdon, UK, 2008. [Google Scholar]
  9. Hattie, J. Visible Learning for Teachers: Maximizing Impact on Learning; Routledge: Abingdon, UK, 2012. [Google Scholar]
  10. Littledyke, M.; Manolas, E.; Littledyke, R.A. A systems approach to education for sustainability in higher education. Int. J. Sustain. High. Educ. 2013, 14, 367–383. [Google Scholar] [CrossRef]
  11. Visvizi, A.; Daniela, L. Technology-Enhanced Learning and the Pursuit of Sustainability; Multidisciplinary Digital Publishing Institute: Basel, Switzerland, 2019. [Google Scholar]
  12. Hinojo-Lucena, F.-J.; Aznar-Díaz, I.; Cáceres-Reche, M.-P.; Trujillo-Torres, J.-M.; Romero-Rodríguez, J.-M. Factors Influencing the Development of Digital Competence in Teachers: Analysis of the Teaching Staff of Permanent Education Centres. IEEE Access 2019, 7, 178744–178752. [Google Scholar] [CrossRef]
  13. Deterding, S.; Dixon, D.; Khaled, R.; Nacke, L. From game design elements to gamefulness: Defining gamification. In Proceedings of the 15th International Academic MindTrek Conference: Envisioning Future Media Environments, Tampere, Finland, 28–30 September 2011; pp. 9–15. [Google Scholar]
  14. Rackwitz, R. Why Gamification is more than just a trend Engaginglab. Engaging lab/Gamification. Retr. Novemb. 2012, 12, 2017. [Google Scholar]
  15. Miller, C. The gamification of education. In Proceedings of the Developments in Business Simulation and Experiential Learning: Annual ABSEL Conference, Oklahoma City, OK, USA, 6–8 March 2013; Volume 40. [Google Scholar]
  16. Wang, A.I.; Zhu, M.; Sætre, R. The Effect of Digitizing and Gamifying Quizzing in Classrooms; Academic Conferences and Publishing International: Reading, UK, 2016. [Google Scholar]
  17. Kaufmann, D.A. Reflection: Benefits of Gamification in Online Higher Education. J. Instr. Res. 2018, 7, 125–132. [Google Scholar] [CrossRef]
  18. Chung, C.-H.; Shen, C.; Qiu, Y.-Z. Students’ Acceptance of Gamification in Higher Education. Int. J. Game Based Learn. 2019, 9, 1–19. [Google Scholar] [CrossRef] [Green Version]
  19. Costello, R.; Lambert, M. Motivational Influences for Higher Education (HE) Students. Int. J. Online Pedagog. Course Des. 2019, 9, 38–50. [Google Scholar] [CrossRef]
  20. Majuri, J.; Koivisto, J.; Hamari, J. Gamification of education and learning: A review of empirical literature. In Proceedings of the 2nd International GamiFIN Conference, GamiFIN 2018, Pori, Finland, 21–23 May 2018. [Google Scholar]
  21. Subhash, S.; Cudney, E.A. Gamified learning in higher education: A systematic review of the literature. Comput. Hum. Behav. 2018, 87, 192–206. [Google Scholar] [CrossRef]
  22. Fuster-Guilló, A.; Pertegal-Felices, M.L.; Jimeno-Morenilla, A.; Azorín-López, J.; Rico-Soliveres, M.L.; Restrepo-Calle, F. Evaluating Impact on Motivation and Academic Performance of a Game-Based Learning Experience Using Kahoot. Front. Psychol. 2019, 10, 2843. [Google Scholar] [CrossRef] [PubMed] [Green Version]
  23. Carrillo, D.L.; García, A.C.; Laguna, T.R.; Magán, G.R.; Moreno, J.A.L. Using gamification in a teaching innovation project at the university of alcalá: A new approach to experimental science practices. Electron. J. E Learn. 2019, 17, 93–106. [Google Scholar] [CrossRef] [Green Version]
  24. Kahoot! | Learning Games | Make Learning Awesome! Available online: https://kahoot.com/ (accessed on 12 December 2019).
  25. Lawshe, C.H. A quantitative approach to content validity 1. Pers. Psychol. 1975, 28, 563–575. [Google Scholar] [CrossRef]
  26. Tabachnick, B.G.; Fidell, L.S. Using Multivariate Statistics; Allyn & Bacon/Pearson Education: Boston, MA, USA, 2007. [Google Scholar]
  27. O’brien, R.G.; Kaiser, M.K. MANOVA method for analyzing repeated measures designs: An extensive primer. Psychol. Bull. 1985, 97, 316. [Google Scholar] [CrossRef] [PubMed]
  28. Vasey, M.W.; Thayer, J.F. The continuing problem of false positives in repeated measures ANOVA in psychophysiology: A multivariate solution. Psychophysiology 1987, 24, 479–486. [Google Scholar] [CrossRef]
  29. Cole, J.W.L.; Grizzle, J.E. Applications of Multivariate Analysis of Variance to Repeated Measurements Experiments. Biometrics 1966, 22, 810–828. [Google Scholar] [CrossRef]
  30. Davidson, M.L. Univariate versus multivariate tests in repeated-measures experiments. Psychol. Bull. 1972, 77, 446. [Google Scholar] [CrossRef]
  31. Schutz, R.W.; Gessaroli, M.E. The Analysis of Repeated Measures Designs Involving Multiple Dependent Variables. Res. Q. Exerc. Sport 1987, 58, 132–149. [Google Scholar] [CrossRef]
  32. Stevens, J.P. Applied Multivariate Statistics for the Social Sciences, 5th ed.; Routledge: Abingdon, UK, 2012; ISBN 978-1-136-91069-2. [Google Scholar]
  33. Hair, J.F.; Black, W.C.; Babin, B.J.; Anderson, R.E.; Tatham, R.L. Multivariate Data Analysis; Prentice Hall Upper Saddle River: New Jersey, NJ, USA, 1998; Volume 5. [Google Scholar]
  34. Kim, S. Interdisciplinary Approaches and Methods for Sustainable Transformation and Innovation; Multidisciplinary Digital Publishing Institute: Basel, Switzerland, 2015. [Google Scholar]
  35. Mishra, J.; Bavelier, D.; Gazzaley, A. How to Assess Gaming-Induced Benefits on Attention and Working Memory. Games Health J. 2012, 1, 192–198. [Google Scholar] [CrossRef] [PubMed] [Green Version]
Figure 1. Satisfaction profile for each group.
Sustainability 12 04778 g001
Figure 2. Item 4 distribution about the Kahoot’s moment of realization.
Sustainability 12 04778 g002
Figure 3. Item 6 distribution about the combination of Kahoot with other techniques.
Sustainability 12 04778 g003
Table 1. Participants in the study.
GenderTotal
FemaleMale
Degree ProgramTeacher training322254
Computer engineering233255
Total5554109
Table 2. Kahoot questionnaire.
ItemsAnswer Options
1. When I play Kahoot1.  I neither enjoy nor learn
2.  I enjoy, but I don’t learn
3.  I don’t enjoy, but I learn
4.  I enjoy and learn
2. Kahoot helps me strengthen what I learned in the classroom1.  Not at all
2.  Barely
3.  A fair extent
4.  A large extent
3. Playing Kahoot motivates me to learn the subject 1.  Not at all
2.  Barely
3.  A fair extent
4.  A large extent
4. I prefer to play Kahoot at the middle of the class.
at the end of class
at the beginning of the class
5. I would like the duration of Kahoot to be short (<5 min).
long (>15 min).
medium (between 5 and 15 min).
6. I prefer the teacher to explain the theoretical concepts byhis oral explanation combined with Kahoot and practical exercises
his oral explanation combined with Kahoot
his oral explanation combined with practical exercises
exclusively his oral explanation
7. In general, I consider Kahoot1.  Absolutely essential
2.  Necessary
3.  Rarely necessary
4.  Useless
Table 3. Reliability analysis.
Item NumberCronbach’s Alpha if Item Is Eliminated
10.774
20.635
30.553
70.566
Table 4. Description of satisfaction variables.
Type of StudentMeanStd. Dev.N
Item 2Teacher training2.930.54454
Computer engineer3.200.82655
Total3.060.711109
Item 3Teacher training2.940.62754
Computer engineer3.240.86055
Total3.090.764109
Item 7Teacher training2.910.52454
Computer engineer3.131.00155
Total3.020.805109
Table 5. Test of intra-subject effects.
SourceType III ErrordfFSig.η2 PartialOb. Pow.
Satisfaction0.29720.1480.5450.5810.005
Group*Satisfaction0.07720.0380.1410.8690.001
Error58.290214
Table 6. Test of inter-subject effects.
SourceType III ErrordfFSig.
Intersection3055.44412644.6530.000
Group5.60914.8550.030 *
Error123.620107
* Significant at 0.05 level.
Table 7. Contingency table on the response frequencies to the questionnaire.
ItemTeacher TrainingComp. Eng.Totalχ2Sig.
1. When I play Kahoot…1. I enjoy and learn.; 2. I don’t enjoy, but I learn.; 3. I enjoy, but I don’t learn.; 4. I neither enjoy nor learn.145448910020.801
2336
35510
4134
4. I prefer to play Kahoot…1. at the middle of the class.; 2. at the end of class.; 3. at the beginning of the class.19 *21 *3011,9500.003
2333265
312 *2 *14
5. I would like the duration of the Kahoot to be…1. short (< 5 min); 2. long (>15 min); 3. medium (between 5 and 15 min).1571221020.350
2162238
3332659
6. I prefer the teacher to explain the theoretical concepts by…1. exclusively through his oral explanation.; 2. his oral explanation combined with practical exercises.; 3. his oral explanation combined with Kahoot.; 4. his oral explanation combined with Kahoot and practical exercises.110116,1290.003
2268
311 *0 *11
440 *49 *89
* Significant at 0.01 level.

