Article

The Influence of Income and Social Capital on the Subjective Well-Being of Elderly Chinese People, Based on a Panel Survey

1
School of Management, Hefei University of Technology, Hefei 230009, China
2
College of Behavior and Social Science, University of Maryland, College Park, MD 20742, USA
3
College of Computer, Hefei University of Technology, Hefei 230009, China
*
Authors to whom correspondence should be addressed.
Sustainability 2020, 12(11), 4786; https://0-doi-org.brum.beds.ac.uk/10.3390/su12114786
Submission received: 19 May 2020 / Revised: 8 June 2020 / Accepted: 10 June 2020 / Published: 11 June 2020
(This article belongs to the Section Psychology of Sustainability and Sustainable Development)

Abstract

:
China has undergone many economic changes in the past four decades, and has seen an imbalance in economic development between rural and urban regions. Meanwhile, it also has an aging population. Using panel data on 3590 elderly residents aged between 60 and 95 in 28 provinces in China in 2015, this study explored older adults’ subjective well-being in terms of income, relative income, and social capital. The ordinary least square (OLS) regression results showed that the effect of actual income on subjective well-being was weak, and relative income and social capital had a significant effect on the happiness of urban and rural residents; however, there were substantial differences between urban and rural areas associated with economic inequality, social context, social security, and demographic characteristics. Expanding income inequality is contributing to decreased happiness of the rural elderly, while higher social trust and social interaction mitigate this negative influence. This paper also verified that relative income has a mediating or moderating effect on income and the subjective well-being of urban and rural elderly people. The evidence indicates that the Chinese government should pay more attention to reducing the income gap between and within urban and rural groups, and take advantage of social capital to improve the subjective well-being of the elderly population.

1. Introduction

Over the past four decades of reform, China has witnessed rapid economic development, with per-capita income rising 40-fold from 1978 to 2018 [1]. However, income gaps and the imbalance between urban and rural development have increased at the same time [2]. Moreover, China has the largest population of elderly people in the world, which presents problems associated with an aging population. By the end of 2018, the elderly Chinese population had reached 249 million, and it is expected to reach 483 million by 2050. The proportion of elderly individuals will go up from 17.9% to 34.1% [3,4]. This is a rising trend globally; in 2010, 1 out of every 12 people was over 60, and by 2050, this is expected to increase to 1 in 5 [5]. The happiness of elderly people and the differences between urban and rural areas have thus attracted increasing attention from society and the government.
Subjective well-being, which refers to the cognitive experience of life satisfaction according to one’s own standards, is an important index used to study the quality of life [6]. There is a growing research field focusing on this issue [7,8,9,10,11]. In 2017, at the 19th National Congress of the Communist Party of China (CPC), the Chinese government set the people’s well-being as a goal of sustainable development, and indicated that it must respond proactively to the aging population by adopting policies and fostering a social environment in which senior citizens are respected and cared for and can live happily [12]. However, China has to confront a major contradiction: people’s growing demand for a better life versus increasing economic inequality [12]. Between 1978 and 2015, the share of national income of the top 10% income band rose from 27% to 41%, while the share of the bottom 50% income band dropped from 27% to 15% [2]. Luo and Li found, based on data from the China Household Income Project (CHIP) from 2007 to 2013, that the income ratio between the top 10% of urban residents and the bottom 10% rose from 8.9 to 12.1, while the ratio for rural residents rose from 12.5 to 15.5 [13]. By applying the data from all respondents from the four years of the China General Social Survey CGSS (2011, 2012, 2013, and 2015), we calculated the Gini coefficient of the whole nation, urban areas, and rural areas (Table 1). The Gini coefficient is a statistical measure of allocation originated by the Italian statistician Corrado Gini in 1912. It is often used as an indication of economic inequality when measuring income distribution. The coefficient ranges from 0 to 1, with 0 representing perfect equality and 1 representing perfect inequality. A Gini coefficient above 0.4 is often seen as an important indicator of serious inequality. Inequality over this level is frequently related to political instability and growing social conflicts. It was evident that the intergroup gap of income in urban areas generally decreased, while in rural areas, intergroup inequality generally increased, except in 2013, when it significantly exceeded the warning line of 0.40. Our survey showed that income inequality in China is very serious, especially in rural areas.
Meanwhile, the Easterlin paradox exists in China, i.e., happiness does not necessarily increase with improved material living standards, and in fact shows a downward trend [14,15,16]. Li and Ma found that 31.2% of middle-aged and elderly people exhibited depressive symptoms, based on the China Health and Retirement Longitudinal Survey 2013 data [17]. Additionally, Steptoe, Deaton, and Stone indicated that the factors impacting subjective well-being change with age, and older age is an important stage in one’s life [10]. Therefore, there is a need to keep investigating the factors that influence the happiness of older adults, comparing the differences among groups, and to continue to explore solutions to improve their well-being.
The association between income and subjective well-being has been widely studied [15,18,19]. Meanwhile, the effects of social capital elements on subjective well-being are being increasingly analyzed [16,20,21]. However, integrated surveys based on national panel data are rare, especially among elderly people. In this study, we attempted to determine how income, relative income, and social capital are associated with subjective well-being by using data from a national panel survey. The present study had three unique aspects that distinguish it from previous studies. First, this analysis concentrated on the effect of the combined factors of income, relative income, and social capital on the well-being of older adults in China, and assessed the differences between urban and rural areas. The early models of Bartolini and Han explored the effect of combined factors, including the economy and social factors, on well-being in China [16,22]. However, their studies were population-wide and did not focus on older adults. Knight conducted a deep study on the effects of income and relative income on Chinese happiness, especially focusing on rural areas, but did not concentrate on the elderly or consider the social capital factor more widely [23,24,25].
Second, the income inequality analysis in this paper used personal and household relative income as stand-ins for the Gini coefficient, which were acquired by comparing the economic status of elderly people with that of their peers and the household economic status of seniors with that of local families. Diener reported that social comparison is a psychological process by which individuals develop their own feelings and self-categorization, rather than an objective comparison [26]. Previous studies have examined the relationship between self-rated relative income and well-being. For example, Bartolini and Sarracino used income ranking, i.e., how satisfied people were with their financial situation, reflecting social comparisons, and Knight used income anticipation to study the effect of relative income on happiness [16,27]. However, no studies to date have examined the relationship between self-rated relative income and subjective well-being using individual and household variables in an integrated approach.
Third, this study verified relative income, which is a self-measurement, moderating the effect of actual income on happiness. The Gini coefficient, as an income inequality variable, has been certified as a moderating factor between income and subjective well-being [28,29], but self-evaluated relative income, which links absolute income and well-being, has seldom been examined.
Research on the subjective well-being of Chinese older populations has increased, but has rarely included comparisons of urban and rural areas. Moreover, we found inconsistent results on relationships between income and perceived relative income with subjective well-being, with the reported effects not always in the same direction. For example, based on the data of the Chinese Longitudinal Healthy Longevity Study 2005, Hu and Lu reported that income inequality (1) had a negative effect on the subjective well-being of senior adults, and (2) exerted a significant influence in rural areas, but no effect in urban areas [30]. Bai and Yuan used data from the China Health and Nutrition Survey (CHNS) 2011 to conclude that absolute income directly affected the happiness of older adults, and had an indirect influence via health and entertainment. Relative income was shown to have a significant effect on the well-being of rural elderly people, but also showed marked inequality between different income groups [31]. Bakkeli examined the CHNS data from 2006, 2009, and 2011, and reported that an increase in income positively influenced high-income urban and lower-income rural elderly people; this income inequality (i.e., the Gini coefficient) significantly affected urban, but not rural senior citizens [32].
Social psychologists focused on the issue of Chinese older adults and found that social capital affects well-being even more than economic factors [16,33]. Qiao et al. used the Chinese General Social Survey (CGSS) 2015 data to report that having more social contacts predicts higher subjective well-being for elderly people, and noted that the main social contacts were friends in urban areas and neighbors in rural areas [34]. Ye elaborated on the ways in which social capital influences mental health, and observed that social capital could relieve the health inequality that results from economic inequality and affects the well-being of older adults [35]. Lou, using the CGSS data from 2010 and 2015, found that social interaction is positively associated with subjective well-being of urban, but not rural, elderly. Social trust significantly affects the subjective well-being of elderly people, as evidenced by an increase from 2010 to 2015 [36]. Deng surveyed the data of CGSS 2015 and reported that social relationships were positively correlated with the subjective well-being of older adults, in that senior residents with no children and no spouse experienced a negative effect on happiness [37]. All of these studies indicated that social capital is positively correlated with the subjective well-being of senior citizens, and that differences can be found between residents of urban and rural areas; however, the exact nature of these findings was inconsistent.
Previous studies have shown that income, relative income, and social capital are predictors of subjective well-being, and the results obtained using different variables and methods of evaluation were enlightening, although inconsistent, and lacked clear vision regarding the issue. Our study provided a more clear and comprehensive exploration of the above situations through a comparative study of urban and rural areas.

2. Literature Review

2.1. Income and Subjective Well-Being

Income and relative income are key elements that affect happiness, and the correlation between income and subjective well-being has been extensively studied in recent years. Income can meet basic needs and satisfy diverse wants, and many studies have shown that an increase in income directly leads to greater happiness [18]. However, the Easterlin paradox, which states that happiness does not increase synchronously with economic development in the long term, has been widely observed in both developed and developing countries [38]. Using the World Values Database (WVS) from 1990–2010, Easterlin et al. found no proof of increased life satisfaction associated with a four-fold expansion of consumption in China, mainly due to the dismantling of the social safety net and escalating income inequality [14].
Easterlin indicated that relative income, i.e., a comparison between one’s own and others’ income and one’s previous income, which is an indicator of income inequality, is an important factor that affects people’s happiness [39]. Diener and Lucas found that people partly rely on perceived feelings obtained by making comparisons with other social groups [40], and previous studies have indicated that perceived relative income, which expresses one’s subjective income status compared to reference groups, is linked to decreased happiness [28,29,41]. In studies regarding the association between subjective well-being and relative income, a reference group should be used.
Festinger’s social comparison theory indicates that people tend to evaluate their situation in the easiest way, but without abstract solutions, and to determine their social status by comparing with other people they know well or like [42]. Clark and Senik indicated that people may appraise themselves with nonrepresentational subgroups akin to them with regard to sociodemographic traits such as age, education, occupation, resident district, etc. [43].
Layard, Mayraz, and Nickell estimated perceived relative income among US families using a five points scale (well above average to well below average) [44]. Luttmer reported that neighborhood income had a significant negative association with well-being [45]; however, Deaton and Stone (2013) indicated that having richer neighbors was positively linked with life satisfaction [46]. Gao Yang evaluated relative income using relative economic status compared with other peers on a 3 point scale (lower, similar, and higher) and self-assessed social class on a 10 point scale (lowest to highest), and found that they were both significantly positively associated with the subjective well-being of elderly Chinese people [47]. Knight et al. considered the impact of income on the well-being of urban and rural residents in China. Based on CHIP 2002 data, Knight et al. indicated that despite their relative poverty and low social status, Chinese rural residents exhibited higher levels of happiness than urban residents, and relative income according to others in the same village was a better predictor of happiness than absolute income [23,25].

2.2. Social Capital and Subjective Well-Being

In addition to material factors, social factors are also found to be important in influencing subjective well-being. Social capital is considered to be an important element that strongly influences subjective well-being. Many inconsistent definitions exist for social capital; this study used Putnam’s definition: “the networks together with shared norms, values, and understandings that facilitate co-operation within or among groups” [48]. This work only analyzed the social connections of social capital without considering economic relationships such as having similar interests, engaging in meaningful activities, possessing analogous backgrounds, etc. [49]. Trust in individuals and social interactions are regarded as the elements of social capital, and are more strongly associated with people’s happiness than a higher economic level.
Helliwell put forward that social trust is the most representative variable of social capital and belongs to the cognitive content of social capital; improvement in social trust was found to significantly improve subjective well-being [50]. Using the World Values Survey, Bartolini and Sarracino found that the subjective well-being of Chinese residents decreased overall from 1990 to 2007, with social comparisons and a decline in social capital mostly explaining the Easterlin paradox observed in China [16]. Ai and Yuan examined the relationship between social networks and subjective well-being based on the World Values Survey 2012 Chinese sample data, and found that greater social trust and social activity were positively associated with subjective well-being [33].
The research object of this paper was the elderly population in China. According to Carstensen’s social emotion selection theory (1999), older adults perceive a limited future and regard emotional management as their social goal [51]. Social interactions and a cohort of family and friends are important factors in reducing negative emotions and promoting positive emotions [52]. Social interaction has been previously shown to have a profoundly positive effect on the subjective well-being of elders [53,54]. Using data from CGSS 2010 and 2015, Lou et al. found that social interaction (measured as occasions of interaction during free time over the last year measured on a 5 point scale, with 1 = never and 5 = very frequently) was not linked to the happiness of urban elderly people in 2010; however, a significant positive relationship was shown in the 2015 survey [36]. Zhu et al. found that social interaction with friends was connected with higher subjective well-being [55].
Based on the data from the nationwide CGSS 2015 questionnaire results from 28 provinces in China, this study analyzed the effects of income, relative income, and social capital on the subjective well-being of elderly people and inspected the moderating role of income inequality between absolute income and well-being by comparing urban and rural areas. As Dowd indicated that elderly population are more likely to depend or depend on others to meet their essential needs with their resources decline with age, for example, the decreasing of income, the declining of health, the loss of characters in neighborhood or working place [56]. Elderly people are a unique and vulnerable group, and should receive more attention as the global population continues to age. The results from this work provide a better understanding of the link between income and social capital and the effects of this relationship on the subjective well-being of older Chinese adults.

3. Data and Methods

3.1. Source of Data

This study used data derived from the China General Social Survey (CGSS), jointly conducted by the Sociology Department of Renmin University of China and the Research Center of the Chinese University of Hong Kong. Beginning in 2003, a cross-sectional survey of more than 10,000 households across Chinese provinces and regions is carried out annually. Its sample design takes the national census data as the overall information source, and it adopts a stratified design and multi-stage probability-proportionate-to-size (PSS) sampling method. The CGSS is the earliest continuous, comprehensive national academic survey project in China, and the most important source of social data for studying Chinese society. In the wake of CGSS 2015, there were six data modules, A–F, and all the data used in this study were selected from Modules A or B, for which the response rate was 100% of the samples. However, the response rate of Modules C and D was one-sixth, and of Modules E and F was one-third. The representative sample included 10,968 valid questionnaires from respondents aged 23 to 100 years, with 4564 elderly respondents (2517 urban and 2047 rural) from 478 villages in 28 of 31 provinces/cities/autonomous regions. Qinghai, Ningxia, and Tibet were not covered in this survey, and, as these three regions cover only a very small proportion of the nation, these missing data were not expected to influence the national representativeness of the measure. After eliminating samples with missing indicators and obviously abnormal answers, 3590 valid samples were obtained, consisting of respondents ages 60 to 95 years. In this study, we eliminated CGSS 2015 samples that had missing items or that deviated from the normal samples to ensure the authenticity of the respondents’ information. The rule of elimination was that if a certain index value of the variable was missing, or if the data of the variable obviously deviated and did not conform to normal logic, it was considered an invalid sample. Although the statistical interpolation method can allow the sample size to be retained, it can affect the distortion of the research results, so the approach of eliminating invalid samples was adopted Table 2 shows the descriptive statistics of respondents in this study. The respondents (47.6% male) were aged 60 to 95 years of age, with a mean age of 69.56; 1958 (45.5%) were from urban areas and 1432 (54.5%) were from rural areas, which was consistent with the 2015 national survey results [57]. This confirmed the conclusion of Luo, who reported that the CGSS has a low deviation from the overall Chinese demographic structure in terms of sex and age groups [13]. Details of the CGSS data and survey methods can be found at the official website of Chinese General Social Survey.
This study concentrated on urban and rural elderly people, which was reflected in the question on hukou status. The hukou system was established in 1958 and has shaped the dual economic structure in China, Which has been gradually formed in the process of the urbanization with the difference in the development of urban and rural productive forces, and has resulted in the inequality of social and economic development between urban and rural areas [58,59]. There is obvious variation between urban and rural older adults in terms of economics, consumption, health, social context, rights and benefits, and mental life [60]. In CGSS 2015, the average personal income of urban elderly respondents was 3.71 times that of rural seniors, with families in rural areas having more children than those in urban areas (3.00 > 2.30). Most elderly people in both urban and rural areas had basic medical and pension insurance. However, in the urban areas, 357 (18.3%) were uneducated, while in the rural areas 650 (39.8%) were uneducated; 538 (27.5%) elderly people in urban areas and only 57 (3.5%) in the rural had a high-school level education or above. The majority of the respondents were married (74%); 42 (1%) urban and 46 (3%) rural senior people were widowed. Self-rated health condition was rated as poor by 487 (25%) urban and 599 (36%) rural seniors, demonstrating obvious differences in the characteristics between urban and rural elderly people and reflecting their actual environment regarding reports of living conditions in urban and rural areas of China (Table A1). The comparative analysis between urban (N = 1958) and rural (N = 1432) seniors in this study was very meaningful, revealing information concerning the subjective well-being of these populations.

3.2. Variables

Subjective well-being, as the dependent variable, was measured in the CGSS 2015 using the question “Overall, do you think your life is happy or unhappy?” with a scale from 1 (very unhappy) to 5 (very happy). We used this question alone to measure the overall level of happiness, although measurement using a single item has certain limitations. Ngamba’s literature review demonstrated that the effect of different measurement methods on results of this nature is not significant [61]. The average values of subjective well-being of urban and rural samples were similar, with the urban average being slightly higher than the rural average (urban = 3.96, rural = 3.87, range = 1–5) (Table 2).
We considered four independent variables: personal income, relative income, social trust, and social interaction. Personal income was measured by using self-reported annual income in 2014 as a Napierian logarithm variable of continuous income, with responses ranging from RMB 0.00 to RMB 960,000.00 (renminbi, or Chinese yuan). The average income of elderly people was RMB 19,336.52, and the average income of urban respondents was 3.71 times that of rural respondents. The measurement was in accordance with a study by Cummins showing that individual annual income indicated personal income [9].
Relative income expressed income inequality in the social comparison conducted in this work. Personal relative income was self-measured using a question comparing personal economic status with that of the peer group on a scale from 1 to 3 (reverse-coded: 1 = lower than average, 2 = average, 3 = higher than average), while householder relative income was self-estimated using a question indicating the householder’s economic status compared to local families, ranked on a scale from 1 to 5 (1 = far below average, 5 = far above average) (Table A1). Wolbring indicated that individuals tend to compare themselves socially with similar average citizens instead of friends or relatives to decide whether their income is satisfactory [62]. Clark, Kristensen, and Westergard-Nielsen (2009) found an obvious influence of average income on well-being in small communities, but not in big cities [63]. The daily lives of elderly people are mainly carried out in the community where they live, and most of the people they communicate with are local. Therefore, as per previous studies, we adopted personal and household relative income from the perspective of social comparison to investigate the influence on the subjective well-being of older adults [37,48,63]. Urban elders reported a slightly higher level of relative personal income than rural elders (1.78 > 1.67), while rural respondents expressed a slightly higher level of relative household income than urban respondents (2.33 > 2.22).
This study selected social trust and social interaction as variables to describe social capital. Social trust encompasses four variables: general social trust, distrust, neighbor trust, and relative trust [22,36,47]. General social trust was measured by asking respondents whether they thought most people were trustworthy, ranked on a scale from 1 to 5 (1 = completely disagree, 5 = completely agree). Social trust was measured using questions that asked respondents whether they generally agreed that others would try to take advantage of them in society if they were not careful, with the same 1–5 ranking. Neighbor trust was assessed by a question regarding the respondents’ degree of trust in general social interactions with neighbors with no monetary benefits, ranked on a scale of 1–5 (1 = most untrusted, 5 = most trusted). Relative trust was addressed by a question regarding the degree of social interactions with relatives with no monetary benefits, with the answers scored the same as above. Urban elders reported a slightly higher level of general social trust and neighbor trust, and rural elders indicated a slightly higher level of relative trust (Table 2).
Social interaction was expressed by three variables: general social interaction, friend interaction, and neighbor interaction [36,53,54]. The CGSS 2015 questions asked how often the respondents interacted socially in their spare time over the last year, how often they interacted socially with their friends in their spare time, and whether they were familiar with their neighbors, with five options: 1 = never, 2 = rarely, 3 = sometimes, 4 = often, and 5 = very often. As shown in Table 2, the levels of two of these variables were higher in the rural than the urban elderly population.
In this study, socioeconomic and demographic characteristics identified from previous studies (sex, age, education level, marital status, number of children, basic medical insurance, basic pension insurance, and self-rated health) were chosen as control variables [22,28,64]. In the CGSS 2015, the ages of the respondents ranged from 60 to 95 years, and urban respondents showed a slightly higher average age than rural respondents (70.04 > 68.98). Regarding basic medical and pension insurance, the questions were “At present, do you attend the following social security projects: urban basic medical insurance/new rural medical insurance?” and “At present, do you attend the following social security projects: urban/rural basic pension insurance?” The level of basic medical insurance in both samples was the same, and urban elderly showed a slightly higher level of basic pension insurance. The range of number of children was 1–10, and we categorized the variable in four options (1 = no children, 2 = one child, 3 = two or three children, 4 = four or more children); the average number of children in urban areas was 2.30 and in rural areas was 3.00. As for education, the data of CGSS 2015 contained 14 options, from uneducated to master’s degree and above; this study integrated these and kept four options: 1 = uneducated, 2 = elementary school, 3 = middle school, and 4 = high school or above. The level of education among rural respondents was much lower than that among urban respondents (1.81 < 2.74). In addition, marital status is an important social relation for the elderly. In CGSS 2015, marital status had seven categories, and we combined these into three groups: 1 = married (including cohabitation, first or second marriage), 2 = widowed, 3 = other (including not married, separated, divorced). Marital status was similar in both samples. Self-rated health is very important for elderly people, and the question asked about the respondent’s self-reported health at present (1 = very poor, 5 = excellent). In this study, rural respondents expressed slightly better health than urban respondents. Descriptive statistics of subjective well-being and the recruitment rate are listed in Table A1.

3.3. Methods

For data where dependent variables are ordered variables, methods such as ordered regression or ordinary least squares (OLS) can be used, and the effects of the two research methods are similar [65]. This study used the OLS regression model, including many variables, to study the effects of income, relative income, social trust, and social interaction on the subjective well-being of elderly Chinese people. Moreover, this paper analyzed the moderating effect of relative income, a variable reflecting income inequality, on the subjective well-being of respondents affected by income. Using multivariate regression analysis with income as the independent variable, a stratified regression was performed. This was used to verify the effects of income and relative income, and the moderating effect of relative income on income and subjective well-being of urban and rural respondents, separately [66]. We made all the regressions assuming the following general specification and moderating formula:
SWB2 = β + γ1LnPInc + γ2ReIncs + γ3Trusts +γ4SocInters + θ1Sex + θ2Age + θ3 NuChi + θ4 Edu+ θ5 Marriage + θ6Basic-Mi +θ7Basic-Pensioni + θ8 Self-raHealth+ μi.
SWB1 = α + ∂1LnPInc + ∂2ReIncs + ∂3LnPInc*ReIncs
where SWB represents subjective well-being, α, β represent constant terms, γ represents the regression coefficients of independent variables, and LnPInc represents personal annual income. Relative incomes (ReIncs) represents relative personal and household income; Trusts represents general social trust, social distrust, neighbor trust, and relative trust; SocInters represents general social interaction, friends interaction, and familiarity with neighbors; θ represents the regression coefficient of covariates; NuChi is the number of children in a family; Basic-Mi stands for basic medical insurance; Basic-Pensioni stands for basic pension insurance; Edu is education level; Marriage is marital status; and Self-raHealth is self-rated health. SPSS 25.0 software was used for the study and the analysis.

4. Results

Before conducting the regression analysis in this study, we tested the value of the variance inflation factor (VIF), which is an instinctive interpretation of the degree of multicollinearity of the ith regressed independent variable; if the value of VIF is less than 10, there is no multicollinearity among the variables, otherwise it may influence the regression result, with no statistical significance [67]. In all five models, as shown in Table 3 and Table 4, the VIF was less than 3, indicating no sign of multicollinearity; therefore, multiple regression could be run for this analysis.

4.1. Regression Model Test

Model 1, as described in the two tables, explored the degree of influence of personal income and the control variables on individual subjective well-being. Personal income was positively associated with subjective well-being in both urban and rural areas (ß = 0.016, p < 0.01; ß = 0.011, p < 0.05). As for the control variables, sex, number of children, and self-rated health had a significant relationship with subjective well-being in both models; compared with males, females exhibited higher subjective well-being, and those with no children or one child reported significantly lower well-being. Self-rated health showed a strong positive association with happiness. Age, being married, and having basic medical and pension insurance were associated with positive effects in the urban model, but not in the rural model. Education indicated a medium or small positive effect in the urban group, with elementary-educated seniors reporting being the happiest. Meanwhile, only middle-school-educated rural elderly people felt slightly happier than others. Model 2, as shown in the two tables, showed that relative income, comparing one’s recent economic status with peers and current household income ranked with the other local families, was significantly positively related to subjective well-being in both urban and rural areas, and the mediating effect of the relative income variables was significant in both areas. Absolute income had no significant relationship with the happiness of Chinese elders in either sample.
Models 3 and 4 in Table 3 and Table 4 present the association between social capital and subjective well-being, and regressions of the four variables measuring social trust showed various results in urban and rural areas. General social trust and relative trust presented a positive association with happiness, and neighbor trust showed no significant relationship with subjective well-being in urban and rural samples; distrust showed no significant relationship with subjective well-being for urban respondents but was strongly negatively linked to the happiness of rural seniors. Meanwhile, personal income had a weak or no significant relationship with subjective well-being for urban or rural participants (Model 3 in Table 3 and Table 4).
As to the association between social interaction and subjective well-being (Model 4 in both tables), the coefficient of familiarity with neighbors was positive for both groups of respondents, which showed that the more familiarity with neighbors, the greater the happiness. Friend interaction did not show a significant relationship with subjective well-being in either sample, and general social interaction showed a strong positive association with happiness in rural respondents, but an insignificant link in the urban sample. Personal income indicated no significant relationship or a weak association with subjective well-being for urban or rural participants (Model 3 in Table 3 and Table 4).
Model 5 was the full model and presents the findings that involve all independent and control variables. Personal income exhibited no significant association with happiness because of the impact of other independent and control variables in both urban and rural samples. However, relative income, social trust, and social interaction were strongly significantly related to subjective well-being as in Models 3 and 4, although the scale coefficients dropped a little. Referring to the control variables, being female and having basic pension insurance and a higher level of self-rated health were associated with greater happiness in urban participants, while being female and having good self-rated health were linked with more subjective well-being in rural participants.

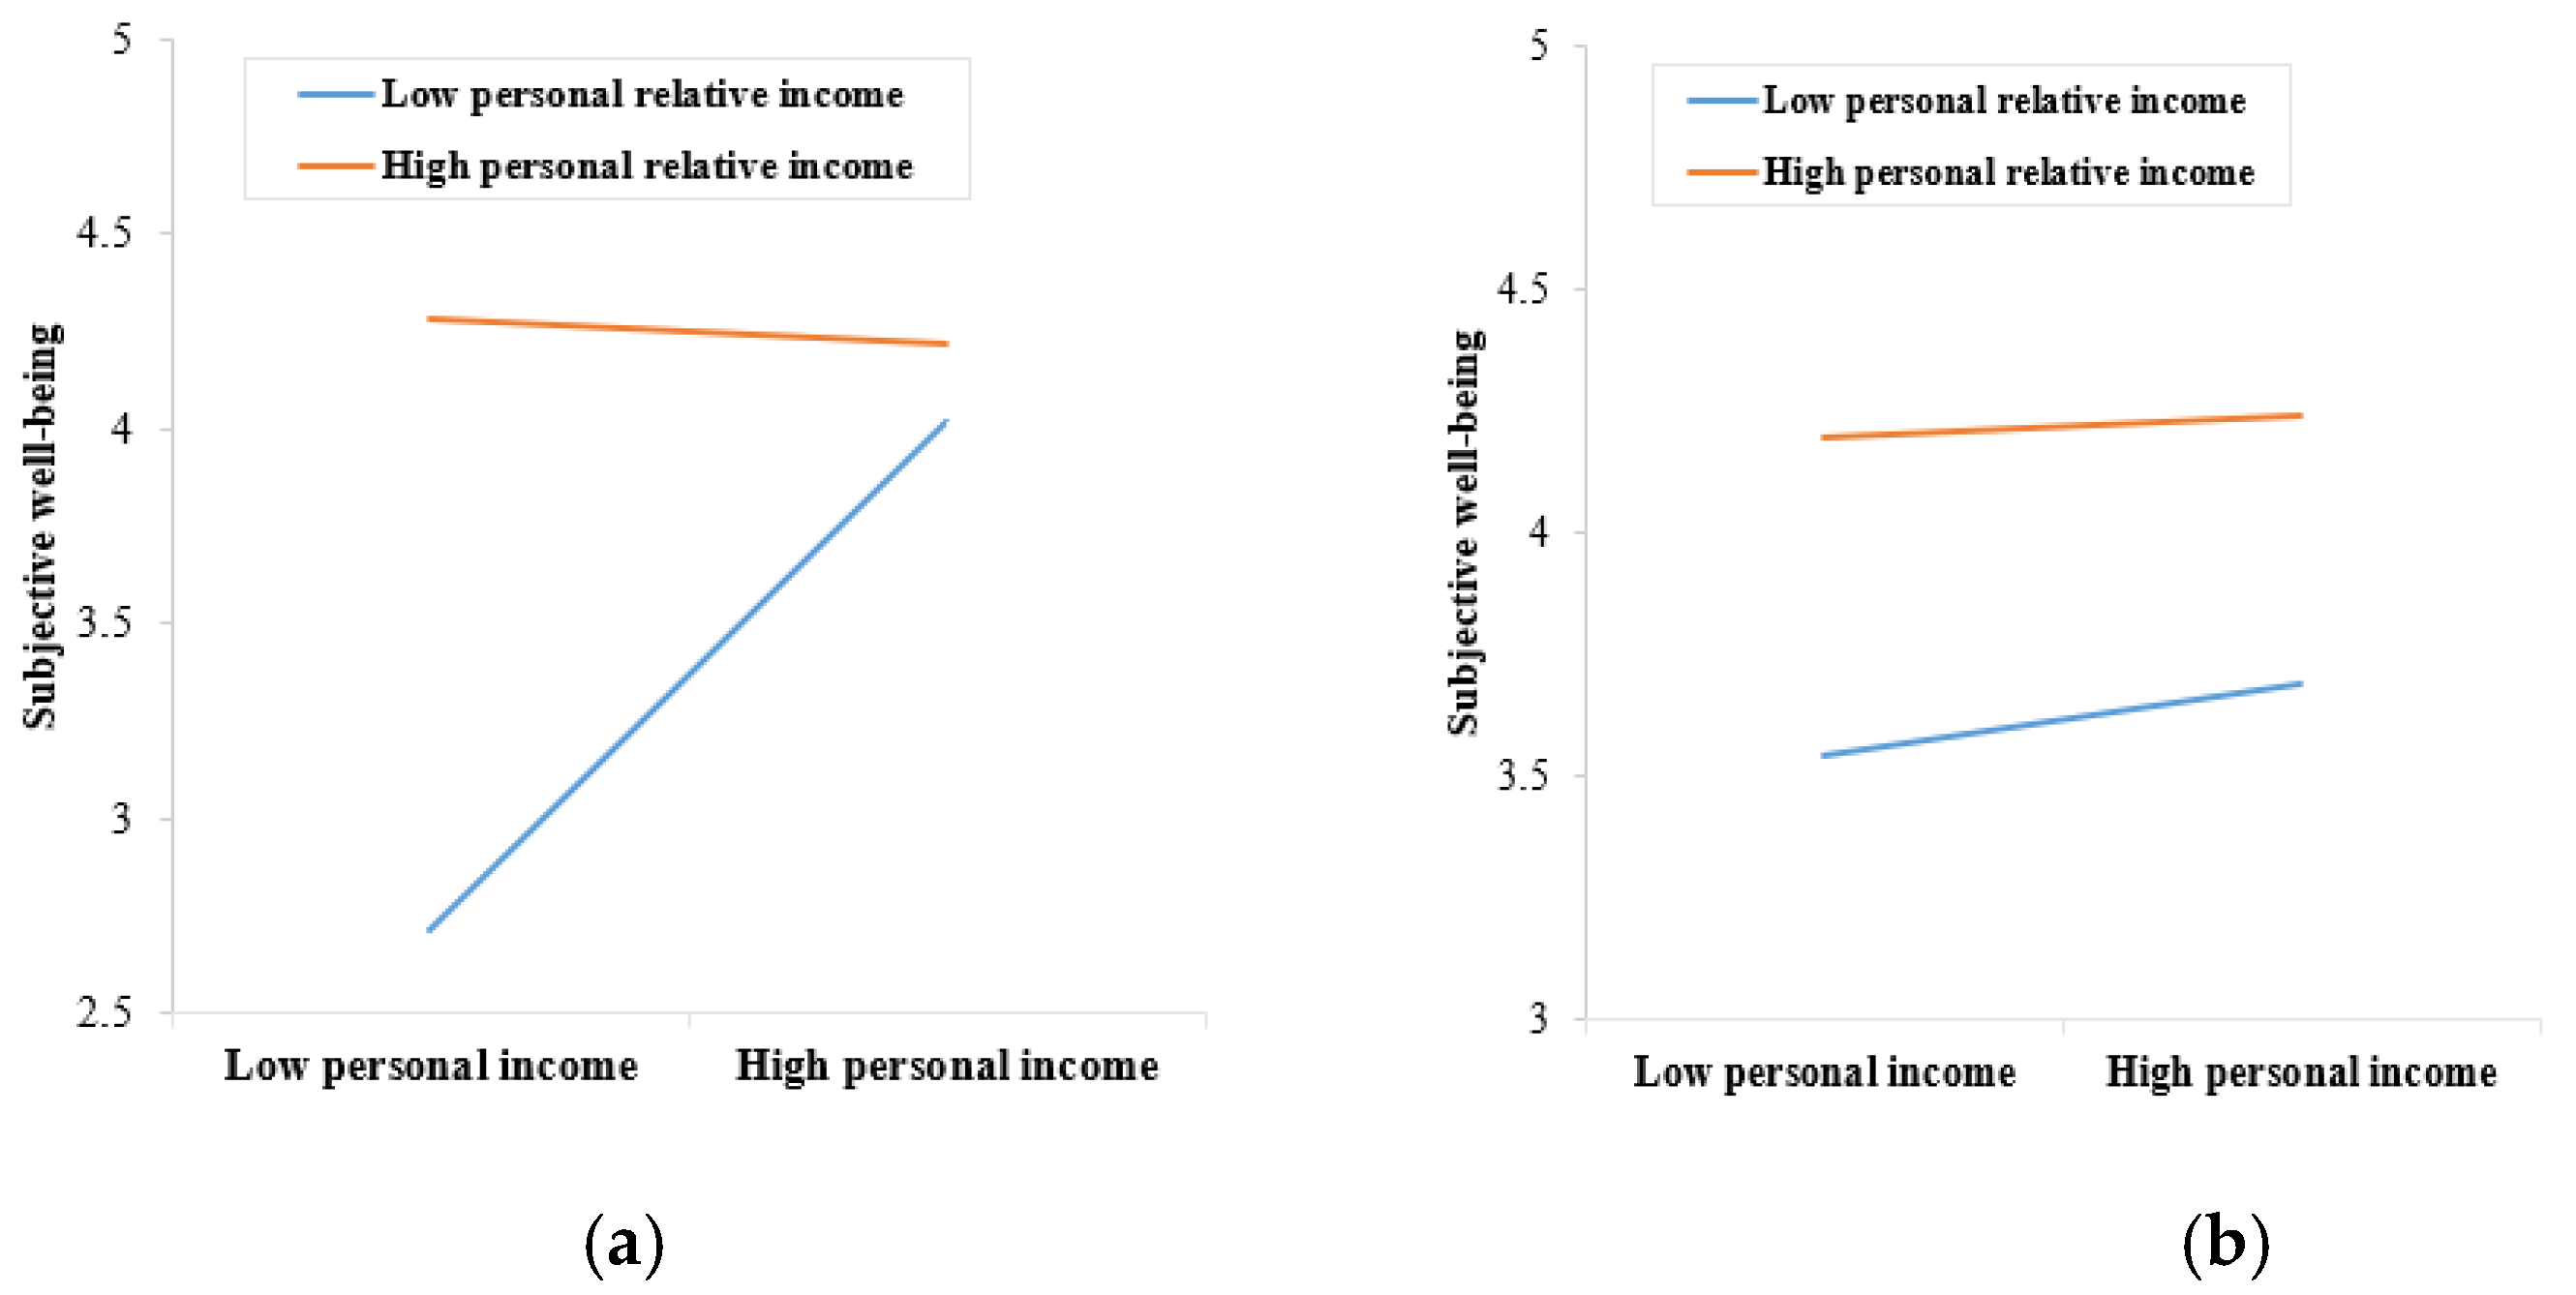
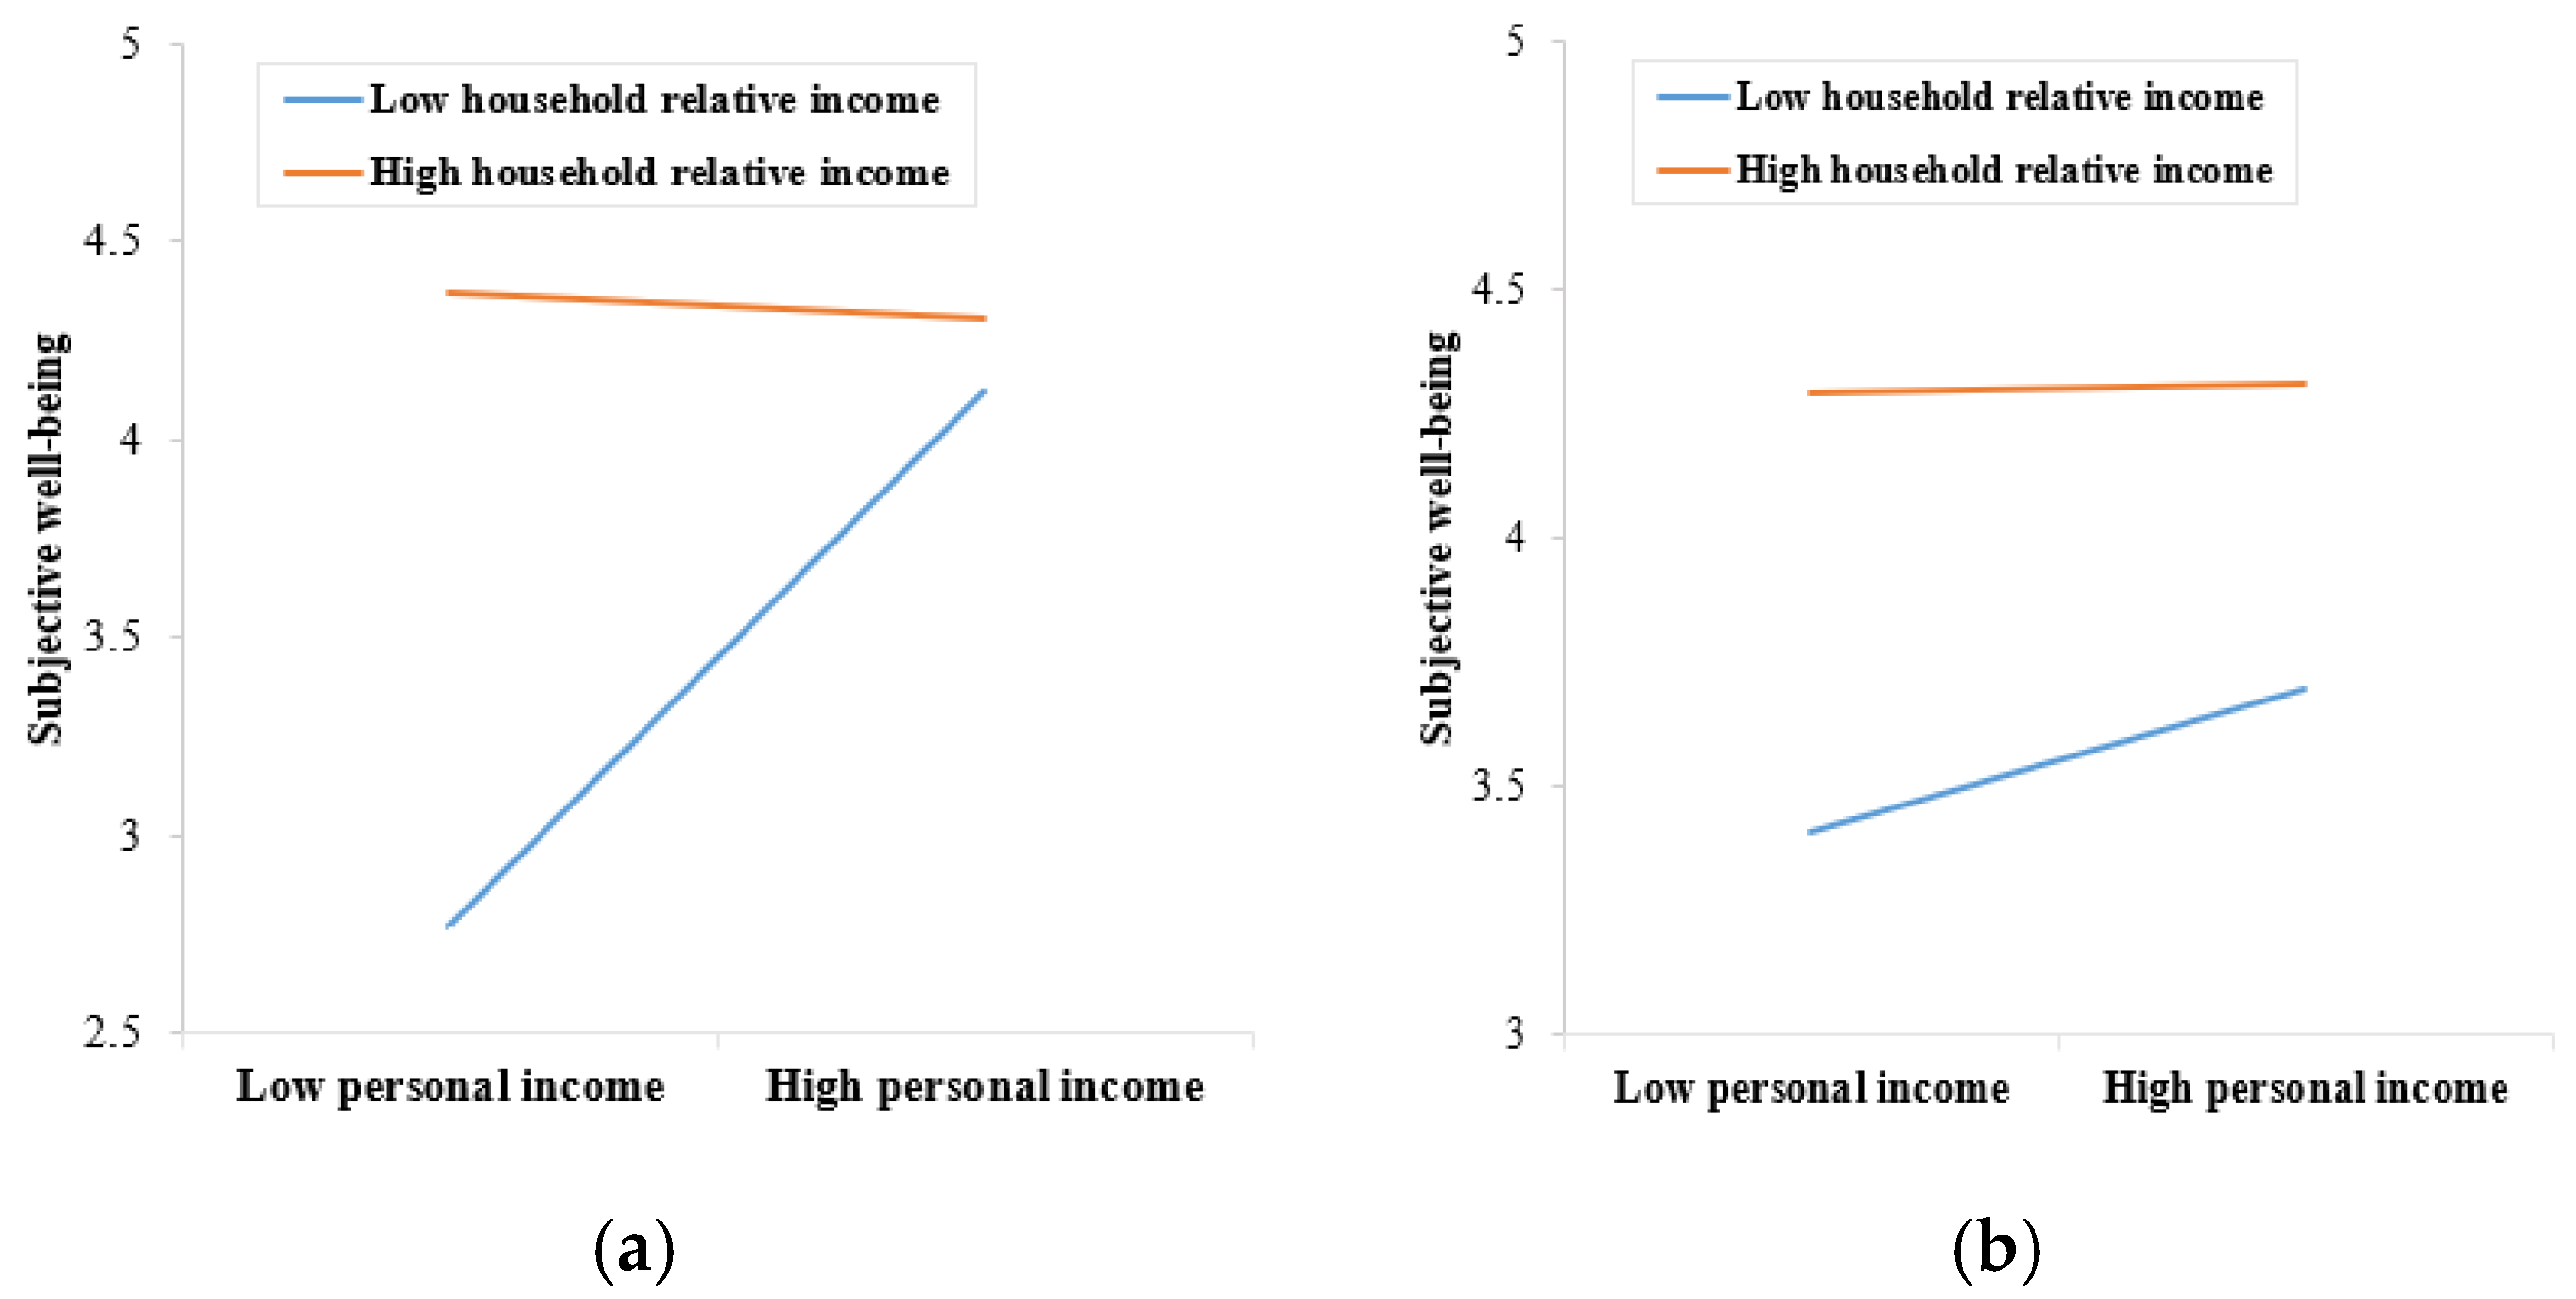
4.2. Moderating Effects of Relative Income

This study tested the moderating effect of relative income on the bivariate correlation between personal income and subjective well-being in urban and rural samples. Figure 1 shows that the moderating influence of relative personal income, which is personal economic status compared with peers, was statistically significant in the urban sample (ß = −0.355, SE = 0.104), but not significant in the rural sample (ß = −0.027, SE = 0.083).
Figure 2 shows that the moderating influence of relative household income, which is the household economic status compared with local families, was also statistically significant in the urban sample (ß = −0.353, SE = 0.111), but not significant in the rural sample (ß = −0.067, SE = 0.091).
Lower relative personal and household income had a strongly negative moderating effecon the association between personal income and subjective well-being for urban respondents; that is, the moderating influence of income inequality was more noticeable for low-income urban senior citizens.

4.3. Sensitivity Analysis

This part of the study examined the sensitivity of the findings regarding comparisons of the independent variable in the one to five models of the Table 3 and Table 4, including relative personal and household income, general and group social trust, and general and group social interaction. We found that the effects of variables of relative income, social trust, and social interaction on subjective well-being exhibited similar regression results and consistent sign directions; therefore, this empirical research was considered to be robust and reliable.

5. Discussion

As previous findings have shown significant variation in the effects of income and social capital on subjective well-being, this paper focused on a panel data investigation of the senior population in China, and explored differences in the association of income, relative income, and social capital on subjective well-being between urban and rural respondents to examine whether income inequality according to social comparison with peers or local families moderated the relationship between personal income and subjective well-being. Four general results are presented in detail in the following.
First, in our analysis, the relationship between personal income and subjective well-being was either weak or insignificant in both urban and rural settings. This finding was consistent with research based on CGSS 2013 data, which found no significant relationship between income and subjective well-being among elderly Chinese people [50]. However, it was inconsistent with Wang’s study of CGGS 2006 data, which found a significant positive relationship between income and well-being [68]. The lack of a consistent relationship between income and well-being among Chinese participants was explained by research based on the Chinese Household Income Project (CHIP) 2002 and 2007 panel data [2]. This research proposed the “hedonic treadmill,” which suggests that an increase in income is not accompanied by a rise in happiness because people advance their aspirations in response to income growth. Additionally, elderly Chinese people express less desire than other groups for material possessions, especially those in rural settings [24,27]. Second, relative income through social comparison showed a strong significant association with subjective well-being in both urban and rural respondents, but with different effect paths. More than one-third of older people reported lower relative income, and less than 10% of respondents reported higher relative income, which was shown to significantly impact well-being. For urban respondents, relative income influenced well-being via mediating and moderating mechanisms, showing a direct positive impact on subjective well-being and higher economic status compared with peers or other families, accompanied by greater levels of happiness. The moderating influence of income inequality on relative income was more significant for low-income than high-income seniors; low-income older adults who live in richer urban communities or with wealthy peers experience less happiness, and increasing their income would result in more happiness.
However, for the rural population, relative income only mediated subjective well-being, and higher relative income status was linked with greater levels of happiness. However, a simple increase of income for rural older adults was not related to better well-being, a result that was consistent with Knight’s survey [27].
In China, there are significant advantages to living in an urban area rather than a rural area in terms of income, social security, education, economic policy, etc. [69]. Most urban seniors depend on pensions, with greater amounts of money accompanying increased age. However, older people in rural areas mainly rely on labor or alimony to meet their basic needs, with older age correlated with lower income and greater reliance on others [60]. Using the CHIP 2002 data, Knight surveyed the differences between urban and rural areas in China in terms of subjective well-being and indicated that rural people expressed greater levels of happiness than urban people [27]. However, in this study, rural seniors expressed lower subjective well-being than urban seniors. There are two possible reasons for this: (1) there was no positive influence of income on subjective well-being and it had no significance in the rural elderly sample population, or (2) the expanding intra-group income inequality among elders in rural areas negatively affected happiness, negating the positive impact on well-being brought about by increased income.
In China, along with economic growth, the living standard of the elderly has been greatly improved in general. According to a survey on the living conditions of China’s urban and rural older persons (2018), their annual income in 2014 in urban areas was RMB 23,930.00, with an average income 3.24 times that in 2000, and in rural areas it was RMB 7621, with an average 4.62 times that in 2000 [58]. The income necessary to meet basic requirements has been protected. Furthermore, social health security for the elderly has greatly improved; basic medical insurance coverage reached 93% in 2015, compared with 36% in 2005 (calculated from CGSS 2005 and 2015). The social safety net, lacking of which was the indication of one important reason of China’s decreased happiness in Easterlin’s previous analysis, has been established [39]. Meanwhile, a relatively self-sufficient economy in rural areas means that elderly people are more able to rely on the land and produce a certain amount of food to meet their own basic needs, thus lessening their need to rely on income. The result that personal income indicates weak or no significance was consistent with the livability model of Veenhoven, which states that increased income above basic needs shows no significant relationship with well-being [70]. However, with the broader influence of Chinese traditional collective culture and the geography in rural areas, elderly people pay more attention to their social economic ranking in their reference group, with a positive and significant effect of relative income on well-being compared with the group with which they identify.
Third, the contribution of social capital to subjective well-being was more remarkable and stable than expected. However, in the typical “dual economy” system of urban and rural areas in China, there were significantly different findings. Similar results were also found in the studies of Han, Bartolini, Chen, and Pei. Social trust and social interaction were important factors in reducing loneliness, with greater social trust and social interaction correlated with better emotional ties between elders and society, and positive links with the social goal of being emotionally healthy [16,22,71,72]. The current study indicates that rural elders enjoyed higher levels of social trust and social interaction, and that these factors exhibited a more significantly positive effect in rural areas than urban areas, which was consistent with previous findings [27,72]. This reflects a more prevalent traditional culture in rural areas, where elderly people pay more attention to social relationships. Close relationships in a village and the convenience of contact also enable rural seniors to have better social capital. However, distrust showing significant negative links with the happiness of rural elderly revealed lower trust in strangers and strong defense against strangers in rural areas, which was in line with the annual report of social mentality of China in 2016 [73].
Finally, self-rated health had a strongly positive significant relationship with subjective well-being in all seniors. Future research should use this variable to deeply explore the association between health and happiness for Chinese elderly people. The demographic characteristics of age, sex, marital status, social security condition, number of children, and education were all demonstrated to be related to the subjective well-being of urban respondents, but only sex and education had a weakly significant relationship with rural respondents’ happiness. These results were due to individual characteristics, social norms, and government social security systems. Age showed a slight or medium positive significance with well-being for the urban sample, but almost no significant relationship with happiness in the rural sample, which may partly reflect higher income with age in urban areas and lower economic status with age in rural areas. Compared to no education, higher education contributed to greater happiness to different extents.
Phelan and Lucas assumed that the juxtaposition of status and stigma would lead to systematic stratification and impact well-being due to socioeconomic status grouping [74]. Low income, expanding income inequality, and poor self-rated health among elderly people are serious problems, and governments should take measures to reduce their impact in order to maintain social stability and sustainable development.

6. Conclusions

6.1. Research Conclusions

Based on nationwide data, this study provides an integrated analysis of how income, relative income, and social capital influence the subjective well-being of Chinese elderly people with regard to differences between rural and urban areas, in order to understand how regional differences impact the happiness of older residents. The results showed that the effect of absolute income on subjective well-being was weak or insignificant because of the hedonic treadmill effect that accompanies overall living standard improvements and the aggravation of income inequality.
Relative income, which is one’s personal or household economic status compared with that of peers or local families and reflects economic inequality, had a profound impact on elderly Chinese people’s subjective well-being, with higher relative income associated with greater levels of happiness both in urban and rural respondents, and lower relative income showing a strong influence in terms of moderating the bivariate association between income and subjective well-being in urban areas. This finding echoed Alderson’s indication that relative income with social comparison has a substantial effect on subjective well-being [75], and showed that people in urban areas were more money-oriented and engaged in social comparison, while rural respondents had less materialistic aspirations and more social identity pursuits. This study showed that one-third or more of respondents were of lower economic status; the Chinese government therefore needs to pay special attention to income inequality issues in both urban and rural areas and to increase the income levels of urban elderly people of lower economic status while improving social security for rural elderly people.
Social capital is a stable, strong influence that shapes the well-being of senior Chinese residents and, as Bartolini states, exerts more influence than income [16]. This finding could enrich policy suggestions and encourage the application of social capital theory to the study of happiness in elderly people. The Chinese government needs to come up with effective solutions to protect and enhance social capital in order to maintain and improve the well-being of older adults, especially in rural areas.
A meaningful difference was observed between urban and rural elderly populations in terms of economic and social factors. In this study, respondents in urban areas reported an average income 3.71 times higher than the average income of rural respondents, but the happiness gap between rural and urban elderly was not large. Large intra-group economic inequality contributed to decreased happiness of rural elderly people, while higher social capital mitigated that negative influence. Due to the process of urbanization, social capital in rural areas is declining. In addition to eliminating the happiness inequality of older adults by closing the gap between and within urban and rural income levels, China must work on protecting and nurturing social capital in rural areas.
Furthermore, self-rated health conditions and other demographic characteristics should receive more attention in regard to subjective well-being; for example, sex, marriage status, number of children, social security, and education level were also associated with subjective well-being, but had different effects in urban and rural samples, and demographics and culture should therefore be considered to further explain this regional diversity.

6.2. Deficiency and Prospects

It should be noted that there were some limitations to this study. This paper used cross-sectional data but did not explore the resulting trends. A longitudinal study design would be needed to understand causality and analyze the mechanisms of the effect of income and social context on the well-being of urban and rural seniors. In this study, we used variables composed of single questions, which may have reduced the effectiveness of the data collection; providing variables with multiple questions is necessary. Personal income from the last year as a self-reported income measure in the current study also limited the analysis results because the respondents’ real incomes may have been inflated or deflated. Household or objective income could be introduced in a future study. A negative influence of income inequality on the happiness of the elderly was observed, but we only used the variable of relative income compared to peers or local families, while other variables such as relative income comparing past and present income levels, different income categories, and the Gini coefficient also respond to economic inequality. As for the urban and rural differences, demographics and culture should be considered to further explaining the regional diversity.

Author Contributions

Conceptualization, J.Z. and C.L.; methodology and software, W.C. and Z.Z.; formal analysis, J.Z. and Z.Z.; writing—original draft preparation, J.Z. and C.L.; writing—review and editing, J.L., J.Z., and C.L.; supervision, J.L. and W.C.; funding acquisition, C.L. and J.Z. All authors have read and agreed to the published version of the manuscript.

Funding

This research was funded by the National Natural Science Foundation of China, grant number 71771075, the project Funds by Humanities, the Social Science Fund of Ministry of Education of China, 16YJA840017 and the Project of Key Research Institute of Humanities and Social Science in University of Anhui Province.

Acknowledgments

We would like to thank our anonymous reviewers for their valuable comments. The authors appreciate the support from the China General Social Survey (CGSS) by providing the data.

Conflicts of Interest

The authors declare no conflict of interest.

Appendix A

Table A1. Description of subjective well-being.
VariableDescriptionTotal Sample Subjective Well-BeingUrban Sample Subjective Well-BeingRural Sample Subjective Well-Being
Obs (%)Mean (SD)Obs (%)Mean (SD)Obs (%)Mean (SD)
Personal income Lower than average = 11892 (55)3.84 (0.881)679 (36)3.85 (0.834)1341 (87)3.84 (0.904)
High average = 21536 (45)4.03 (0.746)1213 (64)4.02 (0.746)195 (13)4.08 (0.746)
Relative personal incomeLower than average = 11202 (33)3.56 (0.978)584 (30)3.63 (0.934)618 (38)3.50 (1.016)
Average = 22119 (60)4.08 (0.692)1202 (62)4.07 (0.672)917 (57)4.08 (0.719)
Higher than average = 3239 (7)4.30 (0.636)151 (8)4.29 (0.617)88 (5)4.32 (0.670)
Relative household incomeFar below average = 1240 (7)3.08 (1.434)85 (4)3.00 (1.697)1272 (46)3.11 (1.272)
Below average = 21199 (34)3.70 (0.857)614 (32)3.74 (0.844)585 (21)3.65 (0.869)
Average = 31840 (50)4.09 (0.773)1039 (54)4.06 (0.841)801 (29)4.12 (0.675)
Above average = 4277 (8)4.32 (0.65)193 (10)4.3 (0.613)84 (3)4.39 (0.728)
Far above average = 511 (1)4.36 (0.924)7 (0)4.14 (0.069)4 (1)4.75 (0.500)
General social trustStrongly disagree = 164 (2)3.53 (1.333)42 (2)3.40 (1.38)22 (1)3.77 (1.232)
Quite disagree = 2463 (13)3.69 (0.893)279 (14)3.80 (0.796)184 (11)3.53 (1.002)
Uncertain = 3557 (15)3.71 (0.863)338 (17)3.78 (0.812)219 (14)3.61 (0.929)
Quite agree = 42137 (60)3.96 (0.763)1136 (59)4.01 (0.706)1001 (62)3.90 (0.820)
Strongly agree = 5347 (10)4.37 (0.827)152 (8)4.37 (0.844)195 (12)4.36 (0.815)
Distrust Strongly disagree = 1167 (5)4.32 (0.957)81 (4)4.32 (0.906)86 (5)4.31 (1.009)
Quite disagree = 21267 (36)3.99 (0.811)672 (35)4.00 (0.78)595 (37)3.98 (0.845)
Uncertain = 3867 (24)3.84 (0.896)474 (24)3.91 (0.929)393 (24)3.76 (0.847)
Quite agree = 41133 (32)3.84 (0.884)636 (33)3.9 (0.869)497 (31)3.75 (0.897)
Strongly agree = 5130 (4)3.75 (1.15)81 (4)3.67 (1.173)49 (3)3.88 (1.111)
Neighbor trustDistrust a great majority = 136 (1)3.56 (1.34)23 (1)3.87 (1.1)13 (1)3.00 (1.581)
Distrust most = 2200 (6)3.85 (0.971)133 (7)3.88 (0.954)67 (4)3.70 (1.008)
Trust half = 3563 (16)3.82 (0.988)365 (19)3.84 (1.008)198 (12)3.79 (0.952)
Trust most = 41796 (51)3.88 (0.855)1005 (52)3.92 (0.845)791 (49)3.82 (0.865)
Trust a great majority = 5948 (27)4.05 (0.901)397 (21)4.09 (0.978)551 (34)4.01 (0.841)
Relative trustDo not trust a great majority = 118 (1)2.67 (3.125)10 (1)2 (3.916)8 (0)3.5 (1.604)
Do not trust most = 291 (3)3.59 (1.075)56 (3)3.77 (1.009)35 (2)3.31 (1.132)
Trust half = 3396 (11)3.82 (0.859)234 (12)3.88 (0.782)162 (10)3.72 (0.954)
Trust most = 41514 (43)3.82 (0.874)847 (44)3.87 (0.862)667 (41)3.77 (0.888)
Trust a great majority = 51530 (43)4.05 (0.853)785 (41)4.08 (0.87)745 (46)4.03 (0.835)
General social interactionNever = 1478 (13)3.88 (0.93)315 (16)3.91 (0.871)163 (10)3.83 (1.034)
Rarely = 21136 (32)3.86 (0.84)660 (34)3.92 (0.779)476 (29)3.77 (0.913)
Sometimes = 3958 (27)3.85 (0.815)536 (28)3.93 (0.761)422 (26)3.76 (0.869)
Often = 4823 (23)4.04 (0.785)375 (19)4.06 (0.756)448 (27)4.02 (0.809)
Very often = 5191 (5)4.2 (0.809)68 (3)4.21 (0.783)123 (8)4.2 (0.826)
Familiarity with neighbors Very unfamiliar = 163 (2)3.73 (1.125)46 (2)3.76 (1.058)17 (1)3.65 (1.32)
Relatively unfamiliar = 2294 (8)3.85 (1.123)253 (13)3.85 (1.161)41 (3)3.83 (0.863)
Average = 3729 (20)3.85 (0.902)568 (29)3.89 (0.88)161 (10)3.71 (0.965)
Relatively familiar = 41267 (35)3.84 (0.815)712 (36)3.95 (0.756)555 (34)3.71 (0.868)
Very familiar = 51232 (34)4.03 (0.914)376 (19)4.07 (1.024)856 (53)4.02 (0.861)
SexMale = 11707 (48)3.92 (0.797)907 (46)3.97 (0.729)800 (49)3.85 (0.865)
Female = 21880 (52)3.92 (0.873)1048 (54)3.94 (0.836)832 (51)3.89 (0.917)
Age60–69 = 12043 (57)3.9 (0.822)1073 (55)3.94 (0.762)970 (59)3.86 (0.881)
70–79 = 21077 (30)3.93 (0.853)585 (30)3.95 (0.826)492 (30)3.92 (0.884)
80+467 (13)3.96 (0.871)297 (15)4.03 (0.8)170 (11)3.84 (0.971)
EducationUneducated1007 (28)3.81 (0.905)357 (18)3.82 (0.851)650 (40)3.80 (0.934)
Elementary1220 (34)3.94 (0.835)527 (27)3.98 (0.783)693 (43)3.91 (0.871)
Middle school754 (21)3.95 (0.810)528 (27)3.94 (0.804)226 (14)3.96 (0.826)
High school or above594 (17)4.04 (0.727)537 (28)4.04 (0.715)57 (3)4.05 (0.833)
Number of children064 (2)3.27 (1.116)29 (1)3.14 (1.125)35 (2)3.37 (1.114)
1825 (23)3.89 (0.808)639 (33)3.92 (0.772)186 (11)3.78 (0.912)
2~31813 (51)3.94 (0.81)917 (47)4 (0.739)896 (55)3.87 (0.872)
≥4874 (24)3.95 (0.881)360 (19)3.98 (0.87)514 (32)3.94 (0.89)
Basic medical insuranceYes = 13331 (93)3.93 (0.825)1816 (93)3.98 (0.766)1515 (93)3.88 (0.787)
No = 2244 (7)3.73 (0.953)134 (7)3.63 (0.986)110 (7)3.85 (0.9)
Basic pension insuranceYes = 12848 (80)3.94 (0.84)1596 (83)3.98 (0.872)1252 (77)3.89 (0.872)
No = 2708 (20)3.78 (1.124)338 (17)3.72 (1.289)370 (23)3.83 (0.946)
Marital statusMarried2657 (74)3.94 (0.839)1455 (74)3.99 (0.811)1202 (74)3.88 (0.867)
Widowed88 (2)3.49 (1.017)42 (2)3.43 (1.039)46 (3)3.54 (1.005)
Other845 (24)3.84 (1.067)461 (24)3.82 (1.16)384 (24)3.88 (0.945)
Self-rated healthVery poor = 1202 (5)3.46 (1.222)79 (4)3.49 (1.036)123 (7)3.43 (1.331)
Relatively poor = 2884 (25)3.65 (0.933)408 (21)3.67 (0.928)476 (29)3.63 (0.937)
Average = 3993 (28)3.91 (0.76)619 (31)3.93 (0.746)374 (23)3.87 (0.782)
Good = 41175 (33)4.1 (0.659)660 (34)4.12 (0.619)515 (32)4.07 (0.706)
Excellent = 5331 (9)4.32 (0.705)187 (10)4.31 (0.688)144 (9)4.33 (0.729)
Obs = observer.

References

  1. Li, S. Four Decades of China’s Income Distribution Reform. China Econ. 2018, 13, 2–33. [Google Scholar]
  2. Li, S. New changes in Chinese income distribution pattern. Gov. Stud. 2018, 5, 35–42. [Google Scholar]
  3. National Bureau of Statistics. Available online: http://www.stats.gov.cn/tjsj/zxfb/201902/t20190228_1651265.html (accessed on 27 March 2020).
  4. Qu, Z.W.; Chen, J.J.; Li, L. Future trends of China’s population and aging: 2015–2100. Popul. Res. 2017, 4, 60–71. [Google Scholar]
  5. Kong, F. Aging Trend of the world. In The Structure of Healthy Life Determinants, International Perspectives on Aging; Hoshi, T., Kodama, S., Eds.; Springer: Singapore, 2018; pp. 7–21. [Google Scholar]
  6. Diener, E. Subjective well-being. Psychol. Bull. 1984, 95, 542–575. [Google Scholar] [CrossRef] [PubMed]
  7. Headey, B.; Veenhoven, R.; Wearing, A. Top-down versus bottom-up theories of subjective well-being. Soc. Indic. Res. 1991, 24, 81–100. [Google Scholar] [CrossRef] [Green Version]
  8. Diener, E.; Fujita, F. Resources, personal strivings, and subjective well-being: A nomothetic and idiographic approach. J. Personal. Soc. Psychol. 1995, 68, 926–935. [Google Scholar] [CrossRef]
  9. Cummins, R.A. Personal income and subjective well-being: A review. J. Happiness Stud. 2000, 1, 133–158. [Google Scholar] [CrossRef]
  10. Steptoe, A.; Deaton, A.; Stone, A.A. Subjective wellbeing, health, and ageing. Lancet 2014, 385, 9968. [Google Scholar] [CrossRef] [Green Version]
  11. Zhang, T.H.; Hu, J.; Zhang, X. Disparities in subjective well-being: Political status, urban rural divide and cohort dynamics in China. Chin. Sociol. Rev. 2020, 52, 56–83. [Google Scholar] [CrossRef]
  12. Xi, J. Report of the 19th National Congress of the Communist Party of China (CPC)-100 Questions of Study Guidance; Party Construction Reading Press, Study Press: Beijing, China, 2017. [Google Scholar]
  13. Luo, C.L.; Li, S. Comparisons on the Income Measurements in Chinese Household Survey Data. Manag. World 2019, 1, 24–36. [Google Scholar]
  14. Easterlin, R.A.; Morgan, R.; Switek, M.; Wang, F. China’s life satisfaction, 1990–2010. Proc. Natl. Acad. Sci. USA 2012, 109, 9775–9780. [Google Scholar] [CrossRef] [PubMed] [Green Version]
  15. Luo, C.L. Income growth and happiness growth. Rev. Ind. Econ. 2017, 2, 5–22. [Google Scholar]
  16. Bartolini, S.; Sarracino, F. The dark side of Chinese growth: Declining social capital and well-being in times of economic boom. World Dev. 2015, 74, 333–351. [Google Scholar] [CrossRef]
  17. Li, J.S.; Ma, W.J. Prevalence and influencing factors of depression symptom among middle-aged and elderly people in China. China J. Public Health 2017, 33, 177–181. [Google Scholar]
  18. Diener, E.; Oishi, S. Money and happiness: Income and subjective well-being across nations. In Culture and Subject Well-Being; Diener, E., Eunkook, M.S., Eds.; The MIT Press: Cambridge, MA, USA, 2000; pp. 185–218. [Google Scholar]
  19. Easterlin, R.A.; McVey, L.A.; Switek, M.; Sawangfa, O.; Zweig, J.S. The happiness-income paradox revisited. Proc. Natl. Acad. Sci. USA 2010, 107, 22463–22468. [Google Scholar] [CrossRef] [Green Version]
  20. Helliwell, J.F.; Putnam, R.D. The social context of well–being. Philos. Trans. R. Soc. B Biol. Sci. 2004, 349, 1435–1446. [Google Scholar] [CrossRef]
  21. Sarracino, F. Social capital and subjective well-being trends: Comparing 11 western European countries. J. Socio Econ. 2010, 39, 482–517. [Google Scholar] [CrossRef] [Green Version]
  22. Han, C. Explaining the subjective well-being of urban and rural Chinese: Income, personal concerns, and societal evaluations. Soc. Sci. Res. 2015, 49, 179–190. [Google Scholar] [CrossRef] [PubMed]
  23. Knight, J.; Gunatilaka, R. The Rural-Urban Divide in China: Income but Not Happiness? J. Dev. Stud. 2010, 46, 506–534. [Google Scholar] [CrossRef]
  24. Knight, J.; Gunatilaka, R. Does Economic Growth Raise Happiness in China? Oxf. Dev. Stud. 2011, 39, 1–24. [Google Scholar] [CrossRef]
  25. Knight, J.; Gunatilaka, R. Is Happiness Infectious? Scott. J. Political Econ. 2017, 64, 1–24. [Google Scholar] [CrossRef] [Green Version]
  26. Diener, E.; Fujita, F. Social comparisons and subjective well-being. In Health, Coping, and Well-Being: Perspectives from Social Comparison Theory; Buunk, B.P., Gibbons, F.X., Eds.; Lawrence Erlbaum Associates Publishers: Mahwah, NJ, USA, 1997; pp. 329–357. [Google Scholar]
  27. Knight, J.; Gunatilaka, R. Income, aspirations and the Hedonic Treadmill in a poor society. J. Econ. Behav. Organ. 2012, 82, 67–81. [Google Scholar] [CrossRef] [Green Version]
  28. Cheung, F.; Lucas, R.E. Relative income is associated with stronger social comparison effects: The effect of relative income on life satisfaction. J. Personal. Soc. Psychol. 2016, 110, 332–341. [Google Scholar] [CrossRef] [PubMed] [Green Version]
  29. Ng, W.; Diener, E. Affluence and Subjective Well-Being: Does Relative income Moderate their Associations? Appl. Res. Qual. Life 2019, 14, 155–170. [Google Scholar] [CrossRef]
  30. Hu, H.S.; Lu, Y.P. Income inequality, health and subjective well-being among the elderly: Empirical evidence on the aging of China. China Soft Sci. 2012, 11, 46–61. [Google Scholar]
  31. Bai, Z.; Qi, S. Income threshold, relative deprivation and happiness of the aged. Financ. Trade Econ. 2017, 38, 20–33. [Google Scholar]
  32. Bakkeli, N.Z. Older adults’ mental health in china: Examining the relationship between income inequality and subjective wellbeing using panel data analysis. J. Happiness Stud. 2018, 16, 75–95. [Google Scholar] [CrossRef]
  33. Ai, H.S.; Yuan, Y.M.; He, X.Q. Relationship between socioeconomic status and sense of happiness. J. Shandong Univ. Financ. Econ. 2015, 12, 47–52. [Google Scholar]
  34. Qiao, M.M.; Wang, J.; Zhou, R.H. Social contact and happiness in older adults: Based on CGSS 2015. Reform Open 2018, 491, 102–105. [Google Scholar]
  35. Ye, B.; Gao, J.L.; Fu, H. Influence of social capital to physical and mental health of elderly. Med. Soc. 2018, 31, 21–23. [Google Scholar]
  36. Lou, J.Y.; Zhang, X.S.; Zheng, Q.C. Social capital, health status and subjective well-being of the elderly—Based on the data of CGSS 2010 and CGSS 2015. J. Fujian Agric. Univ. (Philos. Soc. Sci.) 2019, 22, 69–78. [Google Scholar]
  37. Deng, M. Exploration of The Source of Elderly People’s Subjective Well Being from The Perspective of Social Relations: Based on CGSS2015. Popul. Dev. 2018, 25, 85–93. [Google Scholar]
  38. Easterlin, R.A. Does Economic Growth Improve the Human Lot? Some Empirical Evidence. In Nations and Households in Economic Growth; Elsevier: Amsterdam, The Netherlands, 1974; pp. 89–125. [Google Scholar] [CrossRef]
  39. Easterlin, R.A. Income and happiness: Towards a unified theory. Econ. J. 2001, 111, 465–484. [Google Scholar] [CrossRef]
  40. Diener, E.; Lucas, R.E. Explaining Differences in Societal Levels of Happiness: Relative Standards, Need Fulfillment, Culture, and Evaluation Theory. J. Happiness Stud. 2000, 1, 41–78. [Google Scholar] [CrossRef]
  41. Luo, C.L. Absolute Income, Relative Income and Subjective well-being: Empirical Test Based on the Sample Data of Urban and Rural Households in China. J. Financ. Econ. 2009, 35, 79–91. [Google Scholar]
  42. Festinger, L. A theory of social comparison processes. Hum. Relat. 1954, 7, 117–140. [Google Scholar] [CrossRef]
  43. Clark, A.E.; Senik, C. Who compares to whom? The anatomy of income comparisons in Europe. Econ. J. 2010, 120, 573–594. [Google Scholar] [CrossRef] [Green Version]
  44. Layard, R.; Mayraz, G.; Nickell, S. “Does Relative Income Matter? Are the Critics Right?”. In International Differences in Well-Being; Diener, E., Helliwell, J.F., Kahneman, D., Eds.; Oxford University Press: New York, NY, USA, 2010; pp. 139–165. [Google Scholar]
  45. Luttmer, E.F.P. Neighbors as negatives: Relative earnings and well-being. Q. J. Econ. 2005, 120, 963–1001. [Google Scholar]
  46. Deaton, A.; Stone, A.A. Two happiness puzzles. Am. Econ. Rev. 2013, 103, 591–597. [Google Scholar] [CrossRef] [PubMed] [Green Version]
  47. Gao, Y. Social economic status of Elderly and Subjective well-being—an Empirical Analysis Based on CGSS (2013). Decis. Inf. 2017, 459, 107–115. [Google Scholar]
  48. Putnam, R.D. Bowling Alone. The Collapse and Revival of American Community; Simon & Schuster: New York, NY, USA, 2000. [Google Scholar]
  49. Bartolini, S.; Bilancini, E.; Pugno, M. Did the decline in social connections depress the Americans’ happiness? Soc. Indic. Res. 2013, 110, 1033–1059. [Google Scholar] [CrossRef]
  50. Helliwell, J.F.; Shun, W. Trust and Wellbeing; Social Science Electronic Publishing: Busan, Korea, 2011. [Google Scholar]
  51. Carstensen, L.L.; Isaacowitz, D.; Charles, S.T. Taking time seriously: A theory of socioemotional selectivity. Am. Psychol. 1999, 54, 165–181. [Google Scholar] [CrossRef] [PubMed]
  52. Robert, L.; Kahn, T.C. Antonucci. Convoys Over the Life Course Attachment Roles and Social Support, Life-Span Development and Behavior; Baltes, P.B., Brim, O.G., Eds.; Academic Press: New York, NY, USA, 1980; pp. 253–267. [Google Scholar]
  53. Mair, C.A.; Thivierge-Rikard, R.V. The Strength of Strong Ties for Older Rural Adults: Regional Distinctions in the Relationship between Social Interaction and Subjective Well-Being. Int. J. Aging Hum. Dev. 2010, 70, 119–143. [Google Scholar] [CrossRef] [PubMed]
  54. Toyoshima, A.; Sato, S. Examination of the Effect of Preference for Solitude on Subjective Well-Being and Developmental Change. J. Adult Dev. 2019, 26, 139–148. [Google Scholar] [CrossRef]
  55. Zhu, J.H.; Liang, C.H.; Lu, W.X. Social Support on Subjective Well-being in Urban Community Dwelling Elderly People. East China Econ. Manag. 2018, 259, 166–175. [Google Scholar]
  56. Dowd, J.J. Aging as exchange: A preface to theory. J. Gerontol. 1975, 30, 584–594. [Google Scholar] [CrossRef] [PubMed]
  57. National Bureau of Statistics. Available online: http://www.stats.gov.cn/tjsj/ndsj/2019/indexch.htm/ (accessed on 16 March 2020).
  58. Zhang, J. The Hukou System and Rural-Urban Migration in China. Can. Divers. 2011, 160, 818–855. [Google Scholar]
  59. Liu, X. Analysis of the formation on China’s urban-rural dual economic and social structure. J. Agric. Econ. 2009, 01, 5–7. [Google Scholar]
  60. Dang, J. Survey Report on the Living Conditions of China’s Urban and Rural Older Persons; Social Science Academic Press: Beijing, China, 2018; pp. 21–96. [Google Scholar]
  61. Ngamaba, K.H.; Panagioti, M.; Armitage, C.J. Income inequality and subjective well-being: A systematic review and meta-analysis. Qual. Life Res. 2018, 27, 577–596. [Google Scholar] [CrossRef] [PubMed] [Green Version]
  62. Wolbring, T.; Keuschnigg, M.; Negele, E. Needs, comparisons, and adaptation: The importance of relative income for life satisfaction. Eur. Sociol. Rev. 2011, 29, 86–104. [Google Scholar] [CrossRef]
  63. Clark, A.E.; Kristensen, N.; Westergard-Nielsen, N. Economic satisfaction and income rank in small neighborhoods. J. Eur. Econ. Assoc. 2009, 7, 519–527. [Google Scholar] [CrossRef] [Green Version]
  64. Zhang, W.; Hu, Z.M.; Li, H.J. The Affective Factors Analysis of the Subjective Well-being of the Chinese Elderly. J. Popul. Dev. 2014, 20, 71–75. [Google Scholar]
  65. Ferrer-i-Carbonell, A.; Frijters, P. How important is methodology for the estimates of the determinants of happiness? Econ. J. 2004, 114, 641–659. [Google Scholar] [CrossRef] [Green Version]
  66. Fang, J.; Wen, Z.L.; Liang, D.M.; Li, L.L. Moderation effect analysis based multiple linear regression. J. Psychol. Sci. 2015, 38, 715–720. [Google Scholar]
  67. O’brien, R.M. A Caution Regarding Rules of Thumb for Variance Inflation Factors. Qual. Quant. 2007, 41, 673–690. [Google Scholar] [CrossRef]
  68. Wang, P.; Pan, J.; Luo, Z. The impact of income inequality on individual happiness: Evidence from china. Soc. Indic. Res. 2015, 121, 413–435. [Google Scholar] [CrossRef]
  69. Chuanbo, C. The minimum livelihood requirements and subsistence security allowances of Urban and Rural resident. Issues Agric. Econ. 2011, 8, 38–44. [Google Scholar]
  70. Veenhoven, R.; Ehrhardt, J. The cross-national pattern of happiness: Test of predictions implied in three theories of happiness. Soc. Indic. Res. 1995, 34, 33–68. [Google Scholar] [CrossRef] [Green Version]
  71. Chen, Z.H.; Yang, H.P.; Feng, Y.J. Social capital, family income and happiness for the urban residents, A research based on Chinese large sample micro data. Sci. Decis. Mak. 2016, 12, 24–44. [Google Scholar]
  72. Pei, Z.J. Village social capital: Definition, dimension and measurement-based on an empirical study of 37 villages in western Zhejiang. Rural Econ. 2010, 7, 92–96. [Google Scholar]
  73. Wang, J.X.; Chen, M.Q. Annual Report on Social Mentality of China; Social Sciences Academic Press: Beijing, China, 2016; Volume 12, p. 125. [Google Scholar]
  74. Phelan, J.C.; Lucas, J.W.; Ridgeway, C.L.; Taylor, C.J. Stigma, status, and population health. Soc. Sci. Med. 2014, 103, 15–23. [Google Scholar] [CrossRef] [PubMed] [Green Version]
  75. Alderson, A.S.; Tally, K.G. Compared to whom? Inequality, social comparison, and happiness in the United States. Soc. Forces 2016, 95, 25–53. [Google Scholar] [CrossRef]
Figure 1. Moderating effects of relative personal income: (a) urban sample; (b) rural sample.
Sustainability 12 04786 g001
Figure 2. Moderating effects of relative household income: (a) urban sample; (b) rural sample.
Sustainability 12 04786 g002
Table 1. Gini coefficients of 2011, 2012, 2013, 2015 in China.
YearGini Coefficients
Total SampleUrban SampleRural Sample
20110.5740.6000.540
20120.5720.5570.595
20130.4700.4680.474
20150.5910.5400.666
Mean0.5520.5410.568
SD0.0550.0550.082
Table 2. Descriptive statistics.
VariablesObserverRangeTotal SampleUrban SampleRural Sample
Mean (SD)Mean (SD)Mean (SD)
Dependent variable
Subjective well-being35901–53.92 (0.892)3.96 (0.788)3.87 (0.891)
Independent variable 19,336.5228,737.887739.84
Personal income34311–960,000(38,448.80)(42,700.97)(28,456.58)
Relative personal income35631–31.73 (0.576)1.78 (0.574)1.67 (0.573)
Relative household income35671–52.27 (0.576)2.22 (0.574)2.33 (0.573)
General social trust35701–52.61 (0.739)2.70 (0.518)2.51 (0.747)
Distrust35641–53.63 (0.892)3.55 (0.820)3.72 (0.867)
Neighbor trust31071–52.94 (1.002)2.98 (1.006)2.89 (0.998)
Relative trust30771–53.97 (0.862)3.84 (0.756)4.11 (0.830)
General social interaction35891–52.75 (1.110)2.60 (1.156)2.93 (1.124)
Friends interaction30771–53.86 (1.989)3.92 (3.6383.80 (2.076)
Familiarity with neighbors35851–53.92 (1.014)3.84 (0.756)4.34 (0.837)
Control variable
Sex35901–21.52 (0.499)1.54 (0.499)1.51 (0.500)
Age359060–9569.56 (7.55)70.04 (7.84)68.98 (7.15)
Marital status35901–31.50 (0.849)1.49 (0.849)1.50 (0.849)
Number of children35791–102.62 (1.48)2.30 (1.36)3.00 (1.53)
Basic medical insurance35561–21.07 (0.252)1.07 (0.253)1.07 (0.251)
Basic pension insurance35561–21.20 (0.399)1.17 (0.380)1.23 (0.420)
Education35781–52.32 (1.16)2.74 (1.23)1.81 (0.82)
Self-rated health35881–53.63 (0.89)3.55 (0.906)3.72 (0.867)
Table 3. Regression of subjective well-being for the urban sample.
VariablesModel 1Model 2Model 3Model 4Model 5
ß(SE)ß(SE)ß(SE)ß(SE)ß(SE)
Intercept3.451 ***2.793 ***2.678 ***3.039 ***1.809 ***
(0.137)(0.173)(0.209)(0.218)(0.267)
Personal income0.016 *0.0090.013 +0.0110.006
(0.006)(0.007)(0.007)(0.008)(0.008)
Relative personal income 0.161 *** 0.162 ***
(0.043) (0.047)
Relative household income 0.203 *** 0.143 **
(0.035) (0.038)
General social trust 0.140 *** 0.143 ***
(0.023) (0.025)
Distrust −0.012 0.005
(0.016) (0.017)
Neighbor trust −0.026 −0.065 *
(0.026) (0.030)
Relative trust 0.170 *** 0.140 ***
(0.028) (0.031)
Social interaction 0.0220.000
(0.027)(0.027)
Friend interaction −0.0020.001
(0.012)(0.012)
Familiarity with neighbors 0.064 **0.049 *
(0.023)(0.024)
Female0.100 *0.073 +0.098 *0.125 **0.112 *
(0.037)(0.043)(0.042)(0.046)(0.045)
Age0.064 *0.020.08 **0.113 ***0.065 +
(0.027)(0.032)(0.031)(0.034)(0.034)
Widowed−0.220 ***−0.147 **−0.203 ***−0.219 ***−0.166 **
(0.045)(0.053)(0.050)(0.055)(0.055)
Other: divorced and separated−0.313 *−0.257 +−0.203 ***−0.335 *−0.239
(0.122)(0.144)(0.142)0.156)(0.155)
Number of children
0−0.643 ***−0.518 **−0.640 ***−0.806 ***−0.710 ***
(0.047)(0.055)(0.053)(0.059)(0.058)
1−0.179 ***−0.172 **−0.107 *−0.066−0.069
(0.047)(0.055)(0.053)(0.059)(0.058)
2–3−0.085−0.076−0.045−0.041−0.045
(0.045)(0.053)(0.051)(0.055)(0.055)
Basic medical insurance−0.170 *−0.099−0.141 +−0.167 +−0.071
(0.073)(0.086)(0.085)(0.095)(0.094)
Basic pension insurance−0.151 **−0.126 *−0.166 **−0.149 *−0.127 *
(0.051)(0.060)(0.058)(0.064)(0.064)
Elementary school0.378 **0.284 +0.366 *0.323 +0.301 +
(0.130)(0.155)(0.147)(0.173)(0.178)
Middle school0.118 *0.080.0870.159 *0.094
(0.050)(0.059)(0.070)(0.063)(0.062)
High school or above0.152 *0.0470.0870.188 **0.052
(0.058)(0.069)(0.066)(0.072)(0.072)
Self-rated health0.182 ***0.148 ***0.156 ***0.181 ***0.133 ***
(0.017)(0.019)(0.018)(0.022)(0.022)
R20.0910.1360.120.1020.167
+p < 0.1; * p < 0.05; ** p < 0.01; *** p < 0.001.
Table 4. Regression of subjective well-being for the rural sample.
VariablesModel 1Model 2Model 3Model 4Model 5
ß(SE)ß(SE)ß(SE)ß(SE)ß(SE)
Intercept3.008 ***2.130 ***2.166 ***2.388 ***0.944 ***
(0.153)(0.156)(0.218)(0.201)(0.246)
Personal income0.011 +0.0050.0050.013 **0.002
(0.006)(0.006)(0.006)(0.007)(0.006)
Relative personal income 0.212 *** 0.208 ***
(0.043) (0.044)
Relative household income 0.314 *** 0.280 ***
(0.034) (0.035)
General social trust 0.177 *** 0.175 ***
(0.026) (0.026)
Distrust −0.062 *** −0.045 **
(0.017) (0.018)
Neighbor trust −0.003 −0.037
(0.031) (0.030)
Relative trust 0.104 ** 0.087 **
(0.033) (0.032)
Social interaction 0.085 ***0.053 *
(0.025)(0.023)
Friend interaction −0.0120.000
(0.011)(0.011)
Familiarity with neighbors 0.078 ***0.082 **
(0.024)(0.026)
Female0.144 **0.135 **0.151 **0.162 **0.152 ***
(0.049)(0.046)(0.048)(0.051)(0.047)
Age0.0230.003−0.0120.068 +0.016
(0.037)(0.034)(0.036)(0.038)(0.036)
Widowed−0.018−0.0080.003−0.085−0.053
(0.055(0.052)(0.054)(0.057)(0.053)
Other: divorced and separated0.025−0.087−0.001−0.061−0.176
(0.172)(0.162)(0.173)(0.178)(0.170)
Number of children
0−0.500 **−0.192−0.457 *−0.411 *−0.098
(0.192)(0.181)(0.193)(0.201)(0.193)
1−0.185 **−0.139 **−0.137 *−0.206 **−0.106
(0.071)(0.067)(0.070)(0.070)(0.067)
2–3−0.051−0.044−0.051−0.033−0.026
(0.052)(0.049)(0.051)(0.049)(0.049)
Basic medical insurance0.0570.0980.070.0630.087
(0.016)(0.085)(0.088)(0.093)(0.087)
Basic pension insurance−0.052−0.032−0.020−0.0400.003
(0.025)(0.050)(0.052)(0.054)(0.051)
Elementary school0.1660.1770.1880.0860.181
(0.143)(0.134)(0.133)(0.151)(0.139)
Middle school0.093 +0.0470.096 *0.120 *0.08 +
(0.050)(0.047)(0.054)(0.051)(0.048)
High school or above0.1440.0270.1750.250 *0.166
(0.123)(0.115)(0.121)(0.126)(0.116)
Self-rated health0.222 ***0.143 ***0.205 ***0.202 ***0.123 ***
(0.020)(0.019)(0.020)(0.021)(0.020)
R20.0990.2120.1550.1310.274
+p< 0.1; * p < 0.05; ** p < 0.01; *** p < 0.001.

