1. Introduction
This section presents a literature background on the concepts of energy security and energy transition. Then, the current situation of the Jordanian energy system is addressed. Furthermore, an analysis of energy security of the current system is provided. The last part of this section states the aim of this research and the gap it tries to cover.
1.1. Concepts of Energy Security and Energy Transition
Energy security is a universal concern [
1]. Many studies attempt to discuss the topic [
2,
3,
4] from the view of scientific fields [
5], international affairs [
6] and national security [
7]. The ability of energy security to shape policies and national behaviour [
8] makes energy security important. When policies and regulations are prepared, energy security has to be addressed because of its priority [
9]. Energy security is a central aim for energy policy [
10] because it allows for energy consumers’ needs to be covered [
11].
Although the concept of energy security is ‘as old as fire’ [
12] and the discussion about energy security has a long history, scientific analysis following current research principles and standards are rare before 1975 [
13]. In addition, although Ang et al. [
1] stated that publications on energy security were rare before 2001, the topic has emerged as one of great importance [
14] in the 21st century. The emergence is because energy is the engine for economic growth [
3,
15] with close links to economy [
16,
17] and a driver for civilization [
18] and society [
19]. In general, energy affects every aspect of life [
20] and is thus crucial to the survival of a functioning modern society [
3,
21]. Therefore, enhancing energy security is a key goal of society [
2,
22,
23,
24,
25,
26,
27]. Personal and national energy security are paths to freedom of choice, and thereafter, self-actualization as in Maslow’s hierarchy of needs [
28].
There were many attempts to identify energy security throughout history [
29,
30,
31,
32,
33]. Azzuni and Breyer [
34] derived a comprehensive definition of energy security as “the feature (measure, situation, or a status) in which a related system functions optimally and sustainably in all its dimensions, freely from any threats”. This is linked to the 15 dimensions of energy security.
The definition and dimensions according to Azzuni and Breyer [
34] are applied to the specifics of this research as follows:
energy security is the status in which the Jordanian energy system functions sustainably in the addressed dimensions freely from any risks. Six dimensions were selected for investigation: availability, diversity, cost, environment, health, and employment.
1.2. Current Jordanian Energy System
Although Jordan is in the heart of the Middle East [
35,
36], it has managed to stay stable throughout the political unrest across the whole region. This may be attributed to the absence of fossil oil and gas resources, as it is considered a blessing to have no fossil fuels from a security perspective, since neighbouring countries with fossil fuels have been subject to the energy curse [
37,
38,
39]. However, the absence of fossil fuels is linked to a high economic cost and financial burden on the Jordanian national budget [
35,
40], as Jordan has imported almost 96% of its energy needs [
41]. Jordan has to pay around 20% of its gross domestic product (GDP) for energy imports [
42].
Jordan has access to substantial renewable energy (RE) resources, which are mainly solar energy and wind energy in certain areas [
35,
40,
43,
44,
45], that are still to be utilised, e.g., annual direct normal irradiation ranges between 1600–2300 kWh/(m
2·a), global horizontal irradiation [
46] and wind speeds of 6–8 m/s [
35,
47]. The current hydropower electricity generation accounts for only around 60 GWh [
48], but with a future potential of 400–800 MW hydropower capacity [
49] that could generate up to 200 GWh every year [
50]. By 2012, biomass made up just 10 MW of capacity with less potential for future development [
48]. There are proven reserves of shale oil of about 81,400 TWh
th (70 billion tons) [
35,
51,
52]. The current situation for the Jordanian energy system is summarised in
Table 1.
The Jordanian government approved the following projects [
54,
55] in 2018 and 2019:
Start the direct incineration of oil shale for power generation, with an expected electricity generation capacity of 470 MW in 2020;
Total RE capacity of 1800 MW in 2018;
Reduce taxes on fossil gas for industries from 16% to 7% to promote industrial competitiveness;
Agreement with Iraqi government to construct an oil pipeline though Jordanian territories to export oil through Aqaba seaport;
Reception of 10 direct proposals for electricity storage projects with a capacity of 30 MW;
Installation of 300 solar PV systems, 8000 solar thermal water heaters and 329 PV systems on mosques.
The Jordanian government aims to have a more diverse and reliable energy system and to increase the share of RE to 15% by 2050 [
53], whereas recent research projects pathways for the Middle East leans towards 100% RE by 2050 [
56].
1.3. Energy Security Analysis of the Current Situation
An energy security analysis linked to the energy transition enables to identify the best policies for the country and the consequences of these policies. Energy security enhancement is highly needed in the Jordanian context. For the politics in Jordan, enhancing energy security requires a stronger financial system and more stable governments. Energy security policies are seen to be interconnected with policies related to economic growth and stability, reducing poverty, the raising of living standards, political stability and the provision of public services [
57].
Energy security analysis can be done qualitatively by addressing various aspects and dimensions of energy security. Alternatively, energy security can be assessed quantitatively by an indicators-based approach as proposed in the literature [
58,
59,
60,
61]. There is less research about energy security measurement in Jordan with clear methods of how energy security is evaluated well.
Existing research on energy security in Jordan needs to be further developed to overcome gaps, such as the absence of an energy security analysis that covers all the aspects and dimensions of the issue. Moreover, there is a gap in the measurable quantitative analysis of energy security. As the focus of energy security tends to be linked to geopolitics, fossil-based energy systems or renewables, Jordan is no exception with the literature presented by Alshwawra et al. [
62]. They analysed energy security changes with historical events, but as it was mentioned earlier, their approach was limited to geopolitics in the realm of the fossil energy system.
In principle, energy security can be enhanced by more domestic supplies, but this may be limited, as can be seen from oil-rich countries. Komendantova et al. [
63] used policy as a proxy for energy security concerns. They found that concerns for energy security, such as a reliable energy supply, safety considerations, and costs of electricity are more dominant for policy consideration. However, there was no real analysis of energy security for the current energy system. El-Anis [
57] analysed energy security from the perspective of nuclear energy and its policies, and concluded that nuclear energy can ensure a more diverse system and less reliance on energy imports. It may be true that such a domestic resource might bring these benefits, however energy security also depends on several other dimensions. For instance, Ramana and Ahmad [
64] found that nuclear energy will not be beneficial to the overall energy security because apart from diversifying the energy mix and reducing imports, the environmental impacts, cost structure and other dimensions of energy security would be negatively affected.
A quantitative analysis on energy security was done by the World Energy Council (WEC) [
42], ranking Jordan in 108th place for the year 2019 with a value of 48%. However, this analysis does not disclose its methods of how energy security is measured. To the knowledge of the authors, the only publication that measures energy security in Jordan quantitatively was carried out by Azzuni and Breyer [
65]. They found that the energy security level was at 40.5% for Jordan, ranking 118 out of 183 countries in the world. Jordan’s best achievement has been found in the health dimension with a performance of 82%, which is attributed to a high level of expenditure in the healthcare sector. In contrast, Jordan suffers the most in the availability dimension with 0.3%, as the current energy system is based on imported fossil fuels.
These studies reveal the low energy security level in Jordan, with substantial potential for improvement by an energy transition scheme towards a 100% RE system.
1.4. Aim and Novelty of This Research
This research aims to propose an energy transition pathway towards a 100% RE system in Jordan by 2050, and analyse how the energy security is enhanced as a consequence. This research contributes to the discussion of the feasibility of 100% RE systems, together with providing a detailed pathway of how to achieve such a sustainable future by 2050. Moreover, the novelty of this research lies in its unique approach of analysing impacts of a future energy system on energy security. Furthermore, this study investigates the relationship between the decarbonisation of the energy system and energy security in a qualitative approach based on a comprehensive framework. In addition, it provides clear recommendations for sustainable policy adoption in one of the developing countries, Jordan. This study provides an outlook of sustainable energy use, where access to energy is secured for all people while mitigating the effects of energy use on the environment by eliminating greenhouse gas (GHG) emissions. The applied LUT Energy System Transition model uses energy economics to optimise the lowest cost mixture of energy technologies in the energy system to build a future 100% renewable energy system.
In
Section 2, the methods for the energy transition scenario and the energy security analysis are introduced. The results of the energy transition scenario are presented and discussed in
Section 3. Discussion about the energy security benefits and the impact of a 100% RE system transition on energy security are addressed in detail in
Section 4.
Section 5 presents the conclusions and the respective consequences on energy security.
2. Methods and Data
In this section, the detailed methods and data formulation are described. A Best Policy Scenario for the period from 2015 to 2050 is defined. The last part of this section details the methods for the energy security analysis.
2.1. LUT Model Overview
The LUT Energy System Transition model [
66,
67] was employed to investigate the feasibility of the energy transition in Jordan. This model is an optimisation tool, which defines cost-optimal energy system structures under several technical and financial assumptions across the power, heat, transport and desalination sectors. The heat and electricity demand for the industry sector are considered as a part of the heat and power sectors, respectively. The model works on an hourly resolution for the transition period from 2015 to 2050 in 5 year time intervals. The target function of the model is to achieve a minimal annualised cost of the energy system at each step of the transition.
Figure 1 presents the process flow of the LUT Energy System Transition model. A detailed description of the model is given by Bogdanov et al. [
67] for the power sector alone, by Bogdanov et al. [
68] for the power and heat sectors integrated, and by Ram et al. [
69] for the power, heat, transport and desalination sectors. The schematic block diagram for the integrated power and heat sectors is shown in
Figure 2. The respective block diagrams for the transport and desalination sectors are presented in the
Supplementary Material (Figures S3–S5).
The optimisation was carried out in two stages. In a first step, the demand for prosumers has to be met in hourly resolution for the residential, commercial and industrial sectors, through the respective installed capacity of solar PV and battery storage, as well as the individual heating capacities. Prosumers’ demand is limited to 20% of the total demand by 2050, whereas up to 50% of total generation of prosumers can be fed into the grid [
67]. In a second step, the demand for all sectors has to be met in every hour of the applied year. The optimisation is conducted for the power and heat sectors as an integrated case, while the transport and desalination sectors are simulated individually. The RE installed capacity is limited to a maximum of 20% growth in every 5 year time step to eventually achieve a 100% RE-based energy system by 2050. Additionally, no new nuclear and fossil-based power plants are allowed to be installed after 2015. The existing capacities, however, can remain until the end of their actual lifetime. Gas turbines can still be active in the system, since sustainably produced synthetic natural gas and biomethane can be converted via gas turbines.
2.2. Country Data and Assumptions Used in the Model
The current energy demand across various sectors is collected and the future demand projected. The respective hourly demand profiles are generated and set as input data in the model. The power sector demand profile was taken from Toktarova et al. [
70] in order to generate the respective synthetic load profiles from 2015 to 2050. The power load profile included the cooling demand provided by air conditioning as discussed in Toktarova et al. [
70]. Heat demand is classified into four categories: space heating, domestic hot water heating, industrial process heat, and biomass for cooking. In terms of temperature, heat demand was divided into three groups: low, medium and high. It is projected that biomass for cooking will decline as the transition gets closer to the end. This projection can be justified as the energy system becomes more efficient and all residences in the country will have access to clean energy at the latest by 2050. There are four types of transport mode in the system: road, rail, marine and aviation. Each of the transport modes includes passenger and freight as a sub-category. Transport sector data were taken from Khalili et al. [
71]. The impact of smart charging and vehicle-to-grid concepts was excluded from this study. The desalination demand was collected from Caldera et al. [
72]. The projected desalinated water demand is related to the municipal, industrial and agricultural sectors. The final energy demand by sectors and energy form is shown in
Figure 3. The detailed data are tabulated and provided in the
Supplementary Material (Tables S1–S7 and Figures S1 and S2).
The historic weather data for the year 2005 was applied, as explained in Bogdanov et al. [
67]. The resource profiles in high spatial and temporal resolutions for solar PV, concentrating solar power (CSP), wind energy and hydropower were prepared. The sustainable potential of bioenergy [
73] and geothermal energy [
74] were collected and used as an upper limit. The current installed power plant capacities were structured by technologies and commissioning year, in an annual resolution from 1960 to 2015 (end of 2014), according to Farfan and Breyer [
75]. Access to this level of data helps to better account for power plant capacities that have to be phased out at the end of their lifetimes. Furthermore, technical and financial assumptions for all the technologies used in the model were gathered from different sources and provided in the
Supplementary Material (Tables S8–S10).
2.3. Scenario Definition
The LUT Energy System Transition model can be employed to analyse a wide variety of scenarios across different global regions. The objective of this study was to emphasise on a transition towards an entirely renewable energy-based energy system, which results in reaching zero GHG emissions in the energy sector at the latest by 2050, which is in line with the ambitious target of the Paris Agreement [
76] and the sustainable development goals of the United Nations [
77] with further justification by the Intergovernmental Panel on Climate Change, IPCC Special Report on 1.5 °C [
78]. The Best Policy Scenario fulfils these criteria, wherein the demand for the power, heat, transport and the desalination sectors has to be met by 2050, using a mix of RE, energy storage and other flexibility options such as power-to-X (PtX) technologies. The transition was planned from the current unsustainable energy system towards a fully renewable-driven energy system by 2050 in Jordan.
The financial and technical assumptions for all the technologies involved in the modelling were obtained from different sources, and are presented in the
Supplementary Material (Tables S8–S10). They include the learning curves of all the key technologies, which were considered to have a direct or indirect impact on the future costs since they were a crucial element for determining the cost-optimal energy transition pathways. The simulation was then carried out using the modelling setup of the LUT model, including all the critical aspects of the power, heat, transport and desalination sectors. Here, 108 energy technologies throughout the different sectors were integrated.
2.4. Method for Energy Security Analysis
This research focuses on a soft qualitative analysis of energy security, following the conceptual dimensionalisation according to Azzuni and Breyer [
34]. The connections between these dimensions and energy security was established with strong argumentations of the nature of the connections and their relationships to energy security. An analysis of the future 100% RE system in Jordan from an energy security perspective will follow the dimensions identified as the most important ones from previous research [
34].
Energy transition towards a 100% renewable energy system affects the availability dimension on the level of resources, means and consumers. For the diversity dimension, the transition will provide insights on how diverse the energy supply will be, based on what energy carriers, energy sources and energy use exist. The cost dimension comprises energy prices and their stability due to the energy transition. The impact of such a transition on the environment and the health dimensions will be addressed in detail, followed by the dimension of employment.
The analysis was carried out by addressing the parameters of each dimension. If a parameter or an aspect of a dimension was positively affected, then this dimension obtained a positive sign. The same qualitative analysis was carried out for the negative impacts of the energy transition on energy security. If the consequences of the transition negatively influenced aspects within a dimension, then a negative sign was given. The overall evaluation of a dimension was a numerical sum of the positive and negative signs.
A colour code was used to visualise the impact of a 100% RE transition on energy security for each analysed dimension. The colour depends on how many positive or negative impacts each dimension will obtain throughout the analysis. If the total number of positive impacts is higher than that of the negative ones, then the colour is given for that dimension as green, if lower it is given red and if positive impacts and negative impacts are equal then the dimension is coloured yellow. Each positive impact is represented by a plus symbol and each negative impact is presented by a minus symbol.
3. Results
Simulation results to attain a fully sustainable energy system across the power, heat, transport, and desalination sectors in Jordan by 2050 show that a transition towards a 100% RE energy system for Jordan would be technically feasible and economically viable, based on the input data considered. The energy supply would come from local and distributed renewable resources. Consequently, it implies that the Jordanian energy system could reduce its direct GHG emissions to zero by 2050, while at the same time gaining energy independence.
The results are structured as follows:
Section 3.1 presents an overview of the sustainable future energy system in Jordan by 2050. The results for power and heat are presented in
Section 3.2, whereas the transport sector results are presented in
Section 3.3, and the desalination sector is presented in
Section 3.4. For the cost structure and capital expenditures,
Section 3.5 shows the attained results.
Section 3.6 and
Section 3.7 present GHG emission reduction and employment opportunities, respectively, in relation to the energy transition towards a 100% RE system in Jordan by 2050.
3.1. Development of the Future Energy System
The results for primary energy demand by the form of energy and sector are presented in
Figure 4. The need for primary energy generation will increase until 2050 due to strong growth in the demand for energy services. At present, fossil fuels are able to cover the primary energy demand of around 90 TWh, which is less than 113 TWh, the figure listed in
Table 1, since non-energetic fuel demand, conversion losses in refineries, effects of import and export and others are not part of this study. The primary energy demand will increase to slightly more than 140 TWh by 2050. Much of this energy demand can be provided via large electrification in the country, as shown in
Figure 4a. Among the sectors, demand for the transport sector increases the most, which transitions from a fossil-based system towards a transport sector with high levels of direct electrification and synthetic fuels powered by indirect electrification. The demand for the power and heat sectors experiences a slight increase in primary energy from 2015 to 2050, whereas desalination demand grows due to the projected high water stress in the coming decades.
From the total primary energy demand of around 140 TWh in 2050, renewable electricity contributes 85%. The remaining 15% comes from renewable energy-based heat and bioenergy. Primary renewable electricity generation grows considerably from less than 1 TWh in 2015 to around 120 TWh in 2050, as shown in
Figure 4a, dominated by solar PV and supported by wind energy. High electrification as a result of an effective policy in Jordan can make a substantial difference over the transition. As indicated in
Figure 4c, almost half of the primary energy demand is required compared to a business-as-usual or low-electrification condition. This shows one of the positive effects of the high penetration of RE and comprehensive electrification, as well as a right policy in the country.
3.2. Power and Heat Sectors
The total electricity generation capacity increases drastically from less than 5 GW in 2015 to nearly 40 GW in 2050. Solar PV dominates the total electricity capacity in 2050, mainly driven by fixed-tilted PV with around 60% of total installed capacity. In the initial periods of the transition until 2035, the share of fixed-tilted PV is insignificant, while onshore wind and single-axis tracking PV emerge starting from 2025. In the later part of the transition, the energy system is mainly run by solar PV, which is due to the great potential and availability of this resource across Jordan, as well as its continued cost reduction. Although the share of onshore wind and solar PV is almost comparable in 2030, the cost competitiveness of solar PV in comparison to wind energy makes PV a more attractive option from 2035 onwards. Other RE technologies, such as CSP, geothermal and bioenergy, complement solar PV and wind power, especially during the peak hours, and also when none of these resources are available. The contribution of fossil fuels goes down through the transition to zero by 2050. A small installed capacity of gas remains in the system, but the fuel shifts from fossil gas to synthetic natural gas powered by renewables and biomethane.
In the heat sector, heat pumps play an integral role contributing to over half of the capacity mix from 2030 to 2045, and even higher in 2050, as given in
Figure 5. The majority of heat pump capacity comes from the individual heat sector by 2050, and the remaining fossil fuels are phased out in the last period to achieve a fully sustainable energy system. In addition, some shares of direct electric heating, non-fossil gas, solar thermal heat, CSP solar field, geothermal heat, and biomass-based heating contribute to the total heat generation by 2050. In contrast, heat generation that mainly comes from oil and coal-based heating in 2015 decrease considerably over the transition, and finally to zero by 2050.
The role of energy storage is vital through the transition, especially with the great contribution of solar PV and wind energy. As the sun might not shine and the wind may not blow during every hour of the day, electricity can be stored via energy storage technologies during the hours when the generation is more than the demand. The stored energy can be utilised in the absence of sufficient energy. This phenomenon can be well seen towards the end of the transition, where a higher penetration of solar and wind energy is observed. As shown in
Figure 6a, the installed capacity of batteries start emerging from 2025, with an installed capacity of around 1 GWh
cap, to approximately 67 GWh
cap in 2050. A higher share of PV induces larger energy storage capacities for diurnal balancing. Adiabatic compressed air energy storage (A-CAES) contributes to the total electricity storage capacity, starting from 2035 until 2050. Electricity storage output is dominated by large-scale batteries, prosumer batteries and A-CAES, in total around 31 TWh
el by 2050, as given in the
Supplementary Material (Figure S7).
Similarly, heat storage plays a crucial role in covering the heat demand in Jordan. As presented in
Figure 6b, gas storage dominates the storage technologies in terms of the total installed capacity. The initial heat storage capacity is installed in 2025, where thermal energy storage for district heating accounts for the entire capacity with around 4 GWh
th. From 2040 onwards, a massive capacity of gas storage is added with nearly 900 GWh
th, and it increases to almost 2900 GWh
th by 2050. With regards to the heat storage output, both thermal energy storage and gas storage are key elements to cover more than 14 TWh
th of the heat sector demand during all hours by 2050, as shown in the
Supplementary Material (Figures S7, S11 and S12).
3.3. Transport Sector
Final energy demand for the transport sector was around 15 TWh in 2015, which increases gradually from 2020 to 2040. The demand soars towards the end of the transition period with slightly less than 30 TWh in 2050. Electricity utilisation grows in the transport sector, from almost zero in 2015 to more than 10 TWh in 2050. Towards the end of the transition, sustainably produced hydrogen, methane and biofuels contribute considerably. By 2050, more than half of the demand is covered by these three resources. The transport sector shows an electricity demand of roughly 43 TWh by 2050. The substantial demand for renewable electricity-based synthetic liquid fuels emerges from 2040 onwards up to 2050, as shown in
Figure 7b. The same trend can be observed for the case of hydrogen, growing from less than 1 TWh in 2030 to around 10 TWh in 2050. The contribution of hydrogen and renewable electricity-based synthetic liquid fuels was mainly to satisfy the demand for the marine and aviation transport modes in the final steps of the transition, and some remaining demand from the road and rail transport modes.
Installed electricity generation capacity for the transport sector upsurges from roughly zero at the beginning of the transition to around 25 GW in 2050, as shown in
Figure 8a. From the total installed capacity, the fixed tilted and single-axis tracking PV are the predominant technologies with small shares of onshore wind, as these two technologies are the least costly electricity sources in Jordan. The majority of capacity addition occurs from 2040 onwards, where the contribution of single-axis tracking PV increases. High direct and in particular indirect electrification levels in the transport sector lead to a climb in installed capacities for the last three periods of the transition, as illustrated in
Figure 8b. Electricity generation from solar PV started from 2020 with around 80 GWh. This amount increases to about 7 TWh in 2035 and further rises to 45 TWh in 2050. Fixed tilted and single-axis tracking PV account for 55% and 44% of the total electricity generation in 2050, respectively, with the remaining 1% coming from onshore wind.
Another crucial aspect that can play an important role for shifting away from fossil fuels towards high electrification of the transport sector is the production of hydrogen and synthetic fuels. As shown in
Figure 9, the installed capacities of fuel conversion technologies increase drastically from about 4 GW
output in 2040 to more than 12 GW
output in 2050. Water electrolysis consists of the highest share of fuel conversion capacities through the transition, followed by hydrogen liquefaction units, Fischer–Tropsch synthesis plants and to a lesser extent liquefied natural gas (LNG) units, converting renewable electricity-based synthetic natural gas or biomethane, if available, into LNG. In addition, the required heat during the synthetic fuels production, which is mainly for CO
2 direct air capture (DAC), can be supplied via recovered process heat. This measure makes the energy system more efficient, since the heat that would be wasted is otherwise reutilised by the CO
2 DAC units. Total heat management reaches 6 TWh
th by 2050, which comprises1.6 TWh
th of the recovered heat and 4.4 TWh
th of excess heat.
3.4. Desalination Sector
Jordan is one of the most water-stressed countries in the Middle East. As can be seen in
Figure 10a, almost half of the total water demand in 2050 can be met by desalinated water. The entire desalination capacity comes from the seawater reverse osmosis (SWRO), which is one of the most promising desalination technologies [
80]. SWRO is another Power-to-X application, since low-cost electricity is converted into clean water. A small amount of water storage starts contributing by 2040 and remains almost unchanged until the end of the transition. In terms of the levelised cost of water (LCOW), capex contributes to almost half the cost in 2015, in a period when fossil fuels are still the main supply of energy for running the desalination plants. However, the overall LCOW declines towards the end of the energy transition, as the capex and opex decrease. The LCOW falls from 1.1 €/m
3 in 2015 to 0.6 €/m
3 in 2050. The share of RE-installed capacity climbs from practically zero in 2015 to approximately 4 GW in 2050. As shown in
Figure 11a, gas turbines are the predominant contributors until 2025, whereas solar PV and wind energy emerge from 2030 onwards. A massive amount of fixed tilted PV is installed in 2035, with a capacity of 1 GW, and it continuously increases up to 3 GW by 2050. With regards to total electricity generation in the desalination sector, combined cycle gas turbine (CCGT) plays a key role in the first periods of the transition, whereas RE capacities dominate the second half of the transition, as they are the lowest cost energy sources through the energy transition (
Figure 11b).
3.5. Cost Structure and Investments
The total annual energy system cost increases during the energy transition, from nearly 6 b€ in 2015 to around 8.5 b€ in 2050 (
Figure 12a). Higher investments are particularly needed in the heat sector, followed by the transport, power and desalination sectors. This indicates that fuel imports will fade out through the transition as high shares of RE start contributing and the country becomes independent from energy imports. Additionally, as shown in
Figure 12b, after a rapid decrease from around 105 €/MWh in 2015 to 80 €/MWh in 2020, the levelised cost of energy decreases gradually in the following years up to 2040 and reaches 60 €/MWh. Then, it almost stabilises towards the end of the transition. In the last period of the transition, the levelised cost of energy again increases slightly by 4%. Since a tremendous amount of RE capacity is to be integrated into the energy system, the share of fossil fuel and GHG emission cost goes down towards the end of the transition and finally turns to zero in 2050. At the same time, capital expenditures continue to grow due to high-investment requirements for introducing solar PV and wind energy, as the predominant RE sources, complemented by further energy system components, in particular Power-to-X technologies, as shown in the
Supplementary Material (Figure S10). The sectoral cost breakdowns are presented in the
Supplementary Material (Figures S11–S14).
3.6. GHG Emissions
One of the positive impacts of transitioning to a 100% RE-based energy system is the defossilisation of the energy system. It means the amount of GHG emissions will be reduced from around 24 MtCO
2eq in 2015 to zero in 2050. As illustrated in
Figure 13, heat and power sectors account for the main part of the GHG emissions for most of the first half of the transition, whereas most of the GHG emissions come from the transport sector in the second half of the transition. The respective figures for each sector are provided in the
Supplementary Material (Figure S16). As shown, the amount of GHG emissions continuously declines for both the power and heat sectors, while it takes longer for the transport and desalination sectors. In the transport sector, after an increase from 3.8 MtCO
2eq in 2015 to 4.7 MtCO
2eq in 2025, the GHG emissions fall to 4.3 MtCO
2eq in 2030. Then, it decreases sharply in the last few steps of the transition. Similarly, GHG emissions in the desalination sector decrease gradually from 2030 to 2045, after a rapid increase from 2015 until 2030. The rise in the first half of the transition is due to an increase in the capacities of gas turbines in the energy system, while their utilisation is reduced towards the end of the transition and brought to zero emissions by substituting fossil gas with synthetic methane and biomethane.
3.7. Employment Opportunities
Jordan has come a long way in terms of infrastructure development since its independence in 1946, and it now boasts effective and modern facilities in telecommunications, power and electricity, water, and transport infrastructure [
81]. It also has a growing RE sector and as highlighted by the results, a transformation in the energy system across the power, heat and transport sectors has various benefits. Unemployment in Jordan remains stubbornly high, even during the recent high economic growth years. Unemployment rates, especially among youth, have remained in the double digits over the last decade at around 12% [
81]. In this regard, job estimations on the basis of the results of this study and adopting the method from Ram et al. [
82] show that the energy transition in Jordan has huge employment benefits. The total number of direct energy jobs across Jordan is observed to increase from just around 20 thousand in 2015 to more than 105,000 by 2050, as indicated in
Figure 14 (left). Power and heat sectors create the most jobs through the transition, complemented by jobs in the storage, transmission and distribution technologies as highlighted in
Figure 14 (left). In addition, renewable electricity-based synthetic fuel production creates some jobs from 2040 onwards. Jobs created by various technologies across the power, heat, fuels and storage sectors can be found in the
Supplementary Material (Figures S17 and S18).
Figure 14 (right), also indicates the distribution of jobs across the different categories during the transition period in Jordan. With the rapid installation of capacities up to 2035, the bulk of new jobs is created in the construction and installation of power, heat and storage technologies. Manufacturing jobs have a relatively lower share in the initial periods up to 2025, as the share of imports is high. From 2025 onwards, as domestic production capabilities build up, a higher share of manufacturing jobs are observed until 2050 with over 20% of the total jobs. The share of fuel-related jobs continues to diminish from 2020 onwards through the transition period, as fossil fuels are replaced with synthetic fuels, reaching just 1% of the total jobs by 2050. On the other hand, the share of operations and maintenance jobs grows through the transition period up to 36% of total jobs by 2050. Transmission and distribution jobs increase through the transition contributing to about 6% of the jobs by 2050. This means more stable jobs for a region suffering from high unemployment amongst the youth and a growing number of economic migrants. A higher share of investments in developing sustainable power infrastructure could be the right catalyst to create long-term jobs in this region [
83]. As Cote [
83] highlights, the combined challenges of growing energy demand and labour market pressures present the government of Jordan not only with an opportunity to diversify their energy mix, but also to help mitigate high youth unemployment and assist in creating higher-skilled jobs. The electricity-generation-specific jobs increase initially from 1198 jobs/TWh
el in 2015 to 1631 jobs/TWh
el in 2025 with the rapid ramp up in RE installations. Beyond 2025, with increasing levels of technology development and automation, specific jobs decline steadily to around 872 jobs/TWh
el by 2050, as shown in
Figure 14 (right).
4. Discussion
4.1. Energy Transition
The results of the energy transition show that not only is it a Best Policy Scenario for a 100% RE system possible for Jordan, but it also is feasible as a low-cost option for the entire energy system. The Best Policy Scenario will result in a reduction of primary energy demand by around half of what would be the primary demand of a business-as-usual projection. This result is due to the high efficiency of electricity-based systems, in comparison to fossil-based systems, linked to low-efficiency combustion processes. Such improvements in efficiency will not only reduce wasted energy, but will also reduce GHG emissions to zero, as was presented in
Figure 13. The elimination of GHG emissions was not only due to increased efficiency, but also the source of the energy in use. A 100% RE system in the context of Jordan means the reliance on solar PV and wind energy. Therefore, most of the installed capacities for power and heat generation are PV systems and wind turbines. The elimination of GHG emissions is supported by shifting the transport sector to sustainable solutions, as shown in
Section 3.3. Although the energy demand for the transport sector increases in absolute terms, it declines in relative terms per passenger kilometre and tonne kilometre.
The findings of this research clarify a future path for the opportunities associated with RE, that was found in previous research by Jaber et al. [
47]. This paper agrees with the opportunities that renewables can bring into the Jordanian energy system; a further step was to show a Best Policy Scenario of how to seize these opportunities and benefit from them to positively impact energy security levels. Results in this research highlight that the renewable energy potential in Jordan, as outlined by Anagreh and Bataineh [
84], can pave the way for raising the standards of living according to the Best Policy Scenario. Unlike earlier studies for desalination options with a fossil fuel-based energy system [
85], this study provides a detailed desalination capacity installation scheme based on 100% RE. The importance of desalinated water to meet the increasing water demand for one of the most water-stressed regions in the world, Middle East and North Africa (MENA), has been discussed in length by Caldera et al. [
72,
86,
87] and Aghahosseini et al. [
88]. Finally, a technically feasible and economically viable pathway is presented, not including nuclear in the energy mix. This is supported by previous research on Jordan by Ramana and Ahmad [
64].
A strong initiative to push Jordan for large investments in RE systems is self-sufficiency, and cuts off the reliance on energy imports. A majority of energy production in the country today comes from imports from neighbouring countries. A sudden change in the market or a major conflict due to geopolitical reasons can massively affect the energy supply system in Jordan. Jordan can move towards a high-penetration of RE as an opportunity for socio-economic development in the years to come. Kiwan and Al-Gharibeh [
89] discussed the necessity to secure sustainable electricity in Jordan under several scenarios. The results reveal that to achieve a 100% RE-based system for Jordan by 2050, around 25 GW of solar PV, 11 GW of CSP and 5 GW of wind power aligned with 90 GWh of storage capacities are required. The authors stated that a 100% renewable electricity scenario is affordable and diminishes CO
2 emissions and the need for energy imports to zero by 2050. The feasibility of a 100% RE system is confirmed by this research, as well as the solar energy dominance, whereas the role of CSP cannot be confirmed by this research, which is a consequence of low-cost solar PV and the overall cost optimisation for a least costly energy transition pathway. Regarding the resource availability, Anagreh and Bataineh [
84] have analysed the potential of solar and wind energy using meteorological and statistical approaches. Their findings show that Jordan has great potential to utilise solar PV and wind energy in various locations. An earlier study by Anagreh et al. [
90] proved the excellent potential to implement a wide variety of solar PV and wind projects in the southern part of Jordan.
The energy transition results for Jordan can be compared to research insights on the transition towards a 100% RE system in other countries in the region. Comparable benefits of a 100% RE system in Jordan were concluded for all the countries in the MENA region [
88]. An analysis of three different scenarios was conducted for the region and it was found that a 100% RE system was cheaper than a business-as-usual scenario. Similar analyses for different 100% RE scenarios were conducted for individual countries in the region, in particular for Saudi Arabia [
86], Turkey [
91], Israel [
92] and Iran [
87,
93,
94,
95]; all with a comparable conclusion that a 100% RE system is technically feasible and economically viable. It is not only similar to results from the MENA region, but also similar to research done for comparable sun-rich countries in the world, such as Chile [
96]. The findings of the current study align with those of the previous research papers on the socio-techno-economic feasibility and applicability of an energy transition with emphasis on the need for political will to execute such scenarios. The next steps would be to study the factors that affect policy making and energy system planning with an emphasis on the specific measures to adopt such a 100% RE scenario.
4.2. Energy Security
In this section, energy security is analysed qualitatively for the dimensions: availability, diversity, cost, environment, health and employment, summarised for all the dimensions with a colour code representation.
4.2.1. Availability and Diversity Dimensions
Availability and diversity dimensions are analysed based on the predefined parameters by Azzuni and Breyer [
34]. Availability will be addressed with three parameters and diversity will be addressed with four.
Table 2 summarises these parameters:
As addressed in
Figure 4 and
Figure 5, the availability dimension of the Jordanian energy system is significantly improved by the energy transition towards a 100% RE system. The first positive impact is the existence of resources. Jordan has substantial RE resources that were not used previously, which changes drastically with the energy transition in a positive way. It is expected that the population will at least double by 2050, which was shown in
Figure 4. This development in population means more consumers and more energy use, which is also a positive impact on the energy system. The positive development is not only because of an increased use of energy, but rather because of an increased use of energy per capita, which is also positive. The last parameter of the availability dimension, the existence of means, is affected positively as shown in
Figure 5. There are more means to access and harvest energy, and more people have possibilities to attain energy services. Such access can be mirrored from the infrastructure development in the Best Policy Scenario as can be seen from
Figure 5,
Figure 8,
Figure 9,
Figure 10 and
Figure 11, which is also a positive change for this dimension.
Similarly, the parameters within the diversity dimension are positively affected because of the energy transition towards a sustainable and fully RE system. For the first parameter, the diversity of sources or the dependency factor, such a transition makes the energy system more independent from other energy sources, as all the needed energy is supplied domestically. This is a negative attribute for diversity as there will be mainly one type of source if any disaster happens in Jordan, the whole energy system will be down. A variety of sources may be more advantageous to replace a potential energy shortage. In contrast, a higher level of diversity of fuels can be seen from
Figure 4 and
Figure 5 in 2050 in comparison to the current situation, which is a positive impact, since a 100% RE system leads to a broader use of different fuels for final energy supply. Primary energy will be mainly provided by electricity, which negatively impacts diversity. The third parameter, the diversity of technology and transport, is again positively affected, as the diversity of the use of the various technologies to generate electricity is increased, as can be seen from the installed capacities in
Figure 5,
Figure 8 and
Figure 11. The use of different transportation methods for energy services is another positive effect for diversity. However, as the backbone of the energy system will be dependent on the electricity grid for transporting most of the required energy, this again accounts negatively for the diversity of means. The last parameter for the diversity dimension, the diversity of consumers, seems not to be affected by the energy transition and thus is neither positive nor negative.
4.2.2. Cost Dimension Analysis from the Energy Security Perspective
Since it was found that cost is one of the most important aspects of energy systems [
63], three cost parameters of energy security need to be addressed: relationship to energy price, cost of disruption and cost of securing the system [
34]. The impact of the energy transition on the first parameter was mixed between positive and negative points. The first point was the end cost to be paid per energy unit. As was shown in
Figure 12, the levelised cost of energy will be lower in 2050 than in 2015, which is a positive side of the transition and thus a positive sign is given. Although the present value of energy cost is 15% higher per capita in 2050 than in 2015, which is a negative sign, energy services improve substantially, and thus indicate higher living standards. The third element of this parameter is positive, since the stability of prices is documented by a low volatility during the transition, as shown for the levelised cost of energy in
Figure 12. The overall outlook is positive since subsidies are removed and energy costs reflect the real cost. In addition, energy poverty, which is the situation where individuals spend more than 10% of their income on energy services [
97,
98], will decrease until 2050 due to higher GDP growth per capita [
70] than the increase in energy cost represented in
Figure 12. Therefore, another positive sign is given for this parameter.
The second parameter is cost of disruption, which will be affected by the transition towards a 100% RE system. The cost of disruption can be reduced because of a total dependence on local RE sources and therefore increasing energy security, which is a positive effect. Furthermore, the last parameter gets a positive sign as the cost to make the system more secure tends to be lower since a 100% RE system will be more decentralised. Valuable assets will be distributed all over, and thus securing these smaller units is easier than the need to secure big facilities, as is the case for the current fossil fuel-based system.
4.2.3. Benefits of Environment and Health Dimensions
Environment and health dimensions are among the key energy security dimensions. It is one of the primary goals for the Best Policy Scenario to eliminate the negative impacts on the environment from the traditional fossil-based energy system. The parameters of the environment and health dimensions, according to [
34], are summarised in
Table 3.
The first parameter for the environment dimension can be assessed positively because resources are not depleted faster than the natural ability of regeneration, thus a positive gain for energy security. The next parameter will enhance energy security, as the technologies used to generate electricity, as shown in
Figure 5, cause no relevant burden for the environment. The third parameter on GHG emissions, as shown in
Figure 13, will develop very positively, due to the phasing out of GHG emissions. The fourth parameter can be also evaluated positively, as the Best Policy Scenario (BPS) aims for limiting global warming to 1.5 °C. The projected increase in temperature is accompanied with more sunshine due to even less clouds in Jordan. The higher share of solar PV in the energy system may lead to even more available energy and a higher level of energy security, which is a positive effect. The last parameter can be evaluated very positively, as water will be used much less for power generation due to drastically reducing the share of thermal power generation [
99], and desalination will be based on renewable electricity without relevant water requirements. This parameter is very important for Jordan, as Jordan already suffers from high water-stress levels, so that the BPS will provide innovative solutions for the water issues in Jordan.
The two parameters of the health dimension are expected to show a positive development. The BPS takes into consideration a tremendous improvement in the energy consumption per capita as shown in
Figure 4, and it is projected that this transition will make people healthier in general. Healthier employees and societies will be more productive and efficient, which results in improving the energy security level and is therefore a positive effect. In today’s energy system, where 5 million deaths per year and more than 5% of all health-related issues globally are attributed to the energy system [
100], the BPS will play a very positive role in eliminating this problem. As shown in
Figure 13, GHG emissions from the transport system will be reduced to zero, which also implies that air pollution will be almost eliminated and thus enhances the energy security level. This is a much appreciated positive impact from a 100% RE-based system in contrast to the current system [
101]. Fossil fuels are hazardous materials [
102], thus the broad electrification will have an additional positive impact on people’s health.
4.2.4. Employment Dimension Benefits
The two parameters of the employment dimension are the effect of the energy system on employment and the effect of the employment rate on the energy system. The BPS will result in creating more jobs, as was shown in
Figure 14, which is a positive effect. A higher employment rate means more revenue generation opportunities for individuals [
103] and more financial resources directed to the energy system with a stronger purchasing power. It is expected that more money will be spent on energy services in the future due to a high employment rate, which is another positive effect.
4.2.5. Summary on Energy Security Dimensions
Summary for the energy security analysis of the BPS is presented in
Table 4 with colour codes. Green, for most positive parameters for a dimension, indicates a positive correlation between energy security and the proposed transition towards a 100% RE-based system. Red, if the sum of the assessed parameters per dimension is negative, indicates that the relationship with energy security has deteriorated. Yellow, indicates a neutral impact of the energy transition on energy security.
4.3. Limitations and Recommendations for Future Research
Although this study is limited by the pre-assumptions that are used in the model for simulating the future energy scenario, the significance of these limitations seems to be acceptable because the used assumptions are scientifically accepted. Another limitation is the uncertainty of how solar radiation may change in Jordan until 2050. This limitation is of low significance as change in solar radiation is expected to be below a 3% level [
104]. Effectively, slightly more solar PV yield could be expected, while a slightly higher temperature level may again slightly decrease that extra yield. The structure of the obtained results is expected to be not affected. The assumption that power transmission lines are built fast enough to cover the whole country can be a limitation, knowing that most of the population in Jordan is concentrated in the big cities, while the rest of the country has a lower population and is mostly desert areas. It could be expected that the electricity demand may be further increased by additional cooling demand, induced by increasing temperature due to climate change effects, as discussed by Emodi et al. [
104].
For the current energy system, most of the required data is available to perform a quantitative analysis for energy security according to Azzuni and Breyer [
65]. However, for the future energy system, many of these data do not exist yet, and it is hardly possible to project major parts of that data well, so a qualitative analysis is the best compromise.
The applied Best Policy Scenario in order to achieve a 100% RE-based system is not equal to a fully sustainable system, since it is more focused on the used technologies, i.e., faster overall electrification, fast switch to low-cost solutions, fast phase-in of renewables, coverage of clean water and electric vehicles. The transition towards a fully sustainable energy system for Jordan needs additional studies, which subdivides the country into several nodes based on population distribution and determines the local energy demands, the ability to meet these demands, while minimising the need for transmission lines. Such a valuable improvement in the insights on a national energy transition has been shown for the case of Iran with a first analysis for the country in one node [
94] and a second in-depth research in a multi-node resolution [
93]. It is also suggested to carry out a comparison of different scenarios to see their relative impact on energy security. An even more sustainable scenario could be to model a system where electricity consumption per capita is equal to the average OECD consumption per capita, which would mean higher standards of living, but also respective policy requirements. The comparison of the impact on energy security from different scenarios enables valuable insights into the scenario that would achieve the highest level of energy security. These scenarios are also to be compared with a Current Policy Scenario to address the needed changes in the policy-making process. Other research for the MENA region [
88] clearly indicates that a Current Policy Scenario would lead to higher-energy system cost, while achieving lower sustainability levels.
As the results suggest that there are no major technical and economic barriers to achieve a fully renewable-based energy system in Jordan by 2050, there is still need to address the social acceptance of the respective change and conduct more research on how people would react to such an energy transition.
5. Conclusions
Renewable energy potential in Jordan is quite attractive and a transition towards a 100% RE system is technically feasible and economically viable by 2050. Such a transition towards a highly sustainable energy system will have a multitude of impacts on energy security. The main objectives of this were to propose an energy transition pathway towards a 100% RE system in Jordan by 2050 and to analyse how energy security is enhanced with such a transition.
In order to achieve this goal, multiple steps were implemented in a scientific method. This first step of the method was to simulate a future energy scenario using the LUT model. Then, data was collected from different sources as input data for the model. The calculation method was determined based on the selection of a Best Policy Scenario. Lastly, the methods of energy security analysis were applied by following a comprehensive energy security analysis framework.
The results show that energy demand will increase in absolute terms, but less compared to a business-as-usual scenario, due to improved energy system efficiency. In addition, people will enjoy a higher level of living standards with more traveling and increased transportation services. Furthermore, as water stress and scarcity is one of the biggest challenges Jordan faces nowadays, such a transition can provide all the needed water supply using RE. Such a transition comes along with a GHG emission reduction to zero and employment benefits.
Unlike the current Jordanian energy system, where energy security is at a low level, the Best Policy Scenario will generate positive results for many dimensions of energy security. A major implication of the BPS is zero GHG emissions, enabling the 1.5 °C target of the Paris Agreement. This will drastically enhance the environment and health dimensions of energy security. The BPS allows the energy system to utilise the available renewable resources of Jordan, and thus achieve a higher level of energy security in the availability dimension. Furthermore, the cost dimension will be after all affected positively with a 100% RE system. In addition, the employment dimension will also benefit positively. On the other hand, this transient has a neutral impact on the diversity dimension of energy security.
Future studies should consider modelling additional energy transition scenarios with an even stronger sector coupling of all energy sectors, potentially leading to even higher overall system efficiency and lower cost, the inclusion of non-energetic industrial hydrocarbon demand and higher geo-spatial resolutions. Furthermore, the inclusion of decreased system costs for even higher standards of living and a more diverse mix of energy supply options will highlight the best scenarios that enable Jordan to become one of the first countries around the world with a fully sustainable energy system.
Author Contributions
Conceptualization, A.A. (Abdelrahman Azzuni) and C.B.; methods, A.A. (Abdelrahman Azzuni), A.A. (Arman Aghahosseini), M.R., D.B., U.C. and C.B.; software, A.A. (Arman Aghahosseini), M.R., D.B., U.C. and C.B.; validation, A.A. (Abdelrahman Azzuni), A.A. (Arman Aghahosseini), M.R., D.B., U.C. and C.B.; formal analysis, A.A. (Abdelrahman Azzuni), A.A. (Arman Aghahosseini) and M.R.; investigation, A.A. (Abdelrahman Azzuni), A.A. (Arman Aghahosseini), M.R., D.B., U.C. and C.B.; data curation, A.A. (Arman Aghahosseini), M.R., D.B. and U.C.; writing—original draft preparation, A.A. (Abdelrahman Azzuni), A.A. (Arman Aghahosseini) and M.R.; writing—review and editing, A.A. (Abdelrahman Azzuni), A.A. (Arman Aghahosseini), M.R., D.B., U.C. and C.B.; visualization, A.A. (Abdelrahman Azzuni), A.A. (Arman Aghahosseini), M.R., D.B., U.C. and C.B.; supervision, C.B.; project administration, C.B.; funding acquisition, C.B. All authors have read and agreed to the published version of the manuscript.
Funding
This research received no external funding.
Acknowledgments
The authors gratefully acknowledge the public financing of Tekes, the Finnish Funding Agency for Innovation, for the ‘Neo-Carbon Energy’ project under the number 40101/14.
Conflicts of Interest
The authors declare no conflict of interest. The funders had no role in the design of the study; in the collection, analyses, or interpretation of data; in the writing of the manuscript, or in the decision to publish the results.
Abbreviations
| A-CAES | Adiabatic compressed air energy storage |
| CAPEX | Capital expenditures |
| CCGT | Combined cycle gas turbine |
| CHP | Combined heat and power |
| CSP | Concentrated solar thermal power |
| DAC | CO2 direct air capture |
| DH | District heating |
| GHG | Greenhouse gas |
| GT | Gas turbine |
| HDV | Heavy duty vehicle |
| HT | High temperature |
| ICE | Internal combustion engine |
| IH | Individual heating |
| LDV | Light duty vehicle |
| LNG | Liquefied natural gas |
| LUT | LUT University |
| MDV | Medium duty vehicle |
| OCGT | Open cycle gas turbine |
| OECD | Organization for Economic Co-operation and Development |
| OPEX | Operational expenditures |
| PHES | Pumped hydro energy storage |
| PP | Power plant |
| PtG | Power-to-gas |
| PtH | Power-to-heat |
| PV | Photovoltaic |
| RE | Renewable energy |
| SF | Solar field |
| ST | Steam turbine |
| SWRO | Seawater reverse osmosis |
| TES | Thermal energy storage |
| TTW | Tank-to-wheel |
| 2W | Two-wheelers |
| 3W | Three-wheelers |
| € | Euro |
References
- Ang, B.W.; Choong, W.L.; Ng, T.S. Energy security: Definitions, dimensions and indexes. Renew. Sustain. Energy Rev. 2015, 42, 1077–1093. [Google Scholar] [CrossRef]
- Vivoda, V. Evaluating energy security in the Asia-Pacific region: A novel methodological approach. Energy Policy 2010, 38, 5258–5263. [Google Scholar] [CrossRef] [Green Version]
- Bielecki, J. Energy security: Is the wolf at the door? Q. Rev. Econ. Financ. 2002, 42, 235–250. [Google Scholar] [CrossRef]
- Jun, E.; Kim, W.; Chang, S.H. The analysis of security cost for different energy sources. Appl. Energy 2009, 86, 1894–1901. [Google Scholar] [CrossRef]
- Löschel, A.; Moslener, U.; Rübbelke, D.T.G. Indicators of energy security in industrialised countries. Energy Policy 2010, 38, 1665–1671. [Google Scholar] [CrossRef]
- Kirchner, E.; Berk, C.A.N. European energy security co-operation: Between amity and enmity. J. Common Mark. Stud. 2010, 48, 859–880. [Google Scholar] [CrossRef]
- Dyer, H.; Trombetta, M.J. International Handbook of Energy Security; Edward Elgar Publishing: Cheltenham, UK; Northampton, MA, USA, 2013. [Google Scholar]
- Kovačovská, J. Energy Security in European Conditions. Master’s Thesis, Faculty of Social Studies, Masaryk University, Brno, Czech Republic, 2010. [Google Scholar]
- Sovacool, B.K. Energy security: Challenges and needs. Wiley Interdiscip. Rev. Energy Environ. 2012, 1, 51–59. [Google Scholar] [CrossRef]
- Narula, K. Comparative assessment of energy sources for attaining Sustainable Energy Security (SES): The case of India’s residential sector. Int. J. Sustain. Energy Plan. Manag. 2015, 5, 27–40. [Google Scholar] [CrossRef]
- Johnson, C.; Boersma, T. The politics of energy security: Contrasts between the United States and the European Union. Wiley Interdiscip. Rev. Energy Environ. 2015, 4, 171–177. [Google Scholar] [CrossRef]
- Valentine, S.V. Emerging symbiosis: Renewable energy and energy security. Renew. Sustain. Energy Rev. 2011, 15, 4572–4578. [Google Scholar] [CrossRef]
- Augutis, J.; Krikštolaitis, R.; Pečiulytė, S.; Konstantinavičiūtė, I. Sustainable development and energy security level after Ignalina NPP shutdown. Technol. Econ. Dev. Econ. 2011, 17, 5–21. [Google Scholar] [CrossRef]
- Yergin, D. Ensuring energy security. Foreign Aff. N. Y. 2006, 85, 69. [Google Scholar] [CrossRef]
- Kunz, A. Indian Energy Security. Nuclear Energy Policy; Charles University in Prague: Prague, Czech Republic, 2012. [Google Scholar]
- Magazzino, C. Is per capita energy use stationary? Time series evidence for the EMU countries. Energy Explor. Exploit. 2016, 35, 24–32. [Google Scholar] [CrossRef]
- Magazzino, C. Is per capita energy use stationary? Panel data evidence for the EMU countries. Energy Explor. Exploit. 2016, 34, 440–448. [Google Scholar] [CrossRef] [Green Version]
- Asif, M.; Muneer, T. Energy supply, its demand and security issues for developed and emerging economies. Renew. Sustain. Energy Rev. 2007, 11, 1388–1413. [Google Scholar] [CrossRef]
- Haghighi, S.S. Energy Security: The External Legal Relations of the European Union with Major Oil and Gas Supplying Countries; Bloomsbury Publishing: London, UK, 2007. [Google Scholar]
- Ciută, F. Conceptual notes on energy security: Total or banal security? Secur. Dialogue 2010, 41, 123–144. [Google Scholar] [CrossRef]
- Dannreuther, R. Energy Security; John Wiley & Sons: Hoboken, NJ, USA, 2017. [Google Scholar]
- Sovacool, B.K. Evaluating energy security in the Asia pacific: Towards a more comprehensive approach. Energy Policy 2011, 39, 7472–7479. [Google Scholar] [CrossRef]
- Dunham, I.M.; Schlosser, K. Energy security discourses and environmental protection measures in U.S. federal energy legislation: An introductory exploration. Extr. Ind. Soc. 2016, 3, 86–94. [Google Scholar] [CrossRef]
- Eaves, J.; Eaves, S. Renewable corn-ethanol and energy security. Energy Policy 2007, 35, 5958–5963. [Google Scholar] [CrossRef]
- Jordan, M.; Manley, D.; Peters, R.S.; Stoltz, R. Goals of Energy Policy: Professional Perspectives on Energy Security, Economics, and Environment; Our Energy Policy and Sandia National Laboratory: Washington, DC, USA; Sandia National Laboratory: Albuquerque, NM, USA, 2012.
- International Energy Agency (IEA). Energy Security and Climate Policy-Assessing Interactions; 1281720488; Organisation for Economic Co-operation and Development (OECD) Publishing: Paris, France, 2007. [Google Scholar]
- Franki, V.; Višković, A. Energy security, policy and technology in South East Europe: Presenting and applying an energy security index to Croatia. Energy 2015, 90, 494–507. [Google Scholar] [CrossRef]
- Maslow, A.H. A theory of human motivation. Psychol. Rev. 1943, 50, 370–396. [Google Scholar] [CrossRef] [Green Version]
- Willrich, M. International energy issues and options. Annu. Rev. Energy 1976, 1, 743–772. [Google Scholar] [CrossRef]
- Miller, L.B.; Lieber, R.J.; Maddox, J.; Mancke, R.; Vernon, R.; Willrich, M. Energy, security and foreign policy: A review essay. Int. Secur. 1977, 1, 111–123. [Google Scholar] [CrossRef]
- United Nations Development Programme (UNDP). World Energy Assessment—Energy and Challenges of Sustainability; United Nations Development Programme: New York, NY, USA, 2000. [Google Scholar]
- Bohi, D.R.; Toman, M.A. Energy security: Externalities and policies. Energy Policy 1993, 21, 1093–1109. [Google Scholar] [CrossRef]
- Narula, K.; Reddy, B.S. A SES (sustainable energy security) index for developing countries. Energy 2016, 94, 326–343. [Google Scholar] [CrossRef]
- Azzuni, A.; Breyer, C. Definitions and dimensions of energy security: A literature review. Wiley Interdiscip. Rev. Energy Environ. 2017, 7, e268. [Google Scholar] [CrossRef]
- Jaber, J.O.; Marahleh, G.; Dalabeeh, A. Emissions Reduction Resulting from Renewable Energy Projects in Jordan. J. Energy Technol. Policy 2019, 9. [Google Scholar] [CrossRef]
- Jaber, J.O.; Jaber, Q.M.; Sawalha, S.A.; Mohsen, M.S. Evaluation of conventional and renewable energy sources for space heating in the household sector. Renew. Sustain. Energy Rev. 2008, 12, 278–289. [Google Scholar] [CrossRef]
- Sachs, J.D.; Warner, A.M. The curse of natural resources. Eur. Econ. Rev. 2001, 45, 827–838. [Google Scholar] [CrossRef]
- Mehlum, H.; Moene, K.; Torvik, R. Cursed by resources or institutions? World Econ. 2006, 29, 1117–1131. [Google Scholar] [CrossRef]
- Van der Ploeg, F. Natural resources: Curse or blessing? J. Econ. Lit. 2011, 49, 366–420. [Google Scholar] [CrossRef] [Green Version]
- Ammari, H.D.; Al-Rwashdeh, S.S.; Al-Najideen, M.I. Evaluation of wind energy potential and electricity generation at five locations in Jordan. Sustain. Cities Soc. 2015, 15, 135–143. [Google Scholar] [CrossRef]
- Abu Hamed, T.; Bressler, L. Energy security in Israel and Jordan: The role of renewable energy sources. Renew. Energy 2019, 135, 378–389. [Google Scholar] [CrossRef]
- World Energy Council (WEC). World Energy Trilemma Index; World Energy Council: London, UK, 2019. [Google Scholar]
- Malkawi, S.; Azizi, D. A multi-criteria optimization analysis for Jordan’s energy mix. Energy 2017, 127, 680–696. [Google Scholar] [CrossRef]
- Alali, J. Jordan oil shale, availability, distribution, and investment opportunity. In Proceedings of the International Conference on Oil Shale: Recent Trends in Oil Shale, Amman, Jordan, 7–9 November 2006. [Google Scholar]
- Hrayshat, E.S. Analysis of Renewable Energy Situation in Jordan. Energy Sources Part B Econ. Plan. Policy 2007, 3, 89–102. [Google Scholar] [CrossRef]
- Hrayshat, E.S.; Al-Soud, M.S. Potential of solar energy development for water pumping in Jordan. Renew. Energy 2004, 29, 1393–1399. [Google Scholar] [CrossRef]
- Jaber, J.O.; Elkarmi, F.; Alasis, E.; Kostas, A. Employment of renewable energy in Jordan: Current status, SWOT and problem analysis. Renew. Sustain. Energy Rev. 2015, 49, 490–499. [Google Scholar] [CrossRef]
- Steiner, J.R. Energy Security in Jordan; Naval Postgraduate School: Monterey, CA, USA, 2015. [Google Scholar]
- Weinstein, M. Future Scenarios for Energy Security and Sustainable Desalination in Jordan. Master’s Thesis, KTH Royal Institute of Technology, Stockholm, Sweden, 2019. [Google Scholar]
- Jaber, J.O. Prospects and Challenges of Small Hydropower Development in Jordan. Jordan J. Mech. Ind. Eng. 2012, 6, 110–118. [Google Scholar]
- Jaber, J.O.; Amri, A.; Ibrahim, K. Experimental investigation of effects of oil shale composition on its calorific value and oil yield. Int. J. Oil Gas Coal Technol. 2011, 4, 307–321. [Google Scholar] [CrossRef]
- Besieso, M. Jordan’s commercial oil shale exploitation strategy. In Proceedings of the 27th Oil Shale Symposium, GoldenI, CO, USA, 15–19 October 2007. [Google Scholar]
- Ministry of Energy and Mineral Resources (MEMR). Annual Report 2018; MEMR: Amman, Jordan, 2018. Available online: https://www.memr.gov.jo/ebv4.0/root_storage/ar/eb_list_page/56dcb683-2146-4dfd-8a15-b0ce6904f501.pdf (accessed on 10 June 2020).
- Ministry of Energy and Mineral Resources (MEMR). Energy 2018—Facts & Figures; MEMR: Amman, Jordan, 2018. Available online: https://www.memr.gov.jo/ebv4.0/root_storage/en/eb_list_page/bruchure_2018.pdf (accessed on 10 June 2020).
- Ministry of Energy and Mineral Resources (MEMR). Energy 2019—Facts & Figures; MEMR: Amman, Jordan, 2019. Available online: https://www.memr.gov.jo/ebv4.0/root_storage/en/eb_list_page/bruchure_2019.pdf (accessed on 10 June 2020).
- Breyer, C.; Bogdanov, D.; Gulagi, A.; Aghahosseini, A.; Barbosa, L.S.N.S.; Koskinen, O.; Barasa, M.; Caldera, U.; Afanasyeva, S.; Child, M.; et al. On the role of solar photovoltaics in global energy transition scenarios. Prog. Photovolt. Res. Appl. 2017, 25, 727–745. [Google Scholar] [CrossRef]
- El-Anis, I. The political economy of energy security and nuclear energy in Jordan. Cent. Eur. J. Int. Secur. Stud. 2012, 6, 13–35. [Google Scholar]
- Augutis, J.; Krikstolaitis, R.; Martisauskas, L.; Peciulyte, S. Energy security level assessment technology. Appl. Energy 2012, 97, 143–149. [Google Scholar] [CrossRef]
- Kanchana, K.; Unesaki, H. ASEAN energy security: An indicator-based assessment. Energy Procedia 2014, 56, 163–171. [Google Scholar] [CrossRef] [Green Version]
- Kruyt, B.; van Vuuren, D.P.; de Vries, H.J.M.; Groenenberg, H. Indicators for energy security. Energy Policy 2009, 37, 2166–2181. [Google Scholar] [CrossRef]
- Radovanović, M.; Filipović, S.; Pavlović, D. Energy security measurement—A sustainable approach. Renew. Sustain. Energy Rev. 2017, 68, 1020–1032. [Google Scholar] [CrossRef]
- Alshwawra, A.; Almuhtady, A. Impact of Regional Conflicts on Energy Security in Jordan. Int. J. Energy Econ. Policy 2020, 10, 45–50. [Google Scholar] [CrossRef]
- Komendantova, N.; Ekenberg, L.; Marashdeh, L.; Al Salaymeh, A.; Danielson, M.; Linnerooth-Bayer, J. Are Energy Security Concerns Dominating Environmental Concerns? Evidence from Stakeholder Participation Processes on Energy Transition in Jordan. Climate 2018, 6, 88. [Google Scholar] [CrossRef] [Green Version]
- Ramana, M.V.; Ahmad, A. Wishful thinking and real problems: Small modular reactors, planning constraints, and nuclear power in Jordan. Energy Policy 2016, 93, 236–245. [Google Scholar] [CrossRef]
- Azzuni, A.; Breyer, C. Global Energy Security Index and Its Application on National Level. Energies 2020, 13, 2502. [Google Scholar] [CrossRef]
- Breyer, C.; Bogdanov, D.; Aghahosseini, A.; Gulagi, A.; Child, M.; Oyewo, A.S.; Farfan, J.; Sadovskaia, K.; Vainikka, P. Solar photovoltaics demand for the global energy transition in the power sector. Prog. Photovolt. Res. Appl. 2018, 26, 505–523. [Google Scholar] [CrossRef]
- Bogdanov, D.; Farfan, J.; Sadovskaia, K.; Aghahosseini, A.; Child, M.; Gulagi, A.; Oyewo, A.S.; de Souza Noel Simas Barbosa, L.; Breyer, C. Radical transformation pathway towards sustainable electricity via evolutionary steps. Nat. Commun. 2019, 10, 1077. [Google Scholar] [CrossRef] [PubMed] [Green Version]
- Bogdanov, D.; Toktarova, A.; Breyer, C. Transition towards 100% renewable power and heat supply for energy intensive economies and severe continental climate conditions: Case for Kazakhstan. Appl. Energy 2019, 253, 113606. [Google Scholar] [CrossRef]
- Ram, M.; Bogdanov, D.; Aghahosseini, A.; Oyewo, S.; Gulagi, A.; Child, M.; Fell, H.-J.; Breyer, C. Global Energy System Based on 100% Renewable Energy—Power Sector; Lappeenranta University of Technology: Lappeenranta, Finland; Energy Watch Group: Berlin, Germany, 2017. [Google Scholar]
- Toktarova, A.; Gruber, L.; Hlusiak, M.; Bogdanov, D.; Breyer, C. Long term load projection in high resolution for all countries globally. Int. J. Electr. Power Energy Syst. 2019, 111, 160–181. [Google Scholar] [CrossRef]
- Khalili, S.; Rantanen, E.; Bogdanov, D.; Breyer, C. Global Transportation Demand Development with Impacts on the Energy Demand and Greenhouse Gas Emissions in a Climate-Constrained World. Energies 2019, 12, 3870. [Google Scholar] [CrossRef] [Green Version]
- Caldera, U.; Breyer, C. Strengthening the global water supply through a decarbonised global desalination sector and improved irrigation systems. Energy 2020, 200, 117507. [Google Scholar] [CrossRef]
- Bunzel, K.; Zeller, V.; Buchhorn, M.; Griem, F.; Thrän, D. Regionale und Globale Räumliche Verteilung von Biomassepotenzialen; German Biomass Research Center: Leipzig, Germany, 2009. [Google Scholar]
- Aghahosseini, A.; Bogdanov, D.; Breyer, C. A Techno-Economic Study of an Entirely Renewable Energy-Based Power Supply for North America for 2030 Conditions. Energies 2017, 10, 1171. [Google Scholar] [CrossRef] [Green Version]
- Farfan, J.; Breyer, C. Structural changes of global power generation capacity towards sustainability and the risk of stranded investments supported by a sustainability indicator. J. Clean. Prod. 2017, 141, 370–384. [Google Scholar] [CrossRef]
- United Nations Framework Convention on Climate Change (UNFCCC). Adoption of the Paris Agreement—Proposal by the President; United Nations Framework Convention on Climate Change: Paris, France, 2015; Available online: https://unfccc.int/resource/docs/2015/cop21/eng/l09.pdf (accessed on 10 June 2020).
- United Nations (UN). Sustainable Development Goals Knowledge Platform; United Nations: New York, NY, USA, 2015; Available online: https://sustainabledevelopment.un.org/sdgs (accessed on 10 June 2020).
- International Panel on Climate Change (IPCC). IPCC—Special Report on 1.5 Degrees; International Panel on Climate Change: Geneva, Switzerland, 2018; Available online: http://www.ipcc.ch/report/sr15 (accessed on 10 June 2020).
- United Nations (UN). World Population Prospects: The 2015 Revision, Key Findings and Advance Tables; Working Paper No. ESA/P/WP.241; The Department of Economic and Social Affairs of the United Nations Secretariat: New York, NY, USA, 2015; Available online: https://population.un.org/wpp/publications/files/key_findings_wpp_2015.pdf (accessed on 10 June 2020).
- Caldera, U.; Breyer, C. Learning Curve for Seawater Reverse Osmosis Desalination Plants: Capital Cost Trend of the Past, Present, and Future. Water Resour. Res. 2017, 53, 10523–10538. [Google Scholar] [CrossRef] [Green Version]
- International Labour Office (ILO). Employment Impact of Infrastructure Investment in Jordan—Employment Research Brief; International Labour Office: Geneva, Switzerland, 2016; Available online: https://www.ilo.org/wcmsp5/groups/public/---ed_emp/documents/publication/wcms_575884.pdf (accessed on 10 June 2020).
- Ram, M.; Osario, J.; Aghahosseini, A.; Breyer, C. Job creation during the global energy transition towards 100% renewable energy across the power, heat, transport and desalination sectors by 2050. Furthcoming 2020, 151, 119682. [Google Scholar]
- Cote, S. Renewable Energy and Employment: The Experience of Egypt, Jordan and Morocco; King Abdullah Petroleum Studies and Research Center: Riyadh, Saudi Arabia, 2019. [Google Scholar]
- Anagreh, Y.; Bataineh, A. Renewable energy potential assessment in Jordan. Renew. Sustain. Energy Rev. 2011, 15, 2232–2239. [Google Scholar] [CrossRef]
- Østergaard, P.A.; Lund, H.; Mathiesen, B.V. Energy system impacts of desalination in Jordan. Int. J. Sustain. Energy Plan. Manag. 2014, 1, 29–40. [Google Scholar] [CrossRef]
- Caldera, U.; Bogdanov, D.; Afanasyeva, S.; Breyer, C. Role of seawater desalination in the management of an integrated water and 100% renewable energy based power sector in Saudi Arabia. Water 2018, 10, 3. [Google Scholar] [CrossRef] [Green Version]
- Caldera, U.; Bogdanov, D.; Fasihi, M.; Aghahosseini, A.; Breyer, C. Securing future water supply for Iran through 100% renewable energy powered desalination. Int. J. Sustain. Energy Plan. Manag. 2019, 23, 39–54. [Google Scholar] [CrossRef]
- Aghahosseini, A.; Bogdanov, D.; Breyer, C. Towards sustainable development in the MENA region: Analysing the feasibility of a 100% renewable electricity system in 2030. Energy Strategy Rev. 2020, 28, 100466. [Google Scholar] [CrossRef]
- Kiwan, S.; Al-Gharibeh, E. Jordan toward a 100% renewable electricity system. Renew. Energy 2020, 147, 423–436. [Google Scholar] [CrossRef]
- Anagreh, Y.; Bataineh, A.; Al-Odat, M. Assessment of renewable energy potential, at Aqaba in Jordan. Renew. Sustain. Energy Rev. 2010, 14, 1347–1351. [Google Scholar] [CrossRef]
- Kilickaplan, A.; Bogdanov, D.; Peker, O.; Caldera, U.; Aghahosseini, A.; Breyer, C. An energy transition pathway for Turkey to achieve 100% renewable energy powered electricity, desalination and non-energetic industrial gas demand sectors by 2050. Sol. Energy 2017, 158, 218–235. [Google Scholar] [CrossRef]
- Solomon, A.A.; Bogdanov, D.; Breyer, C. Solar driven net zero emission electricity supply with negligible carbon cost: Israel as a case study for Sun Belt countries. Energy 2018, 155, 87–104. [Google Scholar] [CrossRef]
- Ghorbani, N.; Aghahosseini, A.; Breyer, C. Assessment of a cost-optimal power system fully based on renewable energy for Iran by 2050—Achieving zero greenhouse gas emissions and overcoming the water crisis. Renew. Energy 2020, 146, 125–148. [Google Scholar] [CrossRef]
- Ghorbani, N.; Aghahosseini, A.; Breyer, C. Transition towards a 100% Renewable Energy System and the Role of Storage Technologies: A Case Study of Iran. Energy Procedia 2017, 135, 23–36. [Google Scholar] [CrossRef]
- Aghahosseini, A.; Bogdanov, D.; Ghorbani, N.; Breyer, C. Analysis of 100% renewable energy for Iran in 2030: Integrating solar PV, wind energy and storage. Int. J. Environ. Sci. Technol. 2018, 15, 17–36. [Google Scholar] [CrossRef]
- Osorio-Aravena, J.C.; Aghahosseini, A.; Bogdanov, D.; Caldera, U.; Muñoz-Cerón, E.; Breyer, C. The role of solar PV, wind energy, and storage technologies in the transition toward a fully sustainable energy system in Chile by 2050 across power, heat, transport and desalination sectors. Int. J. Sustain. Energy Plan. Manag. 2020, 25, 77–94. [Google Scholar] [CrossRef]
- Brown, M.A.; Wang, Y.; Sovacool, B.K.; D’Agostino, A.L. Forty years of energy security trends: A comparative assessment of 22 industrialized countries. Energy Res. Soc. Sci. 2014, 4, 64–77. [Google Scholar] [CrossRef]
- Rademaekers, K.; Yearwood, J.; Ferreira, A.; Pye, S.; Hamilton, I.; Agnolucci, P.; Grover, D.; Karásek, J.; Anisimova, N. Selecting Indicators to Measure Energy Poverty; European Commission, DG Energy: Rotterdam, The Netherlands, 2016. [Google Scholar]
- Lohrmann, A.; Farfan, J.; Caldera, U.; Lohrmann, C.; Breyer, C. Global scenarios for significant water use reduction in thermal power plants based on cooling water demand estimation using satellite imagery. Nat. Energy 2019, 4, 1040–1048. [Google Scholar] [CrossRef]
- Johansson, T.B.; Nakićenović, N. Global Energy Assessment: Toward a Sustainable Future; Cambridge University Press: Cambridge, UK, 2012. [Google Scholar]
- Epstein, P.R.; Buonocore, J.J.; Eckerle, K.; Hendryx, M.; Stout Iii, B.M.; Heinberg, R.; Clapp, R.W.; May, B.; Reinhart, N.L.; Ahern, M.M. Full cost accounting for the life cycle of coal. Ann. N. Y. Acad. Sci. 2011, 1219, 73–98. [Google Scholar] [CrossRef] [PubMed]
- Lovins, A.B.; Lovins, L.H. Energy Policies for Resilience and National Security; Council on Environmental Quality, Executive Office of the President: Washington, DC, USA, 1981.
- Kumar, S.; Goteti, N.S.; Savargaonkar, P. Co-benefit technologies, green jobs, and national innovation systems. In Managing the Transition to a Low-Carbon Economy: Perspectives, Policies, and Practices from Asia; Lohani, B.N., Kawai, M., Anbumozhi, V., Eds.; Asian Development Bank Institute: Tokyo, Japan, 2016; pp. 149–173. [Google Scholar]
- Emodi, N.V.; Chaiechi, T.; Beg, A.B.M.R.A. The impact of climate variability and change on the energy system: A systematic scoping review. Sci. Total Environ. 2019, 676, 545–563. [Google Scholar] [CrossRef] [PubMed]
Figure 1.
Fundamental structure of the LUT Energy System Transition model [
67,
69].
Figure 1.
Fundamental structure of the LUT Energy System Transition model [
67,
69].
Figure 2.
Schematic of the LUT Energy System Transition model for the power and heat sectors [
68]. Abbreviations: A-CAES—adiabatic compressed air energy storage, CHP—combined heat and power, CSP—concentrated solar thermal power, GT—gas turbine, ICE—internal combustion engine, PHES—pumped hydro energy storage, PP—power plant, PtG—power-to-gas, PtH—power-to-heat, PV—photovoltaic, ST—steam turbine, TES—thermal energy storage.
Figure 3.
Development of the final energy demand by the energy form (a) and by the sector (b) for Jordan.
Figure 3.
Development of the final energy demand by the energy form (a) and by the sector (b) for Jordan.
Figure 4.
Development of the primary energy demand by the form of energy (
a), sector-wise (
b), the efficiency gain in primary energy demand (
c) and the electricity consumption per capita (
d) through the transition for Jordan. The displayed population, taken from the UN [
79], excludes non-permanent refugees.
Figure 5.
Development of the electricity generation capacity (a) and the heat generation capacity (b) in the integrated heat and power sector from 2015 to 2050 for Jordan.
Figure 5.
Development of the electricity generation capacity (a) and the heat generation capacity (b) in the integrated heat and power sector from 2015 to 2050 for Jordan.
Figure 6.
Development of the electricity storage capacity (a) and the heat storage capacity (b) in the integrated heat and power sector from 2015 to 2050 for Jordan. Abbreviations: HT—high temperature, DH—district heating.
Figure 6.
Development of the electricity storage capacity (a) and the heat storage capacity (b) in the integrated heat and power sector from 2015 to 2050 for Jordan. Abbreviations: HT—high temperature, DH—district heating.
Figure 7.
Final energy demand for transport (a) and the electricity demand for sustainable transport (b) during the energy transition for Jordan.
Figure 7.
Final energy demand for transport (a) and the electricity demand for sustainable transport (b) during the energy transition for Jordan.
Figure 8.
Installed power generation capacity (a) and the electricity generation (b) for the transport sector from 2015 to 2050 for Jordan.
Figure 8.
Installed power generation capacity (a) and the electricity generation (b) for the transport sector from 2015 to 2050 for Jordan.
Figure 9.
Installed capacity for fuel conversion (a) and heat management for the production of synthetic fuels (b).
Figure 9.
Installed capacity for fuel conversion (a) and heat management for the production of synthetic fuels (b).
Figure 10.
Installed desalination capacity (bar graph, left axis) and the total water demand (line plot, right axis) (a), and the levelised cost of water (LCOW) (b) during the energy transition for Jordan. Abbreviations: MSF—multi-stage flash distillation, MED—multiple-effect distillation.
Figure 10.
Installed desalination capacity (bar graph, left axis) and the total water demand (line plot, right axis) (a), and the levelised cost of water (LCOW) (b) during the energy transition for Jordan. Abbreviations: MSF—multi-stage flash distillation, MED—multiple-effect distillation.
Figure 11.
Installed electricity generation capacity (a) and the electricity generation (b) for the desalination sector from 2015 to 2050 for Jordan. Abbreviations: CSP: concentrated solar thermal power, CCGT—combined cycle gas turbine, OCGT—open cycle gas turbine.
Figure 11.
Installed electricity generation capacity (a) and the electricity generation (b) for the desalination sector from 2015 to 2050 for Jordan. Abbreviations: CSP: concentrated solar thermal power, CCGT—combined cycle gas turbine, OCGT—open cycle gas turbine.
Figure 12.
Total annual energy system cost (a) and the levelised cost of energy for all the sectors combined (b) from 2015 to 2050 for Jordan.
Figure 12.
Total annual energy system cost (a) and the levelised cost of energy for all the sectors combined (b) from 2015 to 2050 for Jordan.
Figure 13.
Total GHG emissions by sector during the energy transition from 2015 to 2050. The tank-to-wheel (TTW) approach [
71] indicates that the emissions of the final conversion are regarded, while further emissions may occur in the upstream value chain.
Figure 13.
Total GHG emissions by sector during the energy transition from 2015 to 2050. The tank-to-wheel (TTW) approach [
71] indicates that the emissions of the final conversion are regarded, while further emissions may occur in the upstream value chain.
Figure 14.
Jobs created by the various energy system technologies (left) and the jobs created based on different categories with the development of electricity-demand-specific jobs (right) during the transition from 2015 to 2050 in Jordan. Abbreviations: Mfg.—manufacturing, C&I—construction and installation, O&M—operation and maintenance, Decom.—decommissioning, T&D—transmission and distribution, Spec. Jobs—electricity-demand-specific jobs.
Table 1.
Jordanian energy system overview for 2018. Data are obtained from [
53].
Table 1.
Jordanian energy system overview for 2018. Data are obtained from [
53].
| Item | Unit | Value |
|---|
| Population | million | 10.31 |
| Energy intensity | MWh/kUSD fixed price | 2.7 |
| Energy consumption per capita | MWh | 11.0 |
| Electricity consumption per capita | kWhel/capita | 1701 |
| Population access to electricity | % of population | 99% |
| Total electricity consumption | TWh | 17.5 |
| Primary energy consumption | TWh | 113 |
| Energy imports | % | 94% |
| Cost of consumed energy * | bUSD (bJOD) | 4.25 (3.01) |
Table 2.
Parameters for the availability and diversity dimensions.
Table 2.
Parameters for the availability and diversity dimensions.
| Dimensions | Parameters |
|---|
| Availability | Existence of resources |
| Existence of consumers |
| Existence of means of transport (access) |
| Diversity | Diversity of sources |
| Diversity of fuels (energy carriers) |
| Diversity of means (technologies, transportation) |
| Diversity of consumers |
Table 3.
Parameters for the environment and health dimensions.
Table 3.
Parameters for the environment and health dimensions.
| Dimensions | Parameters |
|---|
| Environment | Exploration rate and resources’ location |
| Extraction and transportation methods |
| Outcomes from energy use |
| Impact resulting from environmental change |
| Relationship to water |
| Health | Impact of people’s health on the energy system |
| Impact of the energy system on health of (energy sector workers, consumers, and international society) |
Table 4.
Summary of the energy transition impacts on energy security.
Table 4.
Summary of the energy transition impacts on energy security.
| Dimensions | Availability | Diversity | Cost | Environment | Health | Employment |
|---|
| Impact | + + + + | + + + − − − | + + + + + − + | + + + + + | + + | + + |
© 2020 by the authors. Licensee MDPI, Basel, Switzerland. This article is an open access article distributed under the terms and conditions of the Creative Commons Attribution (CC BY) license (http://creativecommons.org/licenses/by/4.0/).

 ,
, 


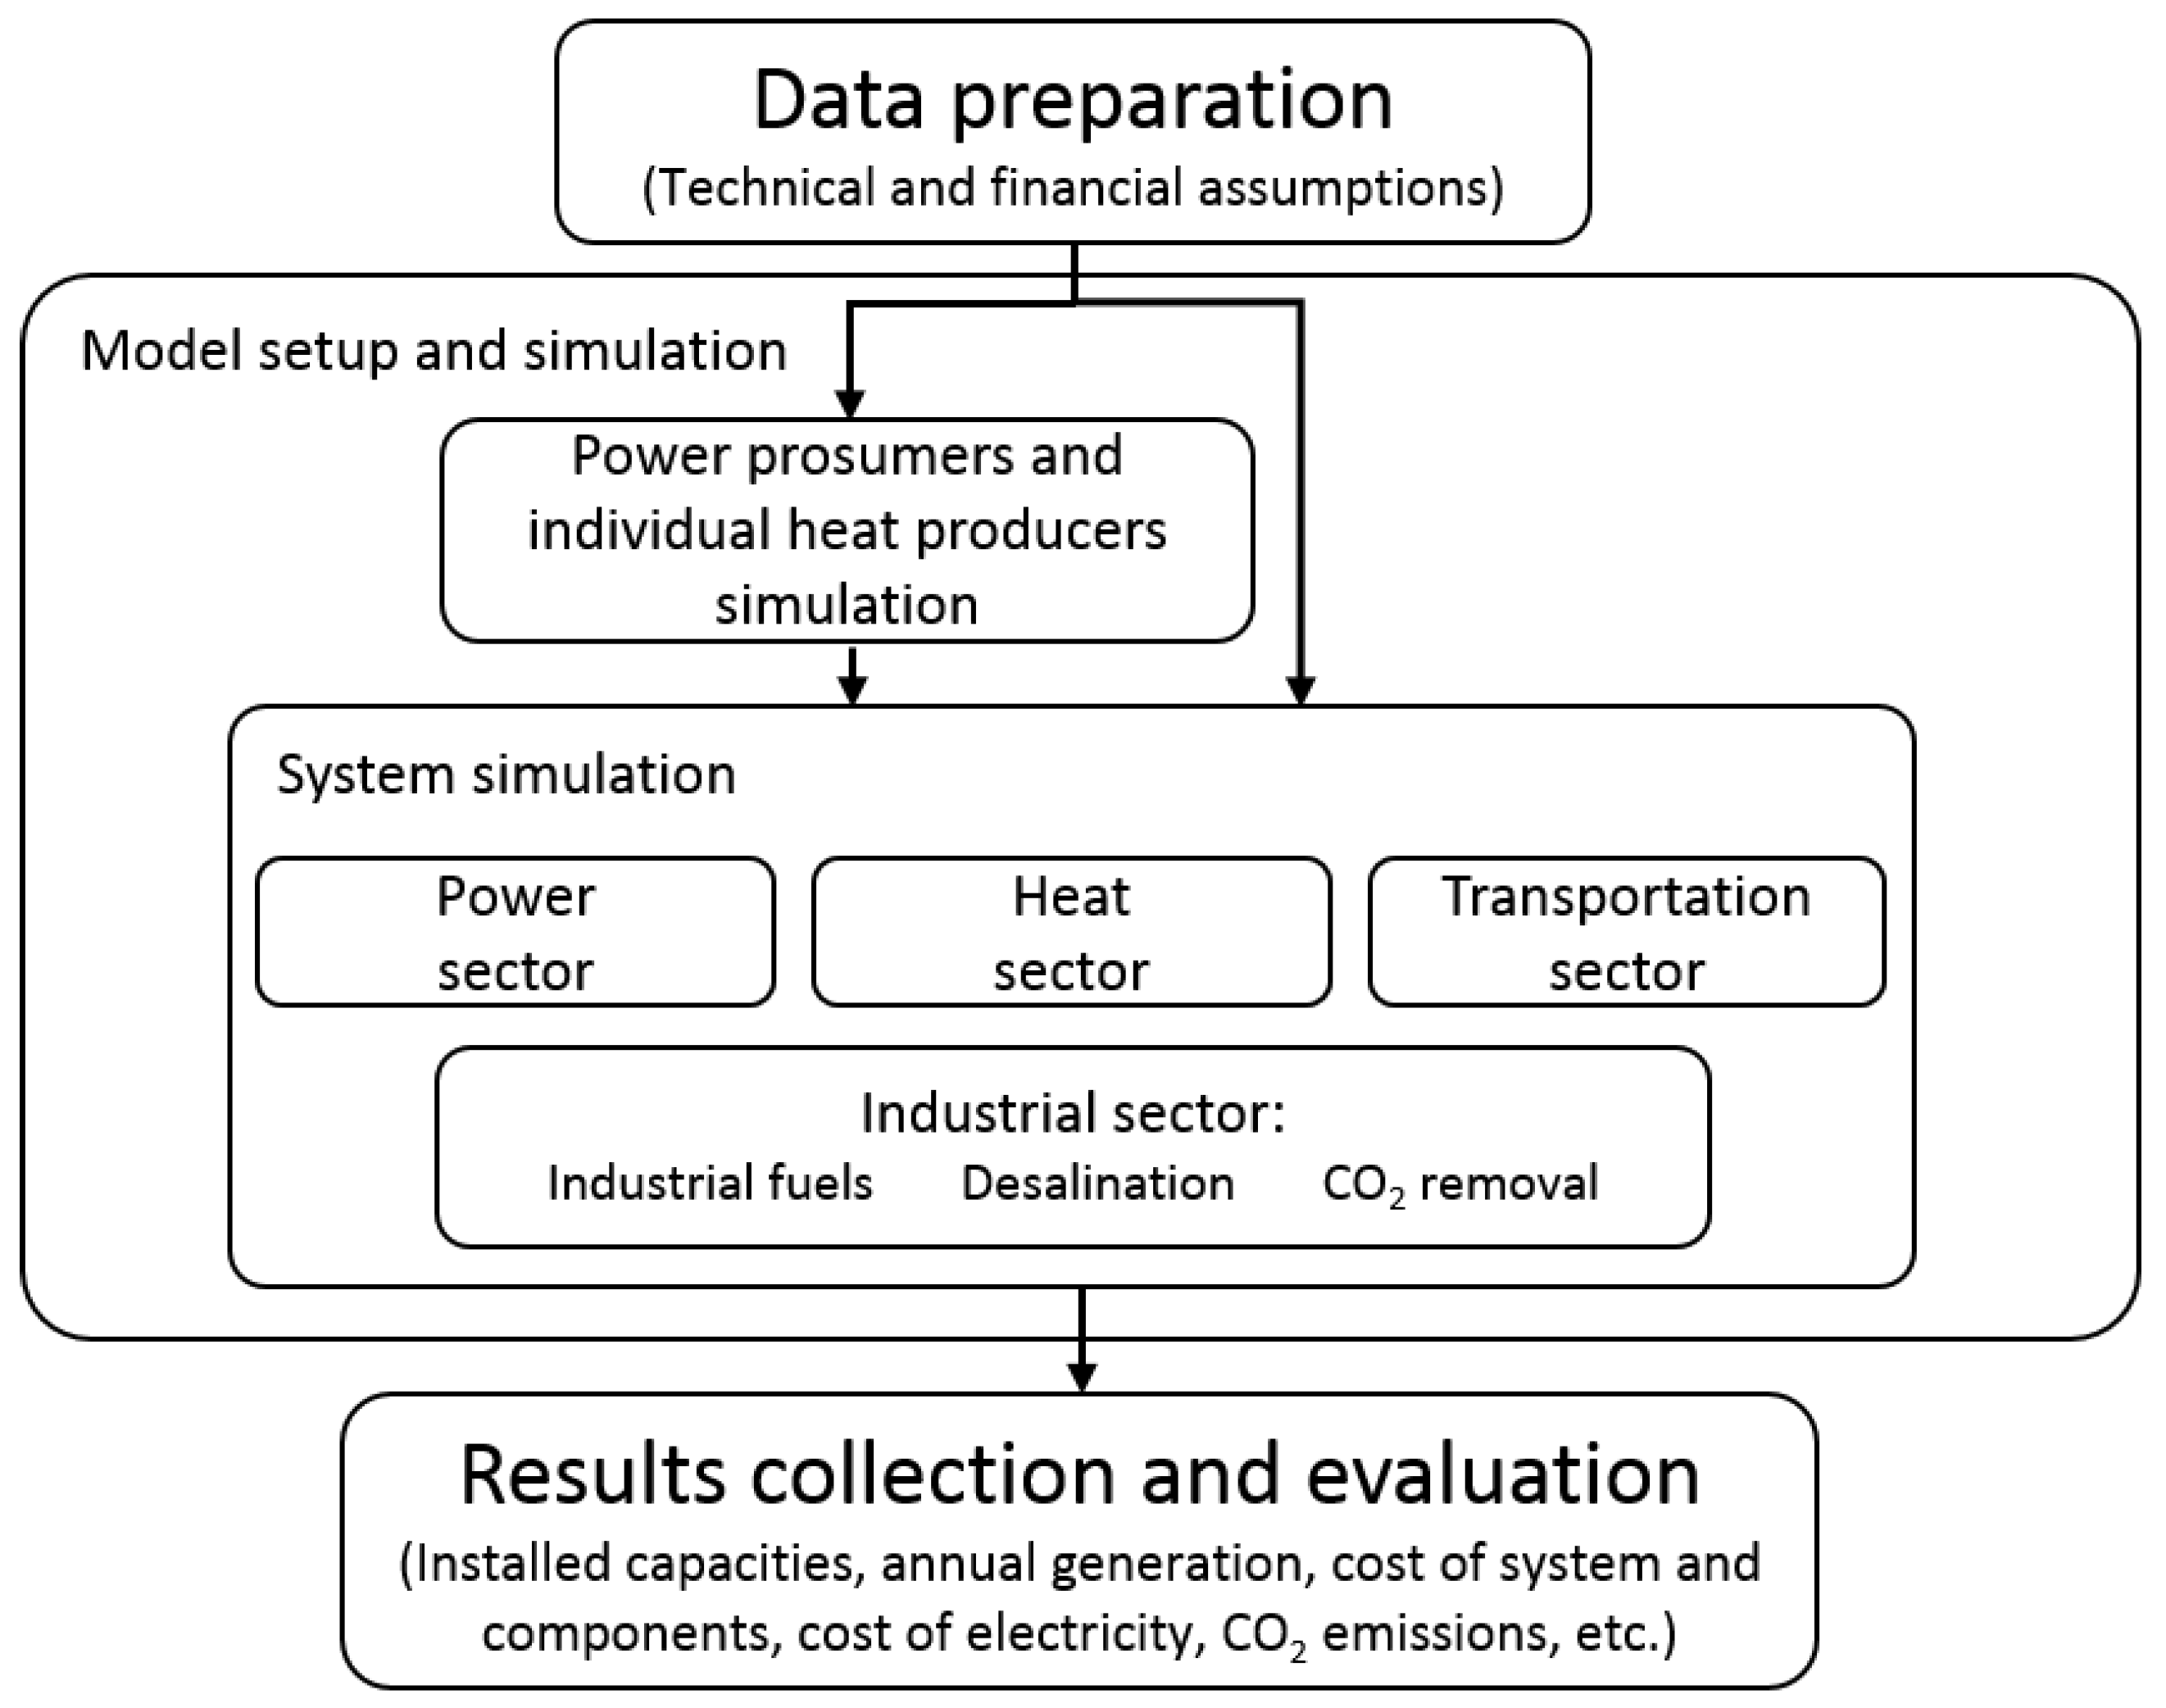
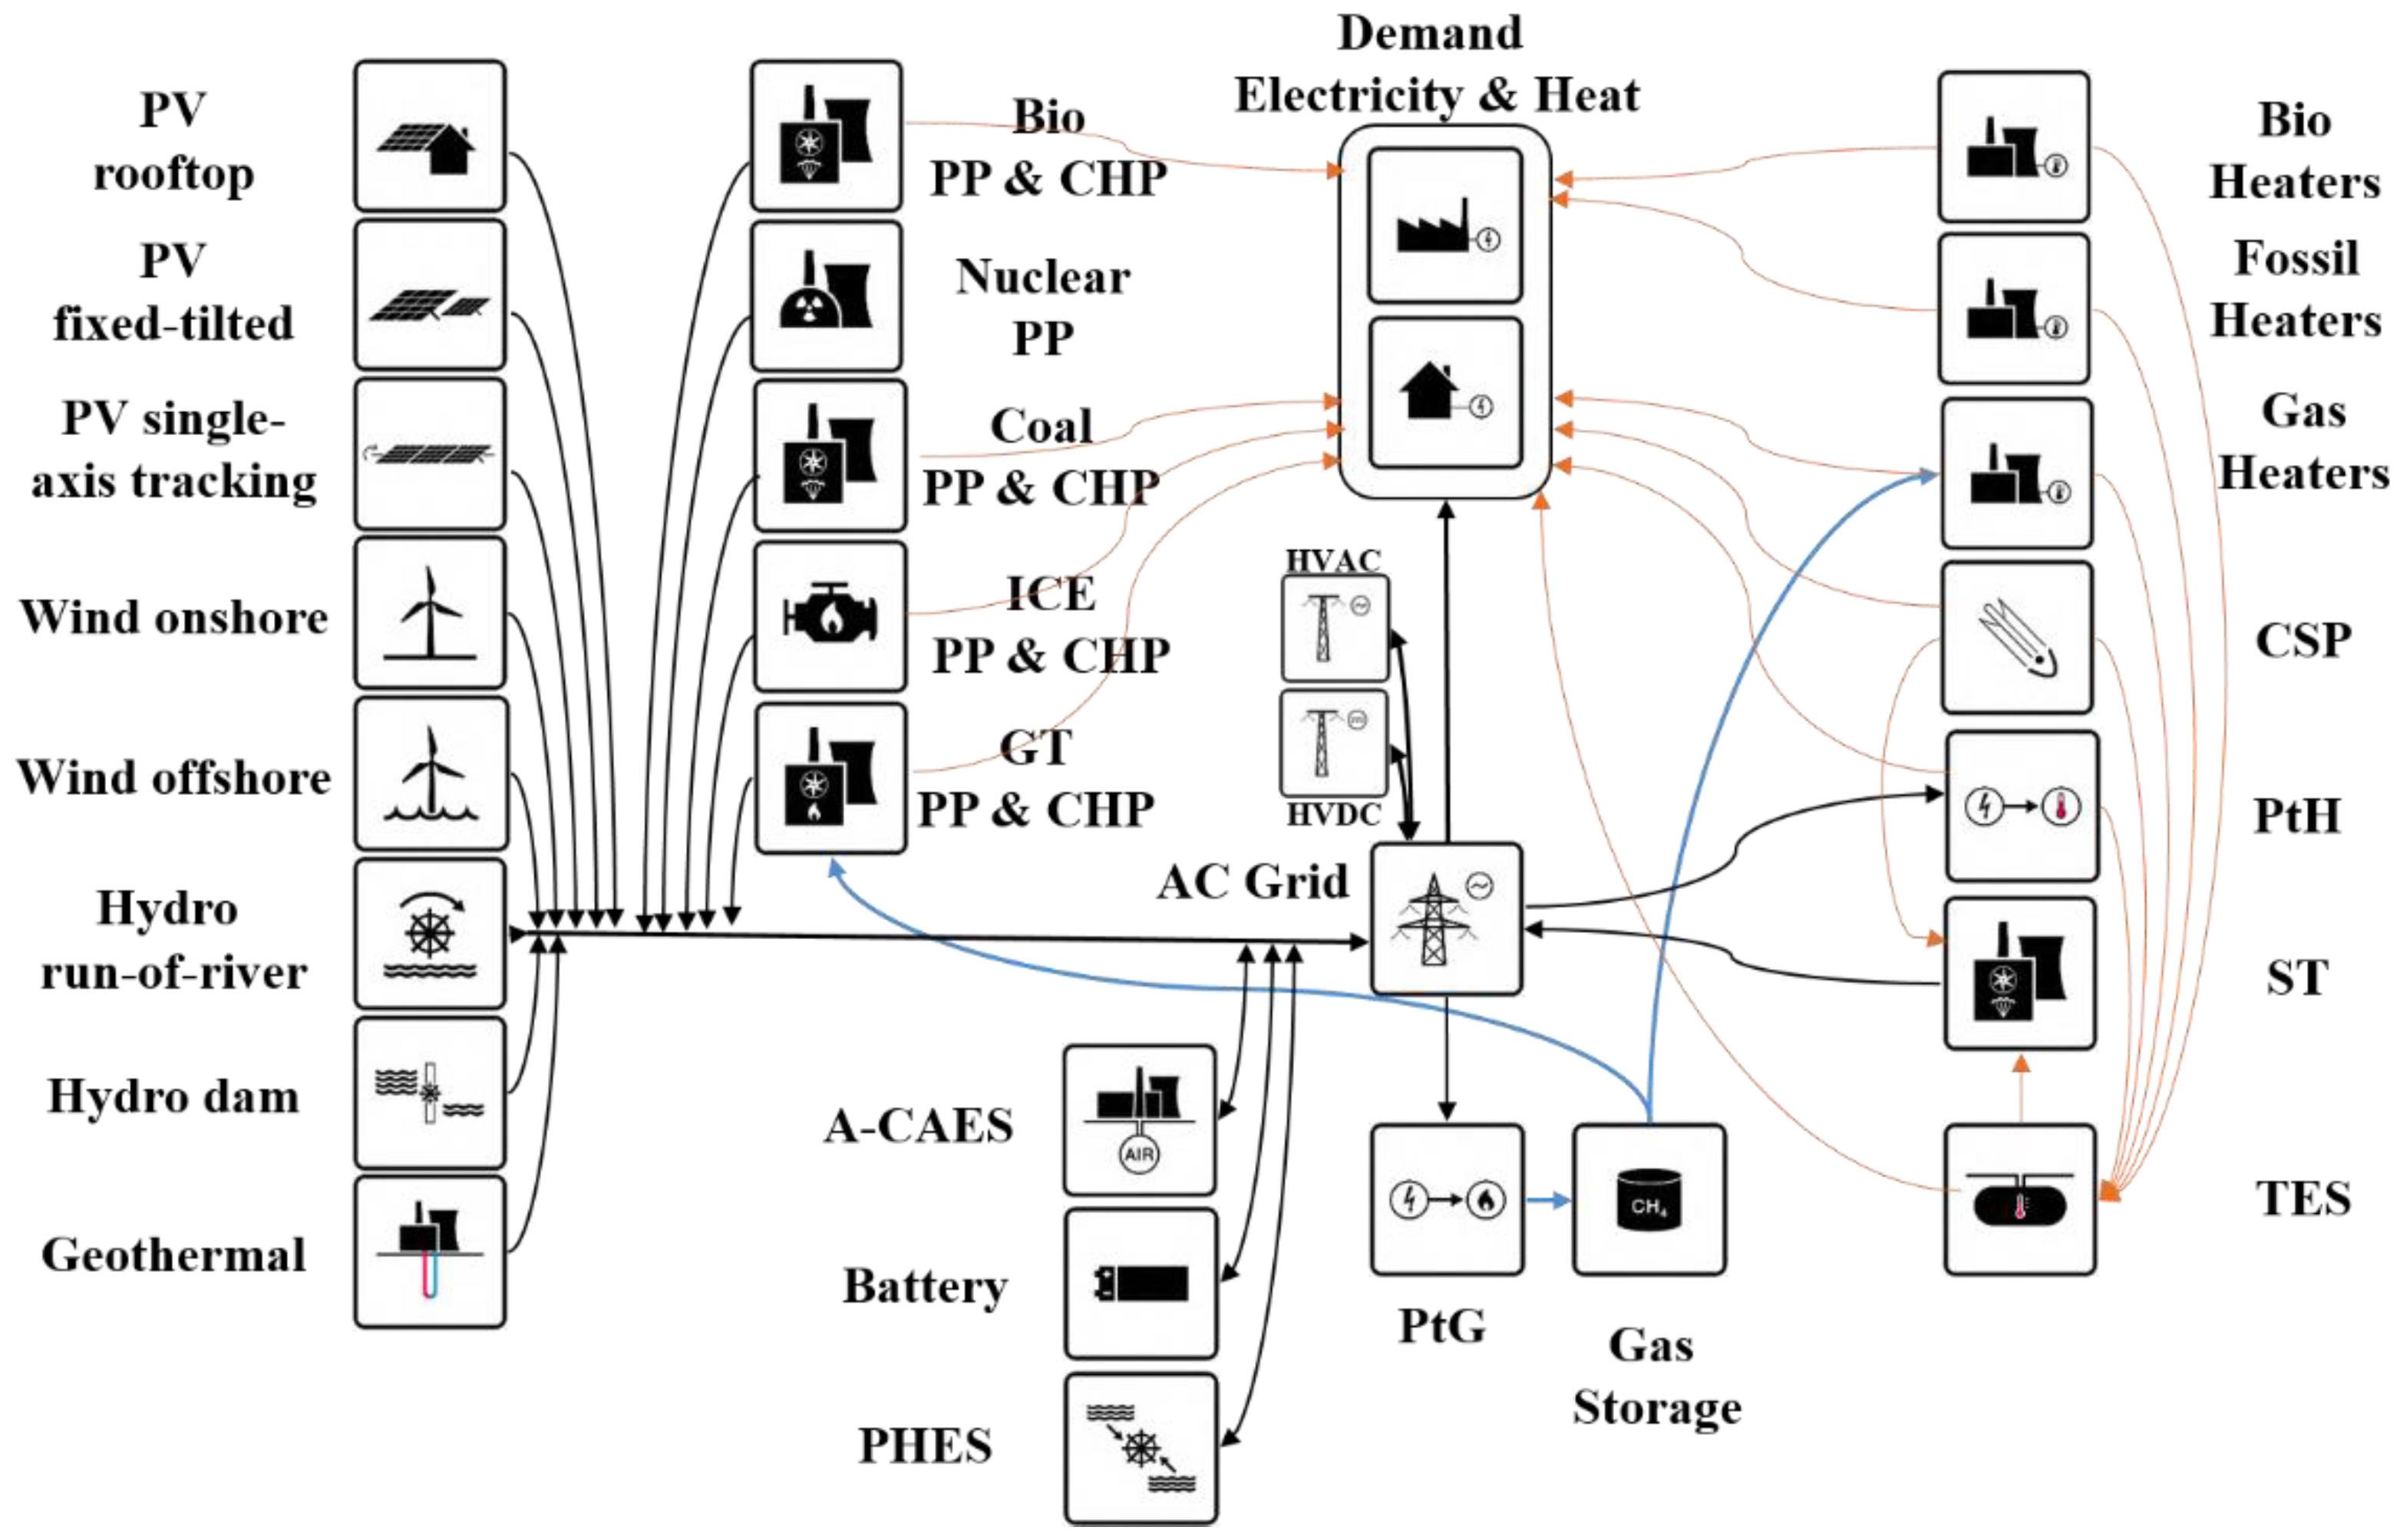
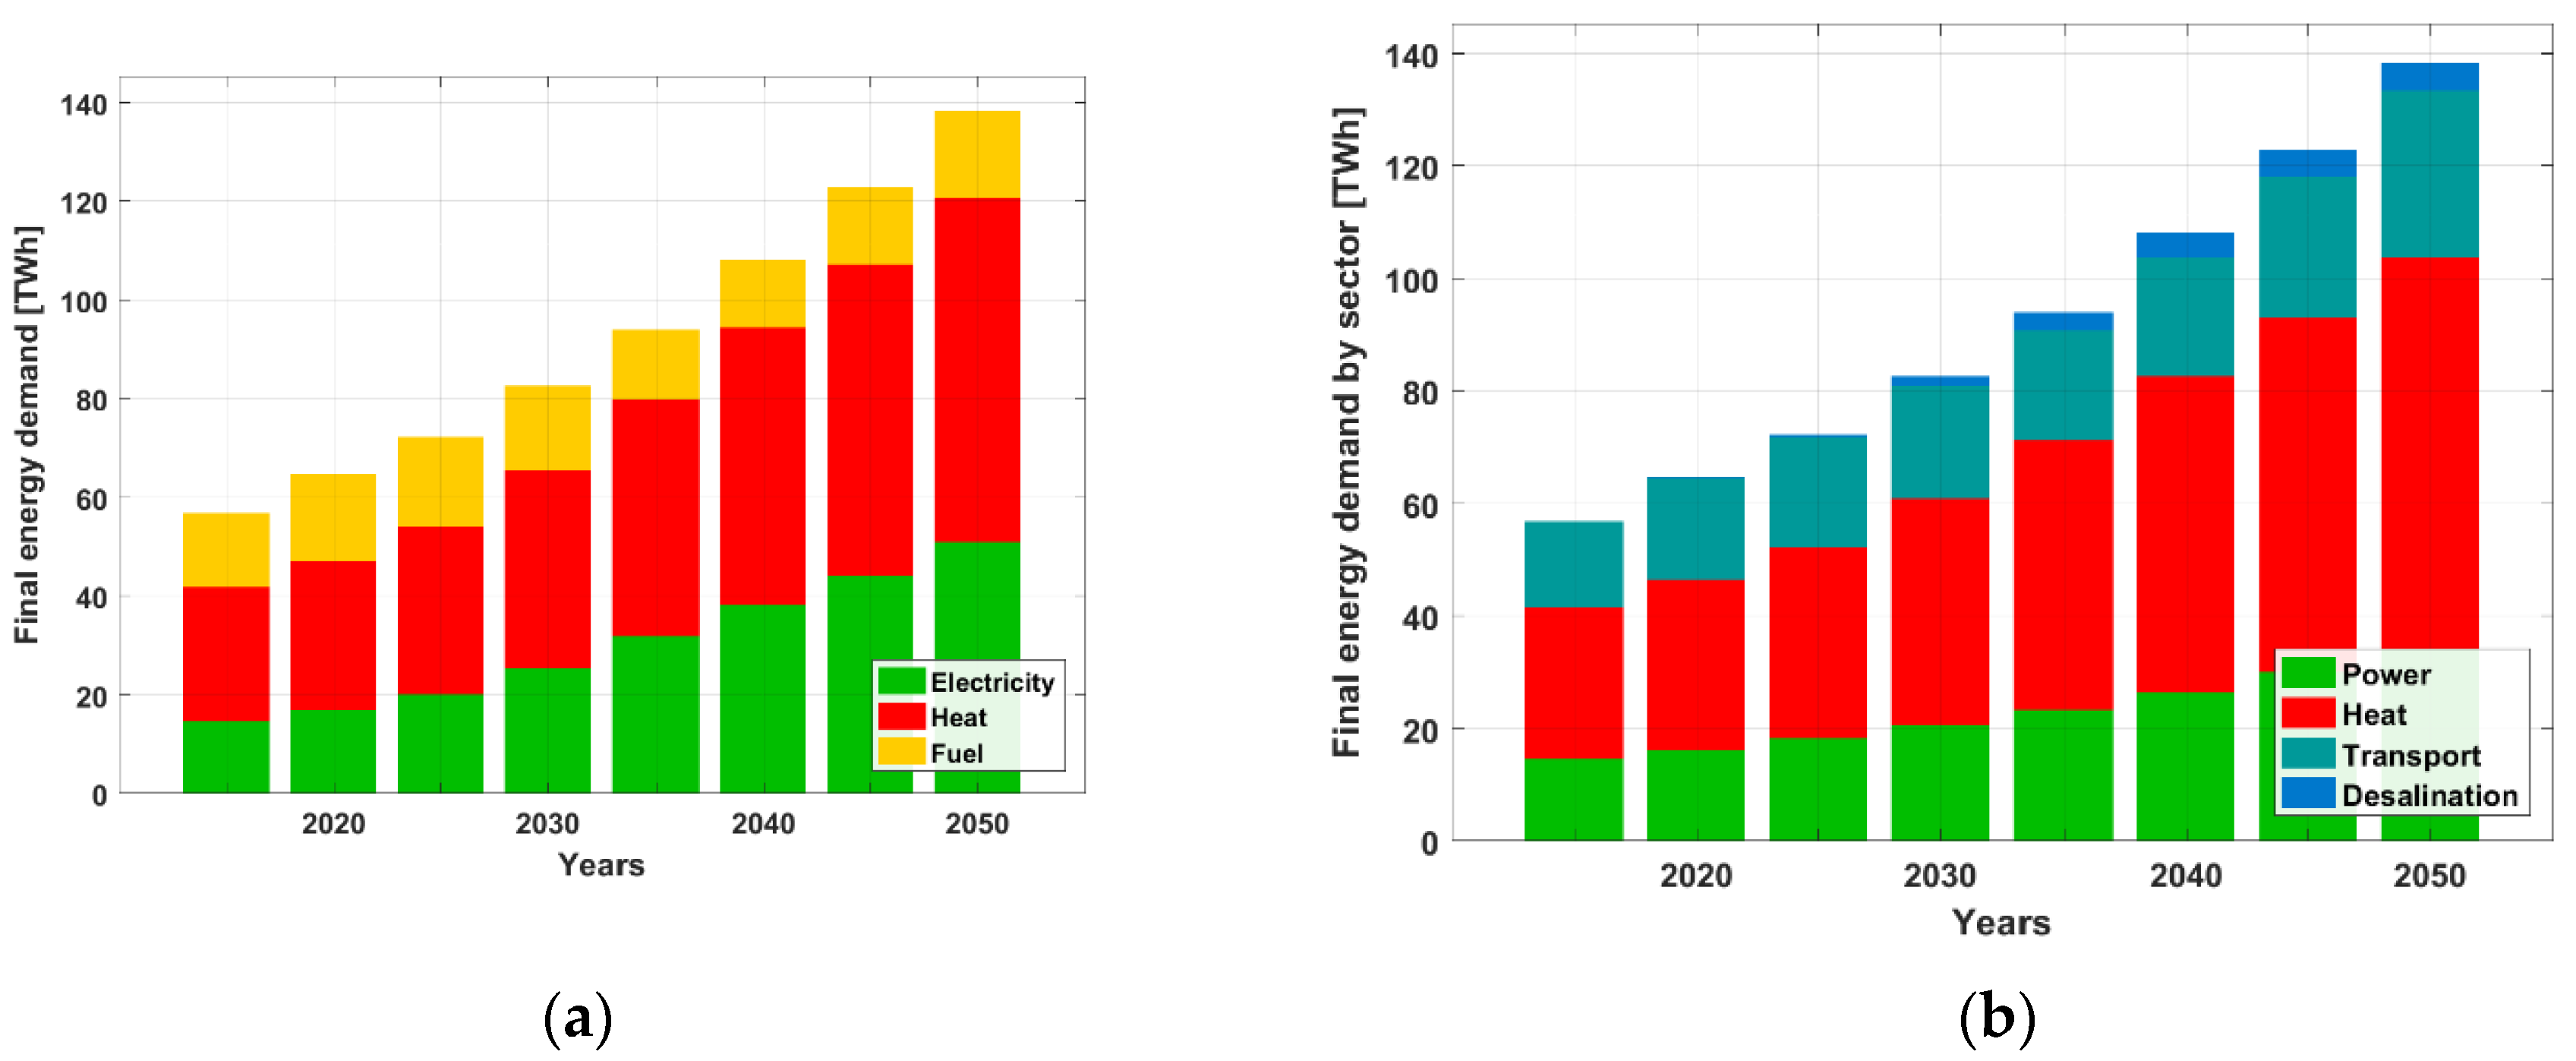
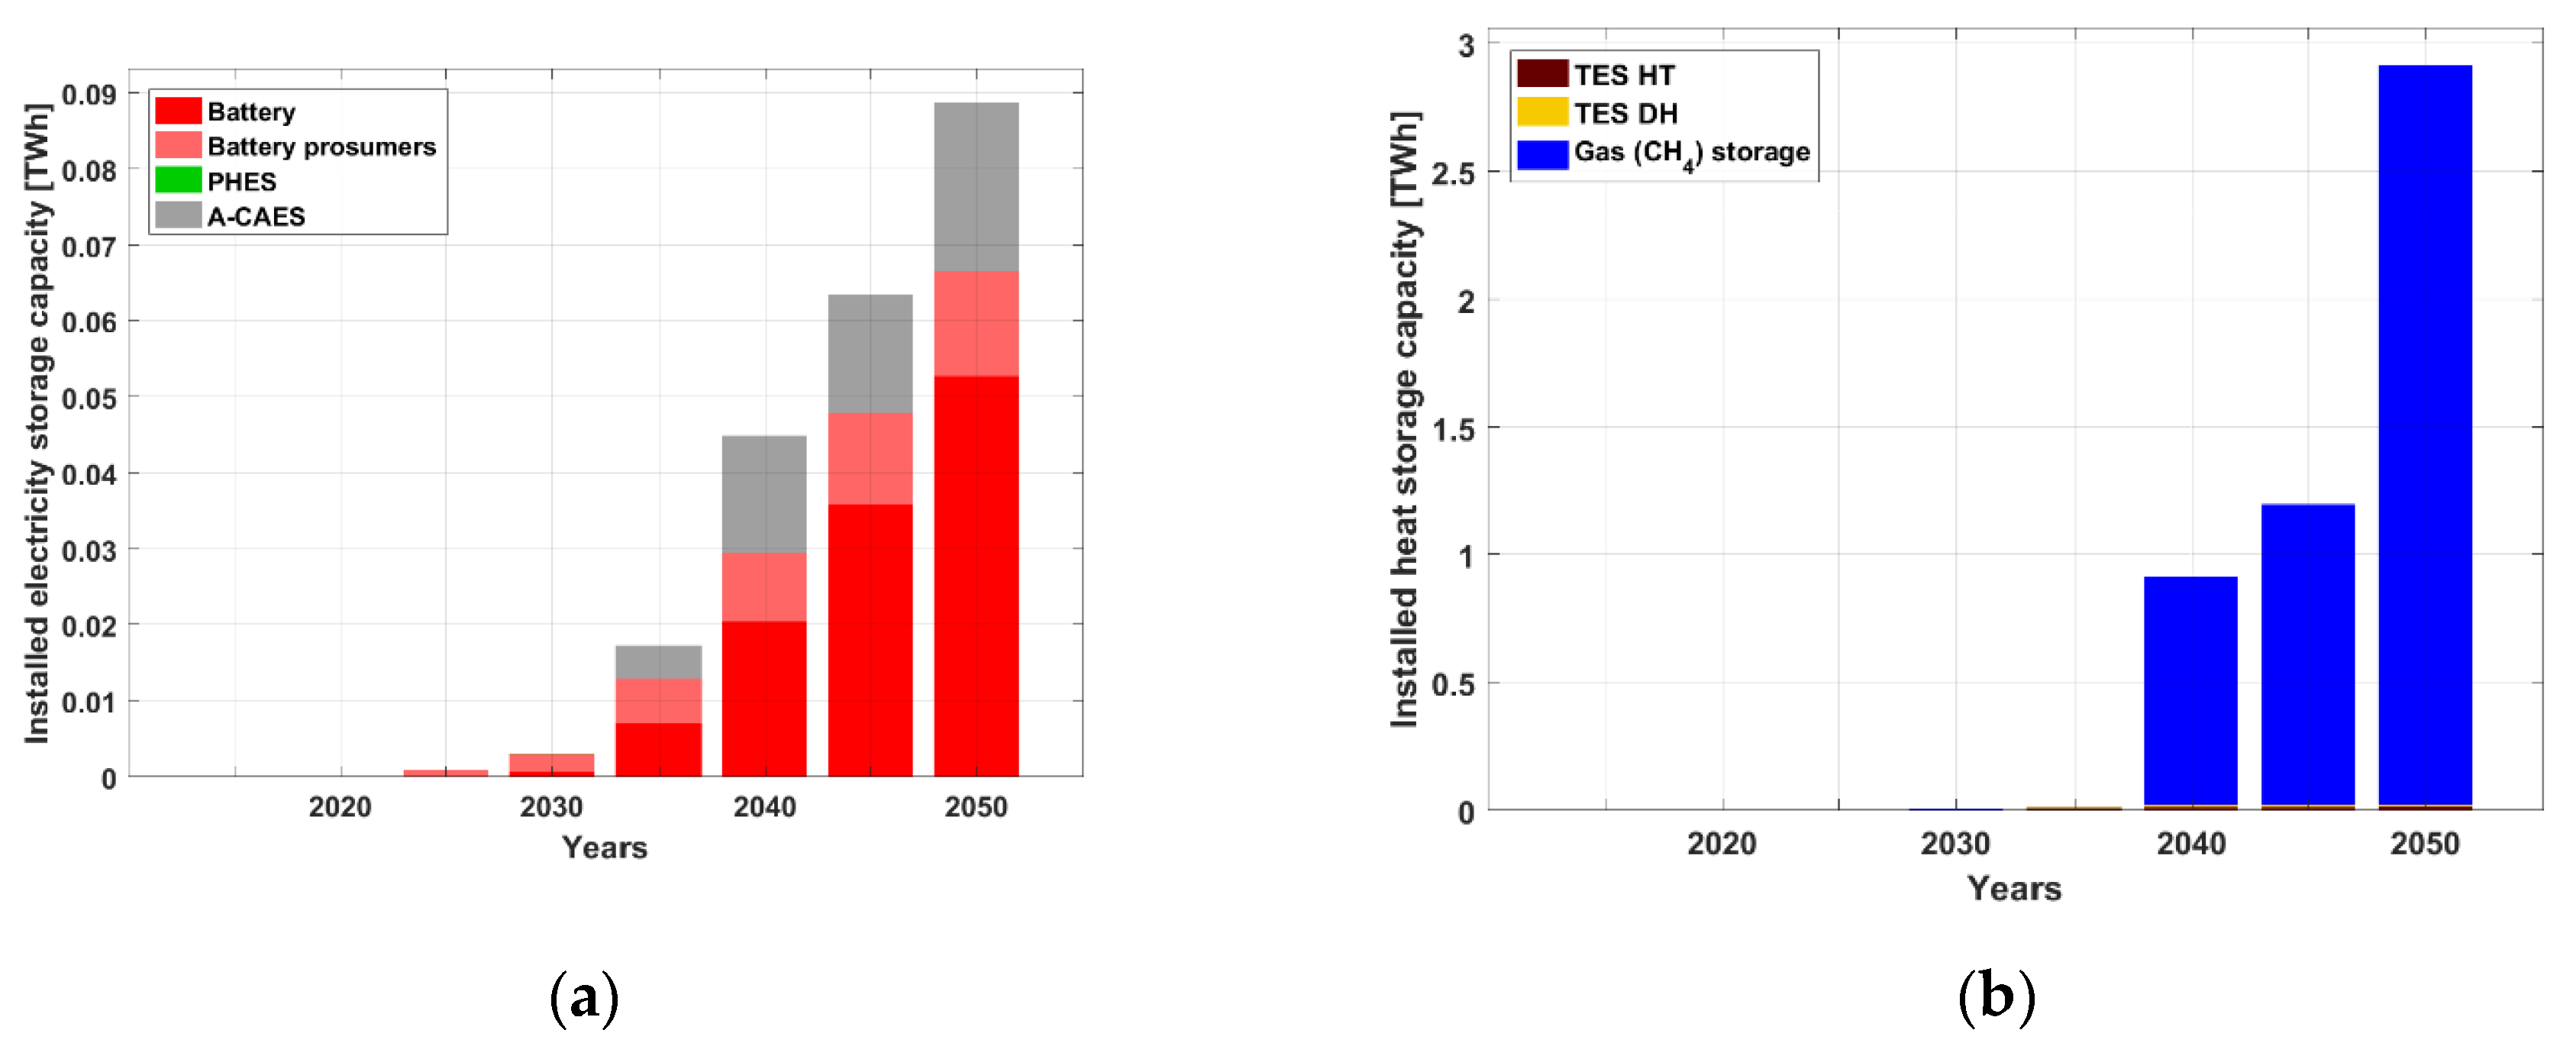
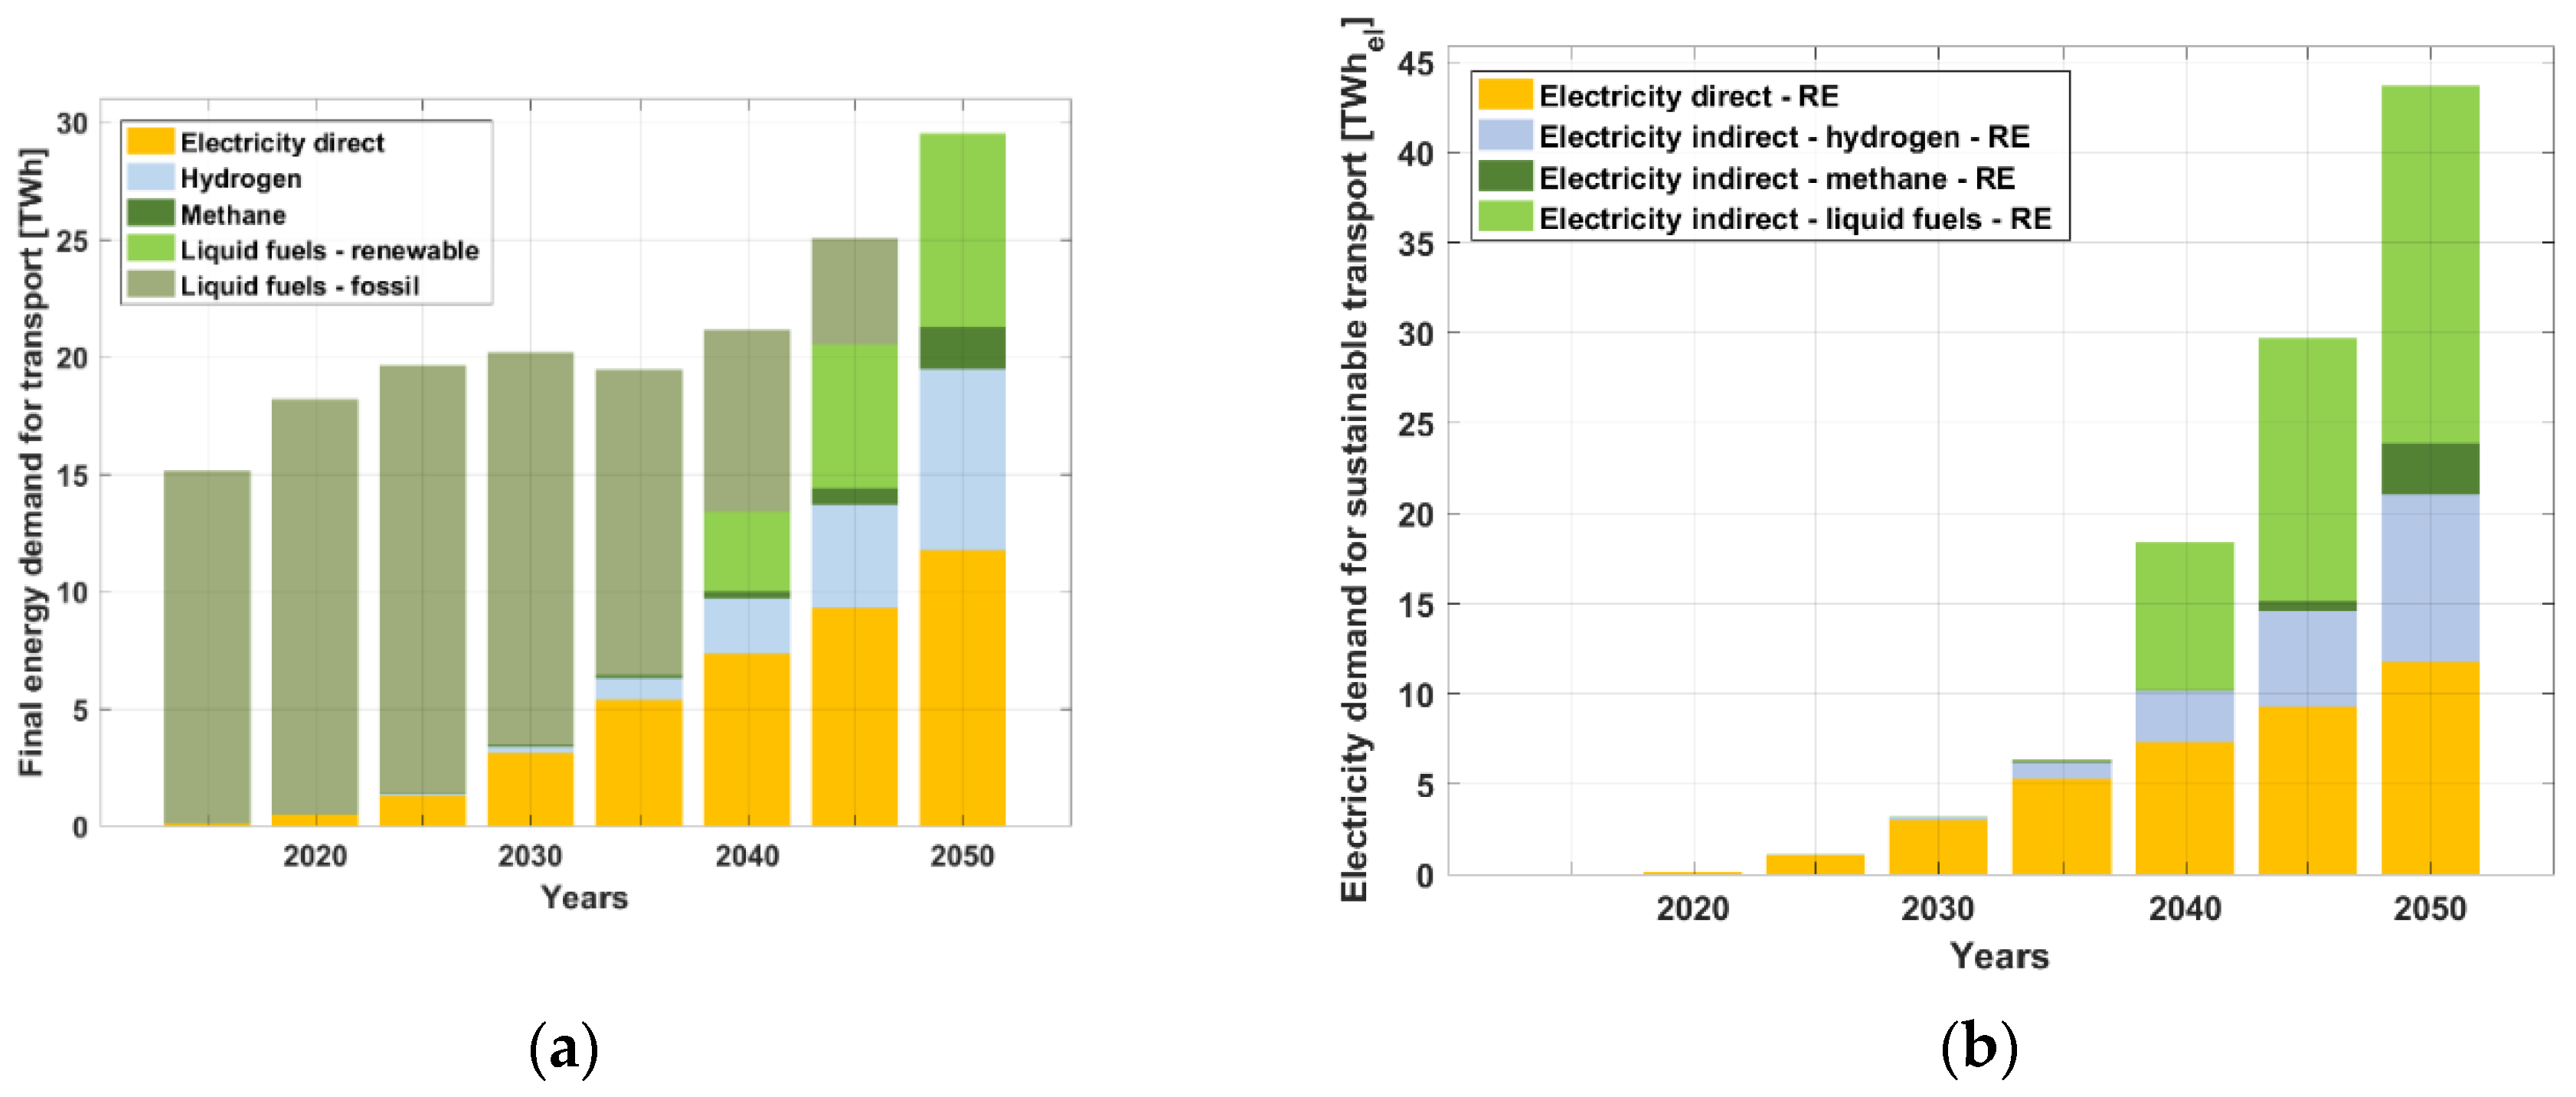
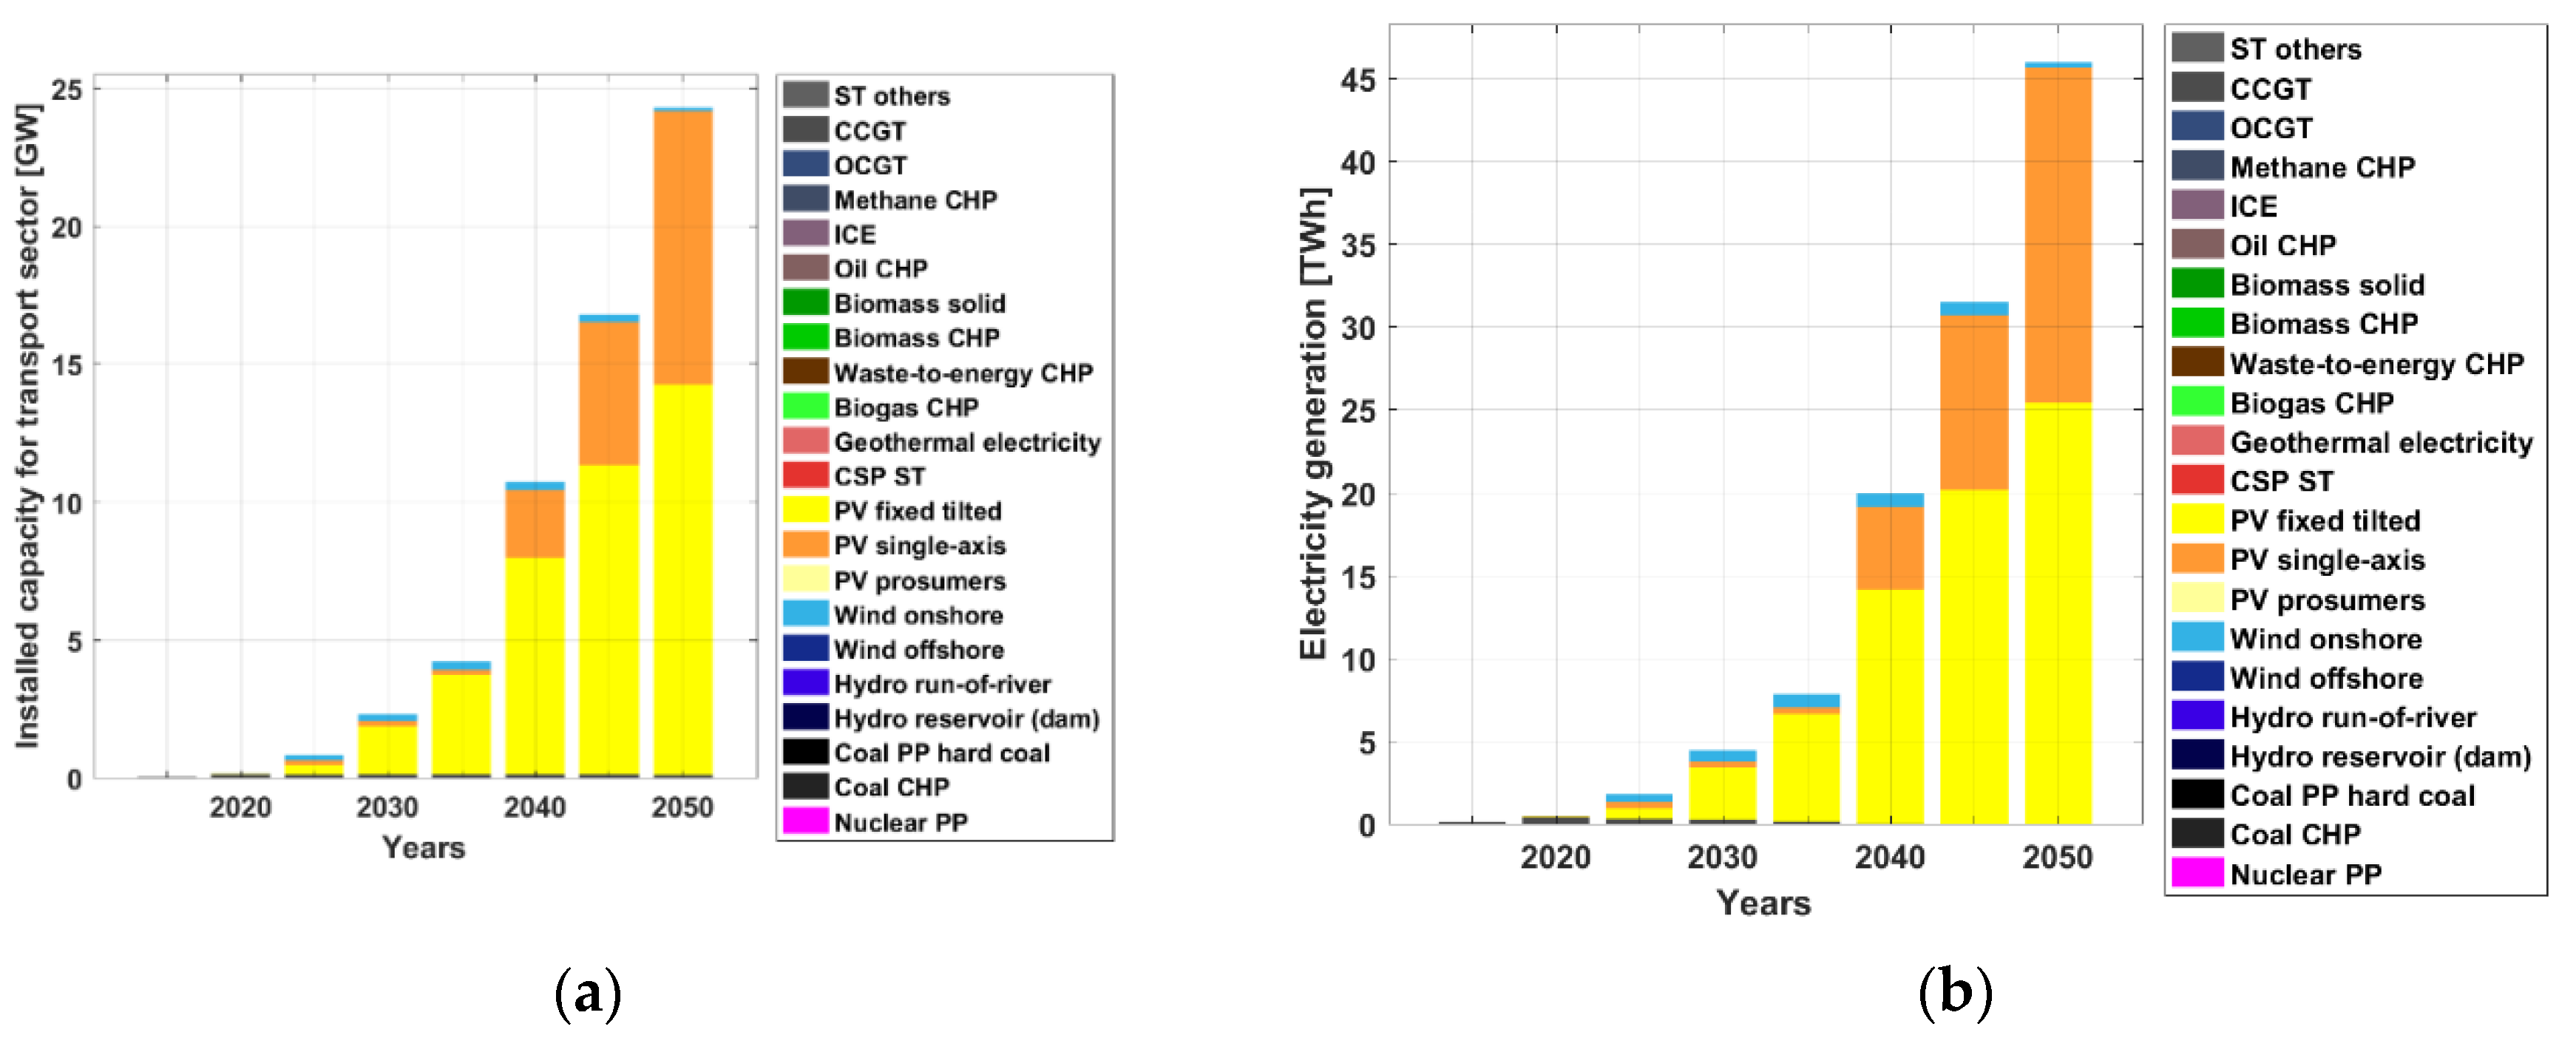
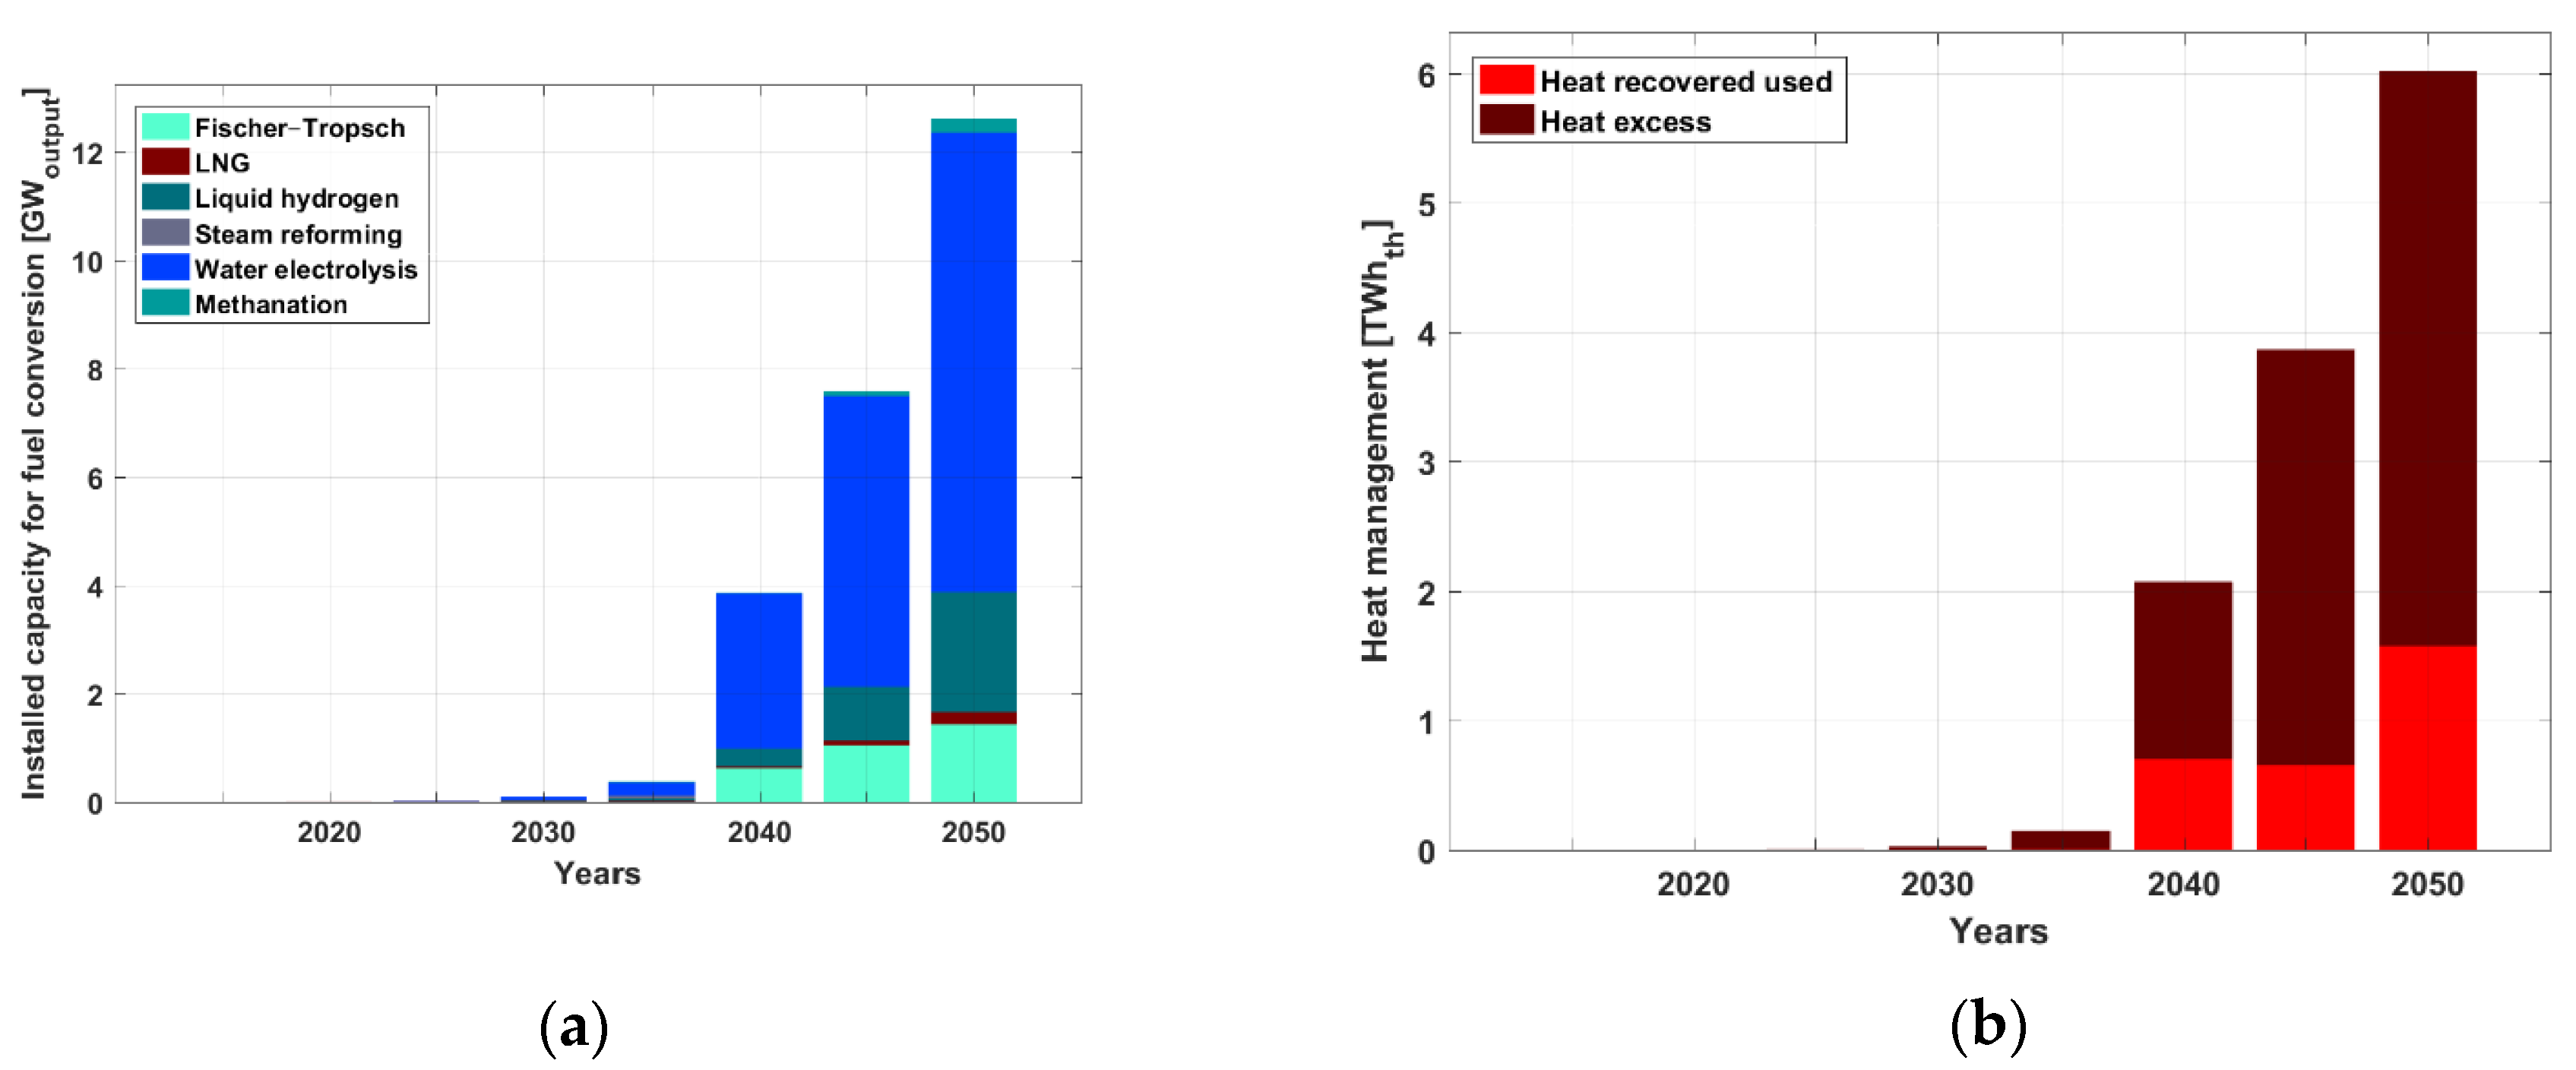
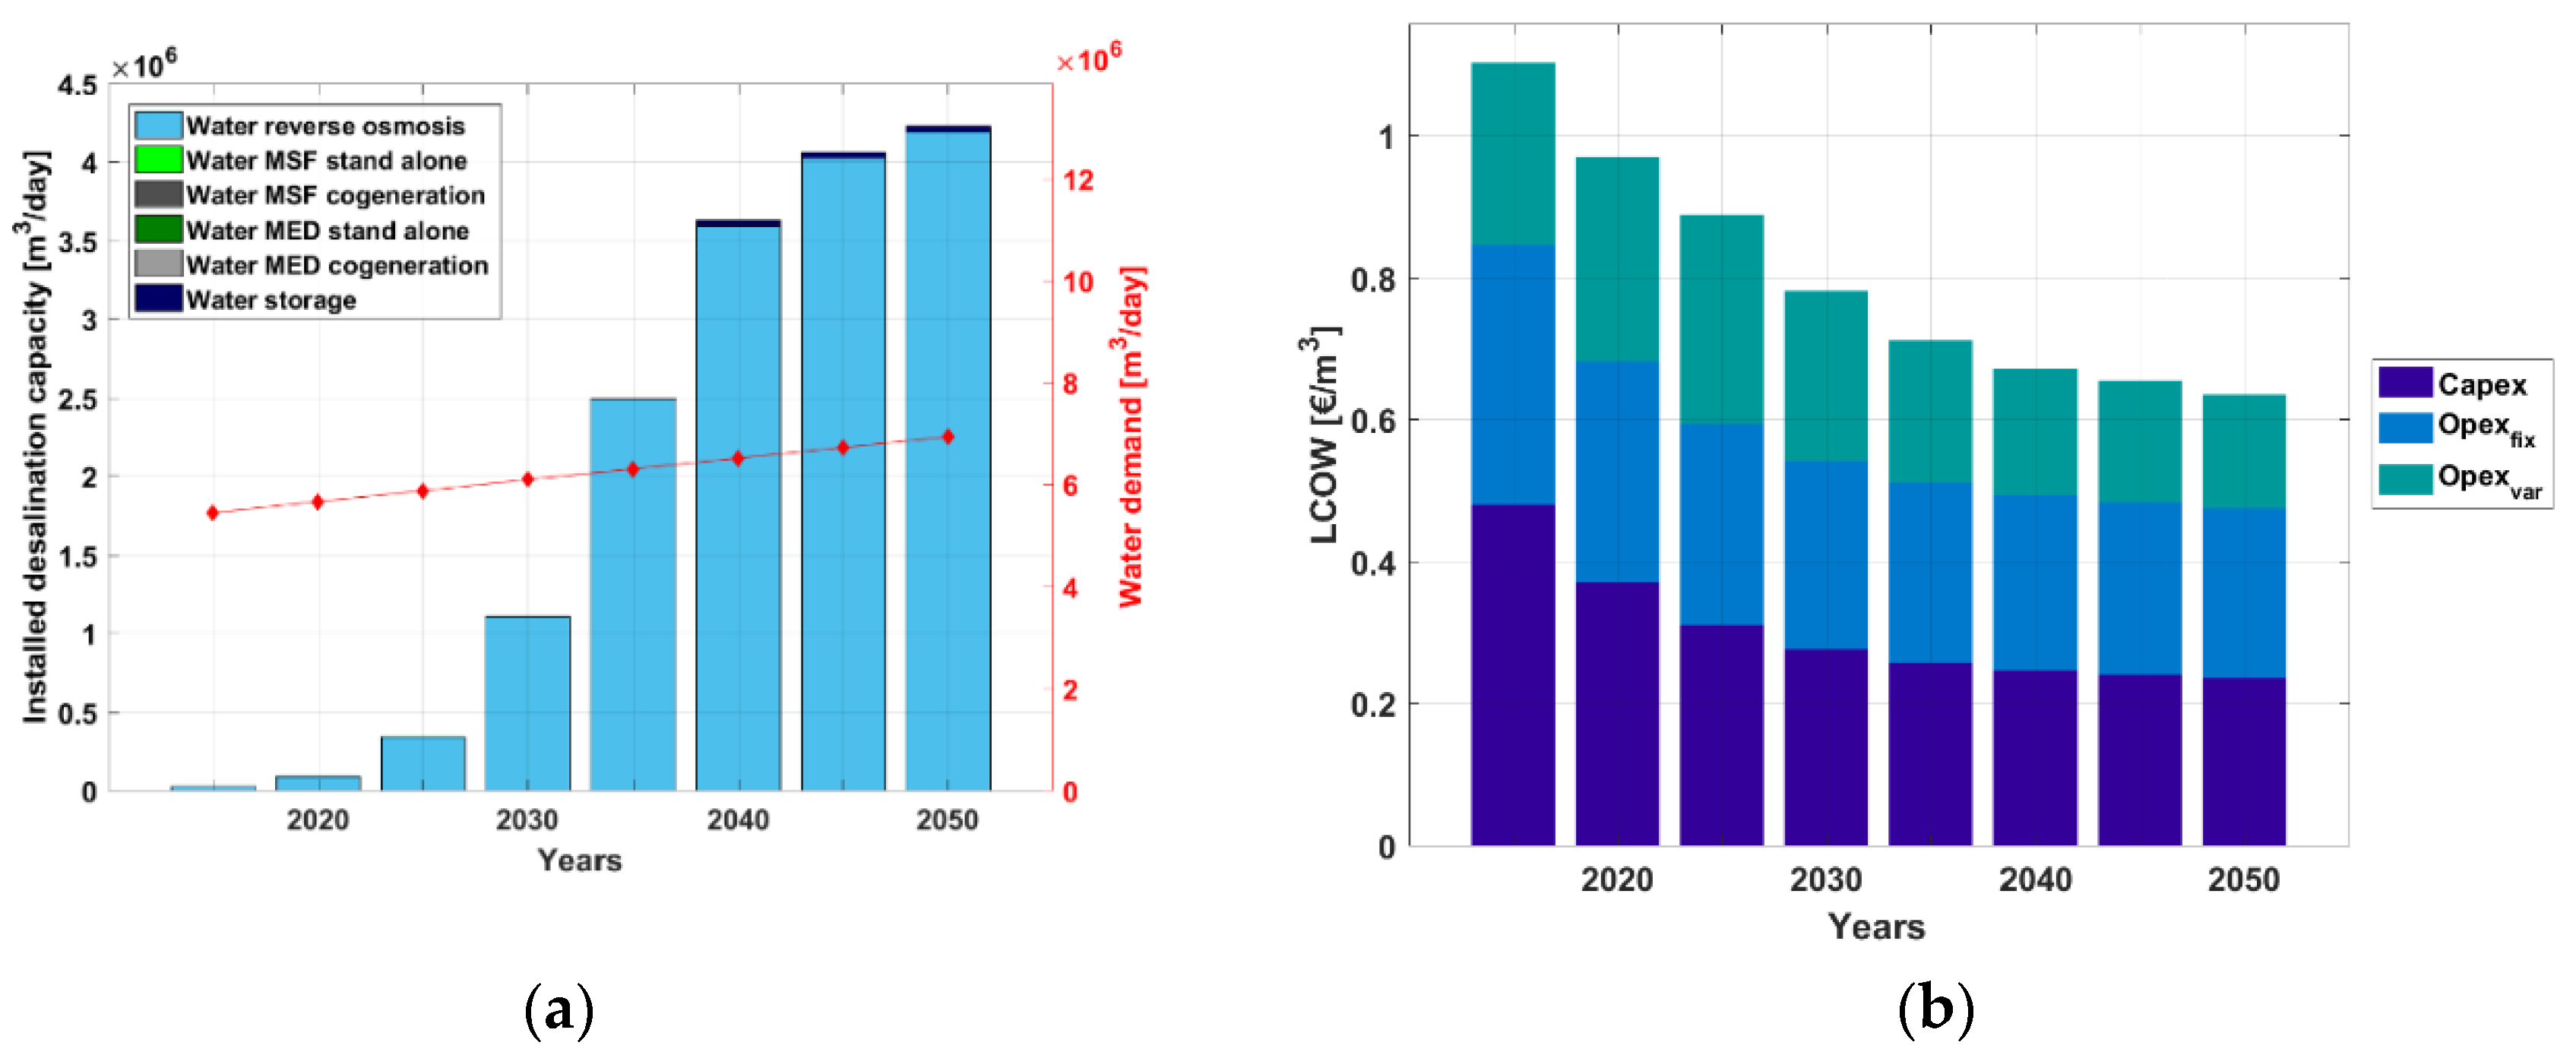
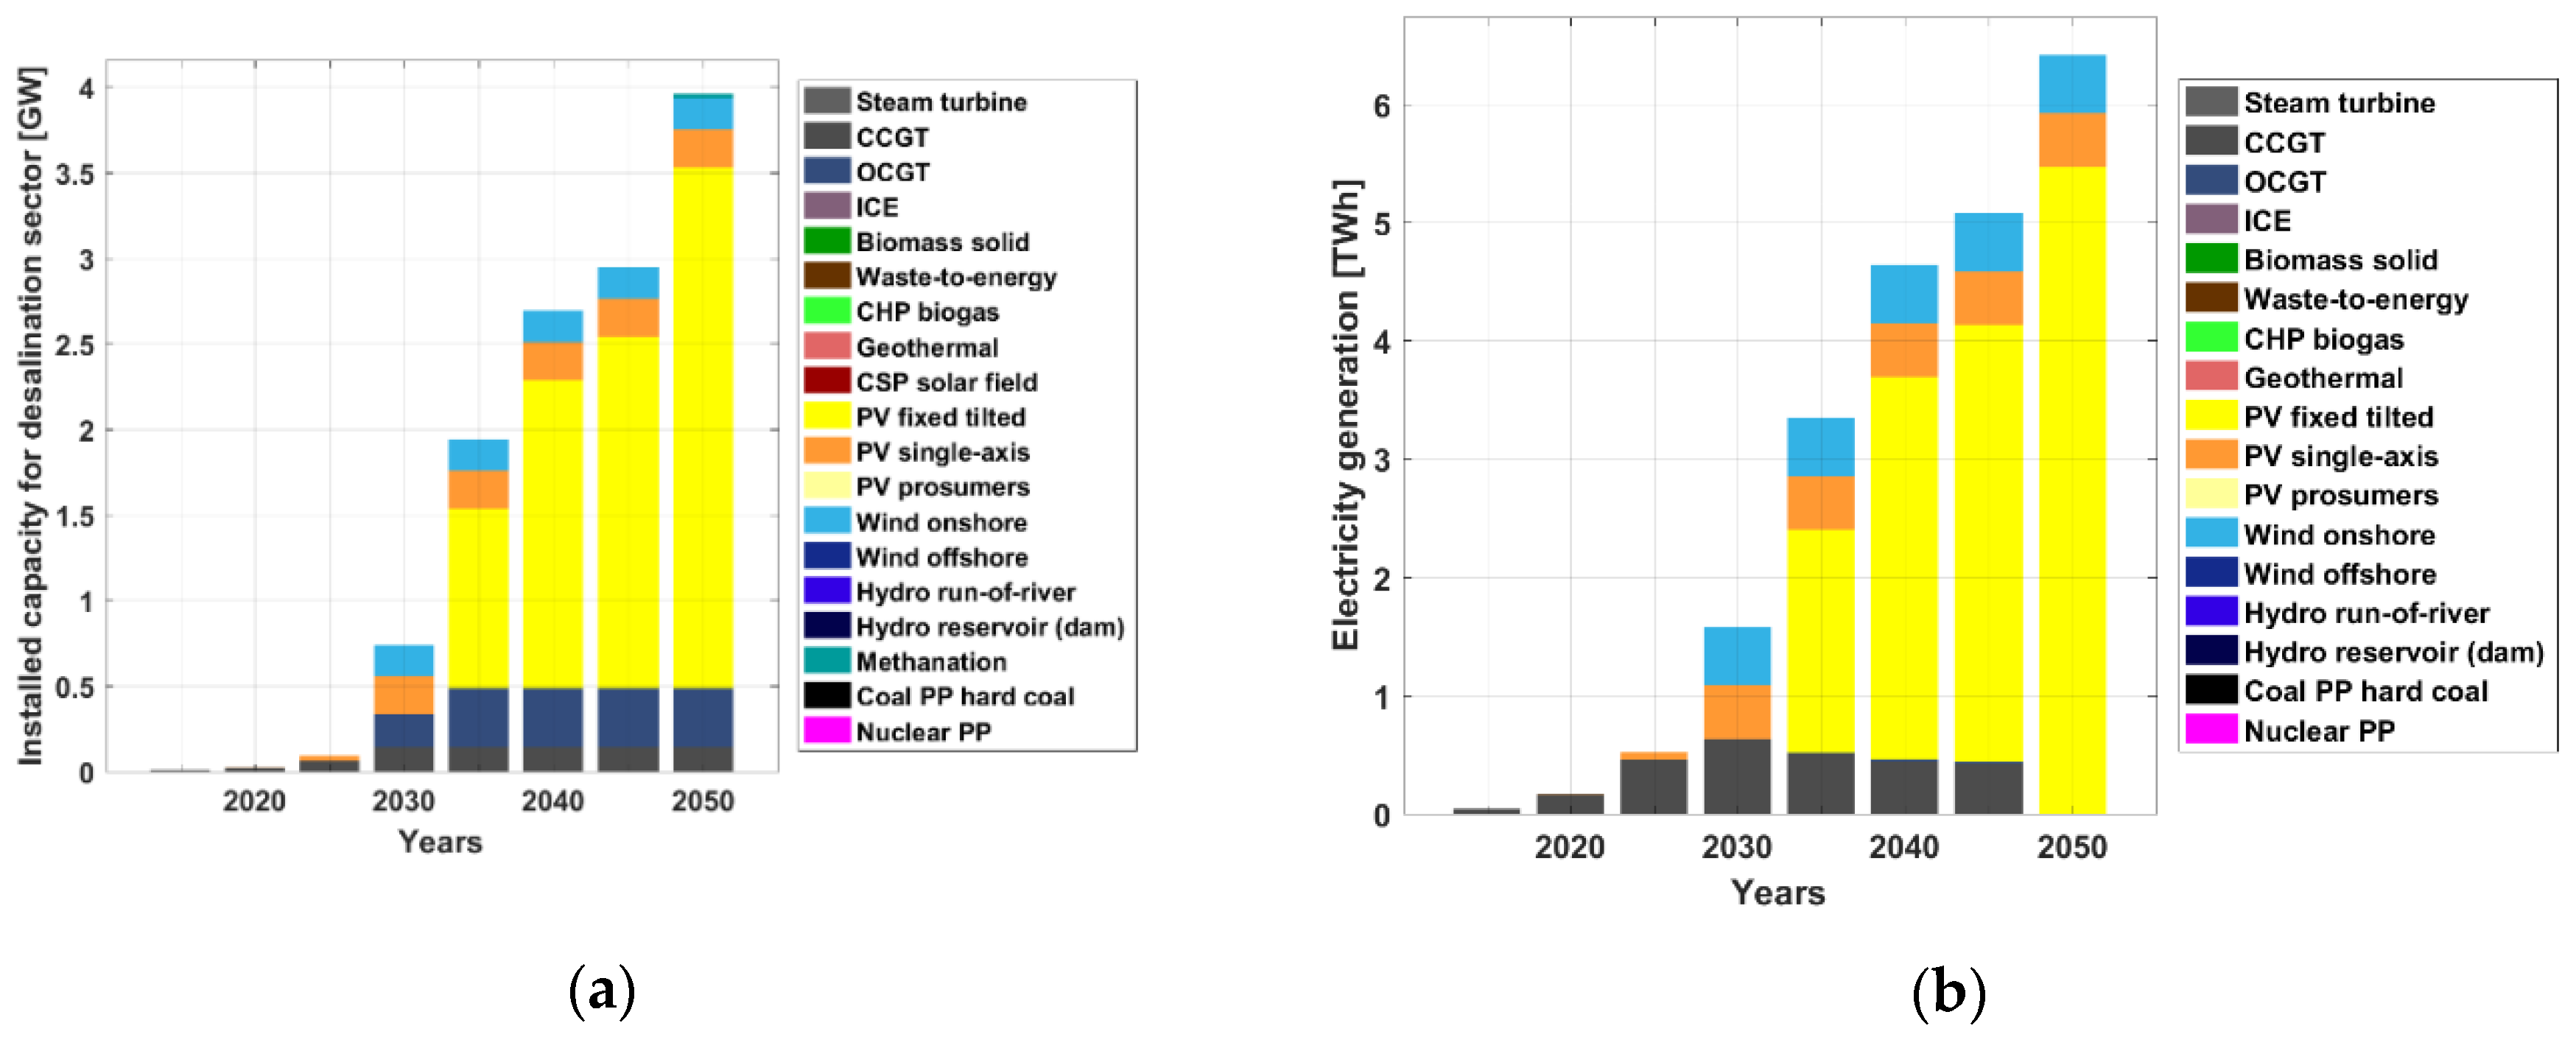
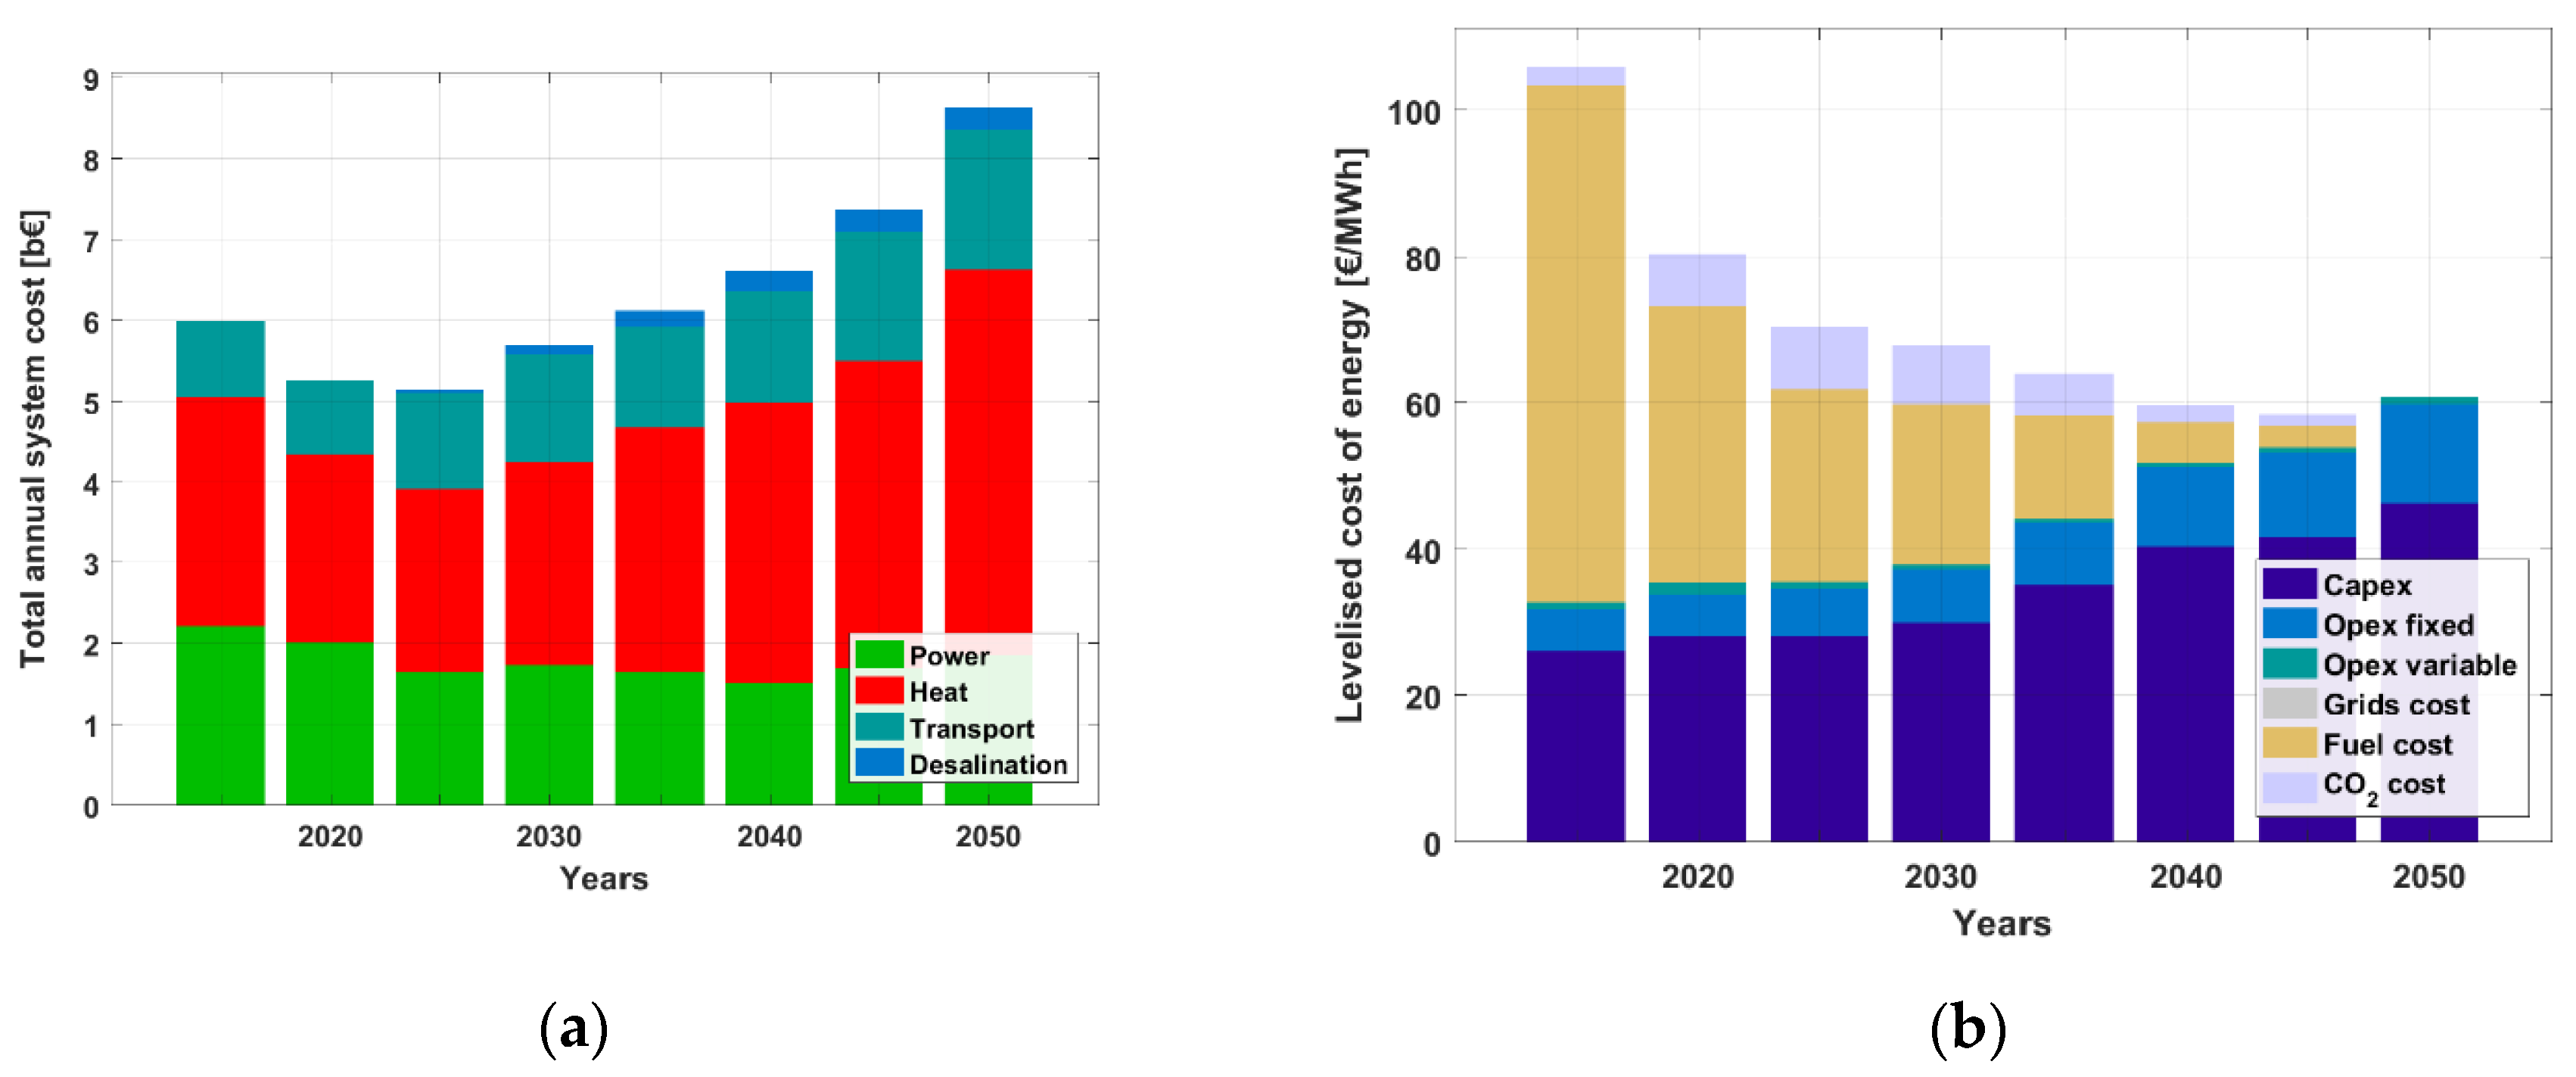
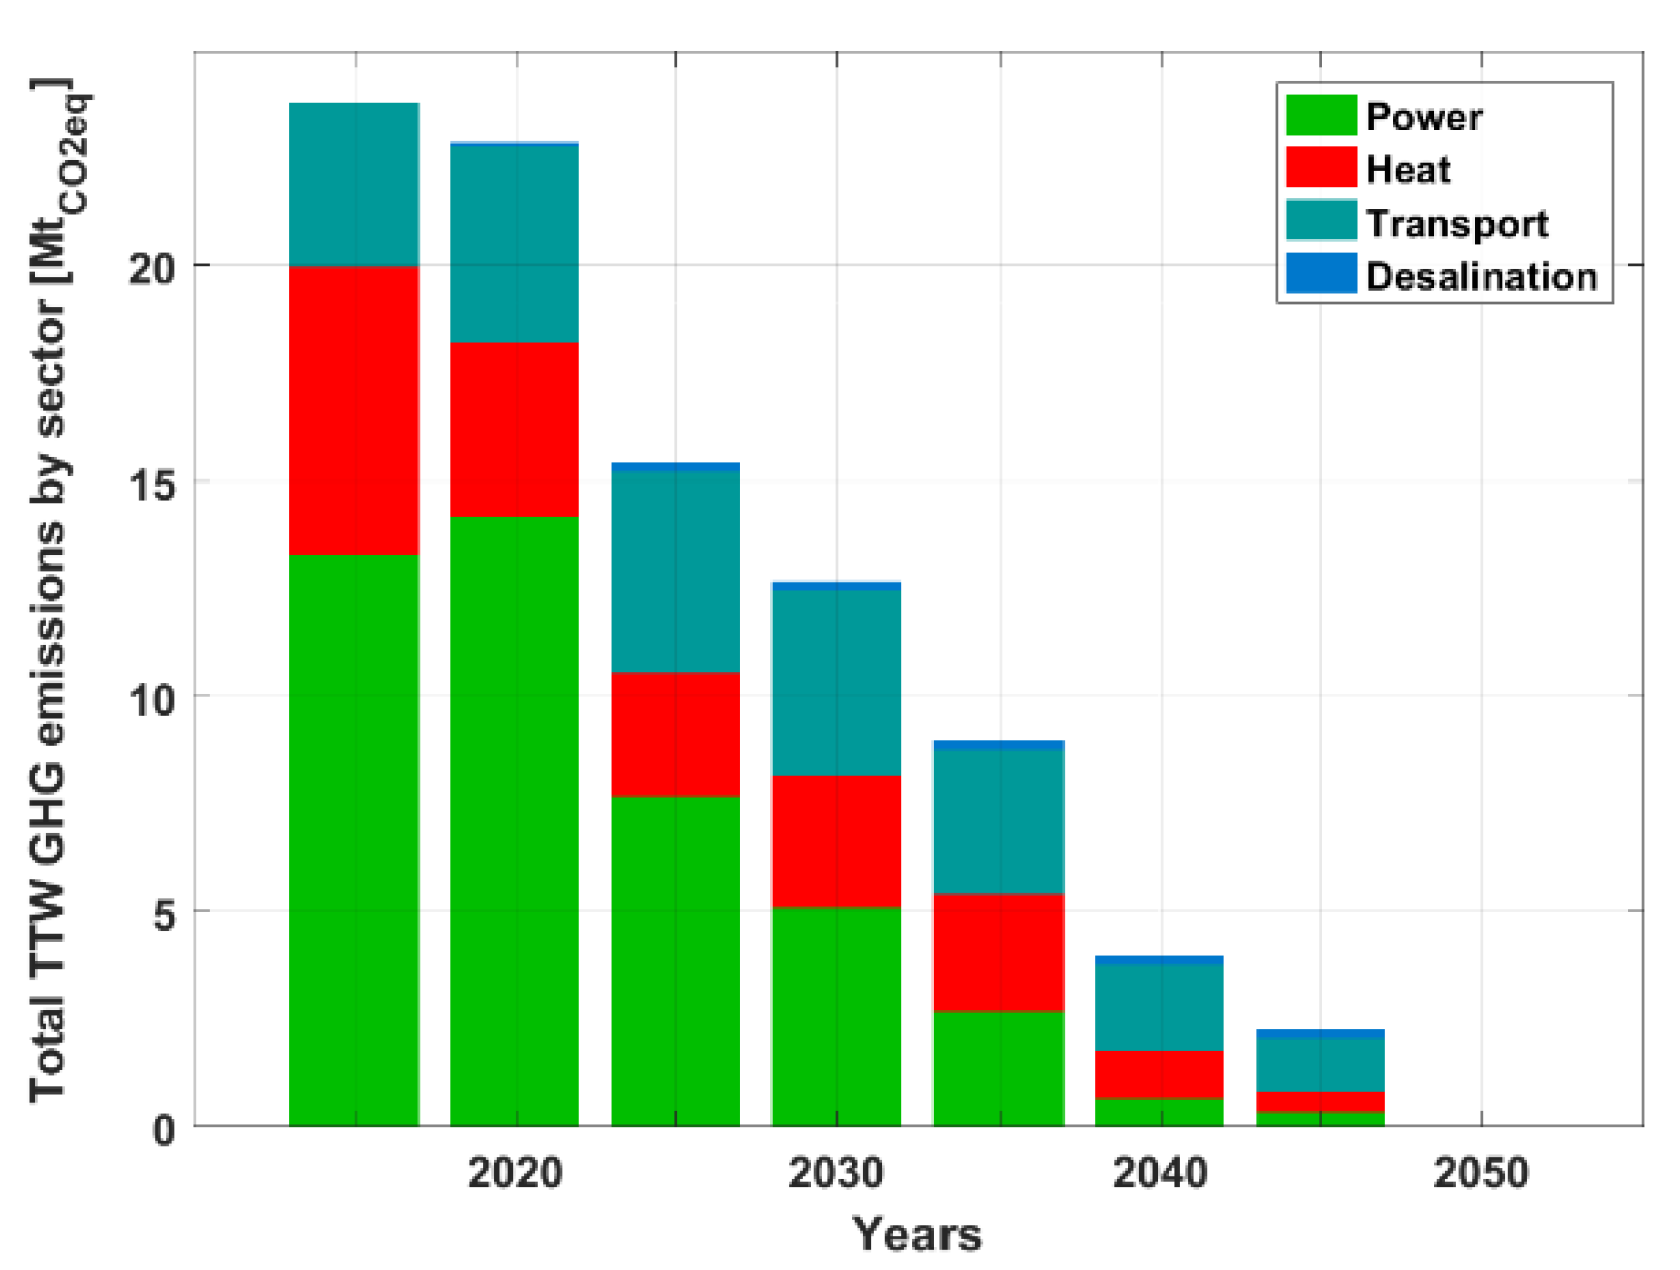