Impact of Samarkand’s Destination Attributes on International Tourists’ Revisit and Word-of-Mouth Intention


1
Department of Hospitality and Tourism Management, Sejong University, Seoul 05006, Korea
2
Silk Road International University of Tourism, Samarkand 140104, Uzbekistan
3
Tourism Industry Data Analytics Lab (TIDAL), Department of Hospitality and Tourism Management, Sejong University, Seoul 05006, Korea
*
Author to whom correspondence should be addressed.
Sustainability 2020, 12(12), 5154; https://0-doi-org.brum.beds.ac.uk/10.3390/su12125154
Submission received: 31 May 2020
/
Revised: 20 June 2020
/
Accepted: 22 June 2020
/
Published: 24 June 2020
(This article belongs to the Special Issue Behavioral Changes in the Tourism Industry: Implications for Sustainable Tourism Development)
Abstract
:Samarkand, Uzbekistan is a relatively unknown but emerging tourism destination. The city was once a major trading hub along the Great Silk Road. The once great city of Samarkand was hidden from the world tourism market, only to emerge after the country gained its independence in 1991. Since then, the artistically beautiful and historically-rich monuments have been attracting tourists from around the world. However, Samarkand has not been gaining much research attention at the same rate as international tourist arrivals. Thus, this study aims to comprehensively assess the city’s destination attributes and their impact on international visitor loyalty behaviors. The literature review process identified 16 destination attribute dimensions. Additionally, cognitive and affective evaluation, satisfaction, revisit intention, and word-of-mouth intention were identified and added to form the study model. A total of 223 international tourist samples were collected in Samarkand to validate the proposed model. The findings revealed 10 attributes to be consistently rated by the samples. Subsequently, the attributes were significantly influencing all subsequent hypothesized relationships. Both theoretical and practical implications are also discussed.
1. Introduction
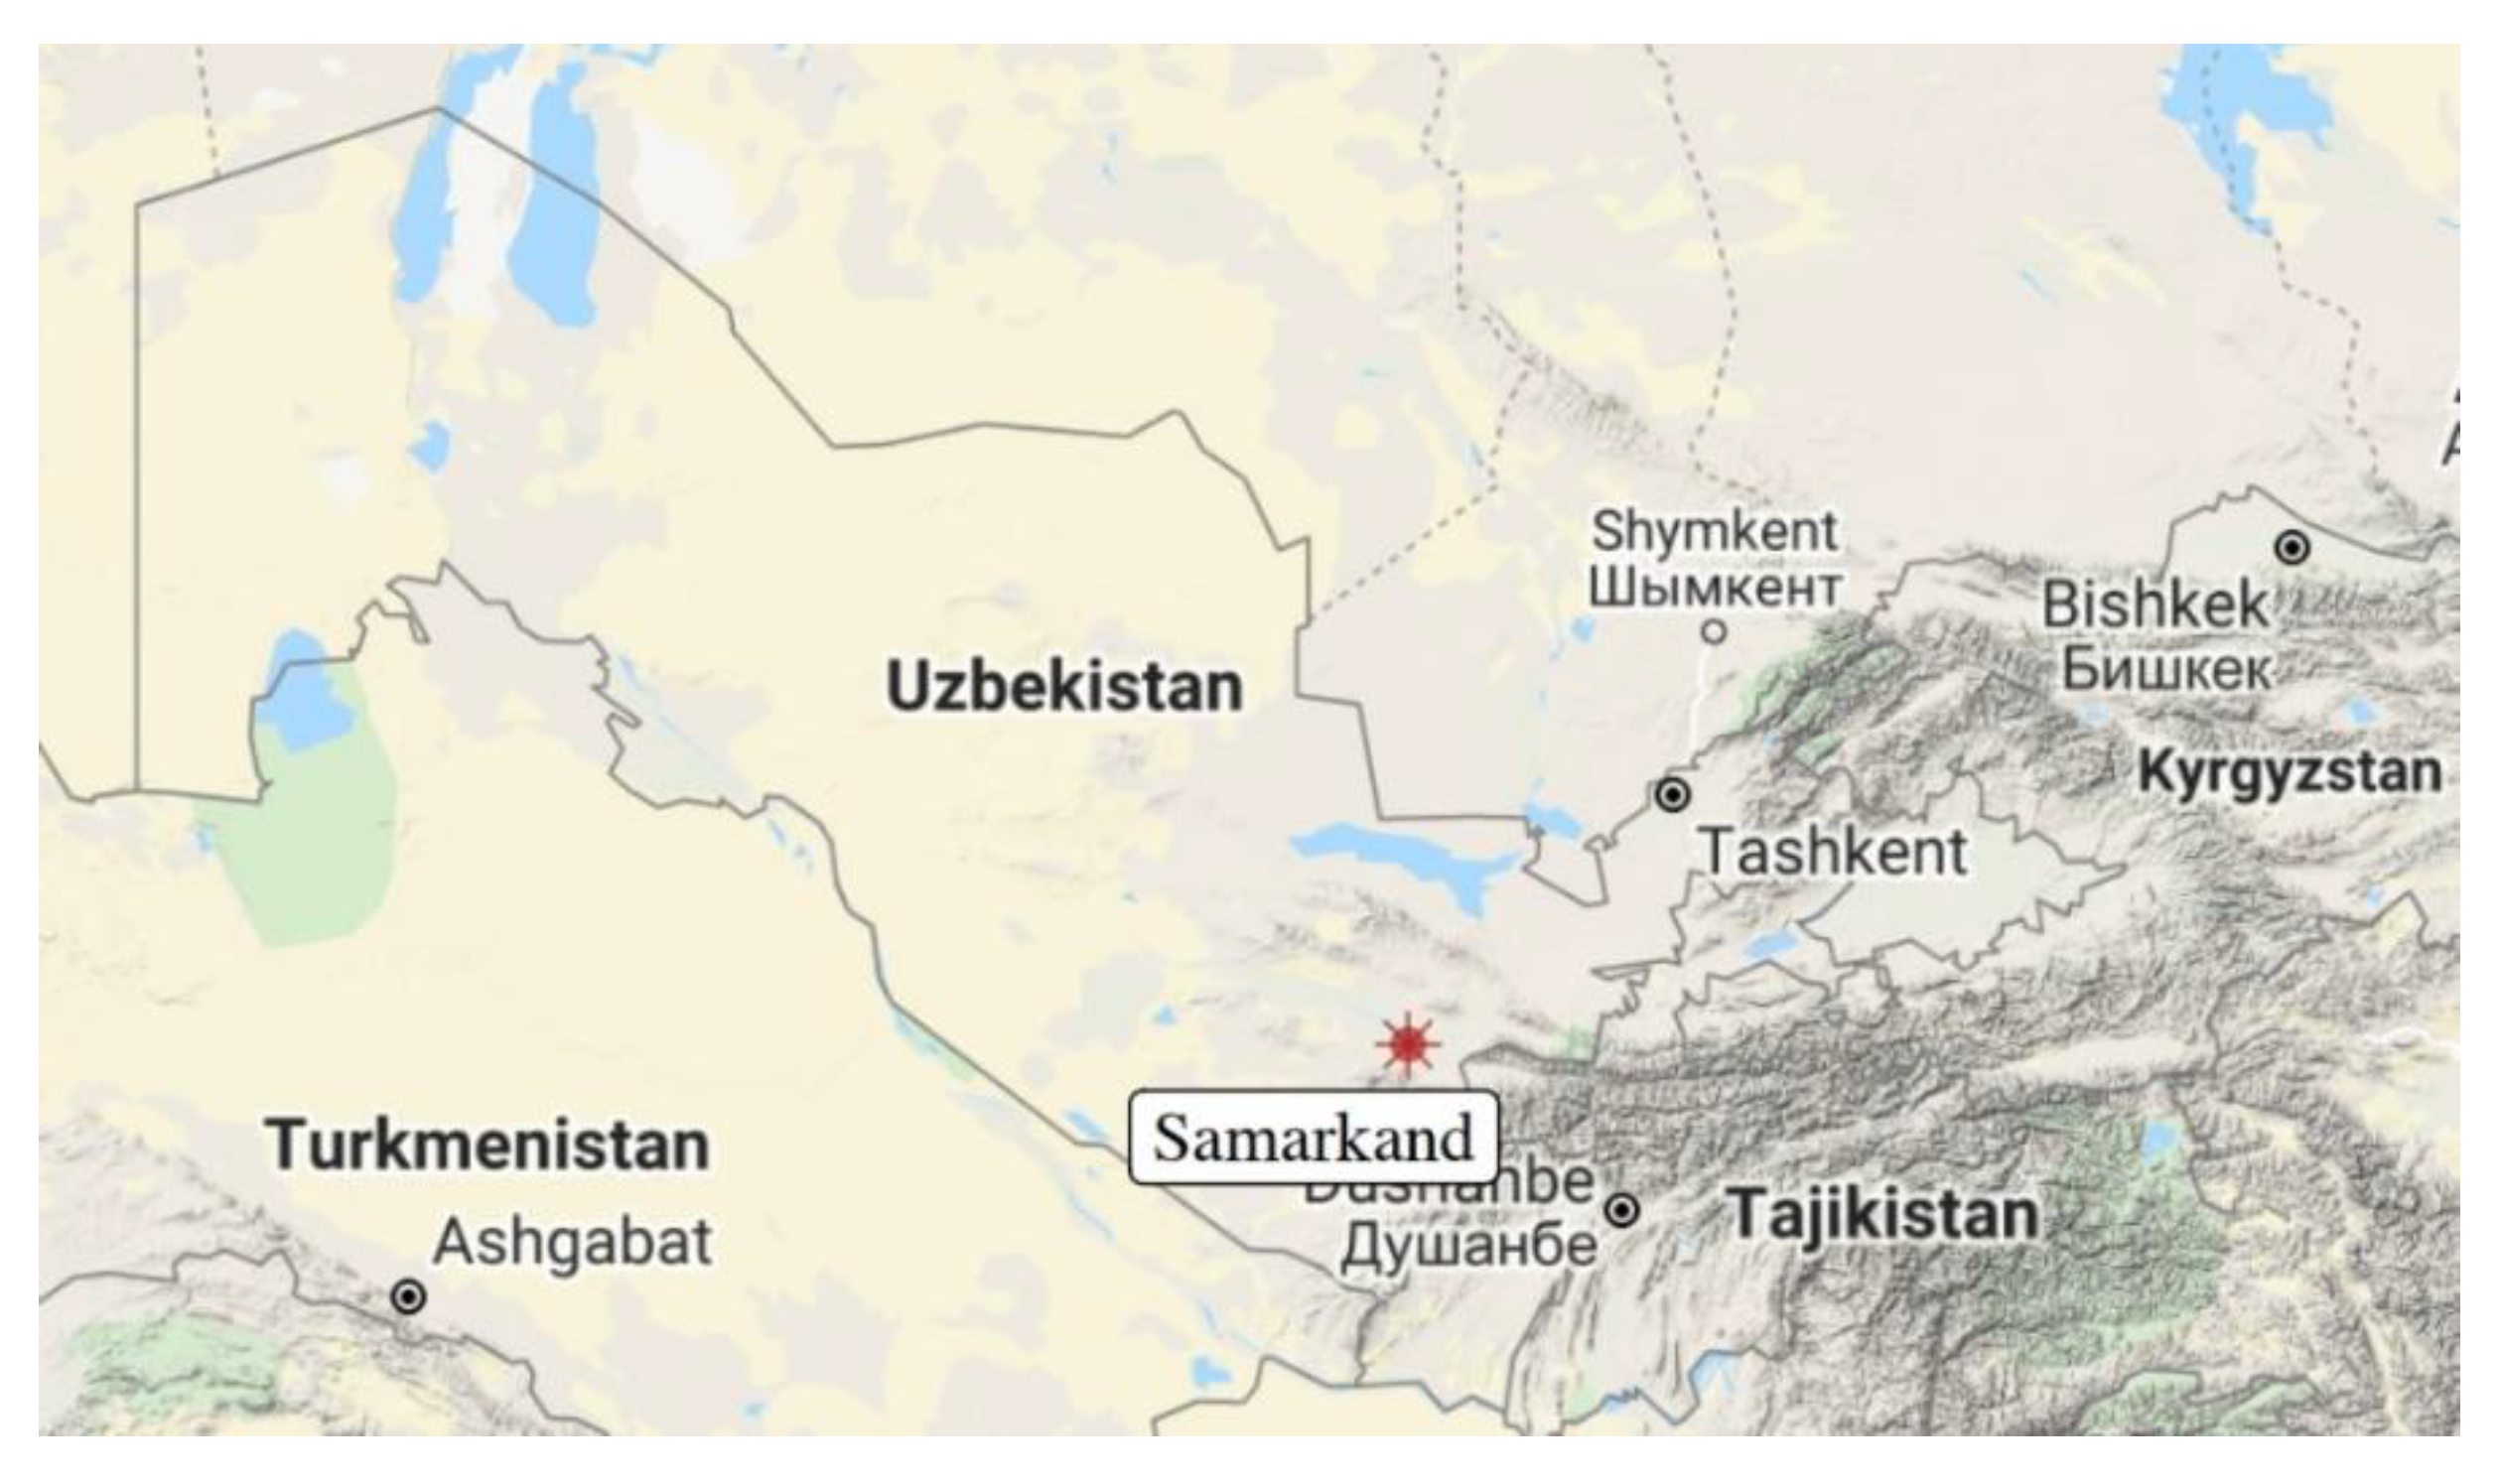
Although Uzbekistan can proudly profess a millennia’s old historical heritage, and a long pilgrimage tourism history, the modern development of its tourism industry is relatively young when compared to other countries [1,2,3]. This is because Uzbekistan only started to develop and promote its own tourism industry after the country gained its independence in 1991 [2]. Despite that, the tourism industry has been growing rapidly in the last years [4]. In one year, from 2017 to 2018, international arrivals increased by 2.3 times, from 2.8 million to 6.4 million [5]. In the latest statistics, foreign visitor arrivals for January 2020 was 538,360, a 23.1% year-on-year increase [6]. Given the benefits tourists may bring, the Uzbek government has implemented various policies to ensure a continued and sustained development of its tourism industry [4]. The majority of tourists are clustered within the four major touristic destinations. They are Samarkand, Bukhara, Khiva, and Tashkent [2]. Among the four destinations, Samarkand plays a major role, both in terms of its touristic appeal and as a transportation hub linking Tashkent and the further two historical cities of Bukhara and Khiva. Figure 1 shows the map of Uzbekistan and the location of Samarkand [7].
The national tourism authority, Uzbektourism, estimated 37.7% of Uzbekistan’s touristic resources are located within Samarkand city and the Samarkand region [4]. Specifically, 780 architectural, 1530 archeological, 36 historical, 225 monumental art, and 71 sculptural resources. Thus, it is no surprise that Samarkand is known for its cultural-historical tourism [1,4,8]. Most of Samarkand’s historical resources are linked to how the city was one of the major commercial centers along the Great Silk Road [8]. An analysis of packaged tours offered by travel agencies also revealed that almost all promotions are linked to the Great Silk Road [3]. However, Samarkand is believed to have a wider range of resources and tourism products on offer [2]. Complementing the cultural-historical tourism, Samarkand also offers appealing ecotourism, pilgrim tourism, and culinary tourism products to visitors, both domestic and international [3,4]. Today, the tourism industry is undoubtedly the most important industry of Samarkand city [8,9]. The tourism industry is often described as complex, in that it needs all stakeholders to individually perform, but tourists perceived the overall experience holistically [10,11,12]. Therefore, a comprehensive analysis of the various attributes of a destination would offer critical insights for effective management and marketing, as well as long-term sustainable development.
The term ‘destination’ in the tourism context often describes more than just a geographic location or its boundaries. A destination then refers to an area that includes a collection of different natural attributes, features, attractions, and services that tourists may choose to visit and experience [13,14,15]. Thus, the given definition implies that within a destination, there are different attributes a tourist perceived during a visit [13]. Additionally, different experience providers collectively contribute to the overall experience of a tourist [11]. Although the overall satisfaction or dissatisfaction is often evaluated holistically, an individual tourist still perceives and evaluates the different cues, or attributes, individually during the trip [16,17]. Moreover, tourists generally look to experience more than one product at a destination [18,19,20]. For example, hotels, activities, restaurants, and attractions are some of the typical experiential providers at a tourist destination [11,21,22]. As a result, each provider relies on one another to generate satisfactory experience to the same tourist [13]. When one experience provider fails to produce a quality experience, the overall satisfaction level or image perception may be drastically diminished [23,24]. Consequently, dissatisfaction may negatively impact future intentions [12,25,26]. Therefore, it is critically important to measure, not just the overall satisfaction level, but also the various destination attributes. Assessing each component or attribute’s performance level may help demonstrate the destination’s specific area of strengths and weaknesses [13].
Moreover, the currently available research on tourist behaviors in Samarkand, the leading destination within Uzbekistan, is lacking. In general, the few available research on the tourism industry of Uzbekistan generally looks at the entire country rather than specific destinations [2,27,28,29,30,31,32]. Among them, the focus has mostly been on the macro view of tourism development [3,4,28,29,30]. Furthermore, two available streams of research on Samarkand has either been related to the conservation and management of heritage assets [1,33,34] or religious pilgrimage [1,32,35]. However, the tourism industry requires not only heritage attractions to create a memorable tourism experience but all experience facilitators to collectively perform [36,37]. Hence, there is a lack of available research on the destination attributes of Samarkand. At this current stage of development, and given the available tourism assets, the current state of destination attributes of Samarkand is unique. The findings of destination attributes in other destinations may not necessarily be transferable to Samarkand. Thus, there is the need to consider Samarkand’s distinctive attributes and verify them using the most current samples of international tourists. As a result, this present research project aims to contribute to the research pool by comprehensively assessing the dimensions of tourism attributes of Samarkand and their impact on tourist loyalty.
The following objectives were designed to help achieve the research aim. First, the dimensions of destination attributes relevant to the current tourism conditions of Samarkand would be identified via a thorough review of the literature. The second objective was to develop a study model to include mediating constructs critical in explaining the hierarchical flow from destination attributes to the loyalty behaviors. Specifically, the study identified the cognitive-affective evaluation constructs and satisfaction as mediators. The cognitive evaluation dimension was identified to represent how tourists are generally understood to be data- and knowledge-driven [38]. Whereas, the affective evaluation variable measures the emotional response at the individual level [39,40]. Furthermore, satisfaction measures the holistic evaluation of the tourism experience [11,16]. The last objective then empirically validated the proposed study model with samples of international visitors to Samarkand.
2. Literature Review
2.1. Destination Attributes
Measuring the various attributes of a destination has matured to include an extensive list of attributes. However, it is still being argued that a universal attribute measurement scale does not exist due to the diverse nature and composition of each destination [11,19]. In practice, researchers often prefer a shorter list of attributes due to the ease of research execution [41]. Whereas, a more comprehensive list of destination attributes can provide more conclusive findings [10,42]. The conceptual model of destination competitiveness developed and introduced by Crouch and Ritchie [10] has been accepted as one of the most comprehensive lists of destination attributes to date [11,43]. The model’s development focused on the relationships and dependencies between the stakeholders involved in creating the complete tourism experience at a destination. Hence, the model was developed to measure the competitiveness from the supply perspective [44]. Thus, some attributes are not suitable to be assessed by the tourists, or the demand side. In this present study, the attribute dimensions are based on Kiatkawsin and Han’s [11] study which assessed international tourists’ perception of destination attributes in Thailand. The study used a scale which assessed all aspects of the tourism experience at a destination.
The first group’s attributes are classified as inherited or endowed resources. They include climate, nature, heritage, and local cuisine. The inherited resources are usually the main attractions that pull tourists to the destination in the first place [36,43]. The climate of the destination has always been a key consideration for tourists when choosing a destination. A comfortable climate, in most cases, refers to a warm climate that can dictate the range of tourism activities, preparation, and overall competitiveness of the destination’s tourism industry [45]. Nature referred to the natural scenery, including both flora and fauna, of the destination. Natural resources have always been treated as the foundation of most tourism destinations. Natural assets are non-renewable, at the same time, many tourist attractions and products rely on such resources [26]. Thus, a plethora of research has focused on sustainable development and conservation of the natural environment [11]. Heritage and local cuisine are resources that have been manifested by the local people living in the community [42]. They are not just historical resources, but also living elements of the culture [37]. Samarkand is most well-known for its rich historical heritage linked to the Great Silk Road [4,8]. However, Samarkand’s local cuisine is often neglected but research has found culinary offerings to be a strong advantage of the city [3].
The second group of attributes is created resources. Although natural resources are fundamentals to popular and successful destinations, it is also possible for destinations to overcome the perceived disadvantage in natural resources by creating or building resources that are still integral to the tourism experience [43,46,47]. Note, created resources are not the same as man-made. Historical buildings, such as the Pyramids of Giza or the Great Wall of China, are man-made but not necessarily created to be tourist attractions. The attribute dimensions under created resources are accommodation, transportation, tourist information, tourism activities, shopping, and entertainment. Accommodation is generally one of the first components when planning a trip, and the quality can play a significant role in creating a memorable tourism experience [41]. Among international travelers, transportation options and quality within the destination country, between different cities, and within the destination may determine the length of visit and the depth of the overall experience [13]. Tourism information covers not only information about the attractions and activities but also critical necessities such as communication (telephones and internet connections) and banks (ATMs, currency exchange). Tourism activities have become much more important today than before. Activities can provide a more immersive experience [12]. Thus, it can leave longer-lasting memories about the trip [26,41]. In recent years, tourists no longer seek just sightseeing and seeing different cultures, and shopping has emerged as an important determinant when choosing a destination [48,49,50]. Entertainment options such as cultural shows and performances can be viewed as an effective tool to add some element of learning to tourists [41,51].
The next group of attributes is supporting factors and resources. Attributes in this group are not necessarily present to directly serve tourists but are general characteristics or skills that may aid or enhance the tourism experience [10,42,46]. In other words, the attributes in this group concern with ‘how’ the tourism experience is provided and perceived. The four attributes are service quality, accessibility, hospitality, and communication. Service quality reflects how the products and experiences are being delivered to tourists and it is often found to be a key determinant of overall satisfaction [52,53]. The accessibility attribute measures the perceived ease of travel from their home location to the destination [54]. Research has found that accessibility significantly impacts the total number of tourist arrivals and subsequently, the popularity among the mass market [55]. Hospitality refers to the general friendliness towards tourists among the local residents [10]. Local residents are among the three main stakeholders of a successful destination, and the community support of tourism activities is key to a warm and hospitable tourist destination [41,56]. Lastly, communication is how easy the tourists find interacting with people or navigating within the destination. This dimension does not only refers to the language ability of service staff but also covers signs and signages at hotspots [46,47].
The last group of attributes is situational conditions. It consists of perceived value and safety and security attributes. Situational conditions are elements that have the potential to either enhance or reduce the overall satisfaction level [42]. Both attributes are perceived to be outside the control of stakeholders on the supply side as both the perception of value and safety is dependent on the individual tourists [43,47,57]. The actual price itself can hardly be a useful indication of satisfaction as prices are driven by many socioeconomic factors within a destination [58]. However, the concept of perceived value is a result of the difference between the evaluation of services an individual received against the costs of the services [17]. The final attribute, safety and security, is also a factor that measures the psychological perception of risks and danger of a destination. The attribute does not necessarily consider actual safety and security concerns such as crime rates at a destination [43,59]. Although, indicators such as news on political unrests, crime rates, and other related news and information may serve as important cues to the perception of safety and security [60].
2.2. Cognitive and Affective Evaluation
Since the conceptualization of satisfaction has been expanded to include an affective element to the traditional cognition-only model, most research today have always operationalized satisfaction as a cognitive-affective system [38,39,61,62]. An evaluation based on cognition was introduced based on the expectation-disconfirmation paradigm. Specifically, consumers evaluate their post-consumption experience and compare that against their pre-consumption expectations. If the experience meets or exceeds expectations, satisfaction is formed [38,39]. The cognition-based model assumes that tourists or consumers are rational individuals whereby they rely on external information to form their own beliefs and judgment [38]. On the contrary, an emotional or affective element was entirely neglected. However, the contemporary pool of research has found that consumers are also evaluating experiences based on their feelings such as pleasure, enjoyment, and excitement [11,26,61].
Several previous studies have validated both cognitive and affective evaluation constructs as a mediator between attributes and loyalty behaviors [11,63,64]. A study involving international tourists in Thailand found a significant mediating effect of positive-negative emotions between destination attributes and revisit intention [11]. In research on wellness spa tourism, the multiple dimension of wellness spa performance was found to have positively and significantly influenced positive affective experience, and negatively impacted negative affective experience [64]. Similarly, halal-friendly attributes of a destination were critical antecedents of affective destination image that eventually impacted revisit and recommendation intention among Muslim tourists in a non-Muslim destination [63]. Based on the conceptualization of both cognitive-affective evaluations and findings of previous studies, hypotheses 1 and 2 were developed.
Hypothesis 1 (H1):
Destination attributes positively affect cognitive evaluation.
Hypothesis 2 (H2):
Destination attributes positively affect affective evaluation.
2.3. Satisfaction, Revisit Intention, and Word-of-Mouth Intention
Satisfaction has always been at the center of many consumer behavior research. That is due to its critically important role as an indicator of the destination’s success [13,17,18,19,65]. Although satisfaction is only a holistic measurement of the overall experience, the level of satisfaction can still be useful information to researchers [25,65]. Due to its simplistic form, satisfaction can be used as an indicator of performance, and when comparing between two units of evaluation [66,67]. The level of satisfaction is often determined by using expectations against perceived performance [19]. However, satisfaction by itself offers limited insights into the performance being evaluated [16]. Therefore, satisfaction is often used as a mediator between a more detailed set of performance indicators, such as destination attributes, and post-evaluation behaviors, such as loyalty intentions [11,12,20,25].
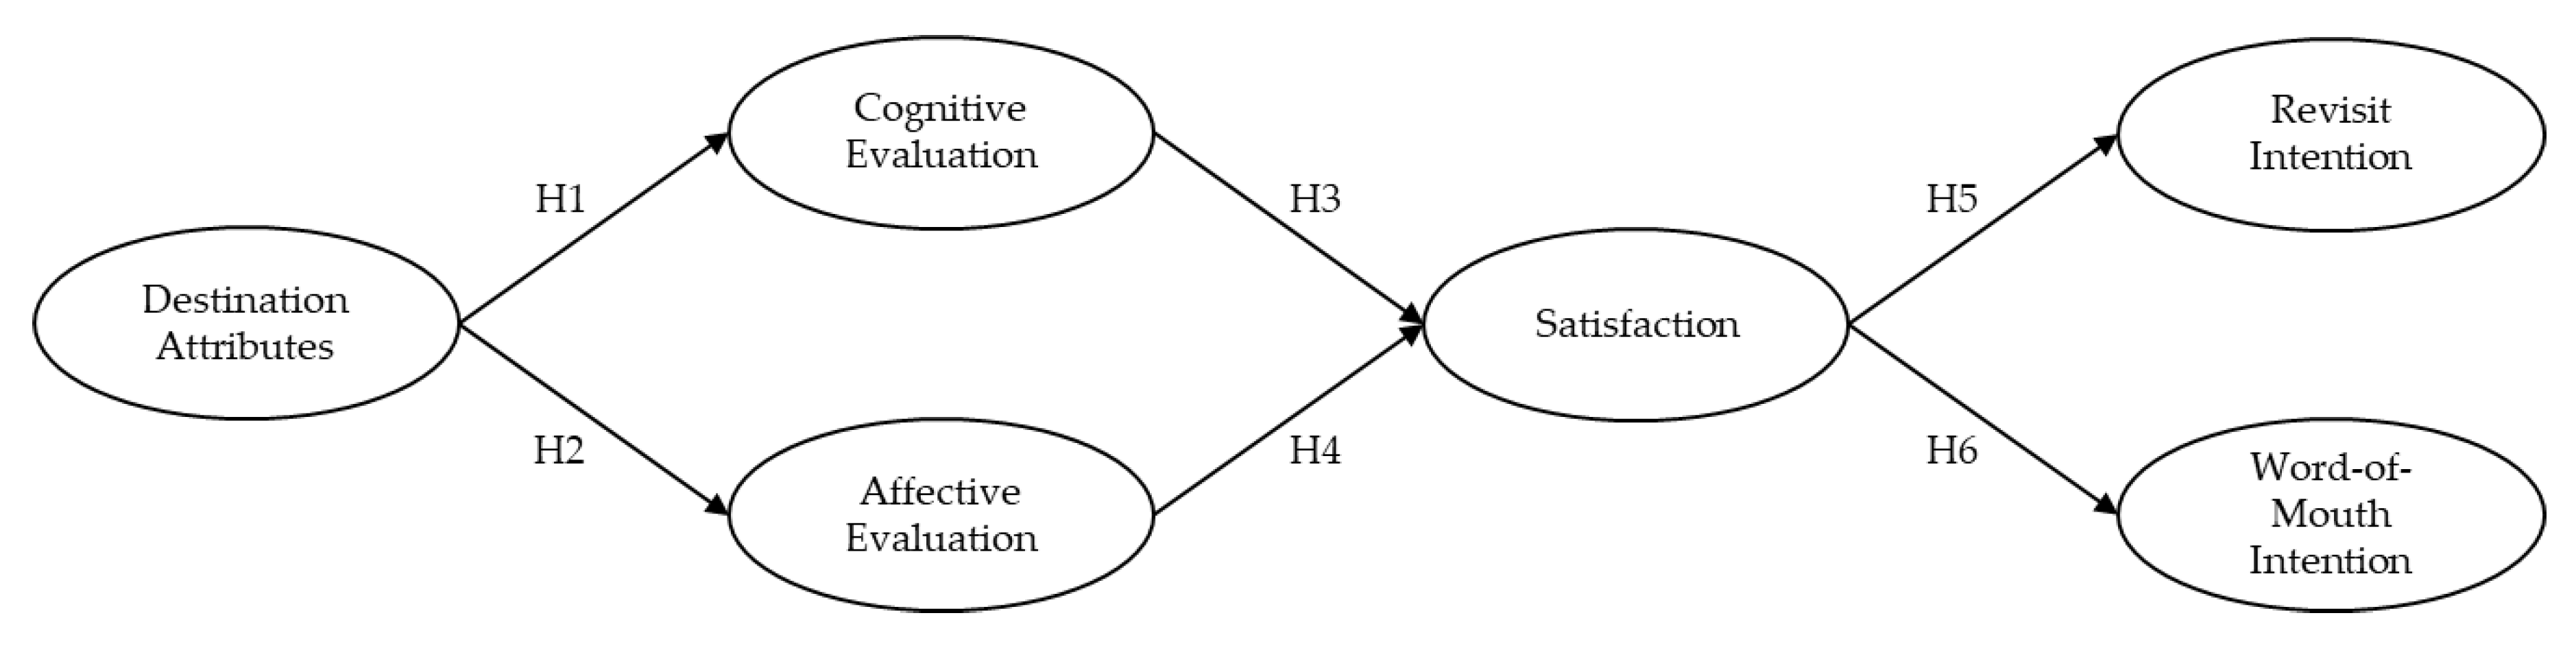
Customer loyalty is especially important to businesses due to it being a strong determinant of customer retention and eventual profitability [68,69]. Satisfaction alone does not necessarily lead to customer retention because of interferences such as switching intention and alternative attractiveness [70,71,72]. Therefore, many researchers always measure the level of loyalty in addition to satisfaction. Research on customer loyalty found that different behaviors indicate loyalty; most notable are repurchase/revisit, positive word-of-mouth/recommendation, willingness to pay a premium, and brand advocacy [53,68,70,71,73,74]. However, not all behaviors are applicable to loyalty to a tourism destination context [25,64]. Hence, this present study measures tourist loyalty using two constructs: revisit intention and word-of-mouth intention. The relationships between cognitive-affective evaluation, satisfaction, and loyalty intentions are demonstrated in several previous studies [11,12,18]. In a rural tourism context, a study found significant relationships of tourists' perceived quality to satisfaction and loyalty behaviors [12]. In sum, this present study proposed a hierarchical flow from destination attributes to cognitive-affective evaluation, then to satisfaction, and eventually tourist loyalty. Hypotheses 3, 4, 5, and 6 were developed to reflect the proposed conceptual framework. Additionally, Figure 2 illustrates the study model.
Hypothesis 3 (H3):
Cognitive evaluation positively affects satisfaction.
Hypothesis 4 (H4):
Affective evaluation positively affects satisfaction.
Hypothesis 5 (H5):
Satisfaction positively affects revisit intention.
Hypothesis 6 (H6):
Satisfaction positively affects word-of-mouth intention.
3. Methods
3.1. Measurement Items and Survey Development
The study identified 16 dimensions of destination attributes based on previous literature. Thus, the measurement items for the destination attributes have been consolidated and adapted from previous studies [10,11,41,43,75]. Each dimension consists of three items, as previously used in a previous study in which the research samples were also international visitors [11]. Subsequently, three items were adopted to measure cognitive evaluation and also three items for affective evaluation [40]. The overall satisfaction of tourists in Samarkand was also measured using three items [40]. Lastly, revisit intention and word-of-mouth intention were measured using previously validated items [40,76]. All items were measured using 7-point Likert-type scales. All measurement items used in the study can be seen in Appendix A (Table A1).
The initial set of measurement items were reviewed by senior academics to ensure the appropriateness of the items to the research context. Then, demographic questions were included. A brief cover letter was also added to introduce the research topic and to inform the participants of the research’s purpose and confidentiality agreement. A pre-test was conducted by members of the general public, industry professionals, and academics. Slight adjustments were made based on their comments, and the survey was finalized. The survey was developed in English, and no translation was done.
3.2. Sampling and Data Collection
The research population was international tourists in Samarkand, Uzbekistan. A convenient sampling method was deployed for this study. As Samarkand is a well-established destination among foreign tourists visiting Uzbekistan, there are approachable international tourists throughout the city. Moreover, the data collection period was chosen to coincide with Sharkh Taronalari, an international music festival. During this period, the number of foreign tourists was higher than the average. The data collection period was the summer months of 2019.
The survey was distributed mostly as self-administered questionnaires at tourist hotspots and transportation hubs. For example, the Registan Square, Guri Amir (Tomb of Timur), Siyab Bazaar, Shakhi Zinda Necropolis, Samarkand Airport, and Railway Station. Additionally, after being granted permission, the surveys were distributed to guests at restaurants, cafes, and malls. Most participants completed the surveys without any assistance. However, a small group of participants was aided with the translation by their tour guides. All survey participants were not offered any incentives, and their participation was voluntary. They were also informed they could stop completing the survey at any time.
3.3. Sample Profiles
A total of 223 completed responses were collected. However, one response was removed due to exhibiting evidence of unengagement. Thus, the final number of responses was 222. Out of the 222 respondents, males accounted for 62.6% (139) and 37.4% (83) for females. The mean age of all participants was 44.6 years old. The respondents reported coming from 38 different countries. Notable nations included France (26), Spain (25), Germany (21), Japan (28), and Italy (13). Most of the participants reported annual household income to be between USD 25,000 and 39,999 (33.8%), followed by between USD 40,000 and 54,999 (24.9%). The majority of the samples hold a higher-education degree. Bachelor’s degree and master’s degree holders accounted for 41.6% and 32.1%, respectively. An overwhelming majority of the samples are full-time employees (70%), followed by full-time self-employed (13.7%).
In terms of their travel characteristics, more than half reported having visited Samarkand for the first time (64.4%). Their visit companionship was mostly family/relatives (41%) and friends (28.8%). The vast majority visited Samarkand for shorter than seven days. The respondents reported to be spending less than three nights the most (43.2%) and then between four to six nights (38.7%). During the visit, most stay at budget hotels (1–3 star) (43.2%), followed by hostel or guesthouse (30.6%). A full summary of the demographic information can be seen in Table 1.
4. Results
4.1. Data Screening
After the preliminary examination of the collected data by identifying missing values and unengaged responses, the 222 samples were tested for any potential outliers. The produced boxplots did not show any outliers. The test of multivariate normality has shown the skewness to range between −1.405 and 1.346. The kurtosis results ranged from −0.987 to 3.405. Both ranged below the recommended thresholds of absolute value 3 and 5, respectively [77]. Thus, no violation of multivariate normality was detected. The study used IBM SPSS version 23 and IBM SPSS AMOS version 23 for data analysis.
4.2. Confirmatory Factor Analysis
The path analysis follows the recommended two-step approach of structural equation modeling (SEM) technique by Anderson and Gerbing (1998) [78]. In the first step, a confirmatory factor analysis (CFA) is conducted to test the proposed study model’s goodness-of-fit statistics, validity, and reliability at the measurement model. The goodness-of-fit statistics have shown that at the measurement model, the data has a satisfactory fit to the proposed model (χ2 = 1338.811, df = 917, p < 0.001, χ2/df = 1.560, RMSEA = 0.46, CFI = 0.943, IFI = 0.944) when compared against the recommended thresholds [79,80]. Next, composite reliability was calculated for all latent variables, and the results (ranging from 0.821 to 0.912) were all higher than the recommended threshold of 0.7, providing evidence of reliability [79]. Convergence validity was assessed using the average variance extracted (AVE) scores, which should be higher than the recommended 0.5 [80]. During this process, six attribute dimensions were removed due to low loadings or failed to produce satisfactory AVE. They were climates, safety and security, heritage, perceived value, communication, and hospitality. The AVE values from all constructs ranged from 0.517 to 0.696. Hence, all exceeded the recommended threshold. Discriminant validity can be assessed by comparing the squared correlations against the AVE. The results showed that evidence of discriminant validity generally exists. However, the squared correlation of cognitive evaluation and affective evaluation, as well as affective evaluation and satisfaction were higher than the AVE [80]. Therefore, an additional step is required to further assess discriminant validity by combining items between both latent variables, then compare the chi-square against the base model. The test produced changes in chi-square difference of 39.397 and 69.627. The degree of freedom were both 5, and the p-values were less than 0.001. Hence, evidence of discriminant validity was established. A summary of the confirmatory factor analysis can be seen in Table 2.
4.3. Structural Equation Modeling
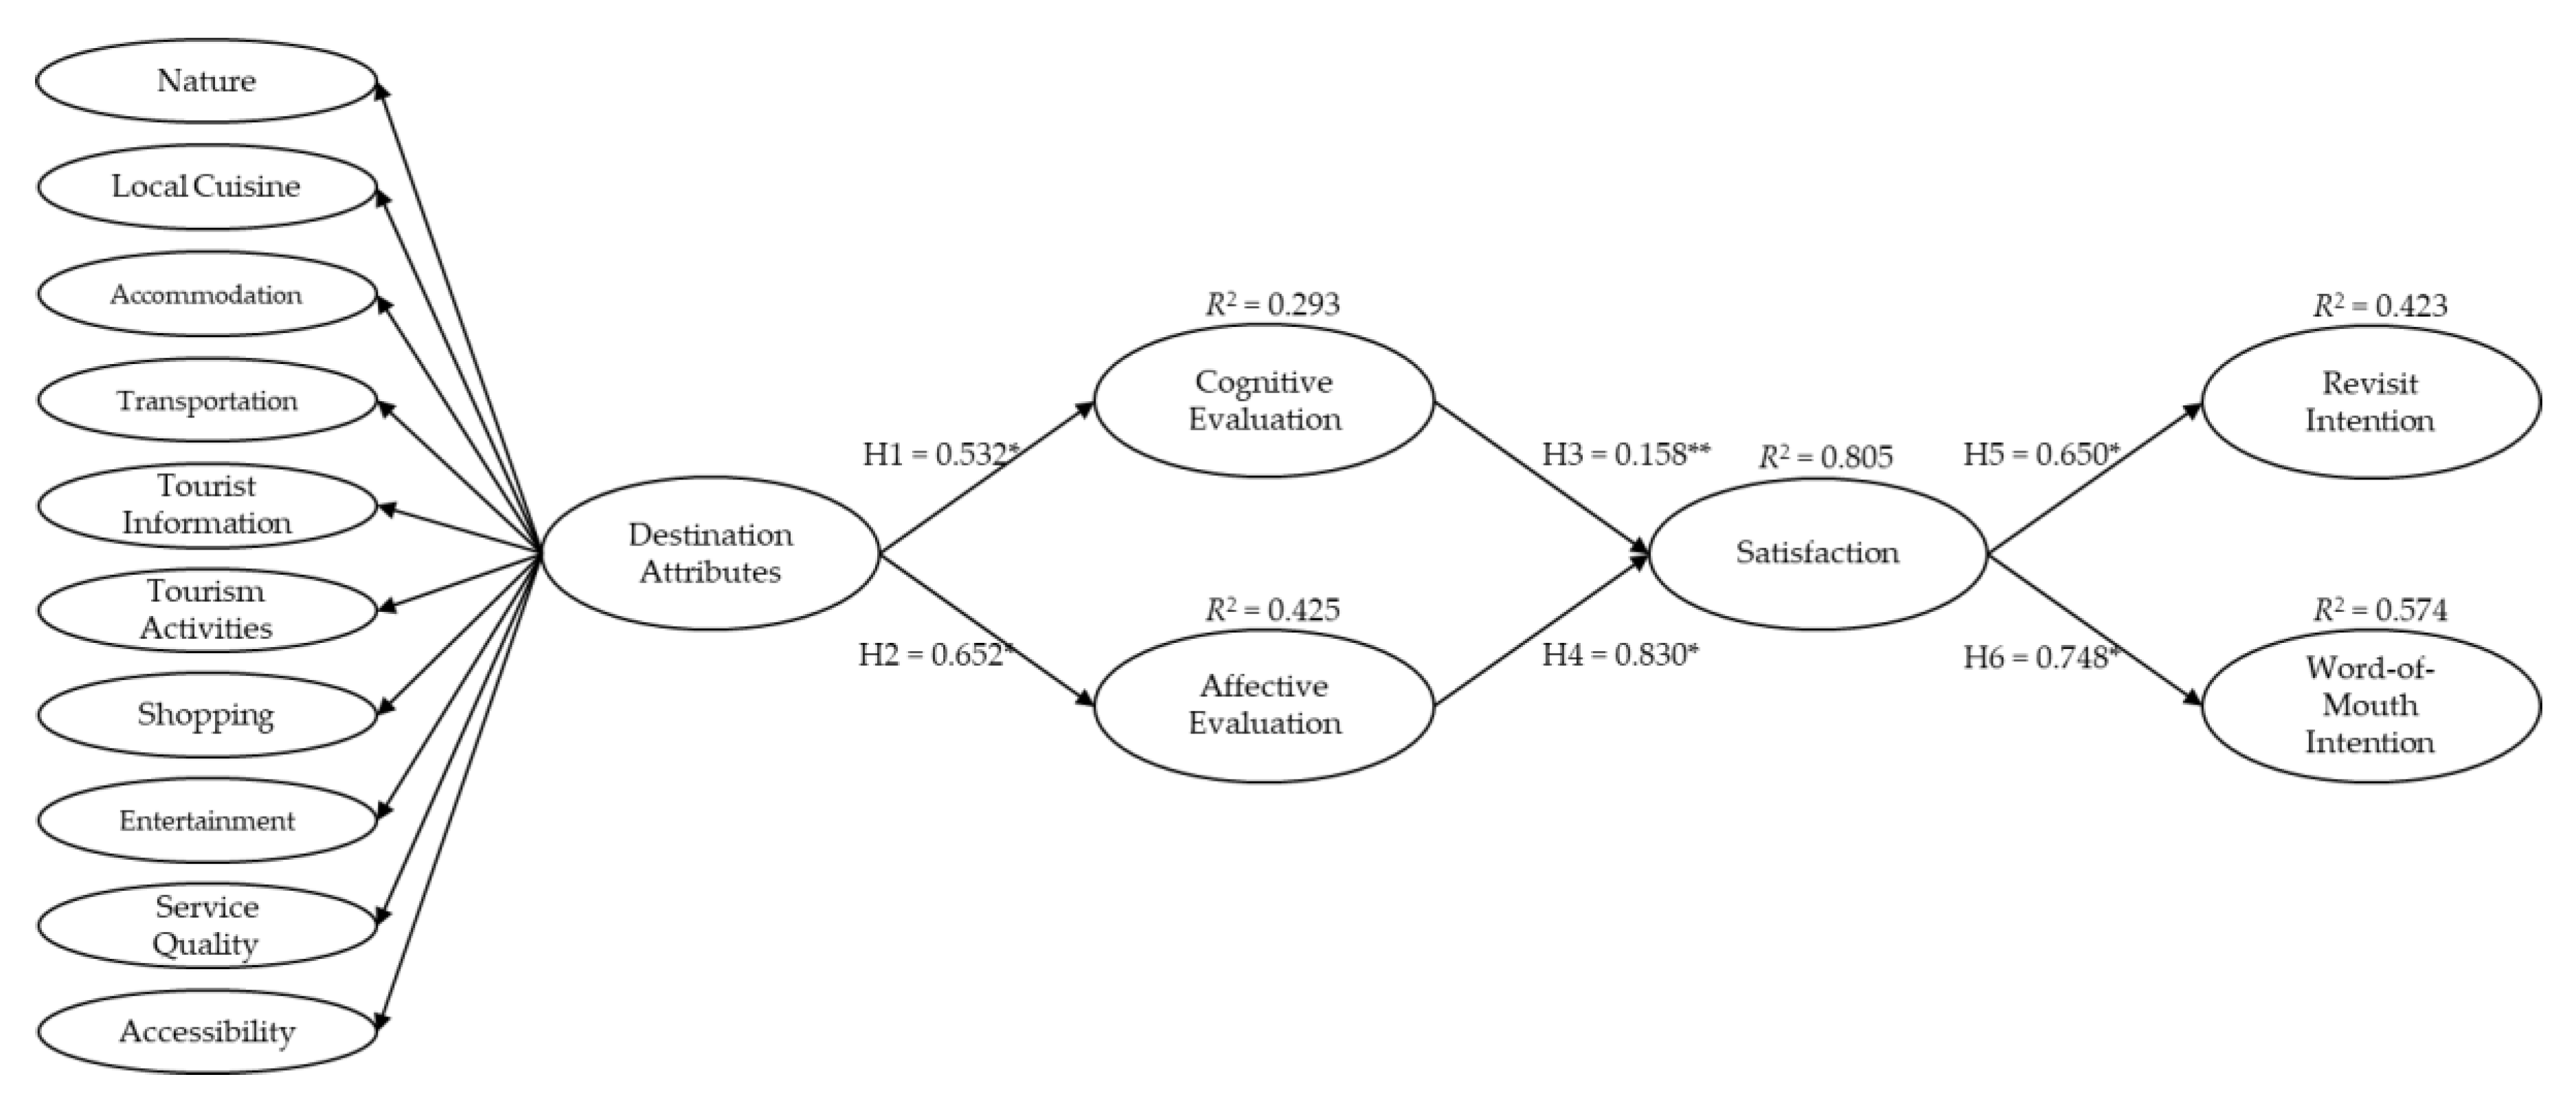
After establishing the fit, validity, and reliability of the measurement model, the second stage involves testing the proposed hypotheses. The goodness-of-fit statistics of the structural model have also been satisfactory (χ2 = 1517.722, df = 926, χ2/df = 1.639, RMSEA = 0.054, CFI = 0.921, IFI = 0.921, TLI = 0.915, NFI = 0.820, PGFI = 0.690). The proposed model indicated that the antecedents strongly predicted the dependent variables. Revisit intention and word-of-mouth intention were predicted by 42.3% and 57.4% of the total variance, respectively. Satisfaction was explained by 80.5% of its antecedents. Both cognitive and affective were explained by 29.3% and 42.5% of the variance in destination attributes, respectively. Interestingly, revisit intention and word-of-mouth were most influenced by different antecedent variables. Satisfaction produced the largest total impact on revision intention (65%), whereas affective evaluation had the largest total impact on word-of-mouth (83%). The cognitive evaluation had the least total impact on both of the final constructs. The relatively strong total impact and variance explained suggests that the proposed variables were effective in predicting revisit and word-of-mouth intention among the samples.
In terms of the proposed hypotheses, the first hypothesis was supposed by the results. The standardized estimate from destination attributes to cognitive evaluation was 0.532 and the relationship was significant at the 0.001 level. Likewise, destination attribute also significantly predicted affective evaluation (β = 0.653, p ≤ 0.001). Both cognitive (β = 0.158, p ≤ 0.01) and affective (β = 0.830, p ≤ 0.001) evaluation subsequently significantly predicted satisfaction. Lastly, satisfaction was significantly predicting both revisit intention (β = 0.650, p ≤ 0.001) and word-of-mouth intention (β = 0.758, p ≤ 0.001). Thus, all six proposed hypotheses were supported by the results. The summary of the SEM results is presented in Table 3. Figure 3 illustrates the proposed study model and the SEM results.
4.4. Indirect-Impact Assessment
The indirect-impact assessment was conducted to test the mediation effect between the variables within the study model. Bootstrapping method with 2000 samples and a 99% confidence level was conducted. The results have shown that the indirect effect of destination attributes on satisfaction (β = 1.139, p ≤ 0.01), revisit intention (β = 0.910, p ≤ 0.01), and word-of-mouth intention (β = 0.887, p ≤ 0.01) were all significant. Hence, the results indicate that cognitive evaluation, affective evaluation, and satisfaction are all partial mediators between destination attributes and the final two constructs. The indirect impact of cognitive evaluation on revisit intention (β = 0.131, p ≤ 0.01) and word-of-mouth intention (β = 0.128, p ≤ 0.01) were also significant. The results imply that satisfaction is also a partial mediator between cognitive evaluation and the two dependent variables. Lastly, the affective evaluation did not produce any significant indirect impact on revisit intention and word-of-mouth intention. Therefore, the results indicated that satisfaction was the complete or full mediator between affective evaluation and both revisit and word-of-mouth intention. Table 4 summarized the results of the indirect-impact assessment.
5. Discussions
5.1. General Discussions
The first area of discussion is the attribute dimensions. From the initial 16 attribute dimensions, 10 attributes were found to have produced adequate loadings to form a factor and retained in the final model. The absence of proposed attributes does not imply the negative rating of the attributes but rather reflects the inconsistency in the ratings by the research samples [11]. The inconsistency in ratings could be influenced by a number of factors. For example, it could be that not all tourists in the sample experienced an identical amount of services or visited the same attractions. In other words, due to varying itineraries, not all were exposed to the same products and services. Secondly, inconsistent ratings may reflect the volatility of service quality. Third, the evaluation of the experience is agreed to be subjective on each individual background. Although attributes were removed from the final, it does not necessarily mean they were rated negatively. Negative but consistent results would still form a factor, albeit the loading would be negative. Nevertheless, inconsistencies of attribute ratings still highlight areas requiring management of attention.
The first most notable attribute that did not form a factor was heritage. Given that previous research had universally identified cultural heritage to be the primary attraction of Samarkand [2,3,8], it is surprising to find heritage attributes to be omitted. Besides, the climate was also removed from the final model. The data collection was completed within a period of two weeks. Hence, seasonality should not be the cause. Still, among the inherited resources, nature and local cuisine were both positively rated. The results should not be surprising due to the relative lack of urbanization; the natural environment may still be in pristine condition. The local cuisine has been mentioned by previous researches as a potential area for development and promotion [3,4]. These findings already show a promise for future development in this area. In terms of the created resources, all six attributes were retained in the final model, implying the generally satisfactory evaluation of tourism-related services.
On the other hand, two supporting factors were retained: service quality and accessibility. Samarkand city is one of, if not the most visited, tourist destination in Uzbekistan. Therefore, transportation to and from the city has already been well established. Additionally, service quality was also rated consistently by the samples, indicating the relatively high standard of training among the service staff. The indication of high-quality training may explain the absence of hospitality and communication attributes. Hospitality measured the perceived friendliness of locals toward tourists, whereas communication measured the perceived ease of communication; while at the destination, both were rated inconsistently. However, service quality was consistent and positive. The findings may imply that although the locals may not always present themselves to be friendly and able to communicate well, the effort and goodwill were still perceived by the tourists. Lastly, situational conditions were both removed from the final model, indicating that both perceived value, and safety and security, were evaluated differently among the research samples. Given that perceived value can be highly subjective depending on the individual tourists’ background, the results were not surprising.
Furthermore, the destination attribute was a significant antecedent to both cognitive and affective evaluations. Interestingly, the variance explained score was higher for affective and cognitive as well as receiving a stronger correlation score. Moreover, affective evaluation produced approximately four times higher amplitude of influence on satisfaction than cognitive evaluation. The results imply that among the international tourists in Samarkand, the emotional response is a much more important determinant of satisfaction. In other words, tourists rely more on their feeling at an individual level when evaluating their experience. Given that tourism experience can be classified as an elective expenditure, it is expected to be evaluated similarly to luxury consumption. Thus, the utilitarian functional value becomes less important compared to hedonic value. Both revisit intention and word-of-mouth intention were strongly predicted by satisfaction and all other antecedents. Nonetheless, word-of-mouth intention still produced a slightly higher total variance explained score than revisit intention. Due to the higher costs and barriers associated with revisit and other psychological influences such as variety-seeking, it is expected that intention to recommend and sharing the experience were more likely.
5.2. Implications
Practically, the research findings have illustrated a number of noteworthy areas for interested stakeholders within the tourism sector in Samarkand. Many businesses and service providers measure the level of satisfaction of their guests on a regular basis via either their own monitoring surveys or from online user-generated content. However, businesses usually lack access to research on the destination level. Therefore, research of this type not only provides an overview of the strengths and weaknesses but also provides an update on the current state of the destination. In general, attributes that were retained in the final model would be considered the strengths, whereas those that were removed require further attention. A business may identify attributes that their business falls under and check how those attributes have been rated by tourists; bearing in mind that the strengths or weaknesses may not be dependent solely on their performance.
Furthermore, managers can look to combine their offering with other attributes to create a more inclusive tourism experience. For example, local cuisine and shopping were identified as strengths of Samarkand. Local restaurants may want to package some of their famous dishes and food items for tourists to purchase and take home. Alternatively, businesses may want to address critical components to the overall tourism experience but did not produce consistent enough results. For instance, Samarkand’s rich historical monuments were evaluated poorly and inconsistently due to poor interpretation or storytelling. Therefore, improving the quality of tour guides through extensive training, or setting up signs and signage explaining the history of such monuments may help improve tourists’ evaluation of the heritage dimension.
Another critical finding for businesses and site managers was the relative importance of the affective evaluation construct. As a strong mediator between destination attributes and satisfaction, it highlights the role of emotional or hedonic value among travelers. Promotional messages and services that can persuade positive emotional benefits when visiting Samarkand should be effective to attract new and retain existing tourists. Therefore, it is recommended that marketers should focus on the affective motivation for traveling and memorable experiences. A study on memorable tourism experiences highlighted that not all experiences encountered by tourists are being remembered. Tourists choose to remember and form a longer-lasting memory than those they do not remember, many of which are affective-based.
Theoretically, this research project contributed in a few ways. First, this study was one of the only few available comprehensive assessments of a tourist destination in Uzbekistan. A study-specific to Samarkand city could hardly be found currently, especially in English. As an emerging destination in the global tourism market, Samarkand city and its tourism stakeholders would benefit from such an independent assessment. The study has also compiled an extensive list of destination attributes to be utilized in replica research in the future. Other constructs included in the study model have also been verified to explain the post-visit evaluation process of tourists. Hence, the conceptualized model should be able to provide a basis for future updates and extensions.
5.3. Limitations and Recommendations for Future Research
The study has a few limitations to be addressed. This research has only sampled a smaller number of international visitors relative to the total number of international arrivals. Thus, readers should view the findings of this research with caution regarding the generalizability of the entire population of international visitors. Secondly, tourists mostly have their unique trip itinerary, and not all visitors experienced the same amount. Therefore, the results should be interpreted with this limitation in mind. Although the study attempted to comply with a comprehensive list of destination attributes, the tourism industry is ever-evolving and new products and services are always being introduced as well as new attractions being developed. Hence, the study only represents a specific period of Samarkand. It is also recommended for future research projects to periodically measure tourist attribute evaluation for the most up-to-date results. The study model was first conceptualized for this present study and additional validation could only further strengthen its robustness. Lastly, the study only focused on international visitors. However, domestic visitors also account for a significant portion of the total tourists in Samarkand. Therefore, future research may like to compare tourist evaluations between domestic and international tourists to provide more useful knowledge to both businesses and site managers.
Author Contributions
Conceptualization, S.J. and K.K.; formal analysis, K.K.; data curation, S.J. and A.K.; writing—original draft preparation, S.J. and K.K.; writing—review and editing, K.K. and A.K.; supervision, K.K. All authors have read and agreed to the published version of the manuscript.
Funding
This research received no external funding.
Conflicts of Interest
The authors declare no conflict of interest.
Appendix A

Table A1.
Measurement items.
| Constructs | Measurement Items (Standardized Factor Loadings) |
|---|---|
| Climate | Comfortable climate for tourism * Pleasant climate for tourism * Cleanliness/Sanitation of natural areas * |
| Nature | Natural wonders/scenery (0.767) Flora and fauna (0.830) Well-preserved natural areas (0.848) |
| Heritage | Historic/Heritage sites and museums * Artistic/Architectural features * Traditional arts * |
| Local cuisine | Variety of local cuisine (0.803) Quality of local cuisine (0.830) Variety of opportunities to experience local ways of life (0.834) |
| Accommodation | Accommodation quality (0.802) Variety of accommodation options (0.929) Standards of accommodation (0.831) |
| Transportation | Airport efficiency/quality (0.850) Visitor accessibility to attraction sites (0.895) Quality of local transport systems (0.889) |
| Tourist information | Availability of tourism guidance and information (0.846) Financial institutions and currency exchange facilities (0.908) Telecommunication system for tourists (0.852) |
| Tourism activities | Variety of nature/water-based activities (i.e., diving and hiking) (0.930) Quality of nature/water-based activities (i.e., diving and hiking) (0.929) Variety of unique sports/games/recreational/festival activities (0.856) |
| Shopping | Quality of shopping facilities (0.857) Value for money of shopping merchandise (0.849) Diversity of shopping experiences (0.881) |
| Entertainment | Variety of entertainment options (i.e., cultural shows and traditional performances) (0.888) Quality of entertainment (i.e., cultural shows and traditional performances) (0.855) Nightlife (0.892) |
| Service quality | Service staff are courteous and friendly (0.811) Samarkand offers highly-customized services (0.850) Customs/immigration officials are courteous and friendly (0.914) |
| Accessibility | Easy to find flights to Samarkand (0.820) Ease of obtaining an entry visa to Samarkand (0.842) Ease of combining travel to Samarkand with other destinations (0.796) |
| Hospitality | Friendliness of residents towards tourists * Resident support for the tourism industry * Local people are willing to help tourists * |
| Communication | Ease of communication between tourists and hotel/service staff * Ease of communication between tourists and local residents * Signage/directions clear and easy to understand * |
| Perceived value | Value for money in Samarkand * Accommodation prices * Price of Samarkand visit relative to competitor destinations * |
| Safety and security | Level of tourist safety in Samarkand * Security/safety policy for tourists * Health/medical facilities to serve tourists * |
| Cognitive evaluation | Samarkand provides a superior traveling experience compared to other places I have visited (0.748) Overall quality of Samarkand’s tourism is high (0.816) I believe Samarkand provides more benefits to tourists than other destinations (0.765) |
| Affective evaluation | I love traveling in Samarkand (0.782) I like Samarkand more than other destinations (0.725) I will have wonderful memories about my visit to Samarkand (0.847) |
| Satisfaction | I believe I did the right thing when I chose to visit Samarkand (0.780) I am happy about my decision to visit Samarkand (0.821) Overall, I am satisfied with my decision to visit Samarkand (0.791) |
| Revisit intention | If I am given an opportunity, I intend to continue visiting Samarkand (0.835) I will consider Samarkand on my future holidays (0.795) I consider Samarkand to be my preferred holiday choice (0.816) |
| Word-of-mouth intention | I will tell my friends/family to visit Samarkand (0.829) I will recommend my friends/family to visit Samarkand (0.838) I will say positive things about Samarkand to my friends/family (0.817) |
* Item removed due to low loadings (<0.5).
References
- Bulai, M.; Eva, M.; Rosu, L. Analysis of tourism features and development strategy for memorial complex “Imam Al Bukhari Mausoleum”, Samarkand region, Uzbekistan. Tékhne 2016, 14, 134–143. [Google Scholar] [CrossRef]
- Olimovich, D.I. Tourism potential of Uzbekistan. Lucr. Semin. Geogr. Dimitrie Cantemir 2015, 40, 125–130. [Google Scholar]
- Kim, A. Analysis and perspectives of tourism development in Uzbekistan. AGALI J. 2013, 3, 87–101. [Google Scholar]
- Khusenova, M.G.; Rakhmonov, S.S. The developmetn of tourism in Uzbekistan (as an example of Samarkand region). New Univ. Econ. Law. 2018, 1, 9–11. [Google Scholar]
- The Tashkent Times Number of Visitors to Uzbekistan Doubled in 2018. Available online: https://tashkenttimes.uz/national/3463-number-of-visitors-to-uzbekistan-doubled-in-2018 (accessed on 10 May 2020).
- Uzbektourism. The Number of foreign Tourists in Devember 2018 and December 2019. Available online: https://uzbektourism.uz/ru/research (accessed on 20 June 2020).
- Kahle, D.; Wickham, H. ggmap: Spatial visualization with ggplot2. R J. 2013, 5, 144–161. [Google Scholar] [CrossRef] [Green Version]
- Suyarov, A. The present condition of tourism in Samarkand, the results of research survey from tourists in region. SCOPE Acad. HOUSE BM Publ. 2017, 103, 41–46. [Google Scholar]
- Paramonov, V.; Strokov, A.; Khoshnazarov, S.; Abdurazakov, A.; Abdujabborov, A.; Nishonboev, K.; Sayfulin, R.; Chupik, V.; Ramazonov, S.; Khashimov, S. Regional cooperation in central Asia: A view from Uzbekistan (II). Probl. Econ. Transit. 2006, 49, 3–93. [Google Scholar] [CrossRef]
- Crouch, G.I. Destination competitiveness: An analysis of determinant attributes. J. Travel Res. 2011, 50, 27–45. [Google Scholar] [CrossRef]
- Kiatkawsin, K.; Han, H. An alternative interpretation of attitude and extension of the value-attitude-behavior hierarchy: The destination attributes of Chiang Mai, Thailand. Asia Pac. J. Tour. Res. 2017, 22, 481–500. [Google Scholar] [CrossRef]
- Chi, X.; Lee, S.K.; Ahn, Y.; Kiatkawsin, K. Tourist-perceived quality and loyalty intentions towards rural tourism in China. Sustainability 2020, 12, 3614. [Google Scholar] [CrossRef]
- Kozak, M. Measuring tourist satisfaction with multiple destination attributes. Tour. Anal. 2003, 7, 229–240. [Google Scholar] [CrossRef]
- McIntyre, G. Sustainable Tourism Development: Guide for Local Planners; World Tourism Organization (WTO): Madrid, Spain, 1993. [Google Scholar]
- Coltman, M.M. Tourism Marketing; Van Nostrand Reinhold: New York, NY, USA, 1989. [Google Scholar]
- Bowen, J.T.; Chen, S.-L. The relationship between customer loyalty and customer satisfaction. Int. J. Contemp. Hosp. Manag. 2001, 13, 213–217. [Google Scholar] [CrossRef]
- Chen, C.-F.; Chen, F.-S. Experience quality, perceived value, satisfaction and behavioral intentions for heritage tourists. Tour. Manag. 2010, 31, 29–35. [Google Scholar] [CrossRef]
- Al-Ansi, A.; Han, H. Role of halal-friendly destination performances, value, satisfaction, and trust in generating destination image and loyalty. J. Destin. Mark. Manag. 2019, 13, 51–60. [Google Scholar] [CrossRef]
- Eusébio, C.; Vieira, A.L. Destination attributes’ evaluation, satisfaction and behavioural intentions: A structural modelling approach. Int. J. Tour. Res. 2013, 15, 66–80. [Google Scholar] [CrossRef]
- Hwang, J.; Lee, J. Relationships among senior tourists’ perceptions of tour guides’ professional competencies, rapport, satisfaction with the guide service, tour satisfaction, and word of mouth. J. Travel Res. 2019, 58, 1331–1346. [Google Scholar] [CrossRef]
- Kiatkawsin, K.; Han, H. What drives customers’ willingness to pay price premiums for luxury gastronomic experiences at michelin-starred restaurants? Int. J. Hosp. Manag. 2019, 82, 209–219. [Google Scholar] [CrossRef]
- Bentley, T.A.; Page, S.J.; Macky, K.A. Adventure tourism and adventure sports injury: The New Zealand experience. Appl. Ergon. 2007, 38, 791–796. [Google Scholar] [CrossRef]
- Campón-Cerro, A.M.; Hernández-Mogollón, J.M.; Alves, H. Sustainable improvement of competitiveness in rural tourism destinations: The quest for tourist loyalty in Spain. J. Destin. Mark. Manag. 2017, 6, 252–266. [Google Scholar] [CrossRef]
- Oppermann, M. Tourism destination loyalty. J. Travel Res. 2000, 39, 78–84. [Google Scholar] [CrossRef]
- Yuksel, A.; Yuksel, F.; Bilim, Y. Destination attachment: Effects on customer satisfaction and cognitive, affective and conative loyalty. Tour. Manag. 2010, 31, 274–284. [Google Scholar] [CrossRef]
- Bui, N.A.; Kiatkawsin, K. Examining vietnamese hard-adventure tourists’ visit intention using an extended model of goal-directed behavior. Sustainability 2020, 12, 1747. [Google Scholar] [CrossRef] [Green Version]
- Airey, D.; Shackley, M. Tourism development in Uzbekistan. Tour. Manag. 1997, 18, 199–208. [Google Scholar] [CrossRef]
- Sobirov, B. Innovative development of tourism in Uzbekistan. Am. J. Econ. Bus. Manag. 2018, 1, 60–74. [Google Scholar] [CrossRef]
- Bobojonovna, B.D. The ways of tourism development in Uzbekistan. Asian J. Multidimens. Res. 2019, 8, 42–47. [Google Scholar] [CrossRef]
- Baxtishodovich, B.S.; Suyunovich, T.I.; Kholiqulov, A. The start-up of tourism in central Asia case of Uzbekistan. World Sci. News 2017, 2, 219–237. [Google Scholar]
- Amriddinova, R.S.; Tursunqulov, I.A. The geography of specific tourism types and the way sof the developmnet in the Republic of Uzbekistan. Am. J. Econ. Bus. Manag. 2018, 1, 97–105. [Google Scholar] [CrossRef]
- Kantarci, K.; Uysal, M.; Magnini, V.P. Tourism in Central Asia: Cultural Potential and Challenges; CRC Press: Boca Raton, FL, USA, 2014. [Google Scholar]
- Fagan, B. From Stonehenge to Samarkand: An Anthology of Archaeological Travel Writing; Oxford University Press: New York, NY, USA, 2006; ISBN 978-0-19-516091-8. [Google Scholar]
- Weise, K. The urben world heritage properties of Kathmandu and Samarkand. In Routledge Handbook on History Urban Landscapes in the Asia-Pacific; Routledge: New York, NY, USA, 2019. [Google Scholar]
- Mantellini, S. Settlement dynamics, territory exploitation, and trade routes in the ancient Samarkand oasis (Uzbekistan). In Proceedings of the B Genito and L. Cateran Cura Archeologia Delle “Vie Della Seta”: Percorsi Immagini E Culture Materiale. II Ciclo di Conferenze, Naples, Italy, 6 March–22 May 2013; pp. 37–59. [Google Scholar]
- McKercher, B.; du Cros, H. Cultural Tourism: The Partnership between Tourism and Cultural Heritage Management; The Haworth Press: Binghamton, NY, USA, 2002. [Google Scholar]
- Gnoth, J.; Zins, A.H. Developing a tourism cultural contact scale. J. Bus. Res. 2013, 66, 738–744. [Google Scholar] [CrossRef]
- del Bosque, I.R.; san Martín, H. Tourist satisfaction a cognitive-affective model. Ann. Tour. Res. 2008, 35, 551–573. [Google Scholar] [CrossRef]
- san Martín, H.; del Bosque, I.A.R. Exploring the cognitive–affective nature of destination image and the role of psychological factors in its formation. Tour. Manag. 2008, 29, 263–277. [Google Scholar] [CrossRef]
- Yoon, Y.; Uysal, M. An examination of the effects of motivation and satisfaction on destination loyalty: A structural model. Tour. Manag. 2005, 26, 45–56. [Google Scholar] [CrossRef]
- Kim, J.-H. The antecedents of memorable tourism experiences: The development of a scale to measure the destination attributes associated with memorable experiences. Tour. Manag. 2014, 44, 34–45. [Google Scholar] [CrossRef]
- Crouch, G.I.; Ritchie, J.B. Tourism, competitiveness, and societal prosperity. J. Bus. Res. 1999, 44, 137–152. [Google Scholar] [CrossRef]
- Dwyer, L.; Kim, C. Destination competitiveness: Determinants and indicators. Curr. Issues Tour. 2003, 6, 369–414. [Google Scholar] [CrossRef]
- Dwyer, L.; Cvelbar, L.K.; Mihalič, T.; Koman, M. Integrated destination competitiveness model: Testing its validity and data accessibility. Tour. Anal. 2014, 19, 1–17. [Google Scholar] [CrossRef]
- Klenosky, D.B. The “pull” of tourism destinations: A means-end investigation. J. Travel Res. 2002, 40, 396–403. [Google Scholar] [CrossRef]
- Enright, M.J.; Newton, J. Determinants of tourism destination competitiveness in Asia Pacific: Comprehensiveness and universality. J. Travel Res. 2005, 43, 339–350. [Google Scholar] [CrossRef]
- Enright, M.J.; Newton, J. Tourism destination competitiveness: A quantitative approach. Tour. Manag. 2004, 25, 777–788. [Google Scholar] [CrossRef]
- Choi, M.J.; Heo, C.Y.; Law, R. Progress in shopping tourism. J. Travel Tour. Mark. 2016, 33, 1–24. [Google Scholar] [CrossRef]
- Choi, M.; Law, R.; Heo, C.Y. Shopping destinations and trust—Tourist attitudes: Scale development and validation. Tour. Manag. 2016, 54, 490–501. [Google Scholar] [CrossRef]
- Choi, S.; Choi, C.; Mattila, A.S. Are all smiles perceived equal? The role of service provider’s gender. Serv. Sci. 2020, 12, 1–7. [Google Scholar] [CrossRef]
- Hwang, J.; Lee, J. A strategy for enhancing senior tourists’ well-being perception: Focusing on the experience economy. J. Travel Tour. Mark. 2019, 36, 314–329. [Google Scholar] [CrossRef]
- Aseres, S.A.; Sira, R.K. An exploratory study of ecotourism services quality (ESQ) in Bale Mountains National Park (BMNP), Ethiopia: Using an ECOSERV model. Ann. Leis. Res. 2019, 1–21. [Google Scholar] [CrossRef]
- Dwivedi, A.; Nayeem, T.; Murshed, F. Brand experience and consumers’ willingness-to-pay (WTP) a price premium: Mediating role of brand credibility and perceived uniqueness. J. Retail. Consum. Serv. 2018, 44, 100–107. [Google Scholar] [CrossRef]
- Hooper, J. A destination too far? Modelling destination accessibility and distance decay in tourism. GeoJournal 2015, 80, 33–46. [Google Scholar] [CrossRef]
- Mckercher, B.; Lew, A.A. Distance decay and the impact of effective tourism exclusion zones on international travel flows. J. Travel Res. 2003, 42, 159–165. [Google Scholar] [CrossRef]
- Nunkoo, R.; Ramkissoon, H. Developing a community support model for tourism. Ann. Tour. Res. 2011, 38, 964–988. [Google Scholar] [CrossRef]
- Ritchie, J.R.B.; Crouch, G.I.; Hudson, S. Assessing the role of consumers in the measurment of destination competitiveness and sustainability. Tour. Anal. 2000, 5, 69–76. [Google Scholar]
- Sanchez, J.; Callarisa, L.; Rodriguez, R.M.; Moliner, M.A. Perceived value of the purchase of a tourism product. Tour. Manag. 2006, 27, 394–409. [Google Scholar] [CrossRef]
- George, R. Tourist’s perceptions of safety and security while visiting Cape Town. Tour. Manag. 2003, 24, 575–585. [Google Scholar] [CrossRef]
- Amir, A.F.; Ismail, M.N.I.; See, T.P. Sustainable tourist environment: Perception of international women travelers on safety and security in Kuala Lumpur. Procedia-Soc. Behav. Sci. 2015, 168, 123–133. [Google Scholar] [CrossRef] [Green Version]
- Prayag, G.; Hosany, S.; Muskat, B.; Del Chiappa, G. Understanding the relationships between tourists’ emotional experiences, perceived overall image, satisfaction, and intention to recommend. J. Travel Res. 2017, 56, 41–54. [Google Scholar] [CrossRef] [Green Version]
- Battour, M.; Ismail, M.N.; Battor, M.; Awais, M. Islamic tourism: An empirical examination of travel motivation and satisfaction in Malaysia. Curr. Issues Tour. 2017, 20, 50–67. [Google Scholar] [CrossRef]
- Han, H.; Al-Ansi, A.; Olya, H.G.T.; Kim, W. Exploring halal-friendly destination attributes in South Korea: Perceptions and behaviors of Muslim travelers toward a non-Muslim destination. Tour. Manag. 2019, 71, 151–164. [Google Scholar] [CrossRef]
- Han, H.; Kiatkawsin, K.; Jung, H.; Kim, W. The role of wellness spa tourism performance in building destination loyalty: The case of Thailand. J. Travel Tour. Mark. 2018, 35, 595–610. [Google Scholar] [CrossRef]
- Dietz, J. Satisfaction: A behavioral perspective on the consumer. J. Consum. Mark. 1997, 14, 401–404. [Google Scholar]
- Oliver, R.L. Satisfaction: A Behavioral Perspective on the Consumer; Routledge: New York, NY, USA, 2015. [Google Scholar]
- Oliver, R.L. A cognitive model of the antecedents and consequences of satisfaction decisions. J. Mark. Res. 1980, 17, 460–469. [Google Scholar] [CrossRef]
- Han, H.; Hyun, S.S. An extension of the four-stage loyalty model: The critical role of positive switching barriers. J. Travel Tour. Mark. 2012, 29, 40–56. [Google Scholar] [CrossRef]
- Can, V.V. Destination loyalty as a consequence of satisfaction and switching barriers. Tour. Anal. 2014, 19, 273–286. [Google Scholar] [CrossRef]
- Han, H.; Ryu, K. The theory of repurchase decision-making (TRD): Identifying the critical factors in the post-purchase decision-making process. Int. J. Hosp. Manag. 2012, 31, 786–797. [Google Scholar] [CrossRef]
- Lee, Y.-K.; Ahn, W.-K.; Kim, K. A study on the moderating role of alternative attractiveness in the relationship between relational benefits and customer loyalty. Int. J. Hosp. Tour. Adm. 2008, 9, 52–70. [Google Scholar] [CrossRef]
- El-Manstrly, D. Enhancing customer loyalty: Critical switching cost factors. J. Serv. Manag. 2016, 27, 144–169. [Google Scholar] [CrossRef] [Green Version]
- Kim, E.J.; Choi, C.; Tanford, S. Influence of scarcity on travel decisions and cognitive dissonance. Asia Pac. J. Tour. Res. 2020, 25, 1–15. [Google Scholar] [CrossRef] [Green Version]
- Hwang, J.; Lee, J. Understanding customer-customer rapport in a senior group package context. Int. J. Contemp. Hosp. Manag. 2019, 31, 2187–2204. [Google Scholar] [CrossRef]
- Chi, C.G.-Q.; Qu, H. Examining the structural relationships of destination image, tourist satisfaction and destination loyalty: An integrated approach. Tour. Manag. 2008, 29, 624–636. [Google Scholar] [CrossRef]
- Lee, C.-K.; Yoon, Y.-S.; Lee, S.-K. Investigating the relationships among perceived value, satisfaction, and recommendations: The case of the Korean DMZ. Tour. Manag. 2007, 28, 204–214. [Google Scholar] [CrossRef]
- Hair, J.F.; Black, W.C.; Babin, B.J.; Anderson, R.E.; Tatham, R.L. Multivariate Data Analysis; Prentice Hall: Upper Saddle River, NJ, USA, 1998. [Google Scholar]
- Anderson, J.C.; Gerbing, D.W. Structural equation modeling in practice: A review and recommended two-step approach. Psychol. Bull. 1988, 103, 411. [Google Scholar] [CrossRef]
- Bagozzi, R.P.; Yi, Y. On the evaluation of structural equation models. J. Acad. Mark. Sci. 1988, 16, 74–94. [Google Scholar] [CrossRef]
- Fornell, C.; Larcker, D.F. Structural Equation Models with Unobservable Variables and Measurement Error: Algebra and Statistics; SAGE Publications Sage CA: Los Angeles, CA, USA, 1981. [Google Scholar]
Figure 1.
Map of Uzbekistan.

Figure 2.
Study model.

Figure 3.
Study model and the SEM results; Note = * p < 0.001, ** p < 0.01.

Table 1.
Demographic information (n = 222).
| Variable | Category | Distribution | Valid Percentage |
|---|---|---|---|
| Gender | Male | 139 | 62.6 |
| Female | 83 | 37.4 | |
| Age | Mean | 44.6 | |
| Country of origin | France | 26 | 11.7 |
| Spain | 25 | 11.3 | |
| Germany | 21 | 9.5 | |
| Japan | 18 | 8.1 | |
| Italy | 13 | 5.9 | |
| India | 10 | 4.5 | |
| China | 10 | 4.5 | |
| USA | 10 | 4.5 | |
| Nepal | 8 | 3.6 | |
| Others | 81 | 36.4 | |
| Household income (USD) | Under 24,999 | 43 | 21.4 |
| 25,000–39,999 | 68 | 33.8 | |
| 40,000–54,999 | 50 | 24.9 | |
| 55,000–69,999 | 24 | 11.9 | |
| 70,000–84,999 | 8 | 4.0 | |
| 85,000–99,999 | 4 | 2.0 | |
| Over 100,000 | 4 | 2.0 | |
| Educational Background | High school or below | 41 | 18.6 |
| Bachelor’s degree | 92 | 41.6 | |
| Master’s degree | 71 | 32.1 | |
| Doctorate | 12 | 5.4 | |
| Others | 5 | 2.3 | |
| Occupation type | Full-time employment | 102 | 70.0 |
| Full-time self-employed | 64 | 13.7 | |
| Part-time employment | 22 | 3.2 | |
| Unemployed | 11 | 2.7 | |
| Student | 10 | 3.2 | |
| Retired | 12 | 1.1 | |
| Prior visit(s) frequency to Samarkand | First time | 143 | 64.4 |
| 1 time | 38 | 17.1 | |
| 2–4 time | 38 | 17.1 | |
| 5–10 times | 2 | 0.9 | |
| More than 10 times | 1 | 0.5 | |
| Visit companionship | Alone | 38 | 17.1 |
| Family/relatives | 91 | 41.0 | |
| Friends | 64 | 28.8 | |
| Organized group tours | 29 | 13.1 | |
| Length of stay | 3 nights or less | 96 | 43.2 |
| 4–6 nights | 86 | 38.7 | |
| 7–10 nights | 26 | 11.7 | |
| More than 10 nights | 14 | 6.3 | |
| Accommodation type | 1–3 star hotel | 96 | 43.2 |
| 3–5 star hotel | 54 | 24.3 | |
| Hostel/guesthouse | 68 | 30.6 | |
| Service apartment/home-stay | 3 | 1.4 | |
| Camping sites/tent | 1 | 0.5 |
Table 2.
Summary of the confirmatory factor analysis results.
| ATT | COG | AFF | SAT | REV | WOM | |
|---|---|---|---|---|---|---|
| ATT | 0.912 a | |||||
| COG | 0.483 b (0.233) | 0.821 | ||||
| AFF | 0.599 (0.358) | 0.801 (0.642) | 0.836 | |||
| SAT | 0.550 (0.302) | 0.618 (0.382) | 0.835 (0.697) | 0.873 | ||
| REV | 0.543 (0.295) | 0.666 (0.444) | 0.700 (0.490) | 0.524 (0.275) | 0.859 | |
| WOM | 0.523 (0.273) | 0.554 (0.307) | 0.712 0.507 | 0.695 (0.483) | 0.743 (0.552) | 0.870 |
| AVE | 0.517 | 0.606 | 0.630 | 0.696 | 0.670 | 0.691 |
Note 1: Goodness-of-fit statistics: χ2 = 1338.811, df = 917, p < 0.001, χ2/df = 1.560, RMSEA = 0.46, CFI = 0.943, IFI = 0.944. Note 2: ATT = Destination Attributes, COG = Cognitive evaluation, AFF = Affective evaluation, SAT = Satisfaction, REV = Revisit intention, WOM = Word-of-mouth intention. a = Composite reliabilities are along the diagonal. b = Correlations. Squared correlations are in parentheses.
Table 3.
Summary of the structural equation modeling (SEM) results.
| Standardized Estimate | t-Value | Hypothesis | |||
|---|---|---|---|---|---|
| H1: Destination attributes | → | Cognitive evaluation | 0.532 | 4.889 * | Supported |
| H2: Destination attributes | → | Affective evaluation | 0.652 | 6.002 * | Supported |
| H3: Cognitive evaluation | → | Satisfaction | 0.158 | 2.789 ** | Supported |
| H4: Affective evaluation | → | Satisfaction | 0.830 | 10.821 * | Supported |
| H5: Satisfaction | → | Revisit intention | 0.650 | 8.382 * | Supported |
| H6: Satisfaction | → | Word-of-mouth intention | 0.758 | 9.818 * | Supported |
| Goodness-of-fit statistics (Final model): χ2 = 1517.722, df = 926, χ2/df = 1.639, RMSEA = 0.054, CFI = 0.921, IFI = 0.921, TLI = 0.915, NFI = 0.820, PGFI = 0.690 | Total variance explained: R2 of COG = 0.293 R2 of AFF = 0.425 R2 of SAT = 0.805 R2 of REV = 0.423 R2 of WOM = 0.574 | Total impact on REV and WOM: ATT = 0.406, 0.474 COG = 0.103, 0.120 AFF = 0.540, 0.830 SAT = 0.650, 0.758 | |||
Note 1: ATT = Destination Attributes, COG = Cognitive evaluation, AFF = Affective evaluation, SAT = Satisfaction, REV = Revisit intention, WOM = Word-of-mouth intention. Note 2: * p ≤ 0.001, ** p ≤ 0.01.
Table 4.
Indirect-impact assessment.
| Indirect Effect of | On | ||
|---|---|---|---|
| SAT | REV | WOM | |
| ATT | 1.139 * | 0.910 * | 0.887 * |
| COG | - | 0.131 * | 0.128 * |
| AFF | - | 0.612 | 0.597 |
Note 1. ATT = Destination Attributes, COG = Cognitive evaluation, AFF = Affective evaluation, SAT = Satisfaction, REV = Revisit intention, WOM = Word-of-mouth intention. Note 2. * p ≤ 0.01.
© 2020 by the authors. Licensee MDPI, Basel, Switzerland. This article is an open access article distributed under the terms and conditions of the Creative Commons Attribution (CC BY) license (http://creativecommons.org/licenses/by/4.0/).
Share and Cite
MDPI and ACS Style
Jumanazarov, S.; Kamilov, A.; Kiatkawsin, K. Impact of Samarkand’s Destination Attributes on International Tourists’ Revisit and Word-of-Mouth Intention. Sustainability 2020, 12, 5154. https://0-doi-org.brum.beds.ac.uk/10.3390/su12125154
AMA Style
Jumanazarov S, Kamilov A, Kiatkawsin K. Impact of Samarkand’s Destination Attributes on International Tourists’ Revisit and Word-of-Mouth Intention. Sustainability. 2020; 12(12):5154. https://0-doi-org.brum.beds.ac.uk/10.3390/su12125154
Chicago/Turabian StyleJumanazarov, Sanjar, Alisher Kamilov, and Kiattipoom Kiatkawsin. 2020. "Impact of Samarkand’s Destination Attributes on International Tourists’ Revisit and Word-of-Mouth Intention" Sustainability 12, no. 12: 5154. https://0-doi-org.brum.beds.ac.uk/10.3390/su12125154
Note that from the first issue of 2016, this journal uses article numbers instead of page numbers. See further details here.