Article

Microbial Water Quality Conditions Associated with Livestock Grazing, Recreation, and Rural Residences in Mixed-Use Landscapes

1
Department of Plant Sciences, University of California, Davis, CA 95616, USA
2
Division of Agriculture and Natural Resources, University of California, Davis, CA 95616, USA
*
Author to whom correspondence should be addressed.
Sustainability 2020, 12(12), 5207; https://0-doi-org.brum.beds.ac.uk/10.3390/su12125207
Submission received: 20 May 2020 / Revised: 23 June 2020 / Accepted: 24 June 2020 / Published: 26 June 2020
(This article belongs to the Section Environmental Sustainability and Applications)

Abstract

:
Contamination of surface waters with microbial pollutants from fecal sources is a significant human health issue. Identification of relative fecal inputs from the mosaic of potential sources common in rural watersheds is essential to effectively develop and deploy mitigation strategies. We conducted a cross-sectional longitudinal survey of fecal indicator bacteria (FIB) concentrations associated with extensive livestock grazing, recreation, and rural residences in three rural, mountainous watersheds in California, USA during critical summer flow conditions. Overall, we found that 86% to 87% of 77 stream sample sites across the study area were below contemporary Escherichia coli-based microbial water quality standards. FIB concentrations were lowest at recreation sites, followed closely by extensive livestock grazing sites. Elevated concentrations and exceedance of water quality standards were highest at sites associated with rural residences, and at intermittently flowing stream sites. Compared to national and state recommended E. coli-based water quality standards, antiquated rural regional policies based on fecal coliform concentrations overestimated potential fecal contamination by as much as four orders of magnitude in this landscape, hindering the identification of the most likely fecal sources and thus the efficient targeting of mitigation practices to address them.

1. Introduction

Contamination of surface waters with pathogens from fecal sources is a significant human health issue [1,2,3]. The concentrations of predominantly non-pathogenic fecal indicator bacteria (FIB), such as Escherichia coli (E. coli) and fecal coliforms (FCs) are commonly monitored and regulated in waterways as technologically simple and economical proxies to safeguard public health from pathogens of concern such as Cryptosporidium spp., Giardia spp., and E. coli O157:H7 [4,5,6]. Ideally, there is a high correlation between the presence of FIB at certain concentrations (i.e., microbiological water quality standards), direct fecal contamination, waterborne pathogens, and human health risk. However, this assumption has become increasingly challenged by a growing body of research (e.g., [4,5,7]), and the scientific search for improved proxies to detect microbial health risks continues with a focus on molecular and other methods (e.g., [8,9,10]). Despite their shortcomings, FIB-based microbial water quality standards remain the primary policy approach to microbial water quality protection [11,12]. Contemporary research demonstrates that E. coli is a superior FIB to FCs as a proxy for fecal pollution from warm-blooded mammals [12,13] primarily due to excessive detections of non-fecal, environmental thermotolerant coliform bacteria by the FC assay (e.g., [14,15,16]), but some rural and developing water quality authorities still rely on FCs.
Surface water beneficial uses within rural watersheds often include human and livestock drinking water, small municipality water supply, recreation, and irrigation. Determining relative contributions of microbial pollutants from fecal sources in rural watersheds is challenging due to the spatial and temporal embeddedness of land uses common in these watersheds. Both non-point (e.g., agriculture, wildlife) and point (e.g., rural residence on-site septic systems, small municipal wastewater treatment systems) sources of microbial pollutants are common across rural watersheds [17,18,19]. Concerns often arise over the potential risks posed by the close proximity of potential fecal sources and surface water uses in these systems (e.g., a recreational swimming site immediately downstream of a cluster of rural residence septic systems). The efficient deployment of best management practices to mitigate risks requires an understanding of the spatial and temporal contributions of microbial pollutants associated with potential sources. The identification and mitigation of microbial pollutant sources in mixed-use rural watersheds is an issue spanning the globe (e.g., New Zealand [20], United Kingdom [21], Canada [22], China [23], and the United States [24]). Livestock agriculture (e.g., [25,26,27]), septic systems, and wastewater treatment systems (e.g., [28,29,30]) are all documented as potential anthropogenic sources of microbial pollutants in rural watersheds. Studies also document the potential for microbial pollutant contributions from environmental sources such as wildlife (e.g., [31,32,33]), soil, and streambed sediments (e.g., [24,34,35,36,37]). Not surprisingly, studies often report detection of microbial pollutants from multiple sources, with the relative magnitude of contributions from sources varying over space and time due to watershed specific conditions (e.g., [23,26,28,38]).
Rural watersheds in the western United States are vast, rugged rangeland and forest-dominated landscapes supporting spatially and temporally intermingled activities such as extensive livestock grazing, recreation, and rural residences. Land ownership is a mosaic of private agricultural, residential, and recreational properties embedded in large public land units administered by federal agencies for uses such as livestock grazing and recreation. This is the case in California’s mountainous Sierra Nevada and Cascade Mountain Ranges which provide summer forage for thousands of grazing livestock, host millions of vacationers, and are home to hundreds of dispersed rural residencies [39,40,41,42]. At the time of this study, various FIB water quality standards were under review by policy makers, water quality authorities, and stakeholders across this landscape [12,43,44,45]. Standards employed and recommended across the landscape varied in FIB (e.g., fecal coliform, E. coli), metrics used for exceedance determination (e.g., geomean values, statistical threshold values), and concentrations used for exceedance determination (e.g., 20 to 400 colony forming units per 100 mL). This policy variation generates substantially different perceptions of microbial water quality conditions depending upon the FIB standard employed, clouding identification and efficient mitigation of microbial pollution sources across the landscape. In this paper, we report microbial water quality conditions in surface waters associated with grazing, recreation, and rural residences (i.e., potential fecal sources) in the upper reaches of three representative rural watersheds. We focused sampling on the summer season (July through September) when temporal and spatial overlap of these activities peak in these watersheds. Our specific objectives were to (1) determine E. coli and FC concentrations in surface waters immediately downstream of these potential fecal sources, (2) examine relationships between FIB concentrations and fecal sources throughout the course of the summer season, and (3) compare results to benchmark FIB concentrations that serve as the basis for microbial water quality standards in the region. Our aim was also to provide guidance on relative appropriateness of the various FIB-standard-based microbial water quality policies for rural watersheds.

2. Materials and Methods

2.1. Study Area

This cross-sectional, longitudinal survey of FIB concentrations in surface waters was conducted in the summer of 2016 across the upper reaches of three mixed land use rural watersheds traversing the northern Sierra Nevada and southern Cascade regions of California (Figure 1). The upper Stanislaus River Watershed, upper Susan River Watershed, and upper East Walker River Watershed reflect the diversity of annual precipitation, range and forest ecosystems, geology, and mixed uses common to the region. Table 1 provides details on the attributes of each watershed enrolled in this survey. Overall, the study area ranged from 40°34′ to 38°5′ N latitude and 121°9′ to 119°7′ W longitude, with an elevation range from 323 to 3754 m. The climate across the study area is Mediterranean with cool, wet winters and warm, dry summers. In these watersheds, the majority of precipitation falls as snow between December and April, with peak snowmelt typically occurring in May and early June. Following peak spring flows, streamflow declines rapidly to base flow conditions during summer (July through September). Numerous streams in the area are intermittent with flows ceasing during mid and late summer. Situated on the west slope of the Sierra Nevada, the upper Stanislaus River Watershed receives the greatest annual precipitation with uplands dominated by mesic conifer forests. The other watersheds are located on the drier eastern slopes of the Sierra Nevada (East Walker River Watershed) and the Cascade Range (Susan River Watershed) with xeric mixed conifer forests in the higher elevations transitioning to xeric shrublands in the lower elevations. Riparian areas associated with streams and springs are found throughout all watersheds, but represent less than 5% of the land area. Higher elevation forests across all watersheds are primarily National Forest lands administered by the U.S. Forest Service. Lower elevation shrublands on the two east-side watersheds are primarily public rangelands administered by the U.S. Bureau of Land Management. Privately owned land parcels are embedded throughout these larger public holdings.

2.2. Sample Sites and Fecal Sources

Seventy-seven stream water sample collection sites were established across all three watersheds in June 2016 (Table 1). Sample sites were selected immediately downstream of near-stream public lands key grazing areas (n = 31 or 40% of all sample sites), near- and in-stream public recreation areas (n = 40 or 52% of all sample sites), and near-stream rural residences (n = 6 or 8% of all sample sites). Sites were selected which could (1) be physically and legally accessed to sample and (2) logistically allow compliance with requirements to process samples at the laboratory within 8 h of collection. Recreational uses included near-stream trailheads used by hikers and recreational horse riders (i.e., pack stock), near-stream campgrounds, and in-stream swimming and bathing areas. Rural residence sites were near-stream small clusters (4 to 12) of rural residences with on-site waste treatment systems (septic systems). Key grazing areas on public lands were near-stream meadows and riparian areas where livestock graze and occupy frequently or for extended periods throughout the grazing season [46,47]. Grazing livestock were commercial beef cattle across all watersheds, with a minor component of commercial sheep grazing on some rangeland areas in the upper East Walker River Watershed. Public lands grazing was extensive in nature with livestock densities less than 0.05 animal unit/ha on individual grazing management units in excess of 10,000 ha. An animal unit is the grazing equivalent of a 450 kg cow with or without calf, assumed to consume 11.8 kg of forage per day on a dry weight basis. Grazing seasons were from June through September.

2.3. Sample Collection and FIB Determination

During the 1 July through 30 September summer season of 2016, stream water samples were collected across all three watersheds every 9 to 13 days. E. coli and FC concentrations were determined for each sample collected. All flowing sites within each watershed were grab sampled during each sampling bout via depth-integrated collection of 250 mL of stream water from the channel thalweg into a sterile container. Samples were immediately stored on ice and processed within 8 h of collection. Following standard method SM9222D, FC and E. coli concentrations as colony forming units (cfu) per 100 mL of water (cfu/100 mL) were enumerated via one step direct membrane filtration (0.45 µm nominal porosity filter) and incubation (44.5 °C, 22–24 h) on selective agar [48]. Agar used for FC was Difco mFC Agar, Becton, Dickinson and Company, Spars, MD, U.S. Agar used for E. coli was CHROMagar E. coli, ChromAgar, Paris, France. Two 100 mL negative control samples (autoclaved, double distilled phosphate buffered saline solution) as well as two positive control samples (negative control spiked to ~ 100 cfu/100 mL) were randomly included in every laboratory run for both E. coli and fecal coliforms.

2.4. Data Analysis and Interpretation

To address our first study objective, we calculated descriptive statistics for FIB concentrations observed by potential fecal source—extensive public lands grazing, recreation, and rural residences—and over the entire dataset (i.e., overall across all sources). FIB concentration data generated in this study were count-based, suggesting either a Poisson or negative binomial regression analysis approach to achieve our second objective. Preliminary analysis of standard Poisson and post-hoc goodness of fit analysis, as well as standard negative binomial regression and post-hoc likelihood ratio tests for over-dispersion (alpha) both indicated that negative binomial regression was superior to Poisson regression due to over-dispersion. The data also had potential autocorrelation among samples collected from the same sample site. Thus, we utilized mixed effects negative binomial regression analyses with sample site identity set as a random intercept term to examine relationships between FIB concentrations (dependent variables) and the following independent variables: (1) streamflow condition (intermittent, perennial); (2) fecal source (grazing, recreation, rural residences); and (3) fecal source and seasonal progression (Julian Day). Likelihood ratio tests indicated that the random intercept mixed models were superior to standard negative binomial regression analysis in all cases. E. coli and fecal coliform concentrations were set as dependent variables and sample site identity was set as a random intercept in the following mixed effects regression analyses. Analysis one included FIB (one model each for E. coli and fecal coliform) and the independent variable streamflow condition (intermittent, perennial) using data from all 77 sample sites (595 samples) to examine differences in FIB between these conditions. Analysis two included FIB (one model each for E. coli and fecal coliform) and the independent variable fecal source (grazing, recreation, rural residence) using data from all 77 sample sites (595 samples) to examine differences in FIB between these sources. Analysis three included FIB (one model each for E. coli and fecal coliform) and the independent variables fecal source, Julian Day, the quadratic term for Julian Day, and the interaction between fecal source and Julian Day to examine expected effects of seasonal progression on FIB [46]. In analysis three, we only included data from perennial sample sites with sustained streamflow throughout the entire summer season (60 sample sites, 521 samples)—given our interest here in seasonal progression. Independent variables were considered significantly related to FIB concentrations at p-Value < 0.10. All statistical analyses were conducted in Stata/SE 13.1 [49]. For our final study objective, we compared observed FIB concentrations to benchmark E. coli (100, 320) and FC (20, 40, 200, 400) concentrations (cfu/100 mL) that form the basis for national, state, and regional FIB microbial water quality standards relevant to the study area [12,43,44,45]. These relevant water quality standards are described in detail in the results and discussion, for ease of comparison.

3. Results and Discussion

3.1. Precipitation, Streamflow, and Samples Collected

Precipitation realized for the hydrologic year (1 October 2015 through 30 September 2016) encompassing the study period (July through September 2016) was 97% (126 cm), 113% (78 cm), and 97% (59 cm) of the 30-year average for the upper Stanislaus River, Susan River, and East Walker River watersheds, respectively (Table 1). There were 595 stream water samples collected with concentrations determined for E. coli and fecal coliform. Sample sizes for grazing, recreation, and rural residence sites were 239, 309, and 47, respectively. Mean sample collection frequency was 11 days per site—ranging from 9 to 13 days. The number of samples collected per site ranged from 3 to 11 with a mean of 7.8 and a median of 8 samples collected per site, respectively. Fewer sample collections were associated with intermittent flow conditions observed at 17 sample sites (12 sites in the upper Stanislaus River watershed, 5 sites in the upper Susan River watershed). The number of sample sites and, thus, sample collections decreased as the season progressed and intermittent streams ceased flowing due to summer dry down. Sixty of the original 77 sample sites were perennial and sustained stream flow throughout the entire summer study period with 80%, 74%, and 67% of recreation, grazing, and rural residence sample sites maintaining perennial streamflow, respectively. Sample sizes for intermittent and perennial flowing sites were 74 and 521, respectively.

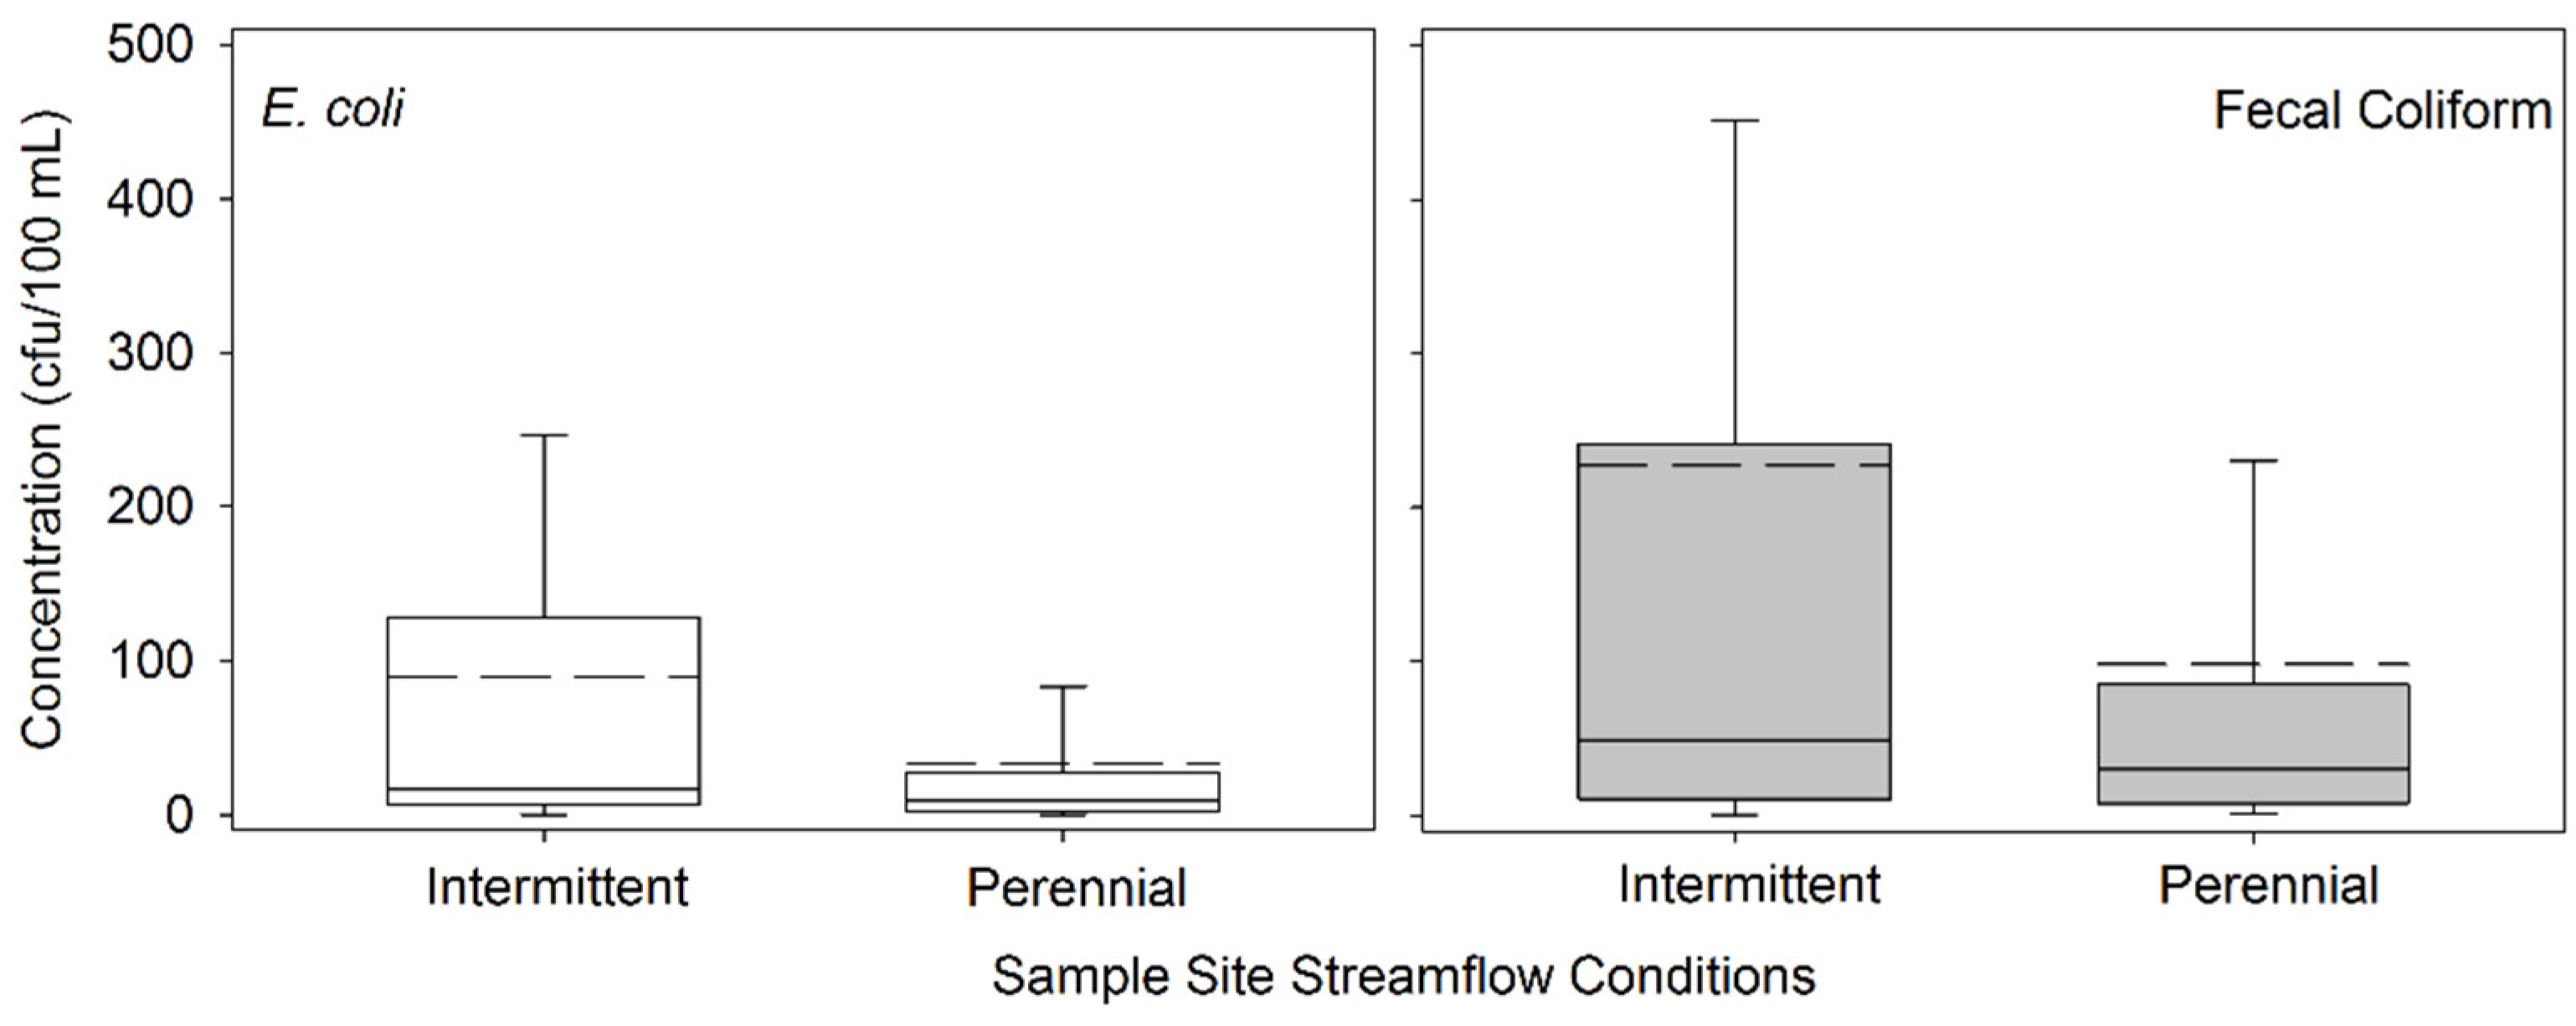
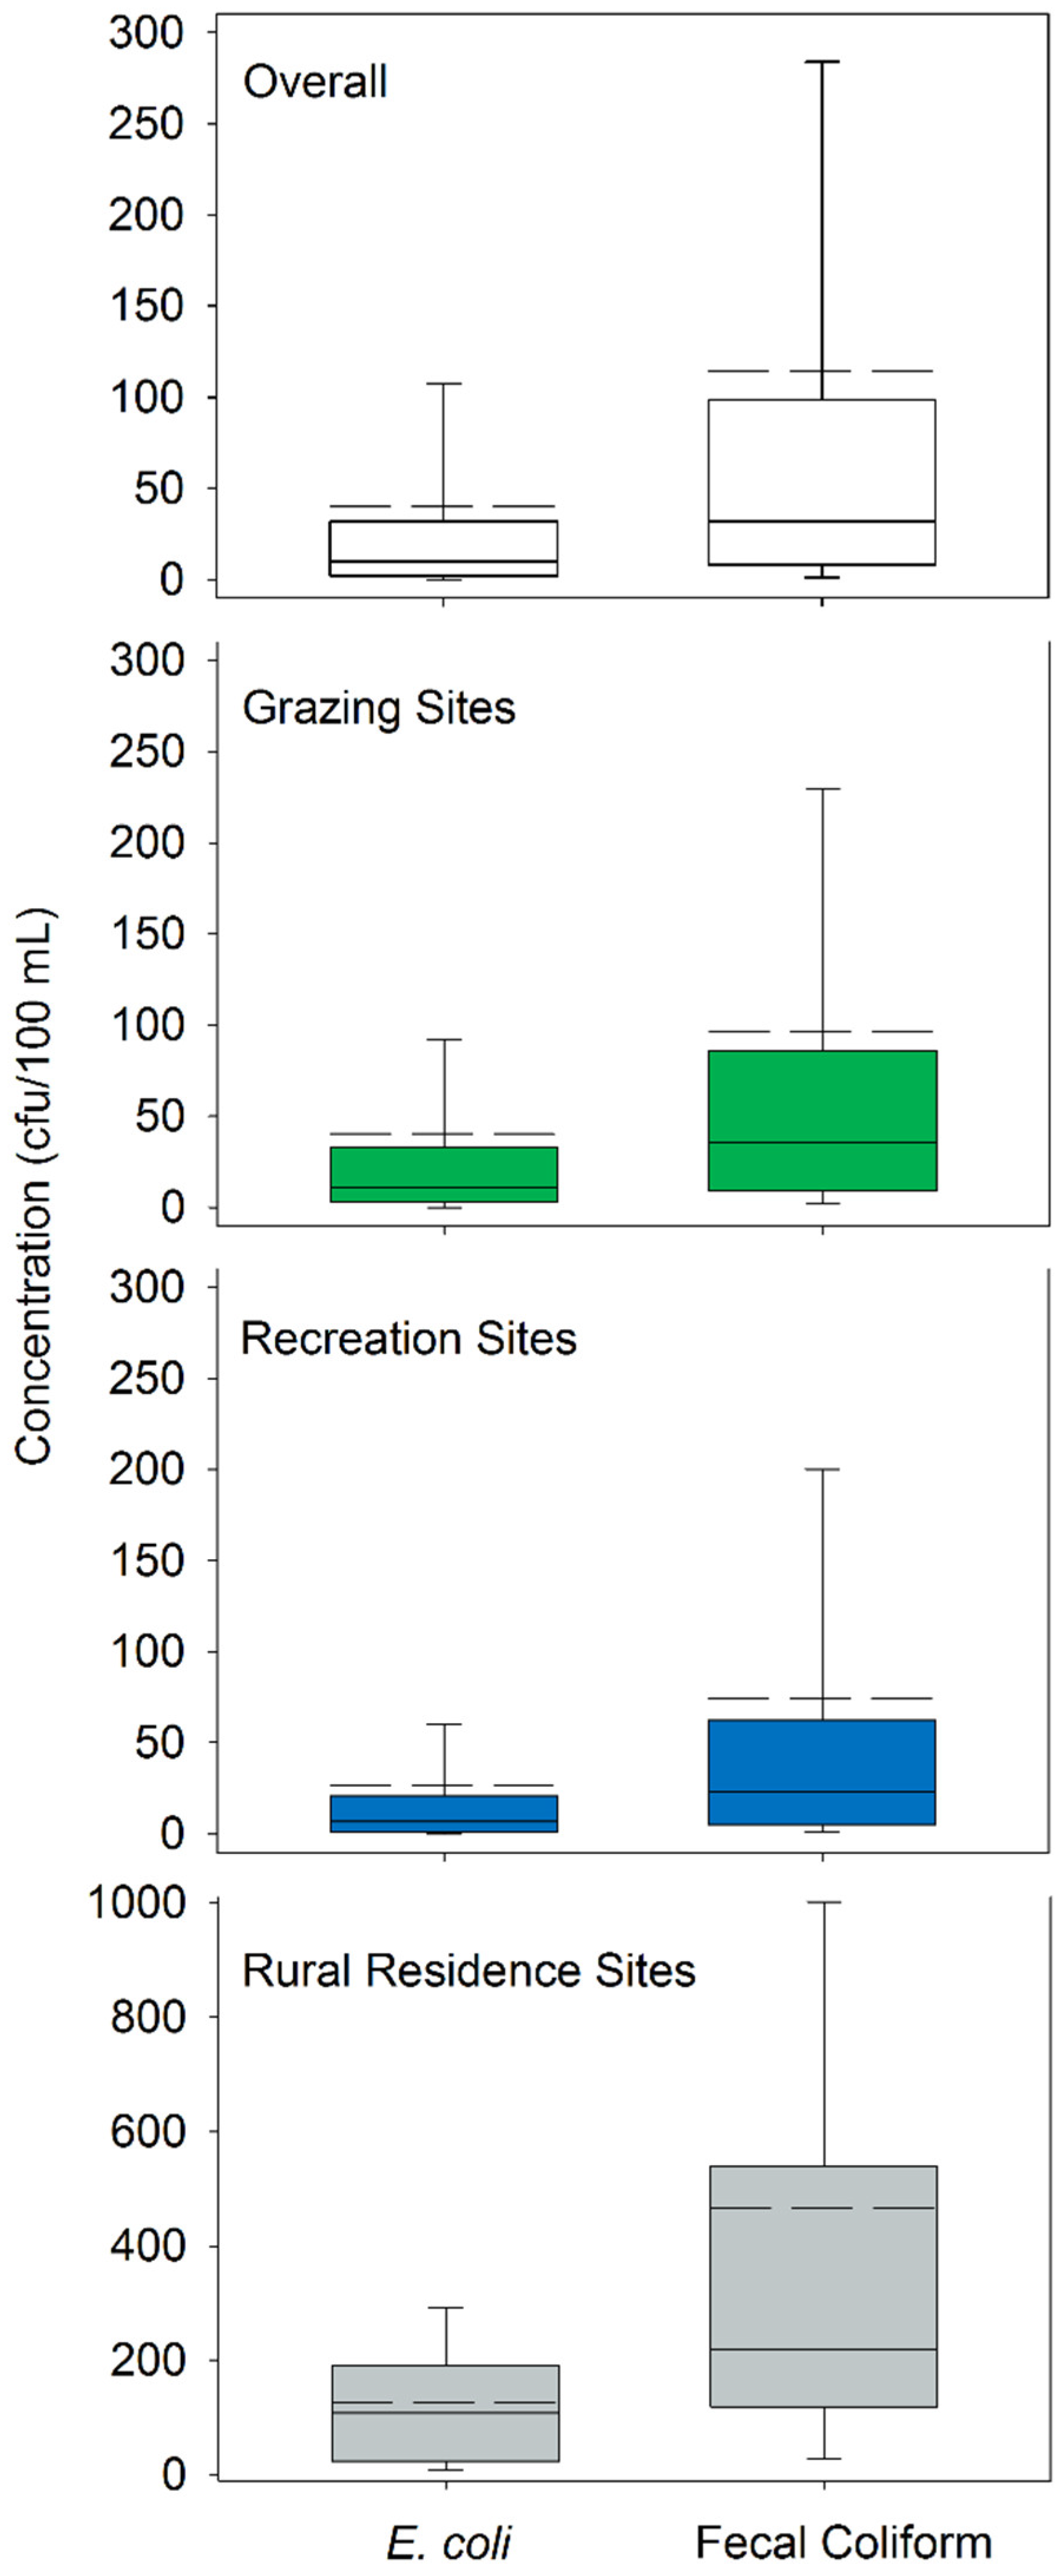
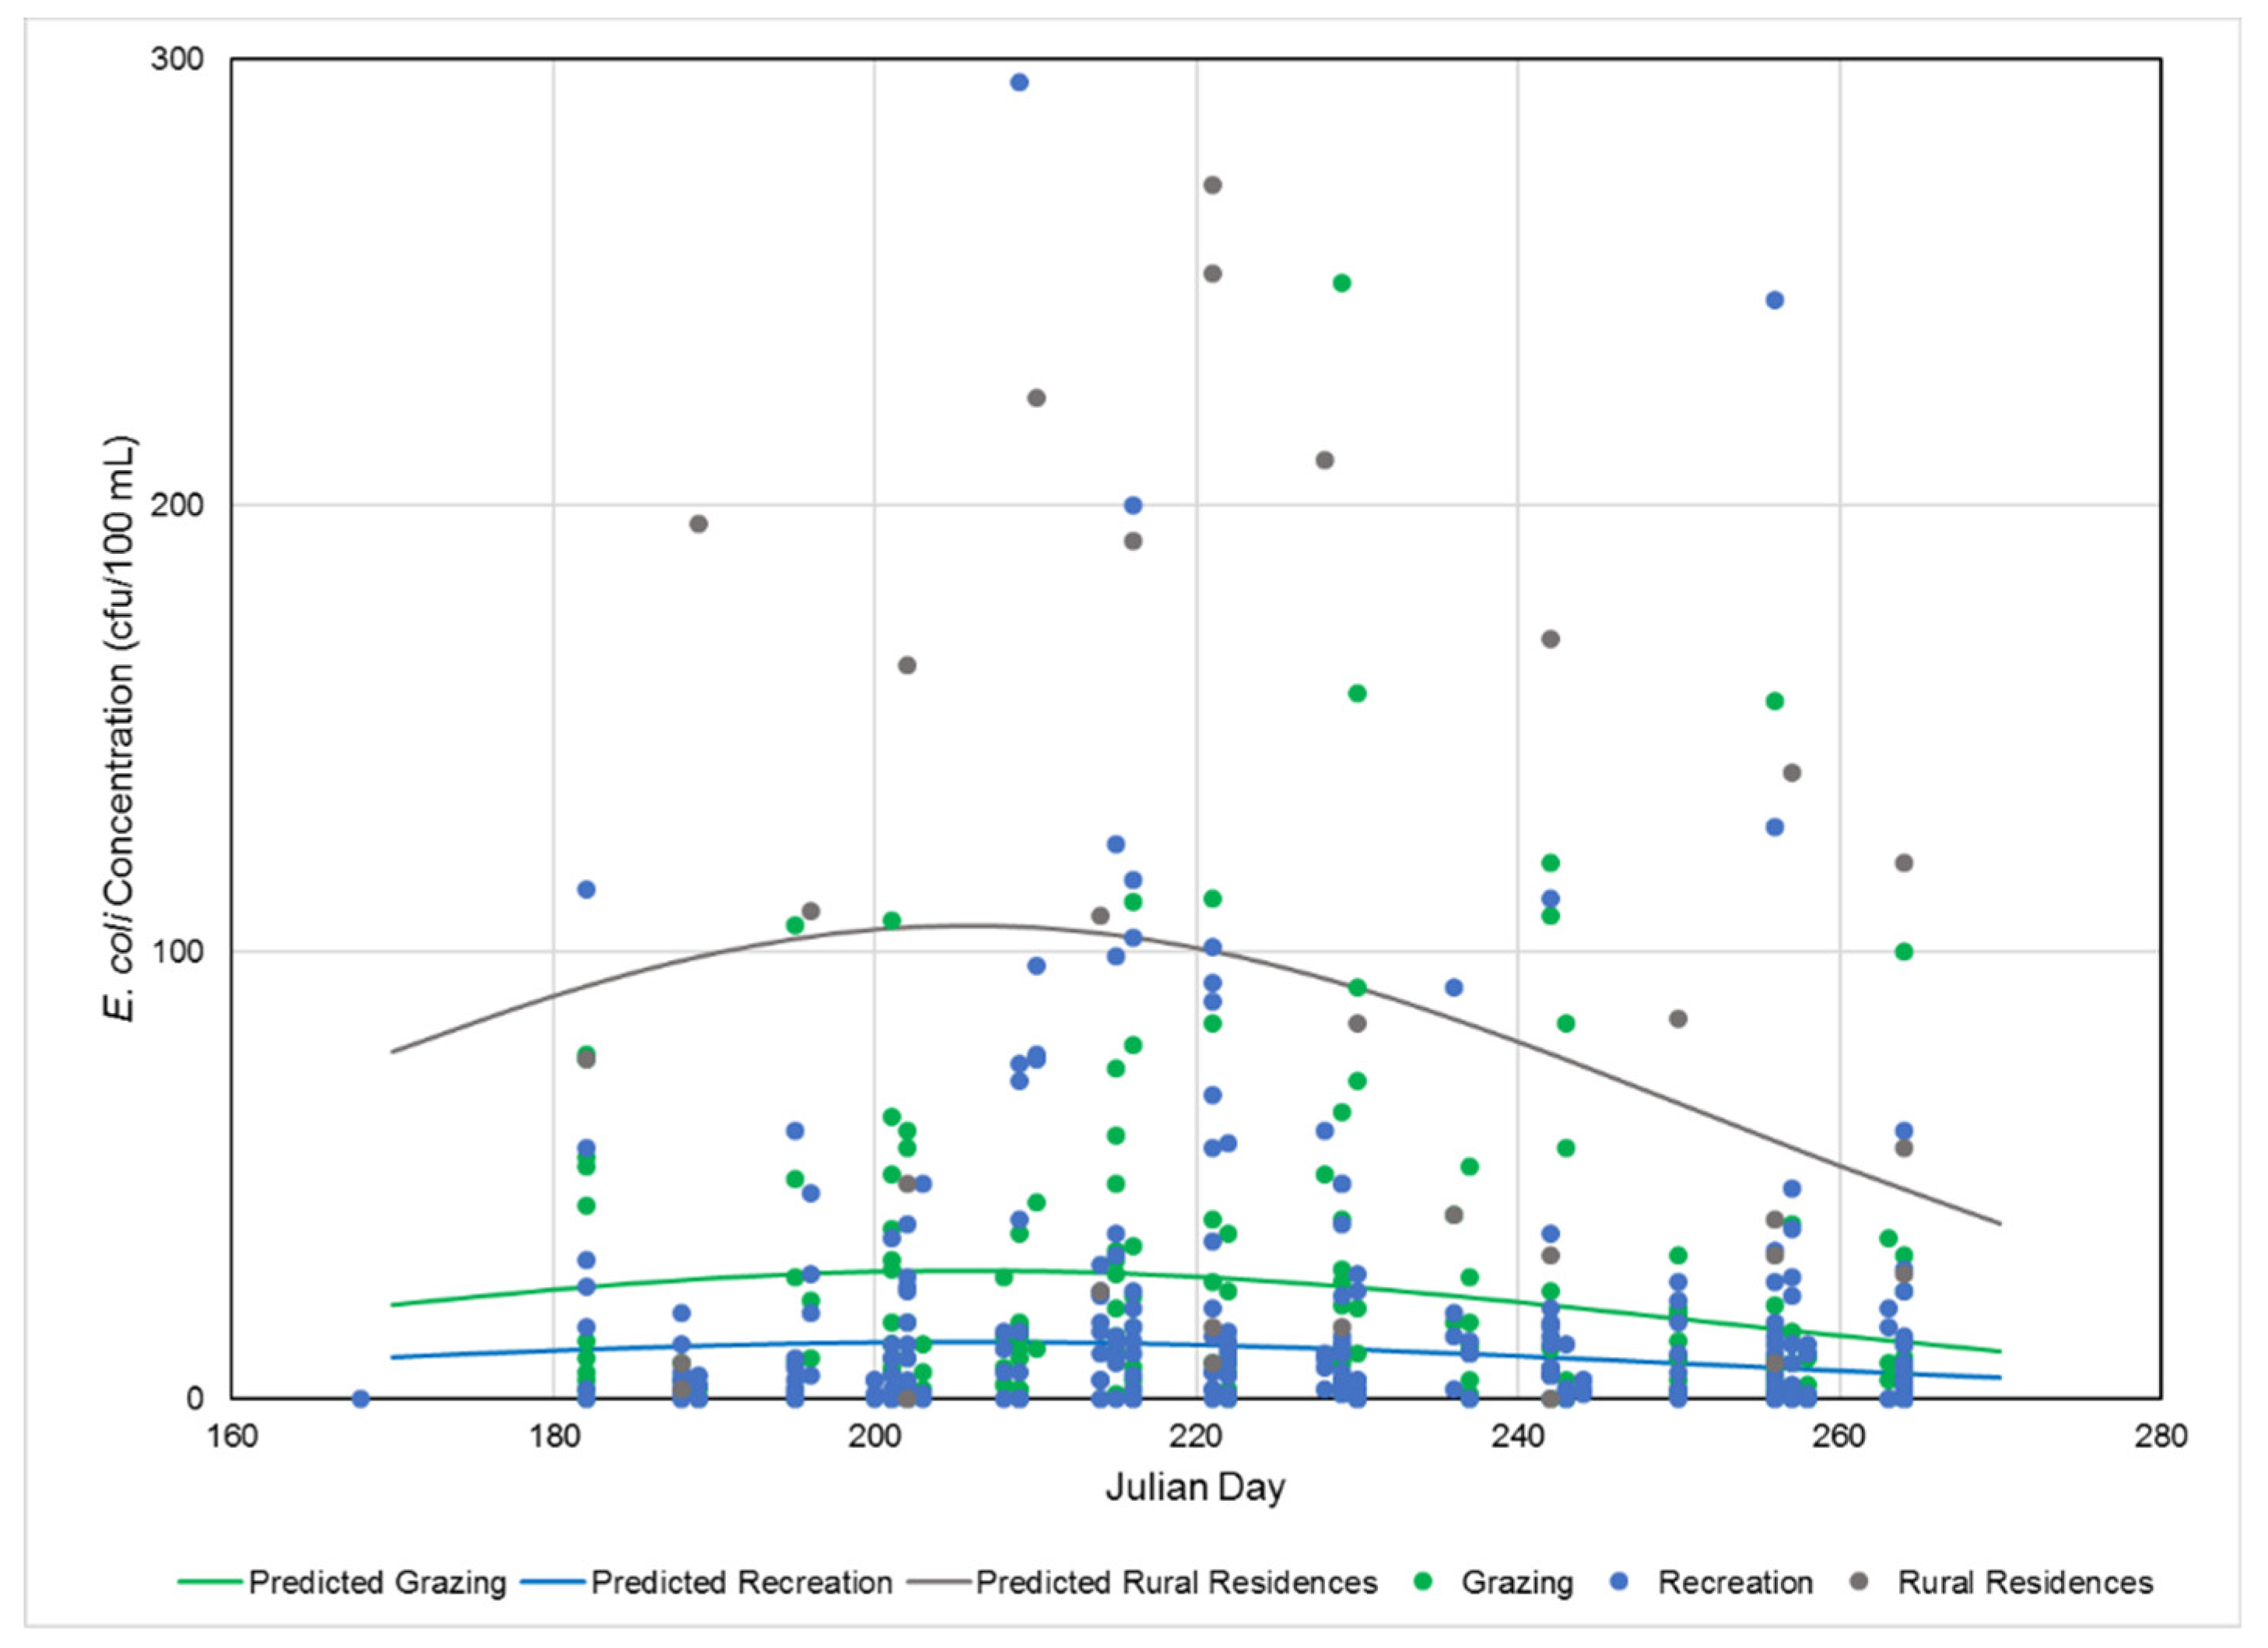
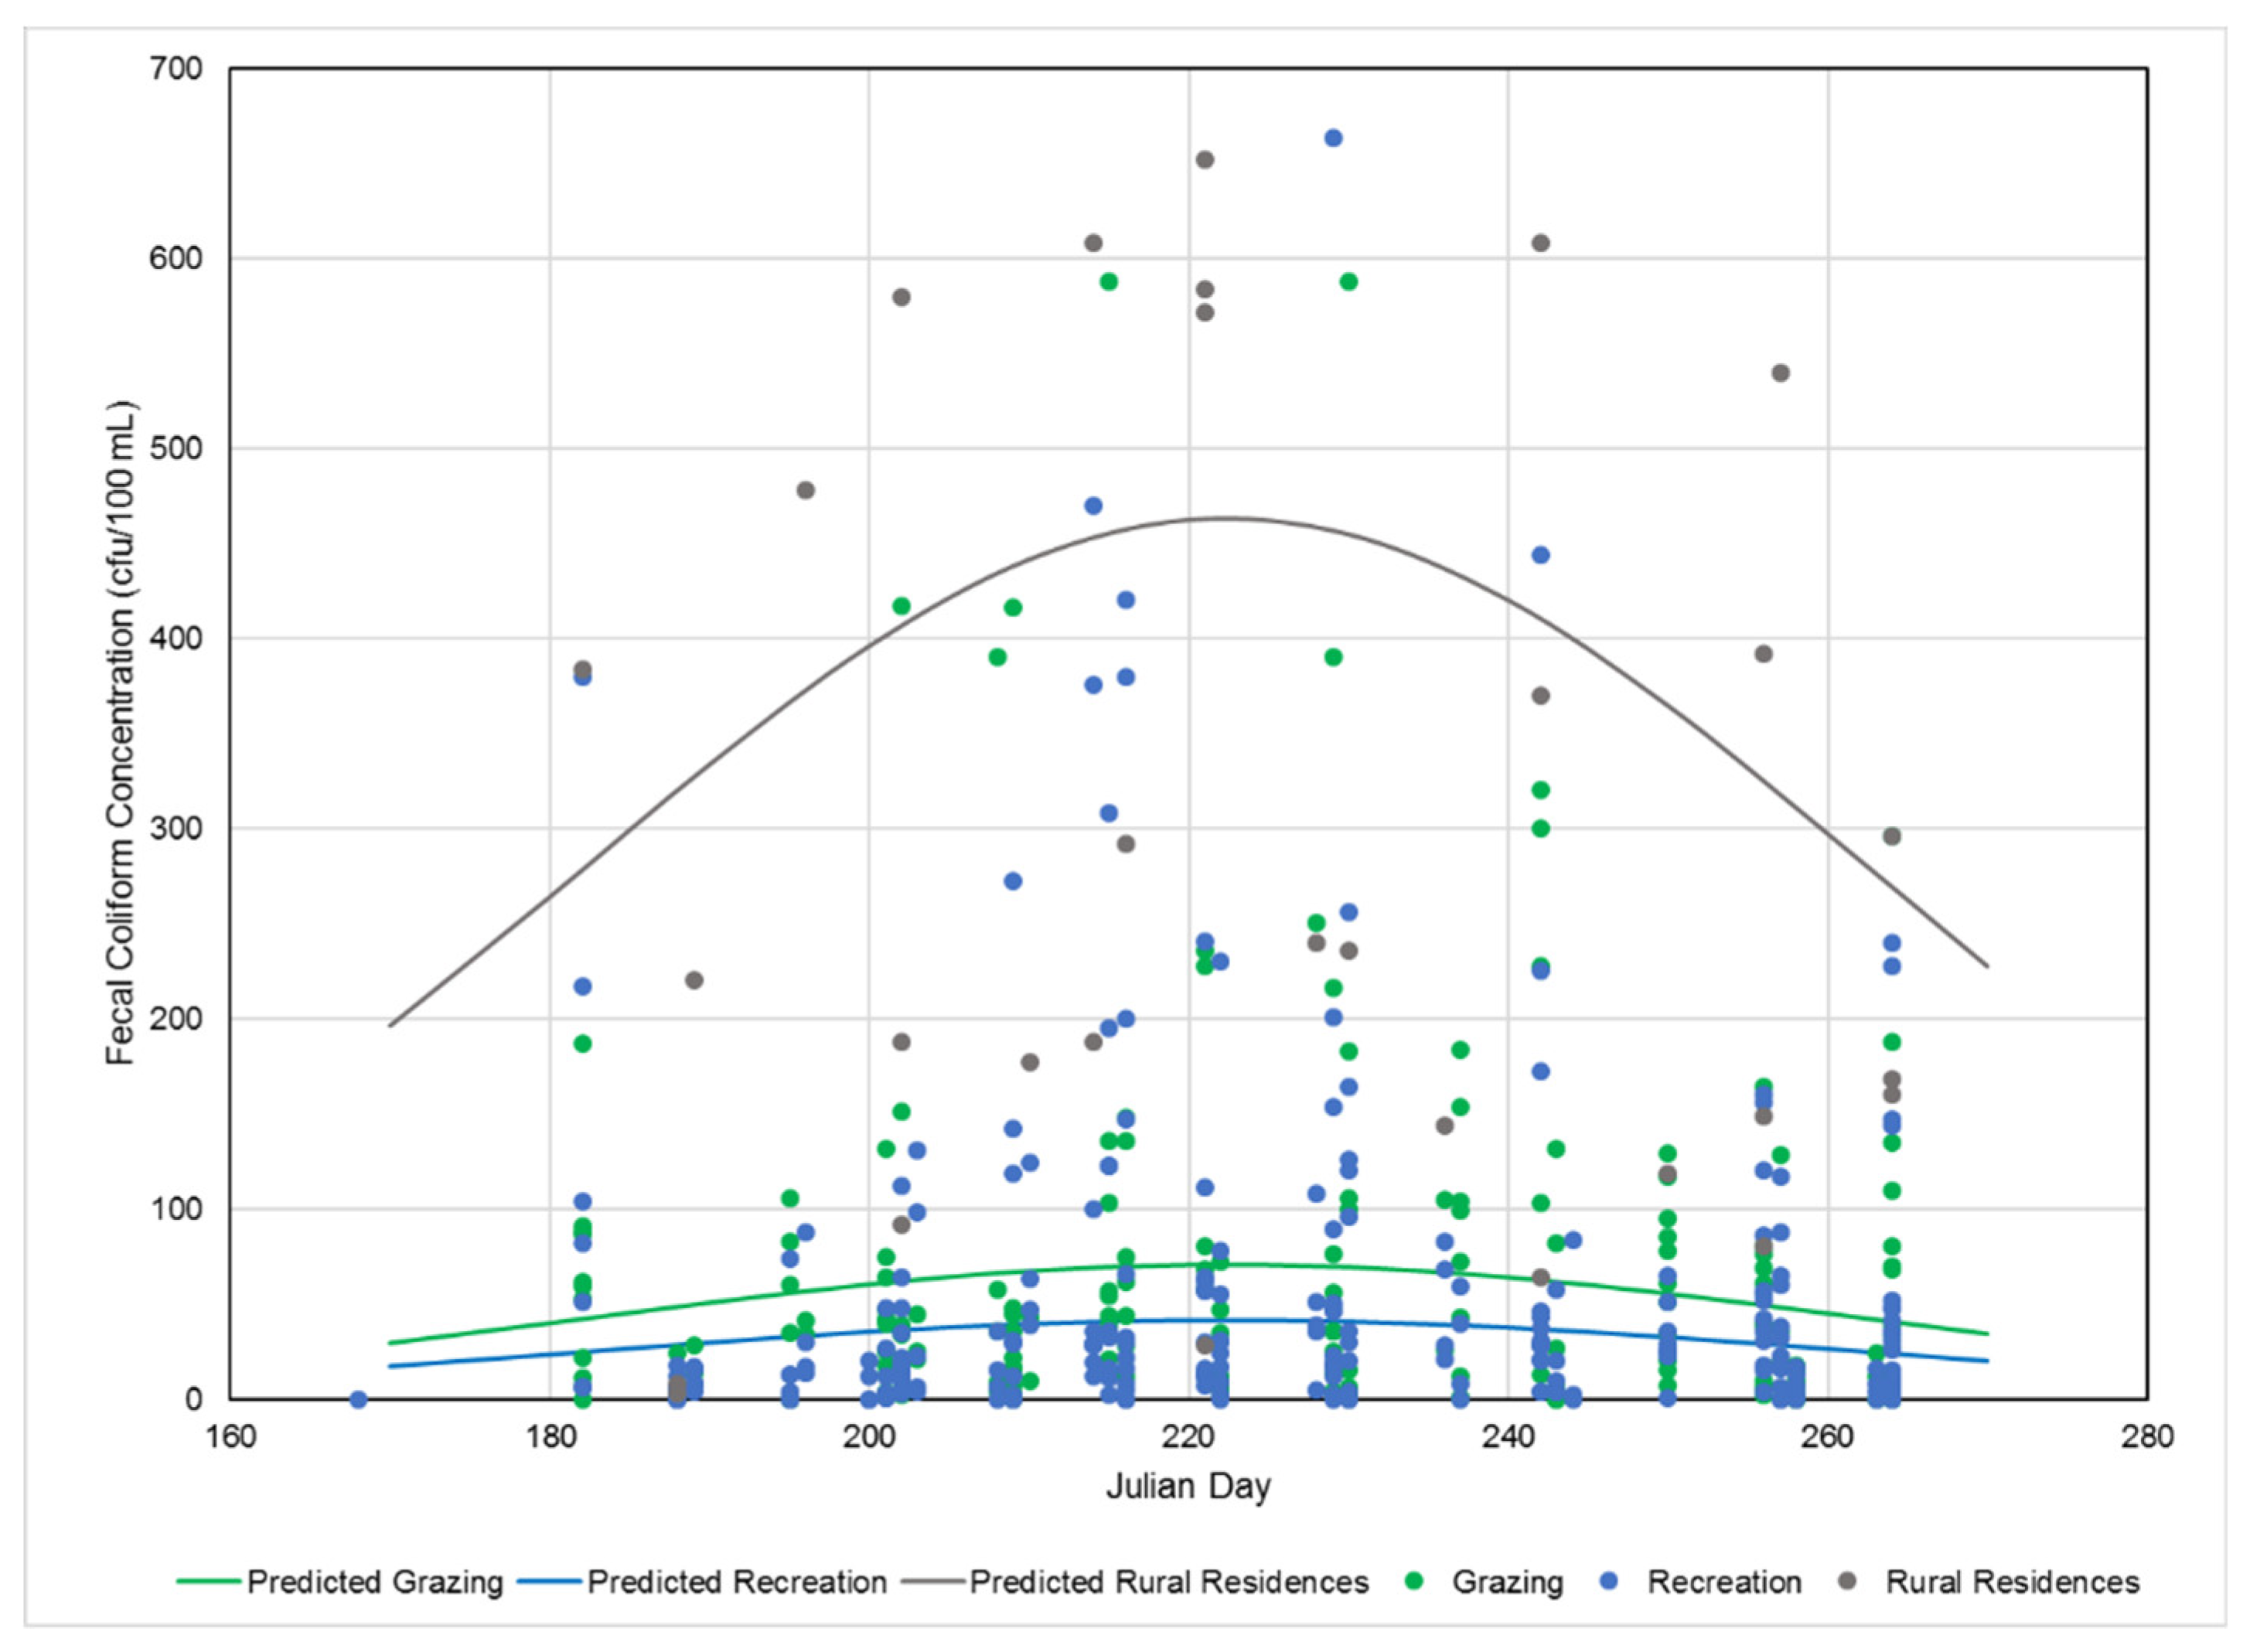
3.2. FIB Concentrations, Streamflow Conditions, Fecal Sources, and Season

Mixed effects negative binomial regression coefficients for fecal source indicated that concentrations of E. coli (p-Value = 0.003) and fecal coliforms (p-Value = 0.090) were higher for sample sites with intermittent streamflow compared to sites with perennial stream flow (Table 2, Figure 2). In previous research on National Forest lands in the study region, we observed mean E. coli concentrations of 114 cfu/100 mL for samples collected under low flow (< 2 L/sec) conditions compared to 35 cfu/100 mL for samples collected under flowing conditions [46]. In that study, we also observed mean FC concentrations of 216 cfu/100 mL for low flow sample collections compared to 72 cfu/100 mL for flowing conditions. When intermittent streams are sampled as they approach cessation of flow, relatively high FIB concentrations are realized [50,51,52] due to a suite of interacting physical and biological factors such as temperature, nutrient concentrations, and biological growth rates [53].
Concentrations of both E. coli and fecal coliforms were lowest at recreation sample sites followed by sites associated with grazing, and were highest downstream of rural residences. Table S1 reports outcomes of mixed effects negative binomial regression analysis examining differences in FIB concentrations between fecal source coefficients for all 77 stream sample sites (595 sample collections) (Figure 3). Table 3 reports outcomes of the mixed effects negative binomial regression analysis examining differences in FIB concentrations between fecal source coefficients while accounting for seasonal progression (Julian Day) for the 60 perennial flowing stream sample sites (521 sample collections). Results in both analyses (Table S1 and Table 3) were congruent on FIB concentration differences between fecal sources. As Table 3 indicates, E. coli concentrations at recreation (p-Value = 0.016) and rural residence (p-Value = 0.050) sample sites were significantly different from grazing sites. Post-hoc pairwise comparison indicated that recreation and rural residence sites had significantly different coefficients for E. coli concentrations (p-Value = 0.001). E. coli concentrations at recreation (p-Value = 0.088) and rural residence (p-Value = 0.005) sample sites were significantly different from grazing sites. Post-hoc pairwise comparison indicated that recreation and rural residence sites had significantly different coefficients (p-Value < 0.001) for fecal coliform concentrations (Figure 3).
The relatively low magnitude of E. coli and fecal coliform concentrations we observed for recreation followed by extensive public lands grazing activities are in agreement with our previous findings in similar watersheds [46], and with other studies. For example, Tiedemann et al. [50] and Gary et al. [54] report similar magnitudes of increase in fecal coliform concentrations associated with extensively grazed cattle pastures on Colorado’s Front Range and Oregon’s Cascade Mountains, respectively. Forrester et al. [55] and Clow et al. [56] both report comparable values for E. coli in several studies of water quality conditions associated with backpacker and pack livestock trail stream crossings, and near-stream pack stock grazing in national parks in the south Sierra Nevada. Pandey et al. [37] found mean E. coli concentrations to be less than 10 cfu/100 mL for sample sites on the mid and upper reaches of the “wild and scenic” designated Merced River Watershed draining Yosemite National Park to the south of the Stanislaus River Watershed, providing some reference for concentrations in limited use watersheds in the region.
On-site waste management systems (i.e., septic systems) are one likely reason for the relatively elevated FIB concentrations observed below near-stream rural residences (Figure 3). Research in other rural regions have demonstrated the potential for near-stream septic systems to contribute fecal bacteria and other pollutants to surface and ground water. For example, Verhougstraete et al. [30] identified septic systems to be a primary driver of in-stream fecal bacteria concentrations across mixed-use rural watersheds in Michigan’s lower peninsula. Lapointe et al. [57] found dissolved nutrients in ground and surface waters to be concentrated near antiquated septic systems contributing to eutrophication of waters in southeast Florida, and Habteselassie et al. [58] report elevated FIB concentration in ground and surface waters near failing septic systems in rural North Carolina. Based upon our literature searches, there appears to be limited published research on septic systems as a microbial pollutant source for surface or ground water quality in rural, mountainous regions of California. Williams et al. [59] and Izbicki et al. [60] both identified septic systems as one source of elevated nitrate concentrations in ground water in semi-arid and arid mountain watersheds in rural areas of southern California. Given our preliminary assessment of FIB concentrations downstream of a limited number (6) of rural residences there is need for further examination of the potential magnitude and scope of this land use in the study region.
We found significant relationships between seasonal progression (Julian Day) and FIB concentrations; however, there were no significant (p-Value > 0.10) interactions between seasonal progression and fecal source (Table 3, Figure 4 and Figure 5). Overall, FIB concentrations are lowest early and late in the summer season, with a pronounced increase as mid-summer approached. Roche et al. [46] documented this summer seasonal rise–peak–decline in FIB on similar watersheds within the study region, as have studies in other systems (e.g., [61,62,63]). This mid-summer peak corresponds to peak livestock and recreationalist numbers, peak migratory wildlife numbers, and peak environmental growth conditions in the region as discussed in reference [46].
Finally, it is important to note that E. coli and fecal coliform concentrations observed during the study were over-dispersed with a majority of observations at low concentrations, and relatively few observations at high concentrations. This distributional attribute and associated large variability in FIB is common to FIB datasets reported for rural mixed-use landscapes (e.g., [46,50,55,64]). In our study, with the exception of rural residence sites, the median and 75th percentile concentrations were lower than mean concentrations for both E. coli and fecal coliforms (Figure 2 and Figure 3). This indicates a substantial preponderance of low concentration observations in the dataset with relatively few high concentrations disproportionately influencing mean values, and diminishing the utility of the mean as an accurate descriptor of the data. This over-dispersion was relatively more pronounced for recreational and grazing sites (i.e., means influenced by few high observations) than for rural residence sample sites (i.e., means less influenced by few high observations).

3.3. FIB Concentrations, Fecal Sources, and Water Quality Benchmarks

Six FIB microbial water quality standards were relevant to the study area in the timeframe of this study and publication. In order to provide context with regard to applicable national, state, and regional recommendations for recreational water quality protection, we compared our results to the key benchmark E. coli and fecal coliform concentrations upon which these six water quality standards are based (Table 4 and Table 5). For an individual sample site, the United States Environmental Protection Agency (USEPA) and California’s State Water Quality Control Board (State Water Board) jointly recommend two microbial water quality standards. The first standard uses a benchmark that the geomean of E. coli concentrations for samples collected over the sample period is less than 100 cfu/100 mL. The geomean is calculated by (1) transforming sample concentrations by log10, (2) calculating the mean of those transformed concentrations, and then (3) raising the transformed mean by the power of 10 [12]. The second standard is based upon a statistical threshold value (STV) benchmark that no more than 10% of samples collected at a site over the sample period exceed an E. coli concentration of 320 cfu/100 mL [12,43]. The upper Stanislaus River Watershed is located within the jurisdiction of California’s Central Valley Regional Water Quality Control Board (Central Valley Board), while the upper Susan River and East Walker River Watersheds are located within the jurisdiction of the Lahontan Regional Water Quality Control Board (Lahontan Board). California’s regional water boards are semi-autonomous and FIB water quality standards have varied among them. At the time this analysis was conducted, the Central Valley Board was in the process of adopting USEPA and State Water Board E. coli-based geomean and STV recommendations to replace existing FC-based geomean (200 cfu/100 mL) and STV (400 cfu/100 mL) standards [44]. At the same time, the Lahontan Board was employing FC-based geomean (20 cfu/100 mL) and STV (40 cfu/100 mL) standards [45], and was considering the adoption of USEPA and SWRCB recommendations. Table 4 reports the percentage of individual sites (n = 77) whose geomean concentration exceeded relevant FIB benchmarks. A comparison of individual sample concentrations to benchmark concentrations used in statistical threshold value (STV) microbial water quality standards is displayed in Table 5.
Results in Table 4 and Table 5 demonstrate the potential for substantial discord, and policy-driven confusion, in assessments of microbial conditions using FC compared to E. coli-based water quality standards as indicators of fecal pollution by warm-blooded mammals. While by no means perfect [4], E. coli-based water quality standards have clearly been determined to be biologically and statistically superior to standards based on FC at any benchmark concentration (e.g., [11,12,16,43]). Thus, we will accept the overall exceedance rates observed for E. coli concentrations as the best estimates of actual microbial water quality pollution and human health risk across the study area and period (Table 4 and Table 5). Compared to the sample site geomean E. coli benchmark (14% of sample sites with geomean > 100 cfu/100 mL E. coli), our results suggest FC-based standards overestimated potential microbial pollution and human health risk at sample sites by as much as 336% (61% of sites > 20 cfu/100 mL FC) and 278% (53% of sites > 200 cfu/100 mL FC) (Table 4). Compared to the individual sample STV E. coli benchmark (13% of samples > 320 cfu/100 mL E. coli), our results would suggest FC-based standards overestimated potential microbial pollution and human health risk across all samples by as much as 538% (83% of samples > 40 cfu/100 mL FC) and 92% (25% of samples > 400 cfu/100 mL FC) (Table 5). We observed similar discrepancies in the assessment of microbial water quality in the region in a previous study of 155 sample sites and 743 sample collections [46]. It is likely that the elevated fecal coliform concentrations relative to E. coli are driven by the fecal coliform assay’s greater detection of non-fecal, thermotolerant environmental coliform bacteria creating false-positive indications of fecal contamination and erroneous estimates of health risk (e.g., [14,15,16]). This flaw in FC as an accurate, selective indicator of fecal contamination is among the various reasons international [11], national [12], and state [43] environmental and human health protection agencies recommend the use of E. coli-based microbial water quality standards.
Rates of observed exceedances for geomean E. coli water quality benchmarks were similar for recreation and grazing sample sites (Table 4). Rates of observed exceedances for grazing sites were higher than recreation sites for STV E. coli water quality benchmarks (Table 5). These results indicate that microbial conditions were relatively good in surface water across the study site proximate to these activities, with approximately 5% to 16% of recreation and grazing sites exhibiting concentrations in exceedance of state and national E. coli standards for recreational waters, respectively. Site-specific fecal source assessments and implementation of appropriate best management practices have a high probability of reducing potential fecal contributions from these locations once identified [64,65,66,67]. Fifty to 83 percent of rural residence associated sample sites (Table 4 and Table 5) exceeded state and national E. coli benchmarks. As discussed above, on-site septic systems are a likely reason for elevated E. coli concentrations and exceedances below rural residences (e.g., [30,57,58]). Our sample size for this land use is relatively small, so there is an important need for additional research into this potential source across the region to provide a clearer picture of the potential mechanisms and magnitude of E. coli contributions from this land use.

3.4. Implications

Overall, we found that 86% to 87% of stream sample sites across the study area met E. coli-based microbial water quality standards. Fecal indicator bacteria concentrations were lowest at recreation sites, followed closely by extensive livestock grazing sites. The highest levels of FIB concentrations observed in this study were at sites associated with rural residences, and at intermittently flowing stream sites. Given our small sample size for rural residences, additional research is required to determine if elevated FIB concentrations are broadly associated with this activity across the study region. Based upon the application of a structured spatial and temporal watershed-scale assessment of E. coli concentrations, we were able to identify relative magnitudes of potential fecal contribution among these sources over the course of the summer grazing and recreation season. The efficient identification of fecal contamination sources in these mixed-use rural watersheds is essential to guide the effective deployment of limited resources for on-the-ground mitigation of microbial pollution to safeguard human health. Our results demonstrate that policies reliant on antiquated fecal coliform-based water quality standards overestimated potential fecal contamination by as much as four orders of magnitude in this landscape. Such policies hinder the identification of the most likely fecal pollution sources and thus the successful targeting of mitigation practices to address them. They also misrepresent actual microbial water quality conditions to stakeholders, resources managers, and policy makers, hindering science-based decision making. We strongly recommend the application of the most current fecal indicator bacteria water quality standards to inform water quality improvement efforts and safeguard human health in these vast landscapes.

Supplementary Materials

The following are available online at https://0-www-mdpi-com.brum.beds.ac.uk/2071-1050/12/12/5207/s1, Table S1: Results of mixed effects negative binomial regression analysis to examine relationships between fecal source (recreation, grazing, and rural residences) and fecal indicator bacteria (E. coli and fecal coliform) concentrations (cfu/100 mL) for 595 water samples collected across 77 stream sample sites sustaining perennial streamflow throughout the entire summer sampling period (July through September of 2016).

Author Contributions

Conceptualization, K.W.T., L.M.R., K.L.D., and D.F.L.; methodology, K.L.D., D.J.E., and K.W.T.; software, K.L.D. and D.J.E.; formal analysis, K.W.T., L.M.R., K.L.D., and D.J.E.; data curation, K.L.D.; writing—original draft preparation, K.L.D. and D.J.E.; writing—review and editing, K.W.T., L.M.R., D.J.E., and D.F.L; visualization, K.L.D. and D.J.E.; supervision, K.L.D.; project administration, K.W.T. and D.F.L.; and funding acquisition, K.W.T., L.M.R. and D.F.L. All authors have read and agreed to the published version of the manuscript.

Funding

This research was funded by the Regents of the University of California’s Russell L. Rustici Rangeland and Cattle Research Endowment, 2016–2017 funding cycle.

Acknowledgments

We thank the following for sample collection and laboratory analysis, as well as logistical support during the study. Emily Fulstone, Alex Orozco-Lopez, Andrew Richie, Emily Howard, Bridgeport Ranchers Organization, United States Forest Service, Scott Oneto, Tuolumne County California, and Lassen County California.

Conflicts of Interest

The authors declare no conflict of interest.

References

  1. Pandey, P.K.; Kass, P.H.; Soupir, M.L.; Biswas, S.; Singh, V.P. Contamination of water resources by pathogenic bacteria. AMB Express 2014, 4, 1–16. [Google Scholar] [CrossRef] [Green Version]
  2. Leclerc, H.; Schwartzbrod, L.; Dei-Cas, E. Microbial agents associated with waterborne diseases. Crit. Rev. Microbiol. 2002, 28, 371–409. [Google Scholar] [CrossRef]
  3. Efstratiou, A.; Ongerth, J.E.; Karanis, P. Waterborne transmission of protozoan parasites: Review of worldwide outbreaks—An update 2011–2016. Water Res. 2017, 114, 14–22. [Google Scholar] [CrossRef]
  4. Field, K.G.; Samadpour, M. Fecal source tracking, the indicator paradigm, and managing water quality. Water Res. 2007, 41, 3517–3538. [Google Scholar] [CrossRef]
  5. Harwood, V.J.; Staley, C.; Badgley, B.D.; Borges, K.; Korajkic, A. Microbial source tracking markers for detection of fecal contamination in environmental waters: Relationships between pathogens and human health outcomes. FEMS Microbiol. Rev. 2014, 38, 1–40. [Google Scholar] [CrossRef] [PubMed] [Green Version]
  6. Jang, J.; Hur, H.G.; Sadowsky, M.J.; Byappanahalli, M.N.; Yan, T.; Ishii, S. Environmental Escherichia coli: Ecology and public health implications—A review. J. Appl. Microbiol. 2017, 123, 570–581. [Google Scholar] [CrossRef] [PubMed] [Green Version]
  7. José Figueras, M.; Borrego, J.J. New perspectives in monitoring drinking water microbial quality. Int. J. Environ. Res. Public Health 2010, 7, 4179–4202. [Google Scholar] [CrossRef] [PubMed] [Green Version]
  8. Tan, B.F.; Ng, C.; Nshimyimana, J.P.; Loh, L.L.; Gin, K.Y.H.; Thompson, J.R. Next-generation sequencing (NGS) for assessment of microbial water quality: Current progress, challenges, and future opportunities. Front. Microbiol. 2015, 6. [Google Scholar] [CrossRef] [PubMed]
  9. Deshmukh, R.A.; Joshi, K.; Bhand, S.; Roy, U. Recent developments in detection and enumeration of waterborne bacteria: A retrospective minireview. Microbiologyopen 2016, 5, 901–922. [Google Scholar] [CrossRef] [PubMed] [Green Version]
  10. Chen, Y.; Wang, Z.; Liu, Y.; Wang, X.; Li, Y.; Ma, P.; Gu, B.; Li, H. Recent advances in rapid pathogen detection method based on biosensors. Eur. J. Clin. Microbiol. Infect. Dis. 2018, 37, 1021–1037. [Google Scholar] [CrossRef] [PubMed]
  11. Ashbolt, N.J.; Grabow, W.O.K.; Snozzi, M. Indicators of microbial water quality. In Assessment of Risk and Risk Management for Water-Related Infectious Disease; Fewtrell, L., Bartram, J., Eds.; World Health Organization, IWA Publishing: London, UK, 2001; Volume 23, pp. 289–316. [Google Scholar]
  12. USEPA. Recreational Water Quality Criteria; United States Environmental Protection Agency: Washington DC, USA, 2012.
  13. Leclerc, H.; Mossel, D.A.A.; Edberg, S.C.; Struijk, C.B. Advances in the bacteriology of the coliform group: Their suitability as markers of microbial water safety. Annu. Rev. Microbiol. 2001, 55, 201–234. [Google Scholar] [CrossRef] [PubMed]
  14. Edberg, S.C.; Rice, E.W.; Karlin, R.J.; Allen, M.J. Escherichia coli: The best biological drinking water indicator for public health protection. J. Appl. Microbiol. Symp. Suppl. 2000, 88. [Google Scholar] [CrossRef] [PubMed]
  15. Doyle, M.P.; Erickson, M.C. Closing the door on the fecal coliform assay. Microbe 2006, 1, 162–163. [Google Scholar] [CrossRef] [Green Version]
  16. Odonkor, S.T.; Ampofo, J.K. Escherichia coli as an indicator of bacteriological quality of water: An overview. Microbiol. Res. (Pavia) 2013, 4, 2. [Google Scholar] [CrossRef]
  17. Sinclair, A.; Hebb, D.; Jamieson, R.; Gordon, R.; Benedict, K.; Fuller, K.; Stratton, G.W.; Madani, A. Growing season surface water loading of fecal indicator organisms within a rural watershed. Water Res. 2009, 43, 1199–1206. [Google Scholar] [CrossRef]
  18. Oliver, D.M.; Porter, K.D.H.; Pachepsky, Y.A.; Muirhead, R.W.; Reaney, S.M.; Coffey, R.; Kay, D.; Milledge, D.G.; Hong, E.; Anthony, S.G.; et al. Predicting microbial water quality with models: Over-arching questions for managing risk in agricultural catchments. Sci. Total Environ. 2016, 544, 39–47. [Google Scholar] [CrossRef] [Green Version]
  19. Pachepsky, Y.A.; Allende, A.; Boithias, L.; Cho, K.; Jamieson, R.; Hofstra, N.; Molina, M. Microbial water quality: Monitoring and modeling. J. Environ. Qual. 2018, 47, 931–938. [Google Scholar] [CrossRef] [Green Version]
  20. Devane, M.L.; Weaver, L.; Singh, S.K.; Gilpin, B.J. Fecal source tracking methods to elucidate critical sources of pathogens and contaminant microbial transport through New Zealand agricultural watersheds – A review. J. Environ. Manag. 2018, 222, 293–303. [Google Scholar] [CrossRef]
  21. Kay, D.; Anthony, S.; Crowther, J.; Chambers, B.J.; Nicholson, F.A.; Chadwick, D.; Stapleton, C.M.; Wyer, M.D. Microbial water pollution: A screening tool for initial catchment-scale assessment and source apportionment. Sci. Total Environ. 2010, 408, 5649–5656. [Google Scholar] [CrossRef]
  22. Stea, E.C.; Truelstrup Hansen, L.; Jamieson, R.C.; Yost, C.K. Fecal contamination in the surface waters of a rural- and an urban-source watershed. J. Environ. Qual. 2015, 44, 1556–1567. [Google Scholar] [CrossRef]
  23. Xue, F.; Tang, J.; Dong, Z.; Shen, D.; Liu, H.; Zhang, X.; Holden, N.M. Tempo-spatial controls of total coliform and E. coli contamination in a subtropical hilly agricultural catchment. Agric. Water Manag. 2018, 200, 10–18. [Google Scholar] [CrossRef]
  24. Bradshaw, J.K.; Snyder, B.J.; Oladeinde, A.; Spidle, D.; Berrang, M.E.; Meinersmann, R.J.; Oakley, B.; Sidle, R.C.; Sullivan, K.; Molina, M. Characterizing relationships among fecal indicator bacteria, microbial source tracking markers, and associated waterborne pathogen occurrence in stream water and sediments in a mixed land use watershed. Water Res. 2016, 101, 498–509. [Google Scholar] [CrossRef] [PubMed] [Green Version]
  25. O’Callaghan, P.; Kelly-Quinn, M.; Jennings, E.; Antunes, P.; O’Sullivan, M.; Fenton, O.; HUallacháin, D.Ó. The environmental impact of cattle access to watercourses: A review. J. Environ. Qual. 2019, 48, 340–351. [Google Scholar] [CrossRef] [PubMed]
  26. McGrane, S.J.; Tetzlaff, D.; Soulsby, C. Application of a linear regression model to assess the influence of urbanised areas and grazing pastures on the microbiological quality of rural streams. Environ. Monit. Assess. 2014, 186, 7141–7155. [Google Scholar] [CrossRef] [PubMed]
  27. Kloot, R.W. Locating Escherichia coli contamination in a rural South Carolina watershed. J. Environ. Manag. 2007, 83, 402–408. [Google Scholar] [CrossRef] [PubMed]
  28. Lee, D.Y.; Lee, H.; Trevors, J.T.; Weir, S.C.; Thomas, J.L.; Habash, M. Characterization of sources and loadings of fecal pollutants using microbial source tracking assays in urban and rural areas of the Grand River Watershed, Southwestern Ontario. Water Res. 2014, 53, 123–131. [Google Scholar] [CrossRef] [PubMed]
  29. Meeroff, D.E.; Bloetscher, F.; Long, S.C.; Bocca, T. The use of multiple tracers to evaluate the impact of sewered and non-sewered development on coastal water quality in a rural area of Florida. Water Environ. Res. 2013, 86, 445–456. [Google Scholar] [CrossRef]
  30. Verhougstraete, M.P.; Martin, S.L.; Kendall, A.D.; Hyndman, D.W.; Rose, J.B. Linking fecal bacteria in rivers to landscape, geochemical, and hydrologic factors and sources at the basin scale. Proc. Natl. Acad. Sci. USA 2015, 112, 10419–10424. [Google Scholar] [CrossRef] [Green Version]
  31. Byappanahalli, M.N.; Nevers, M.B.; Whitman, R.L.; Ge, Z.; Shively, D.; Spoljaric, A.; Przybyla-Kelly, K. Wildlife, urban inputs, and landscape configuration are responsible for degraded swimming water quality at an embayed beach. J. Great Lakes Res. 2015, 41, 156–163. [Google Scholar] [CrossRef]
  32. Nevers, M.B.; Byappanahalli, M.N.; Shively, D.; Buszka, P.M.; Jackson, P.R.; Phanikumar, M.S. Identifying and eliminating sources of recreational water quality degradation along an urban coast. J. Environ. Qual. 2018, 47, 1042–1050. [Google Scholar] [CrossRef] [Green Version]
  33. Nguyen, K.H.; Senay, C.; Young, S.; Nayak, B.; Lobos, A.; Conrad, J.; Harwood, V.J. Determination of wild animal sources of fecal indicator bacteria by microbial source tracking (MST) influences regulatory decisions. Water Res. 2018, 144, 424–434. [Google Scholar] [CrossRef] [PubMed]
  34. Henson, S.S.; Ahearn, D.S.; Dahlgren, R.A.; Nieuwenhuyse, E.V.; Tate, K.W.; Fleenor, W.E. Water quality response to a pulsed-flow event on the Mokelumne river, California. River Res. Appl. 2007, 23, 185–200. [Google Scholar] [CrossRef]
  35. Droppo, I.G.; Liss, S.N.; Williams, D.; Nelson, T.; Jaskot, C.; Trapp, B. Dynamic existence of waterborne pathogens within river sediment compartments. Implications for water quality regulatory affairs. Environ. Sci. Technol. 2009, 43, 1737–1743. [Google Scholar] [CrossRef]
  36. McKergow, L.A.; Davies-Colley, R.J. Stormflow dynamics and loads of Escherichia coli in a large mixed land use catchment. Hydrol. Process. 2010, 24, 276–289. [Google Scholar] [CrossRef]
  37. Pandey, P.; Soupir, M.L.; Wang, Y.; Cao, W.; Biswas, S.; Vaddella, V.; Atwill, R.; Merwade, V.; Pasternack, G. Water and sediment microbial quality of mountain and agricultural streams. J. Environ. Qual. 2018, 47, 985–996. [Google Scholar] [CrossRef] [PubMed] [Green Version]
  38. Kirs, M.; Harwood, V.J.; Fidler, A.E.; Gillespie, P.A.; Fyfe, W.R.; Blackwood, A.D.; Cornelisen, C.D. Source tracking faecal contamination in an urbanised and a rural waterway in the Nelson-Tasman region, New Zealand. New Zealand J. Mar. Freshw. Res. 2011, 45, 43–58. [Google Scholar] [CrossRef]
  39. Duane, T.P. Recreation in the Sierra. In Status of the Sierra Nevada: The Sierra Nevada Ecosystem Project Vol. II Assessments and Scientific Basis for Management Options; University of California: Davis, CA, USA, 1996; Volume II, pp. 557–609. [Google Scholar]
  40. USFS. Grazing Statistical Summary Fiscal Year 2016 Forest Service Range Management; United States Forest Service: Washington, DC, USA, 2016. [Google Scholar]
  41. USFS. Visitor Use Monitoring Survey Results National Summary Report Fiscal Year 2012 through 2016; United States Forest Service: Washington, DC, USA, 2018. [Google Scholar]
  42. USBLM. Public Land Statistics; United States Bureau of Land Management: Washington, DC, USA, 2018; Volume 199. [Google Scholar]
  43. CSWRCB. Water Quality Control Plan for Inland Surface Waters, Enclosed Bays, and Estuaries of CALIFORNIA; California State Water Resources Control Board: Sacramento, CA, USA, 2019. [Google Scholar]
  44. CRWQCB. Water Quality Control Plan for the Central Valley Region; California Regional Water Quality Control Board: Rancho Cordova, CA, USA, 2019. [Google Scholar]
  45. CRWQCB. Water Quality Control Plan for the Lahontan Region; California Regional Water Quality Control Board: South Lake Tahoe, CA, USA, 2019. [Google Scholar]
  46. Roche, L.M.; Kromschroeder, L.; Atwill, E.R.; Dahlgren, R.A.; Tate, K.W. Water quality conditions associated with cattle grazing and recreation on national forest lands. PLoS ONE 2013, 8. [Google Scholar] [CrossRef] [Green Version]
  47. Oles, K.M.; Weixelman, D.A.; Lile, D.F.; Tate, K.W.; Snell, L.K.; Roche, L.M. Riparian meadow response to modern conservation grazing management. Environ. Manag. 2017, 60, 383–395. [Google Scholar] [CrossRef] [Green Version]
  48. Rice, E.W.; Baird, R.B.; Eaton, A.D.; Clesceri, L.S. Standard Methods for the Examination of Water and Wastewater, 12th ed.; American Public Health Association: Washington, DC, USA, 2012. [Google Scholar]
  49. Stata Corp. Stata statistical software: Release 13.1; Stat Corp: College Station, TX, USA, 2016. [Google Scholar]
  50. Tiedemann, A.R.; Higgins, D.A.; Quigley, T.M.; Sanderson, H.R.; Marx, D.B. Responses of fecal coliform in streamwater to four grazing strategies. J. Range Manag. 1987, 40, 322. [Google Scholar] [CrossRef]
  51. Lau, Y.L.; Liu, D. Effect of flow rate on biofilm accumulation in open channels. Water Res. 1993, 27, 355–360. [Google Scholar] [CrossRef]
  52. Edwards, D.R.; Coyne, M.S.; Daniel, T.C.; Vendrell, P.F.; Murdoch, J.F.; Moore, P.A. Indicator bacteria concentrations of two Northwest Arkansas streams in relation to flow and season. Trans. Am. Soc. Agric. Eng. 1997, 40, 103–109. [Google Scholar] [CrossRef]
  53. Herrig, I.; Seis, W.; Fischer, H.; Regnery, J.; Manz, W.; Reifferscheid, G.; Böer, S. Prediction of fecal indicator organism concentrations in rivers: The shifting role of environmental factors under varying flow conditions. Environ. Sci. Eur. 2019, 31. [Google Scholar] [CrossRef]
  54. Gary, H.L.; Johnson, S.R.; Ponce, S.L. Cattle grazing impact on surface water quality in a Colorado Front Range stream. J. Soil Water Conserv. 1983, 38, 124–128. [Google Scholar]
  55. Forrester, H.; Clow, D.; Roche, J.; Heyvaert, A.; Battaglin, W. Effects of backpacker use, pack stock trail use, and pack stock grazing on water-quality indicators, including nutrients, E. coli, hormones, and pharmaceuticals, in Yosemite National Park, USA. Environ. Manag. 2017, 60, 526–543. [Google Scholar] [CrossRef]
  56. Clow, D.W.; Forrester, H.; Miller, B.; Roop, H.; Sickman, J.O.; Ryu, H.; Domingo, J.S. Effects of stock use and backpackers on water quality in wilderness in Sequoia and Kings Canyon National Parks, USA. Environ. Manag. 2013, 52, 1400–1414. [Google Scholar] [CrossRef]
  57. Lapointe, B.E.; Herren, L.W.; Paule, A.L. Septic systems contribute to nutrient pollution and harmful algal blooms in the St. Lucie Estuary, Southeast Florida, USA. Harmful Algae 2017, 70, 1–22. [Google Scholar] [CrossRef]
  58. Habteselassie, M.Y.; Kirs, M.; Conn, K.E.; Blackwood, A.D.; Kelly, G.; Noble, R.T. Tracking microbial transport through four onsite wastewater treatment systems to receiving waters in eastern North Carolina. J. Appl. Microbiol. 2011, 111, 835–847. [Google Scholar] [CrossRef]
  59. Williams, A.E.; Lund, L.J.; Johnson, J.A.; Kabala, Z.J. Natural and anthropogenic nitrate contamination of groundwater in a rural community, California. Environ. Sci. Technol. 1998, 32, 32–39. [Google Scholar] [CrossRef]
  60. Izbicki, J.A.; Flint, A.L.; O’Leary, D.R.; Nishikawa, T.; Martin, P.; Johnson, R.D.; Clark, D.A. Storage and mobilization of natural and septic nitrate in thick unsaturated zones, California. J. Hydrol. 2015, 524, 147–165. [Google Scholar] [CrossRef] [Green Version]
  61. Clark, M.L.; Norris, J.R. Occurrence of Fecal Coliform Bacteria in Selected Streams in Wyoming, 1990–1999; United States Geological Survey: Cheyenne, WY, USA, 2000.
  62. St Laurent, J.; Mazumder, A. Influence of seasonal and inter-annual hydro-meteorological variability on surface water fecal coliform concentration under varying land-use composition. Water Res. 2014, 48, 170–178. [Google Scholar] [CrossRef]
  63. Stallard, M.A.; Winesett, S.; Scopel, M.; Bruce, M.; Bailey, F.C. Seasonal loading and concentration patterns for fecal bacteroidales qPCR markers and relationships to water quality parameters at baseflow. Water. Air. Soil Pollut. 2019, 230. [Google Scholar] [CrossRef]
  64. Lewis, D.J.; Voeller, D.; Saitone, T.L.; Tate, K.W. Management scale assessment of practices to mitigate cattle microbial water quality impairments of coastal waters. Sustainability 2019, 11. [Google Scholar] [CrossRef] [Green Version]
  65. George, M.R.; Jackson, R.D.; Boyd, C.S.; Tate, K.W. A scientific assessment of the effectiveness of riparian management practices. In Conservation Benefits of Rangeland Practices Assessment, Recommendations, and Knowledg Gaps; Briske, D.D., Ed.; United States Department of Agriculture: Washington, DC, USA; Natural Resources Conservation Service: Washington, DC, USA, 2011; pp. 213–252. [Google Scholar]
  66. USFS. National Best Management Practices for Water Quality Management on national Forest System Lands—Vol.1 National Core BMP Technical Guide; United States Forest Service: Washington, DC, USA, 2012; Volume 1. [Google Scholar]
  67. Freitas, M.R.; Roche, L.M.; Weixelman, D.; Tate, K.W. Montane meadow plant community response to livestock grazing. Environ. Manag. 2014, 54, 301–308. [Google Scholar] [CrossRef] [PubMed]
Figure 1. This cross-sectional, longitudinal survey of microbial water quality was conducted across three rural watershed areas in California, on the west coast of the United States of America during the summer season of July through September of 2016. Black dots in the watershed panels indicate stream sample site locations.
Sustainability 12 05207 g001
Figure 2. Descriptive statistics for E. coli and fecal coliform concentrations observed for 595 sample collections across 77 stream sample sites by stream flow conditions (intermittent, perennial) during the June through September of 2016 summer study period. Lower and upper lines represent the 5th and 95th percentile of the data, lower and upper box ends represent the 25th and 75th percentile of the data, the solid horizontal line in the box is the median of the data, and the dashed horizontal line in the box is the mean of the data.
Sustainability 12 05207 g002
Figure 3. Descriptive statistics for 595 E. coli and fecal coliform concentrations observed across 77 stream sample sites by fecal source (grazing, recreation, rural residence) during the June through September of 2016 summer study period. Lower and upper lines represent the 5th and 95th percentile of the data, lower and upper box ends represent the 25th and 75th percentile of the data, the solid horizontal line in the box is the median of the data, and the dashed horizontal line in the box is the mean of the data.
Sustainability 12 05207 g003
Figure 4. E. coli concentrations (cfu/100 mL) observed over the summer season of 2016 by fecal source (recreation, grazing, rural residence). Symbols represent observed concentrations, and lines represent concentrations predicted by a mixed effects negative binomial regression analysis.
Sustainability 12 05207 g004
Figure 5. Fecal coliform concentrations (cfu/100 mL) observed over the summer season of 2016 by fecal source (recreation, grazing, rural residence). Symbols represent observed concentrations, and lines represent concentrations predicted by a mixed effects negative binomial regression analysis.
Sustainability 12 05207 g005
Table 1. Characteristics of the three upper watershed areas included in this study July through September of 2016.
Watershed
Stanislaus RiverSusan RiverEast Walker River
Study Area (ha)141,969192,35892,642
Elevation Range (m)323 to 35151211 to 25371962 to 3754
Mean Annual Precipitation (cm) 11306961
Mean Annual Temperature (°C) 18.67.74.8
Number of Sample Sites282623
Number of Samples Collected178234183
1 PRISM Climate Group, Oregon State University, http://prism.oregonstate.edu, created 4 Feb 2004.
Table 2. Results of mixed effects negative binomial regression analysis to examine differences in fecal indicator bacteria (E. coli and fecal coliform) concentrations (cfu/100 mL) between stream sample sites with intermittent and perennial flow conditions for 595 water samples collected across 77 stream sample sites throughout the summer sampling period (July through September of 2016).
E. coli Fecal Coliform
Model ParameterCoefficient (S.E.)p-ValueCoefficient (S.E.)p-Value
Independent Variables
Streamflow
Intermittent 1--------
Perennial−1.19 (0.40)0.003−0.70 (0.32)0.090
Intercept3.95 (0.36)<0.0014.59 (0.37)<0.001
Random Intercept
Sample Site Identity 21.80 (0.35)--1.96 (0.37)--
1 Referent condition for streamflow during the analyses, thus no coefficient is generated. 2 Likelihood-ratio tests confirmed the random intercept negative binomial model was significantly superior to standard negative binomial regression for both E. coli and fecal coliform.
Table 3. Results of mixed effects negative binomial regression analysis to examine relationships between fecal source (recreation, grazing, and rural residences), seasonal progression (Julian Day), and fecal indicator bacteria (E. coli and fecal coliform) concentrations (cfu/100 mL) for 521 water samples collected across 60 stream sample sites sustaining perennial streamflow throughout the entire summer sampling period (July through September of 2016).
E. coli Fecal Coliform
Model ParameterCoefficient (S.E.)p-ValueCoefficient (S.E.)p-Value
Fixed Effects
Fecal Source (FS)
Grazing 1--------
Recreation 2−0.84 (0.34)0.013−0.58 (0.34)0.088
Residences 21.31 (0.67)0.0491.88 (0.67)0.005
Julian Day (JD)0.099 (0.045)0.0280.138 (0.042)0.001
JD^2−0.0024 (0.00009)0.015−0.0003 (0.00009)0.001
Intercept−6.81 (5.07)0.179−11.10 (4.68)0.018
Random Intercept
Sample Site Identity 31.35 (0.30)--1.41 (0.31)--
1 Referent condition for fecal source during the analyses, thus no coefficient is generated. 2 Post-hoc pairwise comparison indicted rural residence coefficient significantly different from recreation for E. coli (p-Value = 0.001) and fecal coliform (p-Value < 0.001). 3 Likelihood-ratio tests confirmed the random intercept negative binomial model was significantly superior to standard negative binomial regression for both E. coli and fecal coliform.
Table 4. Exceedances based upon the study period geomean concentration (cfu/100 mL) standard for E. coli and fecal coliform (FC) at each sample site by specific fecal sources (recreation, grazing, and rural residences) across the entire summer study period (July through September of 2016).
Percent of Sample Sites
SitesE. coli > 100FC > 20FC > 200
Overall77146153
Recreation4085345
Grazing31106555
Residences683100100
Table 5. Exceedances based upon the study period statistical threshold value (STV) concentration standard that no more than 10% of individual grab samples exceeding benchmark concentrations (cfu/100 mL) for E. coli and fecal coliform (FC) at each site by specific fecal sources (recreation, grazing, and rural residences) across the entire summer study period (July through September of 2016).
Percent of Sample Sites
SitesE. coli > 320FC > 40FC > 400
Overall77138325
Recreation4058015
Grazing31168429
Residences65010067

