Article

Biomass Growth and Its Control in the Process of Biofiltration of Air Contaminated with Xylene on a Biotrickling Column Filled with Expanded Clay

1
Department of Organic and Physical Chemistry, Faculty of Chemical Technology and Engineering, West Pomeranian University of Technology in Szczecin, Al. Piastów 42, 71-065 Szczecin, Poland
2
Department of Heating, Ventilation and Heat Engineering, Faculty of Civil Engineering and Architecture, West Pomeranian University of Technology in Szczecin, Al. Piastów 50, 70-311 Szczecin, Poland
*
Author to whom correspondence should be addressed.
Sustainability 2020, 12(13), 5412; https://0-doi-org.brum.beds.ac.uk/10.3390/su12135412
Submission received: 29 May 2020 / Revised: 29 June 2020 / Accepted: 2 July 2020 / Published: 4 July 2020

Abstract

:
Biofiltration of air polluted with xylene vapors was carried out for nearly two years in a large laboratory-scale installation with a volume of the bed of expanded clay equal to 32 dm3. During the experiment, different xylene inlet concentrations were applied, within the range from 300 to over 1500 mg/m3 at a linear gas flow rate of 0.008, 0.016, and 0.033 m/s, as well as 0.12 and 0.24 dm3 of medium dispensed every 3 h on top of the bed. The progress of the process was followed by measuring the xylene concentration at the inlet and outlet of the column, column mass, and gas flow resistance. The capability to purify air polluted with xylene with an average efficiency of approx. 90% was demonstrated. The process was interrupted by a significant increase in gas flow resistance, caused by a large growth of biomass, resulting in an increase in the mass of the bed by more than 45%. Both intensive rinsing of the bed with a stream of water, causing its fluidization, and rinsing and mixing after removing the bed from the column allowed to reduce flow resistance to a value close to the initial one. To ensure the supply of biogenic elements, it was necessary to periodically spray the bed with a solution of the medium in an amount of up to about 0.1 dm3/h/m3 of purified air.

1. Introduction

One of the significant environmental problems plaguing the contemporary world is the emission of volatile non-methane organic compounds into the atmosphere. The emission of organic solvent vapors, of which xylene is one of the main components, constitutes a large share. Its production in Europe in 2000 was 2872 kt [1]. It is a good solvent for paints, varnishes, and adhesives. In many cases, its share in commercial solvents is in a wide range of 10–60%. It gets into the environment as a result of evaporation and leakage from tanks and incomplete combustion. Its content in automotive exhaust gases can be dominant [2]. According to European and American regulations, it is a dangerous substance, hence its emission into the environment should be controlled [3,4]. Biofiltration due to its close connection with the environment is one of the better methods of reducing its emissions.
Biofiltration and biofiltration on a trickling bed are typical biological methods of cleaning waste gases polluted [5] with biodegradable substances, especially volatile organic compounds. The commonly accepted terms biofiltration and biofilters can lead to misunderstandings. In fact, this is not classic filtration, and biofilters are not typical filters. Biofilters are bioreactors with an immobile and humid packed bed, inhabited by microorganisms (packed-bed reactors). They adhere to the bed surface, forming a more or less continuous, moist, and mucous layer called biofilm [6]. The pollutants first diffuse from the purified gas stream to the biofilm, where they are absorbed. In a subsequent process, they are oxidized by diverse and complex microbial communities of biofilm-forming microorganisms. They use pollution as a source of nutrients, energy, and construction materials. Consequently, the factor significantly affecting biofilter efficiency is the activity of microorganisms during the assimilation and decomposition of gaseous pollutants [7]. The biofilm mainly consists of mixtures of bacterial and fungal cultures [7,8]. The rinsed biofilter, also called trickle-bed reactor, differs from a regular biofilter in that, if a bed in a regular biofilter is only moistened to the assumed high humidity, in the flushed biofilter it is permanently washed with water nutrient solution (trickling bed).
Biofiltration efficiency depends on a number of environmental parameters, which define the conditions inside the biofilter. These include in particular the temperature, pressure, humidity of the bed and gases, the availability of biogenic elements and other nutrients, the rate of flow of gases and liquids washing the bed, and the type of packing material, constituting the basis for the development of microorganisms [9]. When the values of these parameters and factors are optimal, the microorganisms, that inhabit the bed, can demonstrate their full potential and effectively remove contaminants from filtering the air. It is connected with the reliable achievement of the assumed level of purification and high specific rate of biodegradation, on which depends the size of the device. The lifetime of the bed varies, depending mainly on whether the packing material is based on a biodegradable material or not. For biodegradable materials, it usually does not exceed five years. An unfavorable feature of non-biodegradable beds is the need to systematically feed them with a nutrient solution.
Permanent flushing of the bed of the rinsed biofilters creates favorable conditions for the intensive development of fungi, whose mycelium overgrows the grains of the bed and the inter-grains spaces. This leads to an increase in the thickness of the biofilm and the degree of surface coverage, which leads to a reduction in the porosity of the bed, increase in gas flow resistance through the bed, and in the extreme case to its clogging [10,11,12]. Therefore, the accumulation of biomass is considered to be the main factor contributing to the increase of airflow resistance through the bed of biofilter during its long-term operation [13,14].
The rate of biomass accumulation depends on the conditions prevailing inside the apparatus, particularly on the bedload, temperature, and flow rate of the rinsing fluid [15]. For example, in the case of waste gases with low pollutant concentrations, the problem of biomass overgrowth is significantly smaller. Other factors also have their influence, for example, substances used to improve the bioavailability of substrates, such as biosurfactants or silicone oil. The oil, together with the impurities dissolving in it, forms a separate organic phase. This should increase the rate of transport of pollutants from the gas phase to the biofilm in a situation where it limits the speed of the entire biodegradation process on the bed [16].
An increase in biomass and flow resistance has been observed by many researchers [16,17,18,19,20,21,22]. In addition to oxygen taken from the air and carbon present in impurity particles, microorganisms inhabiting the inert biofilter bed also require other nutrients, needed mainly for protein synthesis, which enables the long-term operation of biofilters [23]. Elements such as nitrogen, sulfur and phosphorus usually have to be delivered by sprinkling the bed with a medium of suitable composition [24]. As indicated by the example of toluene by Delhoménie et al. [25], the removal of impurities is strongly dependent on the presence of nitrogen in the medium, which constitutes on average to 13% mass of bacteria. Acuña et al. [26], as well as Kennes and Veiga [14], showed that increasing the amount of nutrients positively affects the growth of microbial cells. Simultaneously, Prado et al. [20] indicate that excessive reduction of nutrient doses, by reducing the dosing frequency of medium, inhibits the biodegradation of pollutants in the biofilter. On the other hand, even significant fluctuations in the amount of nutrient solution, but in the range when the amount of nutrients is sufficient, did not significantly affect the course of biofiltration. Porous, inert materials such as perlite have the ability to retain water and dissolved nutrients and act as a reservoir, which justifies the lack of the need for continuous nutrient dosing. Furthermore, the addition of trace elements and vitamins to the medium and temperature changes between 25 and 33 °C did not significantly affect the course of biofiltration.
Methods of limiting excessive biomass accumulation can be divided according to the proposal of Kennes and Veiga [14] into:
-
Mechanical, such as backwashing with or without fluidizing the bed, air blowing, regular stirring, or mixing of the filter bed, etc., that is, the use of shear forces;
-
Chemical and physical, such as the usage of pH regulators, oxidants, surfactants, bactericidal and hydrolyzing compounds, enzymes, and elevated temperature during backwashing;
-
Slowing of microbial growth by limiting the availability of biogenic elements: nitrogen, potassium, phosphorus, and microelements;
-
The use of predation, for example, by using protozoa or mites as predators of bacteria or fungi.
Another division of methods was proposed by Yang et al. [9]:
  • Physical: the use of mechanical or hydraulic shear forces;
  • Chemical: limiting the availability (control) of carbon and other nutrients, as well as washing or pouring solutions containing oxidants, surfactants, bactericidal, and hydrolyzing compounds;
  • Biological: predation;
  • Improving the biofilter design;
  • Improvement of the biofilter mode of operation.
Compared to biological methods, both physical and chemical methods show some imperfections, such as high costs and periodical decrease in cleaning efficiency, during the re-acclimatization of the bed [9]. Therefore, special attention is paid to biomass control through an appropriate design of the biofilter and improvement of the operating mode. These are cost-effective and environmentally friendly solutions.
High hopes are associated with the use of biological predation. The principle of its operation is based on ecological foundations of trophic pyramids and food chains, in which the efficiency of using food to build new organisms decreases strongly with increasing trophic levels. The population masses of organisms occurring in the biofilter at various trophic levels form a pyramid of biomass. A longer food chain, which consumes more energy, leads to lower biomass efficiency. In effect, the quantity and mass of organisms belonging to species found in surplus at lower trophic levels may be reduced in the presence of species from higher trophic levels.
Improvement of biofilter performance can be achieved through the application of appropriate operational strategies. They can ensure a more even distribution of biomass, and thus a more efficient use of the entire bed layer and reduce the probability of clogging. As indicated by Song and Kinney [27], an action to slow down the rate of biomass accumulation may include switching the gas inlet from top to bottom of the column at three-day intervals. Shorter, 12-h switching rhythm is proposed by Wright et al. [28]. In general, switching of the direction of the gases supply to improve biomass distribution and activate microorganisms results in a more stable bioreactor operation. Among the measures helpful in reducing accumulation and to allow for an even distribution of biomass, one can also distinguish the splitting of the purified gas stream into two streams and feeding one of them at the top part and the other at the middle of the column height [29]. It is also possible to distinguish dosage of pollutants with periodic interruptions lasting from several to several dozen hours [30] and the compensation of the column load with volatile organic compounds through the use of adsorption prior to biofiltration [31].
The interesting physicochemical methods of improving biofiltration described in the literature also include preliminary exposure of the cleaned air to UV radiation, ozone dosing, or the use of shear force, occurring during intensive flushing of the bed. The influence of irradiation of the gas stream with UV rays is described by Moussavi and Mohseni [10]. Treatment of the gas stream feeding the biofilter with UV radiation causes photolysis of air oxygen and impurities. A number of substances are oxidized under these conditions, including those resistant to biodegradation. As the process is usually incomplete, it leads to the creation of multiple intermediate products. They are often more readily biodegradable and soluble. The more aggressive ones like ozone and peroxides can limit the growth of microorganisms, which is the most likely reason for slowing biomass growth.
Saingam et al. [12], as well as Xi et al. [32], showed that ozone dosing stabilizes the density of microorganisms in the biofilm community and prevents excessive accumulation of biomass, thus limiting the pressure increase on the bed. In turn, Wang et al. [33], studying the biofiltration of ethylbenzene, showed that the addition of surfactant and zinc ions (Zn2+) to the bed can slow down the growth of biomass and increase the efficiency of biodegradation. However, this treatment did not completely protect the bed from clogging, and it had to be periodically washed with the nutrient solution.
Clogging of the column due to excessive biomass growth on the column fill was not noted by Kasperczyk et al. [34] who investigated the removal of styrene. If the resistance of gas flowing through the bed increased, they doubled the stream of liquid spraying on the packing material, which was enough to remove the excess biofilm. A similar strategy was also applied by Rene et al. [16], who in case of the problem, increased the flow of rinsing liquid four times. Among the methods of limiting the excessive accumulation of biomass, we can also distinguish direct, periodic mixing of the packing material [5,35,36]. In addition, in certain situations, leachate recirculation can improve environmental conditions for microorganisms and increase process efficiency without excessive increase in gas flow resistance [37].
In practice, reduction of excess biomass is usually done by intensive backwashing of the bed, preferably with its fluidization. It may result in a temporary decrease in filtration efficiency. Flores-Valle et al. [19] confirmed that the biomass reduction procedure in the biofilter is necessary to maintain the efficiency of the biofilter at a certain level. The applied treatments must be carried out in such a way that they should cause the least possible harm to the biomass inhabiting the bed and be cost-effective. They also indicated that column regeneration after biomass-reduction treatments using chemicals is much longer compared to treatments without using them. Zapotocky et al. [38] considered the procedure of backwashing to be effective in biomass controlling, which enables a long-term operation of the biotrickling filter. Mendoza et al. [36] confirmed that it is minimally invasive, which translates into a quick return to the initial efficiency. Reduction in biofiltration efficiency while using periodic backwashing with full fluidization of the bed was not observed by Alonso et al. and Kim et al. [39,40]. They observed a clear decrease in overpressure in the biofilter, without a decrease in the degree of pollution removal. These authors recommended increasing the temperature of the liquid used in the backwash treatment in order to facilitate the removal of biomass. They showed that the most effective method is to wash with water at a temperature of 20 °C to 50 °C. Higher temperatures should not be used, because too-hot liquids reduce the activity of the microorganisms, thus limiting the effectiveness of the removal of contaminants [41]. Smith et al. [42] pointed out that the frequency and duration of backwashing should be adapted to the actual dynamics of changes in the column work, resulting from changes in the composition of volatile organic compounds, load changes, and other relevant factors. Meanwhile, Xi et al., Hwang et al., and Mendoza et al. [5,35,36] proposed direct, periodic mixing of the filtration bed and recirculation of the leachate, which improved the environmental living conditions of microorganisms and, as a result, favorably affected the efficiency of the process. Flores-Valle et al. [19] indicated that the mixing procedure allows removing excess biomass without reducing the biodegradation activity in the biofilter. On the other hand, Roshani et al. [37] indicated that the blending process (in the biofilter) alone does not bring any significant effects.
Due to the complexity of the problem, the information gathered/collected so far on the accumulation of biomass during biofiltration is insufficient. Very important information about the rate of biomass accumulation and increase in flow resistance obtained directly from biofiltration studies is practically unavailable, especially for comparable time with several years of industrial biofilter exploitation. For this reason, it is still difficult to determine in advance the optimal amount of biomass necessary for the proper operation of a biofilter, its accumulation rate, and how to control it [14]. Therefore, systematic research to expand knowledge in this area is still necessary. Perhaps, preliminary studies preceding the design work on a new biofilter will still be required.
The main purpose of the experiment was to check the rate of biomass growth and the associated increase in gas flow resistance during biofiltration of air polluted with technical xylene. To ensure comparability of research with the work of industrial biofilters, the duration of the experiment was assumed to be close to two years. Basic operating parameters such as gas flow rate and associated retention time, xylene concentration, and column spraying intensity should be typical for filtration carried out in both industry and laboratories.

2. Materials and Methods

The experiment was conducted in a large laboratory-scale installation, the key element of which was a column with a diameter of 0.19 m and a working height of 1.12 m (Figure 1). The initial volume of the packing material was 0.032 m3. The total height of the column was 1.45 m. It was filled with a synthetic packing material with the trade name of keramzyt (ceramsite—expanded clay, product of Saint Gobain—Leca, Poland) with a grain size of 2.5–6 mm placed on a grate mounted at a height of 0.095 m from the bottom of the column. Keramzyt is a ceramic insulating material, widely used in construction, obtained by clay firing. This material is readily available and relatively cheap. Due to its properties such as porosity and moisture resistance, it can be a replacement for natural minerals such as volcanic lava or perlite. Overworked keramzyt was used in earlier research to remove o-xylene from the air. The weight of the column together with the packing material on the day of the start-up was 38.7 kg, and the weight of the wet bed pre-settled with microorganisms was 26.4 kg. The moisture content of the bed calculated in relation to the wet weight was 60.2%. The gas flow through the installation was controlled using an Aalborg (Model GFC 47) mass flow regulator. It was determined successively on three levels: 28, 14, and 42 dm3/min. This corresponds to linear flow rates calculated on empty equipment: 0.016, 0.008, and 0.033 m/s. The assumed concentration of xylene vapors was achieved by dispensing liquid xylene into the air stream using an FMI Q Pomp micro-metering pump (Model QG6). The resulting gas stream was directed to the filter column. Technical xylene from the company Dragon Poland based in Krakow was used, being a mixture of ortho-, meta- and para-isomers. Actual concentrations of xylene at the inlet and outlet from the column were determined by gas chromatography. The calculations were made as described in the earlier paper [43]. The sprinkling of the biofiltering column was carried out using a sprinkler located on its upper part. During its activation, the column was sprinkled every 3 h by opening for 3 min a solenoid valve, connecting the sprinkler with a nutrient medium tank with an air cushion. In the later stages of the study, the column sprinkling period was similar, with the difference in the time of medium administration, which was 6 min and returned to the original value after 58 days. The sprinkler performance was about 0.04 dm3/min. The mineral medium according to Kojima et al. [44] was used containing 3.7 g Na2HPO4·12H2O, 0.5 g KH2PO4, 5 g NH4Cl, and 0.2g MgSO4·7H2O per 1 dm3 of distilled water, without the addition of o-cresol and yeast extract. The concentration of contamination at the inlet to the filter column was determined by turn at the level of approx. 700, 500, 1000, 300, 1500, and 800 mg/m3 with the gas flow at a level of 28 dm3/min. The ambient temperature of the column oscillated in the range of 24 ± 2 °C.
In the course of the experiment, during the period of 713 days of operation of the installation, the concentration of contamination, the mass of the column, and the resistances of airflow through the bed were measured. Changes to the inlet concentrations and airflow in the filter column were made to test the influence of these parameters on the course of biofiltration when the efficiency of the column remained constant for several days. When the flow resistance reached a value that prevented further operation of the column due to the blowing of the siphon discharging the nutrient medium, the backwashing of the column or mixing and rinsing of the bed previously unloaded from the column was performed. The duration of a single operation of dispensing a nutrient solution was changed to provide information on how the amount of dosed nutrient solution affects the biomass growth. During the holiday break, the airflow was reduced to a minimum, the xylene dosing was switched off, and the column bed was wetted with water in order to prevent it from drying out. The most important information on the course of the experiment is summarized in Table 1.

3. Results

3.1. Effect of Xylene Concentration, Gas Flow Rate, and Sprinkle Intensity on Biofiltration Efficiency

At the beginning of the experiment, approximately 30 days after adaptation of the bed, when the efficiency of xylene removal from the air was low, it quickly and significantly increased to a level not lower than 78%, to reach 100% at the lowest xylene concentration (Figure 2). After increasing the concentration of xylene to the values greater than 1200 mg/m3 on the 150th day of the experiment, biofiltration efficiency was decreased and remained within the range of 78 to 35% immediately before the holiday break. Subsequently, after the summer break, the pre-holiday gas flow and xylene concentration were restored and the medium was dispensed instead of water at 120 cm3/cycle. When the effect of xylene removal in the column was still not observed after more than 30 days, its concentration at the inlet was reduced to 700 mg/m3 and the gas flow rate to 14 dm3/min. The column began to remove xylene initially with an efficiency of approx. 60%, approx. 80% between the 349 and 441 days, and reached 90% to a 100% efficiency (in most cases) between 480 to 630 days. On day 498, the airflow was changed from 28 to 14 dm3/min. This did not have any effect on the efficiency of filtration. The efficiency of biofiltration was significantly influenced by the bed flushing procedures, especially combined with its mixing, when the return to the value before mixing lasted from 14 to over 42 days. This was the case after flushing on days 441 and 696, when returns lasted 42 and 14 days, respectively. After rinsing the bed without mixing on day 632, return to the value before mixing lasted only for 2 days. In the course of further research, filtration efficiency persisted at a similar level despite changes in the gas stream, including its increase to 42 dm3/min. During the application of the gas flow of 42 dm3/min (on the 647th day of measurement), the highest rate of xylene decomposition during the whole experiment was recorded, equal to 99.7 g/m3/h with a load of 105.7 g/m3/h.
Based on these results, it can be concluded that in order to ensure high efficiency of biofiltration of air stream contaminated with xylene at linear flow rates from 0.008 to 0.033 m/s and concentrations up to 1500 mg/m3 and even slightly higher, it is necessary to ensure systematic moistening of the column bed with the medium, with the intensity of at least 2.5 dm3/h/m3 of the bed and 0.1 dm3/h/m3 of the purified air. This is due to the conversion of the dosing frequency and the size of the nutrient medium stream into the volume of the bed and the purified air stream. The effects described above were accompanied by changes in the mass of the bed and resistance of the filtered airflow.

3.2. Effects of Xylene Concentration, Gas Flow Rate, and Sprinkling Intensity on Biomass Growth and Flow Resistance

During the research, a rapid increase of overpressure on the bed was observed twice, after some time of operation of the column loaded with xylene (Figure 3). Each time it was connected with a significant, linearly time-dependent increase in column mass caused by increasing biomass. The first rapid increase in hypertension began around the 200th day of the experiment, after about two weeks from the date of changing the time of a single nutrient medium dosing operation from 3 to 6 min, thus doubling the volume of a single medium dosing operation from 120 cm3 to 240 cm3. On the 240th day, it exceeded 12 kPa, which in practice was tantamount to clogging the column. It should be noted that the increase in biomass from the moment the research was initiated until the end of the first exponential increase in flow resistance was about 12 kg, which accounted for 46% of the mass of the initially inhabited bed. During the summer break, the overpressure decreased to around 1.2 kPa and the column weight decreased by 5 kg. In relation to the mass of the initially inhabited bed, it was about 20%. After the summer break, pre-set airflow and the time of nutrient solution dosing were maintained for the next 127 days (up to the 441st day). At that time, the airflow resistance remained at a level similar to that observed during the holiday break, i.e., 1.2 kPa, while the biomass increased noticeably by 4.5 kg. In relation to the mass of the pre-populated bed, it was about 18%. On the 441st day of column operation, the mixing and rinsing of the bed after its removal from the column was performed in order to reduce the biomass. As a result, the mass of the column decreased by 6.5 kg, which is about 26% of the mass of the pre-populated bed, and the airflow resistance decreased to a value close to 0 Pa. After this operation, the airflow resistance did not change noticeably, but the mass of the column grew systematically. On the 498th day, the airflow was changed from 28 to 14 dm3/min. This did not have a major impact on the column’s operation. The period of tests with the airflow of 14 dm3/min lasted 89 days (from the 498th to 587th day). At that time the mass of the column increased by about 3 kg, which constituted to about 11% of the bed mass, while the airflow resistance increased from 0 kPa to about 4 kPa.
On the 587th day, the airflow was changed from 14 to 42 dm3/min. As a result, for the second time, the flow resistance started to increase rapidly and after 4 days reached 11 kPa. During further studies, strong fluctuations of airflow resistance were observed, which is clearly visible in Figure 3. At the same time, the mass of the column was systematically, although slowly, increasing. After 45 days, on the 632nd day of the experiment, the procedure of column backwashing was performed without fluidization of the bed. It allowed reducing the resistance of airflow by about 62%, while the mass of the column remained practically unchanged. In the course of further research, the airflow resistance showed an upward trend. After 57 days of operation after backwashing, i.e., on the 689th day of the experiment, due to a significant increase in flow resistance, the column was found to be clogged. Reducing the flow rate on the 689th day to 28 dm3/min did not bring any noticeable changes in the airflow resistance. After a week, in order to reduce them radically, a bed rinsing with mixing was performed after removing it from the column. This allowed reducing airflow resistance from about 12 kPa to 0 Pa and column weight by about 6.5 kg, i.e., by 26% of the bed’s initial weight. The initial, approximately 90%, biofiltration efficiency was obtained after 15 days from the moment of bed washing and mixing outside the column. It was proof of the effectiveness and repeatability of this operation because the effect was practically the same as after mixing with rinsing on the 441st day.

3.3. Estimation of Indicators of Daily Biomass Increase and Biomass Efficiency Factors

The increase of the column weight over three periods 3–240 (A), 314–441 (B), and 452–681 (C) days, showed an approximately linear character (Figure 3). Using the Excel spreadsheet, trend lines were determined whose equations had the forms: y = 0.0481x + 38.954, R2 = 0.9449, y = 0.0155x + 43.242, R2 = 0.5293, and y = 0.0268x + 32.122, R2 = 0.9390. Based on the value of the line slope equal to the daily column mass increase, equivalent to biomass increase, and calculated for these periods the arithmetic mean loading of the bed with xylene, the average daily indicators of wet biomass growth and yield coefficients were calculated for individual periods. They were expressed as the quotient of the slope and the mass or volume of the bed, as well as the quotient of the daily indicators of biomass growth and the average daily load value, respectively.
They amounted respectively to: (A) 0.00182 kg/kgof the bed/day, 0.00152 kg/dm3of the bed/day, and 1.42, (B) 0.00059 kg/kgof the bed/day, 0.00048 kg/dm3of the bed/day, and 0.33, (C) 0.00102 kg/kgof the bed/day, 0.00084 kg/dm3of the bed/day, and 0.85. Assuming a 30% share of dry biomass, the dry biomass yield coefficients would be 0.43, 0.01, and 0.26, respectively.

4. Discussion

The biotrickling filters compared with classical filters have significant advantages. The beds used in them are usually less susceptible to destruction, and nutrient delivery can be precisely controlled. The possibilities of their practical use, however, are significantly reduced by the excessive growth of biomass blocking the flow of gases over time. In the case of this work, during the operation of the filter without significant external interference such as flushing the bed with stirring or a long break, the biomass grew with an approximately constant speed, regardless of the filtering parameters.
A rapid increase in resistance occurred twice. The first time after doubling the amount of dosed medium on day 183. The second began around day 550 at the lowest gas flow of 14 dm3/min and accelerated rapidly after tripling the flow on day 587 of the experiment. It is surprising that up to a point, the increase in resistance is slower than the increase in biomass mass, however, eventually, it significantly overtakes. This phenomenon has not been reported in the literature known to the authors of this work. Furthermore, we did not come across a work in which the simultaneous measurements of bed mass changes and an increase in flow resistance were described.
It can be assumed without any major reservations that doubling the amount of nutrient solution accelerated the moment from which the exponential phase of biomass growth began, which with some delay leads to a rapid increase in flow resistance [45]. The increase in resistance after tripling the gas flow rate could be expected, given the Darcy–Weisbach equation, according to which the flow resistance is proportional to the square of the flow rate.
The lack of a parallel increase in flow resistance to the biomass mass increase may be, among others, the result of uneven biomass growth along the column height. It is definitely faster from the inlet side, where there is a greater supply of nutrients in the form of air pollution [46,47,48,49]. Measured was the mass of the entire column, not its distribution. In this way, the inlet to the column could be blocked, while the rest of the bed would still exhibit high porosity. In addition, making the assumption about the geometry of the pore of the bed, it can be shown that the increase in gas flow resistance through the bed will be much faster than the increase in biomass mass. For example, accepting that the pores of the bed have the shape of cylindrical channels, it can be shown that the ratio of pore radii will change in accordance with the relationship: ri/ri+1 = (ri2 − V/πl)/(ri+12 − V/πl), where: ri is channel radius, V is unit increase in volume, and l is channel radius. Hence ri+1 = (ri2 − V/πl)1/2. Assuming constant biomass density, the biomass mass gain will be proportional to its increase in volume. With a constant numerical value of the V/πl term, which is synonymous with a constant biomass growth rate, the decrease in pore diameter will be the faster, then the larger the increase in unit mass will be. Since the cross section of the tubules is proportional to the square of its diameter, it will decrease at the same rate. This will result in the inverse increase of the gas flow rate. Because, according to the Darcy–Weisbach equation, the flow resistance is proportional to the square of the flow rate, it should increase in proportion to the fourth power of biomass mass, and even faster, taking into account the first effect.
In addition, the rapid increase in resistance on the column bed may be associated with an increase in the share of fungi in the biofilm structure. This is likely because the conditions in the flushed biofilter beds, i.e., high humidity and elevated temperature, promote fungal growth. They have a larger outer surface compared to bacteria [50,51]. Fungal mycelium have also the ability to build spatial structures [52], which can contribute to accelerated clogging of the pores of the bed.
Although studies on the increase in flow resistance were planned, it was not expected for the increase to reach the values preventing gas flow when using a pump and not a fan, which is typically used in industrial solutions. In order to complete the research, it was decided to rinse the column, and later to unload the bed from the column and rinse it and mix it out. Both methods proved effective, as other researchers have also stated [19,35,36,38,42]. Due to the labor-intensive operation, the column bed can be unloaded only in critical situations. Biomass also decreases when there is a lack of food for microorganisms. This was the case during the summer break when the bed was scarcely oxygenated, wetted only with water, and there was no carbon source. A similar effect occurred in two studies by Kim & Sorial and Kim et al. [13,40] and was associated with the reduction of biomass by reducing the amount of pollution supplied.
Calculated for the experiment, the average daily indicators of wet biomass growth and the yield coefficients are similar to those obtained in studies conducted in suspension for o-xylene and other organic substances [14,53,54,55]. They can be the basis for predicting biomass growth in industrial biotrickling filters.
The closest tests were done by Jorio et al. [47]. The apparatus dimensions as well as the gas flows used, xylene concentration, and spraying intensity were very similar. However, they did not carry out mass bed measurements or systematic pressure drop measurements. Their largest pressure drop was 40 mm H2O/m of packing height. In the case of this work, it was about four times more. On the other hand, they lasted twice as long and gave a unique opportunity to compare biomass mass increase and flow resistance.
The obtained results allow stating that the biofiltration of technical xylene on a column filled with keramzyt (expanded clay) and sprinkled with a mineral solution of the medium may take place with high efficiency close to 100% at the concentration of xylene reaching 1500 mg/m3. This process is accompanied by a significant increase in biomass, which in the course of 2/3 of the year results in a 46% increase in the bed mass, with a daily increase in the range of approx. 0.6 to 1.8 kg of wet biomass/Mgof the bed/day. The parallel increase in flow resistance results in practical clogging of the bed. Tested procedures, such as column backwashing, and above all, wash with stirring of the bed performed after its removal from the column, showed that they allow a significant reduction of airflow resistance in the biofiltration column. This operation allows the reduction of flow resistance, practically to 0 Pa. This allowed to unblock the column and to carry out further measurements, significantly extending its working time. On the other hand, the backwashing procedure was less burdensome than wash and mixing of the bed outside the column. However, to be fully effective, it would have to be performed frequently and regularly enough. This would be particularly important for industrial installations. In their case, mixing and rinsing outside the column due to the large volume of the bed and difficult access would pose a huge problem and would be unacceptable in practice.

5. Conclusions

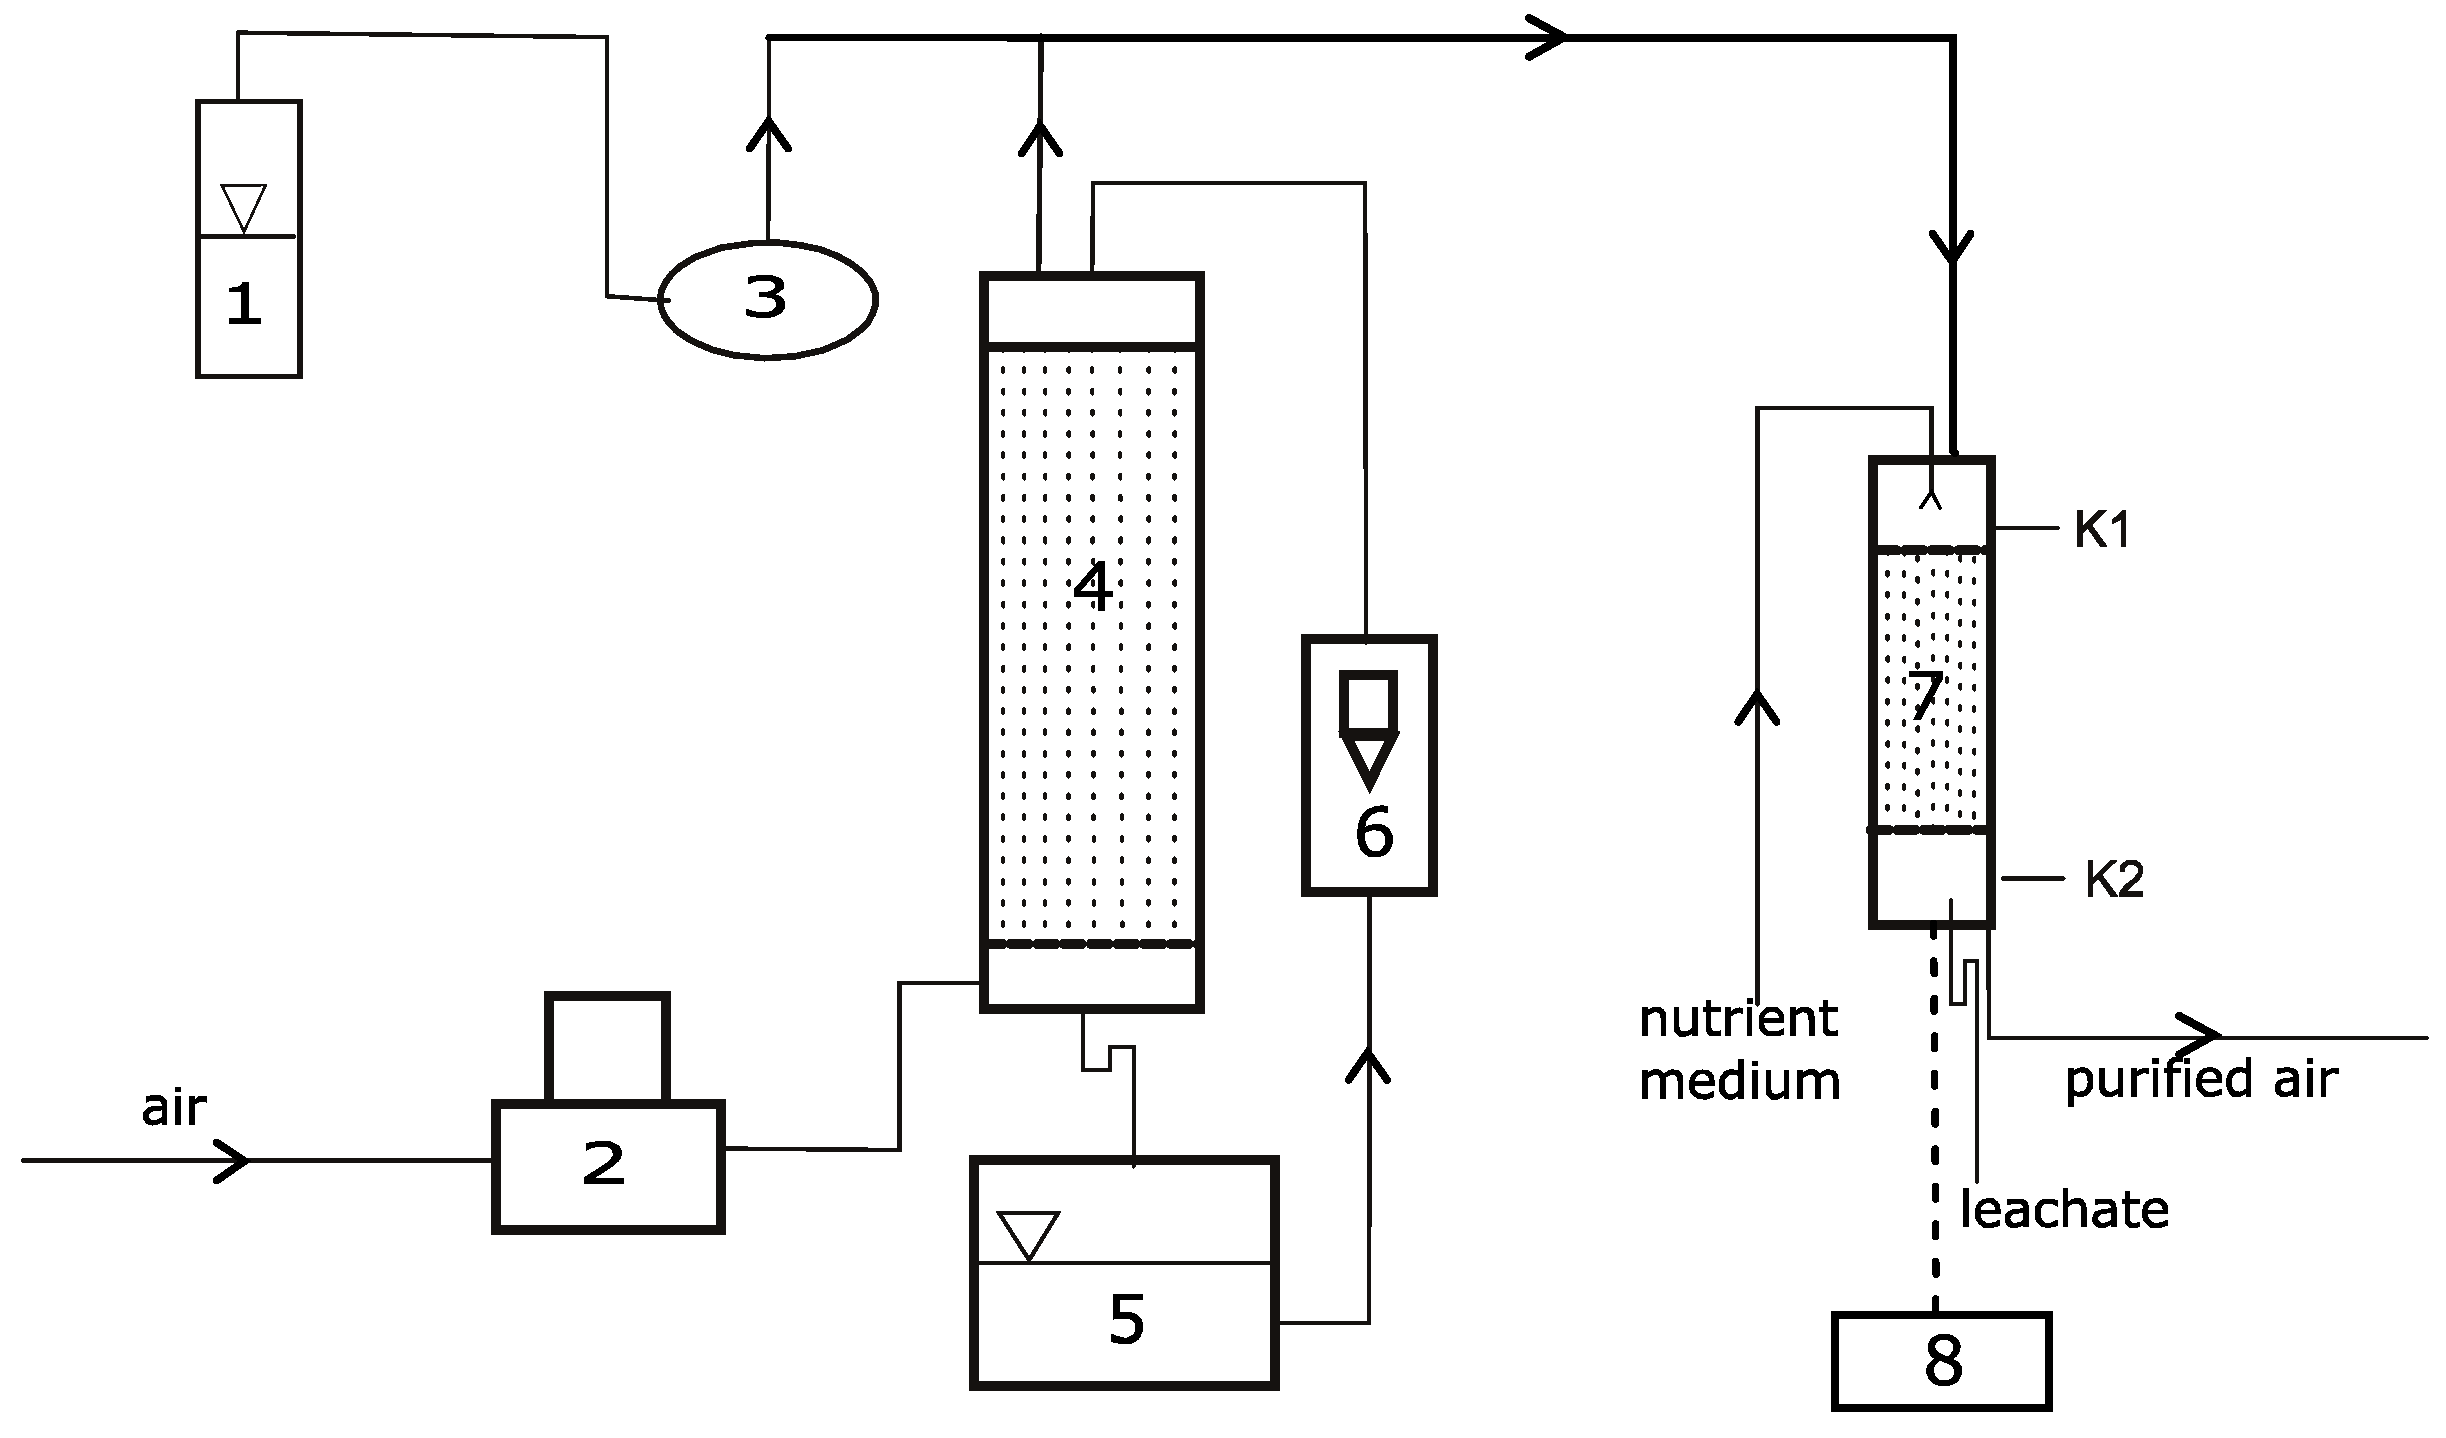
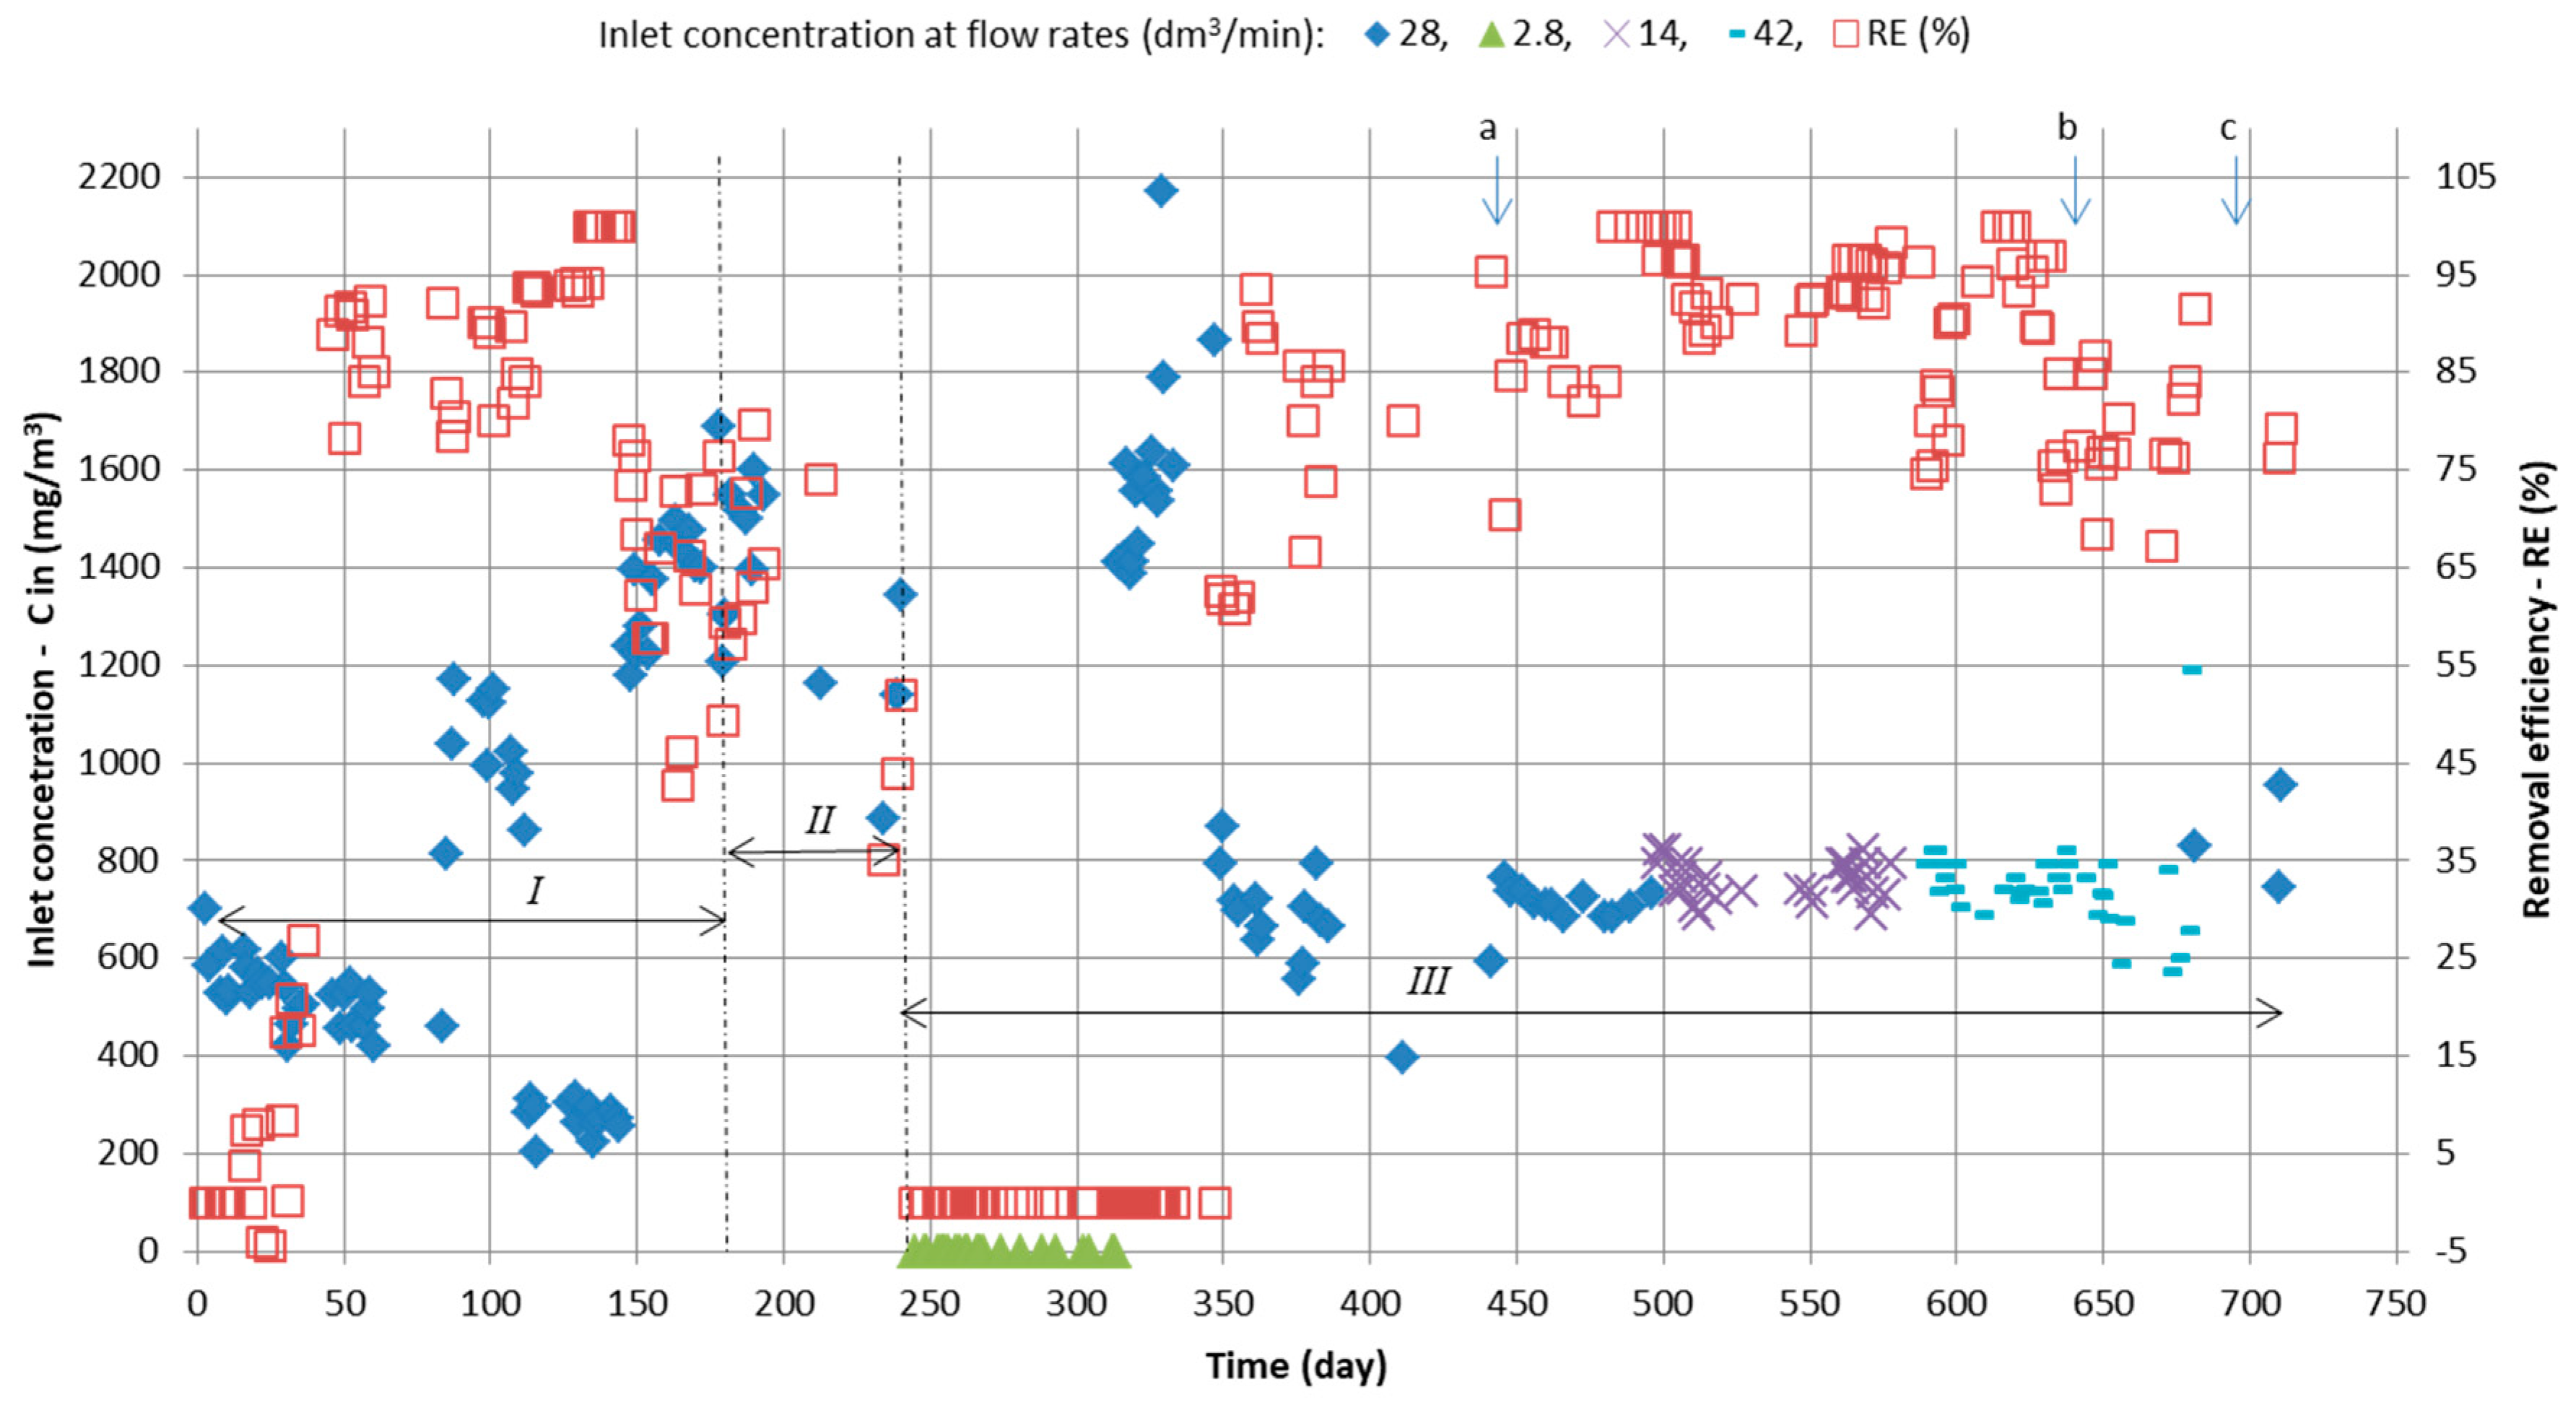
  • Air contaminated with technical xylene can be effectively purified by biofiltration on a biotrickling column filled with keramzyt (fired clay) at a concentration of up to 1500 mg/m3, airflow at a linear rate of up to 0.032 m/s, and a load of the bed up to 105 g/h/m3.
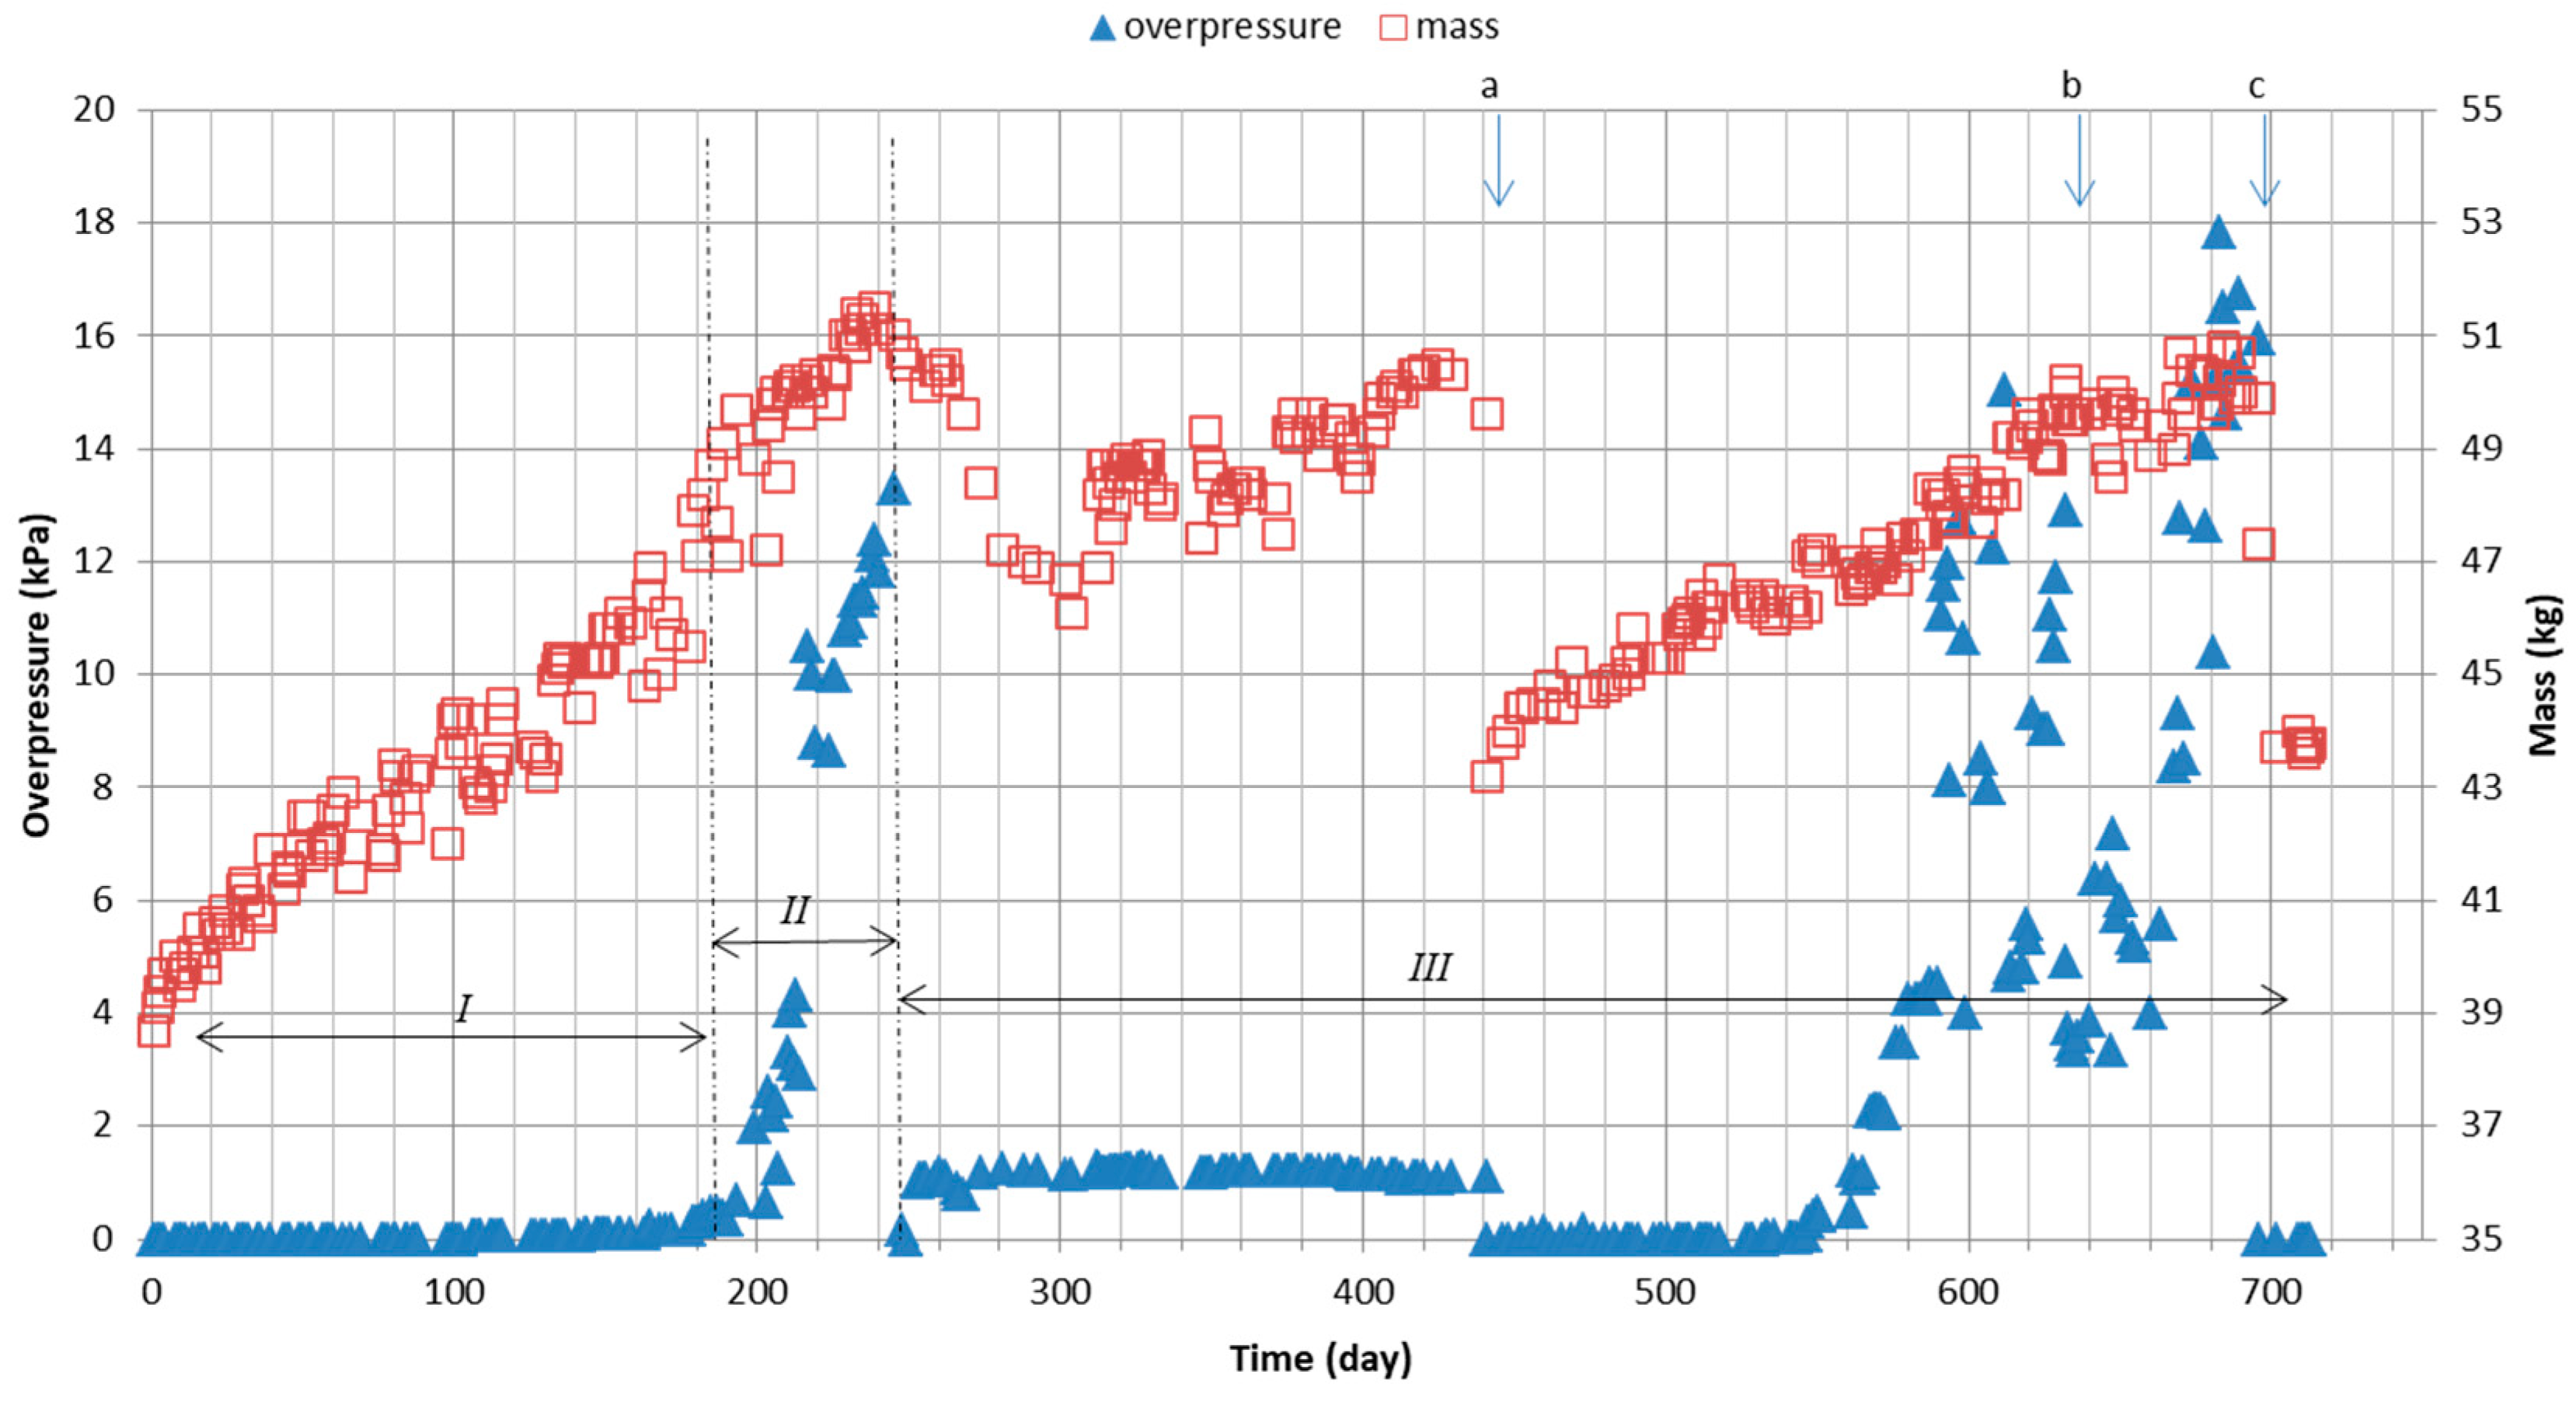
  • Biofiltration of air on the trickle-bed reactor filled with expanded clay is accompanied by an intensive growth in biomass, resulting in a rise of the bed’s initial mass by up to 46% and rapid increases in flow resistance, leading to a practical blockage of the gas flow through the column.
  • The average values of the wet biomass yield coefficient ranged from about 0.33 to 1.82, and the daily indicators of wet biomass growth were in the range from about 0.6 to 1.8 kg/kgof the bed/day.
  • Biomass growth hindering the biofilter exploitation can be effectively limited by periodically flushing the bed in the column with the medium solution fed in the opposite direction to gas flow or by the washing of the packing material after its removal from the column. The second procedure allows restoring the resistance of gas flow through the column to a value close to the initial worth.
  • To ensure the availability of biogenic elements in the bed and to maintain its humidity, it is sufficient to rinse it with a standard mineral nutrient medium, at a low sprinkling intensity of up to 2.5 dm3/h/m3 of the bed, and 0.1 dm3/h/m3 of the purified air.

Author Contributions

Conceptualization, A.W.; methodology, A.W.; formal analysis, A.T. and A.W.; investigation, A.T. and A.W.; writing—original draft preparation, A.T. and A.W.; writing—review and editing, A.W.; visualization, A.T. and A.W.; supervision, A.W. All authors have read and agreed to the published version of the manuscript.

Funding

The research was funded by the implementation of a project supporting the development of young scientists and PhD students BMN 517-10-021-6535/17.

Conflicts of Interest

The authors declare no conflict of interest. The funders had no role in the design of the study; in the collection, analyses, or interpretation of data; in the writing of the manuscript, or in the decision to publish the results.

References

  1. European Commission. Reference Document on Best Available Techniques in the Large Volume Organic Chemical Industry, Integrated Pollution Prevention and Control (IPPC). 2003. Available online: https://www.google.com/url?sa=t&rct=j&q=&esrc=s&source=web&cd=&ved=2ahUKEwilsPnsopXqAhVPzqYKHQMSA-wQFjARegQIChAB&url=https%3A%2F%2Feippcb.jrc.ec.europa.eu%2Fsites%2Fdefault%2Ffiles%2F2020-03%2Fsuperseded_lvoC_bref_0203.pdf&usg=AOvVaw0n7xHhrK3QTFq4FJicdqYm (accessed on 26 June 2020).
  2. Nagel, H.; Frey, R.; Hartgerink, C.; Rikeit, H.E.; Greiner, R.D.; Klein, C.; Boesl, U. On-Line Analysis of Individual Aromatic Hydrocarbons in Automotive Exhaust:Dealkylation of the Aromatic Hydrocarbons in the Catalytic Converter. SAE Tech. Paper Ser. 1997, 412, 451–457. [Google Scholar] [CrossRef]
  3. The European Chemicals Agency Xylene. Available online: https://echa.europa.eu/substance-information/-/substanceinfo/100.014.124 (accessed on 26 June 2020).
  4. United States Environmental Protection Agency. Available online: https://www.epa.gov/clean-air-act-overview/clean-air-act-text (accessed on 26 June 2020).
  5. Xi, J.; Kang, I.; Hu, H.; Zhang, X. A biofilter model for simultaneous simulation of toluene removal and bed pressure drop under varied inlet loadings. Front. Environ. Sci. Eng. 2014, 9, 554–562. [Google Scholar] [CrossRef]
  6. O’Toole, G.; Kaplan, H.B.; Kolter, R. Biofilm Formation as Microbial Development. Annu. Rev. Microbiol. 2000, 54, 49–79. [Google Scholar] [CrossRef]
  7. Zhang, J.; Li, L.; Liu, J. Temporal variation of microbial population in a thermophilic biofilter for SO2 removal. J. Environ. Sci. 2016, 39, 4–12. [Google Scholar] [CrossRef] [PubMed]
  8. Cheng, Z.; Lu, L.; Kennes, C.; Yu, J.; Chen, J. Treatment of gaseous toluene in three biofilters inoculated with fungi/bacteria: Microbial analysis, performance and starvation response. J. Hazard. Mater. 2016, 303, 83–93. [Google Scholar] [CrossRef] [PubMed]
  9. Yang, C.; Chen, H.; Zeng, G.; Yu, G.; Luo, S. Biomass accumulation and control strategies in gas biofiltration. Biotechnol. Adv. 2010, 28, 531–540. [Google Scholar] [CrossRef] [PubMed]
  10. Moussavi, G.; Mohseni, M. Using UV pretreatment to enhance biofiltration of mixtures of aromatic VOCs. J. Hazard. Mater. 2007, 144, 59–66. [Google Scholar] [CrossRef]
  11. Wang, C.; Kong, X.; Zhang, X.Y. Mesophilic and thermophilic biofiltration of gaseous toluene in a long-term operation: Performance evaluation, biomass accumulation, mass balance analysis and isolation identification. J. Hazard. Mater. 2012, 229, 94–99. [Google Scholar] [CrossRef]
  12. Saingam, P.; Xi, J.; Xu, Y.; Hu, H.Y. Investigation of the characteristics of biofilms grown in gas-phase biofilters with and without ozone injection by CLSM technique. Appl. Microbiol. Biotechnol. 2015, 100, 2023–2031. [Google Scholar] [CrossRef]
  13. Kim, D.; Sorial, G.A. Role of biological activity and biomass distribution in air biofilter performance. Chemosphere 2007, 66, 1758–1764. [Google Scholar] [CrossRef]
  14. Kennes, C.; Veiga, M.C. Inert filter media for the biofiltration of waste gases—Characteristics and biomass control. Rev. Environ. Sci. Bio/Technol. 2002, 1, 201–214. [Google Scholar] [CrossRef] [Green Version]
  15. Morales, M.; Hernández, S.; Cornabé, T.; Revah, S.; Auria, R. Effect of Drying on Biofilter Performance: Modeling and Experimental Approach. Environ. Sci. Technol. 2003, 37, 985–992. [Google Scholar] [CrossRef] [PubMed]
  16. Rene, E.R.; Montes, M.; Veiga, M.C.; Kennes, C. Styrene removal from polluted air in one and two-liquid phase biotrickling filter: Steady and transient-state performance and pressure drop control. Bioresour. Technol. 2011, 102, 6791–6800. [Google Scholar] [CrossRef] [PubMed] [Green Version]
  17. Chen, X.; Liang, Z.; Ao, T.; Li, G. Comparative elimination of dimethyl disulfide by maifanite and ceramic-packed biotrickling filters and their response to microbial community. Bioresour. Technol. 2016, 202, 76–83. [Google Scholar] [CrossRef] [PubMed]
  18. Estrada, J.M.; Quijano, G.; Lebrero, R.; Munoz, R. Step-feed biofiltration: A low cost alternative configuration for off-gas treatment. Water Res. 2013, 47, 4312–4321. [Google Scholar] [CrossRef]
  19. Flores-Valle, S.O.; Rios-Bernÿ, O.; Chanona-Perez, J.; Fregoso-Aguilar, T.; Morales-Gonzalez, J.A.; Prado-Rubianes, O.J.; Herrera-Bucio, R.; Lopez-Albarran, P.; Morales-Gonzalez, A.; Garibay-Febles, V.; et al. A Comparative Study of Physical and Chemical Processes for Removal of Biomass in Biofilters. Molecules 2011, 16, 6927–6949. [Google Scholar] [CrossRef] [Green Version]
  20. Prado, Ó.J.; Mendoza, J.A.; Veiga, M.C.; Kennes, C.O. Optimization of nutrient supply in a downflow gas-phase biofilter packed with an inert carrier. Appl. Microbiol. Biotechnol. 2002, 59, 567–573. [Google Scholar] [CrossRef] [Green Version]
  21. Trejo-Aguilar, G.; Revah, S.; Lobo-Oehmichen, R. Hydrodynamic characterization of a trickle bed air biofilter. Chem. Eng. J. 2005, 113, 145–152. [Google Scholar] [CrossRef]
  22. Weber, F.J.; Hartmans, S. Prevention of clogging in a biological trickle-bed reactor removing toluene from contaminated air. Biotechnol. Bioeng. 1996, 50, 91–97. [Google Scholar] [CrossRef]
  23. Yang, H.; Minuth, B.; Allen, D.G. Effects of nitrogen and oxygen on biofilter performance. J. Air Waste Manag. Assoc. 2002, 52, 279–286. [Google Scholar] [CrossRef] [Green Version]
  24. Morales, M.; Revah, S.; Auria, R. Start-up and the effect of gaseous ammonia additions on a biofilter for the elimination of toluene vapors. Biotechnol. Bioeng. 1998, 60, 483–491. [Google Scholar] [CrossRef]
  25. Delhoménie, M.-C.; Bibeau, L.; Roy, S.; Brzezinski, R.; Heitz, M. Influence of nitrogen on the degradation of toluene in a compost-based biofilter. J. Chem. Technol. Biotechnol. 2001, 76, 997–1006. [Google Scholar] [CrossRef]
  26. Acuña, M.E.; Villanueva, C.; Cárdenas, B.; Christen, P.; Revah, S. The effect of nutrient concentration on biofilm formation on peat and gas phase toluene biodegradation under biofiltration conditions. Process. Biochem. 2002, 38, 7–13. [Google Scholar] [CrossRef]
  27. Song, J.H.; Kinney, K.A. Effect of vapor-phase bioreactor operation on biomass accumulation, distribution, and activity: Linking biofilm properties to bioreactor performance. Biotechnol. Bioeng. 2000, 68, 508–516. [Google Scholar] [CrossRef]
  28. Wright, W.F.; Schroeder, E.D.; Chang, D.P.Y. Transient Response of Flow-Direction-Switching Vapor-Phase Biofilters. J. Environ. Eng. 2005, 131, 999–1009. [Google Scholar] [CrossRef] [Green Version]
  29. Mendoza, J.; Veiga, M.C.; Kennes, C. Biofiltration of waste gases in a reactor with a split-feed. J. Chem. Technol. Biotechnol. 2003, 78, 703–708. [Google Scholar] [CrossRef]
  30. Sempere, F.; Gabaldón, C.; Martínez-Soria, V.; Marzal, P.; Penya-Roja, J.M.; Álvarez-Hornos, F.J. Performance evaluation of a biotrickling filter treating a mixture of oxygenated VOCs during intermittent loading. Chemosphere 2008, 73, 1533–1539. [Google Scholar] [CrossRef]
  31. Atoche, J.C.; Moe, W.M. Treatment of MEK and toluene mixtures in biofilters: Effect of operating strategy an performance during transient loading. Biotechnol. Bioeng. 2004, 86, 468–481. [Google Scholar] [CrossRef]
  32. Xi, J.; Saingam, P.; Gu, F.; Hu, H.Y.; Zhao, X. Effect of continuous ozone injection on performance and biomass accumulation of biofilters treating gaseous toluene. Appl. Microbiol. Biotechnol. 2014, 99, 33–42. [Google Scholar] [CrossRef]
  33. Wang, L.; Yang, C.; Cheng, Y.; Huang, J.; Yang, H.; Zeng, G.; Lu, L.; He, S. Enhanced removal of ethylbenzene from gas streams in biotrickling filters by Tween-20 and Zn(II). J. Environ. Sci. 2014, 26, 2500–2507. [Google Scholar] [CrossRef]
  34. Kasperczyk, D.; Bartelmus, G.; Gąszczak, A. Removal of styrene from dilute gaseous waste streams using a trickle-bed bioreactor: Kinetics, mass transfer and modeling of biodegradation process. J. Chem. Technol. Biotechnol. 2012, 87, 758–763. [Google Scholar] [CrossRef]
  35. Hwang, J.W.; Choi, C.Y.; Park, S.; Lee, E.Y. Biodegradation of gaseous styrene by Brevibacillus sp. using a novel agitating biotrickling filter. Biotechnol. Lett. 2008, 30, 1207–1212. [Google Scholar] [CrossRef] [PubMed]
  36. Mendoza, J.; Prado, Ó.J.; Veiga, M.C.; Kennes, C. Hydrodynamic behaviour and comparison of technologies for the removal of excess biomass in gas-phase biofilters. Water Res. 2004, 38, 404–413. [Google Scholar] [CrossRef] [PubMed]
  37. Roshani, B.; Torkian, A.; Aslani, H.; Dehghanzadeh, R.; Aslani, H. Bed mixing and leachate recycling strategies to overcome pressure drop buildup in the biofiltration of hydrogen sulfide. Bioresour. Technol. 2012, 109, 26–30. [Google Scholar] [CrossRef] [PubMed]
  38. Zápotocký, L.; Halecký, M.; Vaněk, T.; Páca, J.; Kozliak, E.; Jones, K.D.; Soccol, C.R. Biofiltration of a styrene/acetone vapor mixture in two reactor types under conditions of styrene overloading. Braz. Arch. Boil. Technol. 2014, 57, 782–788. [Google Scholar] [CrossRef] [Green Version]
  39. Alonso, C.; Suidan, M.T.; Sorial, G.A.; Smith, F.L.; Biswas, P.; Smith, P.J.; Brenner, R.C. Gas treatment in trickle-bed biofilters: Biomass, how much is enough? Biotechnol. Bioeng. 1997, 54, 583–594. [Google Scholar] [CrossRef]
  40. Kim, D.; Cai, Z.; Sorial, G.A. Behavior of trickle-bed air biofilter for toluene removal: Effect of non-use periods. Environ. Prog. 2005, 24, 155–161. [Google Scholar] [CrossRef]
  41. Han, M.-F.; Wang, C.; Liu, H. Comparison of physical technologies for biomass control in biofilters treating gaseous toluene. J. Air Waste Manag. Assoc. 2018, 68, 1–8. [Google Scholar] [CrossRef]
  42. Smith, F.L.; Sorial, G.A.; Suidan, M.T.; Breen, A.W.; Biswas, P.; Brenner, R.C. Development of Two Biomass Control Strategies for Extended, Stable Operation of Highly Efficient Biofilters with High Toluene Loadings. Environ. Sci. Technol. 1996, 30, 1744–1751. [Google Scholar] [CrossRef]
  43. Wieczorek, A. Pilot-scale biofiltration of waste gases containing aliphatic and aromatic hydrocarbons, phenol, cresols, and other volatile organic compounds. Environ. Prog. 2005, 24, 60–66. [Google Scholar] [CrossRef] [Green Version]
  44. Kojima, Y.; Itada, N.; Hayaishi, O. Metapyrocatechase: A New Catechol-cleaving Enzyme. J. Biol.Chem. 1961, 236, 2223–2228. [Google Scholar] [PubMed]
  45. Chan, W.C.; Lai, T.Y. Interaction of compounds on biodegradation of ketone mixtures in a biofilter. J. Chem. Technol. Biotechnol. 2010, 85, 416–422. [Google Scholar] [CrossRef]
  46. Amin, M.M.; Rahimi, A.; Bina, B.; Heidari, M.; Moghadam, F.M. Performance evaluation of a scoria-compost biofilter treating xylene vapors. J. Environ. Heal. Sci. Eng. 2014, 12, 1–10. [Google Scholar] [CrossRef] [PubMed] [Green Version]
  47. Jorio, H.; Bibeau, L.; Viel, G.; Heitz, M. Effects of gas flow rate and inlet concentration on xylene vapors biofiltration performance. Chem. Eng. J. 2000, 76, 209–221. [Google Scholar] [CrossRef]
  48. Mirpuri, R.; Jones, W.; Bryers, J.D. Toluene degradation kinetics for planktonic and biofilm-grown cells of Pseudomonas putida 54G. Biotechnol. Bioeng. 1997, 53, 535–546. [Google Scholar] [CrossRef]
  49. Znad, H.; Katoh, K.; Kawase, Y. High loading toluene treatment in a compost based biofilter using up-flow and down-flow swing operation. J. Hazard. Mater. 2007, 141, 745–752. [Google Scholar] [CrossRef] [PubMed]
  50. Spigno, G.; Pagella, C.; Fumi, M.D.; Molteni, R.; De Faveri, D.M. VOCs removal from waste gases: Gas-phase bioreactor for the abatement of hexane by Aspergillus niger. Chem. Eng. Sci. 2003, 58, 739–746. [Google Scholar] [CrossRef]
  51. Kennes, C.; Veiga, M.C. Fungal biocatalysts in the biofiltration of VOC-polluted air. J. Biotechnol. 2004, 113, 305–319. [Google Scholar] [CrossRef] [Green Version]
  52. Islam, M.R.; Tudryn, G.; Bucinell, R.; Schadler, L.S.; Picu, C. Morphology and mechanics of fungal mycelium. Sci. Rep. 2017, 7, 1–12. [Google Scholar] [CrossRef] [Green Version]
  53. Tarao, M.; Seto, M. Estimation of the Yield Coefficient ofPseudomonas sp. Strain DP-4 with a Low Substrate (2,4-Dichlorophenol [DCP]) Concentration in a Mineral Medium from Which Uncharacterized Organic Compounds Were Eliminated by a Non-DCP-Degrading Organism. Appl. Environ. Microbiol. 2000, 66, 566–570. [Google Scholar] [CrossRef] [Green Version]
  54. Sarma, A.K.; Singh, V.P.; Bhattacharjya, R.K.; Kartha, S.A. Urban Ecology, Water Quality and Climate Change, 1st ed.; Springer International Publishing: New York, NY, USA, 2018. [Google Scholar]
  55. Wang, J.H.; Liao, J.C. Kinetics and Dynamics of o-Xylene Biodegradation with Pseudomonus putida (ATCC 11172). In Proceedings of the 16th Conference of Biochemical Engineering in Taiwan, Taipei, Taiwan, June 2011; Available online: https://www.researchgate.net/publication/328302631_Kinetics_and_Dynamics_of_o-Xylene_Biodegradation_with_Pseudomonus_putida_ATCC_11172 (accessed on 26 June 2020).
Figure 1. Schematic diagram of the experimental installation. 1—cylinder with a model pollutant, 2—mass-flow controller, 3—micro-metering pump, 4—moisturizing tower, 5—water reservoir for humidifying filtered gases, 6—rotameter of circulating water, 7—biofiltration column, K1 and K2—sampling port, 8—weight.
Sustainability 12 05412 g001
Figure 2. Changes in the inlet concentration of the biofiltration column and biofiltration efficiency. ↔I,III—dosing of nutrient solution (water over vacation break) 8 × 3 min./day, ↔II—dosing of nutrient solution 8 × 6 min./day, a, c—mixing and rinsing the column bed, b—backwashing the column bed.
Sustainability 12 05412 g002
Figure 3. Changes in hydraulic resistance at the biofiltration column and its mass. ↔I,III—dosing of nutrient solution (water over vacation break) 8 × 3 min./day, ↔II—dosing of nutrient solution 8 × 6 min./day, a, c—the date of mixing and rinsing the column bed, b—the date of backwashing the column bed.
Sustainability 12 05412 g003
Table 1. Column operating parameters.
Measurement Day Gas Flow Rate, dm3/minXylene Inlet Concentration Set, mg/m3Average Xylene Inlet ConcentrationColumn Mass, kg (on the First Day of the Period)Sprinkling Intensity per Cycle, cm3Sprinkling Intensity per Day, cm3Description of Activities on the First Day of the Period/during the Period
1–292870057538.7120960Start of column work
30–8450048741.2Change in inlet concentration
85–1121000102142.3Change in inlet concentration
113–14630027543.3Change in inlet concentration
147–1811500140745.2Change in inlet concentration
182–21348.22401920Change of nutrient dosing time
214–2391000113349.6Change in inlet concentration
240–24451.1120 *960 *Change of nutrient dosing time
245–3132.80051Holiday break: no nutrient, only water
314–347281500158848.7Normal operation after the holiday period
348–49565067248.7Change in inlet concentration
4412865067249.6120960Flushing and mixing of the bed
43.2After flushing and mixing of the bed
496–5861470074845.3120960Change of airflow
587–6884247.1Change of airflow
6322870074850.2120960Backwashing without fluidization
49.5After backwashing
689–7122870074850.7120960Change of airflow
6962870074847.3120960Flushing and mixing of the bed
43.7After flushing and mixing of the bed
7132870074843.8120960End of column work
* During the holiday break only water was used.

