Exploring Public Opinion on Personal Mobility Vehicle Use: A Case Study in Palermo, Italy


1
Faculty of Engineering and Architecture, Kore University of Enna, Cittadella Universitaria, 94100 Enna, Italy
2
Department of Civil Engineering, Faculty of Engineering and Natural Sciences, Bursa Technical University, 16330 Bursa, Turkey
*
Author to whom correspondence should be addressed.
Sustainability 2020, 12(13), 5460; https://0-doi-org.brum.beds.ac.uk/10.3390/su12135460
Submission received: 4 June 2020
/
Revised: 29 June 2020
/
Accepted: 2 July 2020
/
Published: 7 July 2020
(This article belongs to the Special Issue Sustainable Urban Planning Techniques)
Abstract
:The Sustainable Urban Mobility Planning (SUMP) process deals with barriers to improve accessibility and quality of life in urban mobility. Public opinion is highly essential for this process because it presents the real needs of road users. This paper illustrates the influence of public opinion on using Private Mobility Vehicle (PMV) in urban. A survey was carried out with 400 participants in Palermo, Italy. The results suggested that there was heterogeneity in gender and age groups in subcategories which represented people who use, do not use, and completely reject, using PMVs in urban. In addition, it was explored that there was a statistically significant relationship at 95% confidence level between sociodemographic characteristics (gender and age groups) and public opinion on PMV using. Employment status was found as an important parameter in transport planning. It was also showed that there was an inconsistency between local and national results. The results suggested that sociodemographic characteristics and public opinion should be investigated in further studies. In addition, a participatory planning process should be carried out to monitor for reliable evaluation in urban transport planning.
1. Introduction
The number of private cars has reached to 268 million in the EU countries by 2018 [1]. The estimated private car ownership in 2035 will rise to 1.8 billion [2], because the predicted number of residents in future urban will be approximately 70% of the world population by 2050 [3]. The predictions based on the current trends show that private car ownership will keep its dominance in urban traffic. Consequently, several issues (such as traffic congestion, CO2 emission, noise, occupied lands by roads and safety for passengers) will emerge [4,5,6,7,8]. A sustainable strategy in urban mobility can address these environmental, social, and economic issues to reduce their potential damages. In this context, several projects, i.e., CH4LLENGE (Addressing Key Challenges of Sustainable Urban Mobility Planning), CIVITAS (City-Vitality-Sustainability), SUMPs-Up, with the aim of establishing sustainable mobility plans in urban for providing guidelines to decision-makers [4].
A strategic document, namely, the Sustainable Urban Mobility Plan (SUMP), is introduced by the European Commission to meet the mobility needs of all road users and improve the quality of urban life [9,10]. Considering mobility needs for different road users is essential because equity plays a significant role in the design of a sustainable urban transport system. Equity-based planning eliminates segregation and marginalization in the planning process. [11]. The target of multi-annual mobility plans in SUMP guidelines addresses the urban transport issues in safety, health, social policy, economy, environment, and land use [12]; therefore, cities receive great benefits from these documents [9,13]. SUMP covers the entire urban area and integrates technical, infrastructure, political and soft measures to improve performance and cost-effectiveness in mobility. The SUMP editorial staff use aspects of participatory planning, vertical and horizontal integration, monitoring, evaluation, quality control mechanisms, and investigation with considering the parameters, shown in Figure 1.
Developing and applying the SUMP guidelines is difficult because the key element is to establish the balance between economic, social, and spatial areas [14] for an integrated urban mobility system which Ies all sustainable travel modes. SUMP aims to reduce trips, focus on land use policy, develop long term changes in model-split and give priority to sustainable travel modes, particularly micro-mobility, [12,15]. Therefore, a micro-mobility vehicle, also commonly known as a Personal Mobility Vehicle (PMV), can be considered as an important urban transport planning tool. PMVs (i.e., bicycles, scooters, hoverboards, segways, and single-wheels) have been becoming a key element for sustainable urban mobility policies and planning because of two major reasons: (i) Current motorized movements represent a large percentage of short-distance travel (less than 2 km), and often generate parking problem; (ii) Public Transport (PT) networks cannot meet with door-to-door journeys effectively [16]. From these considerations, PMV has become a cornerstone of SUMP. Cities have started promoting PMV use by investing in traffic moderation facilities, such as paths and parking spaces near PT hubs.
Despite the benefits of PMVs in the daily life of the community and their importance for SUMP, there are some barriers to adopt them into the urban mobility system. Changing urban mobility behavior is a major challenge [4]. For instance, road users assume that a PMV is an unsafe and uncomfortable mobility tool and the dominance of using private cars remains on not only medium-long-distance journeys, but also on short-distance movements. Moreover, there has been a shortage of charging stations and parking facilities, as well as proper maintenance of the infrastructure in many cities.
It was stated that the sociodemographic characteristics of road users were a remarkable barrier to increase the use of PMVs in urban [17]. Therefore, the motivations of road users who belong to different sociodemographic categories, particularly gender, should be taken into consideration. Aging causes a significant decline in older people’s capabilities [18]. Therefore, using PMV in urban might be a desire for many people; however, there are physical limitations to use it for older people. As a result, older PMV users may face safety issues related to their physical strength [19].
Former studies stated that there is a heterogeneity of gender in using PMV in urban [20,21]. It is stated that men were two times more likely to use PMVs in urban than women [20]. Although, women have recommended using e-scooters as a sustainable mobility mode, they found that PMVs have not met their daily transport needs. Women, who have been using PMVs, prefer this mobility tool for leisure activities, while most of men chose PMVs for trips between home and work. The similar trend was explored for using shared PMV services [21]. It was stated that unsatisfied comfort level and less safety on urban traffic had influenced the gender balance in usage rates [17]. Besides, one important factor behind the non-homogeneous distribution was the relationship between gender and social expectations, i.e., to manage activities (such as household chores, children’s schedules, shopping, and similar daily tasks) that were more difficult to be managed on a PMV [22]. There has been often more pressure on women to maintain a certain standard of appearance, particularly in professional environments, that could not be maintained by using a PMV. Regarding these statements, the importance of gender equity emerges remarkably while adopting a PMV.
Gender equity refers to different needs and choices of women and men. This suggests that there should be substantive equality which addresses the realities of women’s and men’s life [23]. For instance, women often face issues, such as sexual harassment or a lack of infrastructure that is adapted to their needs in Development Assistance Committee (DAC) countries. Therefore, the number of female drivers is growing approximately two times faster than that of male drivers, and sometimes the total number of female drivers exceeds the total number of male drivers [24]. With respect to these statements, implementing PMVs into a sustainable urban transport planning is not achievable unless the real needs of the marginalized population can be addressed [11].
Overall, PMV still has been a missing element in the SUMP process. Until two decades ago, this issue was ignorable. However, over the last decade, environmental, economic, and social problems (e.g., low air quality, urban congestion, increase in road deaths) have significantly emerged due to the exponential increase in the use of private cars. The concerns in the community about this unsustainable situation have arisen, and the problems were needed to be addressed. The need has brought an opportunity to introduce PMV utilization to society.
To address these issues, PMV sharing programs have been established for road users who hassle of purchasing because of high cost and parking issues in urban. App-based PMV sharing services offer new possibilities to expand and integrate micro-mobility with existing modes, particularly PT [25]. Integrated urban mobility (including PMVs) can reduce the occupation of private car use in traffic, increase PT use, reduce congestion, air pollution and CO2 emissions [26]. Different groups in society can adopt to shared PMV as their daily urban mobility tool. Shared electric PMVs have become more popular because they have been very practical in recent years with obviation areas having steep slopes for road users, particularly older people. For instance, Baltimore, USA, had the largest fleet of shared electric bicycle system [27]. Cities have been trying to subsidize the cost of shared PMVs for disadvantaged communities. Therefore, it should be noted that shared and/or private PMVs are an essential means of transport tools in the SUMP process. However, the importance of PMV in a SUMP process has been considered recently.
The purpose of the SUMP is improving accessibility to urban and peri-urban areas through implementing economic, environmentally friendly, and safe mobility systems. The spread of shared PMV services allows local authorities to develop agreements with service companies for lower rates and discounts for road users, and it reduces the use of private cars. Therefore, SUMP should incorporate all the possible solutions to implement PMVs into an integrated transport system considering short, medium, and long-range movements. Referring also to what has occurred because of the COVID-19 pandemic, it has been experienced that PMV has been a sustainable travel mode which reduced the social distancing in an extreme condition. Therefore, decision-makers should consider this means of transport on the roads in urban in further SUMP process.
Since 2017, the Italian cities with over 100 thousand inhabitants have needed to have urban planning tools that allow the implementation of sustainable mobility policies. These instruments were named as the Urban Plans for Sustainable Mobility (titled as PUMS in Italy). It has been a strategic plan with a 10-year medium-long horizon considering the objectives of environmental, social and economic sustainability. It was decided that the actions should focus on the effectiveness and efficiency of the mobility system, and its integration with urban and territorial structures and developments. It also should integrate future and existing urban planning tools, which would be updated based on the procedures of the law. It can be thought that this aim referred mainly to transport infrastructures (i.e., tramway, subway networks, stations, parking lots and exchange points).
Both SUMP and PUMS aim to improve the quality of urban life by introducing sustainable mobility; however, they have differences in the planning process. The traditional way of transport planning for finding a solution to urban mobility problems is limited i.e., it does not consider the real needs of road users who live in the city. However, the method in PUMS to reduce traffic congestion on urban streets is based on determining the mobility needs by public participation. Considering public participation in the planning process improves the quality of decisions and eliminates unexpected negative impacts [28,29,30,31]. When a large coalition of stakeholders participate in the decision-making process, the plan or policy leads to long-term benefits [28]. It can be clearly seen that public participation in land management and transport planning is an important parameter for evaluating society. Thus, the traditional way of urban mobility planning should be converted to a new approach with consideration of public participation on shared PMV systems. However, the state-of-the-art review has a remarkable gap regarding this need in the planning process. Therefore, the study in this paper presents an exemplification of methodology which aims to consider SUMP as a roadmap definition and explore the impact of public opinion on using PMVs in urban. The method is explained in Section 2 and is followed by the results in Section 3. Finally, the outcomes are discussed in Section 4.
2. Method
Urban participatory planning includes the whole community in the strategic and management processes. Participatory planning aims to harmonize the opinions among all participants, including marginalized groups, and prevents conflicts between opposing parties. The questionnaire is a strong propositional tool which can be used to evaluate how the social balance of entities, companies and associations are received. The questions should include legibility and communicative clarity, the values conveyed, the points of greatest interest and the type of relationship between the various subjects to obtain accurate feedback. Regarding these requirements, the survey data in this study were collected in three groups: sociodemographic characteristics; mobility attitude; and propensity on using PMV.
The diffusion of panel surveys stated that behavioral change could be measured directly at the level of the individual sample member, and therefore, it provided information that could not be obtained in a cross-sectional survey. They offered a rich source of information that could be used to gain a better understanding of the factors that influence and control personal travel manners. This information was important whenever the purpose of the travel survey was connected, for example, to the development of travel demand models and to predict future demand of mobility, encourage analysis in actions (e.g., fare elasticity, travel time), assess the impact of a change in transportation policy and a change in transport systems (e.g., travel behavior following the opening of an infrastructure). During the design of the survey, one of the main concerns was the so-called “questionnaire fatigue”, that was to say the impact of the length of the questionnaire on a topic that could probably be untoward, and therefore, give a negative impact to the interviewed road user.
The data for this study was gathered in two stages, i.e., local and national surveys. The national survey was carried out in 2019 with 800 random participants around Italy; and the local survey was conducted in January 2020 with 400 participants who have been living in the city of Palermo. Via Maqueda in Palermo, Italy was selected as the case study area because of data availability and the heterogeneity of inhabitants and road users with characteristics similar to other Italian metropolitan cities. The total population of the city was approximately 660,000, and 95% of the total sample were domiciled residents in Palermo. This information was useful because the continuous living activities in urban, such as traveling to work, school or leisure areas in the same place, have ensured that the participants have been active on the use of transport infrastructures and services. It was expected that this could avoid biased results.
The administration of paper and an online questionnaire was carried out that was characterized by three distinct sections, namely, socio-demographic characteristics, transport habits and propensity to use micro-mobility (private or shared). There were no fully open questions, and the respondents were encouraged to expand and/or refine the range of choices available. These range of choices matched with the more socially known examples that also have been highlighted in the review literature. The entire survey consisted of 13 questions which were divided into four groups:
- Dichotomous questions: Yes/No answers, Section A (A4)
- Multiple choice questions: Section A and B (A1, A2, A3, B1, B2, B3, B4)
- Likert scale questions with percentage (%): Section C (C1, C2, C3)
- Likert scale questions with five-point scale (rating from 1 to 5): Section D (D1, D2)
Likert scale on percentage, i.e., answers in Section C, offered the following answers—0%, 20%, 40%, 60%, 80%, and 100%. These ranges have been identified to enable a comparison between national and local data. Likert scale questions with rating in the knowledge offered the following answers: completely disagree, partially disagree, neither agree nor disagree, partially agree, and totally agree. The acquisition of data related to the PMV use has been made through surveys and the administration of paper questionnaires. Through this method, it was possible to collect not only sociodemographic data, but also the road users’ attitudes and encourage participatory planning action related to PMV use [32].
The data was collected for three subcategories: PMV users (G1), potential users of PMV (G2) and participants who reject using PMVs (G3). The motivation behind this selection was to keep the consistency between the local and national data since the national data were categorized in the same way. Hence, this subdivision made it possible to compare national and local data.
Grouping the participants was carried out to explore the real needs or habits in mobility considering characteristics of the subcategories. Group G1 consisted of owners and regular users of PMV. Group G2 included participants who did not have any or minimal experience in using PMV. Group G3 included participants who have had a short experience of using PMV and decided to remain reluctant to use because they preferred other forms of mobility, such as cycling or walking. The survey questions were asked to the participants in the three subcategories G1, G2, and G3; but the variable, namely, main reason for moving with own PMV, was collected for only G1 (Table 1).
The methodology was divided into three steps (Figure 2). The first step included using SUMP as a roadmap definition for determining the methodology, case study area selection and developing participatory planning approach. The second step covered mobility choice, sample selection and carrying out the survey. Finally, the third step included processing the original data and carrying out statistical analysis. As recommended in the state-of-the-art review [33,34], the statistical analysis started with descriptive statistics in order to explore the characteristics of the data. This was followed by Chi square test of independence to explore the relationship between the variables. The following section provides the results of the analysis.
3. Results
The analysis was conducted in three steps, as shown in Figure 3. In the first step, a descriptive statistics analysis was conducted for variables in section A, B, C, and D. The second step aimed to compare national and local data among variables in section D. Finally, Chi-square test of independence was applied to illustrate the dependency between the variables A1 and Section C. Following subsections provide the results for each step of the analysis.
3.1. Descriptive Statistics of Sociodemographic Characteristics and Transport Habits
Descriptive statistics analysis, including sociodemographic parameters (i.e., gender and age groups) and employment status of participants, was carried out to outline the socio-cultural characteristics of the participants. The results illustrated that there was a gender heterogeneity, particularly for participants who are used to use PMVs in daily life (Figure 4). The similar trend was observed for participants, who had limited or no experience in PMV using. The highest number of records in age group of participants who use PMVs was 28–45, and this was followed by the range 46–65. The similar trend was observed for subcategory G2, which suggested that adults aged between 28 and 65 were more likely to use PMVs or at least being a potential user. On the other hand, a fluctuating increase by higher age group was observed for participants who rejected using PMVs.
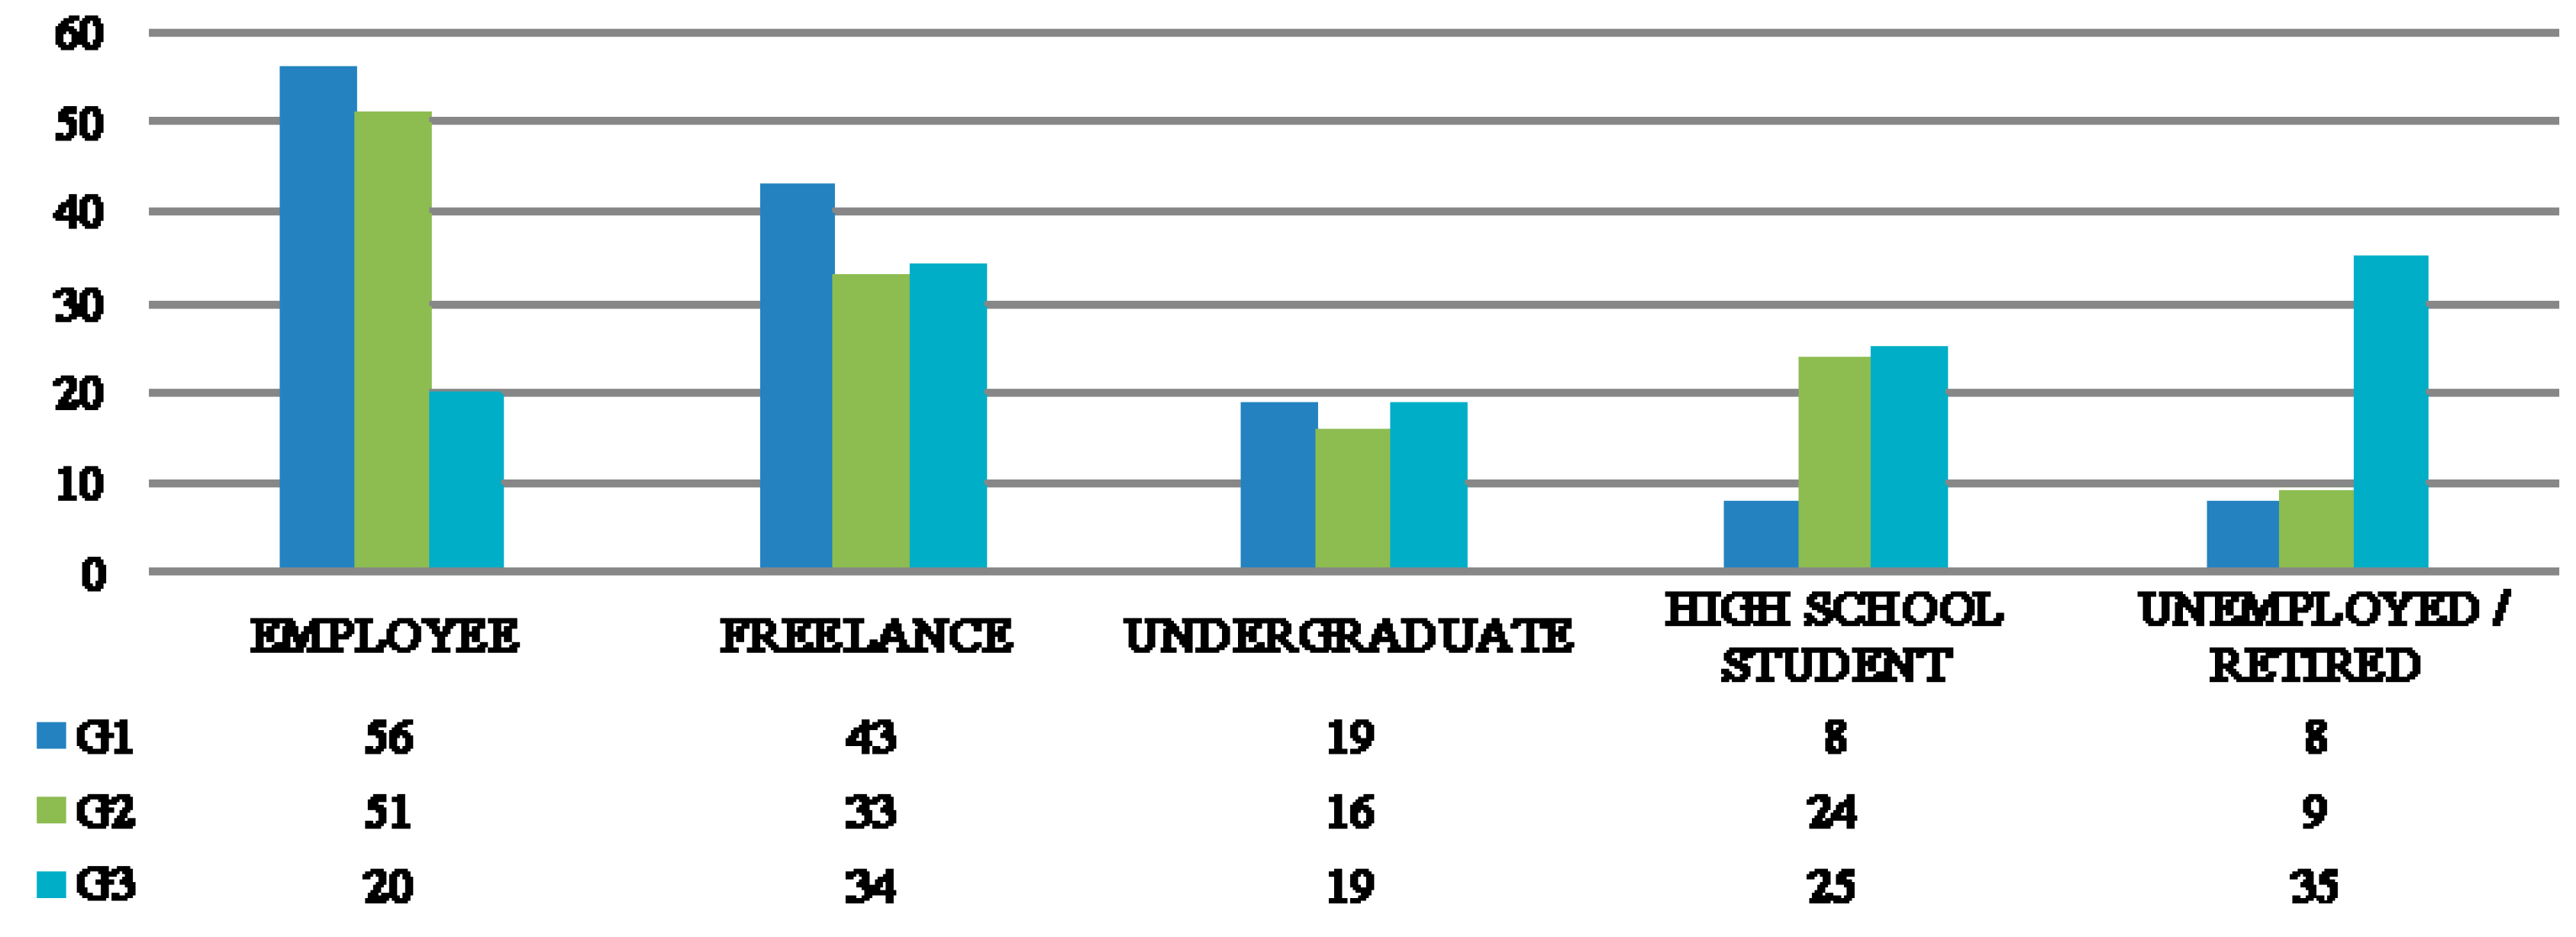
The employment status for adults, who have participated in the survey study, was divided into five groups, namely, Employee (i.e., people who employed in a full-time job), Freelance, students in Undergraduate and High School, and Unemployed/Retired (Figure 5). Majority of the participants, who have been using PMVs actively, were either employee or freelance. Having less or no experience of using PMVs were common between employees, freelances and high school students. Majority of the participants, who have rejected using PMVs, were unemployed or retired people; and this was followed by freelance.
The second stage of the descriptive statistics was carried out in order to explore each participant’s transport habits between Home and Work (H-W), Home and School (H-S) and Home and Leisure (H-L). The data also included variables, namely, Not using Car and Not using Public Transport (PT). In group G1, approximately 75% of users had a driving license, while around 13% did not have. Similarly, in group G2, 81% of participants had a driving license, while less than 10% did not have and the remaining people had a driving license for both car and moped with an engine capacity greater than 50cc. In subcategory G3, 37.5% of road users did not have a driving license and generally preferred walking and cycling for short-distance trips and avoided the use of motorized vehicles. Overall, the possession of a driving license for cars and/or mopeds was not uniformly widespread in the three subcategories. As given in Table 2, approximately 16% of the participants in both G2 and G3 did not use a private car because they either have not had a driving license or have preferred walking or cycling, particularly for short-distance travel (less than 1 km).
The variable (PMV) was collected only for subcategory G1, and the results showed that 65% of the PMV users preferred this transport mode for traveling between home and work. This was followed by home and leisure and home and school with 23% and 11%, respectively. Considering the characteristics of participants in G1, the results suggested that people who preferred to own a private car were more likely to use it for traveling between home and work. In subcategory G1, shared mobility was equally used for all types of daily travel. However, the trend for shared mobility in G1 was not similar to the results of subcategories G2 and G3. Participants, who did not have any or limited experience in PMV using, were more likely to use shared mobility vehicles for leisure activities. On the other hand, the participants, who had an experience of using PMV, but rejected it as a transport mode, preferred using shared mobility vehicles for trips between home and work. Regarding the results of PT, it should be noted that within groups G2 and G3, there were participants who were completely reluctant to use PT. 42% of participants in G2 and 23% in G3 have never used local public busses or rails.
The participants of the survey also expressed an opinion on a possible encouragement, that could be implemented by the local authorities, for an integrated urban transportation plan. This integrated plan including private cars, PT, and owned or shared PMV could be developed through actions such as facilitated service rates, maintenance of the road pavement, improved safety, and discounts on local taxes. The opinions were collected based on the Likert scale method, with values between 0 and 5. The results, shown in Table 3, suggested that participants in two subcategories (G1 and G2) have expressed a positive judgment from 3 to 5 for both owned and shared PMV use together with private car and PT utilization. However, participants, who experienced using PMV and decided to reject this travel mode, disagreed with the improvements provided by local authorities for combined transportation planning.
3.2. Comparative Analysis of Perception of Electric Scooters between Local and National Levels
The study in this paper continued with a comparative analysis to explore the relationship between local and national replies by participants on using electric scooters in urban. First, the participants’ judgments (i.e., from agreement to disagreement) on using electric scooters to reduce traffic congestion in populated cities were explored. Second, the perceptions of participants on electric scooters as an environmentally friendly means of transport were analyzed. Third, participants’ opinion on electric scooters as a quick and convenient system for urban travel was investigated. All of the obtained results from the investigated sample of the local subcategories (G1, G2, and G3), were compared with the outcomes of the national subcategories (NG1, NG2, and NG3).
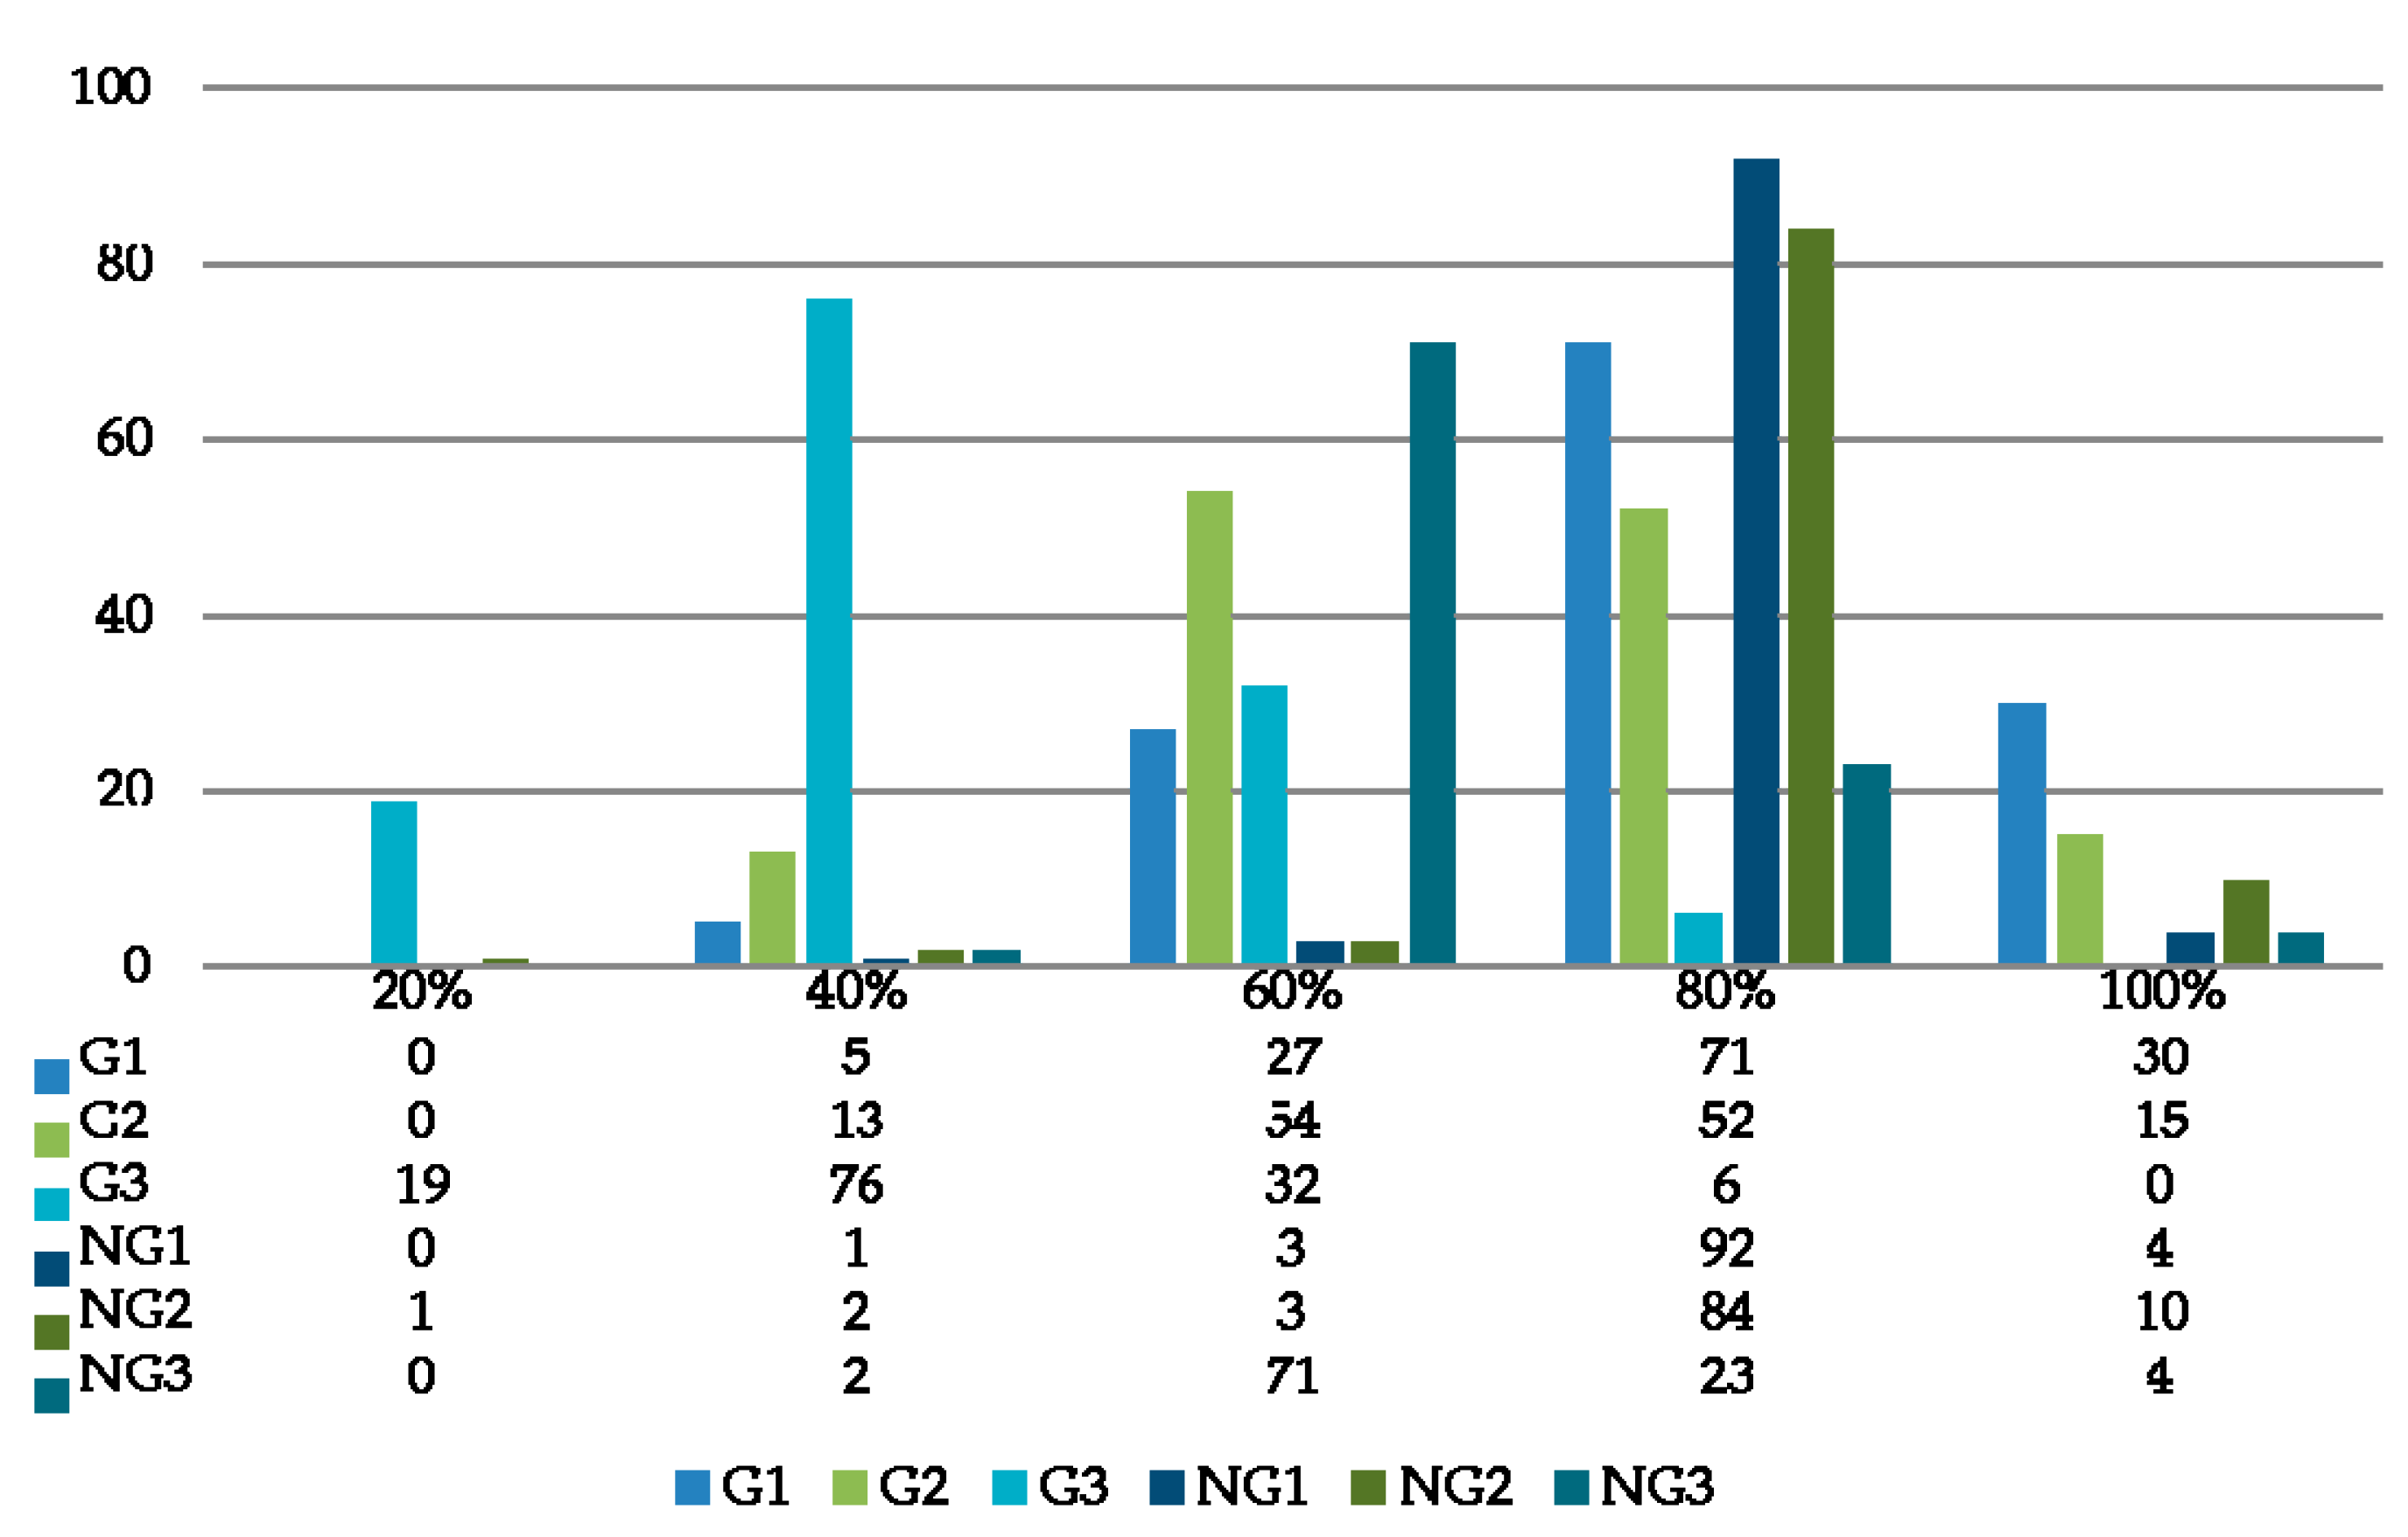
Regarding the first question, which aimed to figure out the perception of using electric scooter as a tool to reduce the traffic in urban, none of the subcategories had a complete disagreement, except G3 (Figure 6). 14% of the participants living in the city of Palermo and rejecting using any type of PMV stated that they did not believe the electric scooters could be a solution for urban traffic. At the national level, the majority of the group, who have rejected to use PMVs in urban, stated that their perception of electric scooter as a tool for urban traffic reduction was moderate with 60%. The active PMV users and the neutral participants were more likely to believe that electric scooters could reduce the congestion problem in populated cities with perception level ranged between 60 and 100% at local and approximately 80% at the national level.
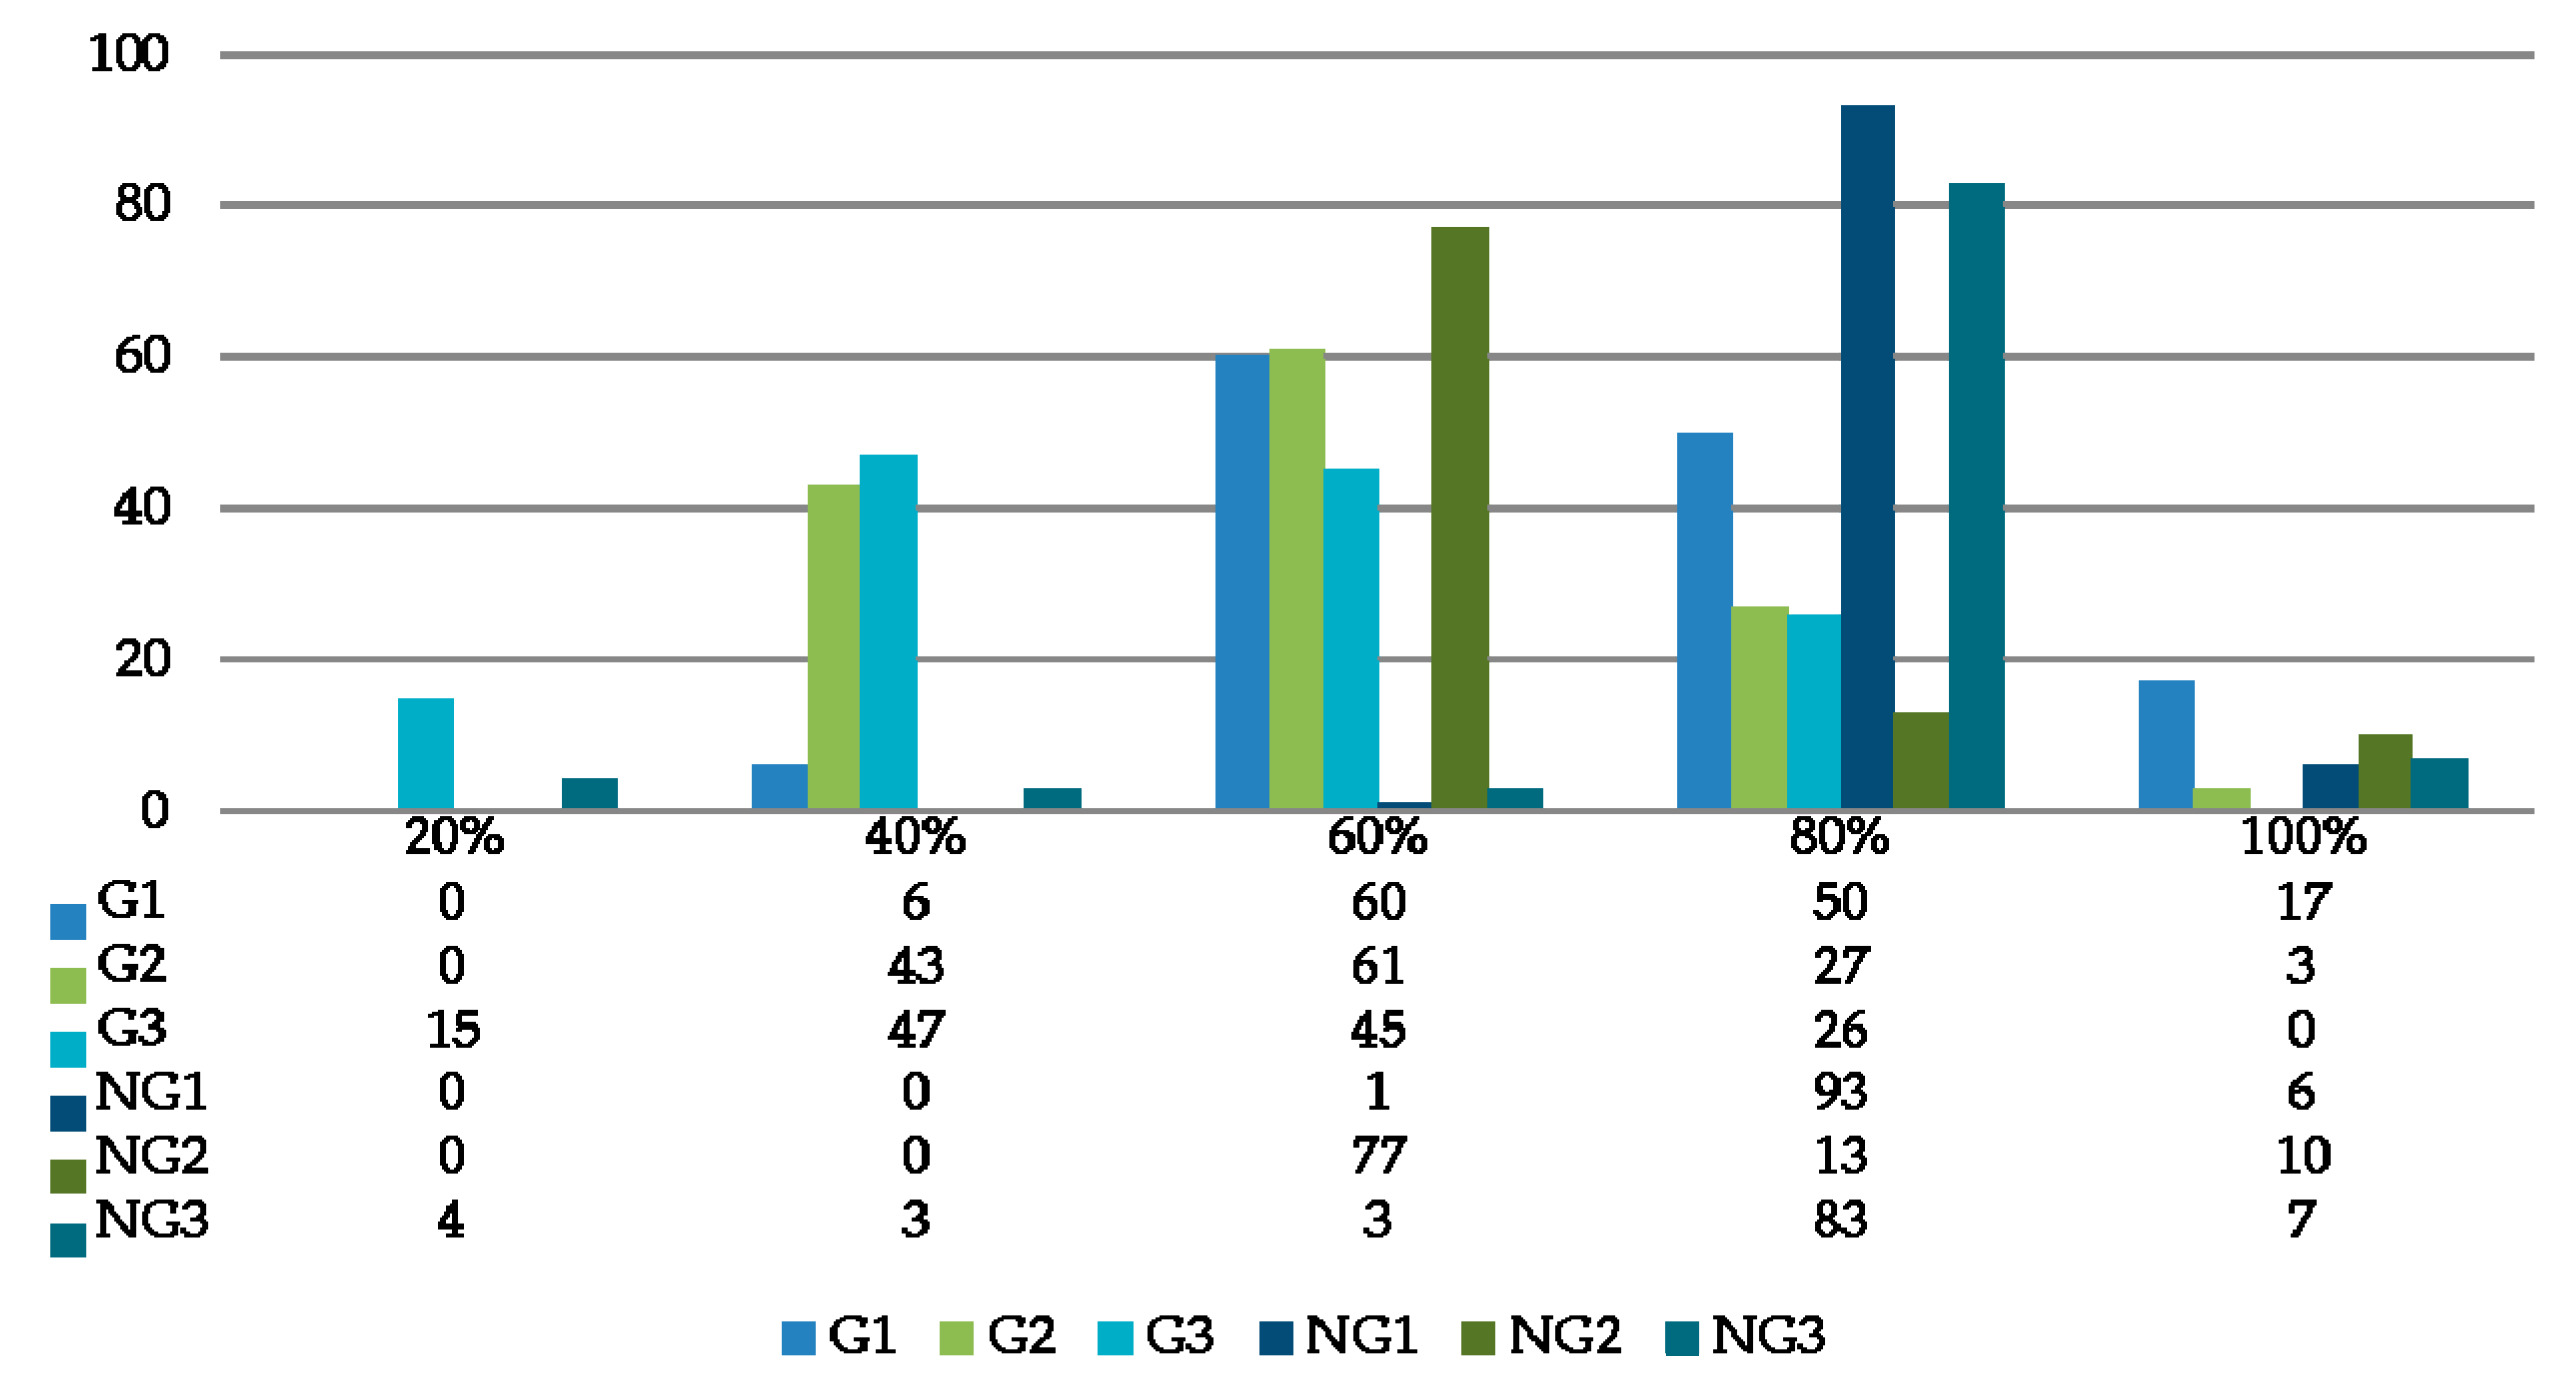
The results from the second question suggested that electric scooters could be considered highly as an environmentally friendly transport tool for the majority of the people at the national level (Figure 7). However, the amount of this consideration reduced for participants who were neutral to use or refused using PMVs on urban streets at the local level.
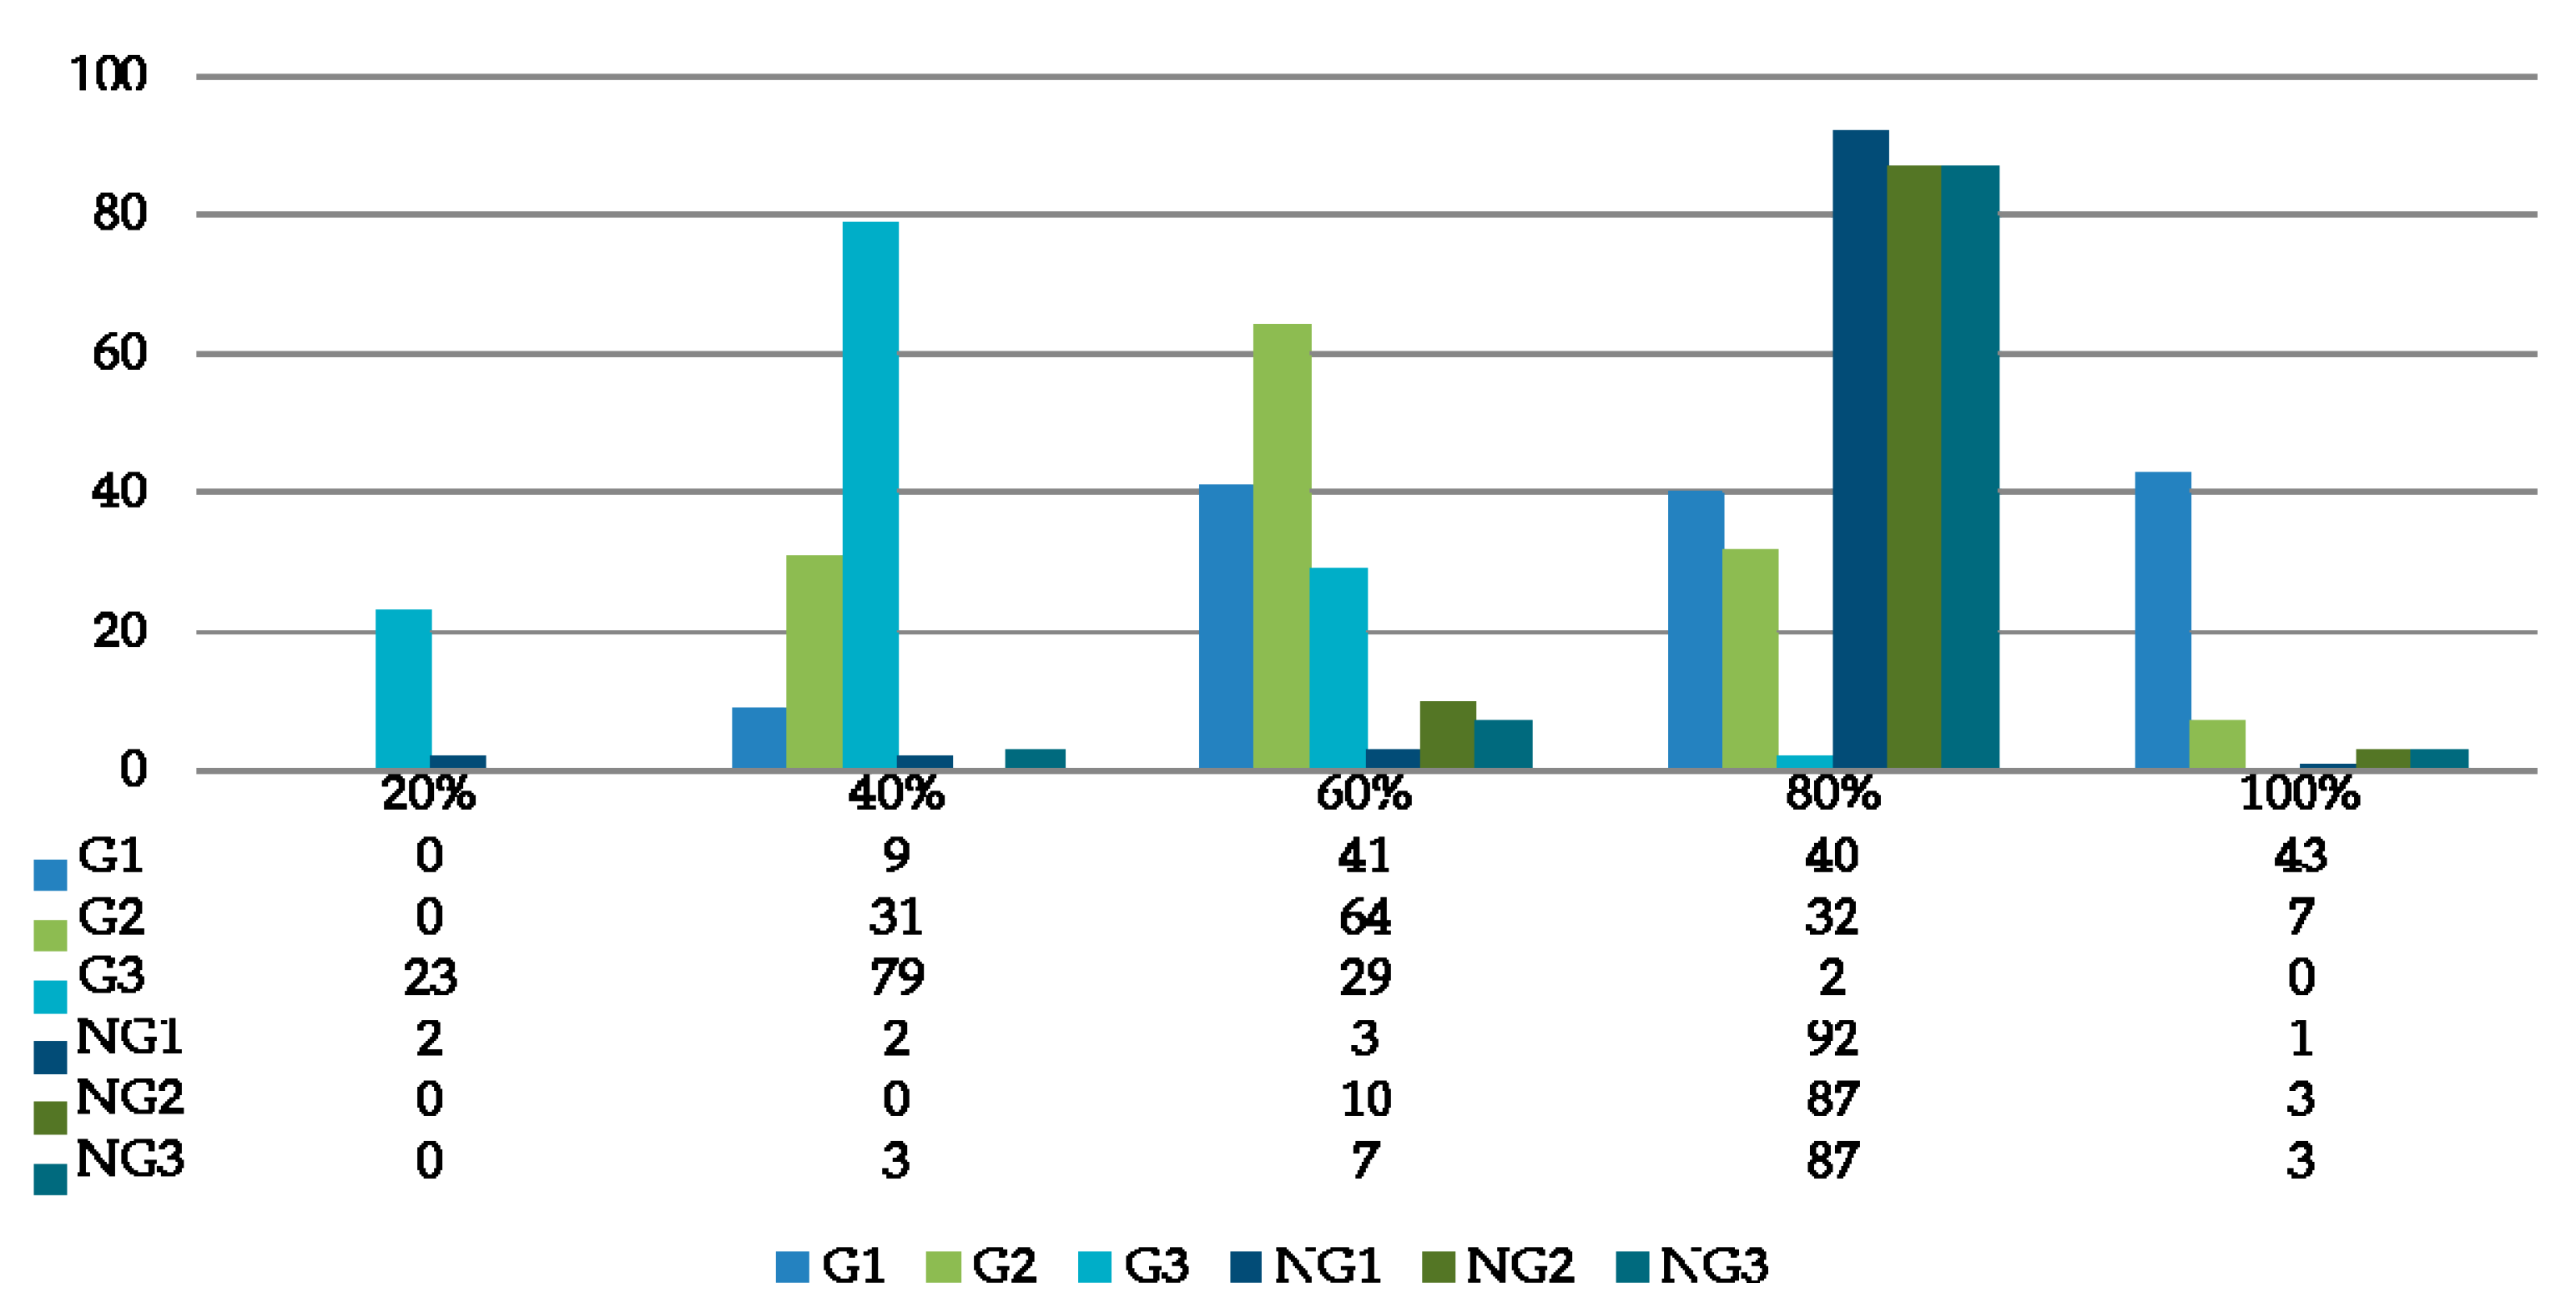
Finally, a third comparative descriptive statistics analysis between local and national level is performed to figure out the public perception of electric scooters as a quick and convenient means of transport in urban (Figure 8). A significantly higher number of participants in the national survey stated that electric scooter was found as a quick and convenient transport mode in urban with 80%. However, this result was not consistent with the local level. Majority of the participants, who have limited/no experience in using this mode, stated that electric scooter might be quick and convenient on the traffic with 60%. When NG1 and G1 were compared, local people who actively use PMVs were less likely to find the electric scooters as quick and convenient in urban. In addition, the amount of people who considered electric scooters as quick and convenient in urban transport was far less for the local participants who rejected using PMVs than national participants.
3.3. Chi-Square Test of Independence Between Sociodemographic Characteristics and Public Opinion on Electric Scooters
Regarding the gap in the state-of-the-art review [17,19], it was aimed to explore the relationship between sociodemographic characteristics (i.e., gender and age) and public opinion on electric scooters. Since these variables were categorical, chi-square (χ2) test of independence was applied. The chi-square test compared the observed frequencies to expected ones by chance in certain categories [35,36]. The greater the chi-square value, the greater the discrepancy between the observed and expected frequencies.
The equation of the Pearson’s chi-square is given as
where “O” is the observed and “E” is the expected value of the variable, and c is the degrees of freedom.
While presenting the results, the statistical significance level was chosen as 95% confidence. The chi-square test of independence, including gender and public opinion on electric scooters suggested that there was a statistically significant relationship between the variables among participants who have been using PMVs (Table 4). A statistically significant relationship between gender and C1 and C2 among participants, who had limited or no experience in PMV using, was observed. However, there was no statistically significant relationship between gender and opinion on electric scooters as a quick and convenient system in urban. The chi-square test results suggested that there was no relationship between gender and public opinion on electric scooters among participants who rejected using PMVs in urban.
The results showed that there was a statistically significant relationship between age group and public opinion on electric scooters among participants who had limited or no experience in PMV using (Table 4). Among the subcategory G1 (i.e., participants who actively use PMVs), a statistically significant relationship between age group and opinions on electric scooters as a tool to reduce urban traffic congestion as an environmentally friendly means of transport. Regarding the participants who rejected using PMVs, there was a statistically significant dependency between age group and public opinion on electric scooters for reducing the traffic congestion in urban. The following section presents the discussion based on the outcomes of the statistical analysis.
4. Discussion
The sample of road users, who are involved in a participatory research process, is often subordinate in their social context. This form of participation in decision-making for planning urban transport can generate greater awareness of the problems by trying to show them at various social levels and define some possible mitigation actions. It is important to consider different categories of people to understand their real motivations [17]. An evaluation of the correlation between sociodemographic parameters and possible solutions to be implemented in the mobility sector are fundamental, as demonstrated by the results of this study.
The results show that adults between age 28 and 65 can adopt using PMVs easily in urban traffic. However, people older than 65 often reject using PMVs. It shows that there is a strong connection between rejecting the use of technology in alternative mobility modes and higher age which is related to the state of health (e.g., posture or balance problems) which is consistent with the former studies [18,19]. Moreover, the results show that there is a statistically significant relationship between age group and public opinion on electric scooters as a tool to reduce the traffic in urban among participants in all subcategories. This shows that the awareness of the impact of PMV use on urban traffic depends on the age groups in society. This result was novel in the literature; therefore, it needed further investigation for a comparative discussion. Regarding the public opinion on electric scooters as an environmentally means of transport and quick and convenient system for urban travel, the age group has an impact on decisions of subcategories, except participants who reject using PMVs. Majority of the participants, who reject using PMVs, are unemployed or retired people. The rejection of using PMV among retired people is consistent with the results of higher age groups who hassle to use this means of transport because of safety and health concerns [19]. It should be stated that decision-makers should consider different age groups’ needs and opinions in the SUMP process.
The results state that there is a heterogeneity of gender in using PMV among participants that is consistent with the former studies [37,38,39]. Gender plays an important role in the preferences regarding PMV use. Several factors, including safety, comfort, and social expectations, make PMV a less convenient choice for urban transport for women as compared to men. Without due attention to difference, gender inequalities can be reproduced in the research process and its outcomes. The diversity can be better explored by building on what is presented in this work and by providing measures and strategies in the future to make gender equity possible. The study in this paper aims to highlight this inequality to eliminate the issue and consider to what extent can gender influence choices of transport modes.
The comparative analysis shows that there is an inconsistency between local and national data with respect to public opinion on electric scooters. This significant discrepancy might be originating from the difference in infrastructure levels in different regions. In addition, the transport needs or behaviors of local participants might be different from the national ones. Therefore, a generalized urban mobility approach may not meet the real needs of road users in different areas. This result is crucial for the SUMP process, and it needs a further investigation to figure out to what extent the public opinion has an influence on sustainable urban transport planning. Participatory planning allows people to articulate their opinions and express their knowledge through the description and analysis of their situation and problems. Different approaches to participatory research vary in purpose, level of participation and representation. The connection and balance of the various components depend not only on purpose, but also on the availability of time and resources.
In summary, participatory research and analysis can be used at different stages of the project cycle: Problem identification, assessment of local priorities, monitoring of progress, and evaluation. It can be used to inform policy design and to provide ‘reality checks’ to adjust existing policy frameworks. Participatory research brings out the views of local people—their reality, their challenges, and their understanding of problems and solutions. Their ideas may prove to be quite distinct from those in charge of formulating the policies that affect their lives. Participatory research can, therefore, produce surprising insights for policy and may challenge the assumptions on which policy frameworks are based. It may also reveal why certain local people do not adopt certain development interventions intended to help the poor. In addition to these, it is also essential to understand the social structure of local communities and the influence of non-governmental organizations on decision-makers.
Author Contributions
Conceptualization, T.C. and N.A.; methodology, T.C.; software, T.C.; validation, T.C., N.A. and D.T.; formal analysis, T.C.; investigation, N.A.; resources, G.T.; data curation, T.C.; writing—original draft preparation, T.C. and N.A.; writing—review and editing, N.A.; visualization, D.T. and N.A.; supervision, G.T.; project administration, T.C.; funding acquisition, T.C. All authors have read and agreed to the published version of the manuscript.
Funding
This research received no external funding.
Acknowledgement
This study was partially supported by the MIUR (Ministry of Education, Universities and Research [Italy]) through a project entitled WEAKI TRANSIT: WEAK-demand areas Innovative TRANsport Shared services for Italian Towns (Project code: 2017ARRHT /CUP Code: J74I19000320008), financed with the PRIN 2017 (Research Projects of National Relevance) programme. We authorize the MIUR to reproduce and distribute reprints for Governmental purposes, notwithstanding any copyright notations thereon. Any opinions, findings and conclusions or recommendations expressed in this material are those of the authors, and do not necessarily reflect the views of the MIUR.
Conflicts of Interest
The authors declare no conflict of interest.
References
- ACEA. Vehicles in Use—Europe 2019. The European Automobile Manufacturers’ Association. Available online: https://www.acea.be/uploads/publications/ACEA_Report_Vehicles_in_use-Europe_2019.pdf#page=4 (accessed on 27 June 2020).
- BP Energy Outlook 2015. Available online: https://www.bp.com/en/global/corporate/energy-economics/energy-outlook.html (accessed on 10 May 2020).
- Lerner, W. The Future of Urban Mobility: Towards Networked, Multimodal Cities of 2050. Available online: https://robertoigarza.files.wordpress.com/2009/07/rep-the-future-of-urban-mobility-2050-little-2011.pdf (accessed on 10 May 2020).
- Okraszewska, R.; Romanowska, A.; Wołek, M.; Oskarbski, J.; Birr, K.; Jamroz, K. Integration of a Multilevel Transport System Model into Sustainable Urban Mobility Planning. Sustainability 2018, 10, 479. [Google Scholar] [CrossRef] [Green Version]
- Van Wee, B.; Ettema, D. Travel behaviour and health: A conceptual model and research agenda. J. Transp. Health 2016, 3, 240–248. [Google Scholar] [CrossRef] [Green Version]
- Russo, F.; Comi, A. City Characteristics and Urban Goods Movements: A Way to Environmental Transportation System in a Sustainable City. Procedia Soc. Behav. Sci. 2012, 39, 61–73. [Google Scholar] [CrossRef]
- Taniguchi, E. Concepts of City Logistics for Sustainable and Liveable Cities. Procedia Soc. Behav. Sci. 2014, 151, 310–317. [Google Scholar] [CrossRef] [Green Version]
- Kijewska, K.; Iwan, S. Analysis of the Functioning of Urban Deliveries in the City Centre and its Environmental Impact Based on Szczecin Example. Transp. Res. Procedia 2016, 12, 739–749. [Google Scholar] [CrossRef] [Green Version]
- Cavalcanti, C.D.O.; Limont, M.; Dziedzic, M.; Fernandes, V. Sustainability of urban mobility projects in the Curitiba metropolitan region. Land Use Policy 2017, 60, 395–402. [Google Scholar] [CrossRef]
- Louro, A.; Da Costa, N.M.; Da Costa, E.M. Sustainable Urban Mobility Policies as a Path to Healthy Cities—The Case Study of LMA, Portugal. Sustainability 2019, 11, 2929. [Google Scholar] [CrossRef] [Green Version]
- Bhuyan, I.; Chavis, C.; Nickkar, A.; Barnes, P. GIS-Based Equity Gap Analysis: Case Study of Baltimore Bike Share Program. Urban Sci. 2019, 3, 42. [Google Scholar] [CrossRef] [Green Version]
- European Commission. Sustainable Urban Transport Plans. Preparatory Document in Relation to the Follow-Up of the Thematic Strategy on the Urban Environment, European Commission 2007. Available online: https://ec.europa.eu/transport/sites/transport/files/themes/urban/studies/doc/2007_sutainable_urba_transport_plan.pdf (accessed on 10 May 2020).
- Awasthi, A.; Omrani, H.; Gerber, P. Investigating ideal-solution based multicriteria decision making techniques for sustainability evaluation of urban mobility projects. Transp. Res. Part A Policy Pract. 2018, 116, 247–259. [Google Scholar] [CrossRef]
- Lopez-Carreiro, I.; Monzón, A. Evaluating sustainability and innovation of mobility patterns in Spanish cities. Analysis by size and urban typology. Sustain. Cities Soc. 2018, 38, 684–696. [Google Scholar] [CrossRef]
- Kiba-Janiak, M.; Kiba-Janiak, M. Sustainable Urban Mobility Plans: How Do They Work? Sustainability 2019, 11, 4605. [Google Scholar] [CrossRef] [Green Version]
- Kujala, R.; Weckström, C.; Mladenović, M.N.; Saramäki, J. Travel times and transfers in public transport: Comprehensive accessibility analysis based on Pareto-optimal journeys. Comput. Environ. Urban Syst. 2018, 67, 41–54. [Google Scholar] [CrossRef]
- Akgun, N.; Dissanayake, D.; Thorpe, N.; Bell, M. Cyclist casualty severity at roundabouts—To what extent do the geometric characteristics of roundabouts play a part? J. Saf. Res. 2018, 67, 83–91. [Google Scholar] [CrossRef]
- Geda, Y.E.; Roberts, R.O.; Knopman, D.S.; Christianson, T.J.H.; Pankratz, V.S.; Ivnik, R.J.; Boeve, B.F.; Tangalos, E.G.; Petersen, R.C.; Rocca, W.A. Physical Exercise, Aging, and Mild Cognitive Impairment. Arch. Neurol. 2010, 67, 80–86. [Google Scholar] [CrossRef] [Green Version]
- Johnson, M.; Rose, G.; Rose, G. Extending life on the bike: Electric bike use by older Australians. J. Transp. Health 2015, 2, 276–283. [Google Scholar] [CrossRef]
- Emond, C.R.; Tang, W.; Handy, S.L. Explaining Gender Difference in Bicycling Behavior. Transp. Res. Rec. J. Transp. Res. Board 2009, 2125, 16–25. [Google Scholar] [CrossRef]
- Nickkar, A.; Banerjee, S.; Chavis, C.; Bhuyan, I.; Barnes, P. A spatial-temporal gender and land use analysis of bikeshare ridership: The case study of Baltimore City. City Cult. Soc. 2019, 18, 100291. [Google Scholar] [CrossRef]
- Gauvin, L.; Tizzoni, M.; Piaggesi, S.; Young, A.; Adler, N.; Verhulst, S.; Ferres, L.; Cattuto, C. Gender gaps in urban mobility. Humanit. Soc. Sci. Commun. 2020, 7, 1–13. [Google Scholar] [CrossRef]
- WHO. Gender, Equity and Human Rights. World Health Organisation. Available online: https://www.who.int/gender-equity-rights/knowledge/glossary/en/ (accessed on 27 June 2020).
- Umaña-Barrios, N.; Gil, A.S. How Can Spatial Design Promote Inclusivity, Gender Equality and Overall Sustainability in Costa Rica’s Urban Mobility System? Procedia Eng. 2017, 198, 1018–1035. [Google Scholar] [CrossRef]
- Smith, G.; Sochor, J.; Karlsson, M. Mobility as a Service: Development scenarios and implications for public transport. Res. Transp. Econ. 2018, 69, 592–599. [Google Scholar] [CrossRef]
- Wu, Y.; Zhang, L. Can the development of electric vehicles reduce the emission of air pollutants and greenhouse gases in developing countries? Transp. Res. Part D Transp. Environ. 2017, 51, 129–145. [Google Scholar] [CrossRef]
- Barnes, P.J.; Grasso, S.; Chavis, C.; Bhutan, I.A.; Nickkar, A. Bicycle Justice or Just Bicycles? Analyzing Equity in Baltimore’s Bike Share Program. Department of Transportation and Urban Infrastructure at Morgan State University 2018. Available online: http://udspace.udel.edu/handle/19716/24132 (accessed on 30 September 2018).
- Fischer, F. Citizens, Experts, and the Environment; Duke University Press: Durham/London, UK, 2000. [Google Scholar]
- Newig, J. Does public participation in environmental decisions lead to improved environmental quality? Towards an analytical framework. Communication, Cooperation, Participation. Int. J. Sustain. Commun. 2007, 1, 51–71. Available online: https://nbn-resolving.org/urn:nbn:de:0168-ssoar-431965 (accessed on 1 May 2020).
- Koontz, T.M.; Thomas, C.W. What Do We Know and Need to Know about the Environmental Outcomes of Collaborative Management? Public Adm. Rev. 2006, 66, 111–121. [Google Scholar] [CrossRef]
- Richards, C.; Blackstock, K.L.; Carter, C.E. Practical Approaches to Participation SERG Policy Brief No. 1; Macaulay Land Use Institute: Aberdeen, UK, 2004. [Google Scholar]
- Ignaccolo, M.; Inturri, G.; Giuffrida, N.; Le Pira, M.; Torrisi, V. Public Engagement for Designing New Transport Services: Investigating Citizen Preferences from a Multiple Criteria Perspective. Transp. Res. Procedia 2019, 37, 91–98. [Google Scholar] [CrossRef]
- Clewlow, R.R. The Micro-Mobility Revolution: The Introduction and Adoption of Electric Scooters in the United States. Transportation Research Board 2019 No. 19-03991. Available online: https://trid.trb.org/view/1528426 (accessed on 10 April 2020).
- Campisi, T.; Torrisi, V.; Ignaccolo, M.; Inturri, G.; Tesoriere, G. University propensity assessment to car sharing services using mixed survey data: The Italian case study of Enna city. Transp. Res. Procedia 2020, 47, 433–440. [Google Scholar] [CrossRef]
- Child, S.; Luck, F.T.; Schofield, C.; Hopkins, L.; Nampijja, M.; Duff, S.; Taylor, J.; Otero, S.; Mannay, D.; Kefalidou, G.; et al. Reviews: Child Development, Culture and Psychological Development, Discovering Statistics Using SPSS (3rd ed.), Doing Qualitative Research in Psychology: A Practical Guide, Essential Psychology: A Concise Introduction, Movies and Mental Illness: Using Films to Understand Psychopathology (3rd ed.), Psychological Groupwork with Acute Psychiatric Patients, Psychology: The Science of Mind and Behaviour, Theories of Developmental Psychology, Your Psychology Project Handbook: Becoming a Researcher, Loftus Speaks. Psychol. Learn. Teach. 2011, 10, 57–75. [Google Scholar] [CrossRef] [Green Version]
- Sharpe, D. Chi-Square Test is Statistically Significant: Now What? Pract. Assess Res. Eval. 2015, 20, 8. [Google Scholar] [CrossRef]
- McKenzie, G. Shared micro-mobility patterns as measures of city similarity. In Proceedings of the 1st ACM SIGSPATIAL International Workshop on Computing with Multifaceted Movement Data—MOVE’19, Chicago, IL, USA, 5 November 2019. [Google Scholar]
- Jiao, J.; Bai, S. Understanding the Shared E-scooter Travels in Austin, TX. ISPRS Int. J. Geo-Inf. 2020, 9, 135. [Google Scholar] [CrossRef] [Green Version]
- Zagorskas, J.; Burinskienė, M. Challenges Caused by Increased Use of E-Powered Personal Mobility Vehicles in European Cities. Sustainability 2019, 12, 273. [Google Scholar] [CrossRef] [Green Version]
Figure 1.
The aspects of Sustainable Urban Mobility Planning (SUMP).

Figure 2.
The steps of the methodology.

Figure 3.
Illustration of analysis steps, including each variable section and subcategories.

Figure 4.
Descriptive statistics for sociodemographic characteristics in each subcategory (G1, G2, and G3): (a) Number of records for each gender; (b) number of records for each age group.
Figure 4.
Descriptive statistics for sociodemographic characteristics in each subcategory (G1, G2, and G3): (a) Number of records for each gender; (b) number of records for each age group.

Figure 5.
Descriptive statistics of employment for each subcategory (G1, G2, and G3).

Figure 6.
Descriptive statistics of question one at the national and local level.

Figure 7.
Descriptive statistics of question two at the national and local level.

Figure 8.
Descriptive statistics of question three at the national and local level.


Table 1.
Characteristics of the variables which was collected in the survey study.
| Section | Variables and Groups of Participants | Question Types | ||||
|---|---|---|---|---|---|---|
| Dichotomous | Multiple Choice | Likert Scale Percentage % | Likert Scale Rating (1–5) | |||
| A | 1 | Gender (G1-G2-G3) | ✓ | |||
| 2 | Age (G1-G2-G3) | ✓ | ||||
| 3 | Employment(G1-G2-G3) | ✓ | ||||
| 4 | Residence place (G1-G2-G3) | ✓ | ||||
| B | 1 | Car license ownership (G1-G2-G3) | ✓ | |||
| 2 | Main reason for moving with own PMV (G-1) | ✓ | ||||
| 3 | Main reason for moving with own private car (G1-G2-G3) | ✓ | ||||
| 4 | Main reason for moving with PT (G1-G2-G3) | ✓ | ||||
| C | 1 | Utility of PMV to reduce the traffic of big cities (G1-G2-G3) | ✓ | |||
| 2 | Electric scooter as an environmentally friendly means of transport (G1-G2-G3) | ✓ | ||||
| 3 | Electric scooter as a quick and convenient system for urban travel (G1-G2-G3) | ✓ | ||||
| D | 1 | Incentive policies to integrate private transport and PT with electric sharing micro-mobility (G1-G2-G3) | ✓ | ✓ | ||
| 2 | Incentive policies to integrate private transport and PT with own electric micro-mobility (G1-G2-G3) | ✓ | ✓ | |||
Table 2.
Descriptive statistics of transport habits for each subcategory (G1, G2, and G3).
| Subcategory | Transport Mode | H-W | H-S | H-L | Not Using Car | Not Using PT |
|---|---|---|---|---|---|---|
| G1 | PMV | 87 | 15 | 31 | 0 | 0 |
| Private car | 65 | 13 | 55 | 0 | 0 | |
| Shared mobility | 45 | 40 | 48 | 0 | 0 | |
| PT | 35 | 23 | 75 | 0 | 0 | |
| G2 | Private car | 74 | 13 | 28 | 19 | 0 |
| Shared mobility | 25 | 5 | 85 | 19 | 0 | |
| PT | 3 | 12 | 63 | 0 | 56 | |
| G3 | Private car | 85 | 1 | 22 | 25 | 0 |
| Shared mobility | 77 | 5 | 26 | 25 | 0 | |
| PT | 33 | 4 | 65 | 0 | 31 |
Table 3.
Road users’ opinion on a possible action for an integrated urban transport taken by local authorities.
Table 3.
Road users’ opinion on a possible action for an integrated urban transport taken by local authorities.
| Subcategories | Transport Combination/Opinion | Likert Scale | ||||
|---|---|---|---|---|---|---|
| 1 | 2 | 3 | 4 | 5 | ||
| G1 | Private car + PT + Sharing PMV | 0 | 5 | 25 | 62 | 41 |
| Private car + PT + Owning PMV | 0 | 3 | 13 | 57 | 60 | |
| G2 | Private car + PT + Sharing PMV | 5 | 26 | 58 | 38 | 7 |
| Private car + PT + Owning PMV | 7 | 24 | 62 | 36 | 5 | |
| G3 | Private car + PT + Sharing PMV | 47 | 39 | 41 | 5 | 1 |
| Private car + PT + Owning PMV | 59 | 21 | 51 | 1 | 1 | |
Table 4.
Chi-square test of independence between sociodemographic characteristics and public opinion on electric scooters.
Table 4.
Chi-square test of independence between sociodemographic characteristics and public opinion on electric scooters.
| Gender (A1) 1 | Age Group (A2) 2 | ||||
|---|---|---|---|---|---|
| Subcategory | Variables | χ2 | p-Value 3 | χ2 | p-Value 3 |
| G1 | C1 | 48.52 | 0.00 | 62.29 | 0.00 |
| C2 | 11.21 | 0.02 | 55.82 | 0.00 | |
| C3 | 12.38 | 0.01 | 12.29 | 0.42 | |
| G2 | C1 | 13.74 | 0.01 | 60.62 | 0.00 |
| C2 | 12.69 | 0.01 | 43.90 | 0.00 | |
| C3 | 6.09 | 0.19 | 57.52 | 0.00 | |
| G3 | C1 | 5.91 | 0.21 | 24.11 | 0.02 |
| C2 | 6.50 | 0.17 | 13.90 | 0.31 | |
| C3 | 3.00 | 0.56 | 18.59 | 0.10 | |
1 Degrees of freedom values df = 4. 2 Degrees of freedom values df = 16. 3 P-Value less than 0.05 was statistically significant at 95% confidence level.
© 2020 by the authors. Licensee MDPI, Basel, Switzerland. This article is an open access article distributed under the terms and conditions of the Creative Commons Attribution (CC BY) license (http://creativecommons.org/licenses/by/4.0/).
Share and Cite
MDPI and ACS Style
Campisi, T.; Akgün, N.; Ticali, D.; Tesoriere, G. Exploring Public Opinion on Personal Mobility Vehicle Use: A Case Study in Palermo, Italy. Sustainability 2020, 12, 5460. https://0-doi-org.brum.beds.ac.uk/10.3390/su12135460
AMA Style
Campisi T, Akgün N, Ticali D, Tesoriere G. Exploring Public Opinion on Personal Mobility Vehicle Use: A Case Study in Palermo, Italy. Sustainability. 2020; 12(13):5460. https://0-doi-org.brum.beds.ac.uk/10.3390/su12135460
Chicago/Turabian StyleCampisi, Tiziana, Nurten Akgün, Dario Ticali, and Giovanni Tesoriere. 2020. "Exploring Public Opinion on Personal Mobility Vehicle Use: A Case Study in Palermo, Italy" Sustainability 12, no. 13: 5460. https://0-doi-org.brum.beds.ac.uk/10.3390/su12135460
Note that from the first issue of 2016, this journal uses article numbers instead of page numbers. See further details here.