Measuring the Economic Impact of a Voluntary Sustainable Tourism Certification


1
Department of Quantitative Economics, University of Oviedo, 33006 Oviedo, Spain
2
Department of Economics, University of Oviedo, 33006 Oviedo, Spain
*
Author to whom correspondence should be addressed.
Sustainability 2020, 12(13), 5465; https://0-doi-org.brum.beds.ac.uk/10.3390/su12135465
Submission received: 13 June 2020
/
Revised: 29 June 2020
/
Accepted: 3 July 2020
/
Published: 7 July 2020
(This article belongs to the Special Issue Multiple Criteria Decision Making for Sustainable Development)
Abstract
:This article contributes to the debate about whether the investment in tourism sustainability is economically profitable for firms. Specifically, using cross-sectional analysis, we explore the existence of a causal link between the possession of a voluntary sustainable certification, Eco-Management and Audit Scheme (EMAS), and the increase in the prices of hotel accommodation. For this, the hedonic price method is used. Prior to the hedonic estimation, the propensity score-matching methodology is applied in order to control for self-selection bias. The analysis is carried out for coastal hotels located in the southern area of Tenerife (Canary Islands, Spain) which merits attention as a typical mature sun and beach tourist destination. The study does not reveal any significant effects of sustainable certification on the prices of accommodations, which would appear to explain the low participation of establishments in the program. We conclude by providing some useful insights on measures aimed at improving related policies.
1. Introduction
Over the last decades, sustainability has become one of the major issues facing the tourism sector. Climate change, degradation of biodiversity habitat, coastal urbanization, increased demand for water [1], fossil fuel consumption and cultural commodification, are, among others, undesirable environmental and social impacts related to tourist activity. As exposed by Paunović et al. [2], sustainability is one of the most important concepts for the future of tourism governance. In order to reduce these inappropriate effects, international institutions, national and local governments, firms and destinations have carried out many actions, for example, urban restrictions, limitation of the growth of hotel beds, development of innovative energy efficient technology in the sector and the establishment of well-known sustainable tourism certifications.
Sustainable tourism certification consists of programs that measure a range of environmental, socio-cultural and economic equity issues [3]. Furthermore, these certifications provide benefits for tourists, for firms and for communities, given that they generate positive externalities. For tourists, sustainable certification helps to reduce the asymmetric information that they suffer [4]. Certifications have an impact on the entire community, increasing the environmental quality of its environment and can also help reduce poverty, especially in rural areas [5,6]. For firms, sustainable certification contributes in two ways. On the one hand, suitably designed environmental standards can lead to innovations that reduce the total cost of a product or service [7]. However, as Dressler and Paunović [8] and Johnson et al. [9] point out, increasing resource productivity through environmental innovation is dependent on the adequacy of the business model. Sustainable business models include stakeholders, environment and the society in order to bring the business purpose closer to sustainability and thus create a sustained competitive advantage [10]. On the other hand, firms can increase their price and/or demand share—and consequently their income—because tourists recognize the label associated with sustainable certification which is a marketing advantage [11,12]. However, firms that voluntarily adhere to these certifications have to affront their costs of adhesion and maintenance. Only if the aforementioned cost savings and income exceed the costs of the investment in sustainability, will the firms continue to adhere to the certification, which will ultimately convert these programs into effective environmental policy instruments [13].
Hence, an analysis of the profitability of these types of certifications becomes essential for their effective use as environmental policy tools [13]. Nevertheless, the literature evaluating the private economic benefits of these certifications is still somewhat scarce, and most studies have focused on calculating the increase in price and/or demand derived from certification ownership. The present study belongs to this category, leaving for future research the benefits of the certification on cost savings, development of innovation, effects on the surrounding environment and on the entire community.
Specifically, the present paper calculates the price premium that the hotel market is willing to pay for the voluntary sustainable certification, Eco-Management and Audit Scheme (EMAS), established by the European Union in 1993 who state, “EMAS is a premium management instrument developed by the European Commission for companies and other organizations to evaluate, report, and improve their environmental performance. EMAS is open to every type of organization eager to improve its environmental performance. It spans all economic and service sectors and is applicable worldwide” [14]. Regulation (EEC) 761/2001 of the European Parliament and of the Council, dated 19 March 2001, has reformulated the EMAS environmental accreditation system, so that many establishments can voluntarily adhere to this certification. EMAS is currently controlled by Commission Regulation (EU) No. 1221/2009, of the European Parliament and of the Council, dated 25 November 2009, on voluntary participation in a community-based environmental management and audit system (DOUE, 22.12.2009).
For the purpose of a market evaluation of the EMAS, the well-established hedonic price method [15] is applied. This method eliminates the gap between the expressed attitudes and actual behavior of consumers and firms in sustainability issues [16,17,18,19]. For addressing the usual methodological issues associated with sample selection, previous to the hedonic analysis, a propensity score-matching technique is used. The latter technique allows reducing any selection bias that may be present in a non-experimental sample, when participants applying treatment or policy—in our case, the hotels awarded by EMAS—are systematically different from those who are not participants.
Our geographical location is the south of Tenerife (Canary Islands, Spain) which stands out as a typical mature sun and beach tourist destination that recognizes problems of sustainability [20]. According to The Travel & Tourism (T&T) Competitiveness Report 2019 [21], Spain is the most T&T competitive country in the world due to rich natural and cultural resources and impressive tourist service infrastructure. However, it is ranked 25 in Pillar 9: Environmental Sustainability. The Canary Islands government has promulgated regulations to address this problem, such as restricting the growth of hotel beds and establishing new quality standards for new establishments. On the other hand, various hotel businesses have also carried out some initiatives aimed primarily at the implementation of environmental management systems and obtaining eco-certifications.
Within an appropriate theoretical framework, we contribute to the literature by assessing the effect of sustainable certification in an important tourism market with recognized problems of sustainability. Rivera [13] performs a similar analysis, but the author carries out a study at national level for a developing country, namely Costa Rica. Our research, in turn, analyzes the policy effects in a regional market and for other sustainable certifications using jointly matching and hedonic price methodologies. According to Rivera [13], research in other countries and other voluntary certifications are necessary in order to extend his findings.
The present research could prove valuable both to policy makers and to firms, because it provides important insights into the design of sustainable policies, for the former, and a way of optimizing the investment for the latter. It could also benefit tourists, at the time of making the choice.
The rest of the study is structured as follows. A literature review on the economic impact of sustainable tourism certification is presented in Section 2. The following section is devoted to exposing both the matching methodology and the theory of hedonic prices in the field of tourist services. Additionally, a background to tourism in Tenerife is presented in this section as well as the description of the database. Section 4 includes a description and discussion of the empirical analysis. The main characteristics offered by hotels are set as the covariates in the matching process and a posteriori, the hedonic regression is undertaken for evaluating the impact of certification on the booking price. Section 5 ends with a discussion of the results. The last section sums up and concludes.
2. Literature Review
The studies that have analyzed the implications of sustainable certifications are diverse, both in the methodology used and in the target to be achieved. Given the goal of our study, we focus our review on studies whose aim is to evaluate the economic impact of sustainable certification and not those that analyze consumer attitudes. Our review extends that of Capacci et al. [4] to include current studies as well as those that analyze the impact of sustainable certification on prices and on economic growth, not restricting ourselves to those that only consider changes in demand and efficiency. We also distinguish between those studies that are not corrected for possible self-selection bias from those that do. Studies about quality or cultural certifications are excluded.
Our review includes eight articles published in academic peer-reviewed journals by Rivera [13], Quintiliani [22], Rigall-I-Torrent et al. [23], Medina et al. [24], Marrocu and Paci [25], Capacci et al. [4] and Cerqua [26], and one in a working paper by Bernini and Cerqua [27]. These studies are classified according to: the type of certification considered (for public places and destinations or for hotels); the variable on which the impact of certification is measured (tourism flows, technical efficiency, prices, sales and economic growth of destinations); the main aim of the study (if it is to evaluate the impact of the certification or if it is a control variable); the geographic focus, the quantitative method used; whether self-selection bias is corrected and the results obtained (see Table 1).
All studies have focused on the economic impact of certifications that are awarded for public places, specifically analyzing the effects of Blue Flag certification, except Rivera [13], who studies the economic impact of the Certification for Sustainable Tourism in Costa Rica (CST program) which rewards hotels.
Regarding the variable on which the impact of certification is analyzed, five studies have been devoted to the impact on tourism flows. One analyzes the technical efficiency [24] and another analyzes the effects of certification on hotel prices [23]. Rivera [13] tested the impact of the certification on prices and sales of hotels, and Bernini and Cerqua [27] tested the impact on economic growth of destinations.
Only the papers by Quintiliani [22], and Marrocu and Paci [25] do not explicitly aim to evaluate the impact of certification.
Six papers use a sub-regional focus, two papers use a regional focus and one uses a national focus. The country for most studies is Italy, with the exception of the study by Rivera [13] and Blackman et al. [28] for Costa Rica, Rigall-I-Torrent et al. [23] for Spain, Medina et al. [24] for Spain and Portugal, and Quintiliani [22] for Italy, Spain, Greece, Croatia and Cyprus.
As for the quantitative method used, three papers carry out a panel data analysis and three a cross-section analysis. Three papers use longitudinal data. Four papers control for self-selection bias.
Certification resulted in a positive impact in four articles whilst in another two, no significant effects were reported. Ambiguous effects were reported in the studies by Rivera [13], Capacci et al. [4] and Cerqua [26]. Rivera [13] shows that the possession of certification alone does not necessarily signify higher prices or sales, but he finds that those hotels that have obtained certification with higher levels of environmental performance increase their accommodation prices. Capacci et al. [4] do not find effects of certification on tourist flows in the year in which it is awarded, but they do find effects in the following year. Cerqua [26] reveals a moderate increase in the flow of domestic tourists, but he finds no effect for foreign tourism.
The present study analyzes the economic impact of a voluntary sustainable certification on the prices of hotels, correcting for self-selection bias. Only Rivera [13] performs a similar analysis, but his geographical focus is at a national country level for Costa Rica. Within an appropriate theoretical framework here, our paper contributes to the literature on the topic by analyzing the effect of certification in other markets.
3. Materials and Methods
3.1. Methodology
As mentioned above, the aim of this study is to assess the economic impact of EMAS on hotel prices. To do this, it is necessary to know the market valuation of the certification and for this purpose, we use the hedonic price model [15]. Prior to the hedonic estimation, the propensity score-matching methodology is applied in order to control for the non-random selection of certain types of tourism hotels seeking certification [28].
- Propensity Score-Matching To Control for Self-Selection Bias
In order to assess the impact of certification on hotel accommodation prices, it is necessary to observe the same hotels both with and without the EMAS certification. This situation is, of course, impossible, although matching methodologies give a suitable tool for solving the problem. These methodologies are useful non-parametric approaches for improving causal inferences in observational studies [29]. Stuart [30] (p. 1) defines “matching broadly to be any method that aims to equate (or ‘balance’) the distribution of covariates in the treated and control groups”.
In our study, the tourist accommodations endowed with sustainable certification, that is, the treatment group, may be substantially different from those that do not possess it, that is, the control group, so that the results may prove biased in an unidentified manner and, therefore, external or internal validity may be compromised.
The technique is based on estimating the propensity score or conditional probability of assignment to a particular treatment given a vector of observable covariates or matching variables [31]. The vectors of observed covariates are set in observed characteristics that may affect participation in the treatment, but have not been affected by the treatment; in our case, this vector consists of the main characteristics of tourist accommodations. The conditional probability of assignment is usually obtained through a bivariate probit regression model.
Thereby, is a dummy variable equal to 1 if the accommodation is awarded with the sustainable certification and 0 otherwise, and is the vector of characteristics of accommodation, such as the room capacity, comfort categories or localization. Then,
where is a vector of regression coefficients and is the disturbance term.
Once Equation (1) is estimated, each treatment unit—the tourist establishment awarded with the sustainable certification—is matched with one or more control units with similar values on the propensity score, and possibly other covariates, and the discarding of all unmatched units [32]. In order to know whether a unit is a good match for another, different methods use different distance measures (see [30,33] and references therein). One of the most common methods is r:1 nearest neighbor matching [34]. After removing observations that do not approximately match, it is possible to apply whatever statistical methods they would have available without matching. In this study, the hedonic price model is applied.
- The Hedonic Price Model
The hypotheses of the hedonic price method [15] have their origin in the New Consumer´s Theory [35]. According to this theory, consumer preferences are defined through the characteristics or attributes of the goods, rather than on the goods themselves. The method is very attractive since it takes into account the preferences of consumers and producers revealed through the market.
The hedonic model relies upon the hypothesis that a heterogeneous good or service with a wide variety of models may be regarded as a vector of characteristics, and its price is a function of these characteristics [15]. Each characteristic can be seen as a good of a special nature, since its price is not observed in the real markets. If the heterogeneous good or service “contains enough models with different combinations of characteristics in the market, it should be possible to estimate an implicit relationship that provides the price of any model with its characteristics” [29] (p. 215); this relationship being known as the hedonic price function.
In our case, the heterogeneous service is the hotel accommodation service, which is composed of different characteristics, such as the room capacity, services provided by the hotel, localization or possession of sustainable certification. Therefore, for Hi, with zi the vector of characteristics, the hedonic price function is as follows:
where β is the vector of coefficients to estimate for the accommodation characteristics with the disturbance term ui.
Under the hypothesis that the tourism accommodation market is in equilibrium and in perfect competition, the hedonic function, Equation (2), is an equilibrium function that results from the interaction of tourists and businesses. The average marginal amount of money a tourist is willing to pay for an additional unit of accommodation characteristic matches the amount of money that a business is willing to receive for this unit, this amount is the marginal price or hedonic price of the characteristic [36].
Therefore, the implicit or hedonic price for characteristic k for continuous characteristics price is,
and for the discrete characteristics
where z{−k} is the vector of all characteristics but the k-th.
With respect to methodological extensions in future research, we will address other functional specifications for the hedonic price relationship. The aim would be to work with non-linear regression models, specifically, to use a non-parametric approach based on artificial neural network (ANN) regressions. ANNs are universal regression tools, capable of consistently estimating arbitrary regression surfaces and their derivatives (e.g., [37] and their references) and they provide a useful means of dealing with the risks of misspecification in non-linear regression. On the other hand, the widespread use of sustainable certifications could improve the analysis addressed. Our future goal is to build a model with a dummy variable to model membership to a set of sustainable certifications.
3.2. Case Study
The geographical location of our empirical analysis is the island of Tenerife. Tenerife is one of the seven islands that make up the Canary Islands archipelago. This archipelago, of volcanic origin, is located in the Atlantic Ocean, southwest of the Iberian Peninsula and Northwest Africa. Its climate is subtropical with an average temperature between 18 °C and 24 °C (64.4 °F and 75.2 °F). Tenerife is located approximately in the central area of the Canary archipelago, between the islands of Gran Canaria and La Gomera, and its distance to the African continent is 284 km.
Tenerife tourism is a mature sun and beach tourism, although many tourists also choose this destination for its unique landscape. Of the archipelago, the island of Tenerife is the one that receives the most tourists. In 2018, 36.6% of the tourists received by the Autonomous Community stayed on this island [38]. In the same year, the island received 5,801,954 tourists, of which 77.5% were foreigners, mainly from the United Kingdom and Germany.
The island is divided into three tourist zones: the northern zone, open to the northeast trade winds, is the most humid and rich in vegetation, covering 15 municipalities; the southern zone, the most arid and driest, covers the south-western coast of the island and is made up of 12 municipalities; lastly, the metropolitan area that encompasses four municipalities and includes the most important cities: San Cristobal de la Laguna and Santa Cruz de Tenerife. The southern area is the most touristic, receiving 75% of the total tourists who visited the island in 2018. It also has the highest percentage of hotels, 147 hotels out of a total of 274 [38].
Tourism in Tenerife began in the 19th century and is located mainly in the north of the island. According to [39], “Its pleasant climate and the mild temperature of the sea made Tenerife into a tourist destination in the last few decades of the 19th century. At that time, thousands of people suffering from health problems were flocking to the island from Europe to recover from their rheumatism, skin problems and breathing difficulties, taking advantage of the Canary Islands’ pure Atlantic air and clear waters”.
Starting in the second half of the 1960s, the north of Tenerife began to receive massive sun and beach tourism. In the following years and throughout the 1970s, there was an excessive and disorganized growth in the northern tourist area, with urban speculation, poor accommodation quality and a lack of green spaces [40,41]. This produced the tourist decline of the northern part of the island in the 1980s. Tourists began to move to the southern part, with more hotel quality and more respect for the island’s environment.
In the decade of the 1990s, social concern arose about the damaging effects on the environment of mass tourism, and in response to this movement, the Canary Islands’ authorities began to enact a series of measures aimed at implementing sustainable tourism in the archipelago. We highlight the following legislation: Law 7/1995 of April 6 of Tourism Management in the Canary Islands; Law 19/2003 of General Management Guidelines and Tourism Management in the Canary Islands; Decree 1/2000 of May 8 on the consolidated text of the Laws of Planning of the Canary Islands Territory and Natural Spaces of the Canary Islands and the Agreement for the Competitiveness and Quality of Tourism in the Canary Islands 2008-2020. In this last agreement, the public administrations of the Canary Islands and the main representative business organizations of the tourism sector in the archipelago, agreed to sign a pact to improve the competitiveness and quality of tourism in the Canary Islands, including environmental quality. These regulations regulate, among other issues, the limitation of the growth of hotel beds and establish new quality standards for new establishments [20].
The hotel sector has also carried out some actions aimed at achieving the sustainable management of tourism activity, mainly through the implementation of environmental management systems and obtaining eco-certifications. A small number of establishments achieved ISO 14001 certification during the 1990s. Likewise, only a few hotel establishments have adhered to EMAS certification, despite the fact that the Autonomous Community of the Canary Islands has established the possibility of granting subsidies for financing part of the accreditation process and the preparation of guides (Decree 35/2002 of April 8). In this respect, in 2003, only two Canary Island hotels were certified. Even more scarce are the number of companies that have obtained some certification from the Responsible Tourism Institute within the Biosphere Hotels brand.
3.3. Data and Variables
In order to carry out the empirical analysis, the prices of rooms in hotels and aparthotels together with their characteristics are required. The data sample includes 140 rooms of the 97 hotels and aparthotels located in the southern area of Tenerife (there were 151 hotels and aparthotels open in this area [38]), as advertised in the Official Website of the Canary Islands Tourist Government in May 2019. Some hotels and aparthotels offer all types of accommodation regimes while others only offer a limited number, so that of the 97 hotels advertised, 140 price observations are obtained. The accommodation characteristics are collected from the aforementioned website and the accommodation prices from hotel websites and from the websites of Booking and Trivago. The data set was collected during the week of May 20–26 of 2019 and the accommodation prices correspond to the second weekend of August 2019.
The prices collected are prices per night in a room or aparthotel in euros, with tax included. The characteristics of the accommodations included in the sample are those that are usually considered in the associated literature [42,43,44,45,46]. These are the following:
- EMAS, is a dummy variable that is equal to 1, if the accommodation is awarded with the sustainable certification EMAS, and 0 otherwise.
- HOTEL, is a dummy variable that is equal to 1, if the establishment is a hotel, and 0 if an aparthotel.
- Comfort category of accommodation. It is measured by the number of stars. Two dummy variables are created: four stars, STARS_4, and five stars, STARS_5. The reference category constitutes those accommodations with less than four stars.
- ROOMS, is the size of the establishment. It is measured by the number of rooms or apartments in the establishment.
- Dist.BEACH, is the distance in kilometers to the nearest beach. The distance to each beach access point from each establishment was computed using Google Maps.
- ACCE, is a dummy variable equal to 1, if the establishment is accessible or practicable, and 0 otherwise.
- Accommodation regime, differentiating between all-inclusive (48 observations), breakfast only (65 observations), half board (13 observations), and accommodation only (14 observations). The following dummy variables are created: all inclusive, ALL_INCLU, takes the value 1, if the accommodation regime is all inclusive, and 0 otherwise, breakfast only, BREAKFAST, takes the value 1, if the accommodation regime is only breakfast, and 0 otherwise, and half board, HALF_BOARD, takes the value 1, if the accommodation regime is half board, and 0 otherwise. The reference category is accommodation only.
The variables included for the entire sample (N = 140) and some descriptive statistics are presented in Table 2.
4. Results
The empirical analysis is conducted in two stages: First, the propensity score is estimated for the entire sample and second, the hedonic technique is applied but only to the matched dataset.
4.1. Propensity Score
The propensity score is estimated applying a probit regression (Equation (1)). The treatment group includes the accommodations that actually have sustainable certification, namely 25 rooms and aparthotels, and the control group, those without certification, that is 115 observations. The dependent variable is 1, if the accommodation has the sustainable certification, and 0 otherwise. The matching variables are the characteristics of accommodation which are summarized in Table 2, excluding the price.
Let i denote the index of n accommodations (rooms and aparthotels) in the database, n1 denotes the number of accommodations with EMAS certification (treated units), n0 denotes the number of accommodations without certification (control units) (such that n = n0 + n1), and xi indicates the vector of matching variables for accommodations i. Let emasi = 1 when the accommodation i is certificated with EMAS, and emasi = 0 when accommodation i is not certificated. We denote Yi (1) as the potential price of accommodation i under the EMAS certification—i.e., the value that the outcome variable would take if emasi were equal to 1, whether or not emasi in fact is 0 or 1—and Yi (0) the potential price of accommodation i assuming that it is not certificated. The variables Yi (1) and Yi (0) are jointly unobservable, and for each i, we observe that one Yi = emasi Yi (1) + (1 − emasi) Yi (0), but not the other.
We conduct a 4:1 nearest neighbor matching with a logistic regression based on propensity score, resulting in 100 accommodations without EMAS certification matched with 25 EMAS accommodations (statistical software R being used for this task). The propensity score for each accommodation is defined as the probability of receiving the EMAS certification given the observed characteristics. The number of accommodations without EMAS certification is much larger than that of the accommodations with EMAS certification. In this situation, the variance of the causal effect is mostly a function of the number of treated units [33] (p. 214). By using nearest neighbor matching, accommodations with EMAS certification are not removed. A 3:1 nearest neighbor matching was also conducted, but was discarded due to the poor results obtained in balance for the HOTEL, STARS_4 and ALL_INCLU variables. According to specialized research (see [33], for further details and references), obtaining a good balance is more advantageous than the drawback of reducing the number of observations in the matched sample. Approximately 89% of the initial data remains in the final database.
Table 3 provides the following statistics for the whole sample and Table 4 for the matched set. “Means Treated” and “Means Control” show the weighted means in the treated and control groups. “SD Control” is the standard deviation computed for the control group. “Mean Diff” is the difference in means between the groups. The last three columns in Table 3 provide the summary statistics of a Q-Q plot. The columns display the median, mean, and maximum distance (eQQ Med, eQQ Mean, and eQQ Max, respectively) between the two empirical quantile functions (treated and control groups). Values greater than 0 indicate deviations between the groups in some part of the empirical distributions. The row “Distance” gives the estimated distance measure for each unit (logit regression has been used in this paper). The results given in Table 3 show lower values for the statistics referring to the Distance to the Beach characteristic for those accommodations with EMAS certification compared to accommodations without it. However, the Accessibility is greater for hotels without certification. These results are kept for the matched data set (see Table 4).
Table 4 displays the mean values of the variables for all accommodations with EMAS certification and all accommodations without it, as well as the differences in means between the two groups after the matching process and standard deviations (SD) of the variables for control group.
Table 5 summarizes the statistical measures for the dataset consisting of the initial EMAS accommodations (n1 = 25) and the non-certificated accommodations that match them (i.e., 100 according to the 4:1 ratio). We compare Table 2 and Table 5 and Table 3 and Table 4 in order to visualize the changes produced by the matching process.
Table 6 summarizes how the matching can improve the balance of the characteristics. The table presents the percent reduction in the difference in means obtained in each of the balance measures in Table 3 and Table 4, (see, for example, [29] for details). Matching improves the balance of most characteristics. Mean differences are smaller for six variables. The percent improvement in the balance for mean differences ranges at the very worst from approximately −91.67% for the STARS-4 variable to the best at 33.42—38.69% for the BREAKFAST and ROOMS variables.
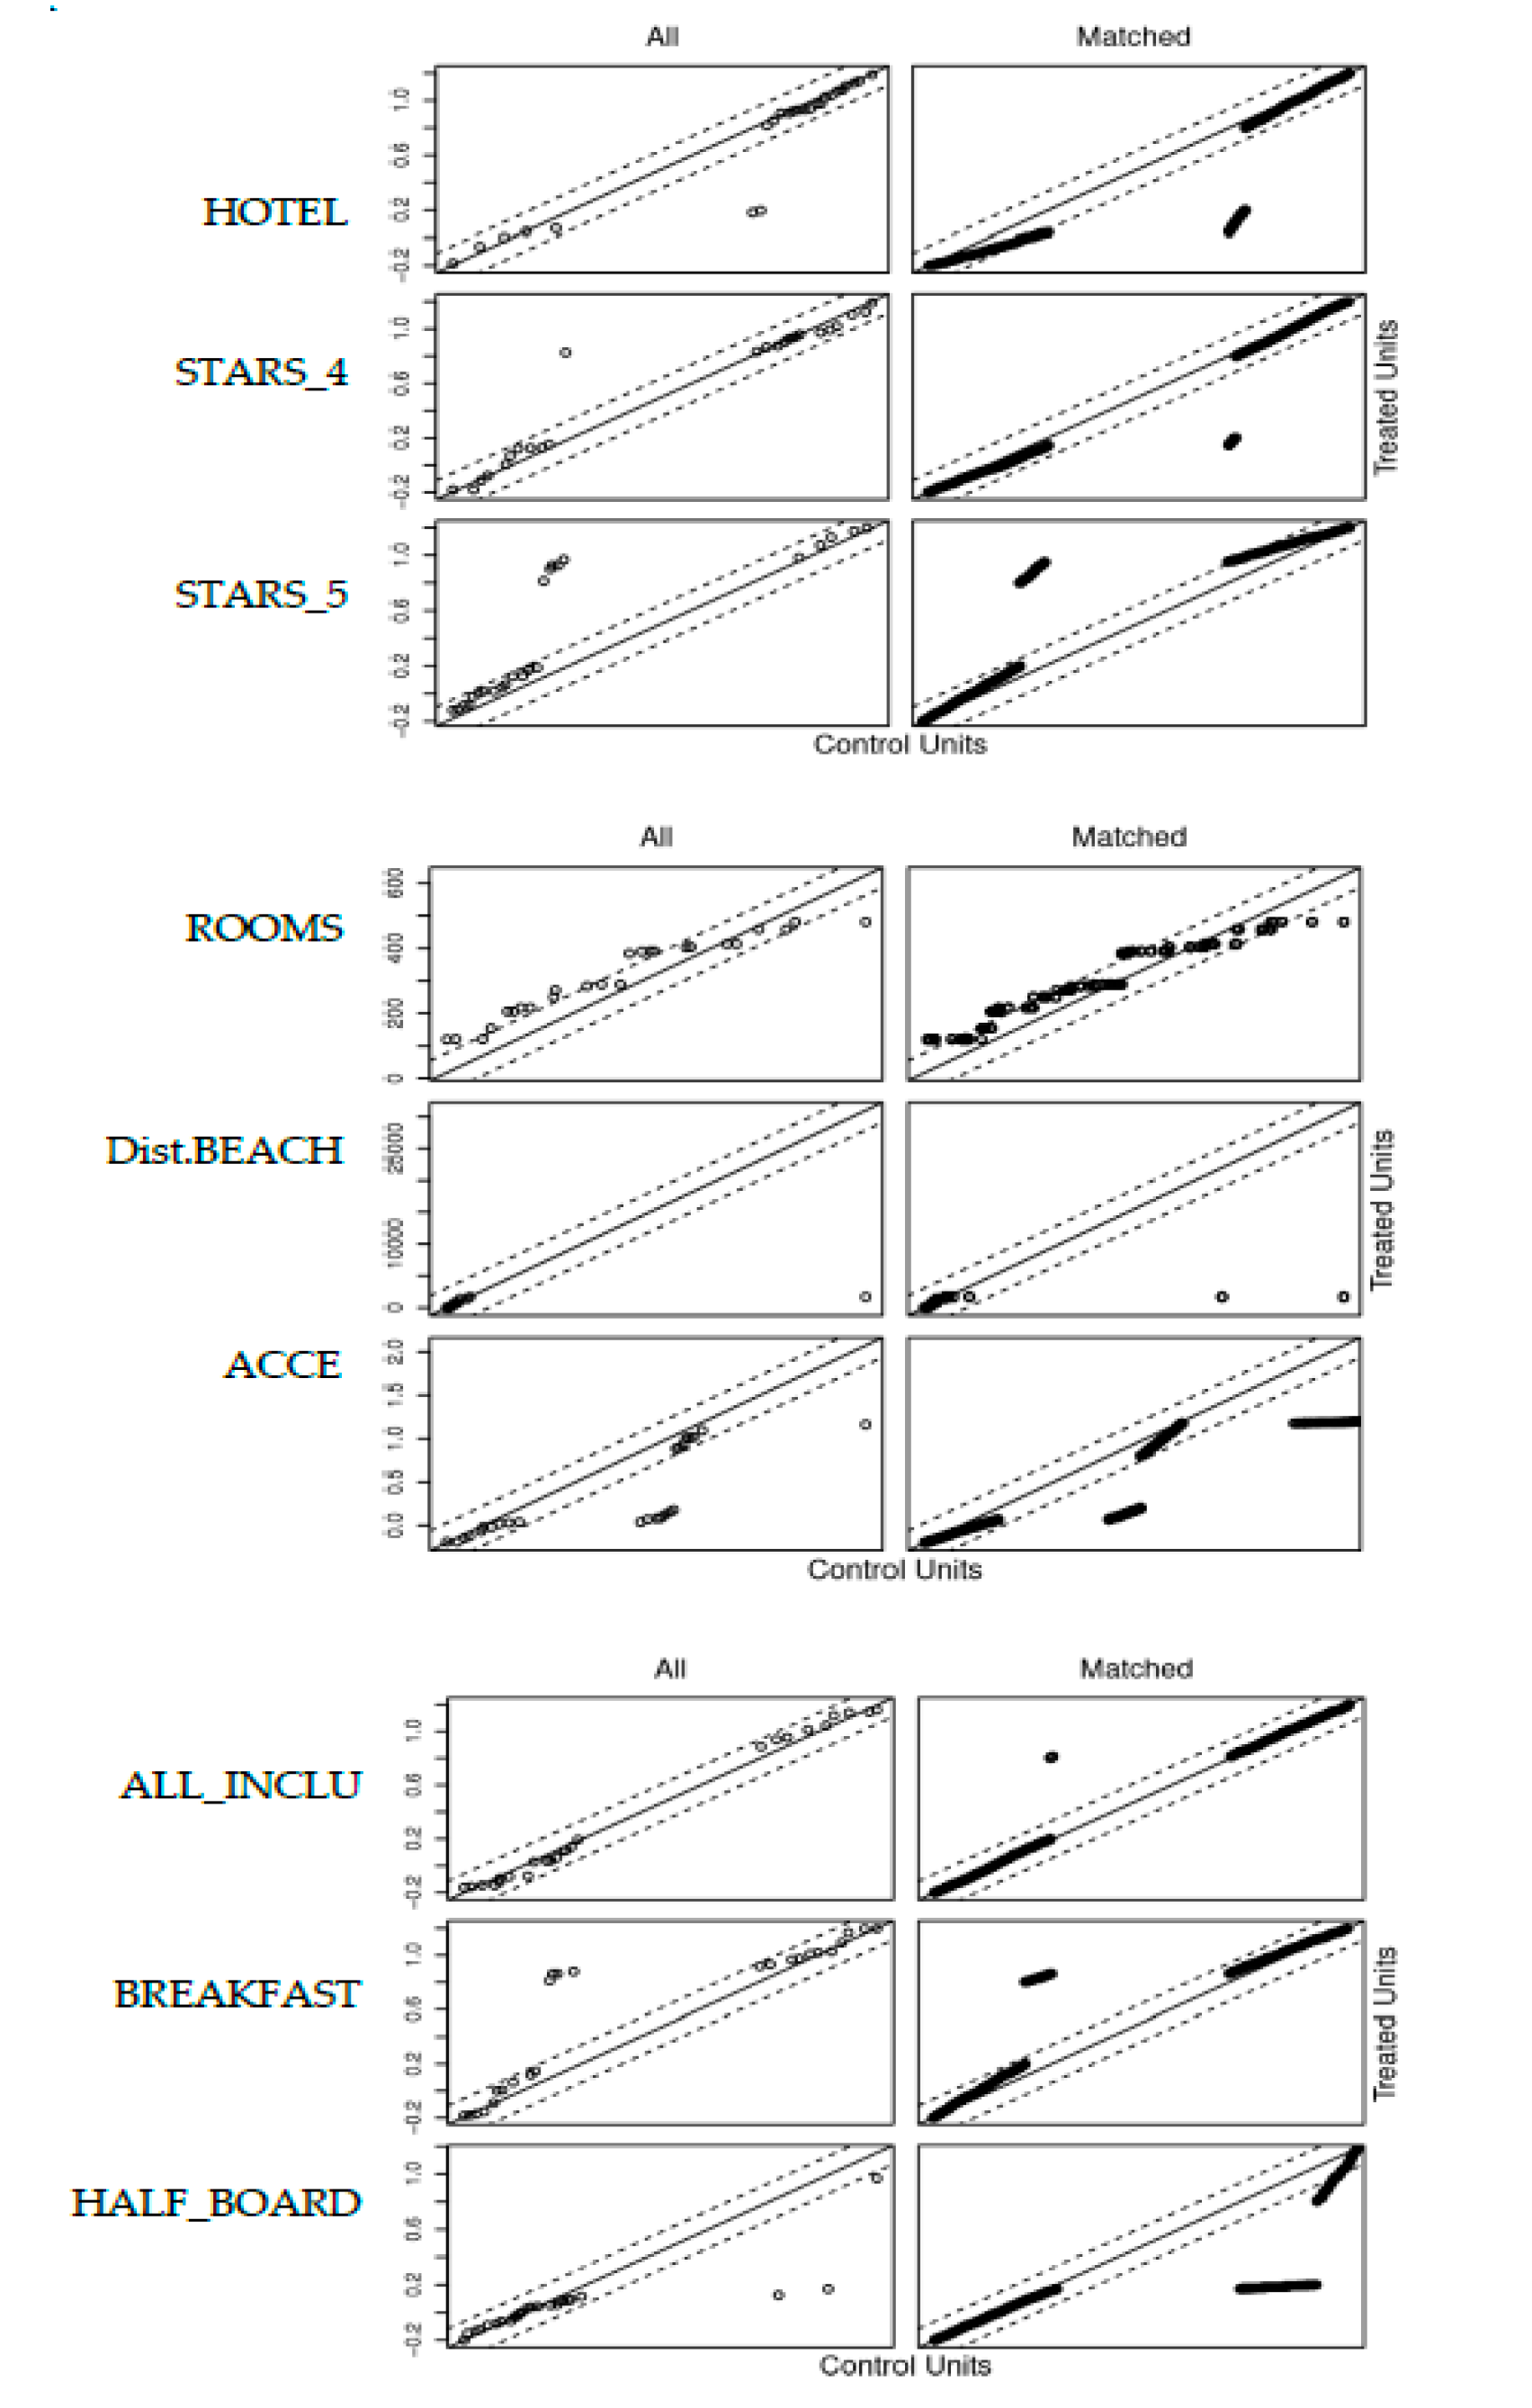
Useful information on into which part of the distribution of the corresponding variable presents differences between the two groups is obtained from the plots of the two empirical quantile functions themselves, shown below. The empirical quantile-quantile (QQ) graphs (Figure 1) allow visualizing values of the variables located in approximately the same quantile of treated and control distributions. Without EMAS, accommodation quantile values are plotted on the x-axis, while EMAS accommodation quantile values are plotted on the y-axis. If values fall below the 45 degree line, without EMAS, accommodations generally take lower values of the variable. Points located exactly on the 45 degree line indicate that the marginal distributions are equal. This figure includes the empirical QQ plots of the characteristics of accommodations before (“All”) and after (“Matched”) matching. From these QQ plots, we can conclude that after matching, the balance of several variables has been improved.
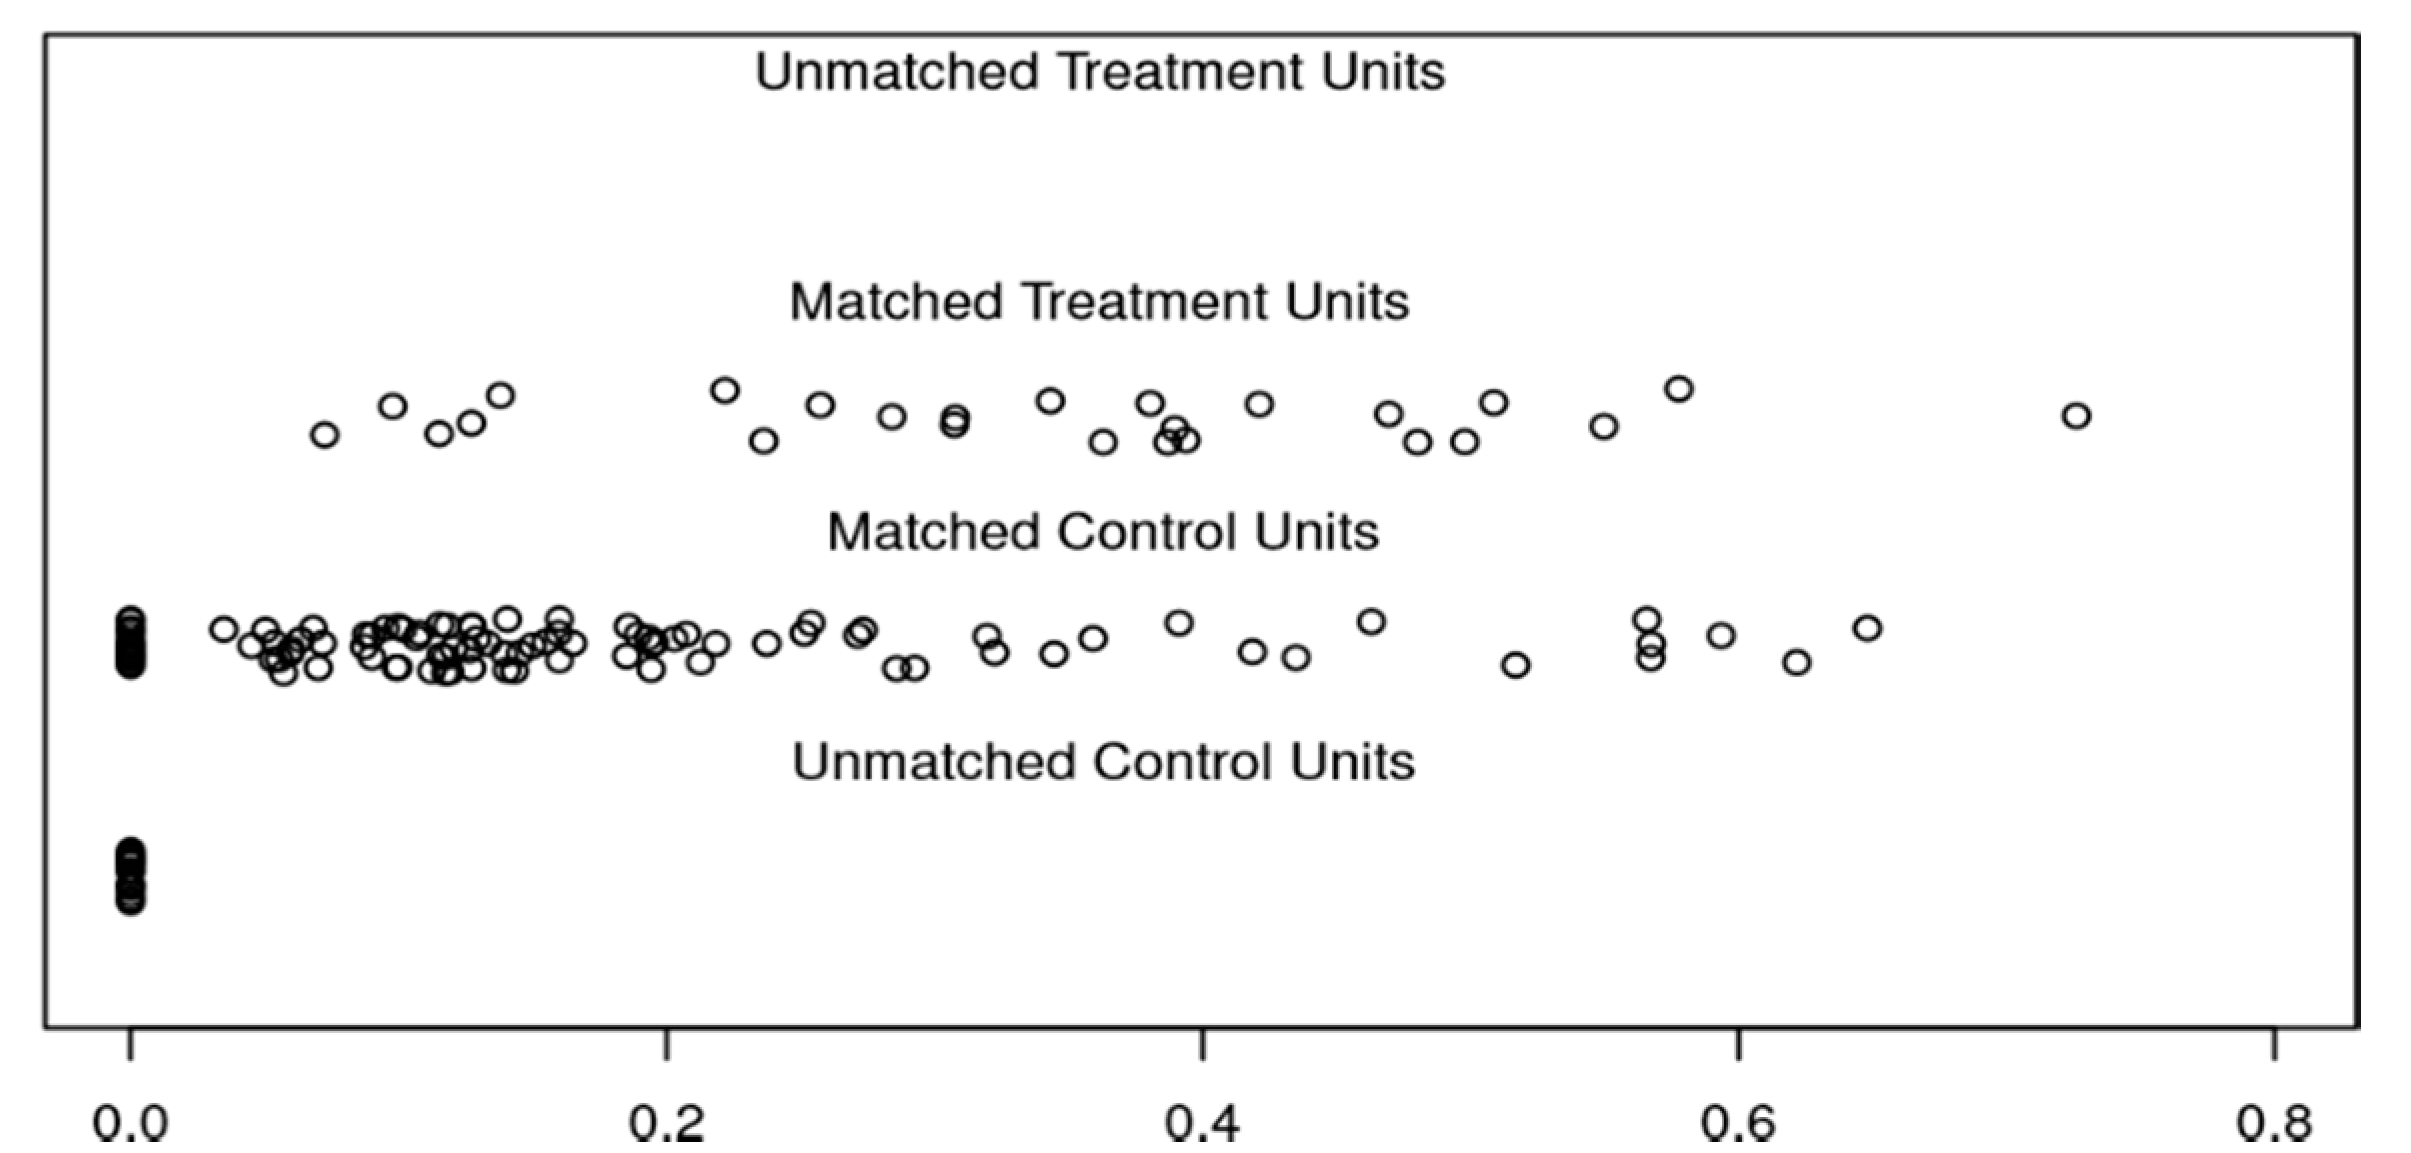
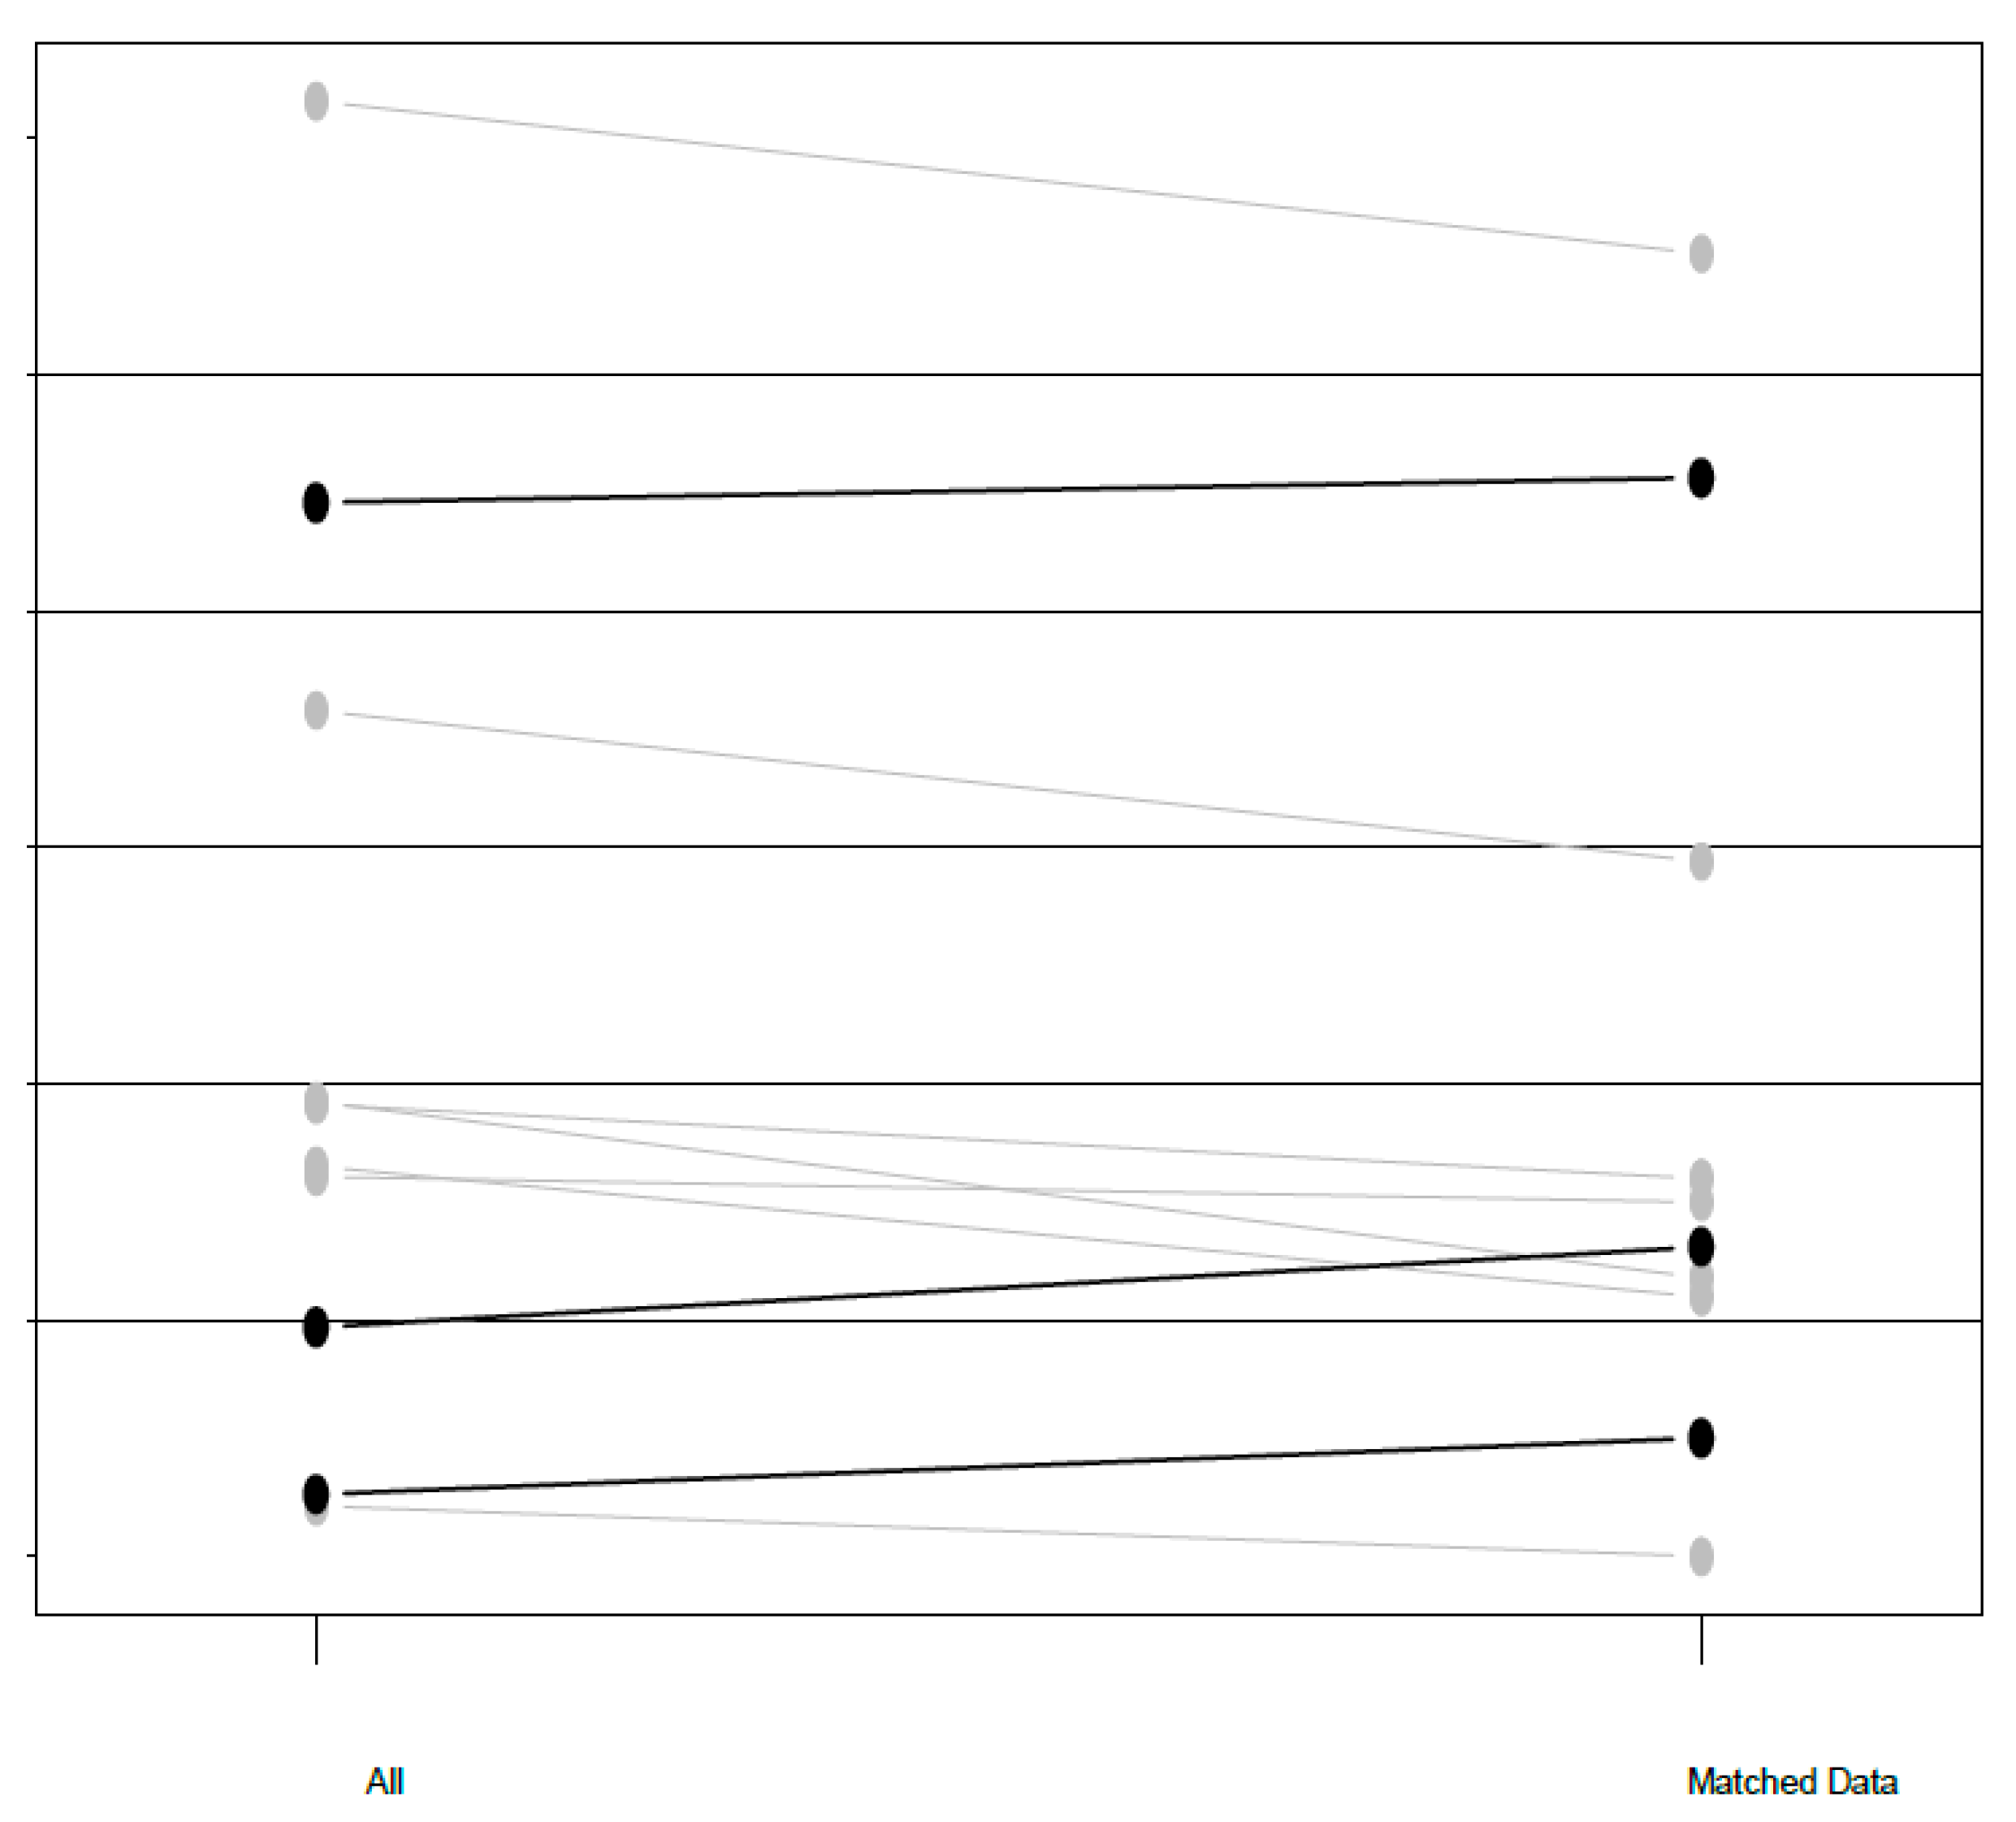
The distribution of propensity scores for the matched treatment units, the matched control units and the unmatched control units are shown in Figure 2, where the closeness between the corresponding propensity scores is observed. The plot of the standardized differences of the means before and after matching is found in Figure 3. This figure illustrates the decrease, after matching, in the standardized difference of means of six characteristics.
4.2. Hedonic Estimation
As noted above, in the second step, the hedonic technique is estimated, but only for the matched dataset. The dependent variable is the price per night in a double room or aparthotel. The prices used in this paper are not transaction prices, but prices published on tour operator websites and hotel websites. Rigall-I-Torrent et al. [23] argue that the use of prices listed on tour operator brochures should not be problematic, since it is reasonable to assume that prices reflect the “expected” prices paid by tourists. Similarly, the prices published on tour operator websites should not prove problematic either. Besides, the hotel market in the south of Tenerife was highly competitive on the dates used, with more than 80% occupancy and thus, it is very unlikely that prices published systematically are not a reflection of real equilibrium market prices [45,47].
The explanatory variables introduced in the hedonic equation are the same as those used in the propensity score estimation but with the sustainable certification added. The Box-Cox transformation for the dependent variable is used for choosing the functional form of the hedonic equation. The calculation of the maximum log-likelihood Box-Cox shows that lambda is equal to a value between 0 and 0.5, and therefore, the semi-logarithmic form is chosen. So, the specification Equation (2) in Section 3 can be expressed as:
where, i = 1, … ,125, and ui is the disturbance term.
The ordinary least squares (OLS) estimation method and LIMDEP 9.0 software were used. The multicollinearity is explored through the variance inflation factors (VIF). The mean VIF is 3.29 and the larger VIF is lower than 8 in all cases, therefore, multicollinearity is not present for any variables. Table 7 shows the results of the hedonic estimate.
5. Discussion
Table 7 indicates that the coefficient of sustainable certification is positive but not significant at the conventional level, which suggests that the possession of certification is not significantly related with higher accommodation prices. This would explain the low participation of firms in the program. In 2018, of the 147 hotels in the south of the island only 19 had been awarded with the EMAS certification, even though the Government of the Canary Islands subsidized part of the accreditation process [48].
This result is in line with that obtained by Rivera [13]. The author does not find any effect (no statistical significance) either on hotel prices or on occupancy rate as a result of possessing the Costa Rican Certification for Sustainable Tourism. However, he finds that those hotels that possess a certification with higher levels of environmental performance—3 and 4 green leaves on a scale from 0 to five green leaves—are able to increase their accommodation prices. The author concludes that the possession of sustainable certification by itself is not significantly related to higher prices, namely, it is also necessary that hotels awarded with the eco-certification maintain higher levels of environmental performance. Unfortunately, EMAS certification lacks information on the levels of environmental performance, so although the hypothesis exposed by Rivera [13] seems plausible to us, we are not in a position to corroborate his findings.
Cerqua [26] arrives at a conclusion similar to Rivera [13], in the sense that the eco-certification of his study alone is not significantly related to positive economic effects. Specifically, the author finds that Blue Flag certification only has positive effects on domestic tourism flows when it is combined with a sustainable policy. In the same way, Rigall-I-Torrent et al. [23] obtain positive effects on hotel prices for Blue Flag certification, when quality and environmental variables of destinations are included in their estimation.
Quintiliani [22] finds no effects of Blue Flag certification on tourism flows. According to this author, the non-significance of the coefficient may be due to the fact that the certification has not been publicized enough to have recognition in the tourist market. The author points out that “it could be that the advertising potential of this indicator may have not worked well enough to lure tourists…” [18] (p. 26). In this context, it may be that the vast number of sustainable certifications creates confusion among consumers and hence, they are not recognized. However, we do not believe that this is the case, since EMAS, in particular, is a prestigious European certification.
Another explanation for the non-significance of the eco-certification coefficient may be due to the type of tourist that the island receives, mainly international tourism (77.5% in 2018). According to the Cerqua [26] study, international tourists take into account a lot of information when choosing their trip, and the possession of the certification has little weight on their decision. The author finds that the award of a Blue Flag only has positive effects on domestic tourism and not international tourism. The author argues [26] (p. 16), “Domestic tourist would put a much larger weight on it as they focus on a few pieces of information when making their decisions. This might explain why we find a positive signaling effect only for domestic tourists…” In the same way, Boronat-Navarro and Pérez-Aranda [49] find differences in the willingness to pay for sustainable hotels according to the type of tourist. Tourists who search for information on sustainable certifications and have previous experiences with sustainable hotels are usually willing to pay more for stays in these types of establishments.
Paunović et al. [2] present a methodology for measuring and explaining destination competitiveness. Three variables related to sustainability are considered as covariates of the model: Wastewater treatment, Enforcement of environmental regulations and Stringency of environmental regulations. Their research confirms the relevant role of sustainability for the competitiveness of both developing and developed destinations. Moreover, they point out several destination governance problems: an insignificant role of destination residents in decision-making and a dominant role of foreign tour operators that could perhaps weigh in contra of the success of a sustainable certification.
More arguments that go towards supporting the results obtained are provided by Teece [50], who questions the assumption that innovations enable value creation via some kind of automatism. Instead, Teece analyzes the fact that market offerings do not create customer value per se, because neither demand nor a sufficient willingness to pay can be assumed. This situation is particularly critical with green or social innovations [51] (p. 669). However, there are still more obstacles to the innovator’s success. Teece [52] identified the innovator’s dilemma: it is often not the innovator who profits most from an innovation but their stakeholders. Teece introduced the “profiting from innovation” (PFI) theory to understand the causes of this dilemma. As collected by Lüdeke-Freund [51] (p. 672), the PFI theory uses the concept of an appropriability regime in order to describe how the type of an innovation and intellectual property protection determine the likelihood of capturing value from an innovation. Teece distinguishes tight regimes from weak regimes. It appears appropriate to analyze this question and whether the weak appropriability is one reason which could explain the non-significance of the sustainable certification coefficient.
This empirical analysis has several limitations that will be taken into account for future research. A segmentation of tourists, according to their level of awareness on sustainability issues, has not been considered in the current work. Many studies find that those tourists with a higher awareness of sustainability are willing to pay a higher price for more sustainable destinations [18] and accommodations [49]. Information about this type of tourist is important for firms and stakeholders. Furthermore, it would be interesting to analyze the effects of seasonality on the evolution of sustainable certification pricing [53]. Lastly, there are two ways in which sustainable certification contributes to profitability. One is to increase income. The other, is to reduce costs by deploying innovative energy efficient technology and business practices, an analysis which has not been addressed here but, due to its relevance, is interesting for the purpose of future research. On the other hand, the present study does not take into account the benefits of sustainable certification for the entire community, which could lead to increasing the environmental quality of surrounding areas as well as contributing towards a reduction in inequality in the area. This research question is very interesting in order to improve the scope of our framework.
With respect to the other results, the category variables and the accommodation regime variables show a very large and highly significant relationship with a higher accommodation price. These results are in line with those obtained by other studies [13,22,42,45,54]. Additionally, the coefficient relating to the distance of the beach is significant and negative, and indicates that, ceteris paribus, if the distance from the establishment to the beach decreases by 1%, the price of accommodation increases by 1.6% [55]. The coefficients of size, type of establishment and accessibility are not significant at the conventional level. In summary, tourists who come to the island take into account the quality, accommodation regime and proximity to the beach when choosing their accommodation.
6. Conclusions
Sustainability is one of the major issues currently facing the tourism sector. In order to encourage the development of sustainable tourism, a wide range of initiatives are being carried out by institutions and social agents. One of them is the establishment of voluntary sustainable certifications for accommodation establishments. This type of certification has appeared since the mid-1990s [56], with the double goal of preventing environmental damage as well as granting a competitive advantage to firms. The firms will adhere to certification, if the income obtained from its possession is higher than the costs of investing in it. For this reason, measuring the economic impact of this sustainability instrument is of great interest.
The present study contributes to this topic by calculating the price premium that the market is willing to pay for the voluntary sustainable certification, EMAS (Eco-Management and Audit Scheme). For this purpose, the hedonic price method is applied after controlling for self-selection bias. We do not find any significant effects on the prices of accommodations as a consequence of sustainable certification. This signifies that firms do not recover their investment in certification via higher prices, thereby jeopardizing the effectiveness of the program as an environmental policy tool.
The literature on the subject mainly offers two explanations for this result. The first argues that the possession of a sustainable certification alone is not sufficient in order to exert a positive economic impact on firms [13,26]. The policy must be accompanied by other actions aimed at increasing the development of sustainable tourism. These actions can be carried out by several agents, by the sustainable certification itself, (for example, by establishing levels in certification), by local administrations improving the environmental quality of their territory or by other tourism stakeholders. That is, in order for the policy to be economically profitable for firms, and for converting these programs into effective environmental policy instruments, it is necessary to use the so-called policy mixes [27].
The second explanation proposed for the non-significance of the coefficient is based on the type of tourism that the island receives. In this context, the tourists who come to the island, comprising mainly foreign citizens, may have only a small commitment towards sustainability. Cerqua [26] finds economic effects of the Blue Flag on domestic tourists but no effect on international tourists. It may also be that Anglo-Saxon and German tourists have a different behavior with respect to sustainable tourism inside and outside their country. Namely, they may behave as pro-sustainable tourists in their own country but not when they travel to Mediterranean countries.
We think that both explanations could serve to support our results, but we cannot affirm our findings without carrying out a more exhaustive analysis. Thus, future research should address both of the following: First, a study of the sustainable policies carried out by each municipality and their effects on the sustainable certification and second, differentiation between domestic and international tourism and the commitment of each with regard to sustainable certifications.
Author Contributions
All authors contributed equally to the final version of the article. Individual contributions can be identified as follows. Conceptualization, C.B.-T.; methodology, A.B.-T. and C.B.-T.; software, A.B.-T. and C.B.-T.; formal analysis, A.B.-T. and C.B.-T.; investigation, C.B.-T.; writing—original draft preparation, A.B.-T. and C.B.-T.; writing—review and editing, A.B.-T. and C.B.-T. All authors have read and agreed to the published version of the manuscript.
Funding
This research was funded by University of Oviedo, PAPI-19-GR-2011-0049.
Conflicts of Interest
The authors declare no conflict of interest. The funders had no role in the design of the study; in the collection, analyses, or interpretation of data; in the writing of the manuscript, or in the decision to publish the results.
References
- Tirado, D.; Nilsson, W.; Deyà-Tortella, B.; García, C. Implementation of water-saving measures in hotels in Mallorca. Sustainability 2019, 11, 6880. [Google Scholar] [CrossRef] [Green Version]
- Paunović, I.; Dressler, M.; Mamula Nikolic, T.; Popovic Pantic, S. Developing a competitive and sustainable destination of the future: Clusters and predictors of successful national-level destination governance across destination life-cycle. Sustainability 2020, 12, 4066. [Google Scholar] [CrossRef]
- Honey, M.; Rome, A. Protecting Paradise: Certification Programs for Sustainable Tourism and Ecotourism, 1st ed.; Institute for Policy Studies: Washington, DC, USA, 2001; pp. 5–8. [Google Scholar]
- Capacci, S.; Scorcu, A.E.; Vici, L. Seaside tourism and eco-labels: The economic impact of Blue Flags. Tour. Manag. 2015, 47, 88–96. [Google Scholar] [CrossRef]
- Bien, A. Why is certification important? In A Simple User´s Guide to Certification for Sustainable Tourism and Ecotourism, 3rd ed.; IDB Publications: Washington, DC, USA, 2007; pp. 10–12. [Google Scholar]
- Dodds, R.; Joppe, M. Have certification programs allowed SME´s in LDC´s access to market? Tour. Territories J. 2009, 1, 237–261. [Google Scholar]
- Porter, M.E.; Van der Linde, C. Green and competitive: Ending the stalemate. Harvard Bus. Rev. 1995, 72, 97–118. [Google Scholar]
- Dressler, M.; Paunović, I. Towards a conceptual framework for sustainable business models in the food & beverage industry: The case of German wineries. Br. Food J. 2019, 122, 1421–1435. [Google Scholar] [CrossRef]
- Johnson, M.W.; Christensen, C.M.; Kagerman, H. Reinventing your business model. Harvard Bus. Rev. 2008, 87, 52–60. [Google Scholar]
- Bocken, N.M.P.; Short, S.W.; Rana, P.; Evans, S. A literature and practice review to develop sustainable business model archetypes. J. Clean. Prod. 2014, 65, 42–56. [Google Scholar] [CrossRef] [Green Version]
- Font, X.; Sanabria, R.; Skinner, E. Sustainable tourism and ecotourism certification: Raising standards and benefits. J. Ecotour. 2003, 2, 213–218. [Google Scholar] [CrossRef]
- Bernal Escoto, B.E.; Portal Boza, M.; Feitó Madrigal, D. Sustainable tourism: A competitiveness strategy perspective in Baja California. Sustainability 2019, 11, 6934. [Google Scholar] [CrossRef] [Green Version]
- Rivera, J. Assessing a voluntary environmental initiative in the developing world: The Costa Rican certification for sustainable tourism. Policy Sci. 2002, 35, 333–360. [Google Scholar] [CrossRef]
- European Commission. 2020. Available online: https://ec.europa.eu/environment/emas/index_en.htm (accessed on 9 September 2019).
- Rosen, S. Hedonic prices and implicit markets: Product differentiation in pure competition. J. Political Econ. 1974, 82, 34–55. [Google Scholar] [CrossRef]
- Carrigan, M.; Attalla, A. The myth of the ethical consumer-do ethics matter in purchase behavior? J. Consum. Market. 2001, 18, 560–578. [Google Scholar] [CrossRef] [Green Version]
- Auger, P.; Devinney, T.M. Do what consumers say matter? The misalignment of preferences with unconstrained ethical intentions. J. Bus. Eth. 2007, 76, 361–383. [Google Scholar] [CrossRef]
- Pulido-Fernández, J.I.; López-Sánchez, Y. Are tourists really willing to pay more for sustainable destinations? Sustainability 2016, 8, 1240. [Google Scholar] [CrossRef] [Green Version]
- Mendoza-González, G.; Martínez, M.L.; Guevara, R.; Pérez-Maqueo, O.; Garza-Lagler, M.C.; Howard, A. Towards a Sustainable Sun, Sea, and Sand Tourism: The Value of Ocean View and Proximity to the Coast. Sustainability 2018, 10, 1012. [Google Scholar] [CrossRef] [Green Version]
- Parreno Castellano, J.M. Turismo sostenible y diversificacion de la oferta en las islas Canarias (España). Études Caribéennes 2011. [Google Scholar] [CrossRef]
- Calderwood, L.U.; Soshkin, M. The Travel & Tourism Competitiveness Report 2017. Available online: https://www.weforum.org/reports/the-travel-tourism-competitiveness-report-2017 (accessed on 22 June 2020).
- Quintiliani, F. International tourism in the coastal regions of five Mediterranean countries. Tour. Anal. 2009, 14, 353–373. [Google Scholar] [CrossRef]
- Rigall-I-Torrent, R.; Fluvia, M.; Ballester, R.; Salo, A.; Ariza, E.; Espinet, J.M. The effects of beach characteristics and location with respect to hotel prices. Tour. Manag. 2011, 32, 1150–1158. [Google Scholar] [CrossRef]
- Medina, L.F.; Gomez, I.G.; Marrero, S.M. Measuring efficiency of sun and beach tourism destinations. Ann. Tour. Res. 2012, 39, 1248–1251. [Google Scholar] [CrossRef]
- Marrocu, E.; Paci, R. Different tourists to different destinations. Tour. Manag. 2013, 39, 71–83. [Google Scholar] [CrossRef] [Green Version]
- Cerqua, A. The signalling effect of eco-labels in modern coastal tourism. J. Sustain. Tour. 2017, 25, 1159–1180. [Google Scholar] [CrossRef] [Green Version]
- Bernini, C.; Cerqua, A. Do Sustainability Policies Finance Local Economies? MPRA Paper 91882; University Library of Munich: Munich, Germany, 2019. [Google Scholar]
- Blackman, A.; Naranjo, M.A.; Robalino, J.; Alpízar, F.; Rivera, J. Does tourism eco-certification pay? Costa Rica’s Blue Flag program. World Dev. 2014, 58, 41–52. [Google Scholar] [CrossRef]
- Bilbao-Terol, A.; Álvarez-Otero, S.; Bilbao-Terol, C.; Cañal-Fernández, V. Hedonic evaluation of the SRI label of mutual funds using matching methodology. Int. Rev. Financial Anal. 2017, 52, 213–227. [Google Scholar] [CrossRef]
- Stuart, E.A. Matching methods for causal inference: A review and a look forward. Stat. Sci. 2010, 25, 1–21. [Google Scholar] [CrossRef] [Green Version]
- Rosenbaum, P.R.; Rubin, D.B. The central role of the propensity score in observational studies for causal effects. Biometrika 1983, 70, 41–55. [Google Scholar] [CrossRef]
- Rubin, D.B. Using propensity scores to help design observational studies: Application to the tobacco litigation. Health Serv. Outcomes Res. Methodol. 2001, 2, 169–188. [Google Scholar] [CrossRef]
- Ho, D.E.; Imai, K.; King, G.; Stuart, E.A. Matching as nonparametric preprocessing for reducing model dependence in parametric causal inference. Polit. Anal. 2007, 15, 199–236. [Google Scholar] [CrossRef] [Green Version]
- Rubin, D.B. Matching to remove bias in observational studies. Biometrics 1973, 29, 159–184. [Google Scholar] [CrossRef]
- Lancaster, K.L. A new approach to consumer theory. J. Polit. Econ. 1996, 74, 132–157. [Google Scholar] [CrossRef]
- Bilbao-Terol, C.; Cañal-Fernández, V.; Valdes, L.; Del Valle, E. Rural tourism accommodation prices by land use-based hedonic approach: First results from the case study of the self-catering cottages in Asturias. Sustainability 2017, 9, 1688. [Google Scholar] [CrossRef] [Green Version]
- Landajo, M.; Bilbao, C.; Bilbao, A. Nonparametric neural network modelling of hedonic prices in the housing market. Empir. Econ. 2012, 42, 987–1009. [Google Scholar] [CrossRef]
- Turismo en Cifras Turismo de Tenerife. 2018. Available online: https://www.webtenerife.com/investigacion/situacion-turistica/turismo-cifras/ (accessed on 17 August 2019).
- SPET Turismo de Tenerife 2020. Available online: https://www.webtenerife.co.uk/tenerife/history/events/auge-turismo.htm (accessed on 20 January 2020).
- González, N.; Miranda, P.G. El Turismo en la Historia de Canarias. Viajeros y Turistas Desde la Antigüedad Hasta Nuestros Días, 1st ed.; Nivaria Ediciones, La Laguna: Tenerife, Spain, 2003. [Google Scholar]
- Benner, M. The decline of tourist destinations: An evolutionary perspective on overtourism. Sustainability 2020, 12, 3653. [Google Scholar] [CrossRef]
- Sinclair, M.T.; Clewer, A.; Pack, A. Hedonic prices and the marketing of package holidays: The case of tourism resort in Málaga. In Marketing Tourism Places, 1st ed.; Ashworth, G., Goodall, B., Eds.; Routledge: London, UK, 1990; pp. 85–103. [Google Scholar]
- Taylor, L.O.; Smith, V.K. Environmental amenities as a source of market power. Land Econ. 2000, 76, 550–568. [Google Scholar] [CrossRef]
- Thrane, C. Hedonic price models and sun and beach package tours: The Norwegian case. J. Travel Res. 2005, 43, 302–308. [Google Scholar] [CrossRef]
- Rigall-I-Torent, R.; Fluvià, M. Managing Tourism Products and Destinations Embedding Public Good Components: A hedonic Approach. Tour. Manag. 2011, 32, 244–255. [Google Scholar] [CrossRef]
- Bilbao Terol, C.; González Vidales, A.; Rodríguez Álvarez, A. Valoración hedónica de la creación de un bien público local un modelo para mercados no competitivos. Rev. Econ. Apl. Spain 2015, 23, 45–61. [Google Scholar]
- Rigall-I-Torent, R.; Fluvià, M. Public goods in tourism municipalities: Formal analysis, empirical evidence and implications for sustainable development. Tour. Econ. 2007, 13, 361–378. [Google Scholar] [CrossRef] [Green Version]
- Gobierno de Canarias. 2020. Available online: https://www.gobiernodecanarias.org/medioambiente/temas/informacion-ambiental/gestion_ambiental_sostenible/emas/organizaciones-adheridas/#_self/ (accessed on 10 July 2019).
- Boronat-Navarro, M.; Pérez-Aranda, J.A. Analyzing willingness to pay more to stay in a sustainable hotel. Sustainability 2020, 12, 3730. [Google Scholar] [CrossRef]
- Teece, D.J. Business models, business strategy and innovation. Long Range Plann. 2010, 43, 172–194. [Google Scholar] [CrossRef]
- Lüdeke-Freund, F. Sustainable entrepreneurship, innovation, and business models: Integrative framework and propositions for future research. Bus. Strategy Environ. 2020, 29, 665–681. [Google Scholar] [CrossRef]
- Teece, D.J. Reflections on “profiting from innovation”. Res. Policy 2006, 35, 1131–1146. [Google Scholar] [CrossRef]
- Sáez-Fernández, F.J.; Jiménez-Hernández, I.; Ostos-Rey, M.S. Seasonality and Efficiency of the Hotel Industry in the Balearic Islands: Implications for Economic and Environmental Sustainability. Sustainability 2020, 12, 3506. [Google Scholar] [CrossRef]
- Clewer, A.; Pack, A.; Sinclair, M.T. Price competitiveness and inclusive tour holidays in European cities. In Choice and Demand in Tourism, 1st ed.; Johnson, P., Thomas, B., Eds.; Mansell: London, UK, 1992; pp. 123–143. [Google Scholar]
- Halvorsen, R.; Palmquist, R. The interpretation of dummy variables in semilogarithmic equations. Am. Econ. Rev. 1980, 70, 474–475. [Google Scholar]
- Graci, S.; Dodds, R. Certification and labelling. In The Routledge Handbook of Tourism and Sustainability, 1st ed.; Hall, C.M., Gössling, S., Scott, D., Eds.; Routledge: Abingdon, UK, 2015; pp. 200–208. [Google Scholar]
Figure 1.
QQ-plots for the characteristics of all accommodations.

Figure 2.
Distribution of propensity scores. Matches chosen using a 4:1 nearest neighbor matching on the propensity score.
Figure 2.
Distribution of propensity scores. Matches chosen using a 4:1 nearest neighbor matching on the propensity score.

Figure 3.
Plot of the standardized difference of the means for characteristics before and after matching.
Figure 3.
Plot of the standardized difference of the means for characteristics before and after matching.


Table 1.
Main characteristics of studies in related literature.
| Aims, Methodologies and Scope | Authors |
|---|---|
| Public Place certification | Quintiliani (2009) [22], Rigall-I-Torrent et al. (2011) [23], Medina et al. (2012) [24], Marrocu and Paci (2013) [25], Blackman et al. (2014) [28], Capacci et al. (2015) [4], Cerqua (2017) [26], Bernini and Cerqua (2019) [27] |
| Hotel certification | Rivera (2002) [13] |
| Impact on tourism flows | Quintiliani (2009) [22], Marrocu and Paci (2013) [25], Blackman et al. (2014) [28], Capacci et al. (2015) [4], Cerqua (2017) [26] |
| Impact on technical efficiency | Medina et al. (2012) [24] |
| Impact on prices | Rigall-I-Torrent et al. (2011) [23] |
| Impact on prices and sales | Rivera (2002) [13] |
| Impact on economic growth of destinations | Bernini and Cerqua (2019) [27] |
| Certification as a control variable | Quintiliani (2009) [22], Marrocu and Paci (2013) [25] |
| Sub-regional focus | Marrocu and Paci (2013) [25], Rigall-I-Torrent et al. (2011) [23], Medina et al. (2012) [24], Blackman et al. [28], Cerqua (2017) [26], Bernini and Cerqua (2019) [27] |
| Regional focus | Quintiliani (2009) [22], Capacci et al. (2015) [4] |
| National focus | Rivera (2002) [13] |
| Panel data analysis | Quintiliani, (2009) [22], Blackman et al. (2014) [28], Capacci et al. (2015) [4] |
| Cross-sectional analysis | Rivera (2002) [13], Rigall-I-Torrent et al. (2011) [23], Marrocu and Paci (2013) [25] |
| Longitudinal analysis | Medina et al. (2012) [24], Cerqua (2017) [26], Bernini and Cerqua (2019) [27] |
| Controlling for self-selection bias | Rivera (2002) [13], Blackman et al. (2014) [28], Cerqua (2017) [26], Bernini and Cerqua (2019) [27] |
| Positive impact | Rigall-I-Torrent et al. (2011) [23], Medina et al. (2012) [24], Marrocu and Paci (2013) [25], Blackman et al. (2014) [28] |
| Ambiguous impact | Rivera (2002) [13], Capacci et al. (2015) [4], Cerqua (2017) [26] |
| No effect | Quintiliani (2009) [22], Bernini and Cerqua (2019) [27] |
Table 2.
Summary of characteristics on initial database.
| Min | 1st Qu. | Median | Mean | 3rd Qu. | Max | SD | |
|---|---|---|---|---|---|---|---|
| PRICE | 62.6 | 124.8 | 161.92 | 182.6 | 208.96 | 727 | 90.1 |
| EMAS | 0 | 0 | 0 | 0.1786 | 0 | 1 | 0.38 |
| HOTEL | 0 | 0 | 1 | 0.793 | 1 | 1 | 0.41 |
| STARS_4 | 0 | 0 | 1 | 0.579 | 1 | 1 | 0.49 |
| STARS_5 | 0 | 0 | 0 | 0.243 | 0 | 1 | 0.43 |
| ROOMS | 18 | 136.8 | 275 | 274.6 | 402 | 624 | 150 |
| Dist.BEACH | 0 | 0.0875 | 0.3 | 0.8659 | 0.6 | 31 | 3.2 |
| ACCESS. | 0 | 0 | 1 | 0.5714 | 1 | 1 | 0.54 |
| ALL_INCLU | 0 | 1 | 0 | 0.3429 | 1 | 1 | 0.48 |
| BREAKFAST | 0 | 0 | 0 | 0.464 | 1 | 1 | 0.5 |
| HALF_BOARD | 0 | 0 | 0 | 0.09286 | 0 | 1 | 0.29 |
Table 3.
Summary of balance for all data.
| Means Treated | Means Control | SD Control | Mean Diff | eQQ Med | eQQ Mean | eQQ Max | |
|---|---|---|---|---|---|---|---|
| Distance | 0.346 | 0.142 | 0.156 | 0.203 | 0.23 | 0.198 | 0.277 |
| HOTEL | 0.72 | 0.809 | 0.395 | −0.089 | 0 | 0.08 | 1 |
| STARS_4 | 0.6 | 0.574 | 0.497 | 0.026 | 0 | 0.04 | 1 |
| STARS_5 | 0.4 | 0.209 | 0.408 | 0.191 | 0 | 0.2 | 1 |
| ROOMS | 312.48 | 266.417 | 155.474 | 46.063 | 73 | 67 | 143 |
| Dist.BEACH | 0.45 | 0.956 | 3.541 | −0.506 | 0.1 | 1.256 | 29.3 |
| ACCE | 0.32 | 0.626 | 0.486 | −0.306 | 0 | 0.28 | 1 |
| ALL_INC | 0.36 | 0.339 | 0.476 | 0.021 | 0 | 0 | 0 |
| BREAKFAST | 0.6 | 0.435 | 0.498 | 0.165 | 0 | 0.16 | 1 |
| HALF_BOARD | 0.04 | 0.104 | 0.307 | −0.064 | 0 | 0.08 | 1 |
Table 4.
Summary of balance for matched data.
| Means Treated | Means Control | SD Control | Mean Diff | eQQ Med | eQQ Mean | eQQ Max | eQQ Med | eQQ Mean | eQQ Max | |
|---|---|---|---|---|---|---|---|---|---|---|
| Distance | 0.346 | 0.164 | 0.156 | 0.182 | 0.195 | 0.18 | 0.266 | 0.195 | 0.18 | 0.266 |
| HOTEL | 0.72 | 0.84 | 0.368 | −0.12 | 0 | 0.12 | 1 | 0 | 0.12 | 1 |
| STARS_4 | 0.6 | 0.65 | 0.479 | −0.05 | 0 | 0.04 | 1 | 0 | 0.04 | 1 |
| STARS_5 | 0.4 | 0.24 | 0.429 | 0.16 | 0 | 0.16 | 1 | 0 | 0.16 | 1 |
| ROOMS | 312.48 | 284.24 | 154.737 | 28.24 | 54 | 54.8 | 143 | 54 | 54.8 | 143 |
| Dist.BEACH | 0.45 | 0.968 | 3.758 | −0.5181 | 0.1 | 1.261 | 29.3 | 0.1 | 1.261 | 29.3 |
| ACCE | 0.32 | 0.6 | 0.496 | −0.26 | 0 | 0.24 | 1 | 0 | 0.24 | 1 |
| ALL_INCLU | 0.36 | 0.36 | 0.482 | 0 | 0 | 0 | 0 | 0 | 0 | 0 |
| BREAKFAST | 0.6 | 0.49 | 0.502 | 0.11 | 0 | 0.12 | 1 | 0 | 0.12 | 1 |
| HALF_BOARD | 0.04 | 0.1 | 0.301 | −0.06 | 0 | 0.08 | 1 | 0 | 0.08 | 1 |
Table 5.
Summary of matched data.
| Min. | 1st Qu. | Median | Mean | 3rd Qu. | Max. | |
|---|---|---|---|---|---|---|
| LNPRICE | 4.265 | 4.885 | 5.138 | 5.173 | 5.382 | 6.589 |
| EMAS | 0 | 0 | 0 | 0.2 | 0 | 1 |
| ALL_INCLU | 0 | 0 | 0 | 0.36 | 1 | 1 |
| BREAKFAST | 0 | 0 | 1 | 0.512 | 1 | 1 |
| HALF_BOARD | 0 | 0 | 0 | 0.088 | 0 | 1 |
| HOTEL | 0 | 1 | 1 | 0.816 | 1 | 1 |
| STARS_4 | 0 | 0 | 1 | 0.64 | 1 | 1 |
| STARS_5 | 0 | 0 | 0 | 0.272 | 1 | 1 |
| ROOMS | 22 | 172 | 289 | 289.9 | 413 | 624 |
| Dist.BEACH | 0 | 0.05 | 0.29 | 0.8646 | 0.6 | 31 |
| ACCE. | 0 | 0 | 1 | 0.528 | 1 | 1 |
| Distance | 0 | 0.0838 | 0.1406 | 0.2 | 0.2915 | 0.7267 |
| weights | 1 | 1 | 1 | 1 | 1 | 1 |
Table 6.
Percent balance improvement.
| Mean Diff. | eQQ Med | eQQ Mean | eQQ Max | |
|---|---|---|---|---|
| Distance | 10.493 | 15.136 | 8.964 | 3.939 |
| HOTEL | −35.294 | 0 | −50 | 0 |
| STARS_4 | −91.667 | 0 | 0 | 0 |
| STARS_5 | 16.364 | 0 | 20 | 0 |
| ROOMS | 38.692 | 26.027 | 18.209 | 0 |
| DIST.BEAC | −2.361 | 0 | −0.433 | 0 |
| ACCE | 15.057 | 0 | 14.286 | 0 |
| ALL_INCL | 100 | 0 | 0 | 0 |
| BREAKFAST | 33.421 | 0 | 25 | 0 |
| HALF_BOARD | 6.757 | 0 | 0 | 0 |
Table 7.
Results of the estimate hedonic price equation with matched data.
| Variables | Coefficient |
|---|---|
| Constant | 4.348 (0.23) *** |
| EMAS | 0.020 (0.053) |
| HOTEL | −0.018 (0.065) |
| STARS_4 | 0.286 (0.081) *** |
| STARS_5 | 0.762 (0.122) *** |
| ROOMS | −0.000 (0.000) |
| Dist.BEACH | −0.016 (0.005) *** |
| ACCE | −0.000 (0.055) |
| ALL_INCLUD | 0.668 (0.225) *** |
| BREAKFAST | 0.387 (0.227) * |
| HALF_BORAD | 0.500 (0.223) * |
| R2 adjusted | 0.47 |
| N | 125 |
| p-Value | 0 |
| F-ratio | 12.09 |
Standard Errors (robust to heteroscedasticity White method) are in parentheses. Dependent variable: the natural logarithm price. *** p < 0.001, ** p < 0.05, * p < 0.1.
© 2020 by the authors. Licensee MDPI, Basel, Switzerland. This article is an open access article distributed under the terms and conditions of the Creative Commons Attribution (CC BY) license (http://creativecommons.org/licenses/by/4.0/).
Share and Cite
MDPI and ACS Style
Bilbao-Terol, A.; Bilbao-Terol, C. Measuring the Economic Impact of a Voluntary Sustainable Tourism Certification. Sustainability 2020, 12, 5465. https://0-doi-org.brum.beds.ac.uk/10.3390/su12135465
AMA Style
Bilbao-Terol A, Bilbao-Terol C. Measuring the Economic Impact of a Voluntary Sustainable Tourism Certification. Sustainability. 2020; 12(13):5465. https://0-doi-org.brum.beds.ac.uk/10.3390/su12135465
Chicago/Turabian StyleBilbao-Terol, Amelia, and Celia Bilbao-Terol. 2020. "Measuring the Economic Impact of a Voluntary Sustainable Tourism Certification" Sustainability 12, no. 13: 5465. https://0-doi-org.brum.beds.ac.uk/10.3390/su12135465
Note that from the first issue of 2016, this journal uses article numbers instead of page numbers. See further details here.