Do Multilateral Development Bank Trust Funds Allocate Climate Finance Efficiently?


1
Department of Political Science, University of Zurich, CH-8006 Zürich, Switzerland
2
Department of Political Science, University of Zurich and Perspectives Climate Research, CH-8006 Zürich, Switzerland
3
School of Social and Political Sciences, University of Glasgow, Glasgow G12 8RT, UK
4
Perspectives Climate Research, D-79106 Freiburg im Breisgau, Germany
*
Author to whom correspondence should be addressed.
Sustainability 2020, 12(14), 5529; https://0-doi-org.brum.beds.ac.uk/10.3390/su12145529
Submission received: 9 June 2020
/
Revised: 28 June 2020
/
Accepted: 6 July 2020
/
Published: 8 July 2020
(This article belongs to the Special Issue Adapting to Climate Change: The Interplay between International and Domestic Institutions in the Context of Climate Finance)
Abstract
:The Paris Agreement has been celebrated as a breakthrough for international climate policy. However, relatively scant attention has been given to the emergent ecosystem of climate finance facilities that support it. We provide an overview of the rising number of climate-related trust funds at multilateral development banks (MDBs). These funds can be distinguished into mitigation funds and adaptation funds. Some funds have a focus on capacity building activities. To maximize their effect on sustainable development, the different types of funds should follow different resource allocation criteria: For adaptation funds, vulnerability should represent the primary criterion. For mitigation funds, the main criterion should be the emission reduction potential. Capacity building should primarily focus on countries with weak institutions. Using a novel dataset of disbursements of climate-related trust funds, available for the World Bank, we examine whether fund allocations correspond to these expectations, and compare them with those of bilateral donors. We find that while trust funds with a focus on mitigation generally allocate aid in line with efficiency considerations, trust funds with a focus on adaptation do not seem to prioritize the countries most strongly in need, contrary to bilateral aid. Furthermore, capacity building activities do not seem to focus on countries with weak institutions. These findings have important implications for the effectiveness and legitimacy of climate aid to developing countries.
1. Introduction
The Paris Agreement has been celebrated as a breakthrough for international climate policy. However, relatively scant attention has been given to the emergent ecosystem of climate finance facilities that support it. Mirroring the complexity of the climate governance regime complex [1,2,3,4], the international climate finance architecture is complex and includes several funding channels, such as bi- and multilateral aid, bi- and multilateral finance channeled through multilateral trust funds, private finance through international market mechanisms, and hybrid forms of those [5,6,7].
In this paper, we provide an overview of the rising number of climate-related trust funds at multilateral development banks (MDBs). Over the past two decades, MDBs have created over 200 of such trust funds. Most trust funds receive contributions directly from donors, while others receive funding from so-called financial intermediary funds (FIFs), like the Global Environment Facility [8,9], which themselves are replenished periodically by donor governments. Primarily through project grants, trust funds can usefully complement other activities that support developing countries with their contributions to global climate change mitigation, and in their effort to adapt to the consequences of climate change. As opposed to most traditional climate finance, which is relatively well documented through data collected on Official Development Assistance (ODA) by the OECD’s Development Assistance Committee (DAC), information on MDB trust funds rests mainly within these banks. Information publicly available is patchy and incomplete [10,11]. Based on both publicly available data and information received directly by the banks, including interpretations based on numerous staff interviews, the overview we provide substantially increases the knowledge about the role and activities of these funds and thus of a significant, but yet underexplored, phenomenon within climate finance.
Beyond the overview of MDB trust funds, we provide an empirical assessment of the allocation of their financial resources to developing countries, which is based on a normative framework sketched at the beginning of this paper.
Our work draws upon several existing strands of the literature. Normative arguments are based on the general aid allocation literature distinguishing between allocation criteria that are theoretically promising for effective aid (such as aid allocation oriented at recipient need) and those that are not (allocation oriented at donor interest). This large literature goes back to the 1970s [12,13]. Its implications in terms of aid effectiveness are not only theoretically plausible, but have also been empirically confirmed in later studies [14,15].
Recent work has shown, however, that this conceptual framework is not applicable to aid for global public goods such as climate change mitigation [16]. This is because, for global public goods, the benefits are independent of the locality of project implementation [1,2]. No matter where a ton of CO2 is reduced, a vulnerable country like Bangladesh will benefit from these emission reductions in exactly the same way. Hence, what should matter here to determine the locality of implementation is not recipient need, but the efficiency of the investment, so that a maximum of emission reductions can be reached with any given amount of financial resources. Of course, emission reduction measures may also have some positive local co-benefits. Furthermore, MDBs could assist developing countries to become locations for more efficient mitigation, notably through capacity building. Such capacity building is an important component of enhancing readiness to engage in mitigation [11].
In contrast to mitigation funding, adaptation funding—through trust funds or otherwise—should be allocated in response to recipient vulnerability [17,18,19,20]. In contrast, mitigation funding should flow primarily to those places where it can achieve the greatest benefits in terms of emissions reductions. This is usually not in the poorest countries, as they lack mitigation options, but rather in middle income countries that often face critical junctures regarding their mid-term development strategies (e.g., regarding investments in infrastructure or durable consumer goods like vehicles, refrigerators or housing) [17,20,21]. Obviously, this only holds on average, and there may always be exceptions. In particular, in certain poor countries there might be the risk that satisfying “suppressed demand” would lead to a big rise of emissions. In this case, mitigation could be achieved, if a new, proposed high carbon infrastructure is prevented by an alternative, low carbon investment. For example, if Tanzania plans to invest in a new coal power plant, a trust fund could intervene at the decision-making point with a renewable energy alternative. However, such windows of opportunity are only open for very short periods and are difficult to predict.
The geographic distribution of projects under the clean development mechanism (CDM), an international market mechanism under the Kyoto Protocol, demonstrates where these efficient mitigation locations can be found: until May 2020, 75.2% of all emission credits (certified emission reductions, CERs) expected before the end of 2020 were linked to projects in only three countries (China, India and Brazil) [22]. At the same time, donors are under increased pressure to focus on poor recipients in their traditional development cooperation, as enshrined in their commitments to principles of “good donorship,” for instance in the Paris Declaration, and as monitored by the international community through various donor rankings [23,24,25]. Some donors may not be aware of the differences between different types of aid and thus follow the same principles for all aid. Others may find it difficult to explain these differences to the public, and hence, give in to the pressure even where it is misguided. As a result, many bilateral aid agencies have found it difficult to use completely different, efficiency-oriented targeting criteria for climate change mitigation [16]. Our study will examine to what extent MDBs face similar tradeoffs in allocating trust fund resources, or whether they are able to allocate mitigation finance more efficiently.
While investing mitigation finance in places with no efficient mitigation options is simply a waste of resources, the MDBs’ activities should not compete with a functioning private market, either [11,26]. This represents a dilemma if MDBs nevertheless decide to remain active in this area, as has been the case in carbon markets. How can they contribute to climate change mitigation, avoiding both inefficiency and the crowding out of the private sector? As acknowledged in their own policy documents, they have to focus on an enabling role, e.g., [27]. Apart from providing conceptual inputs regarding the development and expansion of the markets and the piloting of new activities, they can adopt a complementary role by focusing on capacity building and governance, thereby increasing the scope of efficient mitigation options.
Questions regarding the purpose of trust funds and of their complementarities to alternative funding instruments are also at the center of the broader literature on multi-bi aid, i.e., development assistance originating from bilateral donors, but channeled through trust funds at multilateral agencies. The use of multi-bi aid has grown tremendously since its inception at the turn of the millennium, with a value that currently comes close to half of multilateral aid [28]. Prior studies have established that aid channeled through such trust funds often focuses on different (sub-) sectors than other development assistance, or on different recipients, such as countries just emerging from major conflicts, where support may be very valuable, but also very risky, e.g., [29,30,31]. In this paper, however, we consider a given sector (climate change mitigation and adaptation), which is both extremely prominent in multi-bi aid, but also well represented within traditional bi- and multilateral aid. Furthermore, at least for mitigation funding, it is difficult to imagine a specific focus on conflict areas. So, the question remains; which complementarities could justify the existence of the many MDB trust funds active in this area?
Specific studies focusing on climate-related MDB trust funds are rare. Yet, there is some initial work on individual trust funds, notably on the World Bank’s Prototype Carbon Fund (PCF) [32,33,34], and on the development of carbon funds at the World Bank [26], on which we can build with our analysis. In this paper, we go beyond a discussion of the climate and carbon finance architecture and seek to understand the actual resource allocation patterns of MDB trust funds. Based on a unique database with information we collected from different MDBs, our work also provides an important context analysis for the interpretation of prior case studies in this area.
We proceed as follows. In Section 2, we describe our data collection process and our main data sources. In Section 3, we first provide a general overview of the landscape of climate-related trust funds before examining to what extent they allocate their resources in accordance with mitigation and adaptation purposes. Section 4 discusses the findings and Section 5 concludes.
2. Materials and Methods
The information used in this paper was collected in the framework of an assessment of the landscape of the MDBs’ climate trust funds on behalf of the German Agency for International Cooperation (GIZ) [35]. Thanks to the relentless efforts by the commissioning agency, we were able to create a dataset that—while still far from complete—goes way beyond the sketchy data publicly available. This dataset includes general information, including the start and end year, the geographic and thematic focus, and total contributions for all climate-related trust funds at the World Bank (specifically, at the International Bank for Reconstruction and Development, IBRD, the International Development Agency, IDA, and the International Finance Corporation, IFC), the Asian Development Bank (ADB), the African Development Bank (AfDB), and the Inter-American Development Bank (IADB). The initial list of relevant funds was obtained using a key word search (i.e., climate, mitigation, green, ozone, carbon, emissions, environment, forest, clean technology, Kyoto, adaptation) on trust fund titles in the MDBs’ annual reports, which was then reviewed by experts, notably GIZ and MDB staff. Table 1 provides an overview of the available information:
One difficulty in presenting the data is to distinguish independent trust funds from the myriad of auxiliary and supplementary funds that appear as separate entities in the MDBs’ trust fund databases, and to avoid double counting if the resources of one trust fund are channeled through others (child funds) or accounted for separately by banks acting as implementing agencies. The MDBs themselves do not provide clear guidance on what should be counted. We define trust funds based on the following criteria:
- They receive own external donor contributions (or are at least meant to do so), i.e., they do not just receive funding as implementers, allocated to them from a higher-level trust fund. (Yet, for the illustration from an MDB perspective, we sometimes highlight the implementing accounts separately, e.g., in Table 2 below.)
- We exclude administrative and holding funds, but include facilities that encompass different sub-funds if those facilities can receive own external donor funding.
- We include second-phase trust funds as separate trust funds, no matter whether there were any substantive foreseen changes in the activities.
For each MDB, Table 2 provides the list of the largest active climate-related trust funds in terms of their cumulative contributions received over the lifetime of the fund. Since the MDBs’ implementing accounts under the FIFs are often even larger than their own autonomous trust funds, we also include them in Table 2 for illustrative purposes. The size of FIFs is so large because a number of them operate as financial mechanisms of the UNFCCC, or as parts of the explicit “umbrella” of the Climate Investment Funds (CIFs). While FIF implementing accounts dominate for many regional development banks, the World Bank holds a portfolio of sizeable autonomous trust funds for which it raises its funds directly with donors.
We further classified all climate-related trust funds according to their substantive link to climate change. These classifications are based on literature and document reviews, keyword search, internet searches, and expert interviews. First, in parallel to the DAC Rio Markers’ distinction between climate change as a ‘principal’ or merely a ‘significant’ objective of bilateral aid, we differentiate between high and medium relevance of the trust funds in addressing climate change.
High relevance: trust funds with a direct focus on climate change (e.g., carbon funds, whose goal is to support development of international market mechanisms for climate change mitigation and to generate emission credits that can be used under such mechanisms, or general climate change mitigation or adaptation funds linked to public climate finance provision, e.g., in the context of the GEF or the GCF).
Medium relevance: trust funds with indirect focus on climate change (e.g., renewable energy or energy efficiency funds, whose goal is to replace carbon-intensive economic activity with low-emission alternatives; these funds may generate substantial or even dominant co-benefits in other areas).
Second, we classify trust funds based on the type of climate change-related interventions:
Mitigation: trust funds seeking to prevent climate change through the reduction or avoidance of greenhouse gas emissions. They include carbon funds, funds focusing on renewable energy and energy efficiency, funds focusing on forestry activities, and various combinations of these activities.
Adaptation: trust funds seeking to address/mitigate the impact of climate change. They include a large number of funds specifically focusing on disaster prevention and response, but also some funds focusing on other activities, e.g., water management.
Climate change general: trust funds that address both mitigation and adaptation.
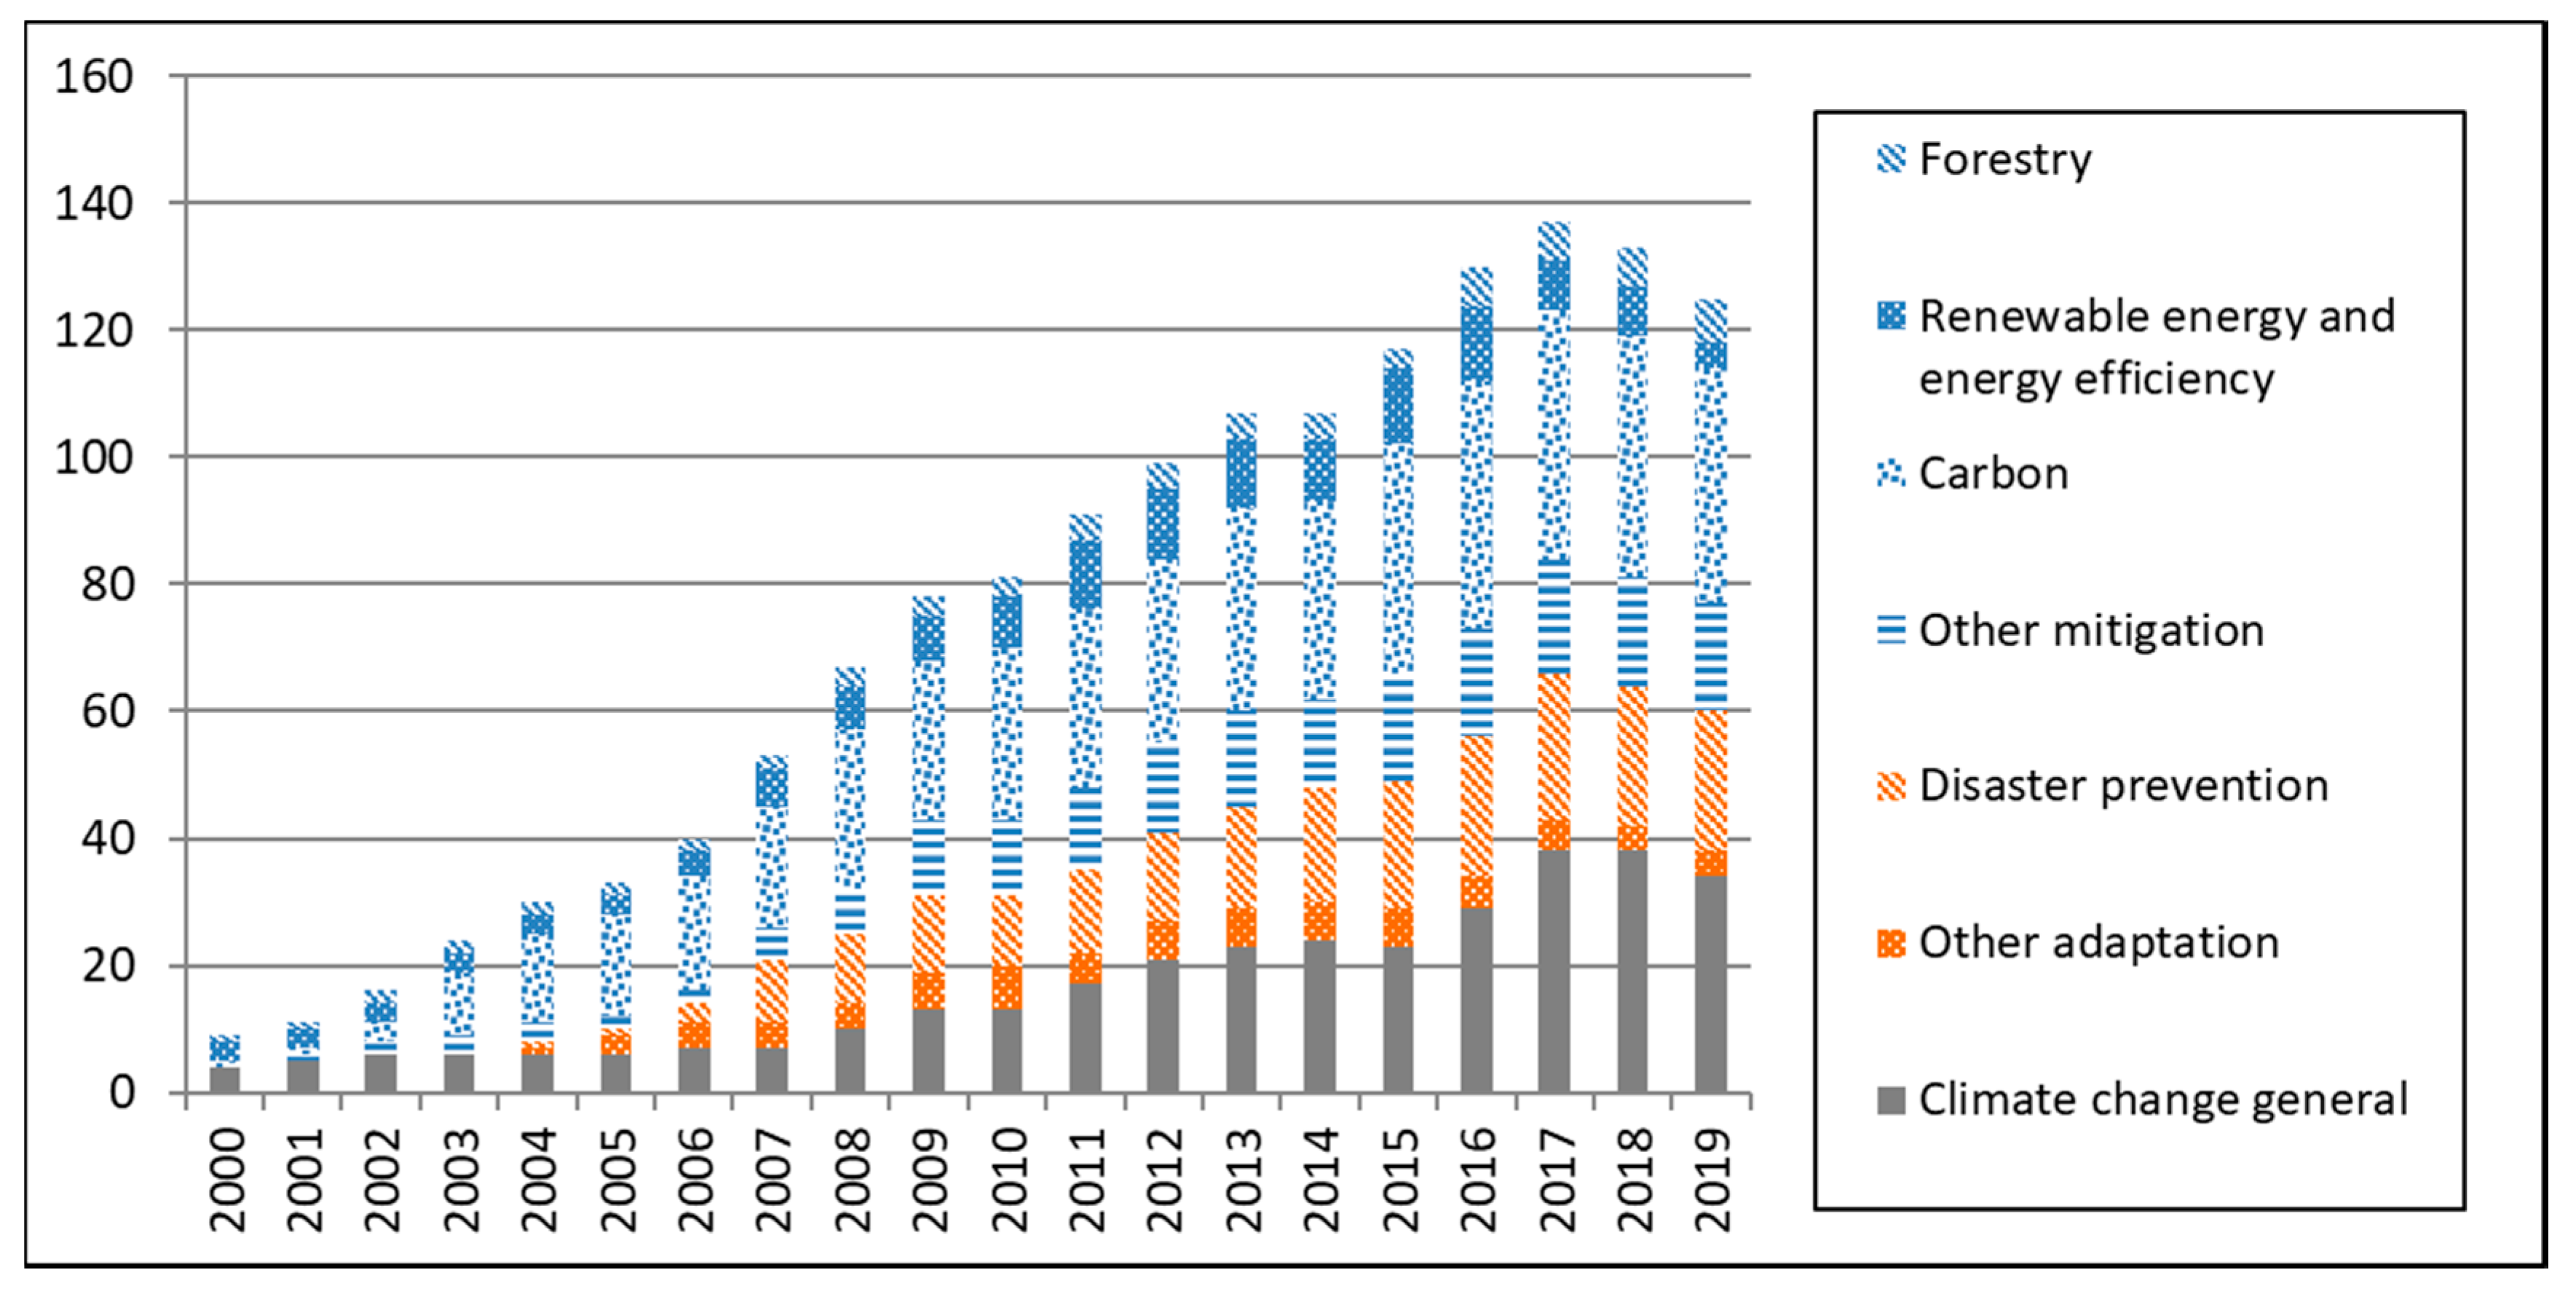
Figure 1 presents the development of the number of active funds in each of these areas over time (including trust funds of both high and medium relevance). Colors indicate main areas (blue: mitigation, orange: adaptation, grey: general), while different shapes refer to thematic sub-fields. Apart from the strong rise in the number of climate-related trust funds overall, the data show the dominance of carbon funds, but also of climate-related funds whose focus is not fixed to any single purpose and include both mitigation and adaptation activities.
While general information at the trust fund level are available for all MDBs, we lack detailed information about individual trust fund-supported projects across MDBs. Maximizing the available information, we therefore conduct analyses at two levels. At the trust fund level, we exploit information on trust fund features to infer to what extent these funds cater to climate-related needs. Specifically, we examine whether trust funds are legally restricted as to the types of locations they can assist. While the advantage of this approach is that such information is available for all MDB trust funds, its drawback is that this information may be a poor representation of actual allocations.
At the project level, we compare the allocation of MDB trust fund resources to the aid allocation by bilateral DAC donors, as far as data availability allows us to do. In fact, additional information on actual disbursements, recipient countries, and sectoral allocation is available only for the World Bank. The information covers both the World Bank’s autonomous trust funds and those parts of FIFs for which the World Bank is an implementing agency. Over the fiscal year 2009–18 period, the World Bank was an implementing agency for the Global Environment Facility (GEF), and its two associated trust funds, the Clean Technology Fund (CTF), the Strategic Climate Fund (SCF), the Adaptation Fund, the Climate Risk and Early Warning Systems (CREWS), the Guyana REDD+ Investment Fund, and the Pilot Auction Facility for Methane and Climate Change Mitigation. However, the disaggregated information does not cover Bank-executed trust funds, i.e., trust funds that finance the Bank’s own support services, such as activities in the area of knowledge transfer, advisory services and technical assistance. Moreover, finally, carbon trust funds, as well as IFC funds, are systematically excluded due to special confidentiality policies. In the case of IFC trust funds, this omission is relatively unproblematic, as IFC manages only 21 trust funds on climate change, with comparatively small funding volumes involved. Our main dataset for the purpose of analyzing disbursement patterns includes trust funds at the World Bank in the period of fiscal years 2009–2018 (the World Bank’s fiscal year 2018 ends on 30 June 2018), excluding carbon funds, bank-executed funds, and IFC trust funds.
We complement these trust fund data with DAC disbursement data for adaptation and mitigation (as identified by the DAC’s ‘Rio markers’). DAC bilateral aid is a useful reference point, as it represents the alternative financing tool that donors can use, and through which they also provide significant funding for climate-related purposes [36]. At the same time, we would not expect bilateral aid to be allocated in accordance with efficiency criteria, given the available evidence on strategic uses of aid [14,15,37,38]. Furthermore, channeling aid through MDB trust funds could allow donors to escape the public pressure mentioned above, and to spend mitigation resources more efficiently. The allocation patterns of bilateral DAC donors should thus provide a lower bar against which MDB trust funds should be able to fare better.
To compare the funding allocations of World Bank trust funds and bilateral DAC donors, we construct a panel dataset of 145 recipients in 2009–2018—in line with the standard approach taken by aid allocation studies [12,13,39]. In this setting, we analyze the effect of different indicators of climate vulnerability and mitigation efficiency on funding from mitigation or adaptation related trust funds, and respectively bilateral DAC donors. We also include generally accessible recipient-level control variables. Appendix A provides information on all variables and data sources.
In estimating the aid allocation models, we implement the analysis and reorganize the disbursement data to obtain a recipient-year panel dataset. Furthermore, we must take into account the censored nature of the data (many country-years with zero disbursements) by using Tobit models. A Tobit model posits that realized disbursements are based on an underlying latent utility, whereby the donor only allocates funding when the utility is positive, and the funding is greater as utility grows further. Coefficient estimates from a Tobit model thus reflect the combination of (1) the change in disbursements for recipients, weighted by the probability of receiving positive amounts, and (2) the change in probability receiving disbursements, weighted by the expected value of a positive disbursement. They can be directly interpreted in terms of the changes in donor utility.
3. Results
3.1. Analysis of Geographic Allocation Based on Trust Fund Features
As discussed in Section 1, adaptation aid should be provided to those countries most in need, because this is where it can have the greatest effect. Except for a few individual funds specifically dedicated to an individual recipient, at trust fund level, we cannot use country specific information to assess recipient need. However, we can proxy need by poverty and examine if trust funds cater for IDA eligible countries. Eligibility for IDA support depends primarily on per capita income, i.e., a country’s gross national income (GNI) per capita must be below a specific threshold (US$ 1175 in fiscal year 2020). In exceptional cases, IDA eligibility extends to countries that lack creditworthiness despite a higher income (including a number of small island states). Other countries borrow from the IBRD. In a certain transition phase, countries may also be able to borrow from both (blend countries) [40].
We can thus use the categories IDA, IBRD, or blend, to assess—albeit roughly—the need orientation of climate-related trust funds. For MDBs other than the World Bank, however, we lack this differentiation. Even many of the World Bank’s own funds are not clearly defined as part of either group. We introduced the additional categories as ‘regional’ and ‘global’ when no other information was available, and where funds kept the freedom to allocate their resources anywhere they see fit (or within only regional limitations). Table 3 shows that this happens a lot.
Table 3 also shows the same distinction for mitigation funds and mixed funds (climate change general). The distribution for the latter is hard to interpret, because it includes the highest share of regional development banks (ADB, AfDB, IADB), whose trust funds fall invariably in the category ‘regional’.
The information on mitigation related trust funds is more revealing, however. In line with the consideration that climate change mitigation is usually not very efficient in the poorest countries, there are hardly any mitigation trust funds focusing exclusively on IDA eligible recipients. In the second part of the table that considers only those trust funds that fully focus on climate change related activities (‘high relevance’), these are only 3% (as opposed to 31% for adaptation trust funds). This contrasts strongly with the result by Castro et al. [16] for bilateral donors, whose geographic allocation of mitigation aid remains strongly influenced by the allocation of their overall development assistance.
This greater consideration of efficiency concerns by the MDB’s mitigation trust funds may be driven by the dominance of carbon funds observed above. Carbon funds differ from other trust funds in that the efficiency of their investments directly matters for the individual funders. They can use the emission credits generated by these investments to fulfill their national emission reduction commitments, and thus their obligations in the framework of the Kyoto Protocol (and expect to use them in the context of the Paris Agreement in the future). There is hence a clear financial incentive for funders to select efficient locations, and the literature suggests that the World Bank at least has taken full advantage of its knowledge in this respect [11,26,41]. In contrast, climate finance through bilateral aid or aid channeled through any of the other MDB trust funds does not generate emission reduction credits. Furthermore, all resources spent for climate finance can be accounted for as ODA, no matter whether they are spent efficiently or not.
Of course, the issue remains that for most MDB trust funds—those without detailed disbursement data—we do not know about the location of their funding. 75% of MDB trust funds with a clear focus on mitigation can be active globally, without limitations. Information on individual disbursements is required to examine the allocation of their resources. We thus proceed with an assessment of these disbursements.
3.2. Analysis of Trust Fund Allocations Based on Disbursement Data
This section presents results from a panel analysis comparing allocations of climate-related trust funds at the World Bank with those from bilateral DAC donors in 2009–18. Table 4 presents the results, first for mitigation (Table 4), then for adaptation (Table 5). In each of these tables, the first part considers disbursements by all relevant trust funds, while the second part considers only those identified as highly relevant. In each case, the tables also present a comparison to the allocation of bilateral ODA with climate change mitigation (Table 4) and adaptation (Table 5). For comparison with disbursements of trust funds that are highly relevant for climate change, we consider ODA with mitigation or adaptation as its principal objective; for a comparison with disbursements of all relevant trust funds, we consider ODA, for which mitigation or adaptation are at least a significant objective. In line with Bagchi et al. [18] and the general aid allocation literature, we use commitments, rather than disbursements for mitigation and adaptation aid, because they better capture the donors’ intent. For MDB trust funds, however, we must rely on disbursements, because data on commitments for specific recipients are not available. We control for population in all regressions and enter government effectiveness as an additional control in some regressions as a robustness test. Our results are qualitatively unaffected when using alternative governance indicators, such as regulatory quality or control of corruption, available from the World Bank Governance Indicators.
Table 4 shows that World Bank trust funds tend to allocate their funding in line with both poverty criteria—gross domestic product (GDP) per capita is generally negatively linked to funding—and efficiency—as measured by the market-based indicator, i.e., the CERs (in tCO2e) expected from registered CDM projects. The allocation thereby follows very similar lines as the allocation of mitigation-related ODA. While for both variables, the coefficient estimates tend to be much higher than for bilateral aid, this is due to the fact that, in a large majority of country-years, trust fund disbursements are zero. The large number of zeros implies that the relative change reflected in the size of the coefficients (which are elasticities since the variables are in logs) appears to be bigger. It also implies that the Tobit for World Bank trust funds captures mostly the binary decision whether at all a country should receive funding, and not so much the decision on how much it should receive.
When comparing the left to the right side of the table, it appears that—as opposed to bilateral donors—the Bank focused more on efficiency and less on poverty for those activities most clearly focused on mitigation. This makes sense, as it is only for activities with a clear global public good character that the locality of implementation does not matter. This argument is somewhat diluted for activities with multiple objectives, such as those included on the left side of the table. Some local co-benefits may be relevant in either case, so that this does not make the comparison less relevant.
However, the numbers for highly relevant mitigation disbursements by World Bank trust funds must be interpreted with a lot of caution. As shown by the number of censored observations below the table, for this category, there are only 17 out of 1507 country-year observations with strictly positive values. They refer to just a handful of recipients, namely Brazil (during five years), Liberia (during four years), Guyana (during three years), South Africa (during two years), as well as Cameroon, the Central African Republic, and the Republic of Congo (during one year each). The lack of variation on the dependent variable leads to a lack of robustness in the estimation results (see, e.g., Regression 7 where government effectiveness is introduced as an additional control). To be sure, we can thus look directly at the statistics for the countries concerned. They confirm the previous discussion: only the Central African Republic and Liberia are low-income countries, the other three (with the majority of the disbursements) are middle-income countries—in the case of Brazil and South Africa, even upper middle-income countries. The latter are also known as top destinations for CDM projects, and hence the generation of CERs. However, when looking into the relevant disbursements more closely, we find that all but the funding for South Africa is forestry related. This type of projects obviously follows a different logic than other mitigation activities: only afforestation and reforestation projects (not avoided deforestation and improved forest management) are included in the CDM and can only generate CERs that have an expiration date. Moreover, the mitigation opportunities provided by forestry projects do not depend on the level of economic development and industrialization of the host country. Hence, for mitigation activities related to forestry, poor countries can also be very efficient locations, and the income level does not really matter.
Overall, regarding mitigation, the limited evidence available to us thus suggests that trust fund resources are allocated relatively efficiently, and that this does not only hold for carbon funds where investments can be driven by direct financial incentives, but also for other mitigation trust funds.
For adaptation funds, the results are more puzzling. While Table 5 again shows a high negative coefficient for GDP per capita when looking at all relevant disbursements, the effect is in no way stronger for adaptation funds than for mitigation funds. As opposed to mitigation, locality matters strongly for adaptation, and support should thus be given in line with financial needs and other vulnerabilities. Just as we observe for bilateral donors, one would thus expect to see a stronger negative correlation between funding and per capita income for adaptation than for mitigation activities. In contrast, for those trust funds that are highly relevant for adaptation, the coefficient for GDP per capita becomes generally positive, and even significantly so in Regression 2. At first glance, these results seem to contradict the results of Table 3, which showed that almost one third of the MDBs’ adaptation trusts focused on IDA eligible recipients. Yet, this still leaves another two thirds of adaptation funds with global or regional focus that may predominantly cater for wealthier countries. Furthermore, while adaptation funds with a focus on IDA-eligible countries are relatively numerous, they seem to be quite small, so that other funds dominate in terms of disbursements.
Besides these somewhat unsettling results about the lack of poverty orientation, we find that the indicators directly measuring climate change vulnerability are mostly insignificant (except for Regression 10). The indicators shown in Table 5 are the standard Notre Dame country index (ND-GAIN), combining the dimensions “vulnerability” and “readiness” (the higher, the less vulnerable and/or better prepared for adaptation), and the share of land below an elevation of 5m (to separately capture some physical vulnerability). Alternative indicators, such as the population, share below an elevation of 5m, agricultural value added (as a proxy of the share of the economy directly dependent on climatic factors) and the vulnerability sub-index of ND-GAIN have also been tested and yielded no significant results either (not shown).
In contrast, for bilateral aid, ND-GAIN is clearly significant. However, the positive coefficient suggests that donors allocate more ODA to those countries that are less vulnerable or already better prepared to face climate change. When breaking up ND-GAIN into its two main components, it becomes clear that the effect is driven by the readiness component. This component is supposed to capture the economic, institutional and social conditions that make a country attractive for external funding. The strongly positive coefficient simply confirms this attractiveness for foreign aid. In the way it is measured, it is linked to well-known factors of bilateral donor-interest, namely access to an interesting market and promising investment opportunities. All indicators related to vulnerability itself are insignificant for bilateral donors.
The CER variable should, in principle, have no role to play for the allocation of adaptation funding, but we add it for comparison with Table 4. Intriguingly, we do find a strong relationship with trust fund disbursements. While we find a significant effect for bilateral ODA as well, this can be explained more easily, as it could also capture some dimensions of bilateral donors’ interest in cooperation, with countries that are interesting partners for trade and investment. These variables are not only correlated with the ND-GAIN readiness component, but also with opportunities for the CDM. However, what drives the preference of World Bank adaptation trust funds to invest in these countries?
In any case, it seems that the World Bank trust fund allocation decisions for mitigation and adaptation funds are all too similar, suggesting that there could be substantial efficiency gains for adaptation funds if they allocated their resources much more clearly according to need. The same is partially true for bilateral ODA, but there at least, we see some more appropriate differentiation between adaptation and mitigation finance, with a clear focus on poverty in the area of adaptation.
It is also striking that World Bank trust funds with high relevance for adaptation seem to focus on recipients that are already quite well governed. If the Bank’s trust funds were complementary to other funding by focusing more strongly on capacity building activities, why would they do this in countries where capacity is already high? Assuming decreasing marginal benefits of such a support, government enabling activities should be most efficient where existing capacity is low. However, it remains to be seen how strongly the trust funds of the World Bank, and of MDBs more generally, are really involved in capacity building activities.
3.3. Focus on Capacity Building
To identify whether the activities of a trust fund focus on capacity building, we again examine the data, both at trust fund level and with respect to individual disbursements. At trust fund level, we went through the individual trust fund names in our database and carried out an additional web search about their activities in case the names were not sufficiently clear. Table 6 shows those trust funds for which we identified a focus on capacity building based on this analysis, along with their geographic and thematic orientation, the responsible organization and their period of activity (as far as available).
We found 16 such funds, mostly run by the World Bank, but also one by each of the regional development banks that we cover, and one FIF in which several MDBs are involved. Most of the capacity building effort seems to be directed towards mitigation, often related to carbon market activities. As this is the area with the greatest risk that the World Bank could directly crowd out private market activities, a strong focus on an enabling role in this area is a positive sign—unless these enabling activities focus mainly on enabling the Bank’s own market transactions. This could be checked by comparing the geographic allocation of resources by carbon funds with the geographic allocation of capacity building activities. Unfortunately, the information on geographic allocation is available for neither of the two.
Generally, there is little we can learn about which countries receive support from MDB trust funds focusing on capacity building, not even in terms of their income category. Most of the funds in Table 6 are active globally or regionally. None of them specializes specifically on IDA recipients. Hence, a specific focus of the trust funds’ carbon market activities on capacity building in poor countries does not appear to be very plausible.
At the level of disbursements, due to the restricted information available to us, we cannot analyze carbon funds any further. In fact, among all the trust funds in Table 6, we have disbursement information only for one (Geothermal Development in Indonesia: Technical Assistance for Capacity Building Geothermal Development in Indonesia). This is because many of them are Bank executed trust funds that are not covered by the disbursement dataset.
Of course, other funds—even if not dedicated to capacity building only—may also spend significant amounts on this topic. We thus examine the sector identifiers for trust fund disbursements for those funds for which disbursement information is available. The sector name that seems to fit best is “Institutional strengthening and capacity building”, but it has zero positive entries in the database (even for the fund clearly identified as capacity building). We thus focus on other sectors that appear close to what we wish to capture, namely support to public administration, to central government and to sub-national government. For each entry in the disbursement database, we build an indicator that sums up the share of disbursements to these capacity-related subsectors. Figure 2 plots this indicator against the per capita income of the recipient.
It is obvious from the figure that there is no clear relationship between GDP per capita and capacity building disbursements. High shares of disbursements (up to 100%) flow into support for public administration, central or sub-national government, even in countries with a per capita income of 20,000 USD. Clearly, the World Bank’s climate trust funds do not specifically focus these support activities on poor countries.
4. Discussion
Do MDB trust funds do what they should? Using disbursements of climate-related trust funds at the World Bank, the above analysis leaves us with a puzzle: while mitigation trust funds seem to focus on countries with large mitigation opportunities, as they should in order to be efficient, adaptation trust funds show a similar pattern. This is problematic, as efficient adaptation measures should focus on the most vulnerable countries that lack capacity to adjust their economy to climate change. The problem is similar for bilateral ODA, although, at least in terms of the consideration of recipient income, the important differentiation between adaptation and mitigation finance is more marked than for World Bank trust funds. Bilateral adaptation finance clearly prioritizes poor countries. This is not evident at all for the trust funds of the World Bank. This leaves us with the impression that World Bank trust funds, rather than to take a strategic decision for an efficiency-oriented allocation of resources for mitigation as a global public good, indiscriminately favor spending in more advanced economies.
We cannot discern any strategic choice of capacity building activities either. Disbursements for such activities do not seem to be linked to financial needs, as measured by GDP per capita. We do see that many trust funds clearly devoted to capacity building activities are active in the area of carbon markets, which may point at a useful complementarity between Word Bank activities in this area and the activities of the private sector. Yet, they may as well be a useful complement to the World Bank’s own financial transactions on this market, effectively cross-subsidizing its carbon market transactions. As long as disbursement data for carbon funds are kept secret, this suspicion cannot be rejected.
5. Conclusions
Based on the best available dataset on MDB climate trust funds, this paper examined the efficiency of their resource allocation and their possible complementarities to other types of public and private funding. The results are rather sobering. In contrast to bilateral aid, the adaptation finance of these trust funds does not seem to give any priority to countries most strongly in need. In a certain way, this could be seen as a complementarity, but clearly not as one that appears useful from an efficiency perspective.
While efficiency orientation would have suggested major differences, the mitigation finance of MDB trust funds seems to focus on a very similar type of countries. A priori, for mitigation, a lesser need-orientation makes sense, because the benefits of mitigation—as a global public good—are not linked to the locality of project implementation. However, in this area, the MDBs’ activities may crowd out the private sector. This is particularly relevant for carbon finance, where the MBDs’ trust funds are active on the same market as project developers, and buyers and sellers of emission credits, alongside with multiple private banks and consultancy firms. To be complementary to these activities, the MDBs need to focus on the function of an enabler or catalyzer [26] for private investment. The relatively large number of carbon trust funds focusing on capacity building could be a positive signal in this direction, enhancing readiness for climate change mitigation beyond specific carbon market transactions. Yet, as long as there are no data to examine who benefits from these capacity building efforts, some doubt remains. In fact, these funds may just as well promote the MDBs’ own carbon market transactions.
The missing disbursement information for carbon funds is not the only area where lack of data seriously hampers our analysis. MDBs other than the World Bank did not make any disbursement information available to us. Within World Bank data, beyond the carbon funds, we lack not only the details for IFC trust funds (which may be understandable as the IFC funds private-sector transactions), but also the information on Bank executed trust funds. In addition, sector codes are not easy to interpret without further guidance, because different classification systems are used in parallel.
Despite all these problems, the information we collected—supported by a major bilateral donor agency that is itself member of multiple MDB trust funds—is still much more comprehensive than the information available to the public. This lack of transparency represents a major barrier to accountability. Moreover, it seems to be at odds with the official transparency policies of multilateral agencies such as the World Bank see [42].
Given the financial weight that trust funds have gained during the last two decades, the lack of transparency is also problematic for the accountability of development finance more broadly. While individual donors are requested to report their bilateral ODA in detail to the OECD/DAC, funding channeled through trust funds vanishes in a black hole. Hence, donor countries have two options how to fund the same purpose and partner country—one is transparent, while the other is not. In principle, trust funds provide an opportunity to donors to hide all those transactions that might be less appreciated by their citizens. These could, for instance, be financial contributions to countries that are important for commercial or geopolitical reasons, but less so from an adaptation or from a general development perspective. If donors use trust funds in this way, then transparency over the remaining ODA becomes less meaningful, too. In fact, a bilateral donor might be able to show a perfectly need-oriented aid portfolio in the DAC statistics, just because it channels all of its less perfect financial flows through MDB trust funds. (For a more general discussion of the “dirty work hypothesis”, see [43,44].) To avoid such obfuscation, the financial flows of these trust funds should be fully publicly accessible and reported in the same way as bilateral ODA.
Author Contributions
Conceptualization, A.M., K.M., B.R. and I.S.; Methodology, A.M., K.M., B.R. and I.S.; Investigation, K.M., B.R.; Data Curation, K.M., B.R.; Writing—Original Draft Preparation, K.M.; Writing—Review and Editing, A.M., K.M., B.R. and I.S.; Visualization, K.M., B.R.; Project Administration, A.M.; Funding Acquisition, A.M., K.M., B.R. and I.S. All authors have read and agreed to the published version of the manuscript.
Funding
This research received no external funding.
Acknowledgments
We wish to thank the German Agency for International Development (GIZ), notably Ursula Stiegler, for support in reaching out to the different MDBs in the context of a prior report for GIZ. Without this prior work and the data collected, as well as the interviews run in this context, this paper would not have been possible. We also thank the colleagues at the different MDBs and at the German Ministry for Development and Co-operation (BMZ), for sharing their insights in the context of this prior report.
Conflicts of Interest
The authors declare no conflict of interest.
Appendix A

Table A1.
Variable description and data sources (panel data).
| Variable | Obs | Mean | Std. | Min | Max | Description | Source |
|---|---|---|---|---|---|---|---|
| TF-disb. | ln (1+trust fund disbursements in const. 2015 US$) for | ||||||
| Mitigation, high relevance | 1773 | 0.13 | 1.35 | 0.00 | 15.82 | trust funds for which mitigation is highly relevant | World Bank trust fund disbursement database (unpublished) |
| Mitigation, all | 1773 | 0.57 | 2.69 | 0.00 | 16.23 | all mitigation trust funds, high and medium relevance | |
| Adaptation, high relevance | 1773 | 0.54 | 2.66 | 0.00 | 16.76 | trust funds for which adaptation is highly relevant | |
| Adaptation, all | 1773 | 1.43 | 4.08 | 0.00 | 16.76 | all adaptation trust funds, high and medium relevance | |
| ODA | ln (1+official development assistance in const. 2017 US$, commitments) for projects, for which | ||||||
| Mitigation, principal | 1639 | 11.72 | 6.48 | 0.00 | 21.89 | mitigation is the principal objective | [45] |
| Mitigation, all | 1639 | 14.40 | 5.24 | 0.00 | 21.94 | mitigation is the principal or a significant objective | |
| Adaptation, principal | 1194 | 11.75 | 6.23 | 0.00 | 20.01 | adaptation is the principal objective | |
| Adaptation, all | 1192 | 14.93 | 4.95 | 0.00 | 20.85 | adaptation is the principal or a significant objective | |
| Recipient characteristics | |||||||
| GDP per capita | 1570 | 8.72 | 0.98 | 6.43 | 10.83 | ln (GDP per capita, PPP, const. 2011 intl. $) | [46] |
| Population | 1633 | 15.48 | 2.25 | 9.19 | 21.05 | ln (population) | |
| Land below 5 m | 1331 | 4.18 | 9.90 | 0.00 | 55.88 | Land area below an elevation of 5m above sea level | |
| ND-GAIN | 1518 | 43.15 | 8.27 | 15.93 | 62.18 | Country index combining vulnerability and readiness (the higher, the lower is the vulnerability and/or the higher is the readiness) | [47] |
| CERs | 1639 | 6.29 | 6.68 | 0.00 | 20.19 | Certified emission reductions (in tCO2e) projected to be generated within year from registered CDM projects | [22] |
| Gov. effectiveness | 1601 | −0.48 | 0.69 | −2.48 | 1.57 | Government effectiveness (composite indicator: the higher, the more effective) | [48] |
References
- Hoffmann, M.J. Climate Governance at the Crossroads: Experimenting with a Global Response after Kyoto; Oxford University Press: Oxford, UK, 2011. [Google Scholar]
- Keohane, R.O.; Victor, D.G. The regime complex for climate change. Perspect. Politics 2011, 9, 7–23. [Google Scholar] [CrossRef] [Green Version]
- Abbott, K.W. The transnational regime complex for climate change. Environ. Plan. C Gov. Policy 2012, 30, 571–590. [Google Scholar] [CrossRef] [Green Version]
- Reinsberg, B. Fully-automated liberalism? Blockchain technology and international cooperation in an anarchic world. Int. Theory 2020, in press. [Google Scholar] [CrossRef]
- Buchner, B.; Falconer, A.; Hervé-Mignucci, M.; Trabacchi, C.; Brinkman, M. The landscape of climate finance. Clim. Policy Initiat. 2011, 27, 1–70. [Google Scholar]
- Stadelmann, M.; Michaelowa, A.; Roberts, J.T. Difficulties in accounting for private finance in international climate policy. Clim. Policy 2013, 13, 718–737. [Google Scholar] [CrossRef]
- Bécault, E.; Marx, A. The global governance system for climate finance. In Governing the Climate Change Regime: Institutional Integrity and Integrity Systems; Cadman, T., Maguire, R., Sampford, C., Eds.; Taylor & Francis: London, UK, 2017; pp. 93–117. [Google Scholar]
- Bayer, P.; Marcoux, C.; Urpelainen, J. When international organizations bargain: Evidence from the global environment facility. J. Confl. Resolut. 2015, 59, 1074–1100. [Google Scholar] [CrossRef]
- Graham, E.; Thompson, A. Efficient orchestration? The Global Environment Facility in the governance of climate adaptation. In International Organizations as Orchestrators; Abbott, K., Genschel, P., Snidal, D., Zangl, B., Eds.; Cambridge University Press: New York, NY, USA, 2015; pp. 114–138. [Google Scholar]
- Barder, O.; Ritchie, E.; Rogerson, A. Contractors or Collectives? Earmarked Funding of Multilaterals, Donor Needs, and Institutional Integrity: The World Bank as a Case Study. CGD Policy Paper 2019, 153, 1–34. [Google Scholar]
- Michaelowa, A.; Michaelowa, K. Climate Business for Poverty Reduction? The Role of the World Bank. Rev. Int. Organ. 2011, 6, 259–286. [Google Scholar] [CrossRef]
- McKinley, R.; Little, R. A Foreign Policy Model of U.S. Bilateral Aid Allocation. World Politics 1977, 30, 58–86. [Google Scholar] [CrossRef]
- McKinley, R. The German Aid Relationship: A Test of the Recipient Need and the Donor Interest Models of the Distribution of German Bilateral Aid 1961-70. Eur. J. Political Res. 1978, 6, 235–257. [Google Scholar] [CrossRef]
- Dreher, A.; Kilby, C. The Impact of Aid on Growth Revisited: Do Donor Motives Matter? Econ. Lett. 2010, 107, 338–340. [Google Scholar]
- Dreher, A.; Eichenauer, V.; Gehring, K. Geopolitics, Aid, and Growth: The Impact of UN Security Council Membership on the Effectiveness of Aid. World Bank Econ. Rev. 2018, 32, 268–286. [Google Scholar]
- Castro, P.; Michaelowa, K.; Namhata, C. Donor Accountability Reconsidered: Aid Allocation in the Age of Global Public Goods. In Proceedings of the Presentation at Political Economy of International Organizations, Vancouver, BC, Canada, 20–22 February 2020. [Google Scholar]
- Michaelowa, K.; Michaelowa, A. Development Co-operation and Climate Change: Political-Economic Determinants of Adaptation Aid. In Carbon Markets or Climate Finance; Michaelowa, A., Ed.; Routledge: London, UK, 2012; pp. 39–52. [Google Scholar]
- Bagchi, C.; Castro, P.; Michaelowa, K. Donor Accountability Reconsidered: Aid Allocation in the Age of Global Public Goods; CIS Working Paper No. 87; Center for Comparative and International Studies: Zurich, Switzerland, 2016. [Google Scholar]
- Betzold, C.; Weiler, F. Development Aid and Adaptation to Climate Change in Developing Countries, 1st ed.; Palgrave Macmillan: Cham, Switzerland, 2018. [Google Scholar]
- Smit, B.; Wandel, J. Adaptation, adaptive capacity, and vulnerability. Glob. Environ. Chang. 2006, 16, 282–292. [Google Scholar] [CrossRef]
- Michaelowa, A.; Michaelowa, K. Does Human Development Really Require Greenhouse Gas Emissions? In Rethinking Development in a Carbon-Constrained World: Development Cooperation and Climate Change; Palosuo, E., Ed.; Ministry of Foreign Affairs of Finland: Helsinki, Finland, 2009; pp. 170–183. [Google Scholar]
- UNEP DTU CDM Pipeline Analysis and Database. Available online: http://www.cdmpipeline.org/ (accessed on 3 June 2020).
- Ghosh, A.; Kharas, H. The money trail: Ranking donor transparency in foreign aid. World Dev. 2011, 39, 1918–1929. [Google Scholar] [CrossRef]
- Knack, S.; Rogers, F.H.; Eubank, N. Aid Quality and Donor Rankings. World Dev. 2011, 39, 1907–1917. [Google Scholar] [CrossRef] [Green Version]
- Roodman, D. The Commitment to Development Index: 2011 Edition; Centre for Global Development: Washington, DC, USA, 2011. [Google Scholar]
- Michaelowa, A.; Michaelowa, K.; Shishlov, I.; Brescia, D. Catalysing Private Action for Climate Change Mitigation: The World Bank’s Role in International Carbon Markets. Clim. Policy 2020, in press. [Google Scholar]
- World Bank. Scaling Up Carbon Finance: A Note on Status and Strategic Directions of Carbon Finance Operations in the World Bank; The World Bank: Washington, DC, USA, 2003.
- Reinsberg, B.; Michaelowa, K.; Eichenauer, V. The Rise of Multi-bi Aid and the Proliferation of Trust Funds. In Handbook on the Economics of Foreign Aid; Avin, M., Ed.; Edward Elgar: Cheltenham, UK, 2015; pp. 527–554. [Google Scholar]
- Graham, E. Money and Multilateralism: How Funding Rules Constitute IO Governance. Int. Theory 2015, 7, 162–194. [Google Scholar] [CrossRef]
- Reinsberg, B.; Michaelowa, K.; Knack, S. Which Donors, Which Funds? The Choice of Multilateral Funds by Bilateral Donors at the World Bank. Int. Organ. 2017, 71, 767–802. [Google Scholar] [CrossRef] [Green Version]
- Eichenauer, V.; Reinsberg, B. What Determines Earmarked Funding to International Development Organizations? Evidence from the New Multi-bi Aid Data. Rev. Int. Organ. 2017, 12, 171–197. [Google Scholar] [CrossRef] [Green Version]
- Smyth, S. The Prototype Carbon Fund: A new departure in international trusts and securities law. McGill J. Sustain. Dev. Law 2005, 5, 28–37. [Google Scholar]
- Matz, N. Financial Institutions between Effectiveness and Legitimacy—A Legal Analysis of the World Bank, Global Environment Facility and Prototype Carbon Fund. Int. Environ. Agreem. 2005, 5, 265–303. [Google Scholar] [CrossRef]
- Zhang, Z. The World Bank’s Prototype Carbon Fund and China. J. Energy Dev. 2006, 31, 157–172. [Google Scholar]
- Reinsberg, B.; Shishlov, I.; Michaelowa, K.; Michaelowa, A. Climate Change-Related Trust Funds at the Multilateral Development Banks; Study on behalf of the German Agency for International Development (GIZ); Internationale Zusammenarbeit (GIZ) GmbH: Bonn, Germany, 2020. [Google Scholar]
- Hicks, R.L.; Parks, B.C.; Roberts, J.T.; Tierney, M.J. Greening aid? In Understanding the Environmental Impact of Development Assistance; Oxford University Press: Oxford, UK, 2010. [Google Scholar]
- Lancaster, C. Foreign Aid: Diplomacy, Development, Domestic Politics; University of Chicago Press: Chicago, IL, USA, 2008. [Google Scholar]
- Reinsberg, B. Do Countries Use Foreign Aid to Buy Geopolitical Influence? Evidence from Donor Campaigns for Temporary UN Security Council Seats. Politics Gov. 2019, 7, 127–154. [Google Scholar] [CrossRef] [Green Version]
- Reinsberg, B. Foreign aid responses to political liberalization. World Dev. 2015, 75, 46–61. [Google Scholar] [CrossRef]
- World Bank IDA Borrowing Countries. Available online: https://ida.worldbank.org/about/borrowing-countries (accessed on 2 June 2020).
- Michaelowa, A.; Shishlov, I.; Brescia, D. Evolution of international carbon markets: Lessons for the Paris Agreement. Wiley Interdiscip. Rev. Clim. Chang. 2019, 10, e613. [Google Scholar] [CrossRef] [Green Version]
- World Bank. Toward Greater Transparency through Access to Information: The World Bank’s Disclosure Policy; World Bank Group: Washington, DC, USA, 2009.
- Abbott, K.; Snidal, D. Why States Act through Formal International Organizations. J. Confl. Resolut. 1998, 42, 3–32. [Google Scholar] [CrossRef]
- Dreher, A.; Lang, V.; Rosendorff, P.; Vreeland, J. Buying Votes and International Organizations: The Dirty Work-Hypothesis; CESifo Working Paper Series 7329; CESifo: Munich, Germany, 2018. [Google Scholar]
- OECD Official Development Assistance, Commitments to Countries and Regions [DAC3a]. Available online: http://stats.oecd.org/Index.aspx?datasetcode=TABLE3A# (accessed on 26 September 2019).
- World Bank World Development Indicators. Available online: http://databank.worldbank.org (accessed on 26 September 2019).
- Notre Dame Global Adaptation Initiative Country Index. Available online: https://gain.nd.edu/our-work/country-index/methodology/ (accessed on 26 September 2019).
- World Bank Worldwide Governance Indicators (WGI). Available online: https://info.worldbank.org/governance/wgi/ (accessed on 2 June 2020).
Figure 1.
Number of active trust funds, by fiscal year and thematic orientation. Note: The figure includes all trust funds for which information on the start and the end year was available. This notably excludes all 21 trust funds of the International Finance Corporation (IFC). The definition of ‘fiscal years’ differs between the World Bank and FIFs (1 July to 30 June), and the other MDBs, for which they align with calendar years. We ignore these differences here to avoid unnecessary complexity in the presentation.

Figure 2.
The share of capacity building disbursements by recipient income. Note: Each dot corresponds to one disbursement from the World Bank’s trust fund disbursement database (for all climate trust funds included in the database).
Figure 2.
The share of capacity building disbursements by recipient income. Note: Each dot corresponds to one disbursement from the World Bank’s trust fund disbursement database (for all climate trust funds included in the database).
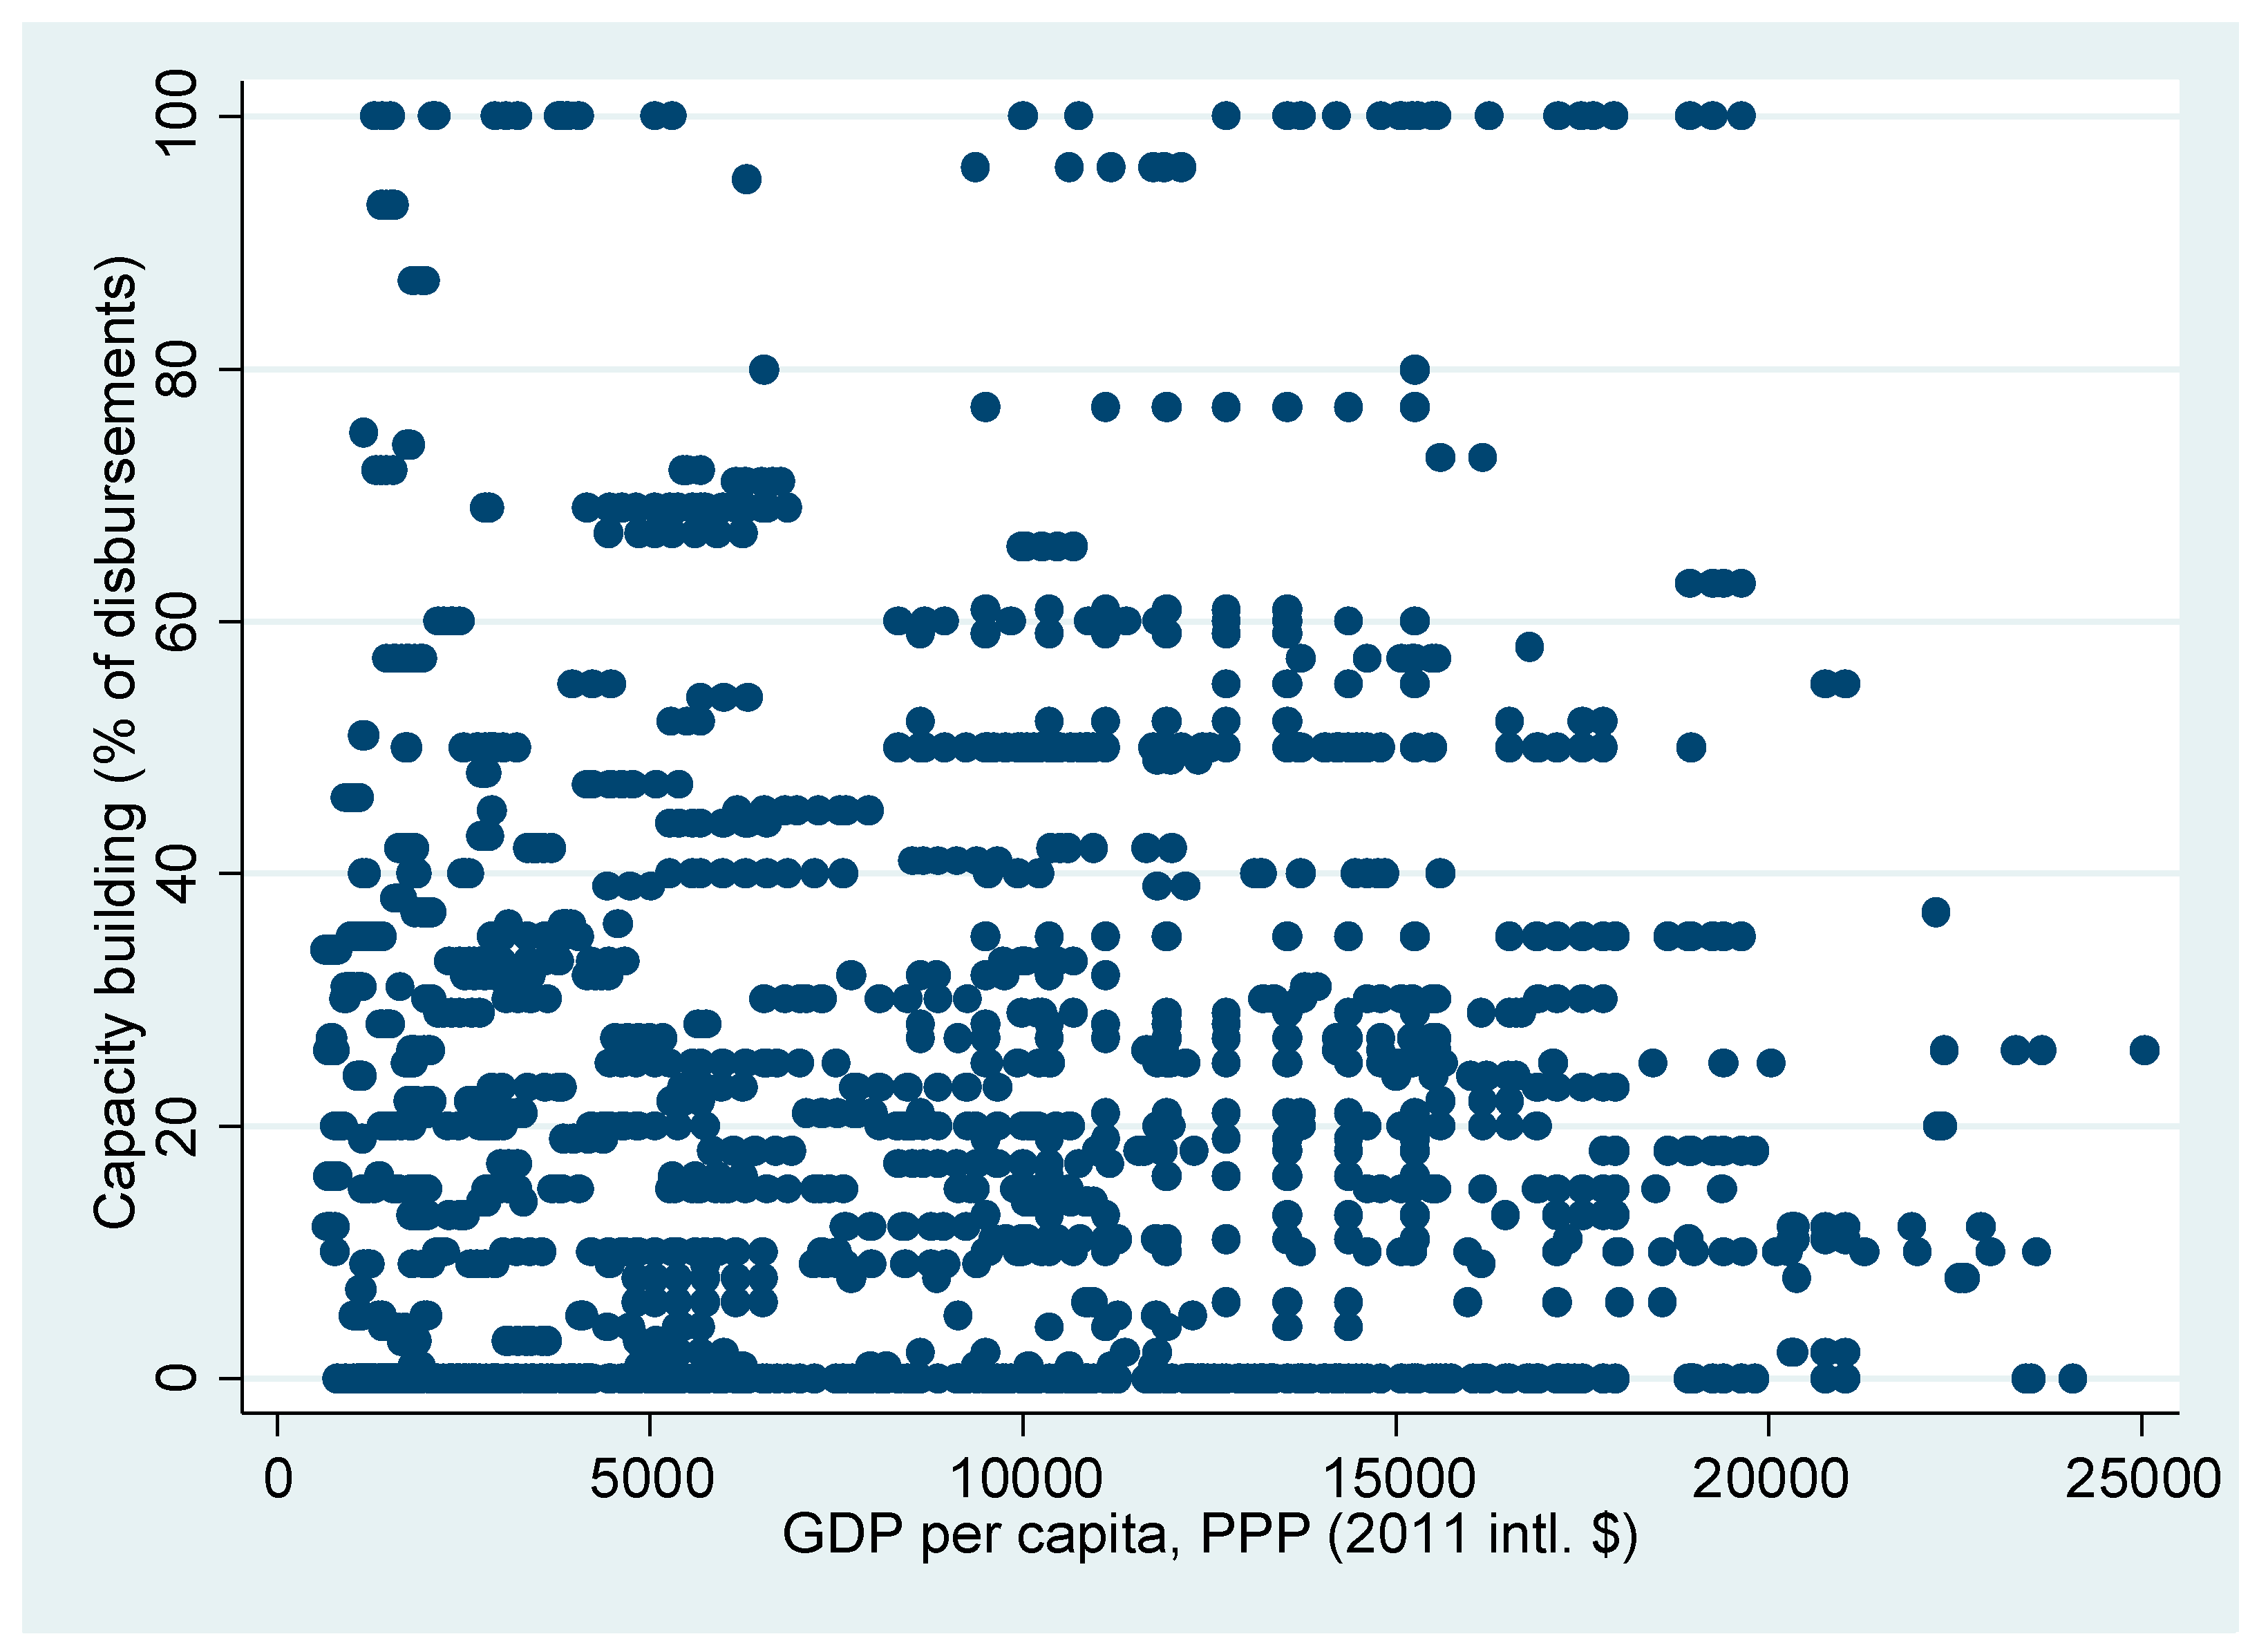
Table 1.
Overview of climate-related Financial Intermediary Funds (FIFs) and multilateral development bank (MDB) trust funds.
Table 1.
Overview of climate-related Financial Intermediary Funds (FIFs) and multilateral development bank (MDB) trust funds.
| Institution | Number of Trust Funds | Number of Programs | Size (Million US$) |
|---|---|---|---|
| FIFs | 12 | 12 | 33,777 |
| World Bank | 161 | 100 | 6358 |
| Asian Development Bank (ADB) | 22 | 19 | 1216 |
| Inter-American Development Bank (IADB) | 15 | 15 | 726 |
| African Development Bank (AfDB) | 6 | 6 | 316 |
| Total | 216 | 152 | 42,393 |
Notes: Numbers reflect complete records but are over different time periods, subject to data availability: FIFs (1991–2019), World Bank (1992–2019), ADB (2001–2019), IADB (1998–2019), AfDB (2008–2019). The numbers also include funds that are not active anymore. Moreover, ‘Programs’ refers to a categorization introduced by the authors to regroup trust funds focusing on the same topic, such as several trust funds succeeding each other based on a very similar agenda, or trust funds that are separate only due to specific administrative requirements of some of their funders. Source: [35] (20).
Table 2.
Top-ten trust funds at MDBs.
| Trust Fund Name | Trust Fund Size 1 | |
|---|---|---|
| World Bank | ||
| 1 | Global Environment Facility Trust Fund 2 | 2320.7 |
| 2 | First Tranche of the Umbrella Carbon Facility | 833.7 |
| 3 | Strategic Climate Fund 2 | 597.9 |
| 4 | Carbon Fund of the Forest Carbon Partnership Facility | 593.0 |
| 5 | Readiness Fund of the Forest Carbon Partnership Facility | 315.5 |
| 6 | Transformative Carbon Asset Facility | 212.2 |
| 7 | Prototype Carbon Fund | 206.1 |
| 8 | Third Tranche of the BioCarbon Fund (BioCFT3) | 204.6 |
| 9 | Carbon Fund of the Forest Carbon Partnership Facility | 200.5 |
| 10 | Multi Donor Trust Fund for Mainstreaming Disaster Reduction Initiative of the Global Facility for Disaster Reduction and Recovery | 199.2 |
| Asian Development Bank | ||
| 1 | Clean Technology Fund 2 | 490.2 |
| 2 | Strategic Climate Fund 2 | 243.9 |
| 3 | Canadian Climate Fund for the Private Sector in Asia (CFPS) II | 149.5 |
| 4 | Urban Climate Change Resilience Trust Fund (UCCRTF) | 149.4 |
| 5 | Global Environment Facility Trust Fund 2 | 135.1 |
| 6 | Clean Energy Fund (CEF) | 122.0 |
| 7 | Future Carbon Fund | 115.0 |
| 8 | Canadian Climate Fund for the Private Sector in Asia (CFPS) I | 77.8 |
| 9 | Climate Change Fund | 74.0 |
| 10 | Carbon Capture and Storage Fund (CCSF) | 70.9 |
| Inter-American Development Bank | ||
| 1 | Clean Technology Fund 2 | 346.9 |
| 2 | Canadian Climate Fund for the Private Sector in the Americas (C2F) | 249.5 |
| 3 | OC-SDP for Sustainability II | 207.7 |
| 4 | Global Environment Facility Trust Fund 2 | 203.0 |
| 5 | Strategic Climate Fund 2 | 140.8 |
| 6 | UK Sustainable Infrastructure Program | 68.9 |
| 7 | Sustainable Energy and Climate Change Initiative (SECCI) | 55.3 |
| 8 | Biodiversity/Natural Capital Lab | 25.0 |
| 9 | UK Low Carbon Agriculture to Avoid Deforestation Fund | 22.3 |
| 10 | Colombia Sostenible | 21.7 |
| African Development Bank 3 | ||
| 1 | Clean Technology Fund 2 | 388.6 |
| 2 | Strategic Climate Fund 2 | 137.0 |
| 3 | Sustainable Energy for Africa (SEFA) | 106.0 |
| 4 | Least Developed Countries Fund 2 | 60.2 |
| 5 | Global Environment Facility Trust Fund 2 | 36.7 |
| 6 | Clim-dev Africa Fund (CDSF) | 27.1 |
| 7 | Africa Climate Change Fund (ACCF) | 12.7 |
| 8 | Special Climate Change Fund 2 | 5.5 |
| 9 | Adaptation Fund 2 | 4.5 |
1 Trust fund size refers to cumulative contributions in million USD since inception, with different coverage periods across MDBs: World Bank (fiscal years 2000–2019), ADB (2001–2019), IADB (1998–2019), AfDB (2010–2019). See exception for implementing accounts below. 2 Rather than autonomous trust funds, these funds are implementing accounts under FIFs for which the MDB is an implementing agency. Associated size refers to total receipts by the MDB in 2009–2018. 3 The nine funds listed reflect the entire set of AfDB trust funds (3) and FIF implementing accounts (6).
Table 3.
Geographic orientation of trust funds.
| Mitigation Trust Funds | Adaptation Trust Funds | Climate Change General | |
|---|---|---|---|
| All climate change trust funds (total: 216) | |||
| Number of trust funds | 124 | 47 | 45 |
| of which | |||
| for IDA eligible countries | 6% | 11% | 2% |
| for International Bank for Reconstruction and Development (IBRD) countries | 19% | 4% | 4% |
| for blend countries | 2% | 6% | 2% |
| Regional | 23% | 30% | 49% |
| Global | 51% | 49% | 42% |
| High relevance for climate change (total: 109) | |||
| Number of trust funds | 64 | 16 | 29 |
| of which | |||
| for IDA eligible countries | 3.1% | 31.3% | 3.4% |
| for IBRD countries | 4.7% | 0.0% | 0.0% |
| for blend countries | 0.0% | 0.0% | 3.4% |
| Regional | 17.2% | 31.3% | 48.3% |
| Global | 75.0% | 37.5% | 44.8% |
Note: Information on commitments for individual funds is too sketchy for a value-weighted presentation of these numbers.
Table 4.
Correlates of disbursements by World Bank mitigation trust funds and bilateral mitigation finance.
Table 4.
Correlates of disbursements by World Bank mitigation trust funds and bilateral mitigation finance.
| (1) | (2) | (3) | (4) | (5) | (6) | (7) | (8) | |
|---|---|---|---|---|---|---|---|---|
| High or Medium Relevance for Mitigation | High Relevance for Mitigation | |||||||
| TF-disb. | TF-disb. | TF-disb. | ODA | TF-disb. | TF-disb. | TF-disb. | ODA | |
| GDP per capita | −5.23 * | −6.59 ** | −8.70 ** | −1.67 *** | −3.35 | −7.78 | 0.62 | −2.38 *** |
| (0.08) | (0.04) | (0.03) | (0.00) | (0.51) | (0.31) | (0.93) | (0.00) | |
| Population | 4.58 *** | 3.13 * | 3.17 * | 0.98 *** | 2.76 | 0.52 | 0.25 | 1.42 *** |
| (0.01) | (0.09) | (0.07) | (0.00) | (0.34) | (0.89) | (0.94) | (0.00) | |
| CERs | 0.69 * | 0.62 | 0.08 *** | 1.53 * | 1.52* | 0.07 * | ||
| (0.07) | (0.11) | (0.00) | (0.10) | (0.07) | (0.07) | |||
| Gov. effectiveness | 6.06 | 0.72 * | −18.04 | 2.05 *** | ||||
| (0.28) | (0.08) | (0.14) | (0.00) | |||||
| Observations | 1507 | 1507 | 1477 | 1399 | 1507 | 1507 | 1477 | 1399 |
| Recipients | 145 | 145 | 142 | 142 | 145 | 145 | 142 | 142 |
| Censored obs. | 1429 | 1429 | 1399 | 114 | 1490 | 1490 | 1460 | 244 |
| Log likelihood | −481 | −479 | −479 | −3547 | −127 | −125 | −124 | −3797 |
| AIC | 972 | 971 | 971 | 7108 | 263 | 262 | 261 | 7608 |
Notes: Random effects Tobit models. p-values in parentheses (* p < 0.1, ** p < 0.5, *** p < 0.01). Trust fund disbursements (TF-disb.), GDP per capita, Population and CERs are in logs so that coefficients can be interpreted as elasticities. All right-hand side variables are lagged by one period. TF-disb. is available until 30 June 2018 (fiscal year 2018), ODA is available until 30 December 2017. For the sake of comparison with bilateral ODA, trust fund disbursements to non-developing countries are excluded from the analysis. See Appendix A for a detailed variable description.
Table 5.
Correlates of disbursements by World Bank adaptation trust funds and bilateral adaptation finance.
Table 5.
Correlates of disbursements by World Bank adaptation trust funds and bilateral adaptation finance.
| (1) | (2) | (3) | (4) | (5) | (6) | (7) | (8) | (9) | (10) | (11) | (12) | |
|---|---|---|---|---|---|---|---|---|---|---|---|---|
| High or Medium Relevance for Adaptation | High Relevance for Adaptation | |||||||||||
| TF-disb. | TF-disb. | TF-disb. | TF-disb. | ODA | ODA | TF-disb. | TF-disb. | TF-disb. | TF-disb. | ODA | ODA. | |
| GDP per capita | −1.51 | −7.17 * | −7.06 * | −7.44 * | −3.49 *** | −3.56 *** | 3.79 | 8.34 * | 5.91 | 5.62 | −5.11 *** | −5.41 *** |
| (0.50) | (0.07) | (0.07) | (0.05) | (0.00) | (0.00) | (0.26) | (0.09) | (0.39) | (0.46) | (0.00) | (0.00) | |
| Population | 2.74 *** | 2.96 *** | 2.92 *** | −0.21 | 0.74 *** | 1.03 *** | 2.94 * | 0.27 | 4.35 ** | 0.59 | 0.90 *** | 1.46 *** |
| (0.01) | (0.01) | (0.01) | (0.86) | (0.00) | (0.00) | (0.09) | (0.81) | (0.03) | (0.79) | (0.00) | (0.00) | |
| Land below 5 m | 0.52 | 0.49 | 0.53 | −0.04 | −0.04 | 0.07 | 0.09 | 0.20 | 0.09 | 0.09 | ||
| (0.20) | (0.23) | (0.16) | (0.55) | (0.54) | (0.86) | (0.88) | (0.75) | (0.23) | (0.29) | |||
| ND-GAIN | 0.28 | 0.13 | −0.30 | 0.17 ** | 0.21 ** | −0.72 | −1.68 | −2.25 ** | 0.22 * | 0.30 ** | ||
| (0.55) | (0.83) | (0.60) | (0.04) | (0.01) | (0.21) | (0.12) | (0.04) | (0.05) | (0.01) | |||
| Gov. effectiveness | 2.09 | 2.86 | −0.40 | −0.33 | 18.57 ** | 19.89 ** | 0.82 | 1.05 | ||||
| (0.65) | (0.52) | (0.51) | (0.60) | (0.03) | (0.02) | (0.36) | (0.26) | |||||
| CERs | 1.37 *** | 0.13 *** | 1.71 *** | 0.25 *** | ||||||||
| (0.00) | (0.00) | (0.01) | (0.00) | |||||||||
| Observations | 1507 | 1133 | 1133 | 1133 | 858 | 858 | 1507 | 1133 | 1133 | 1133 | 859 | 859 |
| Recipients | 145 | 109 | 109 | 109 | 109 | 109 | 145 | 109 | 109 | 109 | 109 | 109 |
| Censored obs. | 1326 | 978 | 978 | 978 | 77 | 77 | 1435 | 1068 | 1068 | 1068 | 169 | 169 |
| Log likelihood | −1021 | −865 | −865 | −854 | −2106 | −2100 | −434 | −409 | −378 | −373 | −2268 | −2277 |
| AIC | 2053 | 1744 | 1746 | 1726 | 4228 | 4217 | 879 | 832 | 772 | 765 | 4554 | 4571 |
Notes: Random effects Tobit models. p-values in parentheses (* p < 0.1, ** p < 0.5, *** p < 0.01). Trust fund disbursements (TF-disb.), GDP per capita, Population and CERs are in logs so that coefficients can be interpreted as elasticities. All right-hand side variables are lagged by one period. TF-disb. is available until 30 June 2018 (fiscal year 2018), ODA is available until 30 December 2017. For the sake of comparison with bilateral ODA, trust fund disbursements to non-developing countries are excluded from the analysis. See Appendix A for a detailed variable description.
Table 6.
Trust funds with capacity building focus.
| Trust Fund Name | Responsible Organization | Geographic Orientation | Thematic Orientation | Period of Activity |
|---|---|---|---|---|
| Ireland Trust Fund for Building Climate Change and Disaster Resilience in Small Island Developing States | ADB | regional | Adaptation | 2019–2024 |
| Africa Carbon Support Program | AfDB | regional | Mitigation | n.a. |
| NDC Pipeline Accelerator | IADB | regional | Mitigation | 2017 |
| Capacity Building Initiative for Transparency Fund | FIF | global | Mitigation | 2016–2024 |
| BioCFplus Technical Assistance and Capacity Building Fund | WBG | global | Mitigation | 2015–2020 |
| Biocarbon Technical Assistance Trust Fund | WBG | global | Mitigation | 2003–2020 |
| Carbon Finance Assist Trust Fund | WBG | global | Mitigation | 2016–2019 |
| Carbon Initiative for Development Readiness Fund | WBG | global | Mitigation | 2013–2025 |
| Climate Change Advisory Services relating to the Facility for Sustainable Business Advisory Services (SBAS) | WBG | global | Climate change general | n.a. |
| Geothermal Development in Indonesia: Technical Assistance for Capacity Building Trust Fund | WBG | IBRD recipients | Mitigation | 2011–2017 |
| Multi-Donor Trust Fund for Economics of Adaptation to Climate Change | WBG | global | Adaptation | 2009–2010 |
| Nationally Determined Contributions Support Facility | WBG | global | Mitigation | 2016–2019 |
| Partnership for Market Readiness (PMR) Multi Donor Trust Fund | WBG | global | Mitigation | 2011–2021 |
| Readiness Fund of the Forest Carbon Partnership Facility | WBG | global | Mitigation | 2008–2021 |
| Readiness Fund of the Forest Carbon Partnership Facility | WBG | global | Mitigation | 2017–2021 |
| Renewable Energy Advisory Services Program for Africa | WBG | regional | Mitigation | n.a. |
© 2020 by the authors. Licensee MDPI, Basel, Switzerland. This article is an open access article distributed under the terms and conditions of the Creative Commons Attribution (CC BY) license (http://creativecommons.org/licenses/by/4.0/).
Share and Cite
MDPI and ACS Style
Michaelowa, K.; Michaelowa, A.; Reinsberg, B.; Shishlov, I. Do Multilateral Development Bank Trust Funds Allocate Climate Finance Efficiently? Sustainability 2020, 12, 5529. https://0-doi-org.brum.beds.ac.uk/10.3390/su12145529
AMA Style
Michaelowa K, Michaelowa A, Reinsberg B, Shishlov I. Do Multilateral Development Bank Trust Funds Allocate Climate Finance Efficiently? Sustainability. 2020; 12(14):5529. https://0-doi-org.brum.beds.ac.uk/10.3390/su12145529
Chicago/Turabian StyleMichaelowa, Katharina, Axel Michaelowa, Bernhard Reinsberg, and Igor Shishlov. 2020. "Do Multilateral Development Bank Trust Funds Allocate Climate Finance Efficiently?" Sustainability 12, no. 14: 5529. https://0-doi-org.brum.beds.ac.uk/10.3390/su12145529
Note that from the first issue of 2016, this journal uses article numbers instead of page numbers. See further details here.