Article

Environmental Risk Assessment of Living Modified Microorganisms (LMM) on the Indigenous Microbial Community

1
Department of Agricultural Biotechnology and Research Institute of Agriculture and Life Sciences, Seoul National University, Seoul 08826, Korea
2
Department of Biological Science, College of Science and Engineering, Sangji University, Wonju-si 26339, Korea
3
Bio-Living Engineering Major, Global Leaders College, Yonsei University, Seoul 03722, Korea
*
Author to whom correspondence should be addressed.
Sustainability 2020, 12(14), 5566; https://0-doi-org.brum.beds.ac.uk/10.3390/su12145566
Submission received: 31 May 2020 / Revised: 6 July 2020 / Accepted: 7 July 2020 / Published: 10 July 2020
(This article belongs to the Special Issue Harmful Organisms and their Management for Sustainable Environment)

Abstract

:
Recent advance of biotechnology enabled development of various living modified microorganisms (LMMs) uses in the field of environmental remediation, food industry, biopesticide, and so on. Consequently, such LMMs have the potential to be released into the natural environment, either intentionally or unintentionally, or exposed to the natural ecosystem during the applications. To investigate the unintended effects of LMMs on soil microorganism populations and communities, microcosm study was conducted using the recombinant microorganism, Corynebacterium glutamicum SEM002 carrying the D-psicose-3-epimerase from Agrobacterium tumefaciens as a model LMM. In addition, potential gene transfer from the LMMs into the soil environment in the microcosm was examined. As a result, small differences in LMMs were observed in populations of soil microorganism such as total bacteria, kanamycin-resistant bacteria, total fungi and total actinomycete. Also, more than 93% of the kanamycin resistance gene from the LMMs was degraded in the microcosm during the 90 days. On the basis of the experimental results, the LMMs showed no distinct impact on soil microorganism populations and communities.

1. Introduction

Introduction of genetically modified organisms (GMOs) has started to become the revolution after the development of the first transgenic organisms in 1970s, leading to the enactment as well as development of guidelines involving recombinant or synthetic nucleic acid molecules by the National Institute of Health, USA [1]. GMOs (e.g., GM crops), organisms whose genetic material has been modified using genetic engineering techniques, are still at the center of debate on environmental implication in spite of their improvement in production [2]. Due to their potential environmental risks and undesirable impacts, biosafety issues have emerged in the world. Similar to GMOs, living modified microorganisms (LMMs) also provoke controversy related to safety, risks, and public concerns, in spite of the potential benefits such as sufficient supplies and cost-effective productions of desired products in the fields of industrial biotechnology [3]. Such LMMs can reproduce themselves and survive with undesirable effects on persistent populations or ecosystems. Hence, environmental concerns of LMMs have also emerged, leading to broader interests in the risk assessment [4]. Major concerns are considered to be their potential impacts and risks due to abiotic factors (e.g., pH, organic content, and humidity) and competition with surrounding microorganisms in the release of LMMs. Assuming the release of LMMs, it might affect the indigenous microorganism community, suggesting a possibility of disturbance in natural ecosystems [5].
Risk assessment is a fundamental regulatory tool determining whether LMMs are released into the environment. Such environmental risk assessment is based on the scientific reports and literatures that provide whether LMMs are harmful to the environment and/or human health or not. For a more accurate decision-making process, a sensitive analytic tool should be further developed because a simple method using a traditional culture-based method or a polymeric chain reaction-based method is not sufficient for analyzing the LMMs’ effect on the activity and community structure of indigenous microorganisms in the natural ecosystem [6]. Combinational approaches combining a molecular, biological method with the culture-based method should be required, which is able to be used to effectively detect and analyze various populations of noncultured indigenous microorganisms in the ecosystem. Some of these techniques can be applied to detect general shifts in the total microbial community structure and changes in specific dominant microbes. For example, denaturing gradient gel electrophoresis (DGGE) is one of the efficient tools for diagnosing alterations in soil, and thus it can be applied for monitoring the environmental risk associated with LMMs [7].
Genetically modified Corynebacterium glutamicum (C. glutamicum) showed improved cell growth as well as enhanced supplies and co-effective production of desired products (e.g., L-lysine and L-glutamate), leading to the wide range of application in the industrial fields of food and biotechnology. C. glutamicum SEM002 is a LMM for producing D-psicose-3-epimerase, which transfers fructose to psicose. C. glutamicum SEM002 could also have potential environmental risks and impacts on the populations of soil microorganisms when compared to C. glutamicum ATCC 13032 (non-LMM), which has been recognized as a safe microbe due to non-endotoxin and non-sporulating property. Unlike a genetically modified Escherichia coli, however, there are some limitations to evaluate the risk assessment, because C. glutamicum SEM002 has been little studied in terms of safety yet. Therefore, it is necessary to carry out a risk assessment for a better understanding of environmental impacts of C. glutamicum SEM002.
In this study, we monitored the survival of C. glutamicum SEM002 released into the soil and investigated changes in the density and structure of the indigenous microorganism community. In addition, we analytically evaluated the environmental impacts such as gene flows and soil environmental changes due to C. glutamicum SEM002.

2. Materials and Methods

2.1. Strain and Culture Condition

The host strain of LMM, Corynebacterium glutamicum ATCC 13032, was used as a wild-type strain. LMM, Corynebacterium glutamicum SEM002, was developed to produce D-allulose from D-fructose. LMM has a kanamycin resistance gene, and therefore it can be grown on Luria-Bertani (LB) media including kanamycin. Wild-type strain and LMM could grow on LB agar media at 37 °C.

2.2. Collection of Field Soil Samples

Assuming that LMM was released into plant, located at Ansan-si, Gyeonggi-do, Korea, where LMM will be used, three kinds of soil sample under different environmental conditions were collected. The factory soil and forest soil samples were collected as flatland soils, and samples of sedimentary river soil near the plant area were collected as lowland soils. The environmental risk posed by LMM to soil microorganisms was analyzed in these samples. Soil samples were collected three times from three sites in the vicinity of each other and under the same environmental conditions. After removal of the surface layer including plant residues and other organic material, top 15 cm soil samples were collected. The samples were mixed and regarded as a single sample. The collected soil samples were stored at 4 °C and immediately transported to the laboratory. Foreign materials, such as pebbles, were removed using a 2 mm sieve before the experiments.

2.3. Physicochemical Characterization of the Collected Soil Samples

Cation exchange capacity of each soil sample was analyzed by the ammonium acetate method, and organic content of the soil samples was analyzed by the Walkley–Black method [8]. Total nitrogen of each soil sample was analyzed by using the micro-Kjeldahl method [9]. To determine the soil texture of each soil sample, particle size was analyzed by a pipet method based on the differences in particle sedimentation rates. The pH values were read using stabilized glass electrode and standard electrode within 60 s using a pH meter (Orion 3 star, Thermo) calibrated by using a pH standard solution. Phosphate ion (PO43−) was analyzed using ion exchange chromatography [10].

2.4. Analysis of LMM (SEM002) Survival in the Soil and Effect on the Soil Microbial Community

To analyze the effects of LMM on the soil microbial community, 500 g of each prepared soil sample was transferred to a separate container, and then (i) LMM-treated microcosms, (ii) wild-type strain-treated microcosms, and (iii) untreated control were prepared with three replications for each set. The prepared microcosms were incubated at room temperature, and soil portions were collected on Days 0, 2, and 9 d, and then at regular intervals according to the level of detected microorganisms, for 90 d.

2.5. Analysis of Changes in the Density of Major Soil Microbial Communities

Soil bacterial density was analyzed by a heterotrophic plate count method. Bacteria were cultured on LB plates and Peptone–Tryptone–Yeast extracts–Glucose (PTYG) plates with cycloheximide. PTYG medium contained 0.25 g of peptone (Difco, USA), 0.25 g of tryptone (Difco, USA), 0.5 g of yeast extracts (Difco, USA), 0.5 g of glucose, 0.03 g of MgSO4, and 0.003 g of CaCl2 per liter. After culturing at 28 °C for 96 h, the colonies on the plate were counted. LKP media which includes 50 mg L−1 of kanamycin and 75 mg L−1 of paromomycin in LB media were used for selective culture and detection of LMM. For fungal community, fungi media that contained 20 g of malt extract and 0.2 g of chloramphenicol per liter and adjusted to pH 7.0 was used. After incubation at 28 °C for 96 h, the colonies on the plate were counted. The density analysis of the actinomycetes community was performed using culture medium which contained 0.2 g sodium caseinate, 0.5 g KH2PO4, 0.2 g MgSO4·7H2O, 15 g agar and 0.5 g FeCl3·6H2O per liter and adjusted to pH 6.5–6.7 [11]. Before cultivation, samples were heated in a 45 °C water bath for 16 h. After cultivation at 28 °C for 5–7 d, the colonies on the plate were counted.

2.6. Detection of Remained Genetic Material of SEM002 and Wild-Type Strains

To determine the amount of genetic material remaining in the microcosm soil in the experimental group, the 16S rRNA gene and kanamycin resistance gene (npt-I) were analyzed by real-time PCR. The 16S rRNA gene primers were specific for the 16S rRNA gene of the C. glutamicum. The forward primer 5′ end is at position 60 (5′-TCGAACGCTGAAACCGGAGCT-3′); the reverse primer 5′ end is complementary to position 172 (5′-CGGTATTAGACCCAGTTTC CCAGGC-3′). The kanamycin resistance gene primer sequences are as follows: 5′-GAGTCGGAATCGCAGACCG-3′ (forward primer); 5′-ATATTTTTGAAAAAG CCGTTTCTGTAAT-3′ (reverse primer). To determine the background levels of LMM and wild-type strains in soil samples, each LMM and wild-type strain were cultured in LB medium, followed by inoculation into the soil. Then, soil DNA from each standard sample was extracted, and the Ct value was determined using the LightCycler® 480 Real-Time PCR system (Roche, Germany). Based on the Ct values and bacterial concentrations, standard curves were plotted, and the detection limit was then investigated. The minimum concentration required for a linear correlation between the log value of inoculated LMM concentration and Ct value was identified, and the background level of the residual transgene left in the soil was then determined.

2.7. Analysis of Changes of Soil Microbial Communities by Real-Time PCR-DGGE

The experimental method to determine the total soil microbial community using the real-time PCR-DGGE method was described in our previous paper [12]. DNA was isolated by using a FastDNA SPIN kit for soil (MP Biomedical, USA). After the extraction of total soil DNA from each sample, the 16S rDNA region of the soil microbial community was amplified by real-time PCR. PCR amplification was conducted using the LightCycler® 480 Real-Time PCR system (Roche, Germany). After PCR amplification, the PCR products were purified with a MiniElute® PCR purification kit (Qiagen, Germany) and checked by electrophoresis on horizontal 1% agarose gels. DGGE was performed on a Dcode mutation detection system (BioRad, USA). The amplified PCR products were mixed with 2 × gel loading dye (2% bromophenol blue, 2% xylene cyanol, 100% glycerol) and separated on Acrylamide-bisacrylamide (37.5:1) gels with a 43–63% denaturing gradient. The 100% denaturant contained 7M urea and 40% (vol/vol) formamide. The gels were electrophoresed in 0.5 × TAE buffer for 25 h at 60 °C and a voltage of 60 V. After electrophoresis, the gels were stained with SYBR Green I (Lonza, USA) for 20 min and destained with 0.5 × TAE buffer for 15 min. The gels were photographed with UV transillumination (302 nm). DGGE profile of the microcosm experiment was then subjected to Pearson correlation cluster analysis using the BioNumerics program (Applied Maths, Belgium) and other statistical analysis was performed by XLSTAT software (Addinsoft, France) [13]. The band position and intensity data were exported to Excel. The DGGE profiles were compared using Analysis of Variance (ANOVA) with Tukey test. Differences with P < 0.05 were considered statistically significant.

3. Results

3.1. Characteristics of Soil Samples

Characteristics of soil samples (i.e., the factory soil, forest soil, and sedimentary soil samples close to plant) were examined. Factory soil had the less organic content and total nitrogen content than other soil samples. The pH of the forest soil sample was 4.37, which was much lower than that of the general agricultural soil. The sediment soil sample showed middle values except the exchangeable magnesium. The textures of factory soil and forest soil were sandy loam and sediment soil was loamy sand (Table 1).

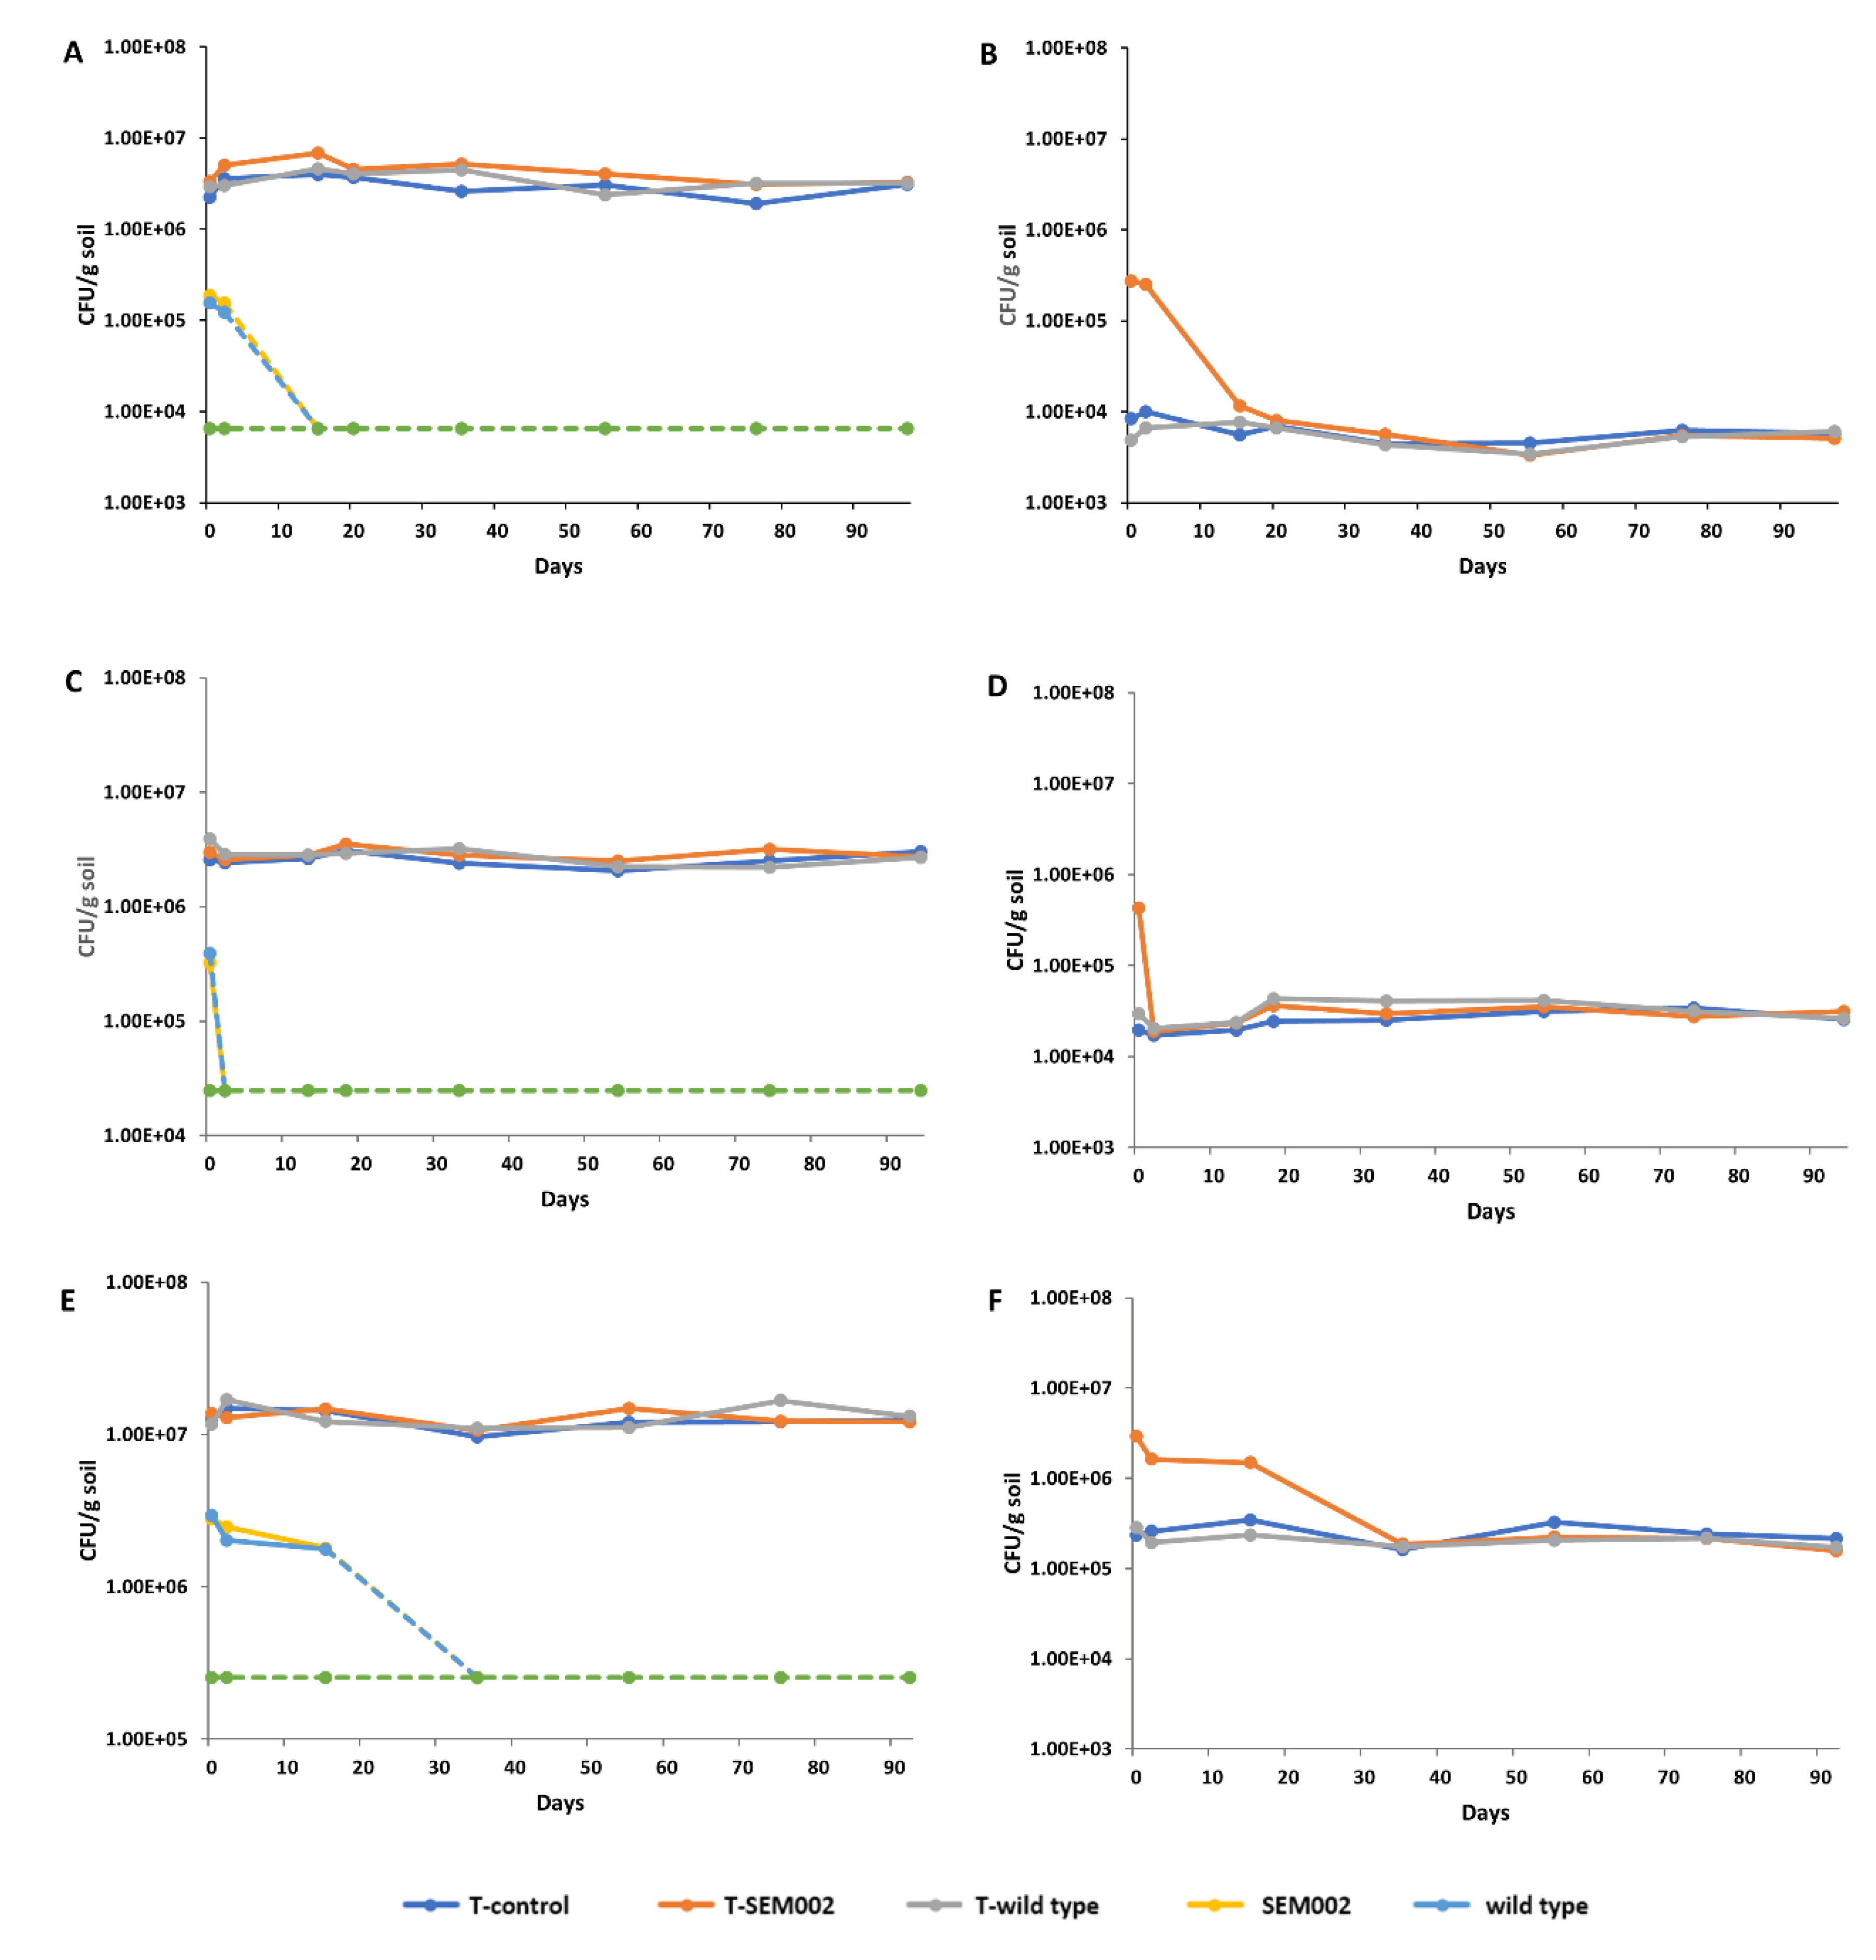
3.2. Survival of LMMs in Soil Samples

After inoculation of LMM and wild-type strains into microcosm soils, the extent of survival of each strain with time was analyzed. LMM and wild-type strains were inoculated into the factory soil at 1.8 × 10⁵ cfu/g soil and 1.5 × 10⁵ cfu/g soil, respectively. Colony count on LB plates revealed that the density of these strains slightly decreased to 1.5 × 10⁵ cfu/g soil and 1.2 × 10⁵ cfu/g soil, respectively, 2 days after the inoculation. Furthermore, 15 days after the inoculation, the inoculated strains were undetectable due to the indigenous microorganism background, indicating that the densities of these strains substantially decreased (Figure 1A). When analyzing the density of SEM002 strain on LKP, it was 2.7 × 10⁵ cfu/g soil on the day of inoculation and decreased slightly to 2.5 × 10⁵ cfu/g soil on Day 2; decreased 10-fold to 1.1 × 10⁴ cfu/g soil on Day 15; and was undetectable because of the indigenous microorganism background that showed resistance to the antibiotics tested on Day 20 (Figure 1B). In the case of forest soil, the density of LMM and wild-type strains inoculated into the microcosm soils was 3.0 × 10⁵ and 3.8 × 10⁵ cfu/g soil on day 0 of the experiment, respectively. On Day 2, these strains were undetectable on LKP medium and LB medium, and it was proposed that most of the inoculated bacteria died or changed to unculturable bacteria (Figure 1C,D). Thus, a second microcosm experiment was performed to investigate the death of the inoculated strains in the early stage of the microcosm experiment. For that experiment, each strain was inoculated and the density of detectable strains was investigated in time series. When the density was determined on LB medium immediately after inoculation of the second microcosm soil, the cell densities were 1.2 × 10⁶ cfu/g soil for LMM, and 1.3 × 10⁶ cfu/g soil for the wild-type strain, and decreased to 1.7 × 10⁵ and 1.6 × 10⁵ cfu/g soil, respectively, after 1 h. Then, 3 h after the inoculation, LMM and wild-type strains became undetectable (Figure S1A). The same results were obtained when the antibiotic selection medium was used (Figure S1B). In the case of sedimentary microcosm soil, their survival was analyzed with time. LMM and wild-type strains were inoculated into the sedimentary soil at 2.7 × 10⁶ and 2.9 × 10⁶ cfu/g soil, respectively. Analysis on LB plates indicated that the density of these strains was 2.4 × 10⁶ and 2.0 × 10⁶ cfu/g soil, respectively. On Day 35 after the inoculation, densities of these strains substantially decreased and the colonies could not be counted because of the indigenous microorganism background (Figure 1E). When analyzed on LKP for the selective culture and detection of LMM, the density of the SEM002 strain was 2.9 × 10⁶ cfu/g soil on Day 0 after the inoculation, and decreased slightly to 1.6 × 10⁶ cfu/g soil on Day 2 and 1.5 × 10⁶ cfu/g soil on Day 15, indicating that the density decreased with time. From Day 35, the strain was undetectable because of the background of indigenous microorganisms that were resistant to antibiotics (Figure 1F).

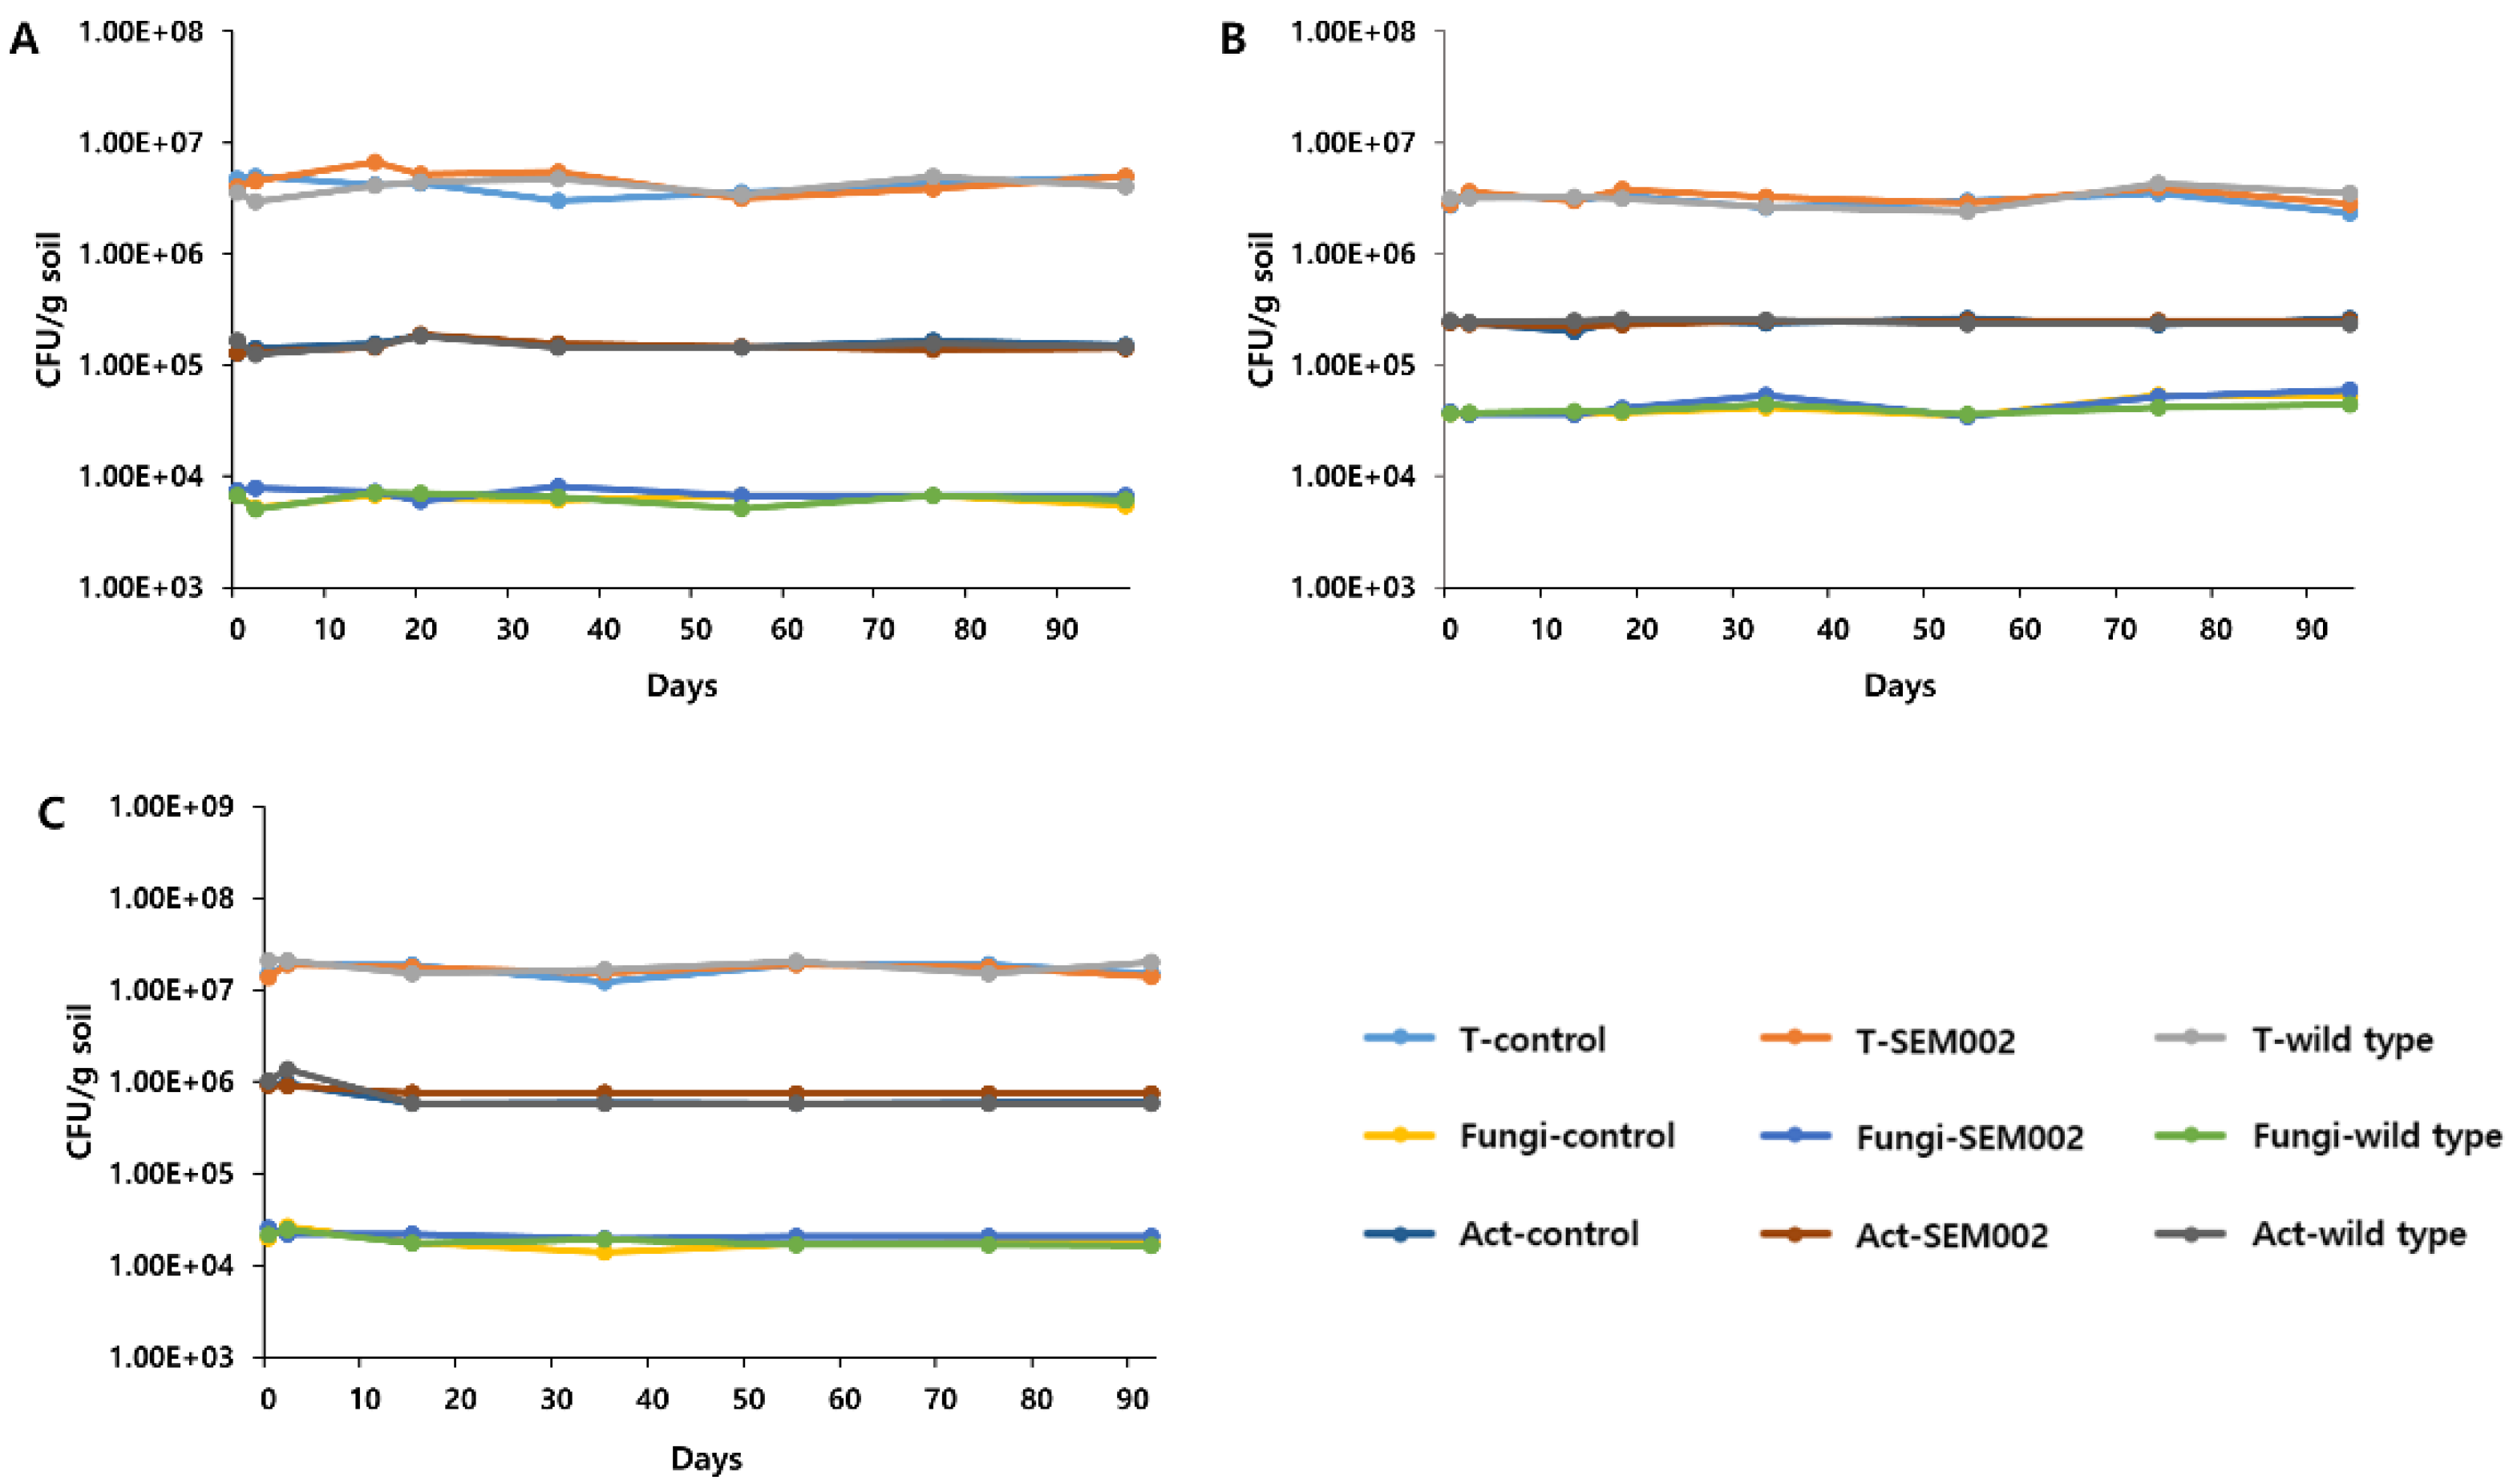
3.3. Changes in the Density of the Major Soil Microorganisms Upon LMM Release

Density changes of the major soil microorganisms in the factory soil in experimental groups inoculated with LMM and wild-type strains, and in an uninoculated control group, were analyzed on selective media. In the three microcosm soil groups, densities of the indigenous bacteria were 2.3 × 10⁶ ~ 3.3 × 10⁶ cfu/g soil on Day 0. Actinomycete cell densities in the experimental microorganism-inoculated groups and the uninoculated control group were 1.2 × 10⁵ ~ 1.6 × 10⁵ cfu/g soil on Day 0. In addition, fungal community densities in the experimental groups after inoculation with LMM and wild-type strains, and in the uninoculated control group, were 6.6 × 10³ ~ 7.5 × 10³ cfu/g soil on Day 0. Soil microorganisms in factory soil in experimental groups remained similar on Day 97 (Figure 2A). In the forest soil, densities of the indigenous bacteria were 2.5 × 10⁶ ~ 3.8 × 10⁶ cfu/g soil on Day 0. Actinomycete densities in the experimental groups inoculated with microorganisms and in the uninoculated control group were 2.4 × 10⁵ ~ 2.5 × 10⁵ cfu/g soil on Day 0. Fungal community densities were 3.6 × 10⁴ ~ 3.8 × 10⁴ cfu/g soil on Day 0 of the microcosm experiment. They remained similar on Day 94 (Figure 2B). Densities of the indigenous bacteria in the sedimentary soil were 1.4 × 10⁷ ~ 2.0 × 10⁷ cfu/g soil on Day 0 of the microcosm experiment. Actinomycete densities in the inoculated experimental groups and uninoculated control group were 9.0 × 10⁵ ~ 1.0 × 10⁶ cfu/g soil on Day 0. Moreover, fungal community densities were 2.0 × 10⁴ ~ 2.5 × 10⁴ cfu/g soil on Day 0 of the microcosm experiment. They remained similar on Day 92 after the inoculation in the three microcosm soil groups (Figure 2C).

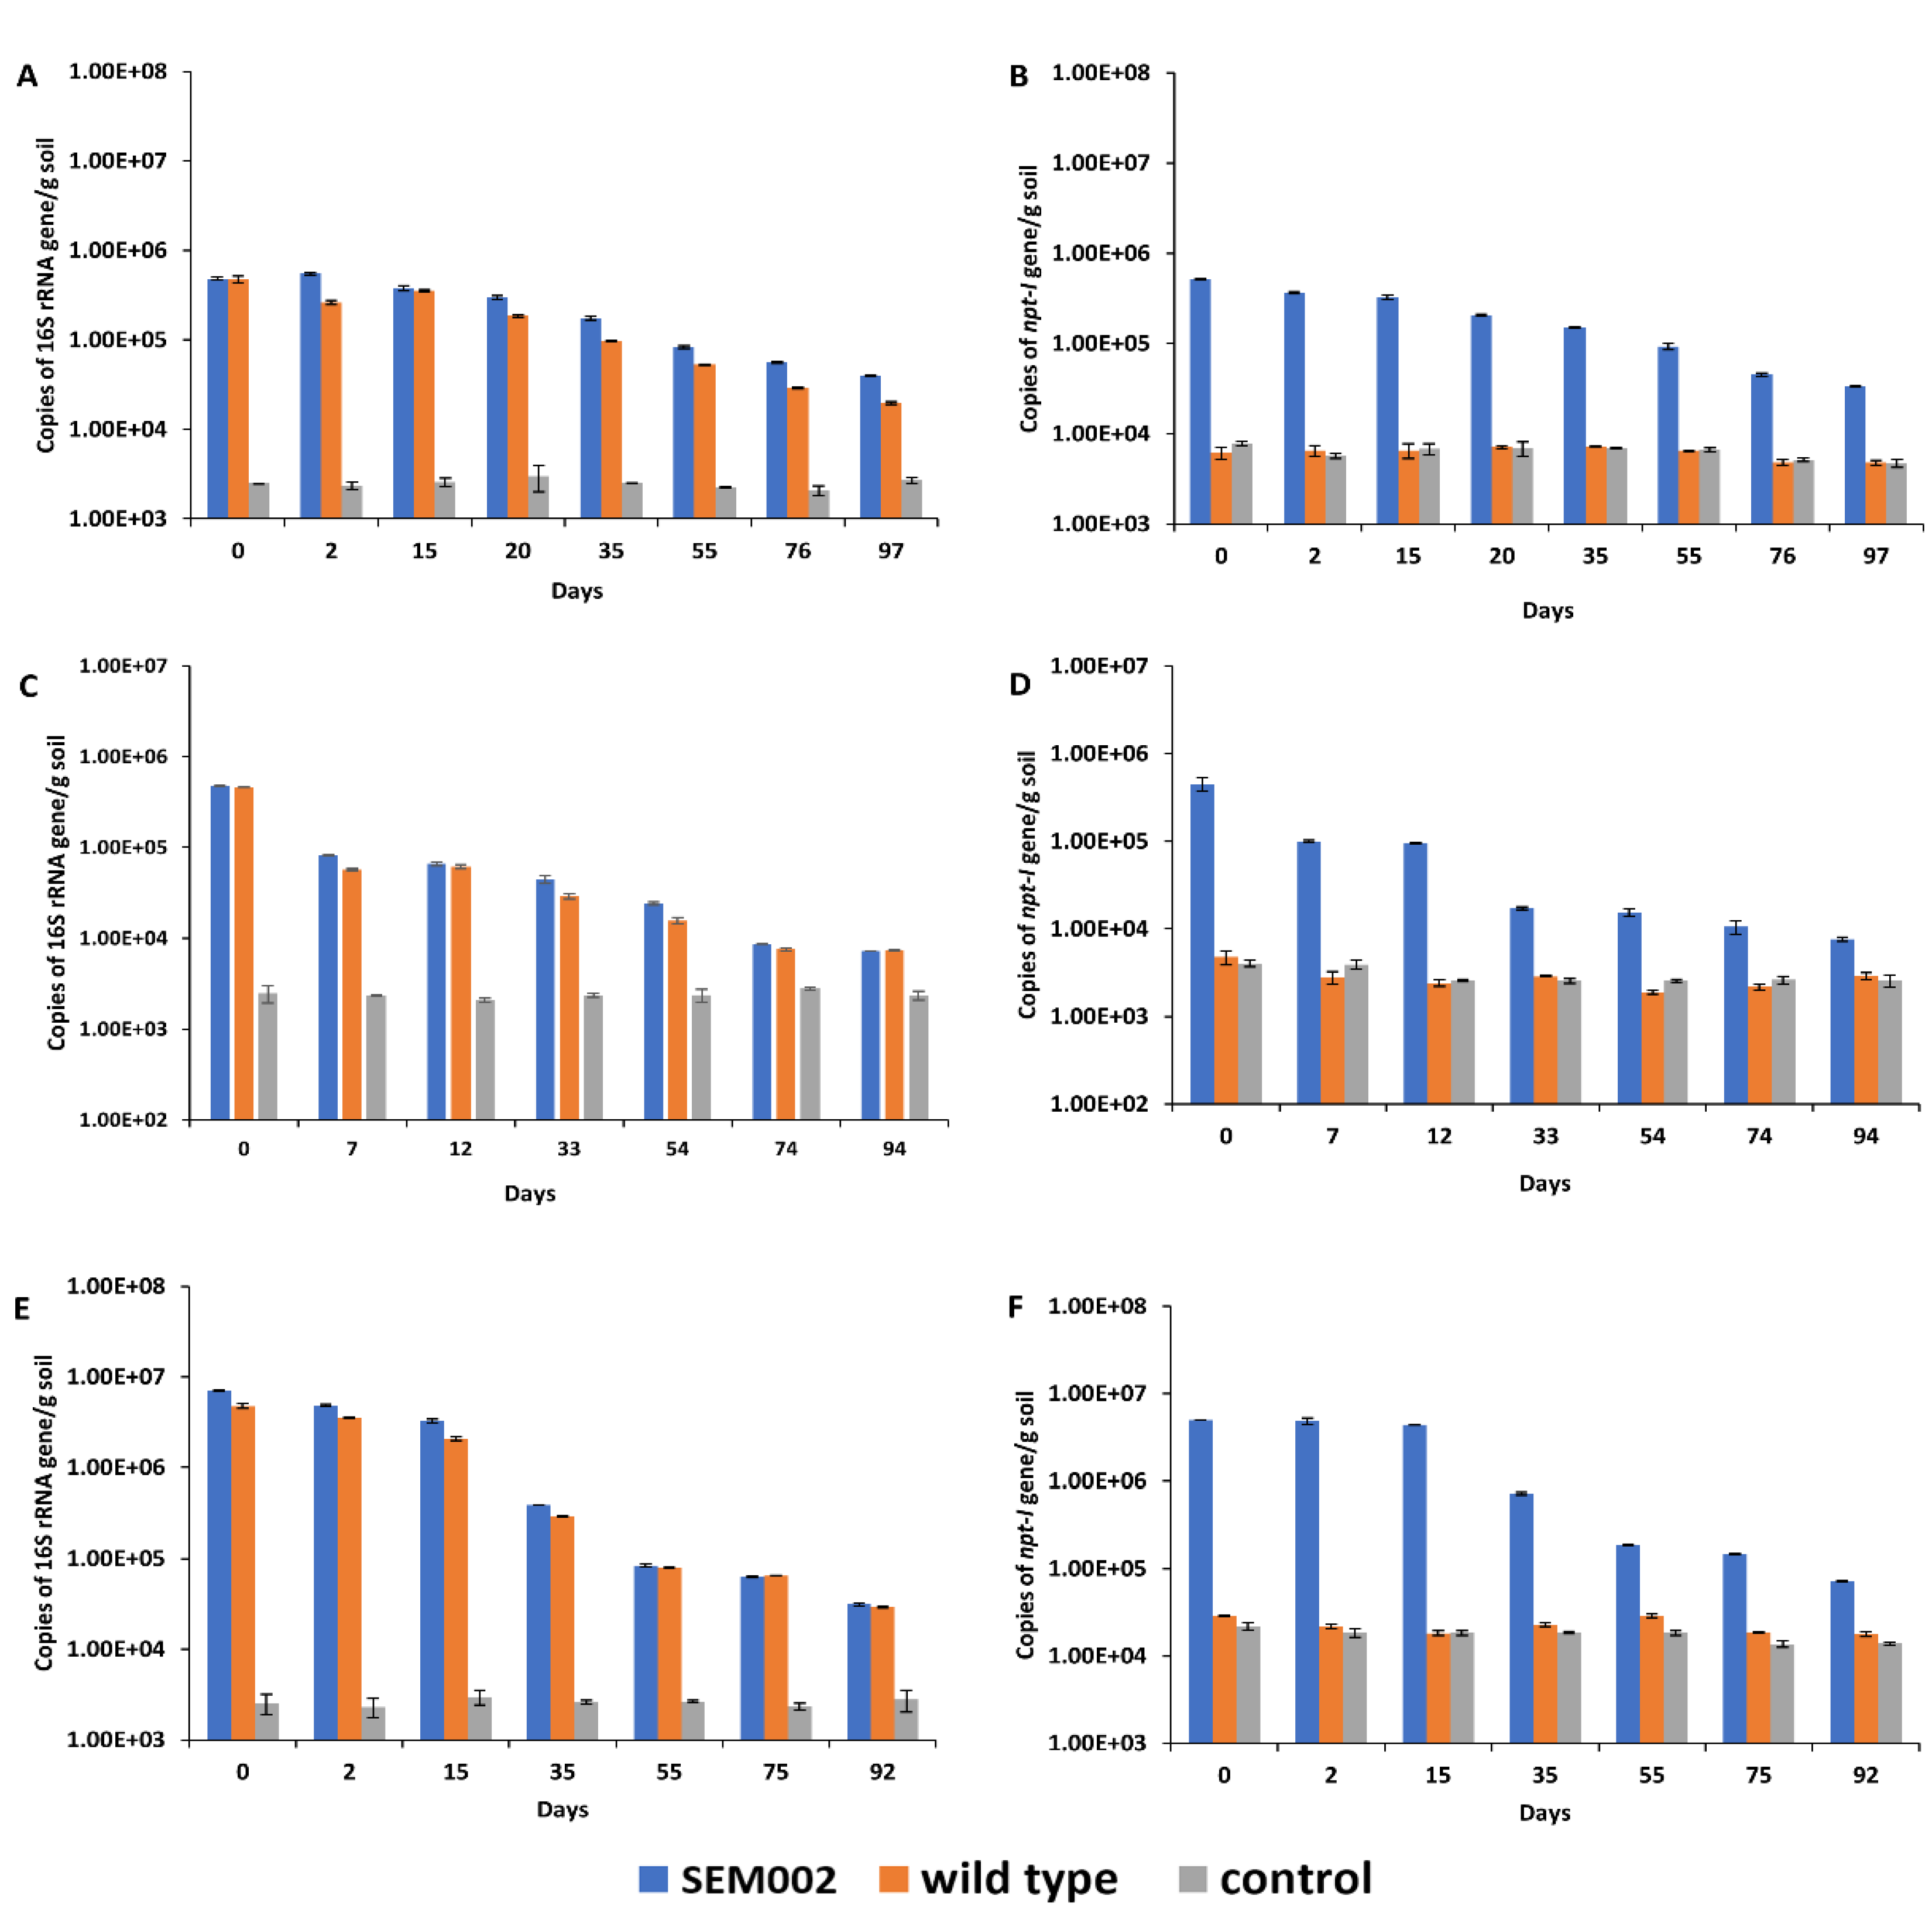
3.4. Changes in the Copy Number of the 16S rRNA and Kanamycin Resistance Gene in Inoculated Microcosm Soil

In the microcosm in the factory soil experimental groups, inoculated with LMM and wild-type strains, the copy numbers of the 16S rRNA gene were 4.8 × 10⁵ and 4.7 × 10⁵ copies/g soil, respectively, on Day 0. The copy number remained similar on Day 15 of the microcosm experiment, whereas it tended to gradually decrease from Day 20, ultimately becoming 8.3 × 10⁴ copies/g soil in the soil with LMM inoculation and 5.3 × 10⁴ in the soil with wild-type inoculation on Day 55 of the experiment. This indicated an 83% and 89% reduction in the amount of genetic material, respectively, from Day 0. A comparison between Day 0 and Day 97 revealed a 91.8% and 95.9% of 16S rRNA gene reduction in the soil inoculated with LMM and wild-type strains during the experimental period, respectively (Figure 3A). In the factory soil microcosm inoculated with LMM, copy number of the kanamycin resistance gene was 5.1 × 10⁵ copies/g soil on Day 0. On Day 55, the copy number was 9.3 × 10⁴ copies/g soil, indicating that approximately 82% of the initial dose of the kanamycin resistance gene inoculated on Day 0 had been degraded. Comparing the data for Days 0 and 97, approximately 93.5% of the inoculated dose of the kanamycin resistance gene was degraded at the later date (Figure 3B). In the forest microcosm soils inoculated with LMM and wild-type strains, the copy numbers of the 16S rRNA gene were 4.8 × 10⁵ and 4.7 × 10⁵ copies/g soil, respectively, on Day 0. On Day 54, the copy number was 2.4 × 10⁴ copies/g soil in the soil inoculated with LMM and 1.5 × 10⁴ in the soil after wild-type inoculation, showing an over 10-fold reduction of the 16S rRNA gene number from Day 0. The amounts of the 16S rRNA gene between Days 0 and 94 of the microcosm experiments were compared and the amounts decreased by 98.5% (LMM) and 98.4% (wild-type strain) in the inoculated soils (Figure 3C). Copy number of the kanamycin resistance gene on forest microcosm was 4.6 × 10⁵ copies/g soil on Day 0. It then remained constant until Day 12, and the copy number subsequently decreased by approximately 27-fold, with 1.7 × 10⁴ copies/g soil on Day 33 (Figure 3D). When the amounts of the kanamycin resistance gene on Days 0 and 94 of the microcosm experiments were compared, a 98.4% decrease was noted. In the microcosm of the experimental groups of sediment soil, copy numbers of the 16S rRNA gene were 7.0 × 10⁶ and 4.7 × 10⁶ copies/g soil, respectively, on Day 0. The copy numbers then rapidly decreased after Day 35 of the soil microcosm experiment, and residual amounts of the 16S rRNA gene were noted, 3.9 × 10⁵ copies/g in the LMM-inoculated soil and 2.9 × 10⁵ copies/g in the wild-type-inoculated soil. A comparison between Day 0 and Day 92 data revealed a 99.5% and 99.4% reduction of the 16S rRNA gene numbers in the sedimentary soils inoculated with LMM and wild-type strains, respectively (Figure 3E). The copy number of the kanamycin resistance gene on sedimentary microcosm showed 4.9 × 10⁶ copies/g soil on Day 0. The copy numbers of the kanamycin resistance gene were 7.2 × 10⁴ copies/g soil on Day 92. Comparison of the levels of the kanamycin resistance gene on Days 0 and 92 of the microcosm experiments revealed a 99.4% decrease (Figure 3F).

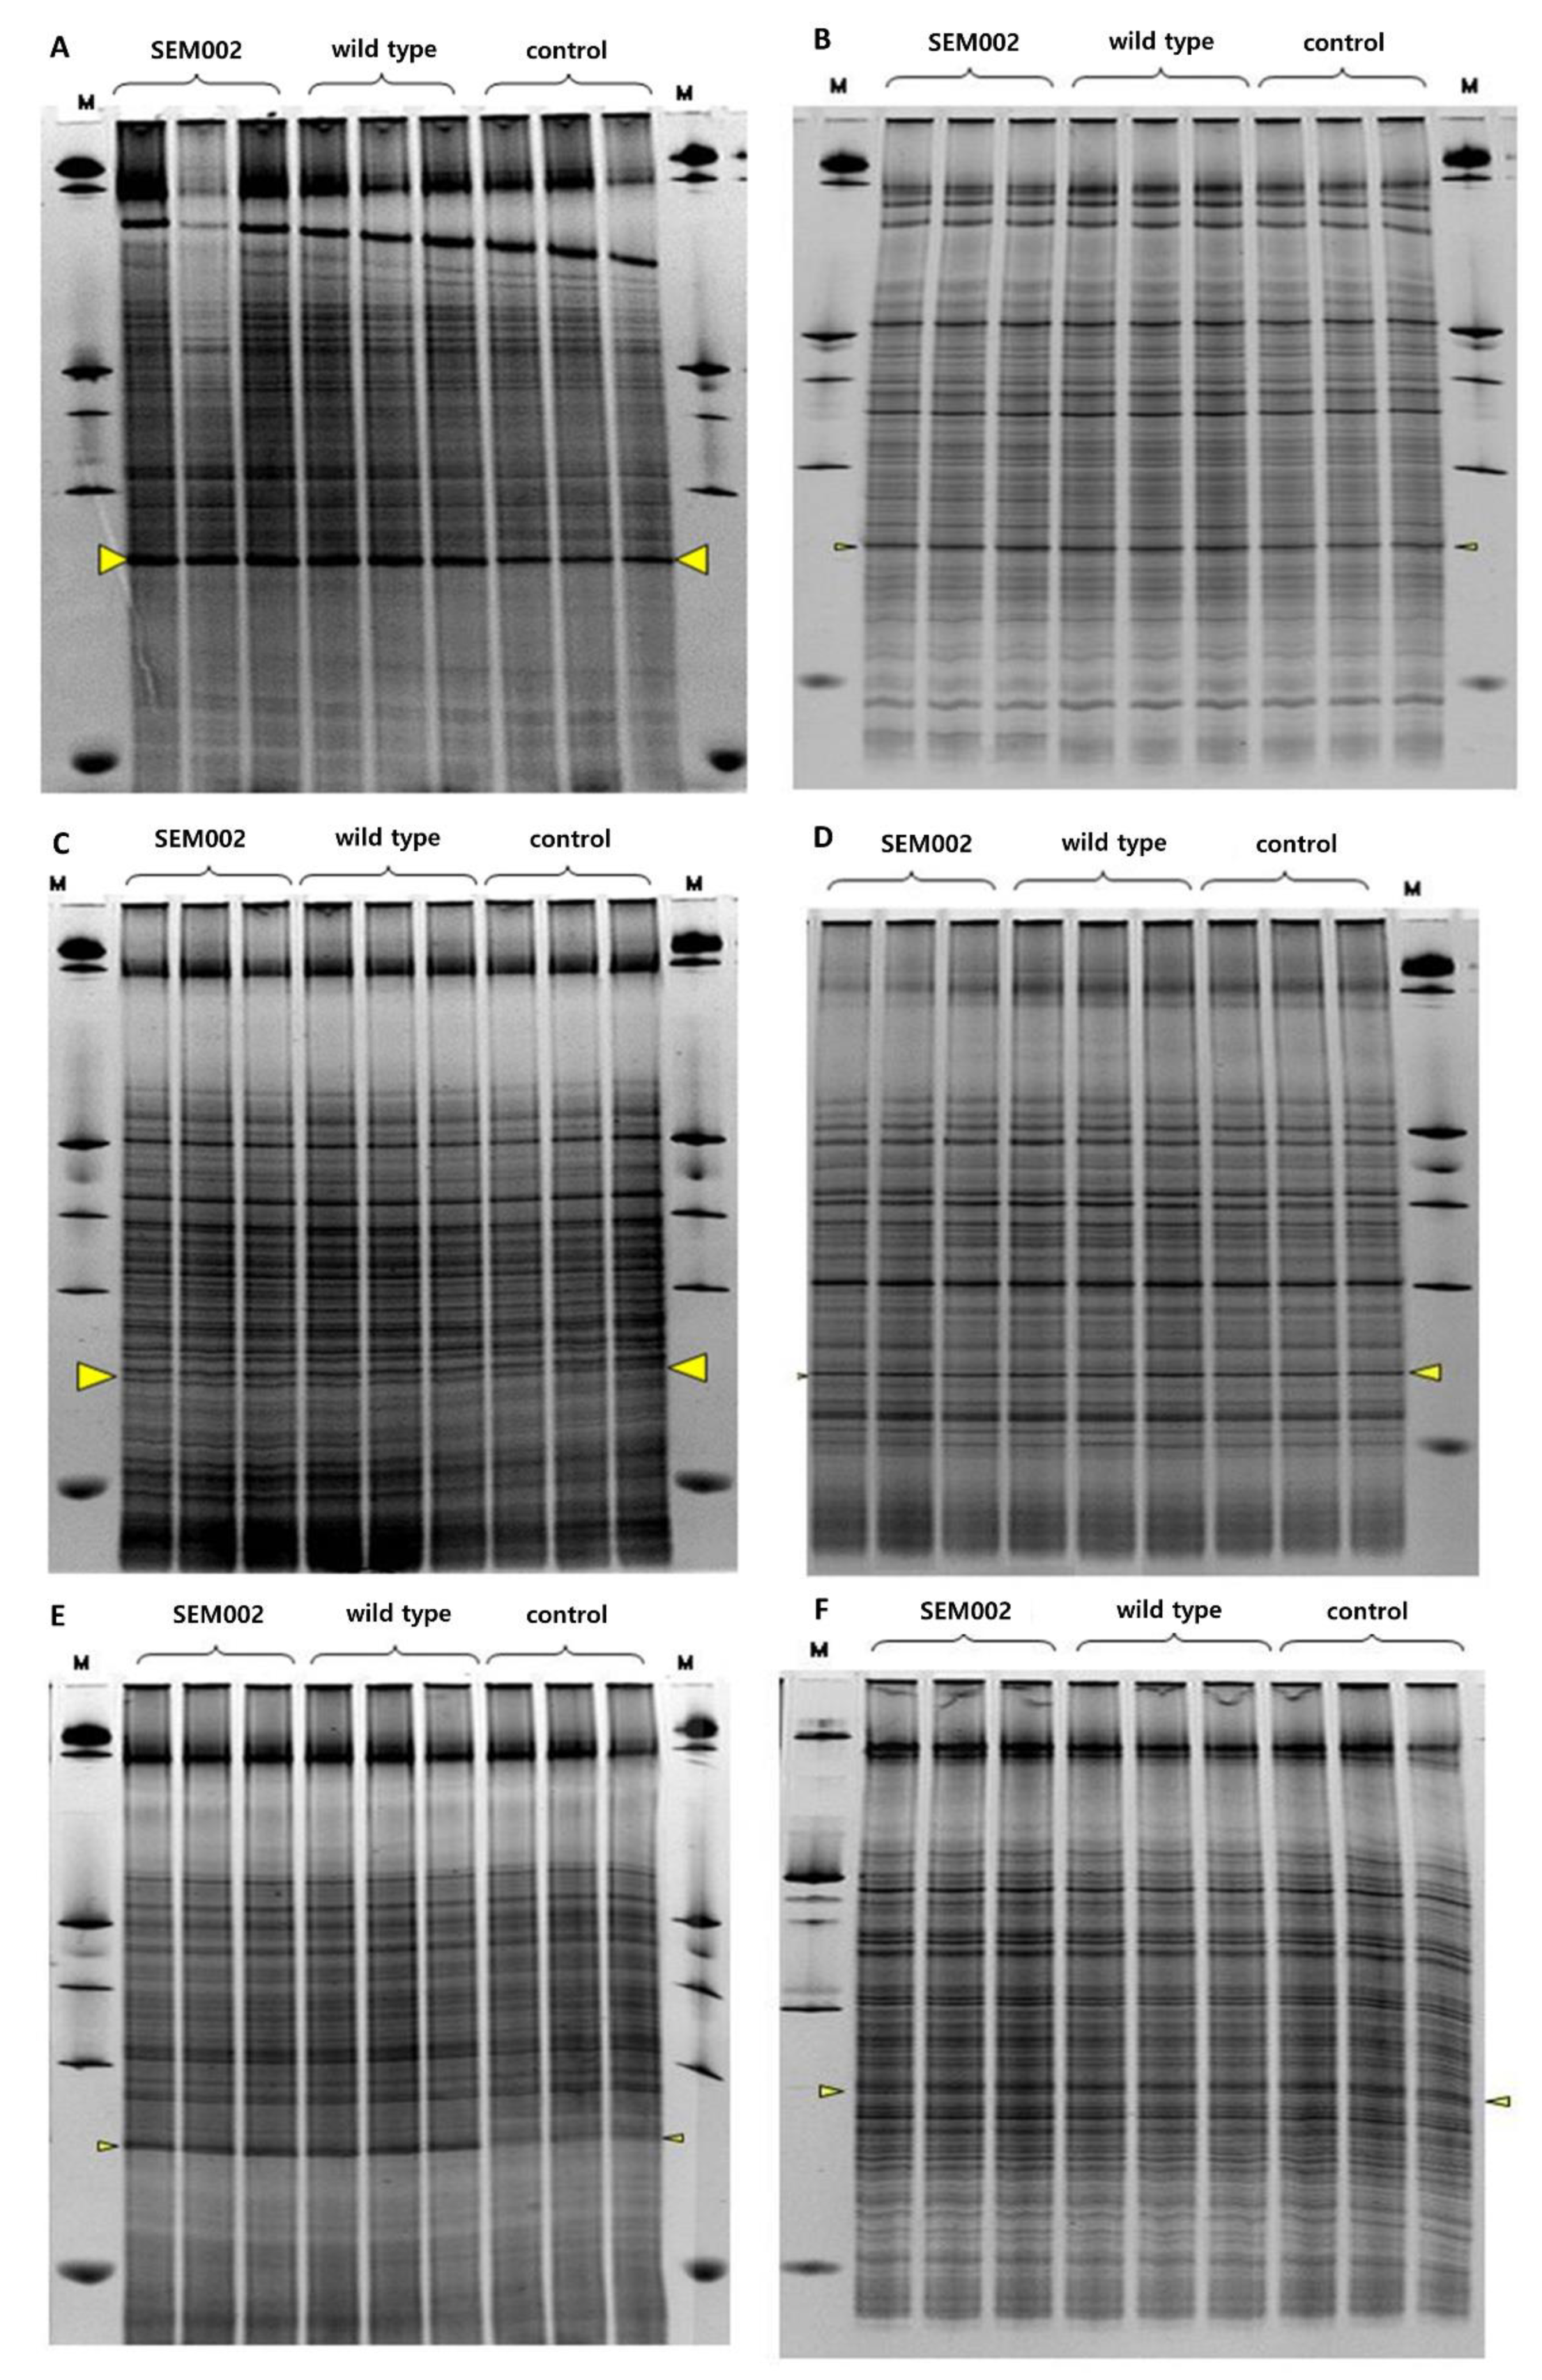
3.5. Effect of LMM on the Indigenous Microbial Community Structure in Soil

Assuming that LMM would be released from plant, LMM and wild-type strains were used to inoculate the microcosm, and the structural changes in the indigenous microbial community with time were then analyzed using real-time PCR-DGGE. Figure 4 and Figures S2–S4 showed the results of the DGGE analysis of microcosm soils inoculated with LMM and wild-type strains. At least approximately 100 DNA bands were detected in each DGGE lane, and highly similar DGGE DNA band patterns were noted in three replicates of inoculated soils and uninoculated soil. In the DGGE profile from Day 0 of the microcosm experiments of factory soil, strain-specific DGGE bands (arrows) in the soils inoculated with LMM and wild-type strains were much more intense than those in the control soil (Figure 4A). No significant difference was apparent for other DGGE bands, indicating that the intensity of strain-specific DGGE bands was much more pronounced in the inoculated microcosm soils. The DGGE band intensity for the inoculated microorganisms was also approximately 2-fold higher than that in the control soil from Day 15 of the microcosm experiments, whereas there was no significant difference with the control soil on Day 35 (Figure S2). These results suggested that LMM and wild-type strains inoculated in the factory soil maintained a relatively high density during the early time points of the microcosm experiment, but the density gradually decreased with time. This was consistent with the results of the plate-culture-based method and residual soil DNA analysis of 16S rDNA of the inoculated strains. This indicates that when LMM SEM002 is released into the factory soil, it would be gradually degraded with time, and the soil microbial community structure would be restored, so that no significant effect on the indigenous microbial community structure in the factory soil would be observed. In the DGGE profile on Day 0 of the microcosm experiment in the forest soil, unlike in the factory soil, the intensities of DGGE bands (arrows) for LMM and wild-type strains after inoculation displayed no significant differences from those in the uninoculated control soil (Figure 4C). This appeared to be associated with the rapid cell death of these strains in the forest soil, as had been revealed by culturing. According to the results of the microcosm experiment until Day 94, DGGE profile of the soil inoculated with LMM and wild-type strains was similar to that of the control uninoculated soil, indicating that partial release of LMM to the forest soil had no significant effect on the structure of the indigenous microbial community structure in the forest soil (Figure 4D and Figure S3). In the DGGE profile on Day 0 of the microcosm experiment, similarly to the factory soil, in sedimentary soils inoculated with LMM and wild-type strains, the intensity of DGGE bands (arrows) of these strains was slightly higher than those in the control soil (Figure 4E). Even on Day 15 of the microcosm experiment in the sedimentary soil, the intensity of the DGGE band (arrow) was slightly higher than that of the uninoculated soil, as on Day 0, which was consistent with the observation that the numbers of the inoculated strains on the selection media were not significantly reduced until Day 15. However, the intensities of DGGE bands (arrows) corresponding to LMM and wild-type strains became similar to those in the control from Day 35, which was consistent with the notion that the density of these strains rapidly decreased, and then became too low to be detected in the sedimentary soil from Day 35 (Figure S4 and Figure 4F). Taken together, these results suggest that LMM can barely survive in the sedimentary soil, similarly to the factory or forest soil, so that LMM had no significant effect on the structure of the indigenous microbial community in the deposit soil. The statistical results demonstrated that there were no significant differences among LMM, wild-type strain, and control.

4. Discussion

Lots of concerns over the undesirable, unwanted effects of released LMMs have highlighted the importance of risk assessment. In practice, the release of LMMs into the environment still presents a challenge in risk assessment without multiple techniques combined with molecular biological methods. Our previous studies tried to analyze and evaluate risks on soil microbial communities using molecular biological experiments such as DGGE and PCR-amplified 16s rRNA gene [12,14]. In addition to these techniques, to better assess their risks and impacts on the environment, monitoring of field sites after the release of LMMs is focused on two approaches. The first approach focuses on the source materials such as monitoring LMMs, and the second approach focuses on retrieving ecological data by monitoring potential environmental risks and impacts.
In general, dominant soil organisms are responsible for the diversity of functions [15], suggesting that impacts of LMM on the soil microbe community should be considered when assessing the environmental and ecological risks of LMM [16]. Therefore, the impact of LMM on the soil microbe community should be considered when assessing the environmental and ecological risks of LMM [17]. The effect of LMM Corynebacterium glutamicum SEM002 on the indigenous microorganisms in the soil was investigated using the factory soil that planned to use LMM, as well as the forest soil and the sedimentary soil close to the plant. In the factory soil, almost all LMM cells died after approximately 20 days. In the forest soil, LMM cells rapidly died in approximately 3 h. The cells also perished in the sedimentary soil, after approximately 35 days, indicating that LMM barely survived in the soil close to the factory. The survival state of microorganisms inoculated into the soil depends on complex interactions between the environmental and biological factors of the inoculated soil. Based on the above results, it was determined that LMM and wild-type strains would have difficulty surviving and would die more quickly in the forest soil than in the factory soil or river deposit soil, because the forest soil has a much lower pH (Table 1) and a higher proportion of indigenous actinomycetes and fungi than the factory soil or river deposit soil. Hagi et al. [18] showed that the number of cells of GM and wild type were decreased logarithmically over time, and no significant differences were found in the rate of decrease. As for the density of the major soil microorganisms, including bacteria, actinomycetes, and fungi, which dwell in the factory soil, forest soil, and sedimentary soil, no significant differences between the inoculated experimental soils and the control uninoculated soil were noted during the experimental period. The inoculated LMM and wild-type strains in the microcosm became undetectable on LB medium and antibiotic selection medium. Hence, the above analysis of changes in the copy number of the 16S rRNA gene indicated that the genetic material of the inoculated strains was also gradually degraded along with cell death over time. Hagi et al. [18] revealed that the number of inoculated cells of GM and wild type decrease rapidly; however, their DNA disappeared more slowly. Most of the initial dose of the kanamycin resistance gene introduced in LMM was similarly degraded, 90 days after the soil treatment, and no significant changes in the density of the indigenous microorganisms resistant to kanamycin were observed during the experimental period. Therefore, neither major transformation nor spread of the kanamycin resistance gene to the indigenous microorganisms was apparent that might have posed serious environmental risk. These results were similar with Ma et al.’s [6] experiment for possible gene flow from GM corn, carrying the neomycin phosphotransferase gene (npt-II), to soil bacteria. In this study, we could not find any evidence of gene flow from the LMM to soil bacteria. When structural changes of the indigenous microbial community in the factory, forest, or sedimentary soils inoculated with LMM were analyzed by real-time PCR-DGGE, the DGGE band patterns of the inoculated soils were highly similar to those of the uninoculated control soil. This indicated no significant structural changes in the soil microbial community even after LMM treatment. These results were similar with Hagi et al. [18]. Taken together, it could be concluded that the inflow of LMM either into the factory soil, the forest soil, or river sedimentary soil close to the plant would not significantly affect the indigenous microorganism community in these soils.

Supplementary Materials

The following are available online at https://0-www-mdpi-com.brum.beds.ac.uk/2071-1050/12/14/5566/s1, Figure S1: Changes in the bacterial counts of LMM and wild-type strains in LB medium and LPK medium after the release of LMM and wild-type strains into forest soil microcosm, Figure S2: Analysis of structural changes of the bacterial community in the factory soil microcosm experiment using real-time PCR-DGGE, Figure S3: Analysis of structural changes of the bacterial community in the factory soil microcosm experiment using real-time PCR-DGGE, Figure S4: Analysis of structural changes of the bacterial community in the factory soil microcosm experiment using real-time PCR-DGGE.

Author Contributions

Conceptualization, experiments design and conduction, H.L. and D.-U.K.; sample collection and data interpretation, S.-B.K. and J.S.; study coordination and supervision, J.-O.K.; data analysis and writing, H.L. and D.-U.K.; All authors read, discussed, edited, and approved the final draft of the manuscript. All authors have read and agreed to the published version of the manuscript.

Funding

This research received funding from the Rural Development Administration of the Republic of Korea (Project No. PJ0152432020).

Acknowledgments

This work was funded by “Cooperative Research Program for Agriculture Science and Technology Development (Project No. PJ0152432020)” Rural Development Administration, Republic of Korea.

Conflicts of Interest

The authors declare no conflict of interest.

References

  1. Zhang, C.; Wohlhueter, R.; Zhang, H. Genetically modified foods: A critical review of their promise and problems. Food Sci. Human Wellness 2016, 5, 116–123. [Google Scholar] [CrossRef] [Green Version]
  2. Schiemann, J.; Dietz-Pfeilstetter, A.; Hartung, F.; Kohl, C.; Romeis, J.; Sprink, T. Risk Assessment and Regulation of Plants Modified by Modern Biotechniques: Current Status and Future Challenges. Annu. Rev. Plant Biol. 2019, 70, 699–726. [Google Scholar] [CrossRef] [PubMed] [Green Version]
  3. Mallikarjuna, N.; Yellamma, K. Genetic and Metabolic Engineering of Microorganisms for the Production of Various Food Products. In Recent Developments in Applied Microbiology and Biochemistry; Academic Press: Cambridge, MA, USA, 2019; pp. 167–182. [Google Scholar]
  4. Engwa, A.G. Genetic engineering on microorganism: The ecological and bioethical implications. Eur. J. Biotechnol. 2014, 1, 27–33. [Google Scholar]
  5. Ando, A.; Suzuki, C.; Shima, J. Survival of genetically modified and self-cloned strains of commercial baker’s yeast in simulated natural environments: Environmental risk assessment. Appl. Environ. Microbiol. 2005, 71, 7075–7082. [Google Scholar] [CrossRef] [PubMed] [Green Version]
  6. Han, I.; Lee, T.K.; Han, J.; Doan, T.V.; Kim, S.B.; Park, J. Improved detection of microbial risk of releasing genetically modified bacteria in soil by using massive sequencing and antibiotic resistance selection. J. Hazard. Mater. 2012, 227–228, 172–178. [Google Scholar] [CrossRef] [PubMed]
  7. Janczyk, P.; Pieper, R.; Smidt, H.; Wolfgang, B. Souffrant effect of alginate and inulin on intestinal microbial ecology of weanling pigs reared under different husbandry conditions. FEMS Microbiol. Ecol. 2010, 72, 132–142. [Google Scholar] [CrossRef] [PubMed]
  8. De Vos, B.; Lettens, S.; Muys, B.; Deckers, J.A. Walkley–Black analysis of forest soil organic carbon: Recovery, limitations and uncertainty. Soil Use Manag. 2007, 23, 221–229. [Google Scholar] [CrossRef]
  9. Guebel, D.V.; Nudel, B.C.; Giulietti, A.M. A Simple and rapid micro-Kjeldahl method for total nitrogen analysis. Biotechnol. Tech. 1991, 5, 427–430. [Google Scholar] [CrossRef]
  10. Ruiz-Calero, V.; Galcera, M.T. Ion chromatographic separations of phosphorus species: A review. Talanta 2005, 66, 376–410. [Google Scholar] [CrossRef] [PubMed]
  11. Jensen, H.L. Actinomycetes in Danish soils. Soil Sci. 1930, 30, 59–77. [Google Scholar] [CrossRef]
  12. Ahn, J.H.; Kim, Y.J.; Kim, T.S.; Song, H.G.; Kang, C.H.; Ka, J.O. Quantitative improvement of 16S rDNA DGGE analysis for soil bacterial community using real-time PCR. J. Microbiol. Methods 2009, 78, 216–222. [Google Scholar] [CrossRef] [PubMed]
  13. Smalla, K.; Wieland, G.; Buchner, A.; Zock, A.; Parzy, J.; Kaiser, S.; Roskot, N. Bulk and Rhizosphere Soil Bacterial Communities Studied by Denaturing Gradient Gel Electrophoresis: Plant-Dependent Enrichment and Seasonal Shifts Revealed. Appl. Environ. Microbiol. 2001, 67, 4742–4751. [Google Scholar] [CrossRef] [PubMed] [Green Version]
  14. Kim, M.C.; Ahn, J.H.; Shin, H.C.; Kim, T.; Ryu, T.H.; Kim, D.H.; Song, H.G.; Lee, G.H.; Ka, J.O. Molecular Analysis of Bacterial Community Structures in Paddy Soils for Environmental Risk Assessment with Two Varieties of Genetically Modified Rice, Iksan 483 and Milyang 204. J. Microbiol. Biotechnol. 2008, 18, 207–218. [Google Scholar] [PubMed]
  15. Bruinsma, M.; Kowalchuk, G.A.; Van Veen, J.A. Effects of genetically modified plants on microbial communities and processes in soil. Biol. Fertil. Soils 2003, 37, 329–337. [Google Scholar] [CrossRef]
  16. Zhang, Z.; Liu, Y.; Yu, C.; Bao, W.; Dong, S.; Yu, R.; Chen, M.; Wang, C. Genetically modified WYMV-resistant wheat exerts little influence on rhizosphere microbial communities. Appl. Soil Ecol. 2016, 105, 169–176. [Google Scholar] [CrossRef]
  17. Ma, B.L.; Blackshaw, R.E.; Roy, J.; He, T. Investigation on gene transfer from genetically modified corn (Zea mays L.) plants to soil bacteria. J. Environ. Sci. Health Part B Pestic. Food Contam. Agric. Wastes 2011, 46, 590–599. [Google Scholar] [CrossRef] [PubMed]
  18. Hagi, T.; Minagawa, A.; Shima, J. Dynamics of genetically modified Lactococcus lactis in simulated natural environments and impacts on microbial communities. J. Biosci. Bioeng. 2009, 107, 339–343. [Google Scholar] [CrossRef] [PubMed]
Figure 1. Total bacterial count and changes of the inoculated strain counts in LB medium (A,C,E) and LPK medium (B,D,F) after the release of living modified microorganisms (LMM) and wild-type strains into microcosm. (A,B), factory soil microcosm; (C,D), forest soil microcosm; (E,F), sedimentary river soil microcosm. T-control, total bacterial counts in the control group; T-SEM002, total bacterial counts in the soil inoculated with SEM002; T-wild type, total bacterial counts in the soil inoculated with the wild-type strain; SEM002, number of SEM002 cells in the SEM002-inoculated soil; wild type, number of wild-type cells in the wild-type-inoculated soil. Dotted lines indicate undetectable level of SEM002 and wild-type strains. Dotted lines parallel to the x-axis indicate background level of indigenous microorganisms in antibiotic selection media.
Sustainability 12 05566 g001
Figure 2. Changes in the density of total bacteria (PTYG media), fungi, and actinomycetes in the soil after release of LMM and wild-type strains. (A) factory soil microcosm; (B) forest soil microcosm; (C) sedimentary river soil microcosm. T-control, total bacterial counts in the control group; T-SEM002, total bacterial counts in the soil after SEM002 inoculation; T-wild type, total bacterial counts of the wild type in the inoculated soil; Fungi-control, total fungal counts in the control group; Fungi- SEM002, total fungal counts in the SEM002-inoculated soil; Fungi-wild type, total fungal counts in the wild-type-inoculated soil; Act-control, total actinomycete counts in the control group; ACT- SEM002, total actinomycete counts in the SEM002-inoculated soil; ACT-wild type, total actinomycete counts in the wild-type-inoculated soil.
Sustainability 12 05566 g002
Figure 3. Changes in the copy number of the 16S rRNA gene and kanamycin resistance gene in the soil after LMM and wild-type strain release. (A,B), factory soil microcosm; (C,D), forest soil microcosm; (E,F), sedimentary river soil microcosm. SEM002, copy number of the kanamycin resistance gene in the SEM002-inoculated soil; wild type, background copy number of the kanamycin resistance gene in the wild-type (ATCC 13032)-inoculated soil; control, background copy number of the kanamycin resistance gene in the control group.
Sustainability 12 05566 g003
Figure 4. Analysis of structural changes of the bacterial community in the soil using real-time PCR-DGGE ((A) Day 0 of the factory soil microcosm experiment; (B) Day 97 of the factory soil microcosm experiment; (C) Day 0 of the forest soil microcosm experiment; (D) Day 94 of the forest soil microcosm experiment; (E) Day 0 of the sedimentary soil microcosm experiment; (F) Day 92 of the sedimentary soil microcosm experiment). SEM002, LMM-inoculated soil; Wild type, ATCC 13032 strain-inoculated soil; Control, uninoculated soil. The arrows indicate DGGE bands of LMM and wild-type strains.
Sustainability 12 05566 g004
Table 1. Analysis of soil samples.
Factory SoilForest SoilSedimentary Soil
pH7.834.376.95
Organic content (%)1.037.213.88
T-N (%)0.04490.26790.1657
Exchangeable Ca (mg/kg)871.50159.30755.3
Exchangeable Mg (mg/kg)31.5221.3458.56
Exchangeable K (mg/kg)93.5194.7280.76
Exchangeable Na (mg/kg)501.50456.70500.20

