Article

Assessment of Ventilation Efficiency in School Classrooms Based on Indoor–Outdoor Particulate Matter and Carbon Dioxide Measurements

1
Faculty of Physics and Applied Computer Science, AGH University of Science and Technology, 30-059 Krakow, Poland
2
Krakow Smog Alert Association, 31-104 Krakow, Poland
*
Author to whom correspondence should be addressed.
Sustainability 2020, 12(14), 5600; https://0-doi-org.brum.beds.ac.uk/10.3390/su12145600
Submission received: 1 June 2020 / Revised: 7 July 2020 / Accepted: 9 July 2020 / Published: 12 July 2020

Abstract

:
The concentration of indoor suspended particulate matter is considered to be one of the main factors that affect health and quality of life. In Poland, in response to the pressure of public opinion, a few thousand air purifiers have been installed in public buildings where children spend time. However, another factor that also impacts upon the quality of indoor air, namely increased CO2 mixing ratios, is frequently overlooked. The only way to remove CO2 excess from interiors is through intensive ventilation. This is often an action at odds with the need to maintain low concentrations of particulate matter in indoor air. Two methods are presented to assess the rate of air exchange using CO2 or particulate matter as a tracer. One of the methods using indoor/outdoor PM (particulate matter) concentrations is based on the use of box models for analysis. The second one uses indoor CO2 concentration change analysis. At the tested locations, they showed large deviations of the determined values of the air exchange coefficients from its limits. Both methods showed consistent ventilation parameters estimation.

1. Introduction

For many years now, the problem of poor air quality, understood mainly as over-normative concentrations of particulate matter (PM), has been raised in Poland [1,2,3,4]. PM in outdoor and indoor air is recognised as one of the key factors most affecting health and quality of life [5]. Recently, the government has initiated activities aimed at reducing concentrations of PM in ambient air. A number of actions have been taken to improve indoor air quality, primarily by the introduction of purification and filtration devices. The main priority is to improve the air quality (in this case understood as the concentration of PM) in places where young people spend long periods of time, such as school and pre-school buildings. There are many initiatives, both civil and governmental, in particular at a local governmental level, aimed at purchasing these so-called air purifiers and installing them in these locations. Focusing on the problem of particulate matter concentration, CO2 has been forgotten; however, it is also a critical component of the indoor air quality [6,7,8,9]. The only technically and economically effective, rational way to remove carbon dioxide is intensive air exchange by means of ventilation. Aiming at keeping low the particulate matter concentration inside the buildings, the pure air exchange needs to be organized according to the requirements of the relevant standards and regulations for the efficient removal of PM and CO2 [10]. The devices used so far in this type of location are very rarely able to meet the regulation requirements. The commercial equipment that was usually bought for schools was able to clean up to 300 m3/h of air, which is most often lower than the required air exchange rate for this type of space. The only parameter the regulation of automatic ventilation systems is based on is the measurement of indoor CO2 concentration [11].
In this work, we present a comparison of two methods allowing to estimate the efficiency of the indoor air exchange rate (AER) based on the concentration measurement of relevant air pollutants. It is worth underlining that, in the case of this work, we are dealing with a high outdoor PM concentration level, and usually local authorities recommend reducing the ventilation in order to keep the indoor air quality at an acceptable level. This is a unique situation in comparison to most of the other studies where the indoor air quality is affected by industrial activity. For that reason, we aim at delivery of a product which would minimize the ventilation efficiency but allow maintenance of healthy carbon dioxide levels.

2. Materials and Methods

Ten classrooms in different schools throughout Poland were selected for this research. The buildings have diverse types of ventilation (natural or mechanical), and some of them have an air purification system (Table 1). Measurements in each location were taken over approximately two consecutive weeks.
Two methods to assess the rate of indoor air exchange were applied. One of them is based on the results of carbon dioxide measurements in the indoor air. The second method is based on the relationship between indoor and outdoor concentrations of PM10. For both methods, measurements were performed with a time resolution of 2 min. The averages of two-minute measurement intervals were logged.

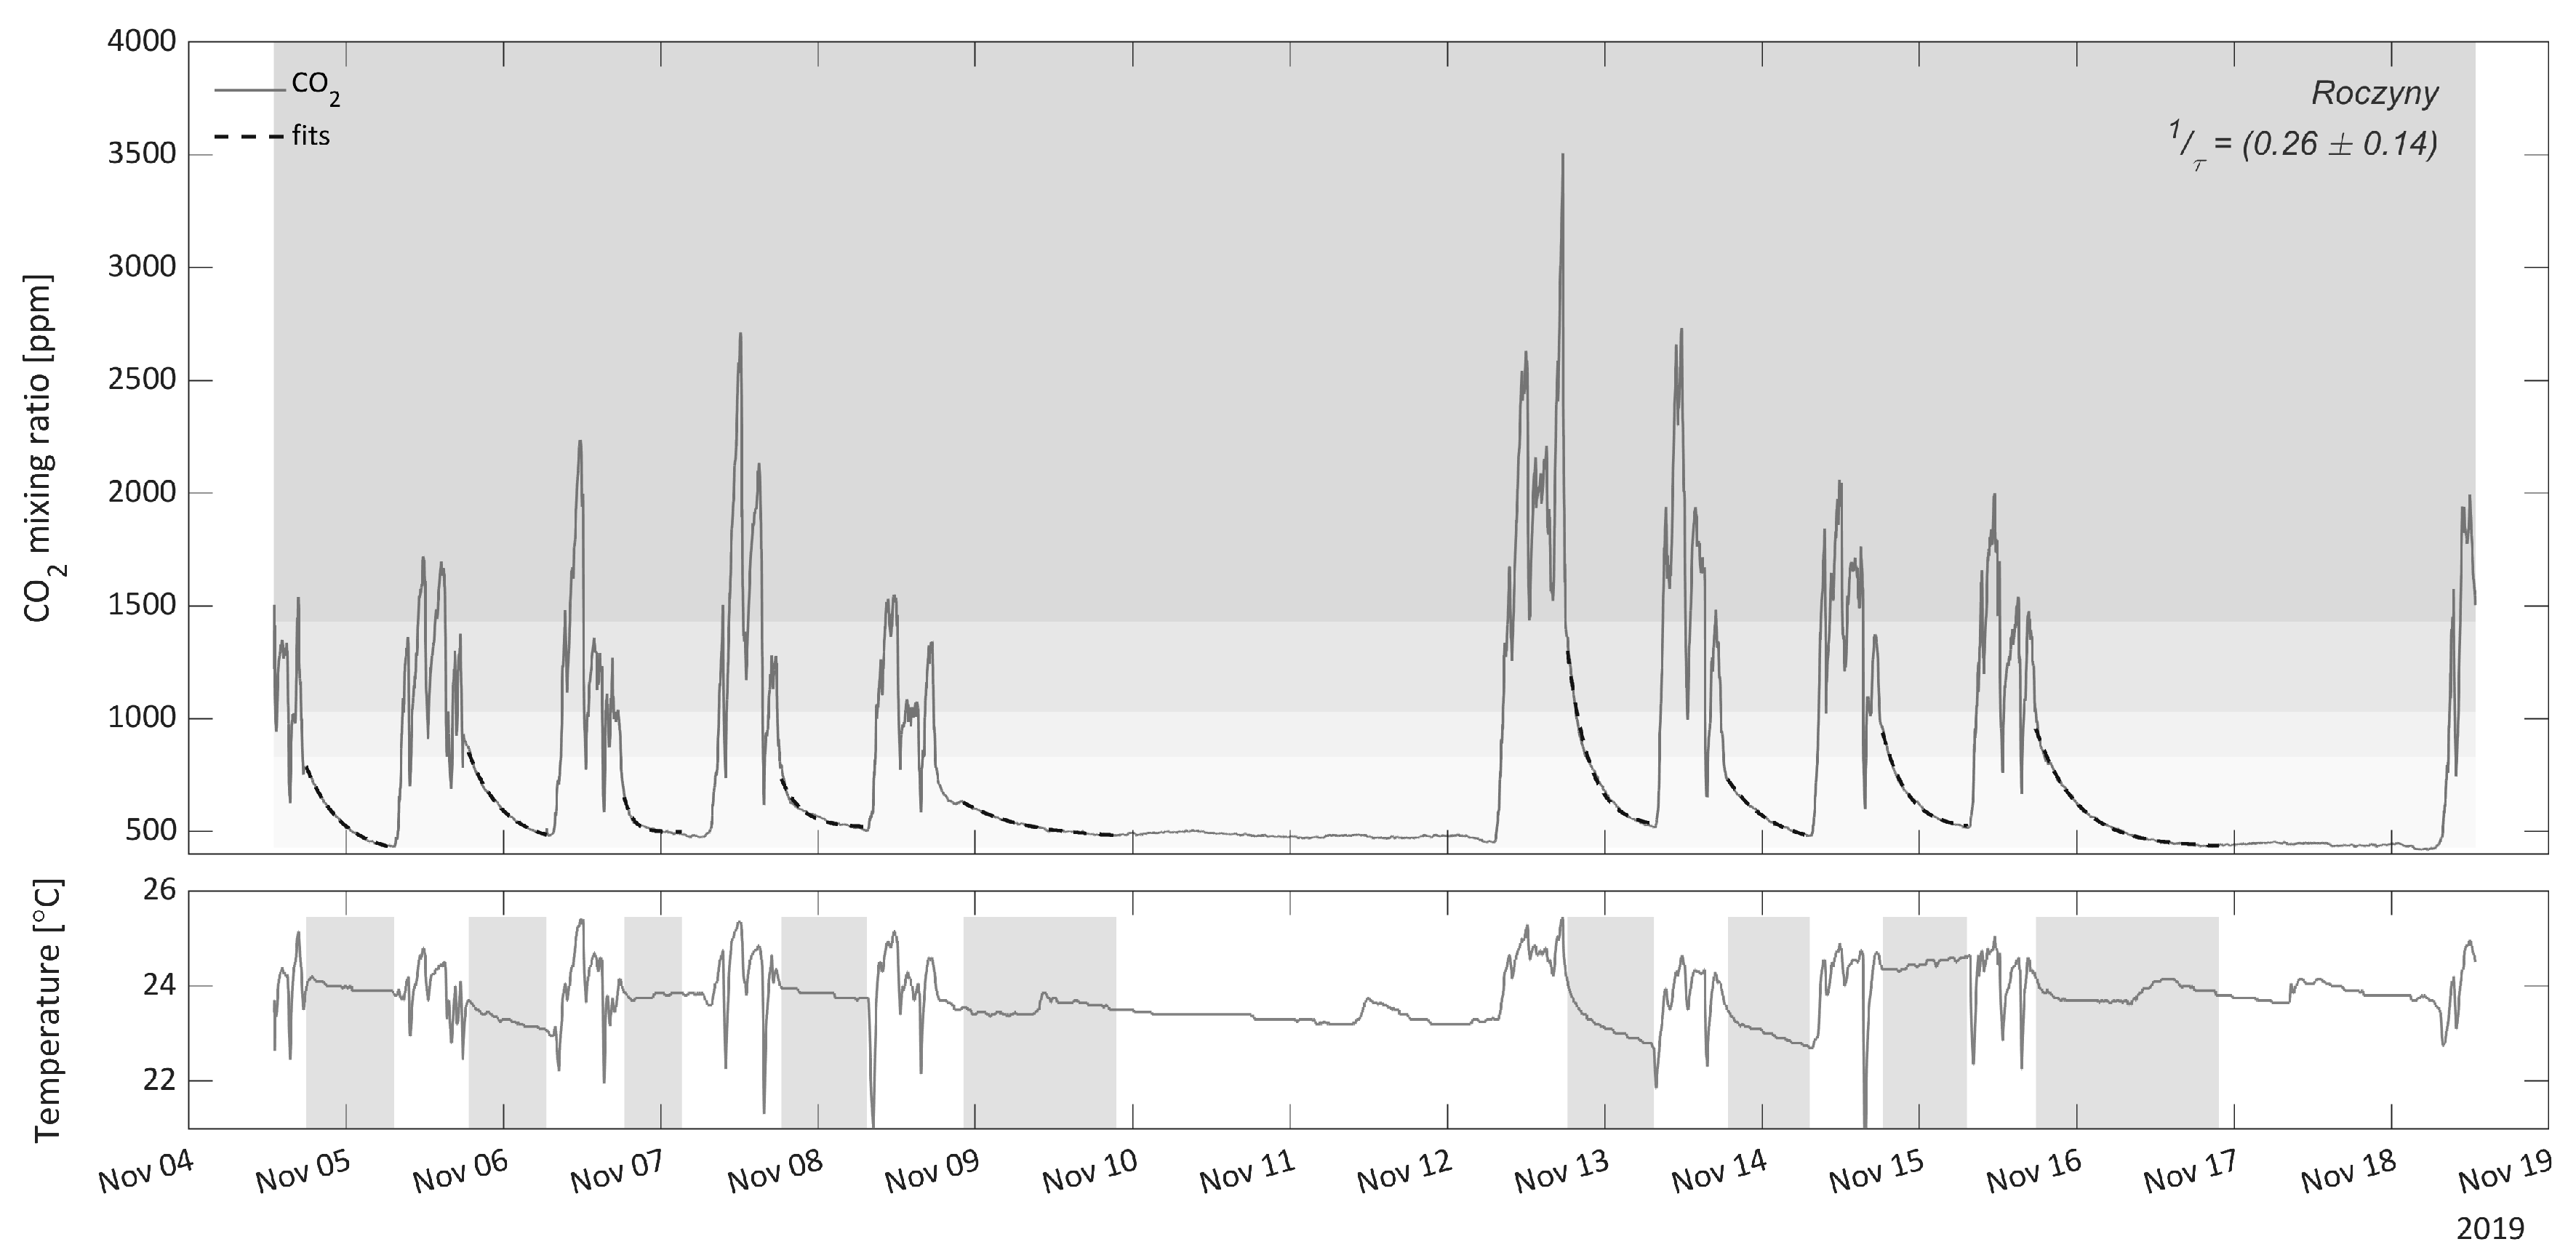
2.1. CO2-Based Method

In the CO2-based method, the three Nondispersive Infrared (NDIR) low-cost sensors (Sensirion Inc. model SCD30) were used to measure trace gas mixing ratios. This type of sensor uses the attenuation of near-infrared radiation by CO2 particles present in the measurement cavity. For the validation of sensor indications, they were pre-calibrated, based on measurements with the laser spectroscopy analyzer using cavity ring down spectroscopy (CRDS model 2201-i, Picaro Inc.), whose indications were based on standard gas calibration mixtures and refer to World Meteorological Organization (WMO) scale. Subsequently, the sensors were tested for stability of readings. Just after the test measurements were carried out, the indications of the three sensors were initially analyzed. The sensor most departed from the two others was rejected if the deviation was statistically significant. The readings of all the sensors that were used in further steps of the experiment were averaged. Additionally, the CO2 sensors which were mounted into the device were also accompanied with a humidity, pressure, and temperature sensor (based on the BME280 microchip) and a stable power supply.
The developed CO2 analyzers were deployed in the classrooms. The mixing ratios were evaluated using a parallel record of the indoor air humidity and temperature. Only the periods when there was no possible CO2 production inside and the initial concentrations were high enough (approximately over 1000 ppm) were taken into account. Based on temperature and humidity indications, we analyzed whether the windows in the rooms were opened (e.g., for ventilation) during the selected periods.
Assuming that the air entering from outside is well mixed within the room, the exponential mixing model was used [12]. The relationship given in Equation (1) was adjusted by the non-linear regression method to select periods of the CO2 mixing ratios.
C ( t ) = C 0 · e ( t τ R T ) + C A ,
where C(t) represents the temporal variation of the indoor CO2 mixing ratio, C0 is the initial CO2 mixing ratio at the start of the analysis, τRT is the mean residence time of the indoor air, and CA is the theoretical CO2 mixing ratio in the ambient air. The external CO2 mixing ratio was not measured in this study but estimated during the regression procedure. The time (t) in the formula was given in hours similar to the unit of τRT coefficient. The 1/τRT parameter can be interpreted as the mean number of air changes in the monitored space per unit of time (hour) and referred to the AER. This parameter is standardised and regulated by the relevant regulations [10]. For each analysis, the AER was determined with an uncertainty corresponding to a 95% level of confidence. The mean coefficient for all analyses in a given location and its uncertainty at the same confidence level were provided.

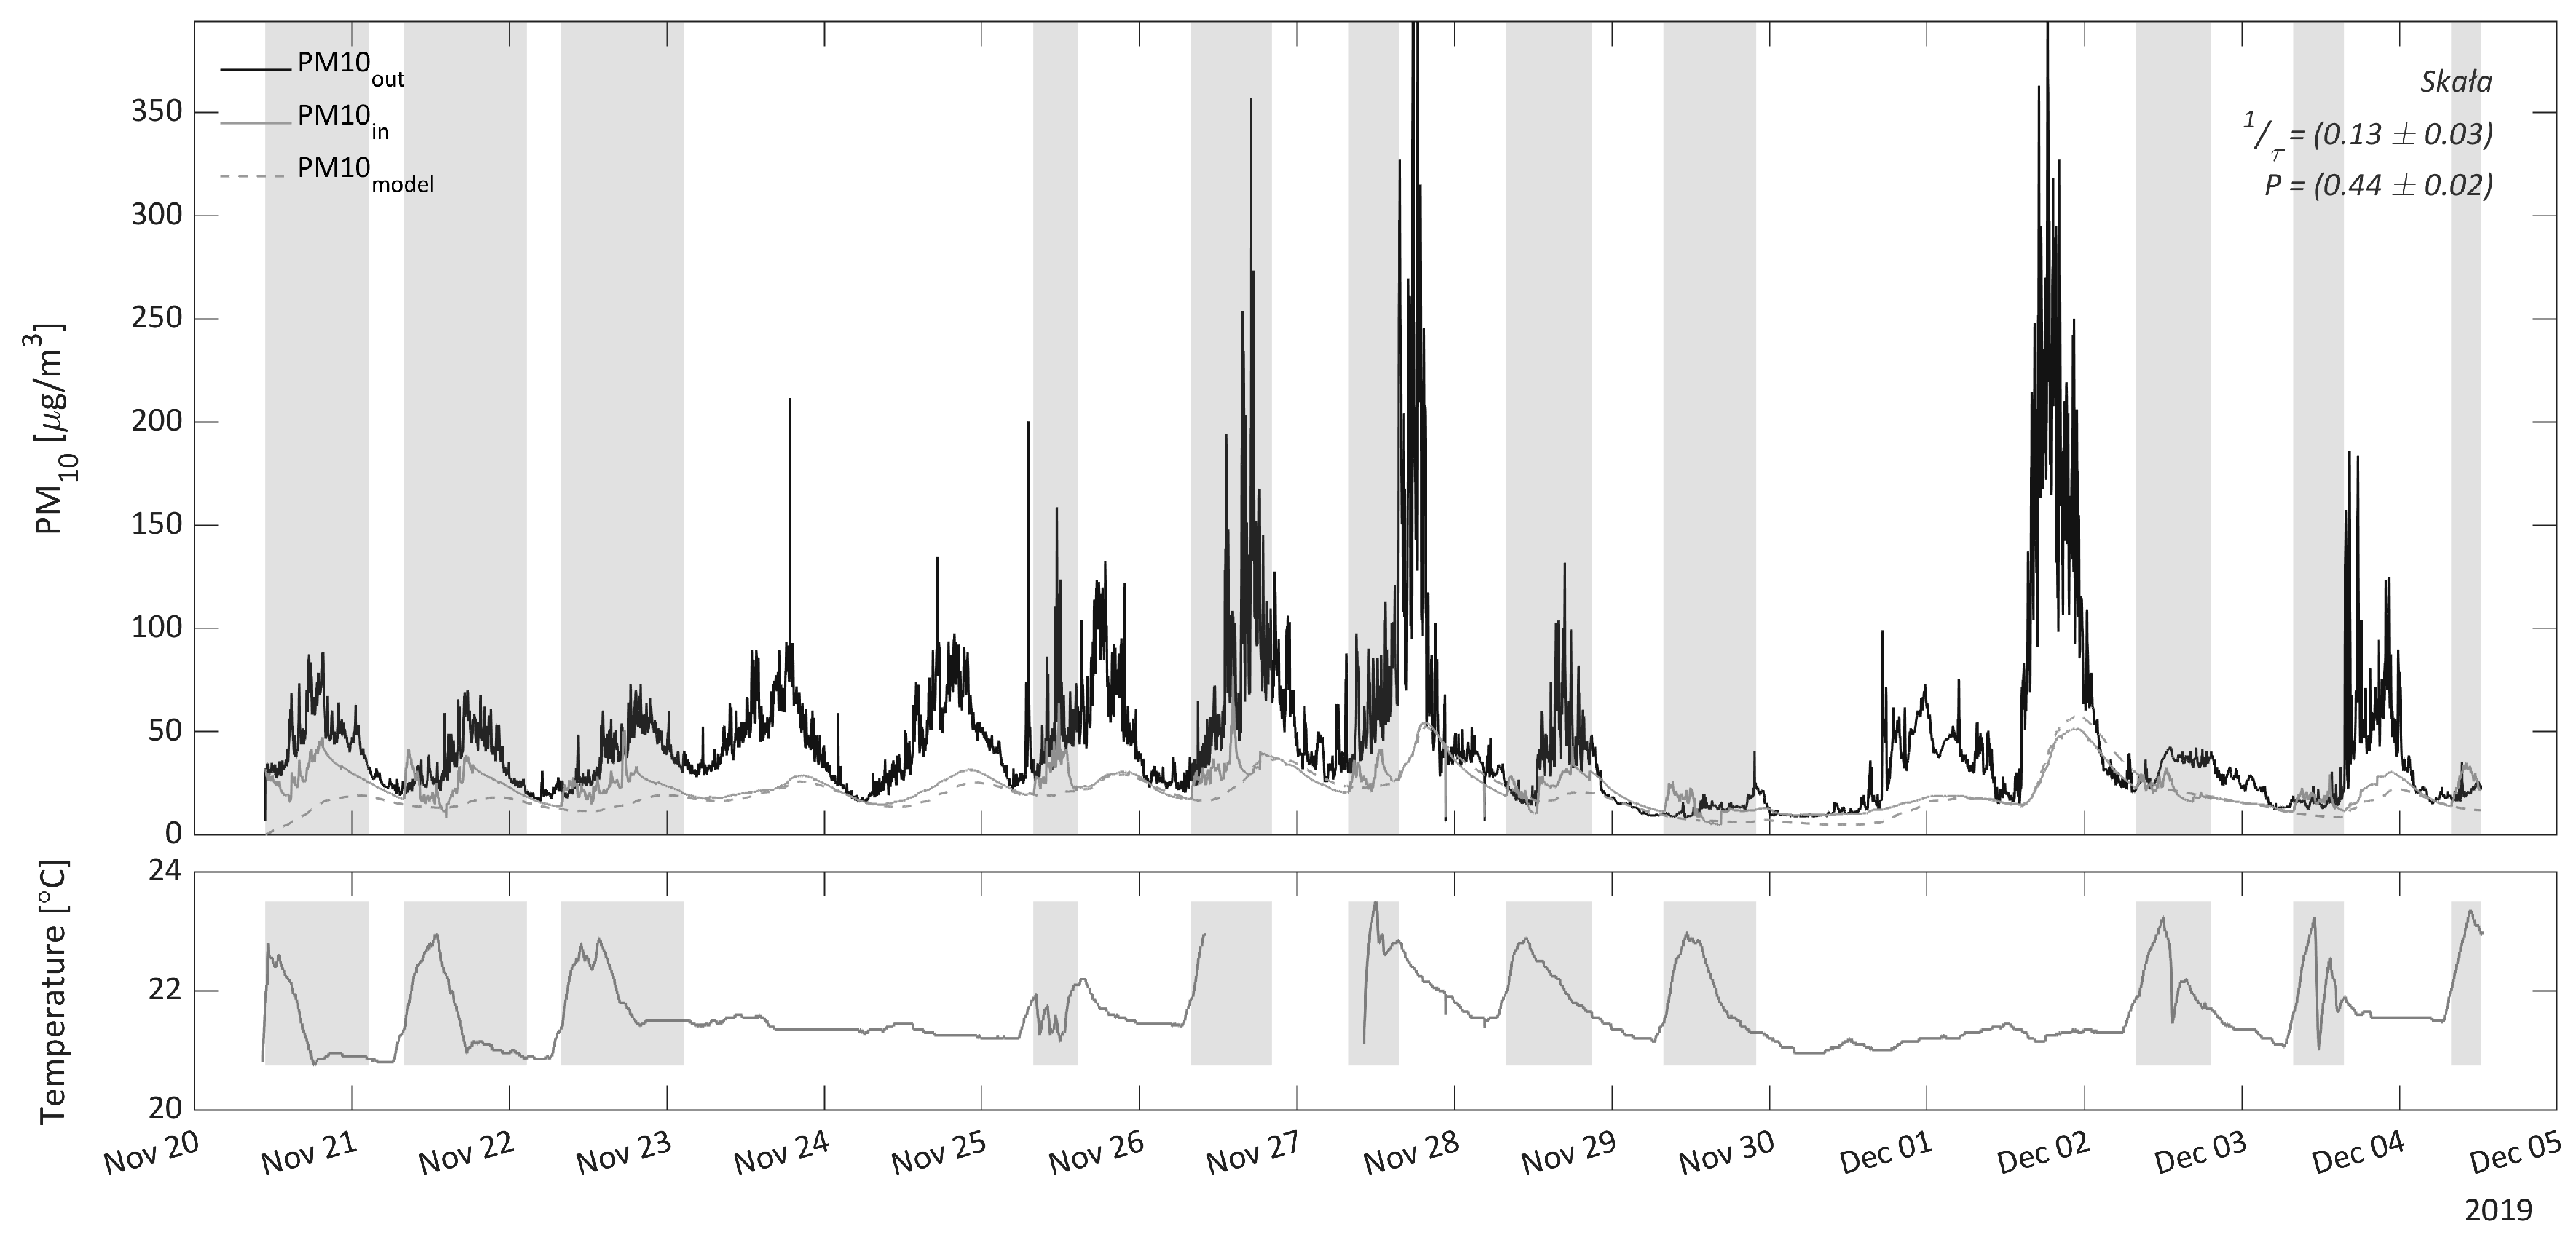
2.2. PM-Based Method

This method is based on the analysis of the relationship between indoor and outdoor PM10 concentrations measured by two DustTrak analysers (TSI Inc, model 8540). The principle of operation of these instruments is based on the scattering of laser light on the particles. A 10µm (PM10) cut-off impactor was installed inside the inlet. The devices were pre-calibrated based on the reference (gravimetric) method. The consistency of the indications between two instruments was key to the success of the applied method. The instruments worked together in the same environment for at least several hours before each series of measurements. Subsequently, one of the devices was installed in the classroom together with CO2 measurements. The second device was installed outside, as close as possible to the building where the measurements were carried out. However, this was done in such a way that there was no direct influence of nearby sources of particulate matter and that meteorological conditions did not interfere with the measurements. In the case of analyses based on PM10 concentrations, the whole period of the measurements at one location was analysed. Only intervals that did not reflect typical indoor air exchange were rejected from the record. These were situations, for example, when the emission of PM occurred inside the room or when the windows in the room were opened.
For the analysis of PM data, a box model with a modified exponential transition (response) function was used [13,14,15]. In the model, the input function is the time series of outdoor PM10 concentration, and the output function is the time series of indoor PM10 concentration. Again, the use of the exponential transition function represents the assumption of ideal mixing of indoor air.
The relationship between the input and output function is described by the respective convolution function:
C i n ( t ) = t C o u t ( τ ) · g ( t τ )   d τ ,
where Cin(t) is the indoor PM10 concentration time series, Cout is the outdoor PM10 concentration time series, t is clock time, τ is flow time (age) of individual air portions, and g(τ) is the response function (transition function). It is considered that not all the particulate matter gets into the building together with the airflow; part of the PM might be filtered when passing through barriers (nets, ventilation tubes, etc.). Therefore, the response function is not a conservative variable and has two parameters: one is the average air residence time (τRT) and the other is the penetration factor P [16]. The transition function has a form:
g ( τ ) = P 1 τ R T e ( t τ R T ) ,
The penetration factor P describes fraction of particles in the infiltration air that passes through the building shell. The box model approach allows the determination of the penetration factor even in case of high variability of the PM concentrations. In this case, the determination of portion of the pollutants infiltrating into the indoor air through a simple indoor/outdoor (I/O) ratio could give false results, especially for short measurement periods (several τRT). Using the penetration factor, it is assumed that there are no internal sources of particulate matter, and with the dynamics of change and concentration of PM, the deposition is negligible.
To determine the values of the model’s parameters, the convolution function was optimized to achieve the maximum agreement between observed indoor PM level and was calculated by Equation (2). The minimized parameter was RMSE (root-mean-square error). Data from periods not included in the analysis were not used to determine the RMSE. When determining parameters by minimizing the error function, the Hessian of the obtained parameters can be taken as a measure of uncertainty. Uncertainties obtained by this method were extended to a confidence level of 95%. Another approach to estimating the uncertainty of the coefficients in the box model method is an iterative approach. From the full set of the measurement data, a subset of data was randomly selected. It was mandatory to assume that the subset was continuous and could not be smaller than half of the record. The distribution of the subset length is a uniform distribution over the range [0.5, 1] of the original set length. On such a selected subset, optimization was performed. The selection of the subset was repeated multiple times, and, on this basis, the standard deviation of the obtained results was determined, which was also extended to a confidence level of 95%.
The locations selected for the analysis are public buildings. For such locations, the air exchange rate is regulated by appropriate legislation [10] and is related to the number of people in the space. Typically, the required fresh air flow rate is assumed to be 20m3/h/pers. Based on the acquired volumes and the declared class capacities, the required fresh air flow rate and the AER(1/τRT) were determined for each location.

3. Results and Discussion

Primarily, the air exchange rates required by building and sanitary regulations have been determined. For all locations, they varied from 2.2 to 3.2 exchanges per hour (Table 2). The low variability of this parameter is due to legislative requirements. The size of the room is optimized in terms of the number of people that can occupy it.

3.1. CO2

For each location, 4 to 10 analyses of the rate of CO2 mixing ratio decrease were carried out (see Figure 1). In one of the locations, it was not possible to apply the above approach due to the intense room ventilation by opening of the windows after lessons. Results were obtained in the range from (0.05 ± 0.01) to (1.47 ± 0.22) air changes per hour. The value of 1.47 1/h was the outlier, and the second highest value was (0.65 ± 0.33) air changes per hour. Using CO2 as a tracer, the relative uncertainties of exchange rate at a confidence level of 95% were between 0.15 and 0.77 with a correlation coefficient between the number of analyses performed and a relative uncertainty of −0.45. The declining number of the performed analyses caused high relative uncertainties. It is worth underlining that this method requires specific conditions to be applied. Due to the fact that the method is based on the decay of CO2 mixing ratio, it requires an initial high value of the carbon dioxide. It cannot be used when there are no emissions in the room for a long time (cf. Figure 1). It is clear that on days Nov. 10 and 12, and Nov. 18 (weekend days), it was not possible to adjust the curves using the regression method. The length of the data range to which the regression method curve was adjusted depends on the rate of air exchange. It usually lasted from the moment pupils left the room until their return the next day (typically 12 h).
Inside the classrooms, the observed CO2 mixing ratios in each case temporarily exceeded 1500 ppm. The maximum observed value was well over 3000 ppm. Such concentration can have a significant impact on the level of human perception [17].

3.2. PM

Analyses using concentrations of particulate matter provided results of AER in the range (0.11 ± 0.04) to (0.77 ± 108.48) 1/h. The uncertainty values obtained using Hessian are purely mathematical and may therefore be overestimated in relation to the real variability of the parameters determined. The uncertainties were therefore determined by means of an iterative method. Analyses with a random subset of the record were repeated 100 times. Increasing the number of draws of a subset of data no longer increased the significance of the results obtained. The mean values of the coefficients determined by the iterative method were consistent with the values obtained from the whole data set at the significance level of 0.01.
In order to determine whether the two-week duration of the experiment was a sufficient time to obtain reliable results, a study of the effect of the measurements duration on the spread of the obtained results was performed. From the full set of data, sub-periods ranging from 2 days to full length were sampled randomly. The length of all the sub-periods were equally represented, in these calculations, forming a uniform distribution. The performed analyses revealed that, for all the measurement locations, the measurement periods lasting longer than any 7 days showed constant variance of the obtained AER values and were equal to that reported while estimating the uncertainty of AER. For parameter P, the spread of values was stabilized for the measurements lasting over 9 days.
Even though a simple model to describe a complex system was used, the indoor particulate matter concentrations determined by the model were consistent (Pearson correlation coefficient r2 > 0.96) with the measurements (cf. Figure 2). In the optimization of the model, the periods were rejected for which the influence of factors other than the typical room air exchange (e.g., intensive room airing, resuspension caused by people) was suspected.
Determining the AER using box models is more efficient in cases where there are high dynamics of concentration changes over time. For those cases, when the concentration was stable, the highest values of the uncertainty were obtained. The relative uncertainties of the AER varied from 0.09 to 0.36 at a confidence level of 95% when the anomalous uncertainty value for the analysis from location No. 10 was rejected. The Hessian uncertainty analysis of the results for location No. 10 also gave anomalously high values of the uncertainty at a 95% confidence level equal to 14.02 1/h. The experiment in this location was performed while the atmospheric variability of PM in the atmosphere was depressed and the diurnal cycle was not present in the majority of cases. It underlines that not every location is suitable for this method. It might be successfully applied in regions of high atmospheric pollution. This is one of the reasons this method was not applied previously.
Comparison analysis of two independent methods revealed relative differences in the range of 0.06 to 1.18. As the experiment was performed in only 10 locations, the statistics cannot be routinely applied. Our discussion in this case confined to the qualitative aspects. Most of the parameters received by the two methods were consistent with each other at the 0.05 level of significance. Locations N° 8 and N° 9 were exceptions. For location N° 8, the analyses carried out by the CO2 method provided abnormally high values of the determined coefficient. For the analysis at location N° 9, the lowest AER values were obtained with standard deviations similar to the remaining ones. For location N° 10, the values were in compliance at the mentioned level, even without considering the high uncertainty of the method based on PM analyses.
Analysing the particulate matter concentrations, the penetration factor was determined. The values determined varied from (0.42 ± 0.02) to (0.63 ± 0.02). Surprisingly, there was no direct relationship between the P value and the presence of the air purification system. The penetration factor in the two locations, where mobile indoor air purifiers have been installed, also did not exceed the range of variation from the other locations. Surprisingly, the highest P factor was found in the building, where the central air purifier is installed. The results determined by the box model method were consistent, within the uncertainty limits, with the results determined by calculating the ratio between indoor and outdoor concentrations in the whole measurement set.
Studies performed using both CO2 and PM10 as markers have shown that the AERs obtained in each case are even several times lower than those resulting from the standards. The factors determined by two methods, for all except one location, were consistent. Both approaches have a good prognosis for use as non-invasive air exchange rate analysis methods. The method based on PM measurements is less sensitive to the space where the experiment was performed. It is possible to use it even in an unutilized location. This is not possible with a method using CO2 concentration as it is necessary to generate the initial concentration of the measured gas for analysis. To obtain a reasonable level of uncertainty, the initial indoor concentration should be several times higher than the outdoor. However, the method using PM measurement requires two instruments and is sensitive to their inter-calibration. A positive advantage of both approaches is that it is not necessary to use an additional tracer (e.g., SF6) [18].
The study shows that the CO2 mixing ratios observed in the classrooms while people are in them may permanently exceed safe values and may contribute to lower mental performance among students [17].

4. Conclusions

The exchange rate of the air in a classroom can be reliably calculated from the results of the measurements using a low-cost sensor, which is easy to install in every classroom. AERs received from the presented approaches were consistent with each other and reflect the actual air exchange rate, which is several times lower than the values required by the relevant legislation. The two-week period of the measurements was proven to be a sufficient time for determination of AER values. The method based on PM measurements requires a relatively high pollution incidence to provide the reliable output. Here, we introduce the novelty of the application of a simple calculation based on observations, even which can help in keeping a good indoor air quality. There is also no evidence that the use of air purifiers in enclosed spaces in any way affects the concentration of particulate matter inside, and the same is true for the central filtration system which reflects the highest penetration factor observed. This means, that schools should use much more efficient filtration systems than anticipated. Extremely high concentrations of CO2 can be observed in classrooms when pupils are present, which is clearly due to poor ventilation efficiency. In this case, further action should be undertaken by a building administration to meet the required air exchange rate. The application of that methodology for continuous observations of the CO2 and PM concentration levels in the classrooms is applicable with a variety of low-cost sensors and does not necessarily imply a high cost investment for the school to gain better air quality standards.

Author Contributions

Conceptualization, J.B. and D.Z.; methodology, J.B.; software, J.B.; validation, J.N., M.Z. and D.Z.; formal analysis, J.B. and J.N.; investigation, J.B.; resources, J.B. and J.N.; data curation, J.B.; writing—original draft preparation, J.B.; writing—review and editing, J.N., M.Z. and D.Z.; visualization, J.B.; supervision, M.Z.; project administration, D.Z.; funding acquisition, D.Z. All authors have read and agreed to the published version of the manuscript.

Funding

The current work was partially supported by the Polish Ministry of Science and Higher Education (projects no. 16.16.220.842 B02); partially financed with LIFE Integrated Project “Implementation of Air Quality Plan for Małopolska Region – Małopolska in a healthy atmosphere” LIFE IP MALOPOLSKA/LIFE 14 IPE PL021.

Acknowledgments

The project was initiated by the Krakow Smog Alert Association.

Conflicts of Interest

The authors declare no conflicts of interest. The funders had no role in the design of the study; in the collection, analyses, or interpretation of data; in the writing of the manuscript, or in the decision to publish the results.

References

  1. Błaszczyk, E.; Rogula-Kozłowska, W.; Klejnowski, K.; Kubiesa, P.; Fulara, I.; Mielżyńska-Švach, D. Indoor Air Quality in Urban and Rural Kindergartens: Short-Term Studies in Silesia, Poland. Air Qual. Atmos. Health 2017, 10, 1207–1220. [Google Scholar] [CrossRef] [PubMed] [Green Version]
  2. Mainka, A.; Zajusz-Zubek, E.; Kaczmarek, K. PM10 Composition in Urban & Rural Nursery Schools in Upper Silesia, Poland: A Trace Elements Analysis. Int. J. Environ. Pollut. 2017, 61, 98–118. [Google Scholar]
  3. Chambers, S.D.; Podstawczyńska, A. Improved Method for Characterising Temporal Variability in Urban Air Quality Part II: Particulate Matter and Precursors in Central Poland. Atmos. Environ. 2019, 219, 117040. [Google Scholar] [CrossRef]
  4. Morawska, L.; Ayoko, G.A.; Bae, G.N.; Buonanno, G.; Chao, C.Y.H.; Clifford, S.; Fu, S.C.; Hänninen, O.; He, C.; Isaxon, C.; et al. Airborne Particles in Indoor Environment of Homes, Schools, Offices and Aged Care Facilities: The Main Routes of Exposure. Environ. Int. 2017, 108, 75–83. [Google Scholar] [CrossRef] [PubMed]
  5. World Health Organization. Regional Office for Europe. Health Aspects of Air Pollution with Particulate Matter, Ozone and Nitrogen Dioxide; WHO Regional Office for Europe: Bonn, Germany, 2003. [Google Scholar]
  6. Kozielska, B.; Mainka, A.; Żak, M.; Kaleta, D.; Mucha, W. Indoor Air Quality in Residential Buildings in Upper Silesia, Poland. Build. Environ. 2020, 177, 106914. [Google Scholar] [CrossRef]
  7. Kozielska, B.; Brągoszewska, E.; Kaleta, D. Investigation of Indoor Air Quality in Offices and Residential Homes in an Urban Area of Poland. Air Qual. Atmos. Health 2020, 13, 131–141. [Google Scholar] [CrossRef]
  8. Mahyuddin, N.; Awbi, H.B. A Review of CO2 Measurement Procedures in Ventilation Research. Int. J. Vent. 2012, 10, 353–370. [Google Scholar] [CrossRef]
  9. Satish, U.; Mendell, M.J.; Shekhar, K.; Hotchi, T.; Sullivan, D.; Streufert, S.; Fisk, W.J. Is CO2 an Indoor Pollutant? Direct Effects of Low-to-Moderate CO2 Concentrations on Human Decision-Making Performance. Environ. Health Perspect. 2012, 120, 1671–1677. [Google Scholar] [CrossRef] [PubMed] [Green Version]
  10. CEN (European Committee for Standardization). Ventilation for Non-Residential Buildings - Performance Requirements for Ventilation and Room Conditioning Systems. Ital. Stand. 2005, 1, 1–75. [Google Scholar]
  11. Fan, Y.; Kameishi, K.; Onishi, S.; Ito, K. Field-Based Study on the Energy-Saving Effects of CO2 Demand Controlled Ventilation in an Office with Application of Energy Recovery Ventilators. Energy Build. 2014, 68, 412–422. [Google Scholar] [CrossRef]
  12. Cui, S.; Cohen, M.; Stabat, P.; Marchio, D. CO2 Tracer Gas Concentration Decay Method for Measuring Air Change Rate. Build. Environ. 2015, 84, 162–169. [Google Scholar] [CrossRef]
  13. Maloszewski, P.; Zuber, A. Lumped Parameter Models for the Interpretation of Environmental Tracer Data. In Manual on Mathematical Models in Isotope Hydrogeology, TECDOC-910; IAEA, Ed.; International Atomic Energy Agency Publishing Section: Vienna, Austria, 1996. [Google Scholar]
  14. Geyh, M. Volume IV Groundwater: Saturated and Unsaturated Zone. In Environmental Isotopes in the Hydrological Cycle Principles and Applicationst; Mook, W.G., Ed.; International Atomic Energy Agency Publishing Section: Paris, France, 2000; pp. 308–424. [Google Scholar]
  15. Zuber, A.; Maloszewschi, P.; Campana, P.E.; Harrington, G.A.; Tezcan, L.; Konikow, K.L. Volume VI Modelling. In Environmental Isotopes in the Hydrological Cycle Principles and Applicationst; Mook, W.G., Yurtsever, Y., Eds.; International Atomic Energy Agency Publishing Section: Paris, France, 2001; pp. 488–570. [Google Scholar]
  16. Chen, C.; Zhao, B. Review of Relationship between Indoor and Outdoor Particles: I/O Ratio, Infiltration Factor and Penetration Factor. Atmos. Environ. 2011, 45, 275–288. [Google Scholar] [CrossRef]
  17. Zhang, X.; Wargocki, P.; Lian, Z.; Thyregod, C. Effects of Exposure to Carbon Dioxide and Bioeffluents on Perceived Air Quality, Self-Assessed Acute Health Symptoms, and Cognitive Performance. Indoor Air 2017, 27, 47–64. [Google Scholar] [CrossRef] [PubMed] [Green Version]
  18. Niachou, K.; Hassid, S.; Santamouris, M.; Livada, I. Experimental Performance Investigation of Natural, Mechanical and Hybrid Ventilation in Urban Environment. Build. Environ. 2008, IV, 1373–1382. [Google Scholar] [CrossRef]
Figure 1. CO2 mixing ratios and room temperature in the school in location N° 1. On the upper panel, the measured CO2 mixing ratios are marked with a grey line, and the modeled mixing ratios decrease with the dashed black line. The intensity of the grey background corresponds to the exceeding of CO2 levels over ambient air according to [10].
Sustainability 12 05600 g001
Figure 2. Time series of PM10 concentrations outdoors and indoors and indoor temperatures in the school in location N° 3. On the upper panel, the black line indicates the outdoor concentrations, the continuous grey line indicates the indoor measured concentrations, and the dashed grey line indicates the modelled indoor concentrations. Grey rectangles on the lower panel represent periods excluded from modelling due to the influence of exceptional activities.
Sustainability 12 05600 g002
Table 1. Characteristics of various measurement locations.
Measurement PeriodLocationVentilation SystemAir Purification SystemDeclared Classroom Occupancy
104.11.2019–18.11.2019Roczynynaturalin the classroom25
204.11.2019–18.11.2019Sidzinanaturalno19
320.11.2019–04.12.2019Skałanaturalin the classroom18
420.11.2019–04.12.2019Wolbromnaturalno23
505.12.2019–19.12.2019Choczniamechanicalcentral25
605.12.2019–19.12.2019Tomicenaturalno30
703.01.2020–20.01.2020Nowy Targnaturalno22
803.01.2020–20.01.2020Paszynnaturalno16
921.01.2020–04.02.2020Otwocknaturalno22
1021.01.2020–04.02.2020Piastównaturalno22
Table 2. Air exchange rates (1/τRT) and penetration factor (P) determined from the legislations and regulations and calculated using methods based on CO2 mixing ratio and particulate matter concentration analysis.
Air flux (m3/h)AER (reg) (1/h)AER (CO2) (1/h)AER (PM) (1/h)P
15003.20(0.26 ± 0.14)(0.19 ± 0.03)(0.58 ± 0.02)
23802.82(0.39 ± 0.30)(0.34 ± 0.05)(0.58 ± 0.03)
33602.21(0.18 ± 0.05)(0.13 ± 0.03)(0.44 ± 0.02)
44602.57(0.16 ± 0.03)(0.17 ± 0.04)(0.56 ± 0.06)
55002.83no data(0.76 ± 0.07)(0.63 ± 0.02)
66002.86(0.26 ± 0.17)(0.20 ± 0.02)(0.42 ± 0.02)
74402.33(0.35 ± 0.14)(0.27 ± 0.06)(0.55 ± 0.02)
83202.93(1.47 ± 0.22) 1(0.38 ± 0.05)(0.61 ± 0.02)
94402.38(0.05 ± 0.01)(0.11 ± 0.04)(0.49 ± 0.09)
104402.69(0.65 ± 0.33)(0.77 ± 108.48) 1(0.60 ± 0.16)
1 Outlier values.

