Development of a New Methodology to Identity Promising Technology Areas Using M&A Information

1
School of Business, Sejong University, Seoul 05006, Korea
2
Department of IT Management, Hanshin University, Gyeonggi-do 18001, Korea
*
Author to whom correspondence should be addressed.
Sustainability 2020, 12(14), 5606; https://0-doi-org.brum.beds.ac.uk/10.3390/su12145606
Submission received: 15 June 2020
/
Revised: 8 July 2020
/
Accepted: 8 July 2020
/
Published: 12 July 2020
(This article belongs to the Special Issue Big Data for Sustainable Anticipatory Computing)
Abstract
:In this paper, we suggest a new methodology to identify promising technology areas by analyzing merger and acquisition (M&A) information. First, we present decision models for estimating the velocity and acceleration of M&A transactions to identify promising areas based on M&A information. Second, we identify the promising technology areas with longitudinal analyses of M&As over the entire period. Third, cross-sectional analysis is proposed to determine which technology areas are more promising through a relative comparison among technology areas within the IT sector for a specific period. The main significance of our research is that it is a prior data-based analytic method based on M&A transaction information to identify the growth of industry and technology. We hope this study will provide insights for R&D (Research&Development) policymakers and investment firms as a new approach that complements previous methods in exploring promising industry or technology areas.
1. Introduction
In a competitive industrial environment, early identification of technological opportunities is crucial for companies to formulate technology strategies that can provide a core competitive advantage over competitors and sustainable growth in the future. As more and more participants in the merger and acquisition (M&A) market develop a systematic approach to sustainable growth, sustainability issues are beginning to emerge in M&A transactions [1,2,3].
However, companies are struggling to diversify and grow their businesses due to a lack of diversification information, opportunity capturing capability, and actual commercialization capability.
To overcome these difficulties, a variety of forecasting methods to identify promising industry, business, or technology areas have been developed thus far. Some of the more useful and widespread forecasting techniques are judgmental methods and bibliometric analysis methods [4,5,6,7]. Judgmental methods fundamentally rely on the opinions of experts or panels with knowledge in the fields that are relevant to the forecast. These methods are largely dependent on the individual and are particularly vulnerable to bias [8]. Bibliometrics, in the context of technology forecasting, can be defined as statistical analysis research to produce and disseminate information concerning the use of recorded literature or patents for forecasting and decision making [9].
The methods mentioned above have some limitations, however, in applying their analysis results to the real world. The major problem of judgmental methods is that the results of the methods are not objective. Another drawback of judgmental methods is inconsistency. Inconsistency occurs when experts or panels apply different decision criteria to similar situations. In the case of bibliometric methods based on papers or patents, there is a time lag [10,11] for practical use in the market because it generally takes time to finally publish a paper or apply for a patent from finishing documents to publishing or application. Bibliometric methods also have some drawbacks, including quality, discipline variation, database variation, and bias and discrepancies [12,13,14]. Above all, all the above methodologies are not based on actual business transactions in the market, so they are somewhat different from the real business world. Consequently, there are some limitations in actually utilizing the analysis results.
Therefore, it is necessary to propose a new methodology to explore promising technology areas as a new business opportunity for future growth. The alternative to the above judgmental methods and bibliometric analysis methods is quantitative approaches to analyze M&A transaction information [15].
M&A transaction depicts two corporates’ efforts to create positive synergies through business combination [16,17]. M&A provides a mechanism to learn about the other firm’s technologies, to recombine knowledge and technologies residing in different firms, and thereby to generate innovations [15,18]. M&A also represents a massive asset reallocation within and across industries, often enabling firms to double in size in a matter of months on a microeconomic level [19]. M&A also accelerates global market expansion by providing alternatives to develop complementary technologies and innovative features [20,21]. Consequently, companies began to engage strategically in M&A transactions to create new business value, acquire technological capabilities, and achieve market share growth and global expansion [16,22]. On a macroeconomic level, as mergers tend to occur in waves and cluster by industry, it is easily understood that such transactions may radically and swiftly change the competitive architecture of affected industries [19].
Our previous study [23] supports that M&A activities play an essential role in identifying industries with lots of potential and that strategic investment planning can be drawn from both industry and time-lag perspectives. Thus, M&A transaction information itself shows dynamic linkages among industries or technologies through the strategic relations of participating companies. It can be very useful for analyzing correlations and convergences between different industries, businesses, or technology areas. Therefore, the analysis information based on the M&A transactions can be utilized as an infrastructure for identifying promising industry and technology areas or exploring new business opportunities for sustainable growth in the future.
In summary, our research aims to suggest a new methodology that can recommend promising industry or technology areas using M&A information. The significance of our study is that it is a prior data-based analytic method based on M&A transaction information that does not have a time-lag issue in identifying promising industry or technology areas.
The remainder of the paper is organized as follows. In the following section, prior research related to methods for technology/business opportunity analysis is introduced. In section III, we define two variables for the analysis to identify promising technology areas, the number of M&A transactions, and value of M&A transactions, and present decision models for evaluating the velocity and acceleration of M&A transactions to identify promising areas based on M&A information. In section IV, we identify the promising industry areas with longitudinal analyses of M&A trends by sub-industry in the IT (Information Technology) sector. Furthermore, cross-sectional analysis is proposed to determine which technology areas are more promising through a relative comparison among technology areas for a specific period. In order to derive a growing industry group within the IT sector for a particular period, promising industry groups are obtained using the K-means clustering algorithm. The paper concludes by presenting the research results, significance, and limitations of our research, and further research issues.
We hope our study results provide insights for R&D (Research&Development) policymakers and investment firms that need to decide on promising technology areas to cultivate or invest in, and for researchers who want to explore M&A information to identify M&A trends and growing technology areas.
2. Literature Review
In this section, existing methods used to analyze promising industry and technology opportunities are presented. The analysis of promising industry and technology opportunities is a process of assessing the attractiveness of a business and technology development opportunity. The main benefit of this analysis is to help guide the process of better understanding the most important market segments, how fast the opportunity is growing, what the key sustainable differentiations are, and why these are important. Furthermore, it is important to understand the potential impact that a new technology or business might have on the market.
The methods for finding a promising business or technology opportunity are primarily divided into three categories: bibliometrics, the judgmental methods of experts, and market information analysis.
2.1. Bibliometrics
Bibliometrics, in the context of technology forecasting, can be defined as analytical research to produce and disseminate information concerning the use of recorded literature or patents for forecasting and decision making. Bibliometrics for business/technology opportunity analysis has been continuously developing for the past 30 years, mainly in academia, using papers and patent information. This technique helps to identify the most recent technological trends and discover hidden patterns with the information of authors/inventors, affiliations, and recent research in literature or patents [9]. The major derivatives of bibliometrics are publication counts, citation counts, citation networks, co-citation counts, co-word counts, and scientific mapping [9].
Park and Yoon [24] proposed an approach to determine application technology opportunities customized to a target firm by applying collaborative filtering to the firm’s technology portfolios, which are represented as a set of patent classification codes of the firm’s patents. Technology opportunities are defined as the promise of technological progress or the potential ability to drive technological advances in specific fields or over different industries [25,26]. The authors say that technology opportunity discovery (TOD), customized to a firm’s current technology capability, can be a good starting point to formulate a technology strategy for a firm that lacks technology information, experts, and/or facilities.
Yoon and Magee [7] suggested a systematic approach to conducting TOD by visualizing patent information, such as patent documents and citation relations. In the paper, keywords are extracted from collected patent documents by text mining, and patents are visualized in a two-dimensional space, and vacant cells, potential candidates for developing new technologies, are identified with their estimated keyword vectors by generative topographic mapping (GTM). Kim et al. [27] also introduced TOD via technology convergence, using both patent textual data and patent citation networks. The authors carried out TOD by extracting representative keywords from patent pairs selected based on their technological relatedness and organizing them into the basic description of a new invention, which the potential convergence of the patent pair might produce.
Rodriguez et al. [5] proposed another approach that addresses TOD via patent outlierness, leveraging both patent attributes and citations. They proposed new outlier ranking methods developed specifically for patents in attributed patent citation networks. Attribute data independently describe a patent, while citation network data relate patents to each other, thus capturing patent outlierness from two different aspects.
Breitzman and Thomas [28] suggested the Emerging Clusters Model, which is designed to identify emerging technologies close to real-time across multiple patent systems by using patent citation techniques. The authors found that patents in emerging clusters consistently have a significantly higher impact on subsequent technological developments than patents outside these clusters.
Other studies have attempted to predict a technology based on semantic patent analysis. Yoon and Kim [29] proposed a method of detecting new technological opportunities by using Subject-Action-Object (SAO)-based semantic patent analysis and outlier detection. In the research, SAO structures are syntactically ordered sentences that can be automatically extracted by natural language processing of patent text, and outlier detection is used to identify unusual or distinctive patents in a given technology area. Lee et al. [30] proposed Intelligence in Science and Technology (InSciTe) Advanced, which is a decision-making support service based on the TOD model. It discovers emerging technologies based on the technology life cycle model and analyzes R&D status in terms of semantic repository and inference as well as text mining on patents or papers.
Gerken and Moehrle [31] and An et al. [32] also introduced semantic patent analysis for the identification of inventions of high novelty to improve the usability of keyword-based patent analyses.
Rotolo et al. [6] reviewed methods for the detection and analysis of emergence in science and technology and then classified them in terms of the methodological approach: indicators and trend analysis studies; citation analysis studies; co-word analysis studies; overlay mapping technique studies; and hybrid studies.
Bibliometric methodologies based on research papers or patents are based on accumulated data, so the methodologies are robust and widely used.
However, a time-lag occurs in bibliometrics between the submission of a manuscript and its publication in a journal or between patent applications and their publication [33,34,35,36]. Given the nature of post-data-based research, there are some limitations in effectively utilizing it for exploring emerging or rapidly growing new research and technology areas. Bibliometric methods also have several drawbacks, including quality, discipline variation, database variation, and bias and discrepancies [12,13,14]. Despite these drawbacks, bibliometrics has been applied in many studies related to technology forecasting.
2.2. Judgmental Methods
Judgmental methods fundamentally rely on opinion to generate a forecast. Typically, the opinion is from an expert or panel of experts with knowledge in fields that are relevant to the forecast. In its simplest form, the method asks a single expert to generate a forecast based on his or her own intuition. Sometimes called a “genius forecast”, it is largely dependent on the individual and is particularly vulnerable to bias. Experts are likely to suffer from cognitive biases or may focus on explaining current circumstances and lose the wider picture [37,38]. The potential for bias may be reduced by incorporating the opinions of multiple experts in a forecast, which also has the benefit of improving balance.
Some public research and policy organizations or research and advisory firms periodically publish technology forecasting results for companies or individuals to alleviate R&D risk and to offer reliable and sufficient evidence.
Recently, judgmental methods have been developed as a hybrid technique that incorporates technology/market information analysis [39,40,41,42]. Furthermore, in order to have more reliable and effective results, workshops among experts using an expert-based approach are integrated with the bibliometric approach to detect emerging research domains and forecast emerging technologies [35,43]. There is a tendency to complement the weaknesses of judgmental methods, such as technical myopia, with technical/market information analysis.
2.3. Market Information Analysis
The use of market information has been developed around investment firms. The market information used in exploring existing business and technology opportunities is about financial statements and macroeconomic indicators. Leading global investment banks and enterprises such as Goldman Sachs, Blackstone, J.P. Morgan, and Standard & Poor’s (S&P) have built their own market information databases and used them to search for business and technology opportunities.
However, techniques based on market and investment information are subject to data availability due to high price and confidentiality. There is very little research on business or technology opportunity analysis that focuses on market information.
Table A1 in the Appendix A presents a non-exhaustive literature review on the previous research regarding the methods for finding a promising technology opportunity. Therefore, in this paper, we suggest a new method that identifies promising industry and technology areas using M&A information and presents the analysis results based on M&A transaction information of the IT sector by using this method.
M&A is defined as being horizontal, vertical, and conglomerate [15,44,45]. M&A is considered horizontal when two companies compete directly and share the same product line and market, and it is considered vertical when a company expands backward by M&A with another company supplying raw materials or extends forward in the direction of the ultimate customer. M&A is considered conglomerate when firms are in entirely different markets and/or do not have a common business line. M&As also can be classified according to their transaction intention. When the management of acquiring and target companies mutually and willingly agree to a takeover, it is called a friendly M&A, and when the acquisition is “forced” or against the will of the target management, it is called a hostile M&A [44]. Friendly M&As are related to promising areas because both parties’ interests and growth possibilities are recognized by mutual agreement. However, a hostile M&A is not a means for mutual growth but a unilateral relation. In such a situation, M&As do not reflect growth potential or shareholder value and ultimately fail to contribute to the growth of a specific sector or technology area.
The M&A type is an important issue, but it is not easy to classify all past M&A transactions according to M&A type, and this study focuses on presenting a new method based on M&A transformation information. Thus, M&A type-specific analysis was not considered in the study.
Finding information about M&A transactions is possible with the availability of some M&A databases. One of the powerful databases that contain M&A information is S&P Capital IQ. It provides accurate and timely financial information to investment banks, asset management firms, private equity firms, and corporations around the world. S&P Capital IQ provides detailed information and analysis of all M&A transactions at the most granular level.
S&P Capital IQ’s industry segment is based on the Global Industry Classification Standard (GICS), which is an industry taxonomy developed in 1999 by MSCI and Standard & Poor’s (S&P) for use by the global financial community. The GICS structure consists of sectors, industry groups, industries, and sub-industries into which S&P has categorized all major public companies. GICS is used as a basis for S&P and MSCI financial market indexes in which each company is assigned to a sector, industry group, industry, and sub-industry according to the definition of its principal business activity. A sector is one of a few general segments in the economy within which a large group of companies can be categorized. An economy can be broken down into about a dozen sectors, which can describe nearly all of the business activity in that economy. Sectors, in turn, are broken down into sub-categories known as industries. An industry describes a much more specific grouping of companies with highly similar business activities. Essentially, industries are created by further breaking down sectors into more defined groupings. This allows a closer grouping of similar businesses.
The classification tree of S&P Capital IQ has a common lower level for each sector; the common lower level for all industry sectors is level 4, which corresponds to the sub-industry level of GICS. A company is classified in the sub-industry, whose definition most closely describes the business activities that generate the majority of the company’s revenues [46].
According to the S&P Capital IQ database, the IT sector is divided into 13 sub-industries on level 4, which is divided into 85 sub-sub-industries on level 5. The classification tree of the S&P database has eight levels for the IT sector. Sub-industries (level 4) may be regarded as a somewhat broader range of technology areas, and sub-sub-industries (level 5) are considered more specific technology areas. Sub-industries of the IT sector and representative sub-sub-industries for each sub-industry are shown in Table A2 in the Appendix A.
We extracted all M&A transaction information traded in the IT sector in the United States for the past 15 years, from 2004 to 2018. A total of 25,879 M&A transaction data were extracted and analyzed. A total of 25,879 Target companies participated in these M&A transactions, and 27,646 Buyer companies were involved in the transactions.
In the following section, we present the analysis results of the overall trends of M&A transactions in the IT sector.
3. M&A Transactions by Sub-Industry in the IT Sector
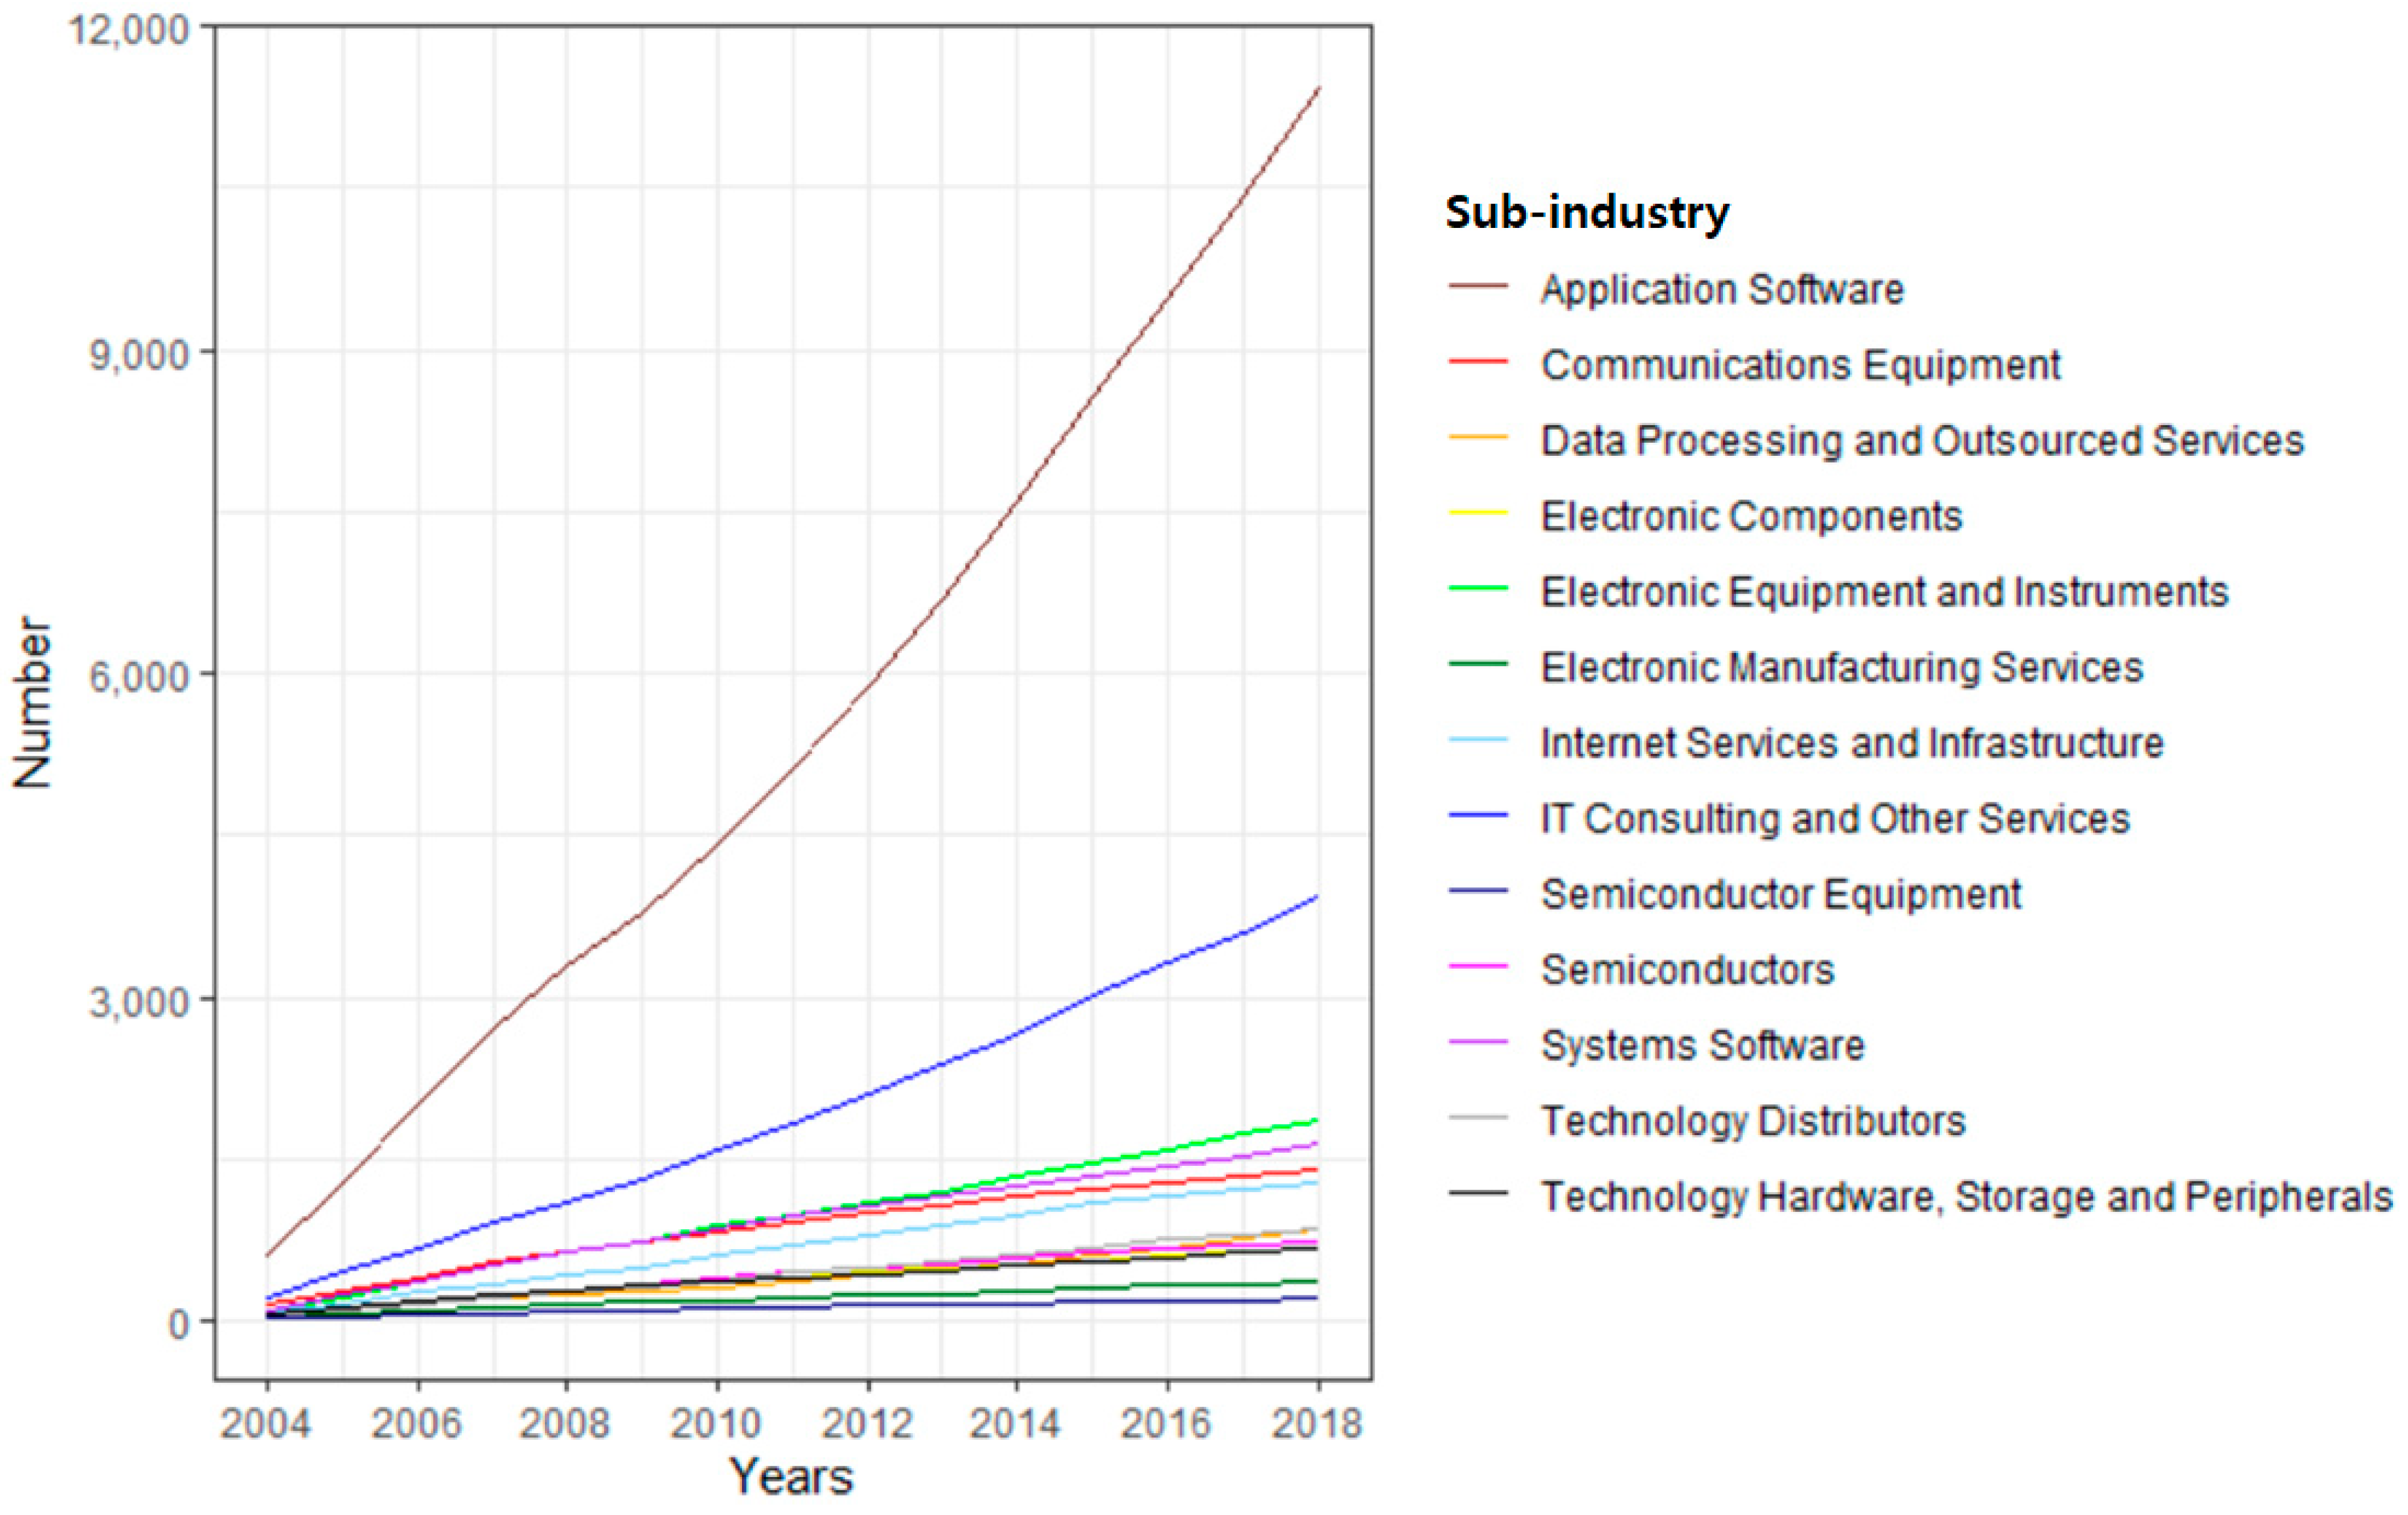
Figure 1 shows the analysis results of the cumulative number of M&A transactions by sub-industry (level 4) in the IT sector over the last 15 years (2004–2018) in the United States.
There were significant differences in the number of M&A transactions by sub-industry. Among the sub-industries, “Application Software” and “IT Consulting and Other Services” account for a large part of the M&A transactions and show continuous and steeply increasing trends. The sub-industries, including “Electronic Equipment and Instruments”, “Systems Software”, “Communications Equipment”, and “Internet Services and Infrastructure” have a relatively low proportion of frequency of M&A transactions. However, the cumulative number of transactions significantly continues to increase over time.
Figure 2 shows the results of analyzing the M&A transaction value, namely the M&A transaction amount, by sub-industry in the IT sector. The M&A transaction value of each sub-industry was estimated by calculating the average of the middle 50 percent of the M&A transaction values when ordered from lowest to highest and multiplying it by the number of M&A transactions of the corresponding sub-industry.
Like the overall trend of the cumulative number of M&A transactions in Figure 2, the M&A transaction values of most sub-industries show overall increasing patterns over the whole period, though there are significant differences in the transaction values by sub-industry.
“Application Software” and “IT Consulting and Other Services” account for a large part of the M&A transaction value and show continuously increasing patterns except around 2009.
In the case of “Systems Software”, “Electronic Equipment and Instruments”, “Communications Equipment”, and “Internet Services and Infrastructure”, there were ups and downs in some periods, but the overall trends show increasing patterns over the past 15 years. On the other hand, all other sub-industries, including “Data Processing and Outsourced Services” and “Semiconductors”, do not show substantial changes over the entire period from a transaction value perspective.
The overall trend analysis shows high or low increasing patterns across the periods but does not provide exact information in analyzing promising industries. To resolve this issue, we suggest a new analysis method.
4. Methods
As suggested above, in this research, we try to derive promising industry or technology areas in the IT sector based on a new method. For the analysis, we present decision models to identify promising areas by evaluating the velocity and acceleration of M&A transactions.
We first define some variables to identify them, which include Numi and Vali.
- i: Index of period
- Numi: Number of M&A transactions for the ith period
- Vali: Value of M&A transactions for the ith period
- Si(Num): Cumulative number of M&A transactions until period i
- Si(Val): Cumulative value of M&A transactions until period i
Decision models for measuring M&A status to identify promising industry and technology areas based on M&A data are presented below.
vi(Num) refers to the growth velocity of period i based on the number of M&A transactions. As with the general concept of velocity, the growth velocity can be obtained by dividing the difference between the cumulative number of M&A transactions until period i and the cumulative number of M&A transactions until period i−1, ΔSi(Num), by the time difference between the two periods, Δt. ΔSi(Num) divided by the required time (Δt) of period i is defined as the growth velocity of the ith period based on the number of M&A transactions. In other words, the number of M&A transactions completed during the unit period is defined as the growth velocity of the ith period in terms of the number of M&A transactions.
vi(Val) refers to the growth velocity of period i based on the value of M&A transactions. This can be obtained by dividing the difference between the cumulative M&A transaction value up to period i and the cumulative M&A transaction value up to period i−1, ΔSi(Val), by the time difference between the two periods, Δt. In other words, the amount of all M&A transactions achieved during the specific period is defined as the growth velocity based on the M&A transaction value for the corresponding period.
On the other hand, ai(Num) means growth acceleration based on the number of M&A transactions for the period i. In general, from the perspective of finance or economics, growth acceleration means growth momentum, which is used as a term to describe accelerating or slowing economic or financial growth [47,48]. Therefore, positive growth acceleration in a certain period means that the growth momentum is higher than the previous period. As with the general concept of acceleration, the growth acceleration ai(Num) can be obtained by dividing the difference between the growth velocity of the number of M&A transactions of period i and the growth velocity of the number of M&A transactions of period i−1, Δvi(Num), by the time difference between the two periods, Δt. In other words, the degree of change in the growth velocity of the current period relative to the previous period is defined as the growth acceleration, namely growth momentum, of the corresponding period. As with the growth velocity, the time required for period i (Δt) is defined as one year.
ai(Val) denotes the growth acceleration of the ith period based on the value of M&A transactions. ai(Val) can be obtained by dividing the difference between the growth velocity of period i and the growth velocity of period i−1, that is, Δvi(Val), by the time difference between the two periods, Δt. The growth rate of the M&A transaction value of the current period relative to the previous period, that is, the growth momentum, is defined as the growth acceleration of the corresponding period based on the value of M&A transactions.
When the total transaction time (t) is divided into n periods to get the velocity and acceleration of the number of M&A transactions, the value of M&A deals and the average M&A transaction value, the transaction velocity is derived for each of n periods from the 1st period to the nth period. In contrast, the acceleration is calculated for n−1 periods from the 2nd period to the nth period.
The increase in growth velocity for M&A transactions over time reflects the belief of the M&A parties that the corresponding industries or technologies are promising or growing in the period. On the other hand, a positive change in growth velocity, that is, an increase in growth acceleration means that the short-term growth potential of the industry and technology fields is large. This implies that the M&A parties believe that the corresponding technology area has higher growth momentum over the period compared to other areas and will continue to grow in the future.
Based on the above variables and models, the next section analyzes the velocity and acceleration of M&A transactions for M&A status in the IT sector in the United States.
5. Data
The IT sector has contributed substantially to economic growth for developed, developing, and emerging countries [49]. In particular, bidirectional Granger-causality is observed between IT investment and economic growth, which implies that IT investment is driven by economic growth and vice versa [50].
Thus, the IT sector is an ideal industry for analyzing M&A activities because it has high R&D investment and intense technological changes, leading to economic and social development. The United States has secured a global lead, maintaining relatively strong competitiveness compared with other OECD (Organisation for Economic Co-operation and Development) member states in the IT sectors [51].
Our sample includes 25,879 M&A deals that occurred in the IT sector of the U.S. during the last 15 years (2004~2018). The IT sector is composed of 13 sub-industries, as shown in Table A2 in the Appendix A.
Table 1 shows descriptive statistics, including the number of M&A transactions and M&A transaction values of each sub-industry. Transaction value is divided into the mean, minimum, 1st Quartile, 2nd Quartile, 3rd Quartile, and Maximum transaction value of each sub-industry over the last 15 years.
The summary statistics show that the number of M&A transactions is highest in the “Application Software” sub-industry and lowest in the “Semiconductors” sub-industry. On the other hand, the average transaction amount of M&A shows that the “Technology Hardware, Storage and Peripherals” sub-industry is highest, and the “Electronic Manufacturing Services” sub-industry is lowest.
Table 2 shows a correlation matrix of M&A transactions between sub-industries in the IT sector of the U.S. over the last 15 years (2004–2018). On the target side, it is divided into 13 sub-industries of the IT sector. On the other hand, from the buyer’s point of view, it is divided into 13 sub-industries in the IT sector and others, including all sub-industries in other sectors.
According to the data collected from S&P, the number of closed or effective M&A transactions that were conducted for the 13 target sub-industries during the entire period was 25,879.
6. Main Analysis Results
6.1. Longitudinal Analysis of M&A Status by Sub-Industry in the IT Sector
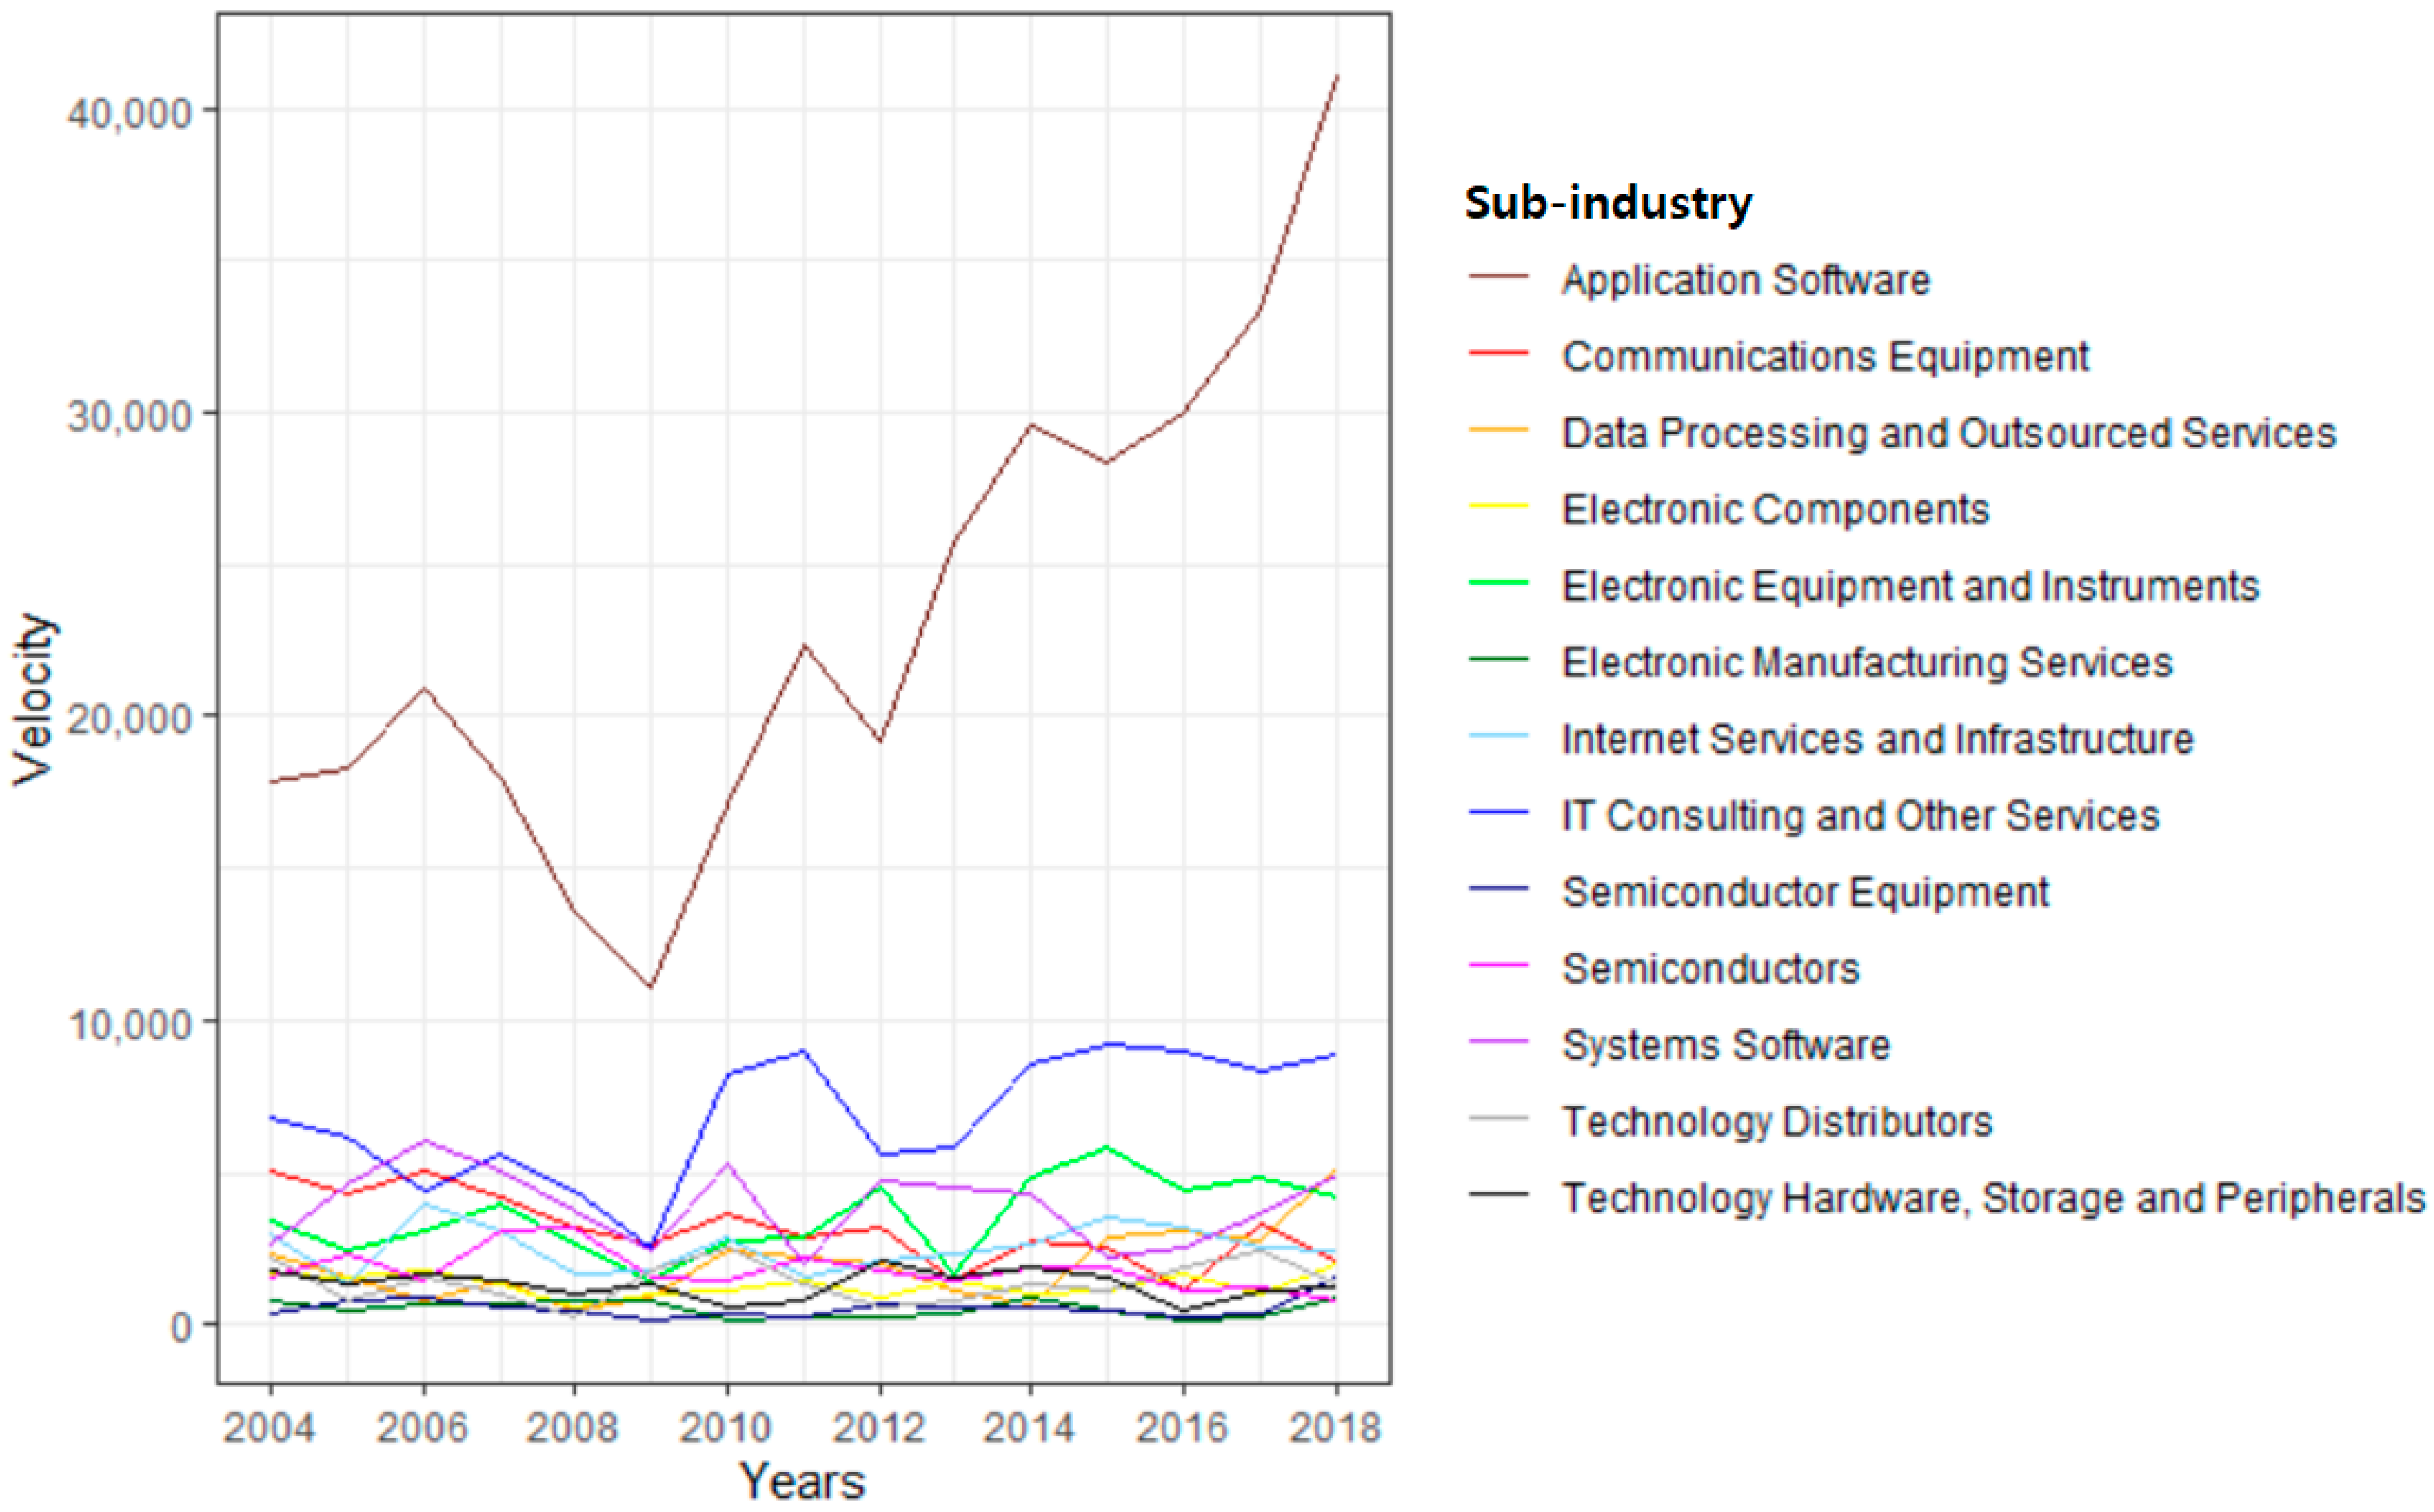
Figure 3 shows the analysis results of the velocity of M&A investment in terms of the number of M&A transactions by sub-industry in the IT sector. The analysis of the velocity provides the exact information for analyzing promising industry or technology areas.
As shown in Figure 3, the sub-industry “Application Software” alone shows a sharp increasing pattern over the whole period except 2008–2009. The sub-industries “IT Consulting and Other Services” and “Data Processing and Outsourced Services” also show steadily increasing patterns across the periods except 2008–2009. On the other hand, sub-industries including “Communications Equipment”, “Electronic Components”, “Semiconductor Equipment”, and “Semiconductors” have some ups and downs but usually have a decreasing pattern throughout the entire period. Most sub-industries suffered a temporary decline around the period of 2008–2009. This phenomenon, the decline of velocity across most sub-industries in the IT sector, seems to be caused by external factors such as the global financial crisis at that time. After the temporary decline, most sub-industries show recovery.
Figure 4 shows the results of analyzing the velocity of M&A transaction value by each sub-industry area of the IT sector.
According to the analysis results, sub-industries such as “Application Software”, “IT Consulting and Other Services”, and “Data Processing and Outsourced Services” show an overall pattern of increase across the entire period. On the other hand, the analysis shows that sub-industries such as “Electronic Equipment and Instruments” and “Technology Distributors” show patterns that are not as steep compared to the above three sub-industries but have a steady increase pattern over the entire period. In contrast, “Communications Equipment”, “Electronic Manufacturing Services”, “Semiconductors”, and “Systems Software” have some ups and downs but usually have a decreasing pattern over the last 15 years. Unlike the analysis results presented in Figure 4, most of the sub-industries showed a temporary decline in various periods other than around 2008–2009.
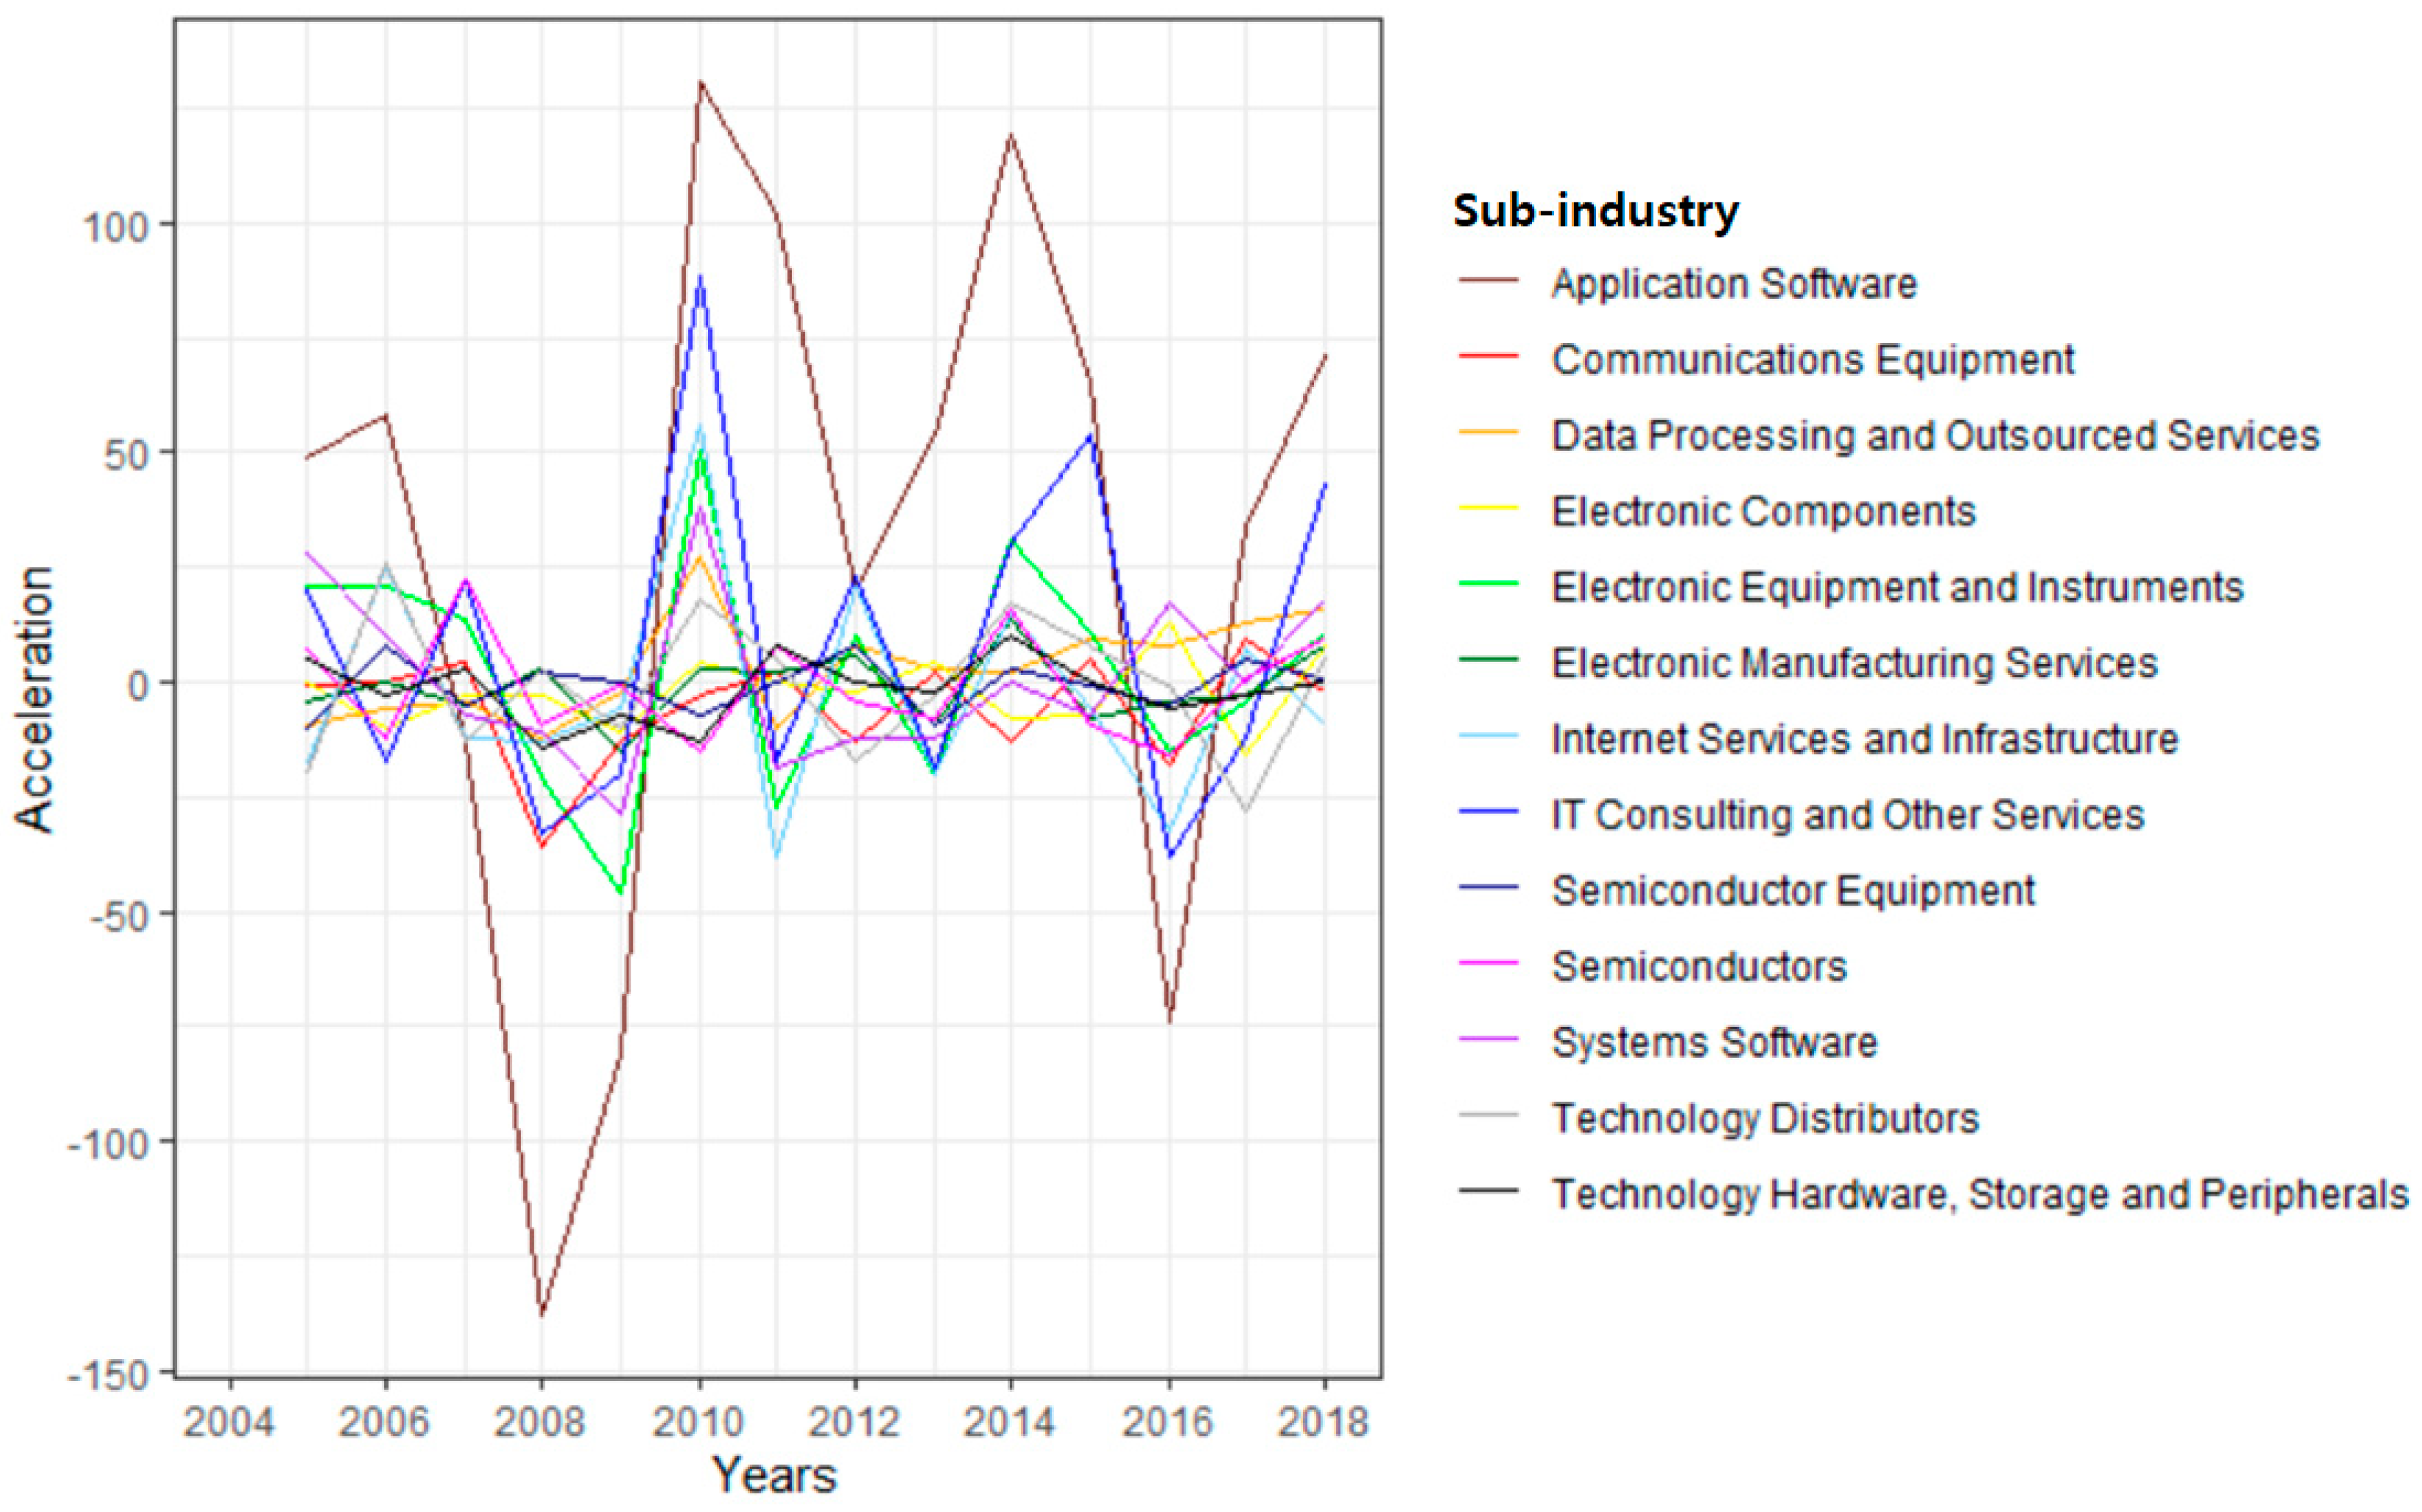
Figure 5 shows the results of measuring the acceleration of M&A transactions based on the number of M&A transactions in the IT sector. The acceleration of M&A transactions, namely the increase or decrease of growth velocity for M&A transactions over time, reflects the M&A parties’ belief that the corresponding industry or technology area is fast-growing and promising during the period. As explained earlier, the M&A acceleration is derived for n−1 periods, from the 2nd period to the nth period, because the acceleration is based on the difference in growth velocity between two periods.
As shown in Figure 5, all sub-industries have ups and downs over the last 15 years in terms of acceleration. Among them, “Application Software” and “IT Consulting and Other Services” show sharp changes compared to other sub-industries. Some sub-industries, including “Application Software”, “Communications Equipment”, “IT Consulting and Other Services”, and “Technology Hardware, Storage and Peripherals”, have a rapid decrease in acceleration during the periods 2007–2008 and 2015–2016. However, after those periods, it shows that acceleration rapidly recovers in the sub-industries. The sub-industry “Data Processing and Outsourced Services” shows a trend of increasing acceleration over the entire period. This implies the belief of M&A parties that this sub-industry has positive growth momentum for the whole period overall. We need to consider extraordinary events such as the global financial crisis or one-off transactions to more clearly analyze the overall trend and prevent distortion. However, this study did not consider these issues in the analysis process because it was not easy to apply consistently because the timing and extent of the impact were different for each sub-industry.
Figure 6 shows the analysis results of the acceleration of M&A transactions by sub-industry in the IT sector when evaluated in terms of M&A transaction value.
As shown in Figure 6, all sub-industries have ups and downs over the last 15 years in terms of acceleration. Among them, “Application Software”, “Communications Equipment”, and “IT Consulting and Other Services” show sharp changes compared to other sub-industries. Also, many sub-industries have rapid drops in acceleration around 2007–2008 and around 2015–2016. Sub-industries, including “Application Software” and “Data Processing and Outsourced Services”, have a trend of increasing acceleration over the entire period. In contrast, the “Semiconductors” sub-industry alone indicates a trend of decreasing acceleration during the whole period.
So far, we presented the results of analyzing sub-industries (level 4) in the IT sector by dividing them into 1-year periods to suggest the method itself. It is possible to obtain more specific and detailed analysis results by subdividing the analysis target into sub-levels and classifying the analysis interval further by dividing it into semiannual, quarterly, and monthly periods. It is also possible to conduct a time-series analysis for a specific technology area, as suggested below.
Figure 7 below depicts the time-series change in the velocity and acceleration of the number of M&A transactions for the sub-industry “IT Consulting and Other Services” for the last five years from 2014 to 2018. The X-axis and Y-axis represent the normalized velocity and acceleration of the number of M&A transactions for each period (year), respectively.
As suggested in Figure 7, in 2014 and 2015, the velocity value was lower than the half of normalized velocity, compared to other sub-industries, but the acceleration value was higher than the half of normalized acceleration. Based on the high acceleration value, that is, the potential for future growth, we can see that the velocity slightly increased in 2016. However, as the acceleration values fell below the half in 2016, the velocity values for 2017 and 2018 decreased again.
6.2. Cross-Sectional Analysis of M&A Status by Sub-Industry in the IT Sector
In this section, cross-sectional analysis is proposed to determine which technology area is more promising by a relative comparison among all sub-industries for a specific period.
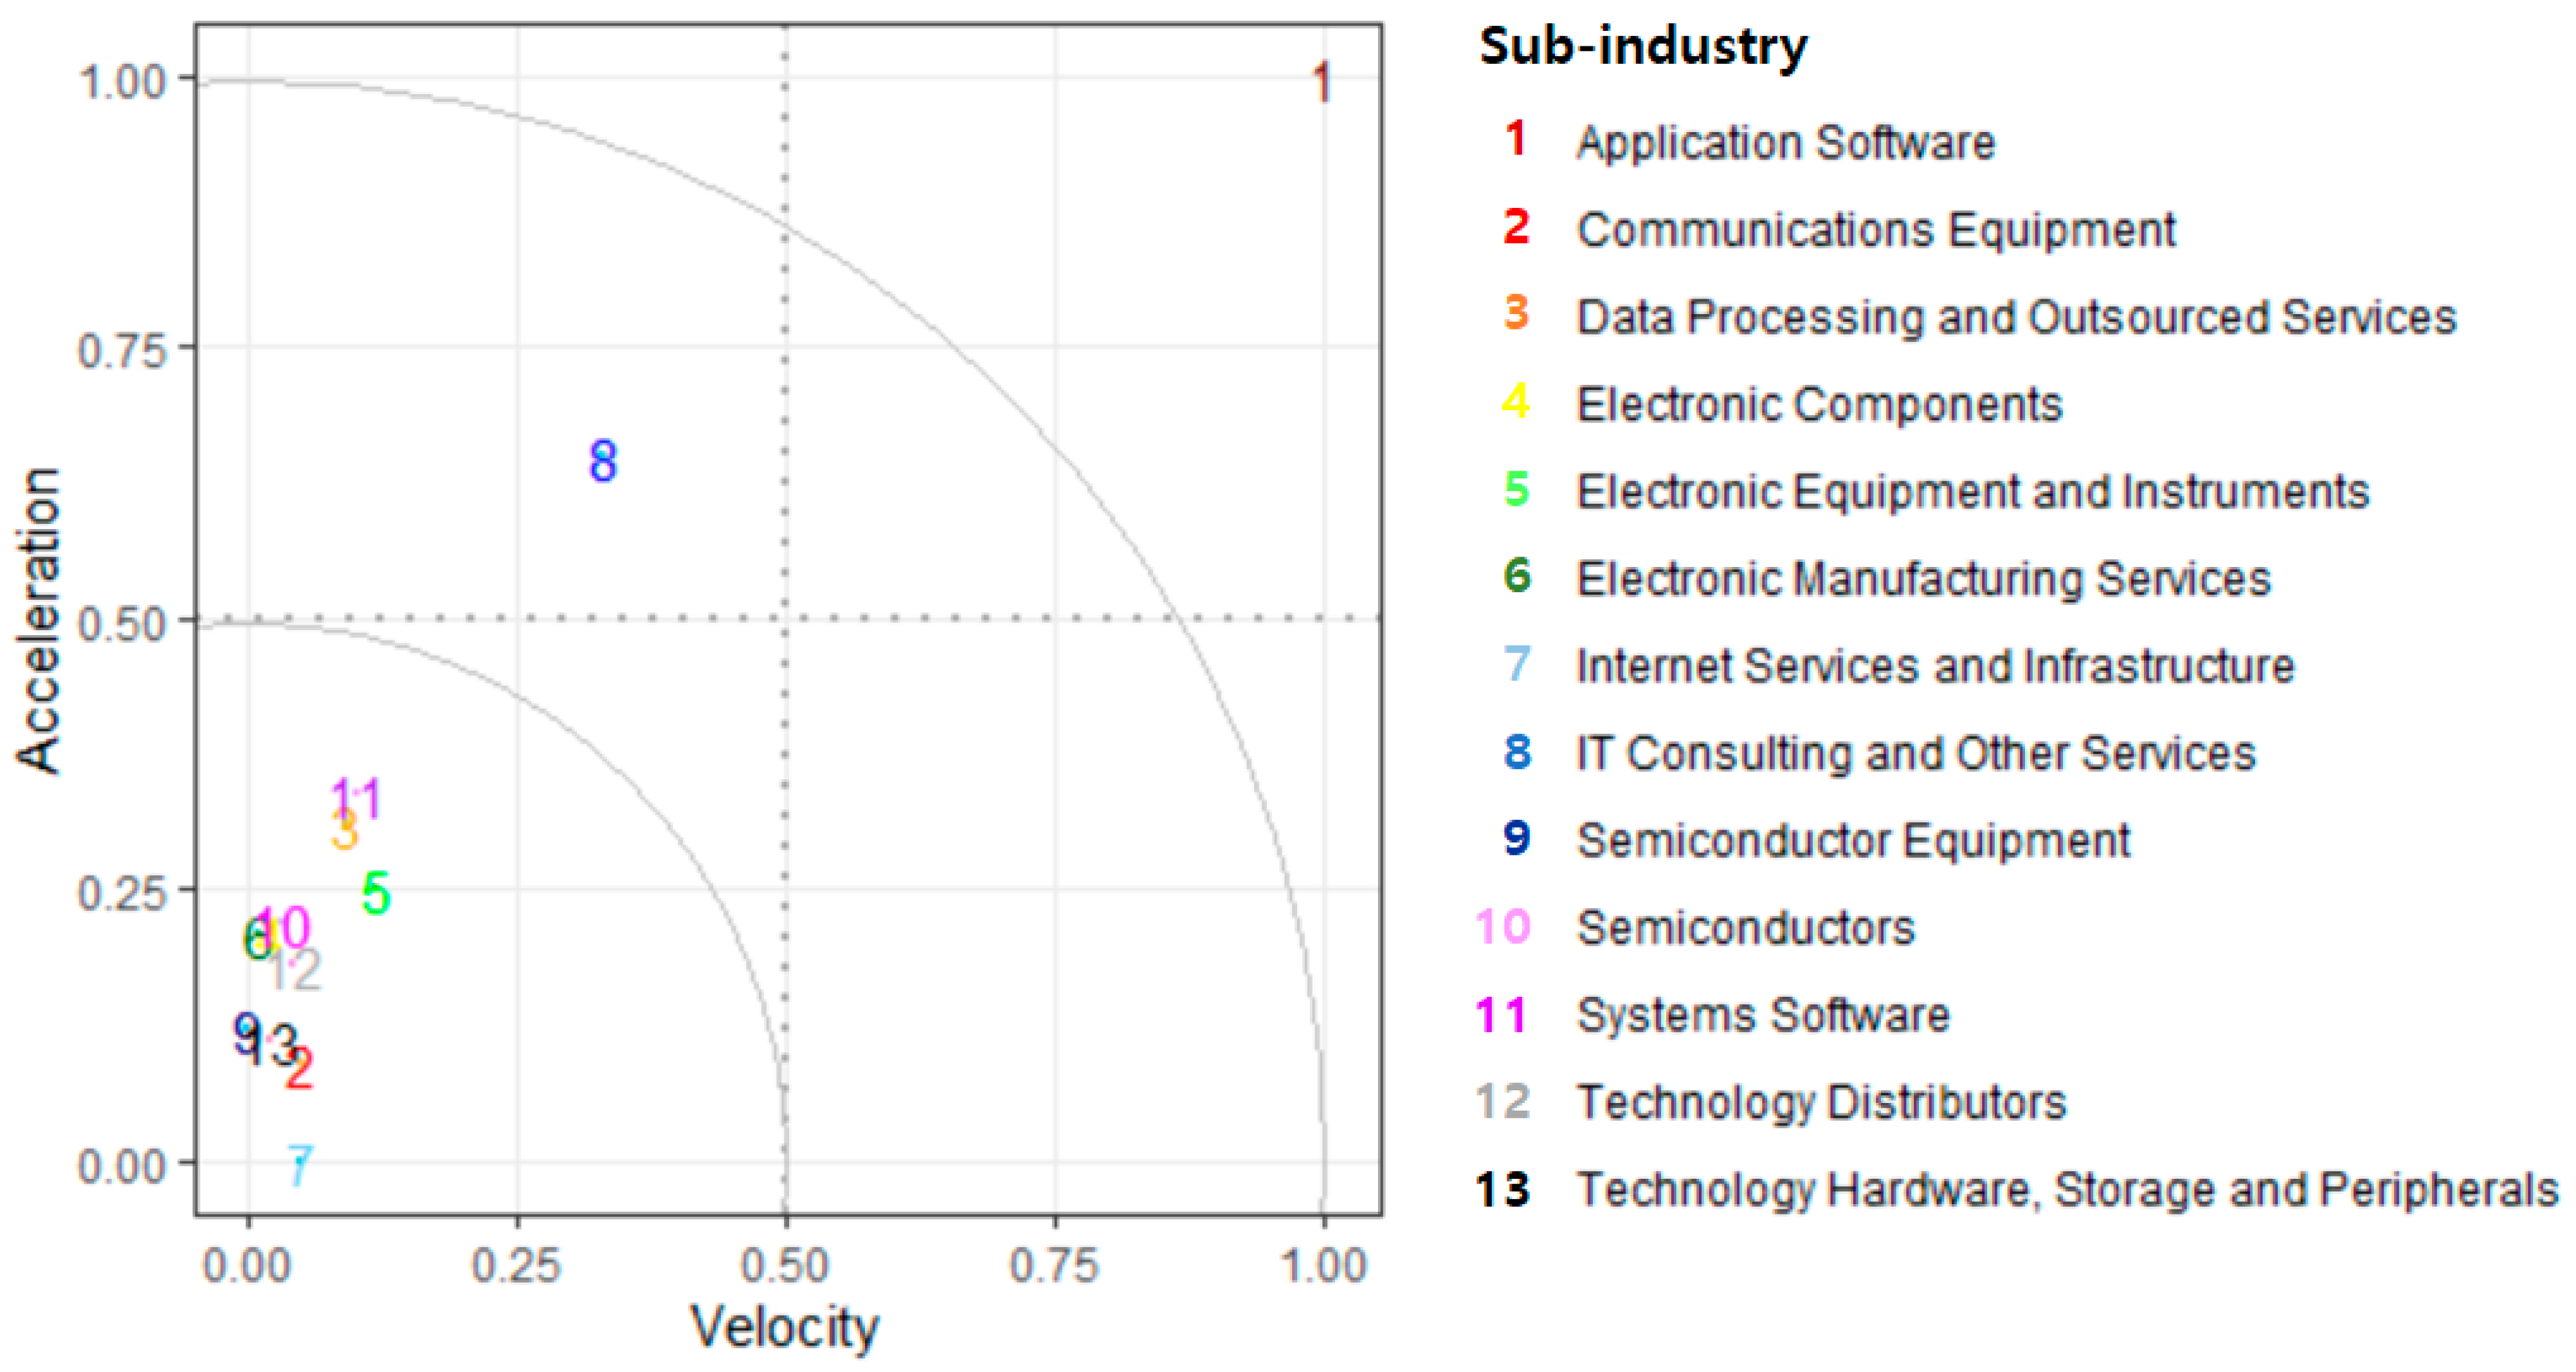
Figure 8 shows the analysis of the velocity and acceleration of the number of M&A transactions performed in 2018 for 13 sub-industries (level 4) in the IT sector. The X-axis represents the velocity of the number of M&A transactions for the period, and the max-min normalized values are presented by rescaling the velocity of each sub-industry to have values between 0 and 1. The Y-axis represents acceleration based on the number of M&A transactions of each year, and the normalized values of the acceleration of the number of M&A transactions of all sub-industries are suggested.
In the first quadrant of the graph, the velocity of the number of M&A transactions is higher than thehalf of normalized velocity of sub-industries, and the acceleration of the number of M&A transactions is also higher than thehalf of normalized acceleration of all sub-industries, so they can certainly be regarded as promising technology areas in the period. In the second quadrant, the velocity of M&A transactions of the corresponding sub-industries is below the half of normalized velocity, but the M&A acceleration is above the half of normalized acceleration, which can be seen as having a significant growth momentum. In the case of sub-industries belonging to the fourth quadrant, the M&A transaction velocity is above thehalf, so M&A transactions are currently being actively conducted, but the growth momentum is regarded as low in the long term because the acceleration of M&A transactions is below thehalf. A more detailed analysis is needed to determine the prospects for sub-industries in the second and fourth quadrants. Finally, in the third quadrant, both the velocity and acceleration of M&A transactions are below the half of normalized values of all sub-industries. Therefore, the sub-industry in this area is estimated to beless than half, both in terms of M&A activation and future growth momentum, compared to other sub-industries. Finally, the absolute position of each sub-industry in the graph, i.e., the distance from each sub-industry to the origin, can be considered to represent a relatively promising degree, taking into account both velocity and acceleration. To more intuitively identify whether a particular sub-industry is promising, circles are displayed at regular intervals so that the degree of relative prospects among the sub-industries can be easily grasped.
Figure 8 suggests that only the sub-industry “Application Software” is located in the first quadrant in 2018. This means that the analysis of transaction velocity based on the number of M&A transactions in 2018 shows that “Application Software” is very high compared to the half of normalized velocity and acceleration of all sub-industries in the IT sector, so it can certainly be regarded as a promising technology area for the period.
And in the second quadrant, there is only one sub-industry, “IT consulting and Other Services”. In other words, this sub-industry shows that the growth momentum and the current M&A activation level is relatively very high compared to other sub-industries, although it is relatively low compared to “Application Software”.
Most sub-industries are located in the third quadrant. This means that, based on the number of transactions, M&A transactions in these sub-industries are not actively conducted during that period, and future growth momentum is also very low compared to the previous two sub-industries.
Likewise, Figure 9 shows the analysis of the velocity and acceleration of the M&A transaction values performed in 2018 for 13 sub-industries (level 4) in the IT sector. The X-axis represents the normalized velocity of the M&A transaction values for the period, which has values between 0 and 1. Likewise, the Y-axis shows the normalized acceleration based on the value of the M&A transactions of all sub-industries in 2018.
As shown in Figure 9, max-min normalization based on the velocity and acceleration of the M&A transaction value shows that the first quadrant includes only one sub-industry, “Application Software”. This sub-industry can be regarded as a very promising area, which means that its M&A transactions are very active during the period, and this sub-industry has high growth momentum compared with all other sub-industries in terms of the transaction value. Most sub-industries, including “Data Processing and Outsourced Services”, “Systems Software”, and “IT Consulting and Other Services”, are located in the third quadrant of the graph. These sub-industries are relatively less promising compared to “Application Software” in 2018. This indicates that M&A transactions of these sub-industries are conducted less active during the period, and future growth momentum is relatively very low compared to “Application Software” in 2018. Likewise, the above analysis is based on a specific year. By extending the analysis presented in this study to a lower level or further refining the period, it is possible to elaborate more dynamic and sophisticated analysis results.
Furthermore, to derive a growing industry group within the IT sector for a specific period, promising industry groups can be obtained by clustering methods. Clustering is defined as a collection of objects in one group, which are similar between them and dissimilar to other groups [52].
Before clustering, we need to define what variables to group based on this. In this study, there are two variables for M&A transactions: number of deals and transaction value. There are also velocity and acceleration for each of the two variables. Therefore, for velocity, the weighted average was calculated by reflecting the velocity of the number of transactions and the velocity of the transaction value by 50%, respectively, and this was defined as the weighted velocity in a specific period. Likewise, in the case of acceleration, the acceleration for the number of transactions and the acceleration for the transaction value is reflected by 50%, respectively, and defined as the weighted acceleration in a specific period.
Among the various clustering methods, K-means is a simple partitional clustering algorithm that attempts to find the user-specified K clusters, and these clusters are represented by their centroids (a cluster centroid is typically the mean of the points in the cluster) [53].
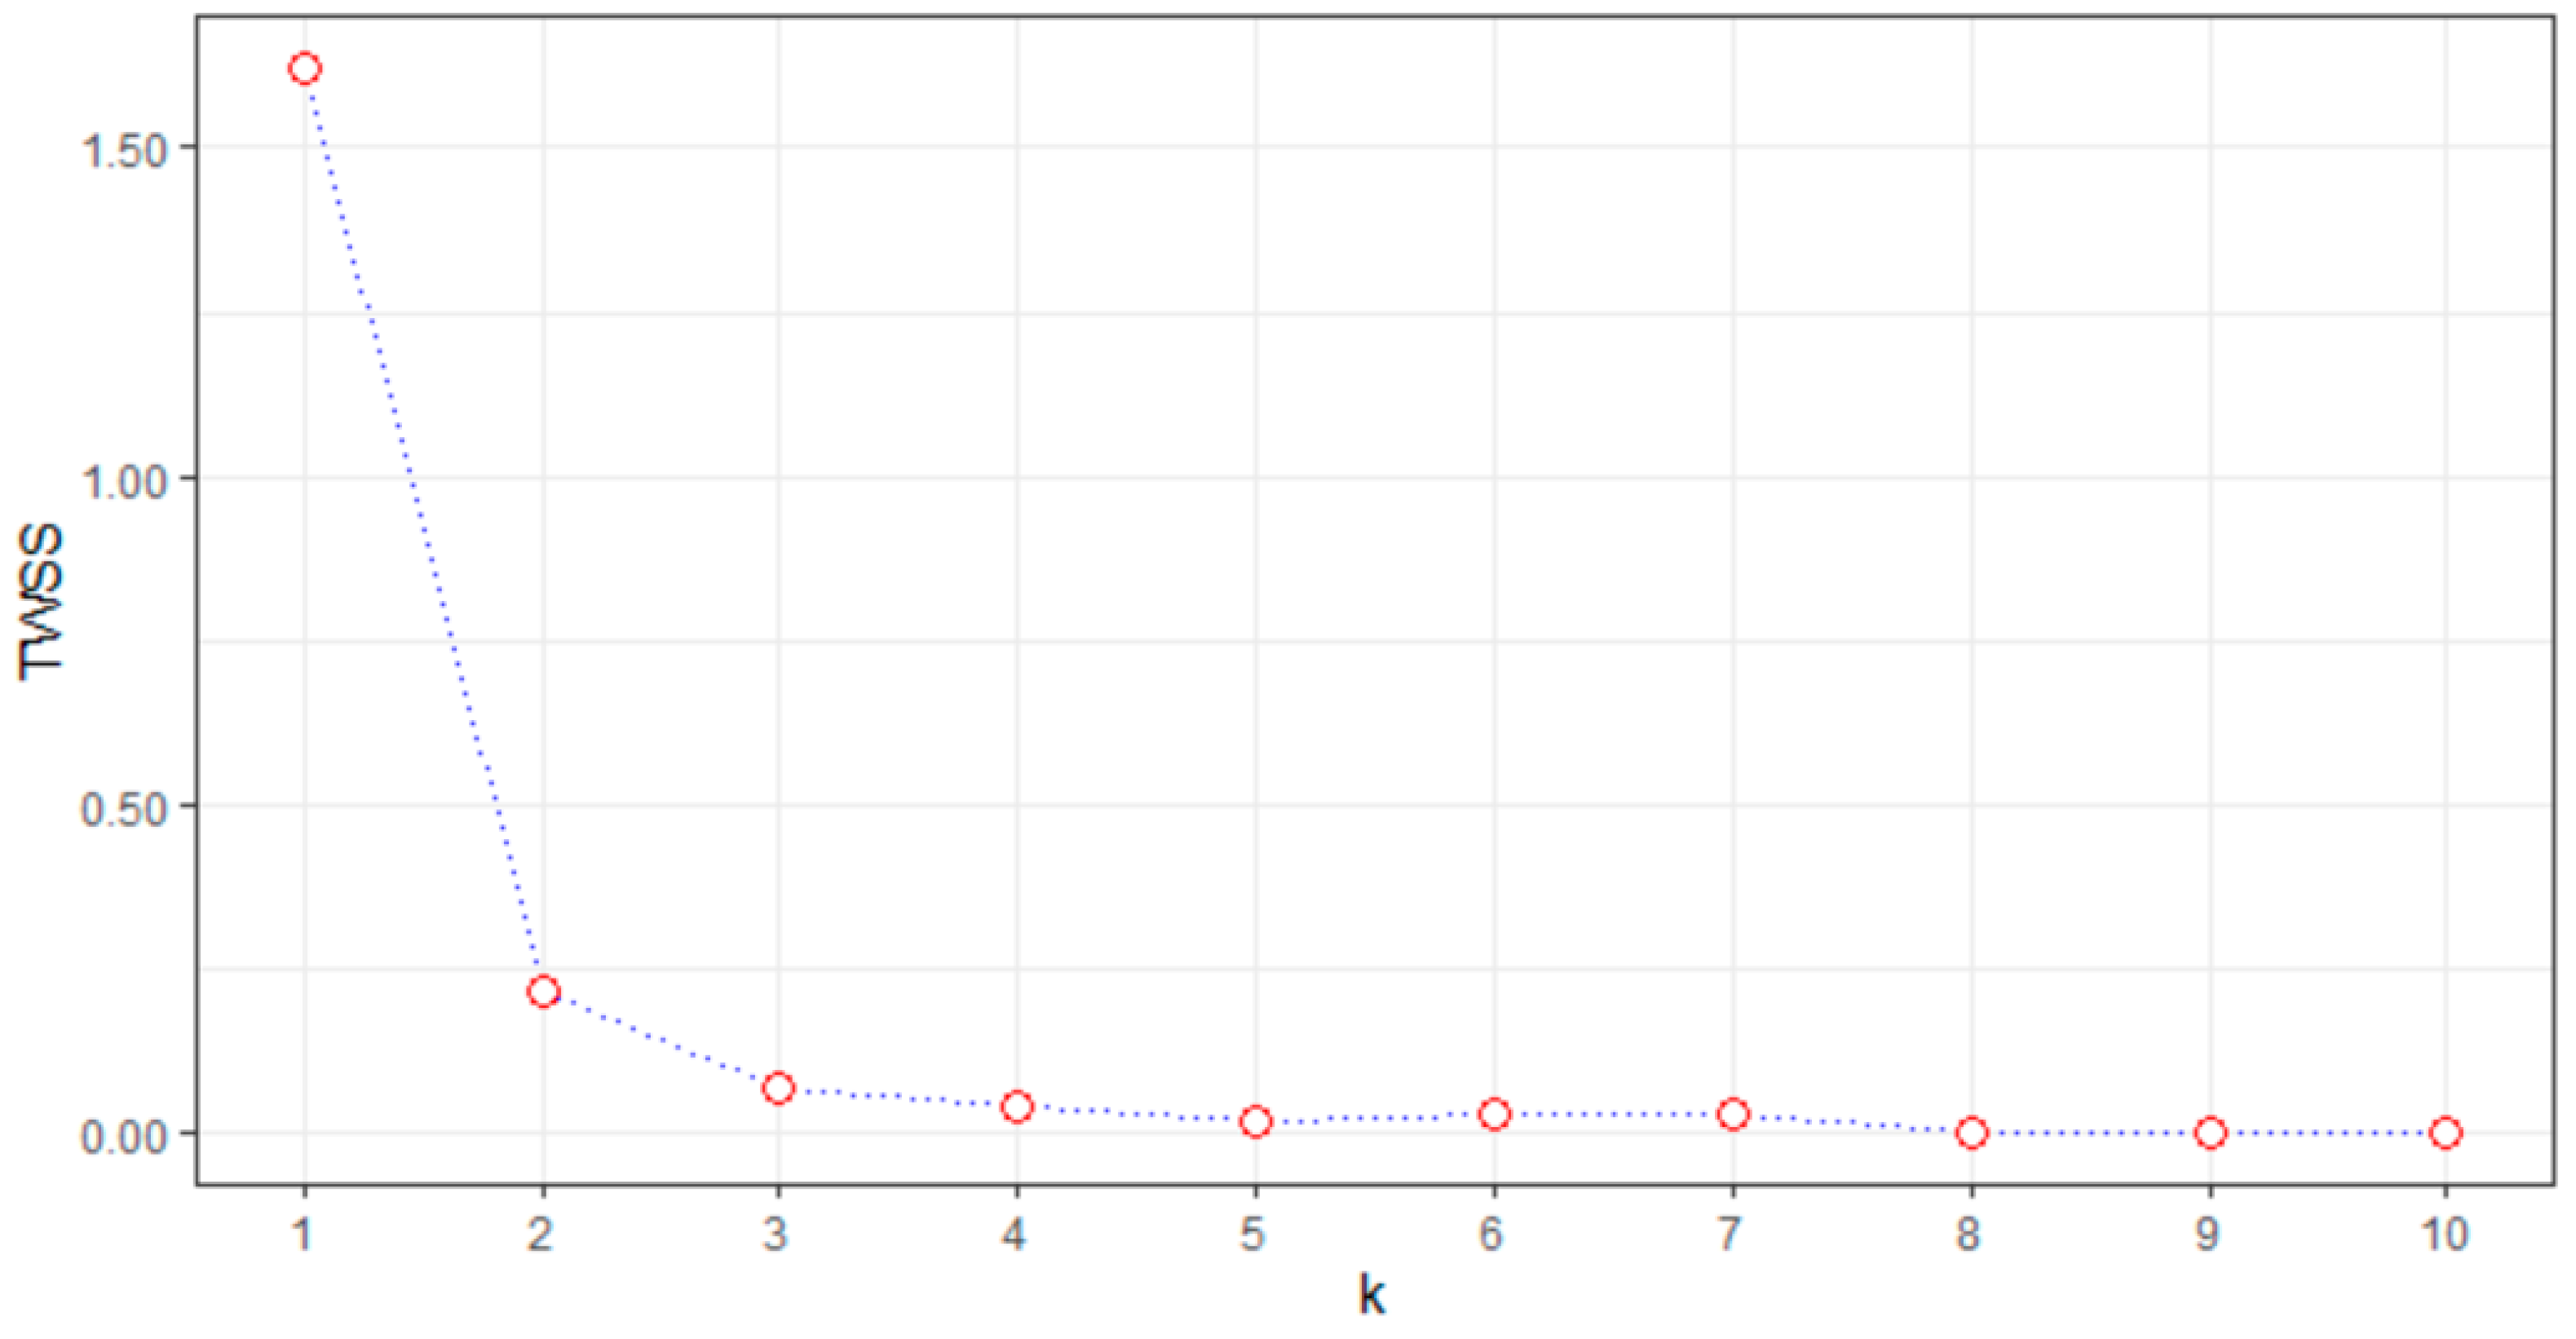
The number of clusters (K) is determined based on the total within sum of squares (TWSS). TWSS is a measure of the variability of the points within each cluster. TWSS is defined as being the sum, over all points, of the squared differences between the points and their overall mean. The TWSS value shows the cluster variance, where the smaller the result of TWSS, the better-formed the cluster is [54,55]. The elbow method is usually used to choose the optimal K. The idea of the elbow method is that one should select some clusters so that adding another cluster doesn’t give much better modeling of the data [56]. The first clusters will add much information, but at some point, the marginal gain drops sharply and makes an angle in the graph. The correct number of clusters, K, is selected at this point, hence the “elbow criterion”. Figure 10 shows that an elbow-like shape happens when K equals 3.
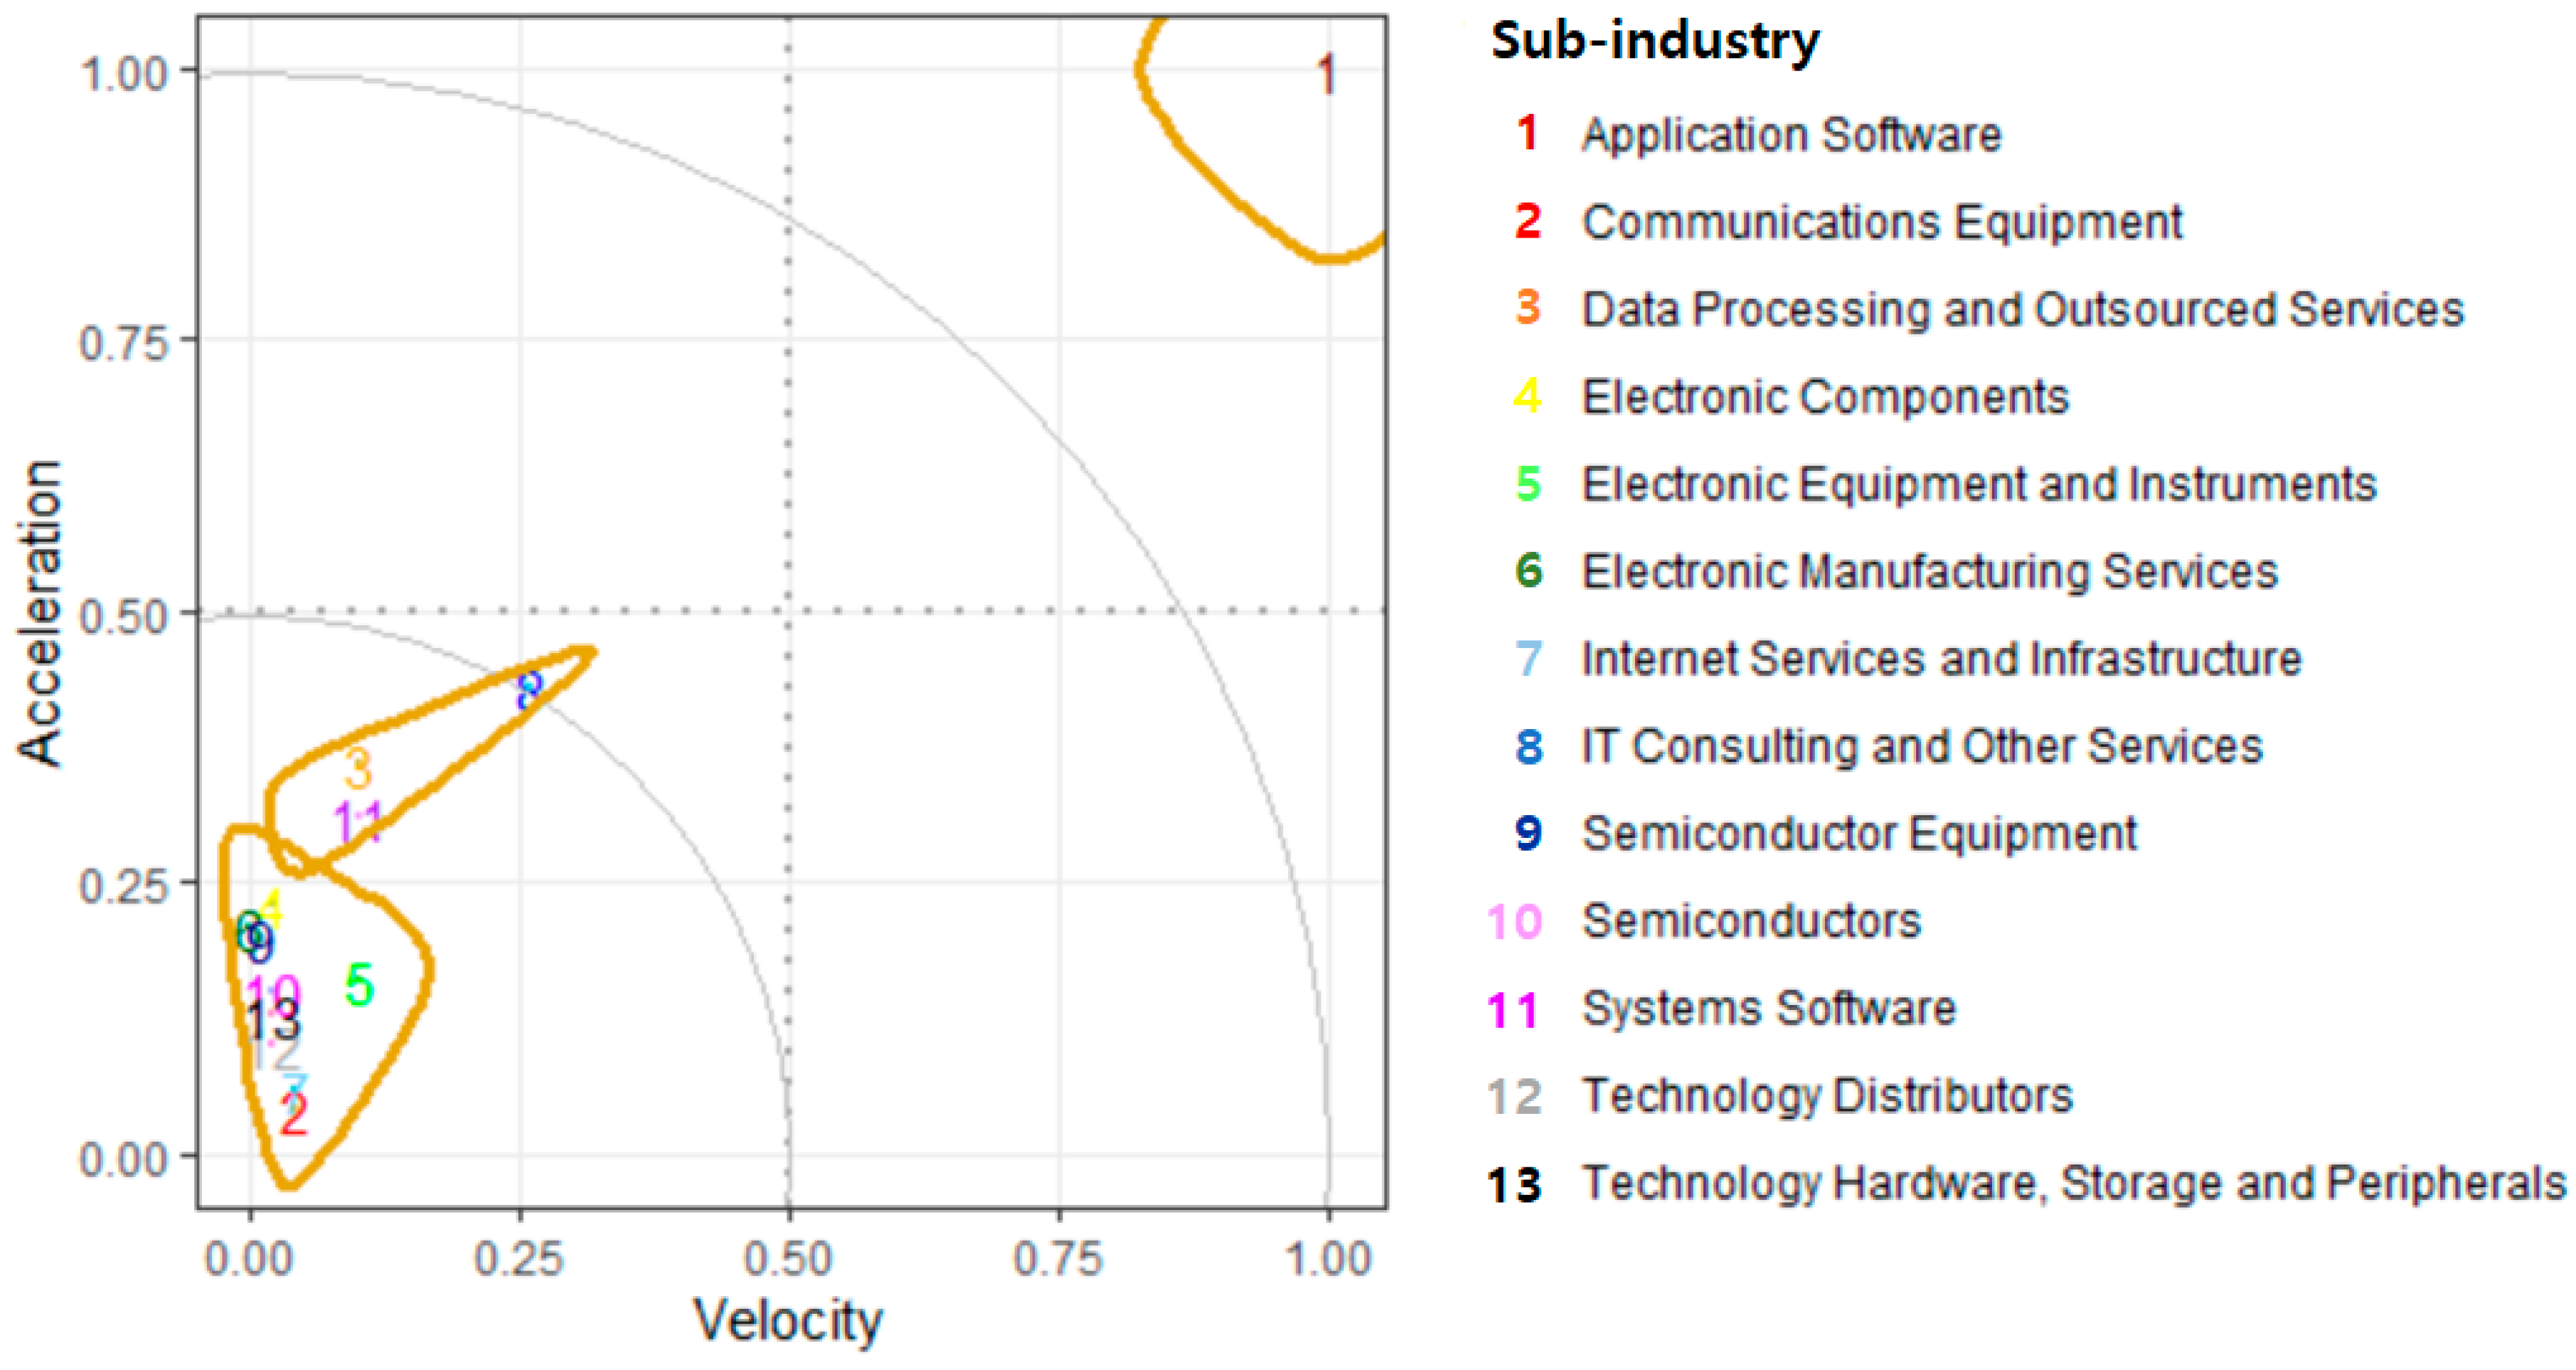
After finding the number of clusters required for the dataset using the elbow method, the K-means clustering algorithm is applied based on the M&A information. The result of the K-means clustering algorithm is represented in Figure 11.
Figure 11 shows that sub-industries are divided into three clusters. This means that if 13 sub-industries are classified based on the weighed velocity and acceleration as of 2018, they can be divided into three areas. The first group consists of “Application Software”, which is the sub-industry group with the highest velocity and acceleration. And the second group consists of “IT Consulting and Other Services”, “Data Processing and Outsourced Services”, and “Systems Software”, which have relatively low velocity and acceleration compared to the first group. Finally, the third group consists of the remaining sub-industries, in which both velocity and acceleration are very low overall compared to the previous two groups. Currently, we have presented the analysis results for the sub-industry level (level 4), but if the level is further lowered, a detailed analysis of specific technical areas is possible.
7. Discussion and Conclusions
Despite the increasing importance of R&D for continued growth, it is challenging to identify technology opportunities early before competitors. When technology emerges, in particular, analysts and policymakers have incomplete knowledge of technology growth boundaries and the pace of its growth [57].
Among the representative methods used previously, bibliometrics or judgmental methods have some limitations such as the time-lag issue or vulnerability to experts’ bias, respectively, in applying the analysis results to the real world. Notably, an important but unresolved question in the technology forecast literature regarding bibliometrics is whether the existing approaches deal with the lag time among the technology growth parameters [23]. The time-lag between the allocation of research funding and research outputs has been estimated to be five to six years for patents and two to three years for journal articles [10].
This study presents a quantitative method to effectively utilize M&A transaction information that has little time-lag to identify promising technology areas for sustainable growth in the future. As mentioned above, M&A information can provide sufficient information for technology opportunities because it reflects a nearly real-time market status through dynamic transactions between participating companies and industries. Therefore, R&D policymakers and investment firms can identify promising industry and technology areas without time-lag compared with bibliometric methods using patents or research papers.
First, we presented decision models for estimating the velocity and acceleration of M&A transactions to identify promising areas based on M&A information. Then, based on the methodology, we identified promising industry areas with longitudinal analyses of M&A trends by sub-industry in the IT sector. Also, we suggested cross-sectional analysis results to determine which technology area is more promising through a relative comparison among technology areas for a specific period. To derive a growing industry group within the IT sector for a specific period, promising industry groups are calculated using the K-means clustering algorithm.
The significance of this study is that this is a new approach to offset time-lag by using market information as a way to complement previous methods to explore promising industries or technologies. Furthermore, more specific and detailed analysis results can be obtained by further subdividing the period or analyzing at a lower level or applying time-series changes to particular periods. As with other quantitative methodologies, what is important when applying this methodology is to determine the criteria and weights to apply to define a promising area. It depends on the decision of the policymaker or decision-maker. As with patents and research papers, M&A information with dynamic linkages between industries or companies needs to be viewed and analyzed from a multidimensional perspective.
Our study also has some limitations. First, the proposed model can only be applied specifically to a certain sector of a particular country. This is because it is difficult to objectively and sufficiently compare enough the status of M&A transactions taking place in different market conditions and various social and legal framework. Also, it is difficult to apply consistently between sectors with different levels of competition and unusual barriers to entry. Furthermore, as with many other quantitative methodologies, attention also should be paid to the application of the proposed method because the analyzed results are subject to data availability and case-specific. Second, the M&A type was not sufficiently considered. Classification by M&A type is an important issue, but it was not easy to classify all past M&A transactions by M&A type. In particular, the dynamic nature of the IT sector, the presence of strong economies of scale and scope, and the significance of complementarities and “platform competition” complicate efforts to understand the competitive effects of M&As [58]. Third, another limitation of this study is that the influence of extraordinary events, such as the global financial crisis, has not been sufficiently considered.
Therefore, in future research, we need to consider various M&A types, including M&A intentions, for a more accurate analysis. Future work should also certainly include designing a robust methodology that can integrate decision variables and analysis results, taking into account the characteristics or scale of a particular industry or technology area. In addition, follow-up studies are needed, including a study [59,60,61] on the impact of extraordinary events such as the global financial crisis, and analysis excluding the impact of one-off transactions that can distort the overall analysis results.
Author Contributions
Conceptualization, J.C. and Y.S.C.; data curation, J.C. and Y.S.C.; formal analysis, J.C. and Y.S.C.; funding acquisition, J.C. and Y.S.C.; investigation, J.C. and Y.S.C.; methodology, J.C. and Y.S.C.; project administration, J.C.; resources, J.C. and Y.S.C.; software, J.C. and Y.S.C.; supervision, J.C. and Y.S.C.; validation, J.C. and Y.S.C.; visualization, Y.S.C.; writing—original draft, J.C.; writing—review & editing, J.C. and Y.S.C. All authors have read and agreed to the published version of the manuscript.
Funding
This research was supported by the Ministry of Education of the Republic of Korea and the National Research Foundation of Korea (NRF-2019S1A5A2A03049194).
Conflicts of Interest
The authors declare no conflict of interest.
Appendix A

Table A1.
Overview of promising technology forecast techniques.
| Authors | Approach | Data | Findings |
|---|---|---|---|
| Park and Yoon [59] | Bibliometric analysis | Patents | Proposes an approach to determine technology opportunities customized to a target firm by applying collaborative filtering to firms’ technology portfolios |
| Yoon and Magee [7] | Bibliometric analysis | Patents | Suggests a systematic approach to identify opportunity analysis by analyzing patent keyword networks |
| Rodriguez et al. [5] | Bibliometric analysis | Patents | Proposes outlier ranking methods developed specifically for patents in attributed patent citation networks |
| Breitzman and Thomas [28] | Bibliometric analysis | Patents | Suggests the Emerging Clusters Model to identify emerging technologies across multiple patent systems by using patent citation techniques |
| Yoon and Kim [29] | Bibliometric analysis | Patents | Proposes a patent network based on semantic patent analysis using subject-action-object (SAO) structures |
| Lee et al. [30] | Bibliometric analysis | Paper, Patents | Proposes InSciTe, which is a decision-making support service for discovering emerging technologies based on semantic analysis and text mining |
| Gerken and Moehrle [31] | Bibliometric analysis | Patents | Develops a method based on patent semantic analysis by measuring textual patent similarity on the basis of elements referred to as combined concepts |
| An et al. [32] | Bibliometric analysis | Patents | a technological-relation-based keyword network based on a semantic relation between the technological keywords |
| Bañuls and Salmeron [39] | Judgmental method | Experts | Proposes a foresight model for detecting key areas in the Information Technology industry by combining the Delphi method and AHP Process |
| Bengisu and Nekhili [40] | Judgmental method | Experts, Paper, Patents | Proposes a tool to link technology foresight by experts with quantitative analysis of patents and publications for trend analysis and technology forecasting |
| Lee et al. [41] | Judgmental method | Experts, Patents | Develops a systematic process of building technology road-maps (TRMs) for project selection and planning |
| Zhang et al. [42] | Judgmental method | Experts, Patents | Integrates bibliometrics with qualitative methods to construct a hybrid visualisation model for technology roadmapping |
| This study | Market Information analysis | Financial | Evaluates promising technology areas based on M&A transaction information |
Table A2.
Classification of technology areas in the IT sector.
| No | Sub-Industry (4-Level) | Sub-Sub-Industry (5-Level) |
|---|---|---|
| 1 | Application Software | Application Hosting Services, Collaboration Tools, Drawing and Imaging Software, Enterprise Software, Groupware, Internet Software, Math and Science Software, Multimedia Software, Office and Home Productivity Software, Personal Mobile Applications (10 areas) |
| 2 | Communications Equipment | Communications Processing Equipment, Communications Towers, Networking Equipment, Radio and Television Broadcasting Equipment, RFID Systems, Satellite and Microwave Equipment, Telephone and Telecommunications Equipment (7 areas) |
| 3 | Data Processing and Outsourced Services | ATM/POS Rental and Leasing with Processing, Data Processing and Entry Services, Data Processing and Outsourced Services for Banking Industry, Data Processing and Outsourced Services for Insurance Industry, Data Processing and Outsourced Services for Investment and Capital Markets, Electronic Document Processing Services, Internet Merchant Services, Online Bill Payment Services, Payments Fraud Management Services (9 areas) |
| 4 | Electronic Components | Electronic Components (1area) |
| 5 | Electronic Equipment and Instruments | Calculating and Accounting Machines; Mail Machines; Time Clocks and Other Time Recording Devices; Measuring, Analyzing, and Controlling Instruments; Security, Control, Surveillance, and Detection Equipment (5 areas) |
| 6 | Electronic Manufacturing Services | Electronics Manufacturing Equipment, Manufacturing Services, Outsourced Technology Manufacturing Services (3 areas) |
| 7 | Internet Services and Infrastructure | Co-location/Data Centers, Content Delivery Services, Infrastructure Services, Internet-based Banking related Services, Internet-based Insurance-related Services, Internet-based Investment and Capital Markets related Services, Internet Navigation Portals, Internet Presence Providers (IPP) (8 areas) |
| 8 | IT Consulting and Other Services | Information Technology (IT) Consulting (1 area) |
| 9 | Semiconductor Equipment | Semiconductor Manufacturing Machinery (1 area) |
| 10 | Semiconductors | Analog and Mixed Signal, Digital, Semiconductor Manufacturing Services (3 areas) |
| 11 | Systems Software | Automation Products and Services, Backup and Recovery Software, Computer Telephone Integration (CTI) Software, Design Automation, Development Tools, License Distribution and Control Software, Maintenance Software, Network Administration, Operating System Software, Performance Monitoring and Analysis Software, Security Software, Software Configuration and Control, Software Research, System Software for Banking Industry, System Software for Insurance Industry, System Software for Investment and Capital Markets, Wireless Access (17 areas) |
| 12 | Technology Distributors | Commercial Electronics Distribution, Communications Equipment Distribution, Semiconductor Equipment and Product Distribution, Software Distribution, Technology Hardware and Equipment Distribution (5 areas) |
| 13 | Technology Hardware, Storage and Peripherals | Banking related Technology Hardware, Storage and Peripherals; Computer Components; Data Storage; Facsimile Machines; Industry Specific Electronics; Insurance Industry related Technology Hardware, Storage and Peripherals; Investment and Capital Markets related Technology Hardware, Storage and Peripherals; Labeling Machines; Paper Processing Machines; Personal Computers And Accessories; Photocopiers; Printers; Servers; Smart Cards; Wireless Telephone Equipment (15 areas) |
| Total | 13 Sub-Industries | 85 Sub-Sub-Industries |
References
- Marimuthu, M. Mergers and Acquisitions: Some Empirical Evidence on Performance, Financial Characteristics and Firm Sustainability. Int. J. Bus. Manag. 2009, 3, 8–15. [Google Scholar] [CrossRef] [Green Version]
- Salvi, A.; Petruzzella, F.; Giakoumelou, A. Green M&A Deals and Bidders’ Value Creation: The Role of Sustainability in Post-Acquisition Performance. Int. Bus. Res. 2018, 11, 96. [Google Scholar] [CrossRef]
- González-Torres, T.; Rodríguez-Sánchez, J.L.; Pelechano-Barahona, E.; García-Muiña, F.E. A systematic review of research on sustainability in mergers and acquisitions. Sustainability 2020, 12, 513. [Google Scholar] [CrossRef] [Green Version]
- Narin, F. Patent bibliometrics. Scientometrics 1994, 30, 147–155. [Google Scholar] [CrossRef]
- Rodriguez, A.; Tosyali, A.; Kim, B.; Choi, J.; Lee, J.M.; Coh, B.Y.; Jeong, M.K. Patent Clustering and Outlier Ranking Methodologies for Attributed Patent Citation Networks for Technology Opportunity Discovery. IEEE Trans. Eng. Manag. 2016, 63, 426–437. [Google Scholar] [CrossRef]
- Rotolo, D.; Hicks, D.; Martin, B.R. What is an emerging technology? Res. Policy 2015, 44, 1827–1843. [Google Scholar] [CrossRef] [Green Version]
- Yoon, B.; Magee, C.L. Exploring technology opportunities by visualizing patent information based on generative topographic mapping and link prediction. Technol. Forecast. Soc. Chang. 2018, 132, 105–117. [Google Scholar] [CrossRef]
- Council, N.R. Persistent Forecasting of Disruptive Technologies; The National Academies Press: Washington, DC, USA, 2010; ISBN 978-0-309-11660-2. [Google Scholar]
- Cho, Y.; Daim, T. Technology Forecasting Methods. In Research and Technology Management in the Electricity Industry: Methods, Tools and Case Studies; Springer Science & Business Media: Berlin, Germany, 2013; pp. 67–112. ISBN 978-1-4471-5097-8. [Google Scholar]
- Daim, T.; Monalisa, M.; Dash, P.; Brown, N. Time lag assessment between research funding and output in emerging technologies. Foresight 2007, 9, 33–44. [Google Scholar] [CrossRef]
- Chapman, N.R. Editorial: Bibliometrics. IEEE J. Ocean. Eng. 2014, 39, 405–406. [Google Scholar] [CrossRef] [Green Version]
- Wallin, J.A. Bibliometric methods: Pitfalls and possibilities. Basic Clin. Pharmacol. Toxicol. 2005, 97, 261–275. [Google Scholar] [CrossRef]
- Belter, C.W. Bibliometric indicators: Opportunities and limits. J. Med. Libr. Assoc. 2015, 103, 219–221. [Google Scholar] [CrossRef] [PubMed] [Green Version]
- Zupic, I.; Čater, T. Bibliometric Methods in Management and Organization. Organ. Res. Methods 2015, 18, 429–472. [Google Scholar] [CrossRef]
- Choi, J.; Chung, S.; Chang, Y.S. Is M&A information useful for exploring promising industries and technologies? Sustainability 2020, 12, 139. [Google Scholar] [CrossRef] [Green Version]
- Aaldering, L.J.; Leker, J.; Song, C.H. Uncovering the dynamics of market convergence through M&A. Technol. Forecast. Soc. Chang. 2019, 138, 95–114. [Google Scholar] [CrossRef]
- Mocciaro, A.; Destri, L.; Picone, P.M.; Minà, A. Full Length Research Paper from “Strategic Fit ” to Synergy Evaluation in M & A Deals. J. Appl. Sci. Res. 2012, 1, 25–38. [Google Scholar]
- Valentini, G.; Di Guardo, M.C. M&A and the profile of inventive activity. Strateg. Organ. 2012, 10, 384–405. [Google Scholar] [CrossRef]
- Andriuskevicius, K. M&A performance and economic impact: Integration and critical assessment of methodological approach. Trends Econ. Manag. 2017, 11, 9. [Google Scholar] [CrossRef] [Green Version]
- Cefis, E. The impact of M&A on technology sourcing strategies. Econ. Innov. New Technol. 2010, 19, 27–51. [Google Scholar] [CrossRef] [Green Version]
- Cefis, E.; Marsili, O. Crossing the innovation threshold through mergers and acquisitions. Res. Policy 2015, 44, 698–710. [Google Scholar] [CrossRef]
- Cassiman, B.; Veugelers, R. In Search of Complementarity in Innovation Strategy: Internal R&D and External Knowledge Acquisition. Manag. Sci. 2006, 52, 68–82. [Google Scholar] [CrossRef] [Green Version]
- Choi, J.; Shin, N.; Lee, H.S. Exploring the dynamics between M&A activities and industry-level performance. Sustainability 2020, 12, 4399. [Google Scholar] [CrossRef]
- Park, Y.; Yoon, J. Application technology opportunity discovery from technology portfolios: Use of patent classification and collaborative filtering. Technol. Forecast. Soc. Chang. 2017, 118, 170–183. [Google Scholar] [CrossRef]
- Klevorick Alvin, K.; Levin Richard, C.; Nelson Richard, R.; Winter Sidney, G. On the sources and significance of interindustry differences in technological opportunities. Res. Policy 1995, 24, 185–206. [Google Scholar] [CrossRef]
- Olsson, O. Technological opportunity and growth. J. Econ. Growth 2005, 10, 35–57. [Google Scholar] [CrossRef]
- Kim, B.; Gazzola, G.; Lee, J.M.; Kim, D.; Kim, K.; Jeong, M.K. Inter-cluster connectivity analysis for technology opportunity discovery. Scientometrics 2014, 98, 1811–1825. [Google Scholar] [CrossRef]
- Breitzman, A.; Thomas, P. The Emerging Clusters Model: A tool for identifying emerging technologies across multiple patent systems. Res. Policy 2015, 44, 195–205. [Google Scholar] [CrossRef]
- Yoon, J.; Kim, K. Identifying rapidly evolving technological trends for R&D planning using SAO-based semantic patent networks. Scientometrics 2011, 88, 213–228. [Google Scholar] [CrossRef]
- Lee, M.; Lee, S.; Kim, J.; Seo, D.; Kim, P.; Jung, H.; Lee, J.; Kim, T.; Koo, H.K.; Sung, W. InSciTe Advanced: Service for Technology Opportunity Discovery. In Proceedings of the 10th International Semantic Web Conference—Semantic Web Challenge, Bonn, Germany, 23—27 October 2011. [Google Scholar]
- Gerken, J.M.; Moehrle, M.G. A new instrument for technology monitoring: Novelty in patents measured by semantic patent analysis. Scientometrics 2012, 91, 645–670. [Google Scholar] [CrossRef]
- An, J.; Kim, K.; Mortara, L.; Lee, S. Deriving technology intelligence from patents: Preposition-based semantic analysis. J. Informetr. 2018, 12, 217–236. [Google Scholar] [CrossRef]
- Jena, K.L. A bibliometric analysis of the journal “Indian Journal of Fibre and Textile Research, 1996–2004”. Ann. Libr. Inf. Stud. 2006, 53, 22–30. [Google Scholar]
- Kalyane, V.L.; Sen, B.K. A bibliometric study of the journal of oilseeds research. Ann. Libr. Sci. Doc. 1995, 42, 121–141. [Google Scholar]
- Li, X.; Zhou, Y.; Xue, L.; Huang, L. Integrating bibliometrics and roadmapping methods: A case of dye-sensitized solar cell technology-based industry in China. Technol. Forecast. Soc. Chang. 2015, 97, 205–222. [Google Scholar] [CrossRef]
- Lindman, Å.; Söderholm, P. Wind energy and green economy in Europe: Measuring policy-induced innovation using patent data. Appl. Energy 2016, 179, 1351–1359. [Google Scholar] [CrossRef]
- Coenen, R. The use of technological forecasts in government planning. Res. Policy 1972, 1, 156–172. [Google Scholar] [CrossRef]
- Goodwin, P.; Wright, G. The limits of forecasting methods in anticipating rare events. Technol. Forecast. Soc. Chang. 2010, 77, 355–368. [Google Scholar] [CrossRef] [Green Version]
- Bañuls, V.A.; Salmeron, J.L. Foresighting key areas in the Information Technology industry. Technovation 2008, 28, 103–111. [Google Scholar] [CrossRef]
- Bengisu, M.; Nekhili, R. Forecasting emerging technologies with the aid of science and technology databases. Technol. Forecast. Soc. Chang. 2006, 73, 835–844. [Google Scholar] [CrossRef]
- Lee, S.; Kang, S.; Park, E.; Park, Y. Applying technology road-maps in project selection and planning. Int. J. Qual. Reliab. Manag. 2008, 25, 39–51. [Google Scholar] [CrossRef]
- Zhang, Y.; Guo, Y.; Wang, X.; Zhu, D.; Porter, A.L. A hybrid visualisation model for technology roadmapping: Bibliometrics, qualitative methodology and empirical study. Technol. Anal. Strateg. Manag. 2013, 25, 707–724. [Google Scholar] [CrossRef]
- Kostoff, R.N.; Solka, J.L.; Rushenberg, R.L.; Wyatt, J.A. Literature-related discovery (LRD): Water purification. Technol. Forecast. Soc. Chang. 2008, 75, 256–275. [Google Scholar] [CrossRef]
- Gupta, P.K. Mergers and Acquisitions (M&a): The Strategic Concepts for the Nuptials of Corporate Sector. Innov. J. Bus. Manag. 2012, 1, 60–68. [Google Scholar]
- Motis, J. Mergers and Acquisitions Motives; Working Papers 0730; Department of Economics, University of Crete: Heraklion, Greece, 2007. [Google Scholar]
- Hicks, D. Structural change and industrial classification. Struct. Chang. Econ. Dyn. 2011, 22, 93–105. [Google Scholar] [CrossRef]
- Hausmann, R.; Pritchett, L.; Rodrik, D. Growth accelerations. Journal of Economic Growth. J. Econ. Growth 2005, 10, 303–329. [Google Scholar] [CrossRef]
- Mohan, R. The Growth Record of the Indian Economy, 1950–2008: A Story of Sustained Savings and Investment; Working Papers 1388; eSocialSciences: New Mumbai, India, 2008. [Google Scholar]
- Niebel, T. ICT and economic growth—Comparing developing, emerging and developed countries. World Dev. 2018, 104, 197–211. [Google Scholar] [CrossRef] [Green Version]
- Hong, J. pyo Causal relationship between ICT R&D investment and economic growth in Korea. Technol. Forecast. Soc. Chang. 2017, 116, 70–75. [Google Scholar] [CrossRef]
- Makada Henry-Nickie, K.F.; Sun, H. Trends in the Information Technology Sector. Available online: https://www.brookings.edu/research/trends-in-the-information-technology-sector/ (accessed on 15 January 2020).
- Garg, N.; Rani, R. Analysis and visualization of Twitter data using k-means clustering. In Proceedings of the 2017 International Conference on Intelligent Computing and Control Systems (ICICCS), Madurai, India, 15–16 June 2017; pp. 670–675. [Google Scholar]
- Wu, J.; Chen, J.; Xiong, H.; Xie, M. External validation measures for K-means clustering: A data distribution perspective. Expert Syst. Appl. 2009, 36, 6050–6061. [Google Scholar] [CrossRef]
- Kozak, M. “A Dendrite Method for Cluster Analysis” by Caliński and Harabasz: A Classical Work that is Far Too Often Incorrectly Cited. Commun. Stat. Theory Methods 2012, 41, 2279–2280. [Google Scholar] [CrossRef]
- Ferdhiana, R.; Fabidin, T.; Mardhiah, A. Grouping the districts in Indonesia based on value of science subjects of National Exam using K-Means clustering method. In Proceedings of the IOP Conference Series: Materials Science and Engineering, Aceh, Indonesia, 12–14 September 2018; Volume 523. [Google Scholar] [CrossRef]
- Purnima, B.; Arvind, K. EBK-Means: A Clustering Technique based on Elbow Method and K-Means in WSN. Int. J. Comput. Appl. 2014, 105, 17–24. [Google Scholar]
- Burmaoglu, S.; Sartenaer, O.; Porter, A. Conceptual definition of technology emergence: A long journey from philosophy of science to science policy. Technol. Soc. 2019, 59, 101126. [Google Scholar] [CrossRef]
- Eisenach, J.A. US merger enforcement in the information technology sector. In Handbook of Antitrust, Intellectual Property and High Tech; Cambridge University Press: Cambridge, UK, 2017; pp. 445–466. [Google Scholar] [CrossRef]
- Park, I.; Yoon, B. Identifying promising research frontiers of pattern recognition through bibliometric analysis. Sustainability 2018, 10, 4055. [Google Scholar] [CrossRef] [Green Version]
- Campbell, C.; Cowan, A.; Salotti, V. Multi-country event-study methods. J. Bank. Financ. 2010, 34, 3078–3090. [Google Scholar] [CrossRef] [Green Version]
- Boulanger, P.C. The Financial Impact of M&A Announcements: Event Study in the Personal Luxury Goods Industry between 2000 and 2016; Louvain School of Management, Université catholique de Louvain: Louvain-la-Neuve, Belgium, 2018. [Google Scholar]
Figure 1.
The cumulative number of merger and acquisition (M&A) transactions by sub-industry in the IT sector.
Figure 1.
The cumulative number of merger and acquisition (M&A) transactions by sub-industry in the IT sector.

Figure 2.
The Cumulative M&A transaction value by sub-industry in the IT sector.
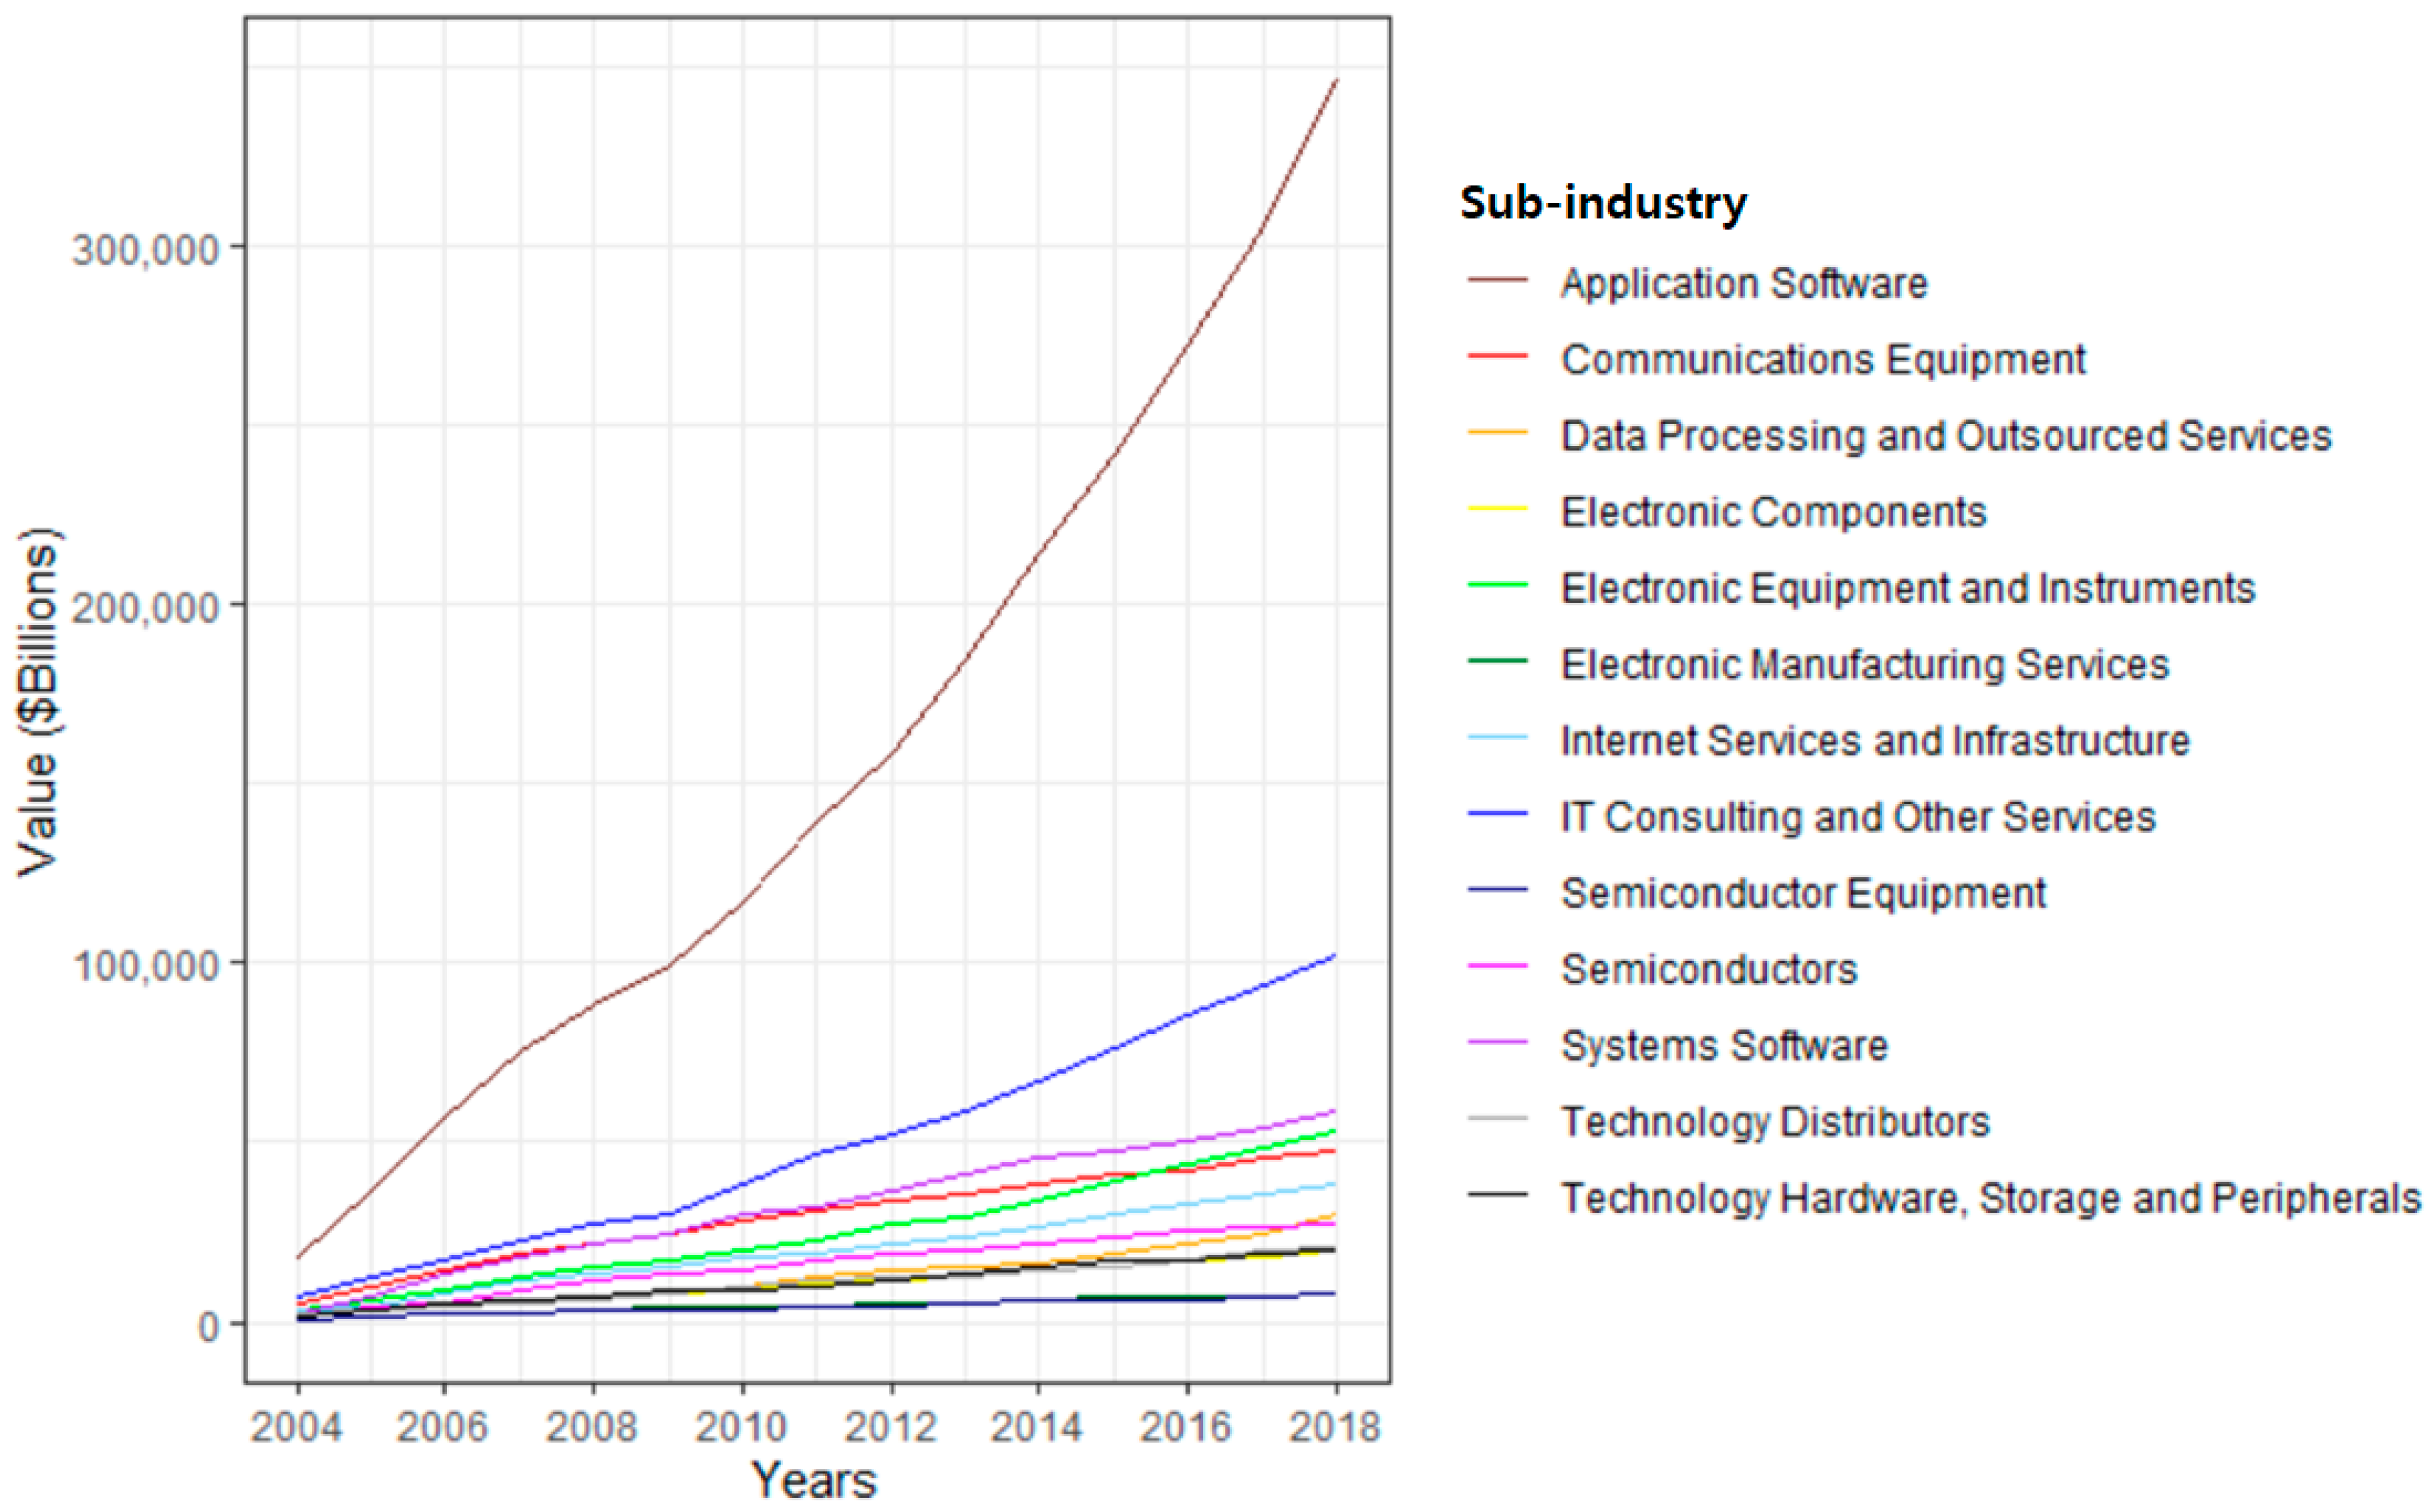
Figure 3.
The velocity of M&A transactions based on the number of M&A transactions by sub-industry.
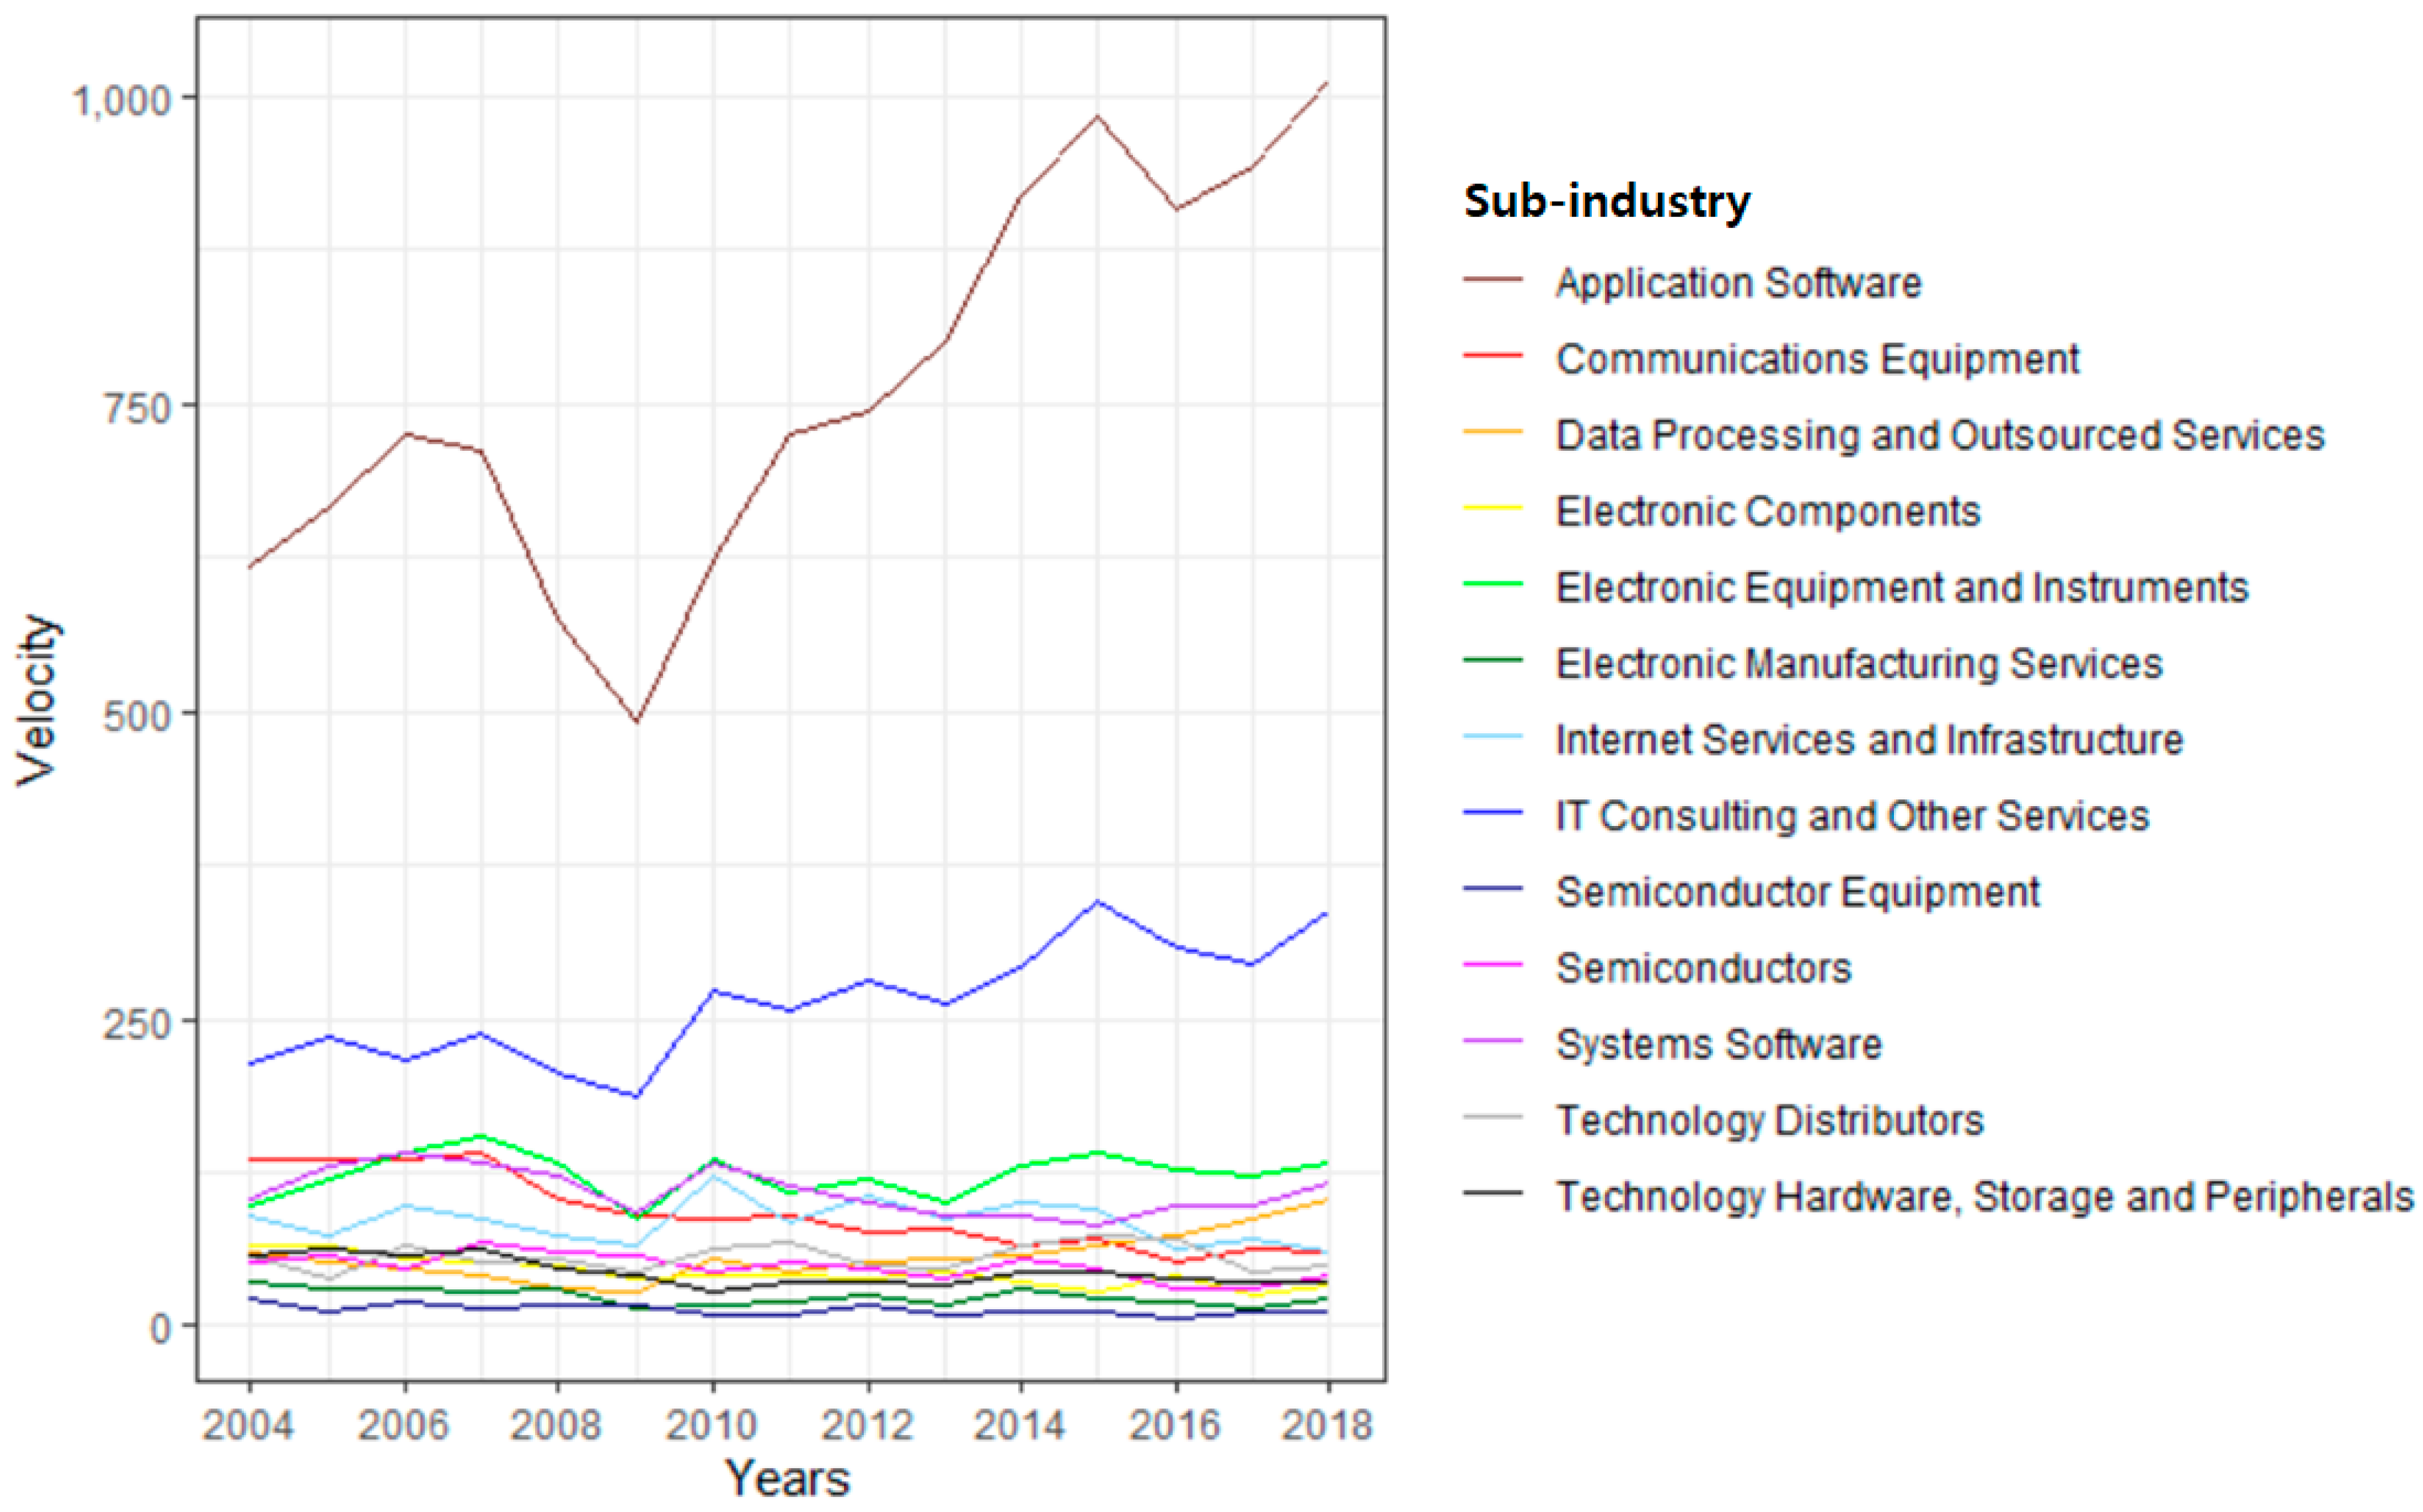
Figure 4.
The velocity of M&A transactions based on the value of M&A transactions by sub-industry.

Figure 5.
Acceleration of M&A transactions based on the number of M&A transactions by sub-industry.

Figure 6.
Acceleration of M&A transactions based on the value of M&A transactions by sub-industry.
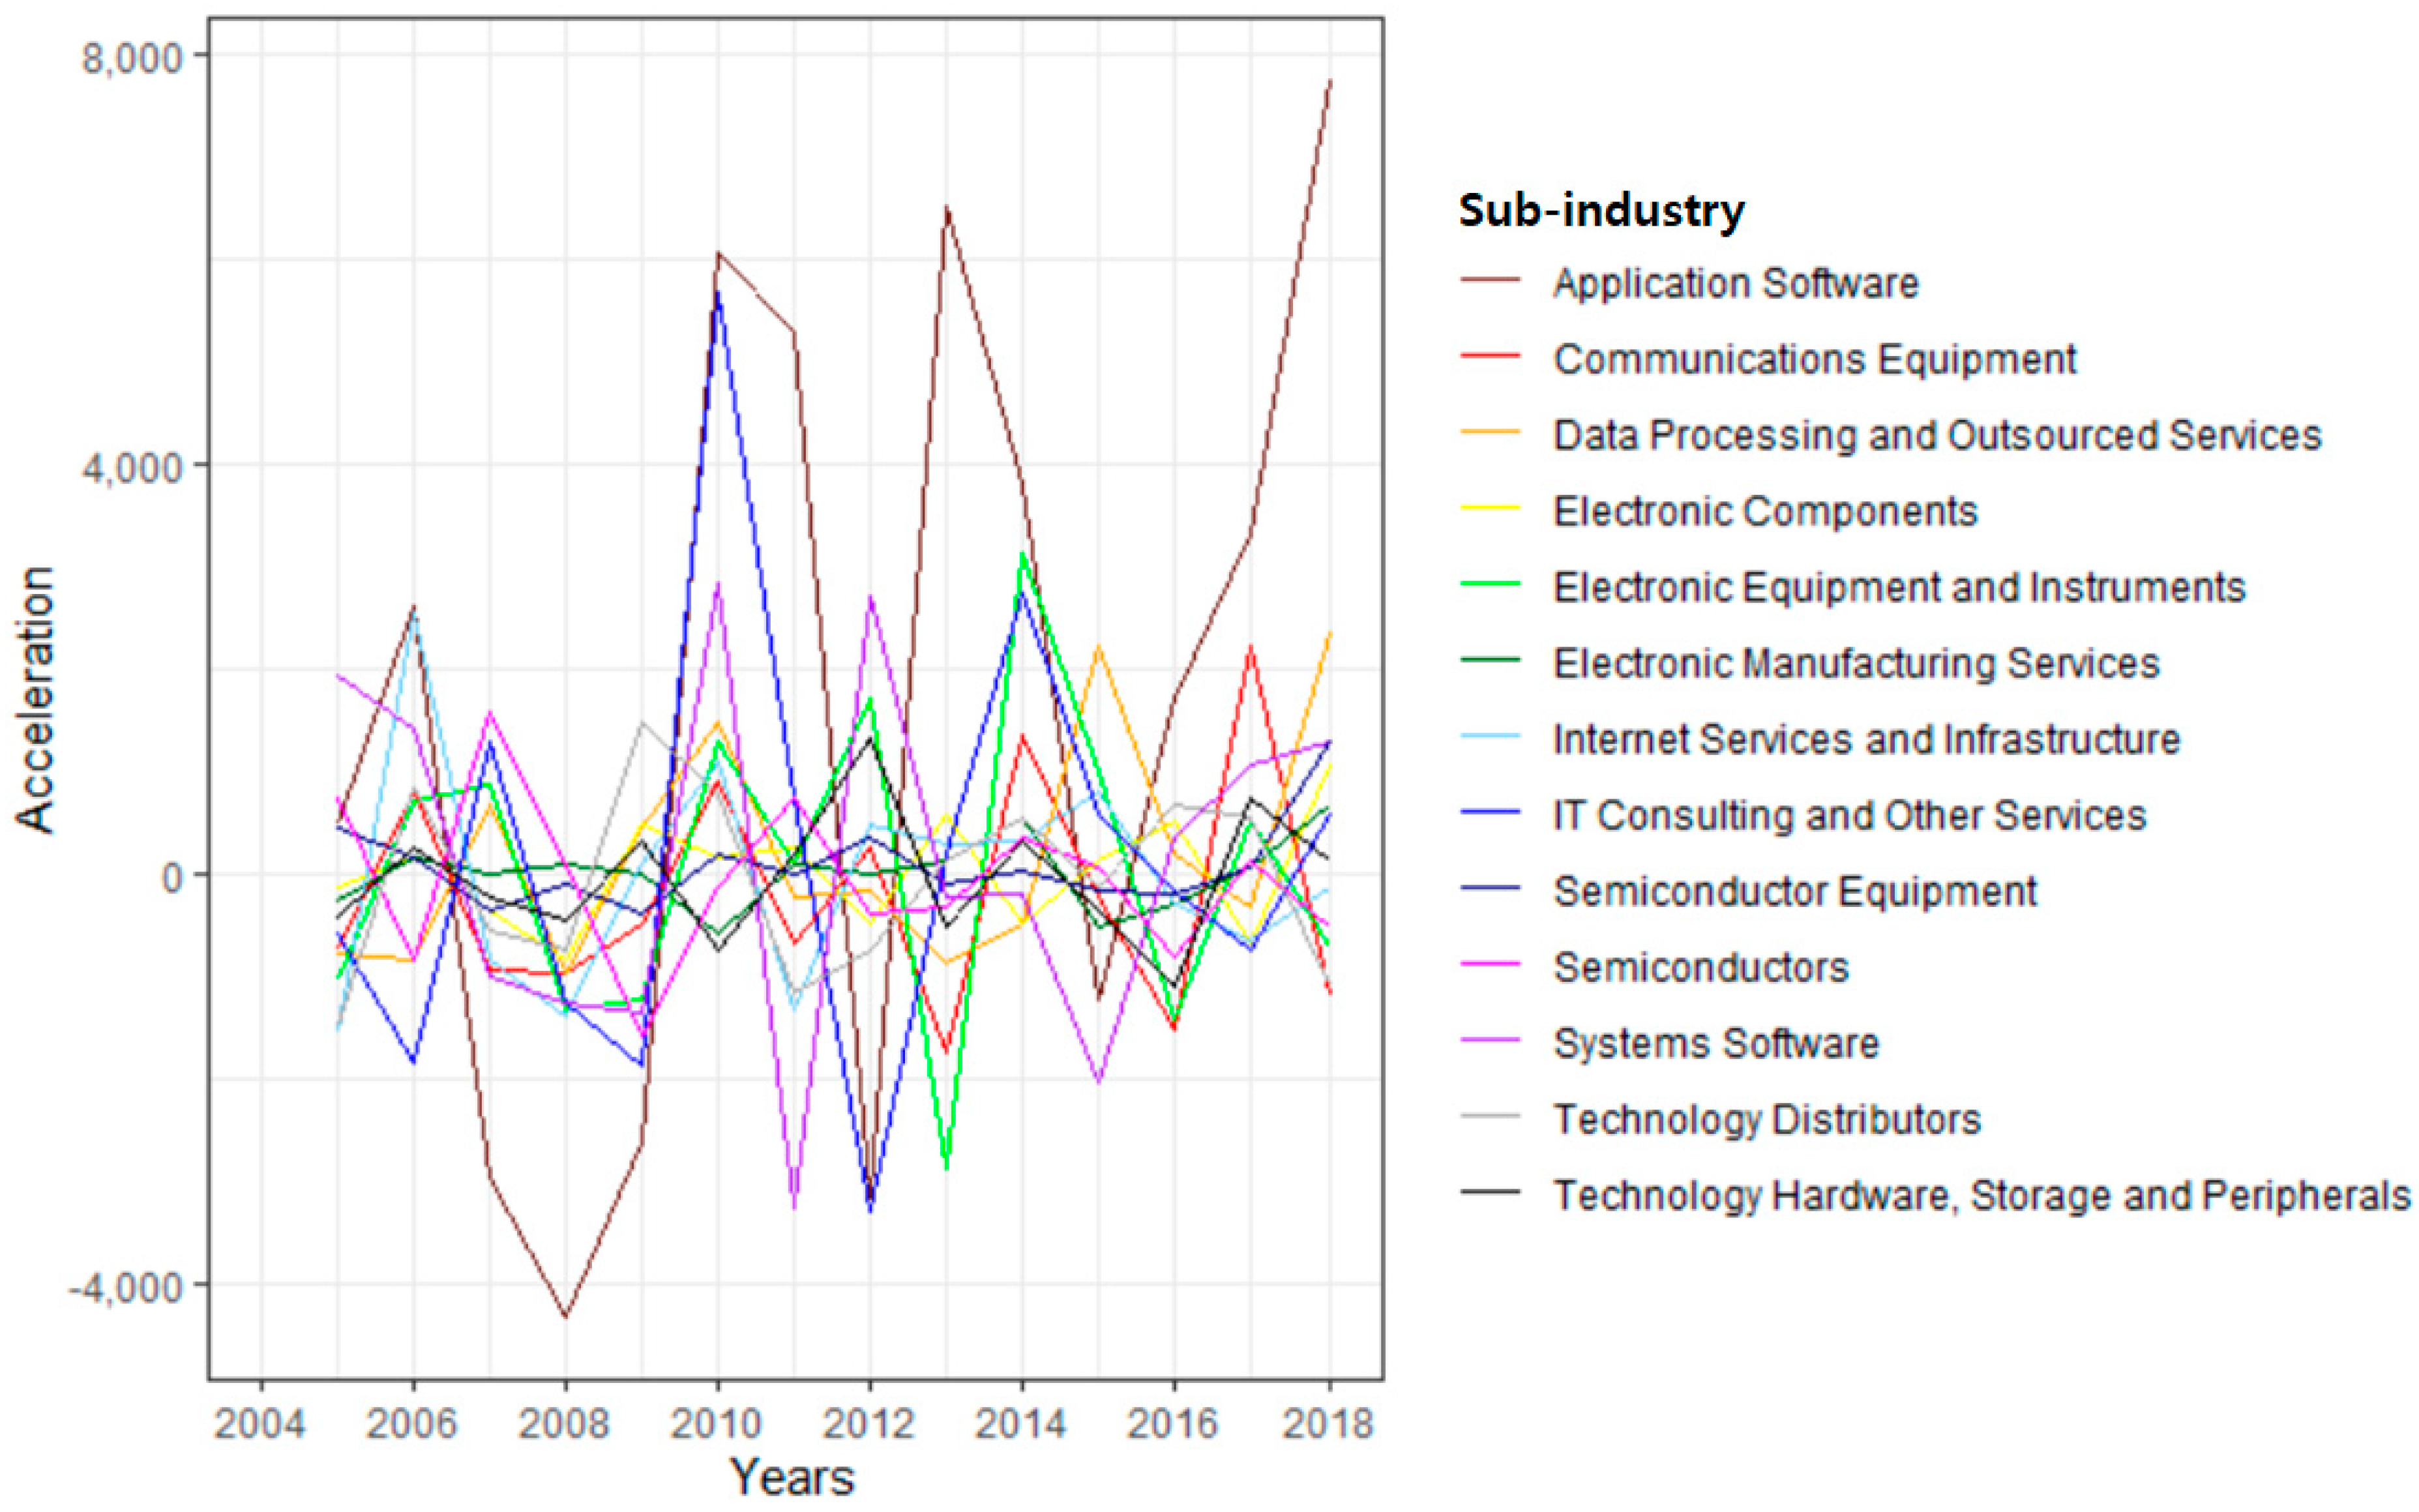
Figure 7.
Time-series change in the number of M&A transactions (“IT Consulting and Other Services”).
Figure 7.
Time-series change in the number of M&A transactions (“IT Consulting and Other Services”).
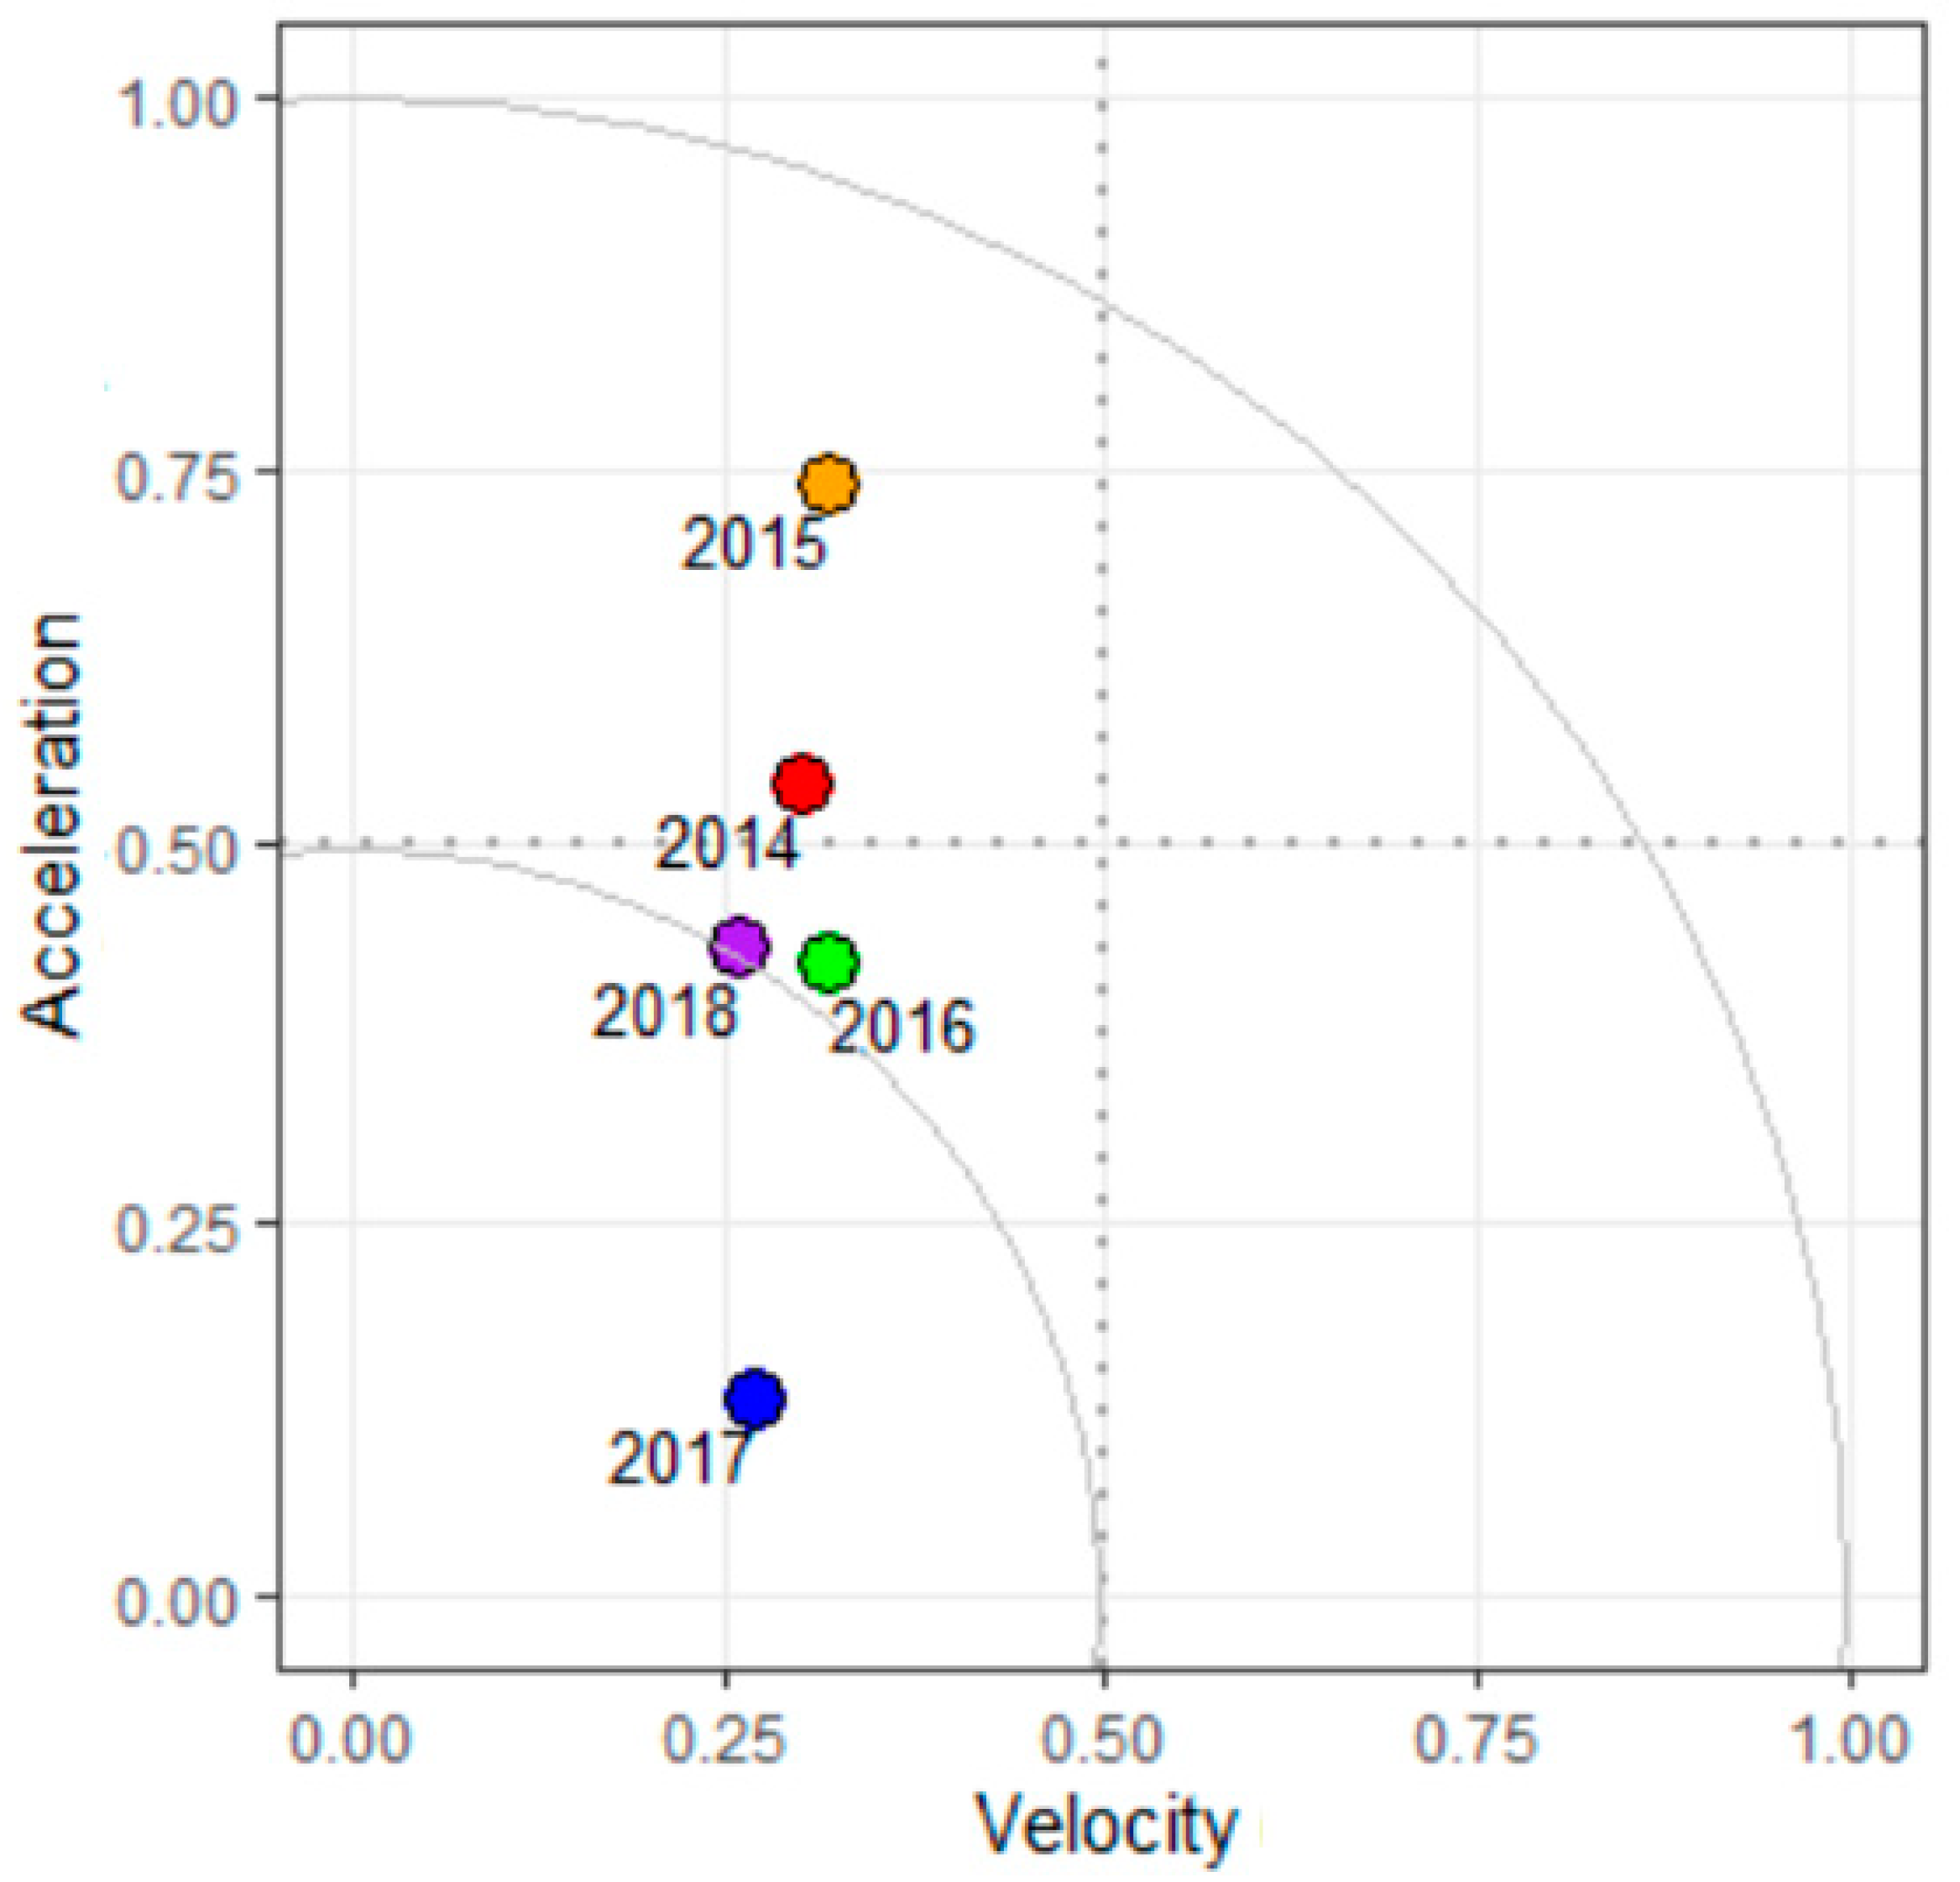
Figure 8.
M&A transaction velocity of the number of M&A transactions by sub-industry (2018).

Figure 9.
M&A transaction velocity of the value of M&A transactions by sub-industry (2018).
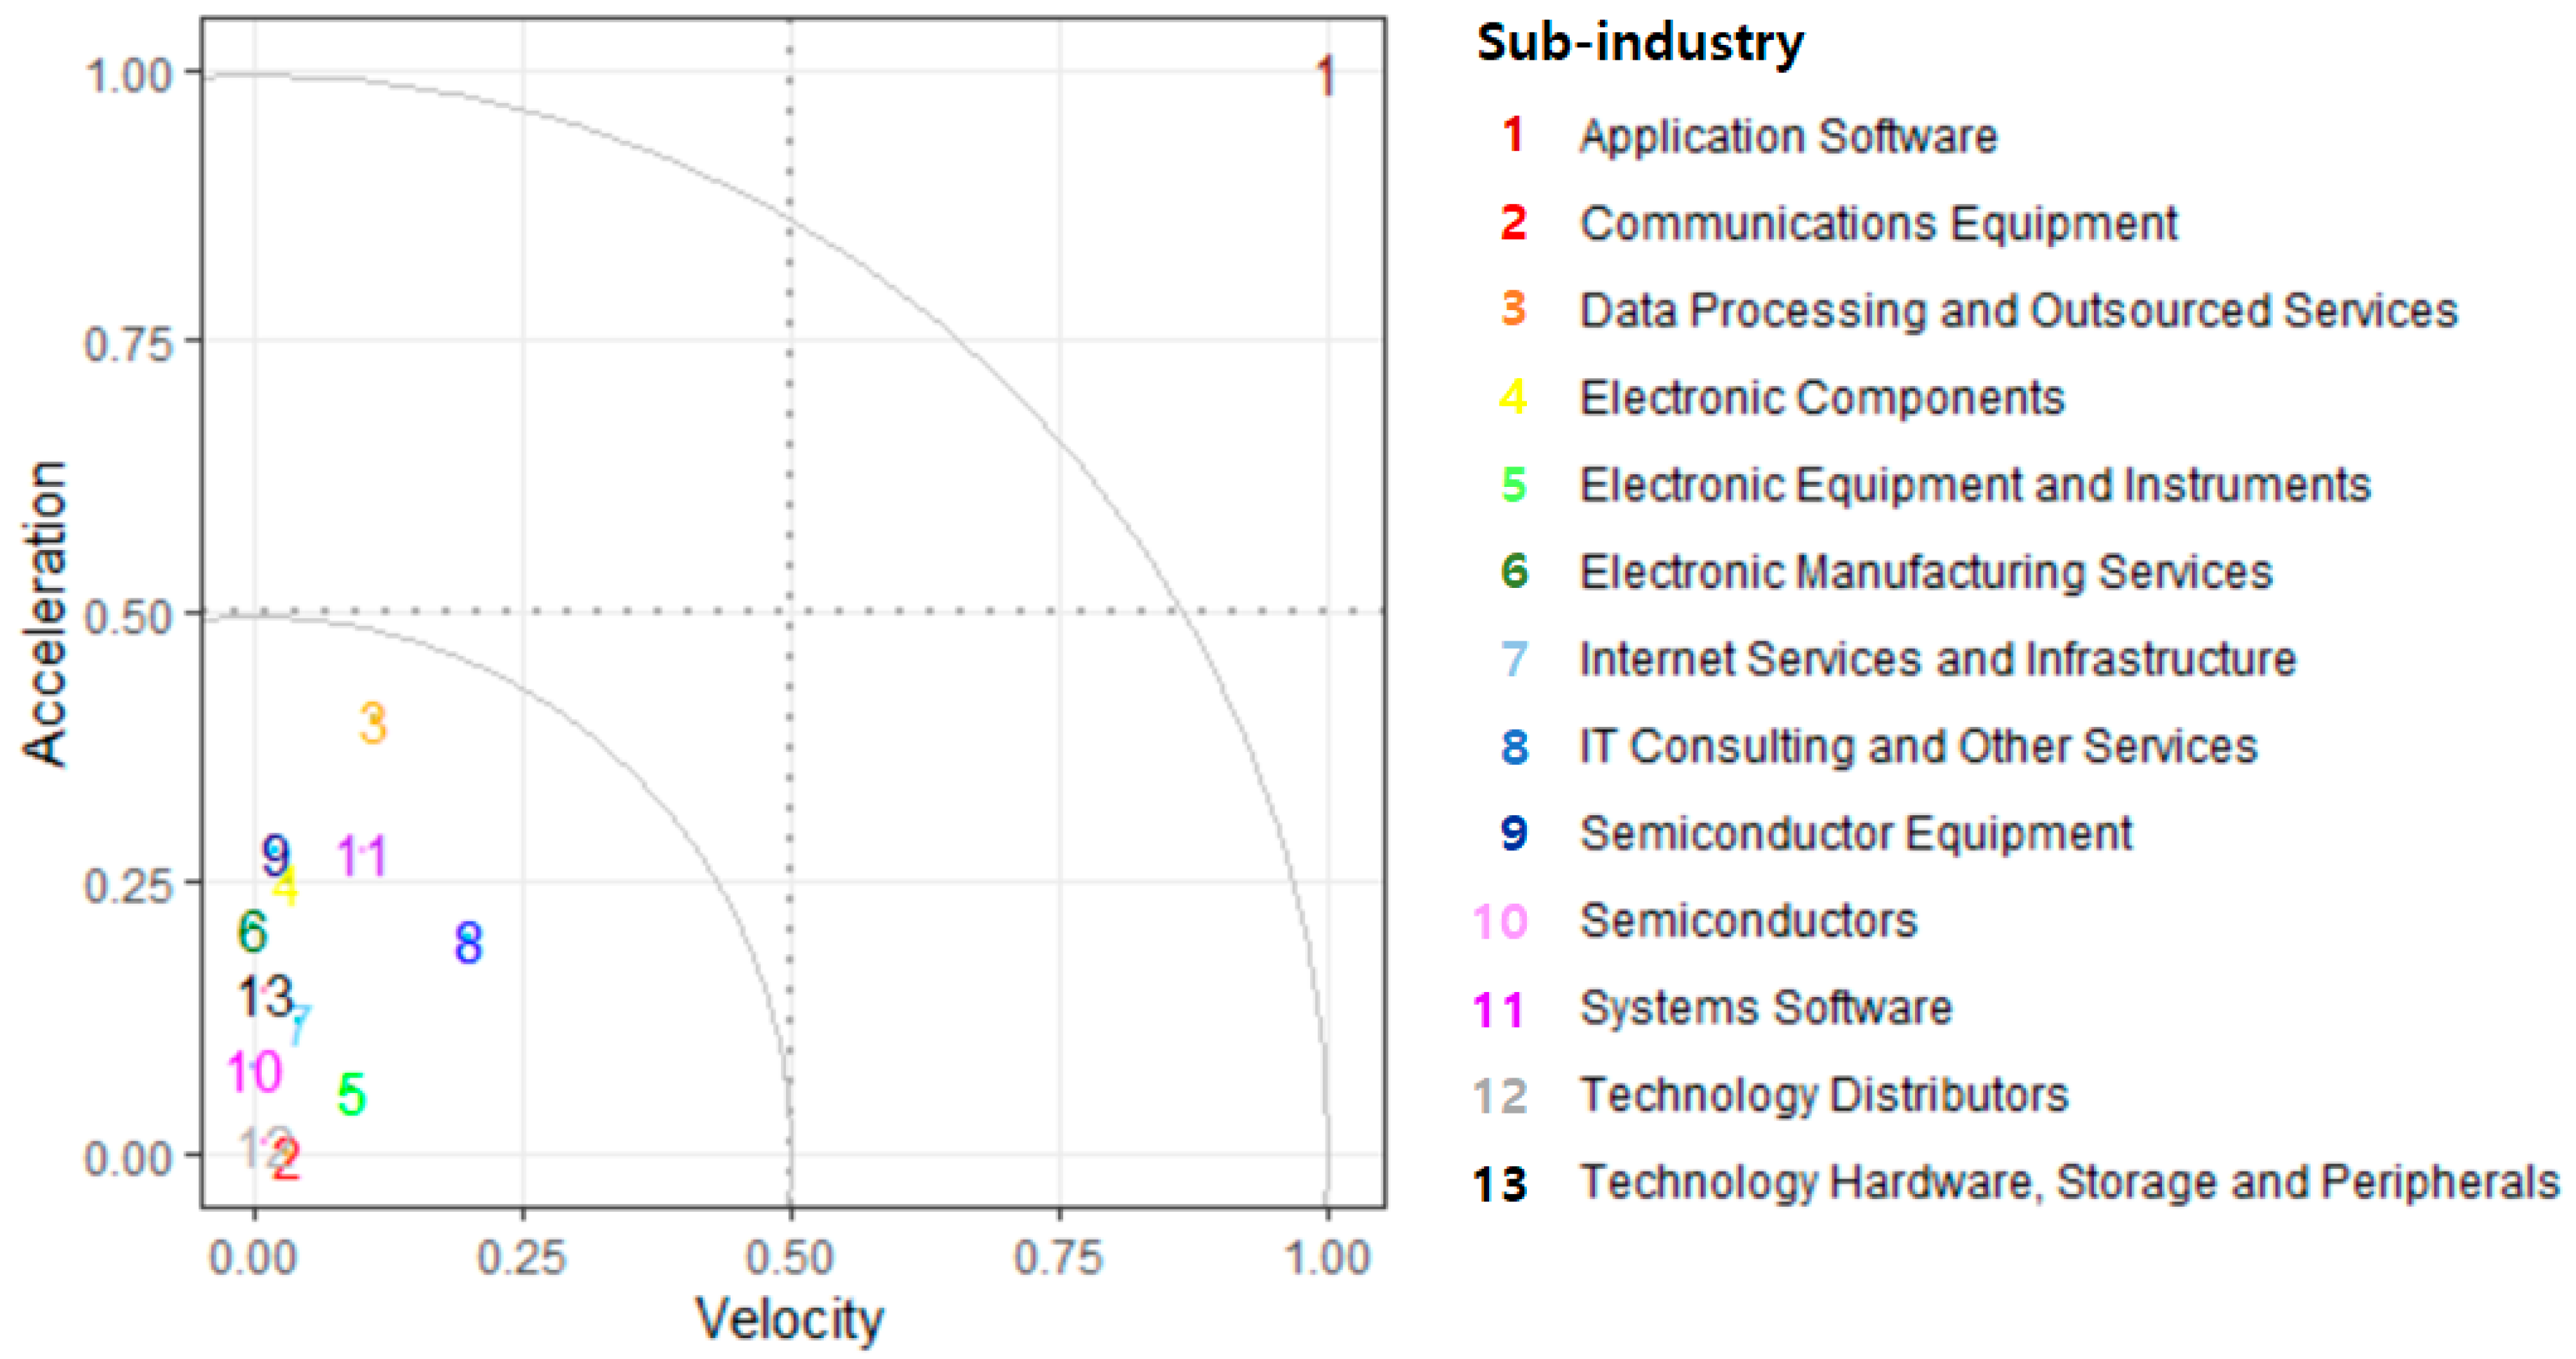
Figure 10.
Finding the number of clusters using the elbow method (2018).

Figure 11.
Sub-industry groups by K-means clustering algorithm (2018).

Table 1.
Descriptive statistics of the 25,879 M&As.
| Sub-Industry | Number of Transactions | Total Transaction Value ($USDmm) | |||||
|---|---|---|---|---|---|---|---|
| Mean | Min | 1st Quartile | 2nd Quartile | 3rd Quartile | Max | ||
| Application Software | 11,437 | 173.6 | 0.01 | 5.0 | 18.5 | 81.0 | 11,536.1 |
| Communications Equipment | 1390 | 256.3 | 0.01 | 6.0 | 26.2 | 99.4 | 18,854.7 |
| Data Processing and Outsourced Services | 860 | 412.8 | 0.01 | 5.9 | 32.8 | 187.8 | 28,677.9 |
| Electronic Components | 659 | 103.9 | 0.01 | 4.3 | 17.0 | 63.1 | 7228.6 |
| Electronic Equipment and Instruments | 1853 | 109.3 | 0.03 | 3.3 | 15.4 | 57.0 | 4522.7 |
| Electronic Manufacturing Services | 366 | 100.5 | 0.02 | 5.3 | 14.4 | 39.0 | 4301.2 |
| Internet Services and Infrastructure | 1278 | 173.4 | 0.01 | 3.0 | 16.3 | 62.2 | 7500.0 |
| IT Consulting and Other Services | 3944 | 152.6 | 0.01 | 3.4 | 14.0 | 50.0 | 16,987.4 |
| Semiconductor Equipment | 201 | 235.8 | 0.10 | 7.1 | 23.0 | 172.5 | 4891.4 |
| Semiconductors | 737 | 545.1 | 0.04 | 9.9 | 36.6 | 190.0 | 38,452.5 |
| Systems Software | 1647 | 335.8 | 0.01 | 6.0 | 23.3 | 103.5 | 35,690.9 |
| Technology Distributors | 848 | 214.6 | 0.02 | 2.0 | 10.3 | 65.9 | 7332.6 |
| Technology Hardware, Storage and Peripherals | 659 | 668.7 | 0.02 | 4.8 | 19.9 | 109.2 | 75,716.5 |
Table 2.
Inter-Sub-industry (Level 4) correlation matrix over the entire period (number of M&A transactions).
Table 2.
Inter-Sub-industry (Level 4) correlation matrix over the entire period (number of M&A transactions).
| Target Sub-industry | Application Software | Communications Equipment | Data Processing and Outsourced Services | Electronic Components | Electronic Equipment and Instruments | Electronic Manufacturing Services | Internet Services and Infrastructure | IT Consulting and Other Services | Semiconductor Equipment | Semi- conductors | Systems Software | Technology Distributors | Technology Hardware, Storage and Peripherals | Total | |
|---|---|---|---|---|---|---|---|---|---|---|---|---|---|---|---|
| Buyer Sub-industry | |||||||||||||||
| Application Software | 4500 | 95 | 103 | 5 | 69 | 7 | 133 | 459 | 6 | 21 | 401 | 47 | 41 | 5887 | |
| Communications Equipment | 224 | 386 | 0 | 44 | 56 | 10 | 21 | 35 | 2 | 28 | 106 | 22 | 31 | 965 | |
| Data Processing and Outsourced Services | 278 | 5 | 212 | 0 | 3 | 0 | 53 | 39 | 0 | 1 | 17 | 15 | 16 | 639 | |
| Electronic Components | 8 | 47 | 2 | 134 | 53 | 20 | 0 | 2 | 5 | 29 | 2 | 4 | 6 | 312 | |
| Electronic Equipment and Instruments | 168 | 54 | 4 | 42 | 480 | 17 | 5 | 19 | 7 | 10 | 32 | 29 | 34 | 901 | |
| Electronic Manufacturing Services | 7 | 14 | 1 | 45 | 27 | 101 | 1 | 3 | 5 | 8 | 3 | 5 | 8 | 228 | |
| Internet Services and Infrastructure | 161 | 8 | 55 | 1 | 1 | 0 | 261 | 129 | 0 | 1 | 24 | 7 | 3 | 651 | |
| IT Consulting and Other Services | 604 | 47 | 49 | 2 | 33 | 7 | 175 | 1576 | 1 | 4 | 102 | 133 | 15 | 2748 | |
| Semiconductor Equipment | 13 | 1 | 0 | 16 | 31 | 5 | 0 | 0 | 83 | 23 | 4 | 2 | 3 | 181 | |
| Semiconductors | 58 | 59 | 1 | 51 | 26 | 24 | 3 | 8 | 18 | 375 | 43 | 4 | 29 | 699 | |
| Systems Software | 611 | 46 | 4 | 1 | 8 | 1 | 38 | 97 | 1 | 7 | 395 | 15 | 21 | 1245 | |
| Technology Distributors | 64 | 16 | 0 | 3 | 10 | 4 | 14 | 103 | 4 | 1 | 13 | 217 | 18 | 467 | |
| Technology Hardware, Storage and Peripherals | 185 | 24 | 8 | 13 | 27 | 6 | 20 | 43 | 1 | 20 | 66 | 33 | 175 | 621 | |
| Others | 4556 | 588 | 421 | 302 | 1029 | 164 | 554 | 1431 | 68 | 209 | 439 | 315 | 259 | 10,335 | |
| Total | 11,437 | 1390 | 860 | 659 | 1853 | 363 | 1278 | 3944 | 201 | 737 | 1647 | 848 | 659 | 25,879 | |
© 2020 by the authors. Licensee MDPI, Basel, Switzerland. This article is an open access article distributed under the terms and conditions of the Creative Commons Attribution (CC BY) license (http://creativecommons.org/licenses/by/4.0/).
Share and Cite
MDPI and ACS Style
Choi, J.; Chang, Y.S. Development of a New Methodology to Identity Promising Technology Areas Using M&A Information. Sustainability 2020, 12, 5606. https://0-doi-org.brum.beds.ac.uk/10.3390/su12145606
AMA Style
Choi J, Chang YS. Development of a New Methodology to Identity Promising Technology Areas Using M&A Information. Sustainability. 2020; 12(14):5606. https://0-doi-org.brum.beds.ac.uk/10.3390/su12145606
Chicago/Turabian StyleChoi, Jinho, and Yong Sik Chang. 2020. "Development of a New Methodology to Identity Promising Technology Areas Using M&A Information" Sustainability 12, no. 14: 5606. https://0-doi-org.brum.beds.ac.uk/10.3390/su12145606
Note that from the first issue of 2016, this journal uses article numbers instead of page numbers. See further details here.