Anthropogenic and Inherent Effects on Soil Organic Carbon across the U.S
by
 ,
,
Márcio R. Nunes
1,*, 
Harold M. van Es
2,
Kristen S. Veum
3,
Joseph P. Amsili
2 and
Douglas L. Karlen
4 1
USDA-Agricultural Research Service (USDA-ARS), National Laboratory for Agriculture and the Environment, University Boulevard, Ames, IA 50011–3611, USA
2
Section of Soil and Crop Sciences, School of Integrative Plant Science, Cornell University, Ithaca, NY 14853, USA
3
USDA-ARS, Cropping Systems and Water Quality Research Unit, 269 Agricultural Engineering Bldg., University of Missouri, Columbia, MO 65211, USA
4
USDA-ARS, DL Karlen Consulting LLC, 487 Ashland Ave., St. Pual, MN 55102, USA
*
Author to whom correspondence should be addressed.
Sustainability 2020, 12(14), 5695; https://0-doi-org.brum.beds.ac.uk/10.3390/su12145695
Submission received: 29 May 2020
/
Revised: 2 July 2020
/
Accepted: 13 July 2020
/
Published: 15 July 2020
(This article belongs to the Special Issue Sustainable Soil Health Management)
Abstract
:Soil organic carbon (SOC) influences several soil functions, making it one of the most important soil health indicators. Its quantity is determined by anthropogenic and inherent factors that must be understood to improve SOC management and interpretation. Topsoil (≤15 cm) SOC response to tillage depth and intensity, cover crops, stover removal, manure addition, and various cropping systems was assessed using 7610 observations from eight U.S. regions. Overall, including cover crops, reducing tillage depth and intensity increased SOC. The positive effects of cover crops were more noticeable in South Central, Northwest, and Midwest regions. Removing high rates (>65%) of crop residue decreased SOC in Midwestern and Southeastern soils. Depending on region, applying manure increased SOC by 21 to 41%, compared to non-manured soils. Diversified cropping systems (e.g., those utilizing small mixed vegetables, perennials, or dairy-based systems) had the highest topsoil SOC content, while more intensive annual row crops and large-scale single vegetable production systems, had the lowest. Among inherent factors, SOC increased as precipitation increased, but decreased as mean annual temperature increased. Texture influenced SOC, showing higher values in fine-texture than coarse-texture soils. Finally, this assessment confirmed that SOC can be a sensitive soil health indicator for evaluating conservation practices.
1. Introduction
Critical soil functions include: filtering and buffering; sustaining productivity; regulating water entry, retention, and release to plants; cycling nutrients; transforming compounds; maintaining biodiversity; moderating climate through carbon sequestration and the regulation of gaseous emissions to the atmosphere. Soil health refers to the ability of a soil to perform these functions and can be assessed based on inherent and dynamic soil properties [1], which can be associated with soil genoforms and phenoforms, respectively [2]. A soil genoform provides a reference state that encompasses inherent soil capability under specific long-term circumstances (e.g., natural vegetation), while a phenoform reflects the condition of soils with similar inherent properties but dynamic properties modified by specific land-use or management history. Thus, identifying the most suitable land use and management for each site is essential to maintain and/or improve soil health and ensure the long-term sustainability of food production, as well as other ecosystem services.
Soil health cannot be measured directly, but rather it is inferred by measuring dynamic soil properties or soil health indicators. Ideally, those measurements reflect management impacts, as opposed to relatively static properties defining a genoform. An ideal soil health indicator must be easy to measure, applicable to field conditions, accessible to many users, and pertinent to a wide range of soil functions [3,4,5]. Changes in dynamic indicators can be used to monitor soil health dynamics and thereby determine whether a soil is stable, improving, or declining in response to management, land use, or conservation practice.
Several chemical, physical, and biological soil properties have been proposed as soil health indicators [6]. Each of those is linked to one or more soil function(s). Chemical indicators are usually connected to nutrient cycling, water relations, and buffering. Physical indicators are associated with soil stability and support, water relations, and habitat. Biological indicators are related to biodiversity, nutrient cycling, and filtering. Soil organic carbon (SOC) transcends all three categories, thus being recognized as the most significant single soil health indicator [3,7] and is tied to several soil functions [8]. SOC influences: (1) soil structure, which governs soil tilth and aeration; (2) water retention and use efficiency, which control tolerance to drought, heatwaves, and abrupt climate change; (3) nutrient retention and use efficiency, which moderate nonpoint source pollution and water quality; (4) gaseous emissions, which moderate atmospheric chemistry and are drivers for climate change [7]. Sustainable SOC management is therefore essential for enhancing and managing soil health.
Topsoil SOC can be negatively affected by agricultural practices, such as tillage and crop residue removal. For millennia, tillage was essential for crop production because it helped ensure good soil-seed contact, provided weed control, and enhanced nutrient cycling. Deep and intensive tillage, however, promotes SOC depletion by exposing carbon protected in soil aggregates to microbial degradation and increases rates at which plant residues are oxidized, decomposed, or incorporated into the soil. Furthermore, the excessive removal of crop residue for any purpose (e.g., baling, grazing, bioenergy, or bio-products) can accelerate soil erosion, increase soil organic matter (SOM) decomposition, and nutrient loss [9].
In the U.S., reduced tillage practices were developed and promoted to mitigate catastrophic water and wind erosion following the 1930s Dust Bowl. More recently, multiple benefits of diversifying cropping systems (e.g., including cover or perennial crops in rotations), adding organic amendments (e.g., manure or compost), and retaining crop residues have been recognized as ways to increase topsoil SOC [9,10,11,12]. Reduced tillage intensity decreases SOM mineralization by minimizing residue fractionation and incorporation, while incorporating cover crops and perennials into production systems can increase SOC due to greater total biomass production, returning more crop residue and extending the time living plants and roots are present within the soil. The positive effects of conservation practices on SOC are complex and site-specific [13,14]. As a result, SOC levels often change very slowly (e.g., over years or decades), making this soil property a less useful indicator for detecting the early effects of management changes on soil health [15]. To build a consensus regarding which practices should be recommended, the effects of conservation practices on SOC across the U.S. need to be quantified to improve our knowledge of this important soil health indicator.
Assessing the effect of inherent factors (e.g., temperature, moisture, soil type, and soil texture) on SOC is crucial to improve its interpretation and better use this soil attribute as a soil health indicator. Generally, temperature and moisture strongly affect SOC mineralization, but the literature is inconsistent. Moore and Dalva [16] state that, as temperature and moisture increase, C mineralization rates increase, but Yang et al. [17] argue that moisture effects on SOC are not significant. Meanwhile, Zhang et al. [18] argue that SOC decomposition is more sensitive to changes in temperature than precipitation, whereas Burke et al. [19] show that, across the U.S. Central Plains Grassland Region, topsoil SOC decreased with temperature but increased with precipitation. Those mixed results suggest that climate variable effects on topsoil SOC are still not clear. Therefore, using a nationwide analysis, our objective was to determine how SOC, within the upper portion of the soil profile, relates to (i) land use and management practices and (ii) inherent soil factors.
2. Materials and Methods
2.1. Database
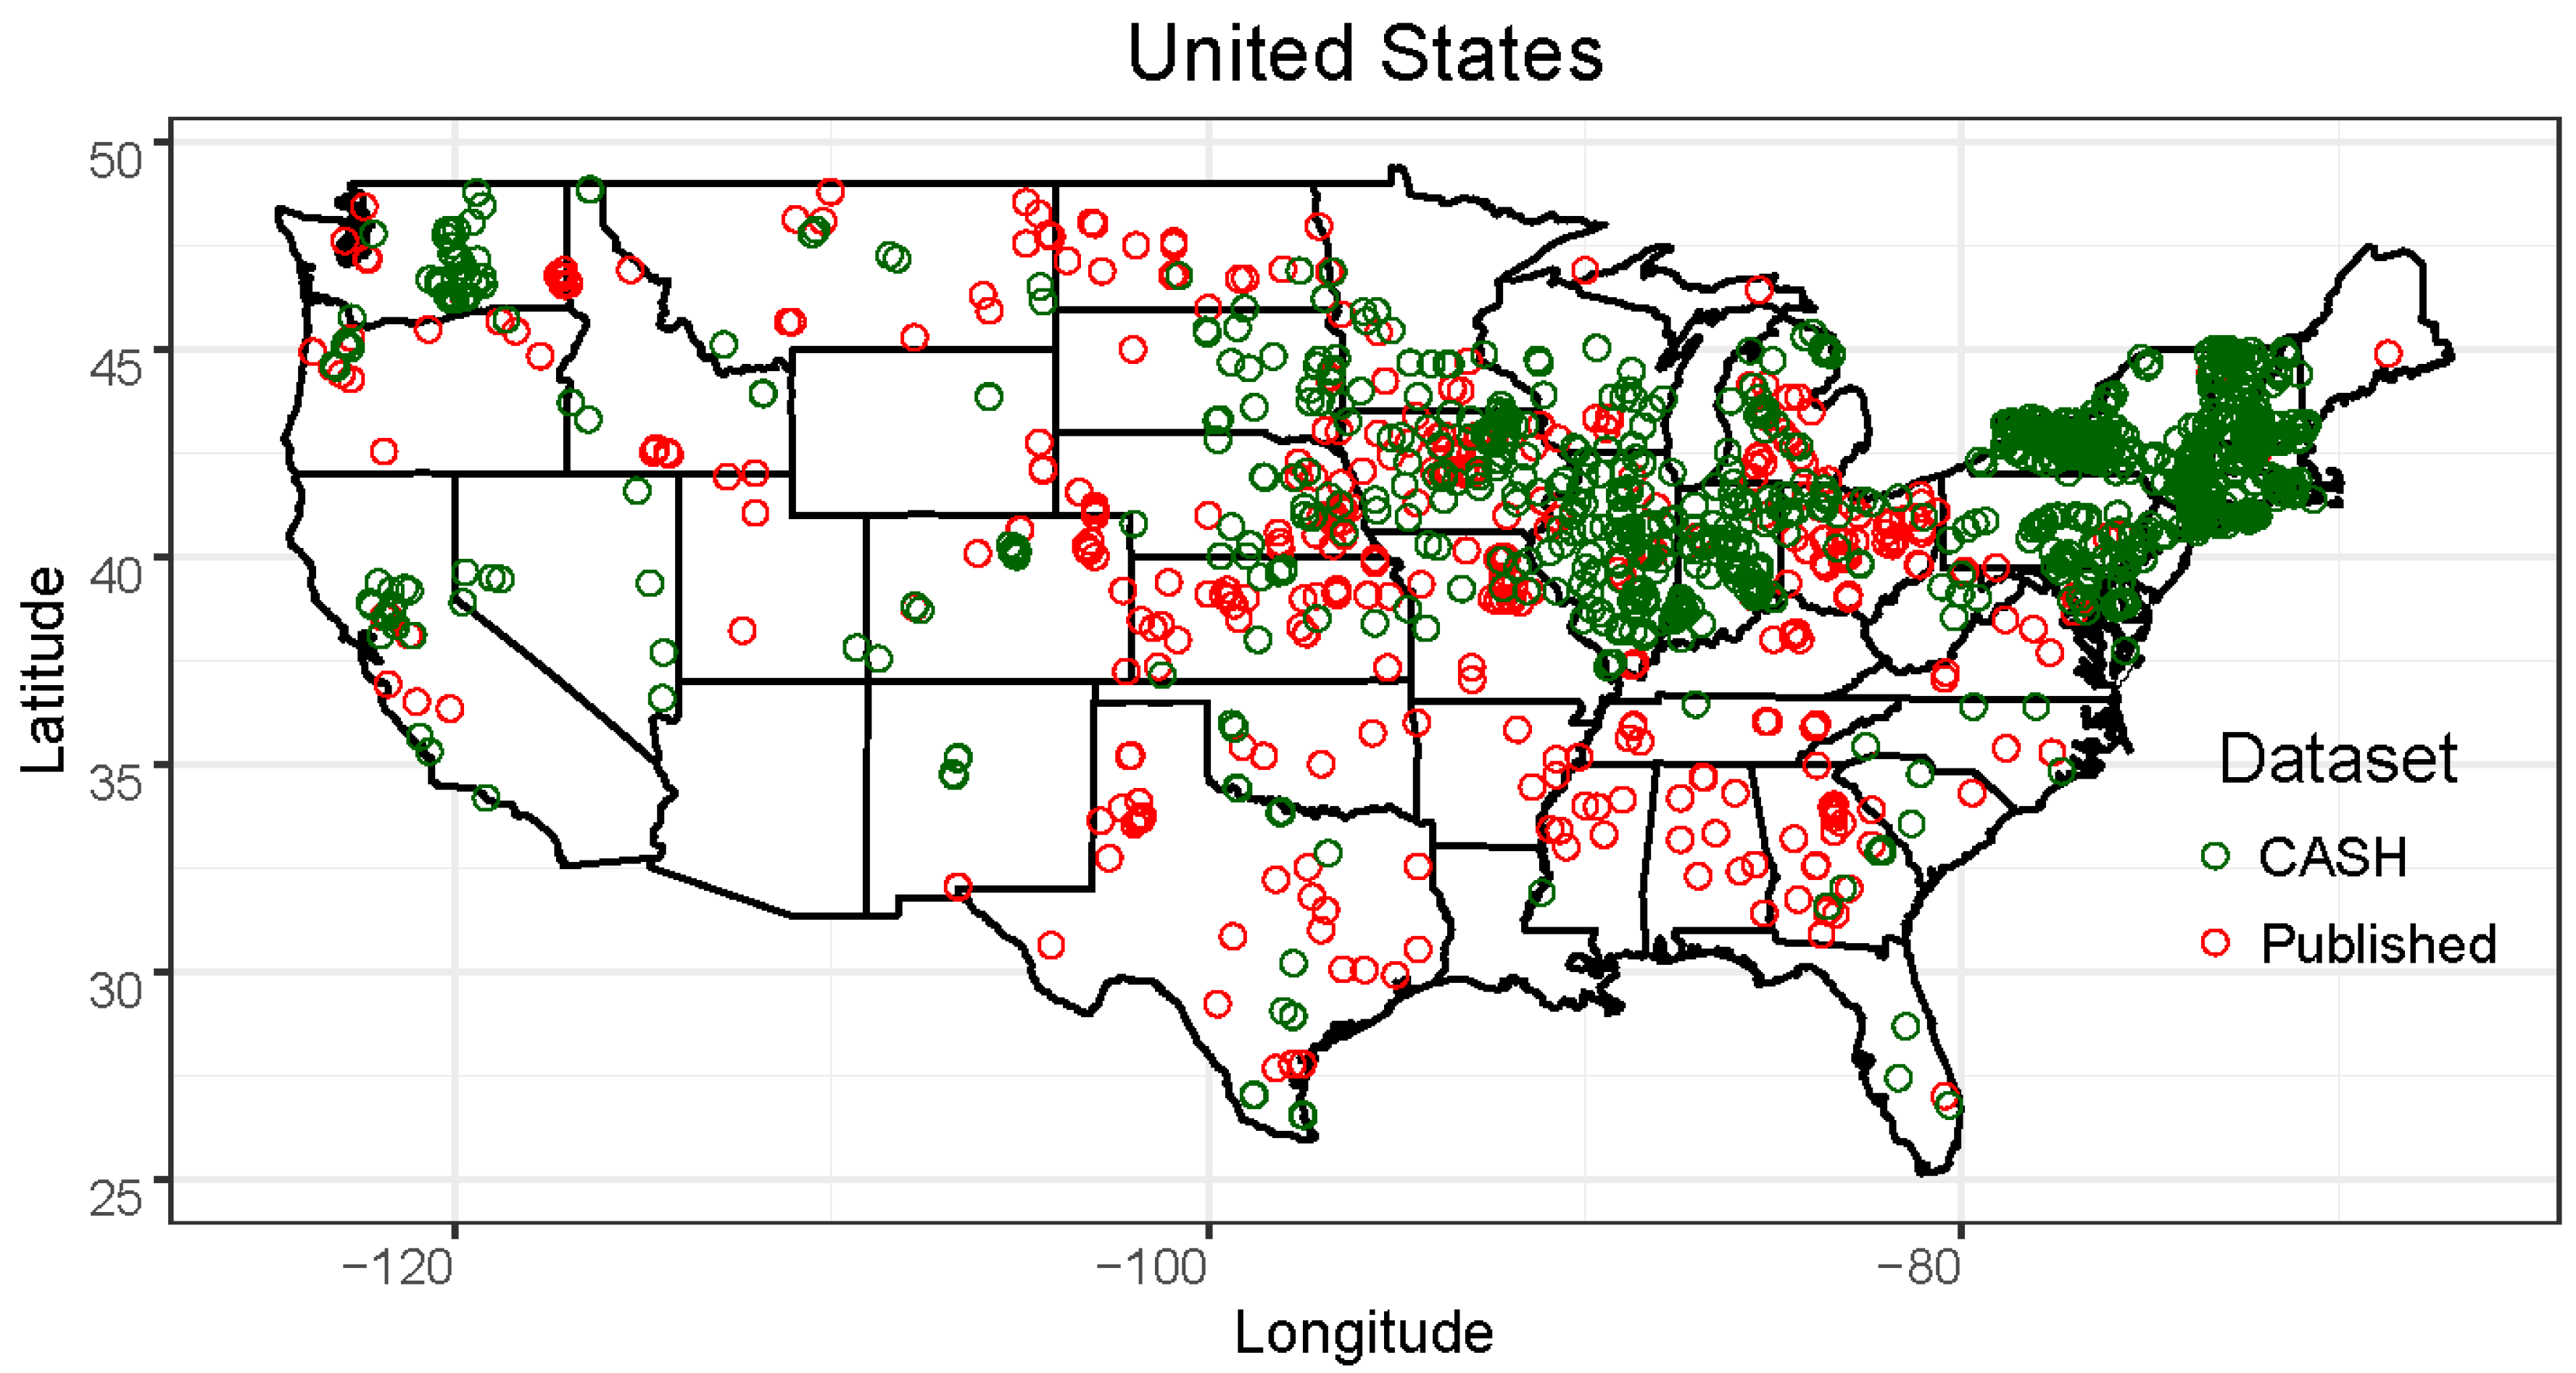
Soil organic carbon observations from two datasets, described below and referred to herein as “Published” (n = 3447) and “CASH” (n = 4163), were used for this study. The combined dataset represented several soil types, climate conditions, and agricultural practices across the contiguous continental U.S., as shown in Figure 1. Based on sampling location, each SOC observation was assigned to one of eight regions: (i) Northeast (NY, CT, MA, ME, NH, RI, VT, MI); (ii) Midwest (IA, IL, IN, MN, MO, WI, MW, OH); (iii) East Central (PA, WV, KY, TN); (iv) Plains States (ND, KS, NE, SD, MT, WY, CO); (v) Northwest (WA, OR, ID); (vi) Southeast (FL, NC, SC, GA, AL, MS, DC, NJ, DE, MD, VA); (vii) South Central (TX, NM, OK, AR, LA); (viii) Southwest (CA, AZ, UT, NV).
2.1.1. Published Dataset
The Institute for Scientific Information Web of Science (Thomas Reuters, New York) was used to search for published studies. The terms, soil health, soil quality with cropping system, soil tillage, residue management, cover crop, crop rotation, and soil fertility, were used as keywords. In addition, in reviewing full texts identified by the Web of Science, references within the articles were also scrutinized.
To be included in the database, publications had to: (1) present soil health indicators from studies comparing multiple treatments, including tillage intensity, crop diversity, addition of organic amendment, or site comparison (including perennial ecosystems); (2) be written in English; (3) be conducted in the U.S.; (4) be replicated studies. We excluded duplications and non-peer reviewed papers. Concentration (gravimetric; e.g., g kg−1) rather than stock (e.g., volumetric or areal measurements, such as Mg ha−1 or kg m−2, over fixed depth or soil mass) data were used unless the study reported soil bulk density (BD) values that could be used to convert stock values into concentration units.
For each observation in the dataset, the following were identified: latitude, longitude, year collected, experiment duration, local precipitation and temperature, soil texture and suborder, sampling depth, analytical methods, and the indicator(s) measured. We used SOC (or converted SOM to SOC by dividing by 1.724) for our analysis, since C is easily identified, measured, and considered to comprise 50 to 60% of SOM [20]. For this study, we used only topsoil (≤15 cm) values. If climate, texture, or soil suborder were missing, latitude and longitude were used to acquire local information from the Soil Survey Geographic Database (SSURGO). The experiment duration was split into four classes between 0 and 2 years (0–2 years); between 3 and 5 years (3–5 years); between 6 and 10 years (6–10 years); longer than 10 years (10+ years).
A total of 456 articles, as shown in Figure 1, were identified and used to develop the database. The complete database was divided into four subsets, based on whether studies addressed tillage intensity (S1), cover crops (S2), residue management (S3), or addition of manure (S4). S1 includes three levels of tillage intensity: CT = conventional tillage (high tillage intensity; e.g., moldboard plow); RT = reduced tillage (intermediate tillage intensity; e.g., chisel plow, primary tillage that leaves 15% to 30% residue coverage on the soil); NT = no-till (minimal soil disturbance). S2 includes annual cropping systems with two cover crops levels: No = without cover crops; Yes = with cover crops. S3 includes three levels of crop residue removal: NR = no removal; MR = moderate removal (35 to 65% of crop residues removed); HR = high removal (>65% of crop residues removed). S4 includes two levels of manure application: No or Yes. The four subsets were analyzed separately.
2.1.2. CASH Dataset
The CASH abbreviation means Comprehensive Assessment of Soil Health. The CASH dataset considered all samples (containing GPS information) submitted for analysis to the Cornell Soil Health Laboratory (CSHL; Ithaca, NY) from 2014 to 2018. It was assumed that the samples were collected from the 0 to 15 cm depth and composited by clients as per sampling guidelines [21]. Three indicators (SOC, active-C (AC), and soil texture) were used for this study.
Following CASH protocols, soil texture was assessed using a rapid quantitative method, as described by Kettler et al. [22]. AC was assessed as permanganate-oxidizable carbon, measured in duplicate by reacting 2.5 g soil with 20 mL 0.02 M potassium permanganate (KMnO4) solution (pH 7.2). Extracts were shaken (120 rpm, 2 min), then allowed to settle for exactly 8 min. An aliquot of the solution was diluted 100-fold before reading absorbance at 550 nm using a handheld spectrophotometer (Hach, Loveland, CO). Sample absorbance was calibrated with KMnO4 standard curves and converted to mg AC per kg soil using the equation of Weil et al. [23]. SOM content was determined by measuring the sample loss on ignition (LOI) in a muffle furnace at 500 °C after 2 h. The %LOI was converted to %OM using: %OM = (%LOI × 0.7) − 0.23. This equation is used in CASH protocols and derived from Storer [24] and is based on correlations with the Walkley–Black method. For our analysis, we converted SOM to SOC [20].
Geolocations were used to obtain site-specific information, including soil classification (e.g., order and suborder) and climate (mean annual precipitation and temperature). Additional details on agricultural practices, such as tillage depth and cropping system, were also included. Three tillage categories were considered: zero (no-till), shallow (depth ≥ 2 and < 17 cm), and deep (depth ≥ 17 cm), as provided by clients. Cropping systems were divided into six categories based on crop codes provided by clients: AnnualGrain = field crops harvested for grain (e.g., corn, soybean, wheat, barley…); DairyCrop = crops present in dairy systems (alfalfa, alfalfa grass, alfalfa trefoil grass, and corn silage); MixVeg = mixed vegetables systems (small systems); LargeVeg = large-scale vegetable production systems (e.g., broccoli, cabbage, cauliflower, tomato, pepper, lettuce, carrots, squash, radish…); Fruit = fruit production systems (e.g., apples, grape, nectarines…); Perennial = most perennial grass pasture and other grass systems.
2.2. Data Analyses
2.2.1. SOC Sensitivity to Management Practices and U.S. Regions
Using the entire database (Published + CASH), a one-way Analysis of Variance (ANOVA) was performed to assess regional effects on topsoil SOC content. The sensitivity of SOC to management practices was assessed separately for each dataset, as follows:
a. Published Dataset
Tillage, cover crop, crop residue management, and manure effects on SOC were evaluated with a linear mixed-effects model. SOC was the dependent variable, management practices (e.g., tillage, cover crop, residue, or manure), experiment duration, and the interaction management vs. experiment duration were treated as fixed effects, and study ID (site identification within the dataset) was a random effect. Study ID was introduced to account for site-specific characteristics, as well as spatial autocorrelation among different studies conducted at the same location. Interactions between management practices and experiment duration were considered when sufficient data were available. Analyses were performed on log-transformed data when appropriate. Management practice effects were first assessed across all eight U.S. regions combined, and when sufficient data were available, separately within each region.
Models were fit to the data by restricted maximum likelihood estimation, using the “lmer” function within the lme4 package. A type III ANOVA for each model was assessed (Satterthwaite’s degree of freedom approximation) using the “anova” function within the lmerTest package [25]. For significant factors (p < 0.05), post-hoc tests compared treatment means using the “emmeans” function, also included in the lmerTest package. Output estimates included means for each factor level and pairwise comparison tests (Tukey’s HSD, α = 0.05). Means were then plotted with 95% confidence intervals using the R package “ggplot2” [26].
b. CASH Dataset
This dataset consisted of 2746 samples with tillage information and 2769 with cropping system information, although they were not necessarily for the same sample. To provide the maximum number of samples for each analysis, two subsets were created using all samples with tillage depth and agroecosystem information, as shown in Table 1.
Tillage and cropping system categories, as previously described, were assessed separately with two linear effects models, where SOC was the dependent variable and tillage or cropping system were fixed effects. These effects were assessed overall and separately for each U.S. region, where data allowed.
2.2.2. SOC Sensitivity to Inherent Factors
Topsoil SOC sensitivity to five inherent factors was assessed with a linear mixed model, using the entire database (Published + CASH). Log-transformed (SOC) was treated as a dependent variable, with temperature, precipitation, aridity index, soil suborder, and soil texture treated as fixed effects. “Local” (location from where an observation was taken) was also treated as a random effect. Approximately 50% of the data came from experimental plots comparing multiple treatments (Published dataset). Furthermore, some SOC observations within the CASH dataset also came from experimental plots comparing multiple treatments. Introducing “Local” as a random effect accounts for those site-specific conditions, as well as spatial autocorrelation among different studies conducted at the same site.
The de Martonne aridity index (AI) was calculated based on local mean annual precipitation (P, mm) and mean annual temperature (T °C) [27]:
This climate classification is a conventional method used in most climatology projects with good worldwide results for identifying dry/humid conditions within different regions (e.g., in [28,29]). Using that index, climate was classified as: arid (AI < 10); semi-arid (10 ≤ AI < 20); Mediterranean (20 ≤ AI < 24); semi-humid (24 ≤ AI < 28); humid (28 ≤ AI < 35); very humid (35 ≤ IDM < 55); extremely humid (AI > 55). Only 18 samples came from arid zones, so following a preliminary analysis indicating no SOC differences between arid and semi-arid climates, the 18 arid samples were merged with semi-arid sites.
Soil taxonomy suborder, rather than order, was used in the mixed model because suborders are more finely differentiated based on additional characteristics. Topsoil SOC distribution by soil order was also separately assessed, using the lm() function in R.
2.2.3. SOC vs. Other Soil Health Indicators
Pearson product–moment correlation coefficients between SOC and biological (AC, microbial biomass-C (MBC), and beta-glucosidase activity (BG)), physical (BD, aggregate stability (AS), and penetration resistance (PR)), and chemical (soil pH, total N (TN), extractable P and K) soil health indicators were obtained across all eight U.S. regions and separately for each, using the entire database (Published + CASH).
3. Results and Discussions
3.1. SOC by U.S. Region
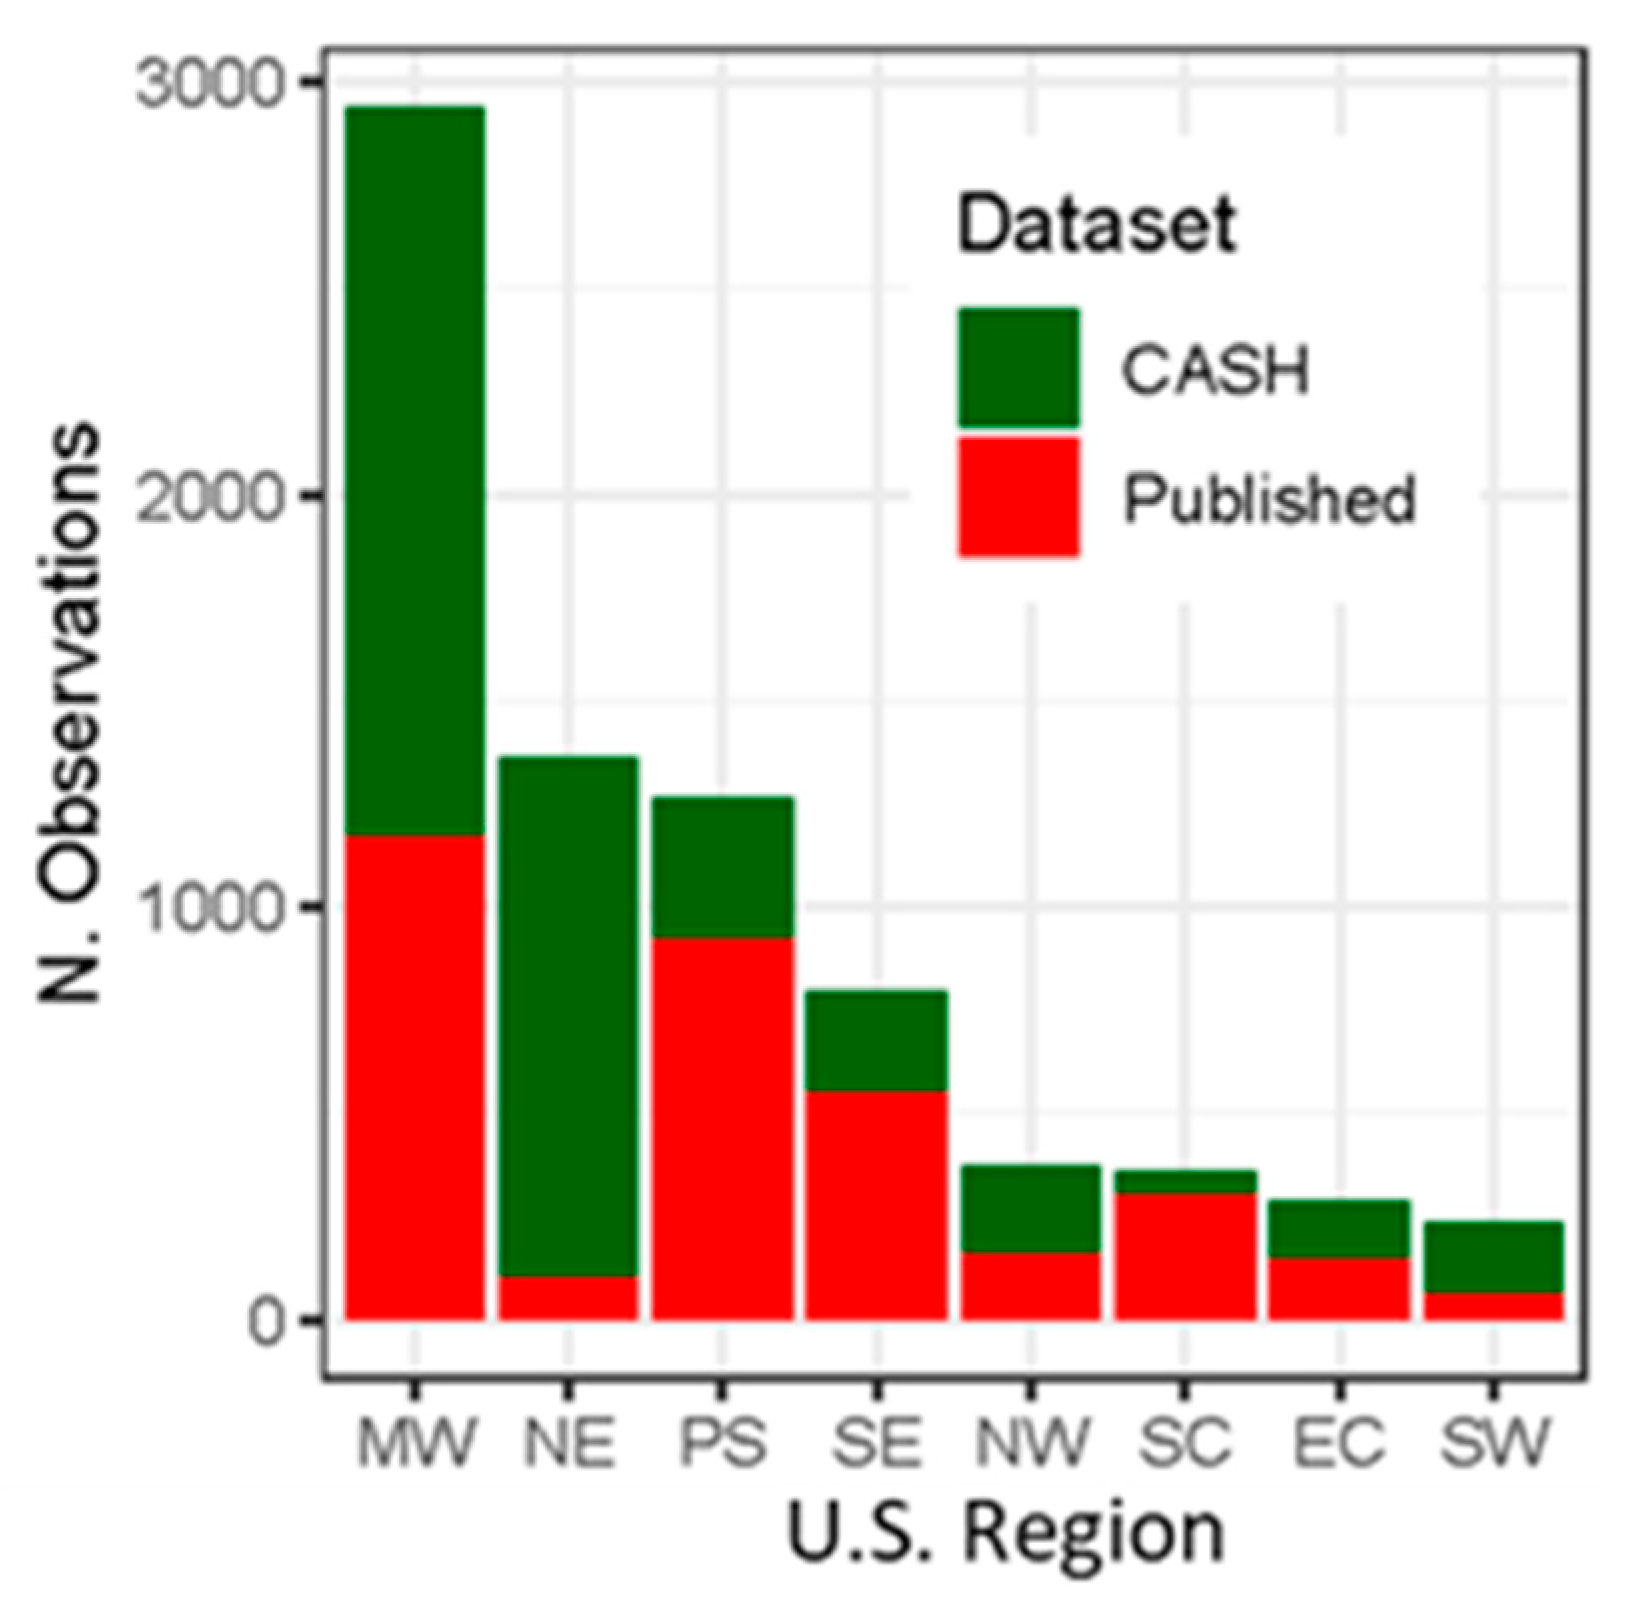
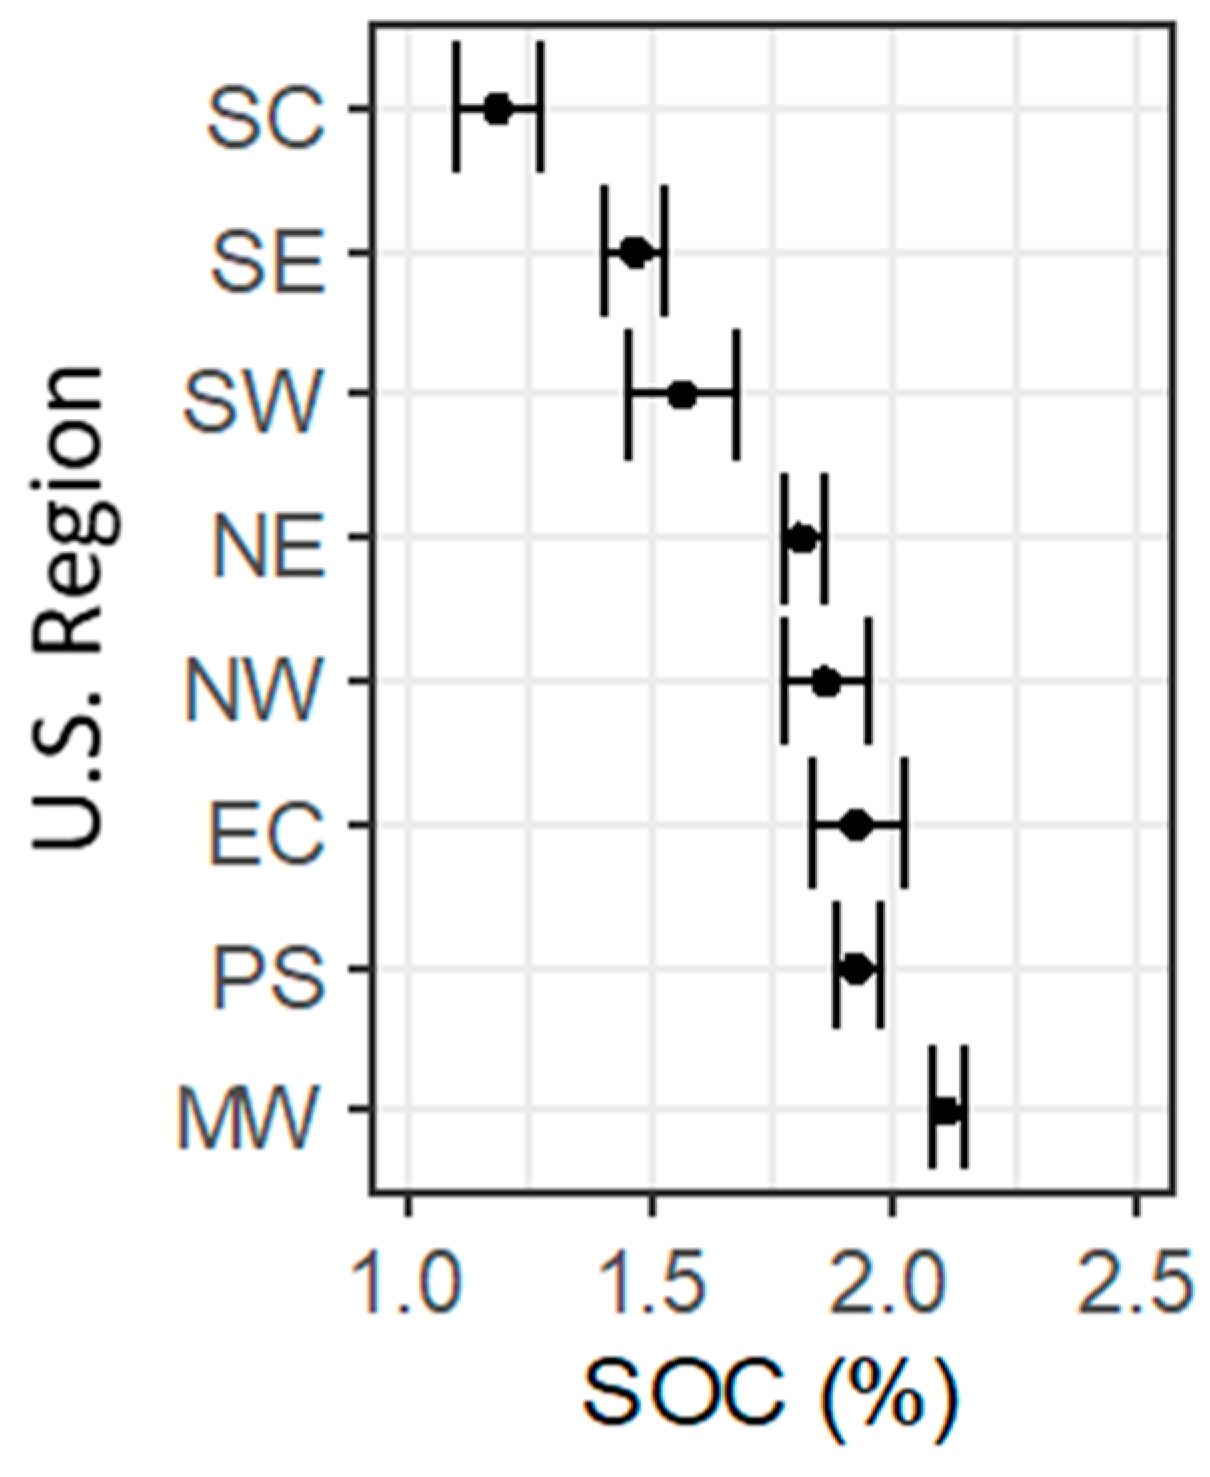
The entire database (Published + CASH) included 7610 topsoil SOC observations distributed across the continental U.S., as shown in Figure 1. The Midwest was the most intensively sampled region (2938 obs.), followed by the Northeast (1361 obs.), Plains States (1262 obs.), Southeast (797 obs.), Northwest (372 obs.), South Central (360 obs.), East Coast (286 obs.), and Southwest (234 obs.), as shown in Figure 2. Topsoil SOC was significantly different among regions, as shown in Figure 3. Midwestern soils had the highest concentrations, followed by Plains States, East Coast, Northwest, and Northeast regions. Soils from Southwest and Southeast regions had lower SOC than within the five previous regions, but higher SOC than in South Central soils. These regional SOC differences partially reflect pedogenic factors, notably native vegetation, moisture and temperature regimes, and natural drainage. Most Midwestern soils were Mollisols, which are expected to have inherently high SOM within the upper portions of the soil profile. The lowest SOC concentrations were found in southern regions (lower latitude), presumably reflecting a warmer climate than in the North and soils with lower potential to accumulate SOC. Furthermore, agricultural management practices varied across the U.S., superimposing an imprint on SOC and creating new soil phenoforms [2]. The effect of inherent and anthropogenic factors on topsoil SOC are presented below.
3.2. Anthropogenic Effect on SOC
3.2.1. Published Studies
a. Tillage Effect
Soils under CT had the lowest SOC concentration among all treatments, as shown in Table 2, overall and within each region, showing that intensive tillage decreased SOC across the U.S. Intensive tillage (e.g., moldboard plowing plus secondary operations) decreases SOC by increasing SOM mineralization due to the mechanical and rain-induced disruption of soil aggregates. Converting from high-intensity tillage to RT (e.g., chisel, disk, and harrow) or NT is an effective strategy for increasing SOC [30,31,32], although benefits are most notable in surface layers and may be partially offset by inverse patterns in deeper soil layers [33]. Focusing on surface layers can cause profile SOC benefits to be overestimated [34]. Overall, soils under RT had 12% higher surface SOC relative to CT, as shown in Table 2. When CT and RT were compared within each U.S. region, greater SOC gains were observed in the Northwest (31% higher), South Central (18% higher), and Northeast (12% higher) than in other regions. Those results reflect maintaining SOM by RT compared to CT, although the benefits are slow to accrue and may be difficult to detect through soil health analyses. Switching from CT to NT improved SOC overall and within each region, as shown in Table 2. The largest SOC improvement associated with converting from NT to CT was observed in the Northwest (42% higher), while the lowest was found in Midwest and Plains States (14% higher). No-till increases in topsoil SOC, especially over time, primarily reflect the maintenance of crop residues on the soil surface and decreased soil disturbance due to plowing and weeding [35].
b. Cover Crop Effect
Another management option for improving SOC content in the surface soil is to increase crop functional diversity in annual cropping systems by including cover crops. Overall, the inclusion of cover crops in annual cropping systems increased SOC by 14%, as shown in Table 2. At a regional scale, including cover crops, significantly increased SOC by 19% in Midwestern soils, 24% in Northwestern soils, and 39% in South Central soils. Within the remaining regions, mean SOC in annual cropping systems with cover crops was higher than in those without cover crops, although the differences were not statistically significant (α = 0.05). Overall, these results confirm that, within annual cropping systems, cover crops can increase SOC on U.S. farmlands, thus providing increased spatial and temporal plant diversity and protection from wind and water erosion. Furthermore, increased above- and below-ground biomass from cover crops also increases carbon inputs and residue diversity—factors that help increase SOC content [36,37].
c. Residue Removal Effect
Compared to retaining 100% crop residues within an agroecosystem, removing moderate rates (35 to 65%) did not measurably affect topsoil SOC levels, as shown in Table 2. However, removing 65% or more significantly decreased SOC content across all sites and especially within Midwest and Southeastern regions, as shown in Table 2. Within Plains States, Northwest, South Central, and Northeast regions, the effects of crop residue management on topsoil SOC concentrations were not significant (α = 0.05), as shown in Table 2. Those results confirm that removing high amounts of crop residue has the potential to decrease SOC concentration in some U.S. regions, which then compromises soil functioning and the sustainability of natural resources [38]. The results also suggest that harvesting low or moderate rates (e.g., <65%) of crop residue may not negatively affect topsoil SOC.
Other studies have shown that excessive crop residue harvest, as feedstock for biofuel, bio-product production, or animal feed, can negatively affect not only SOC concentration but also overall soil health [9,39]. A global meta-analysis by Xu et al. [40] showed that high rates of stover removal (>75%) reduced SOC stocks by 8.7% in the topsoil (0 to 30 cm), compared to no-removal, irrespective of soil properties or tillage practices. However, the negative effect of moderate crop residue removal (<50%) on SOC stocks was minimal (1.4%). Another meta-analysis by Qin et al. [41] reported that stover removal did not reduce SOC stocks when the removal rates were less than 70%. Qin et al. [42] even projected that SOC stock could increase with 30% stover removal, provided cover crop and manure management practices were adopted. Collectively, the results of previous meta-analyses and our study confirm that a low level of stover removal, as is currently recommended, can minimize adverse impacts on SOC. These results also support conclusions from Moebius-Clune et al. [43] that major SOC benefits associated with roots remain, regardless of aboveground biomass management, provided tillage intensity is minimized.
d. Manure Effect
Overall, manured soils had 18% higher SOC concentration than non-manured soils, as shown in Table 2. At a regional scale, topsoil SOC content under manured soils was increased by 39% in the Midwest, 22% in Plains States, 38% in the Northwest, 26% in South Central, 41% in East Central, and 31% in Northeast regions, compared to non-manured soils, as shown in Table 2. This is consistent with several previous studies, reinforcing that applying manure can increase SOM over time, thus improving soil health [44,45].
A global meta-analysis by Xia et al. [45] showed that SOC increases due to manure additions were primarily due to greater soil microbial biomass C. Manure provides a labile energy source for soil microbes, that significantly increases microbial activity and increases the soil storage of both N and C cycled by the organisms. Increasing SOC concentrations, by applying manure to soils, can also provide several other benefits, including C sequestration, which is crucial for offsetting anthropogenic greenhouse gas emissions [46]. According to Xia et al. [45], the SOC sequestration rate was significantly increased by substituting manure for fertilizer, irrespective of land type, manure type, or substitution rate, primarily because of exogenous C source inputs. The addition of manure has also been shown to improve N pools, soil aggregation, water-holding capacity, erosion resistance, and crop productivity [45,47,48,49].
e. Management Practices vs. Experiment Duration
The effect of agricultural management practices (i.e., tillage intensity, cropping system, residue management, and the addition of organic amendments) on several soil health indicators, including SOC, is time-dependent [30,34,41]. Considering the size of the data within the Published database used for this assessment, the effect of management vs. experiment duration on topsoil SOC was tested over all of the U.S. and within some specific regions and for some specific factors, as presented in Table 2: tillage = seven regions; cover crop = seven regions; residue = two regions; manure addition = two regions. A significant interaction between tillage intensity and experiment duration was found in the Plains States (p ≤ 0.046) and Northwest (p ≤ 0.056) regions, where RT increased topsoil SOC concentration after three years. Experiment duration also influenced the positive effect of cover crop on SOC within the Midwest (p ≤ 0.058), Northwest (p ≤ 0.069), and South Central (p ≤ 0.069) regions. Furthermore, overall, there was a significant interaction between the addition of manure and experiment length, including a significant increase in topsoil SOC after applying manure for long-term experiments. Several meta-analyses have shown that time can moderate the effect of agricultural practices on topsoil SOC. For example, Nunes et al. [34] showed that long-term (≥3 years) NT management is necessary to increase topsoil SOC concentration, relative to conventional tillage (i.e., moldboard plow). However, these authors argued that the positive impact of reducing tillage intensity on SOC can occur over a period of years rather than decades. Quin et al. [41] also discussed that, to accurately assess SOC stock change, the time duration of land transition must be considered. They suggested that the most dramatic changes in SOC stocks occur during the 5–10 years following land transitions.
3.2.2. CASH Dataset
a. Tillage Depth Effect
Overall, 2746 samples submitted for CASH analyses contained information regarding tillage depth. Soils under NT (depth equal 0 cm) were generally sampled (n = 1404) most intensively, while those being deep tilled (n = 636) were sampled the least, as shown in Table 2. Over all regions, SOC concentration was significantly higher under NT than with either shallow or deep tillage, as shown in Table 3. Shallow tillage did increase SOC concentration by 7%, compared to deep tillage, but was 9% lower than NT soils. The Northeast was the most intensively sampled region, with NT soils having higher SOC concentrations than those under either shallow or deep tillage, as shown in Table 3. Converting from deep tillage to NT increased SOC concentrations in Southeast, Northwest, Northeast, and Southwest topsoils, as shown in Table 3. Within the Plains States, there was no significant difference between shallow and deep tillage. NT was not included in that analysis because the number of NT observations was several times higher than for the other treatments, as shown in Table 1. Within the South Central region, the difference between shallow tillage and NT was not significant, but since deep tillage had only two observations, it was not included in the analysis. Overall, these results show that NT and shallow tillage can increase topsoil SOC concentration, supporting the “Published” dataset results, as shown in Table 2, already discussed herein and in several previous studies (i.e., in [12,31,32]).
b. Cropping System Effect
There were 1475 SOC measurements from annual cropping systems: 330 from perennial systems; 295 from large scale vegetable production systems; 241 from small scale mixed vegetable systems; 222 from fruit production systems; 206 from dairy systems, as shown in Table 1. Across all regions, soils under mixed cropping systems had the highest average topsoil SOC concentrations, as shown in Table 3. Higher SOC under mixed vegetable systems, many of them small organic farms, reflects high crop diversity and the addition of organic amendments. In those systems, compost and manure are usually applied as the primary plant nutrient source, which increases microbial populations and SOC, as shown in Table 2. Soils under perennial systems had the second highest SOC concentrations among all cropping systems, as shown in Table 3, confirming its potential for improving topsoil SOC relative to annual cropping systems. Enhanced SOC under perennial systems can be explained by several factors, including the absence of tillage, greater species diversity, a longer growing season, continuous root growth, and deeper, more fibrous root architecture [50]. Those results are consistent with previous studies (e.g., in [11,31,51]) and suggest that switching from annual cropping to perennial systems (e.g., working grasslands for pasture, hay, or biofuel feedstock) is a good option for increasing SOC [34].
Soils from dairy-based cropping systems had lower SOC than those from mixed vegetables and perennial systems, but higher SOC than those within soils from large scale vegetable, fruit, or annual grain cropping systems, as shown in Table 3. The benefits of rotating perennial crops (alfalfa, alfalfa grass, etc.) with annual crops (corn silage) and applying dairy manure are reflected in those results. In contrast, annual grain cropping and large-scale single vegetable production systems tended to be the least diversified and had lower carbon inputs. Conventional vegetable cropping systems often include practices, such as intensive soil disturbance, to incorporate large amounts of chemical fertilizers and herbicides, cultivation to control weeds, and the formation of hills (i.e., ridging and untimely harvest), under unfavorable conditions that negatively affect SOC.
Where there were enough data to compare cropping systems, similar results were found at the regional scale, as shown in Table 3. In general, SOC concentrations were highest with mixed vegetable, perennial, or dairy cropping systems, and lowest with annual grain or large-scale single vegetable production systems. An exception to this was in the Plains States region, where soils under annual grain production had higher SOC than perennial systems, presumably due to confounding factors (e.g., marginal soils that were likely overgrazed under fertilized perennial crops).
These results highlighted that adopting conservation agricultural practices, such as reducing tillage intensity, improving cropping system diversification, and adding organic amendment, is paramount to maintain and/or improve soil health, particularly within some specific inherent conditions (i.e., sandy soils). A recent study showed that the farming of sandy soils can favor SOC build up as crop roots and residues can accumulate within the surface soil horizon [52]. Diversified cropping systems, reduced tillage, and the addition of organic amendments can improve biomass productions and build A-horizon [53]. The positive effect of agricultural practices on topsoil thickness has also been reported around the world. Adhikari and Hartemink [52] showed that, on average, surface soils from the Central Sands (Wisconsin, USA) hold up to 59 t SOC/ha, which is higher than reported for sandy soils under native forest vegetation. That study showed that, with the increased A-horizon thickness and better soil management practices, SOC stocks were higher.
3.3. Inherent Effects on SOC
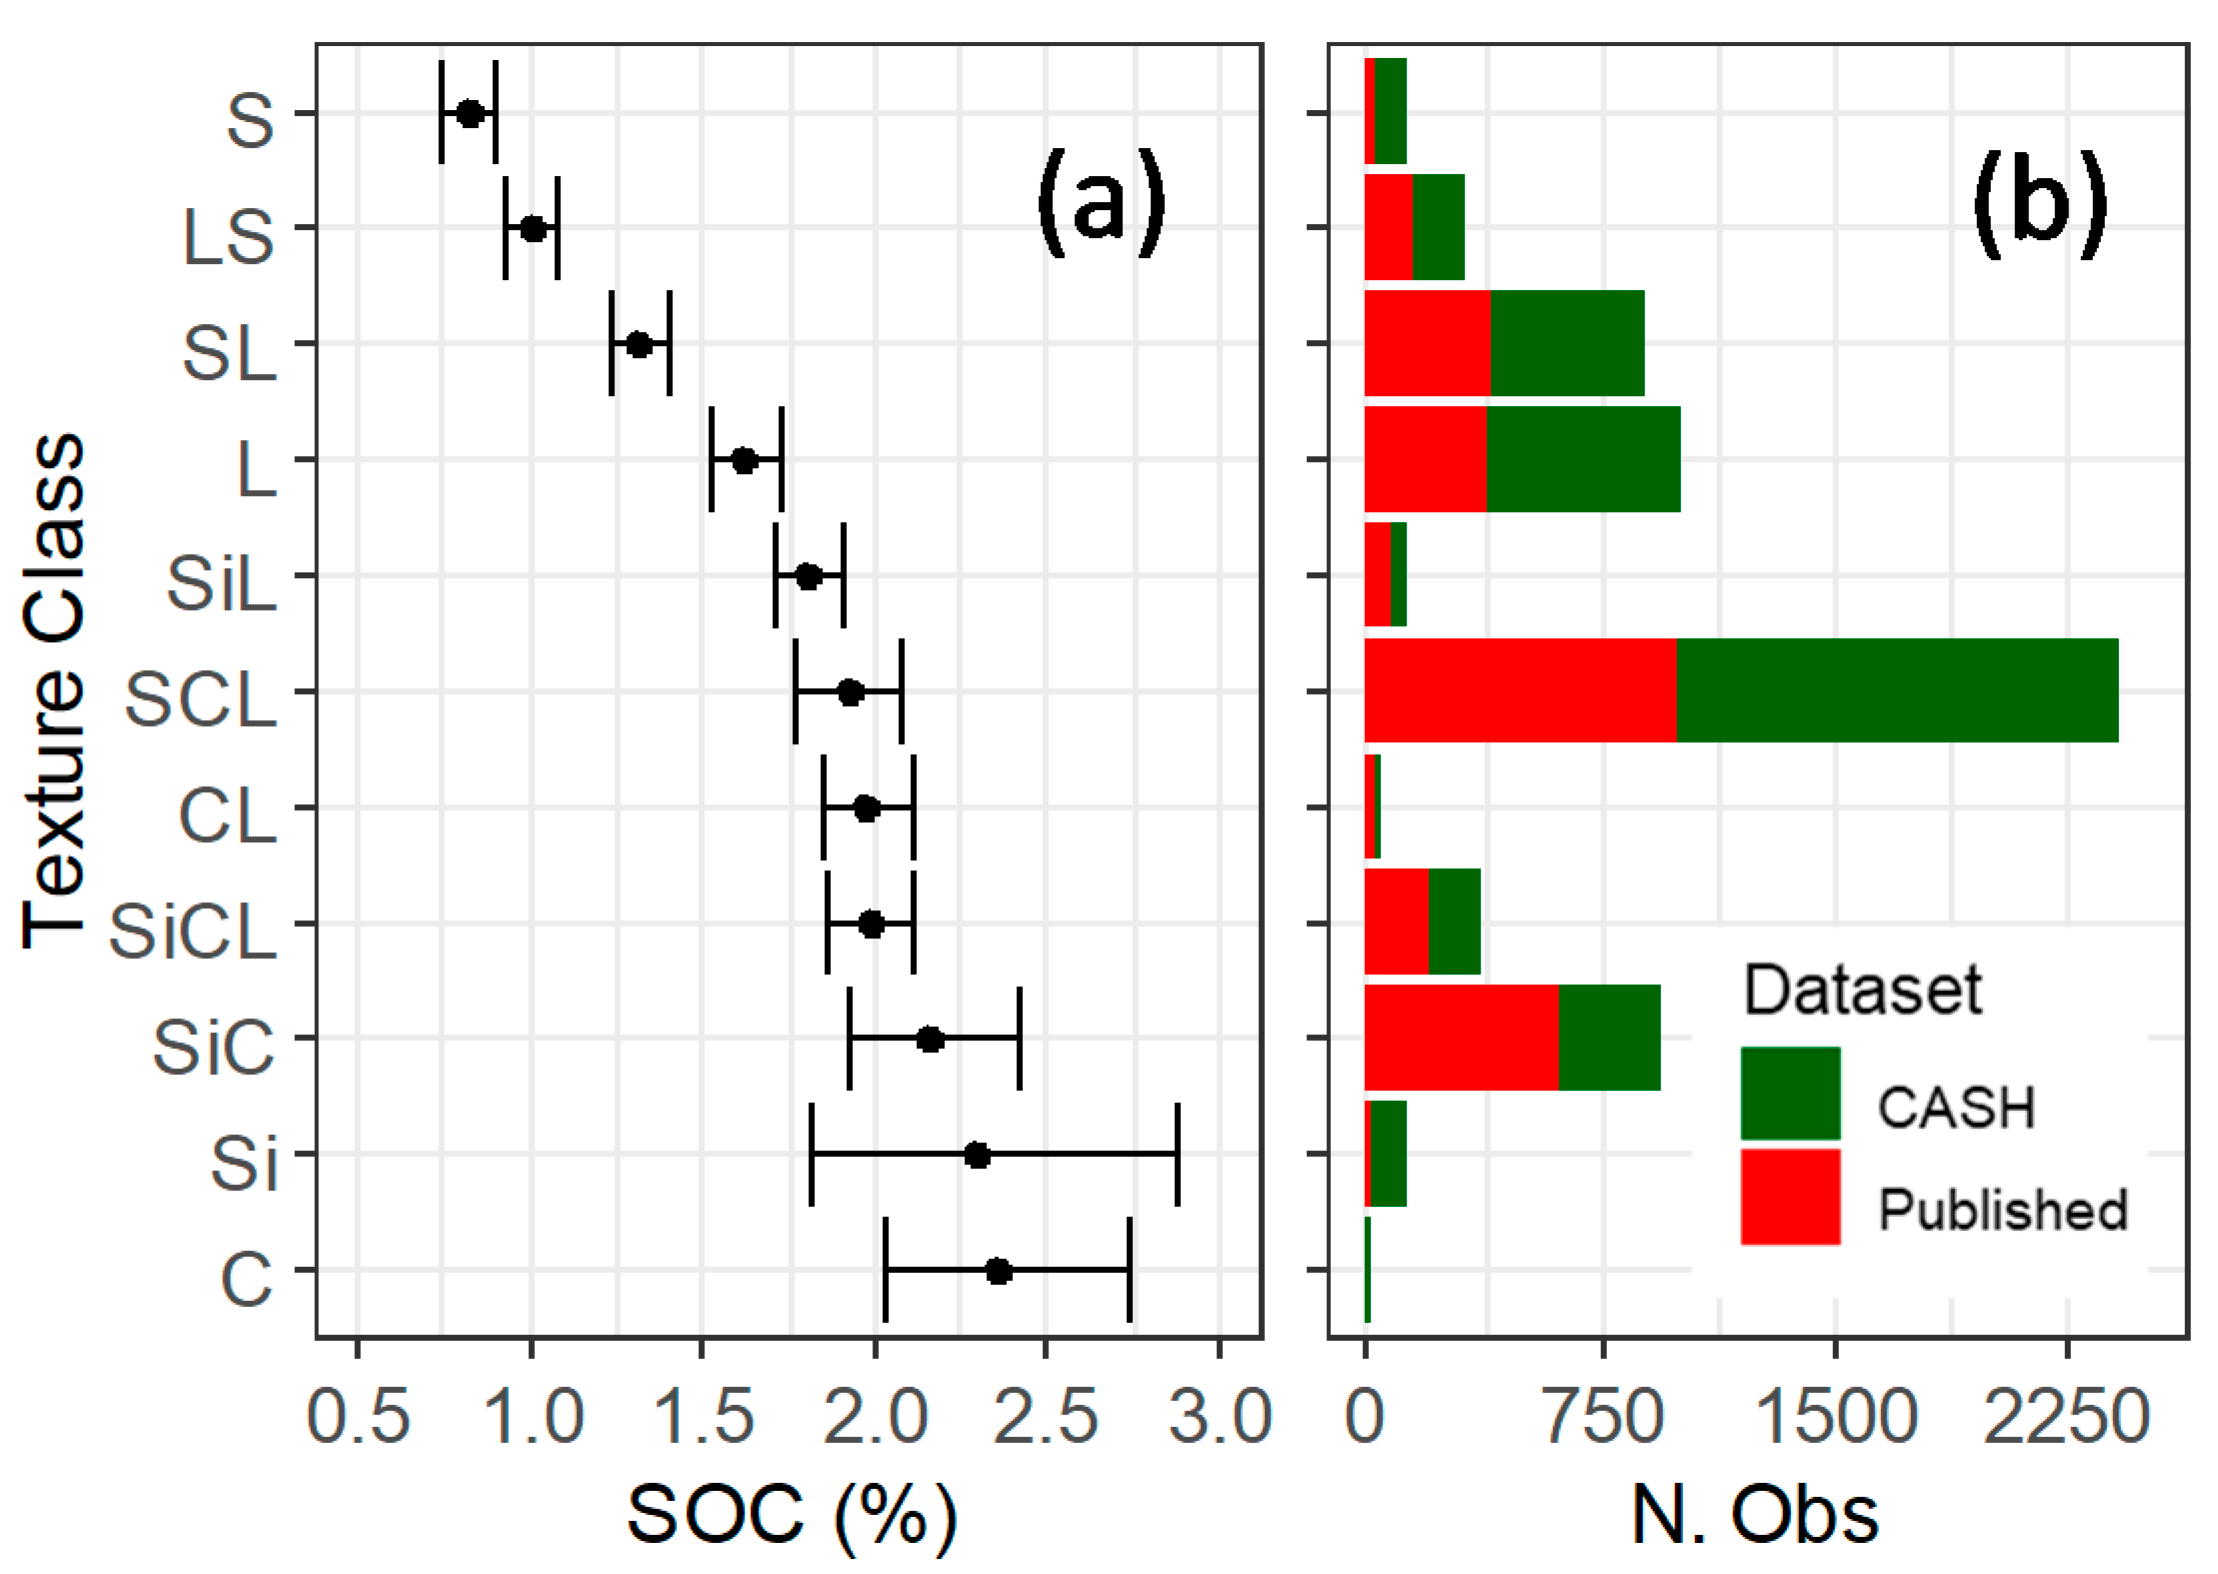
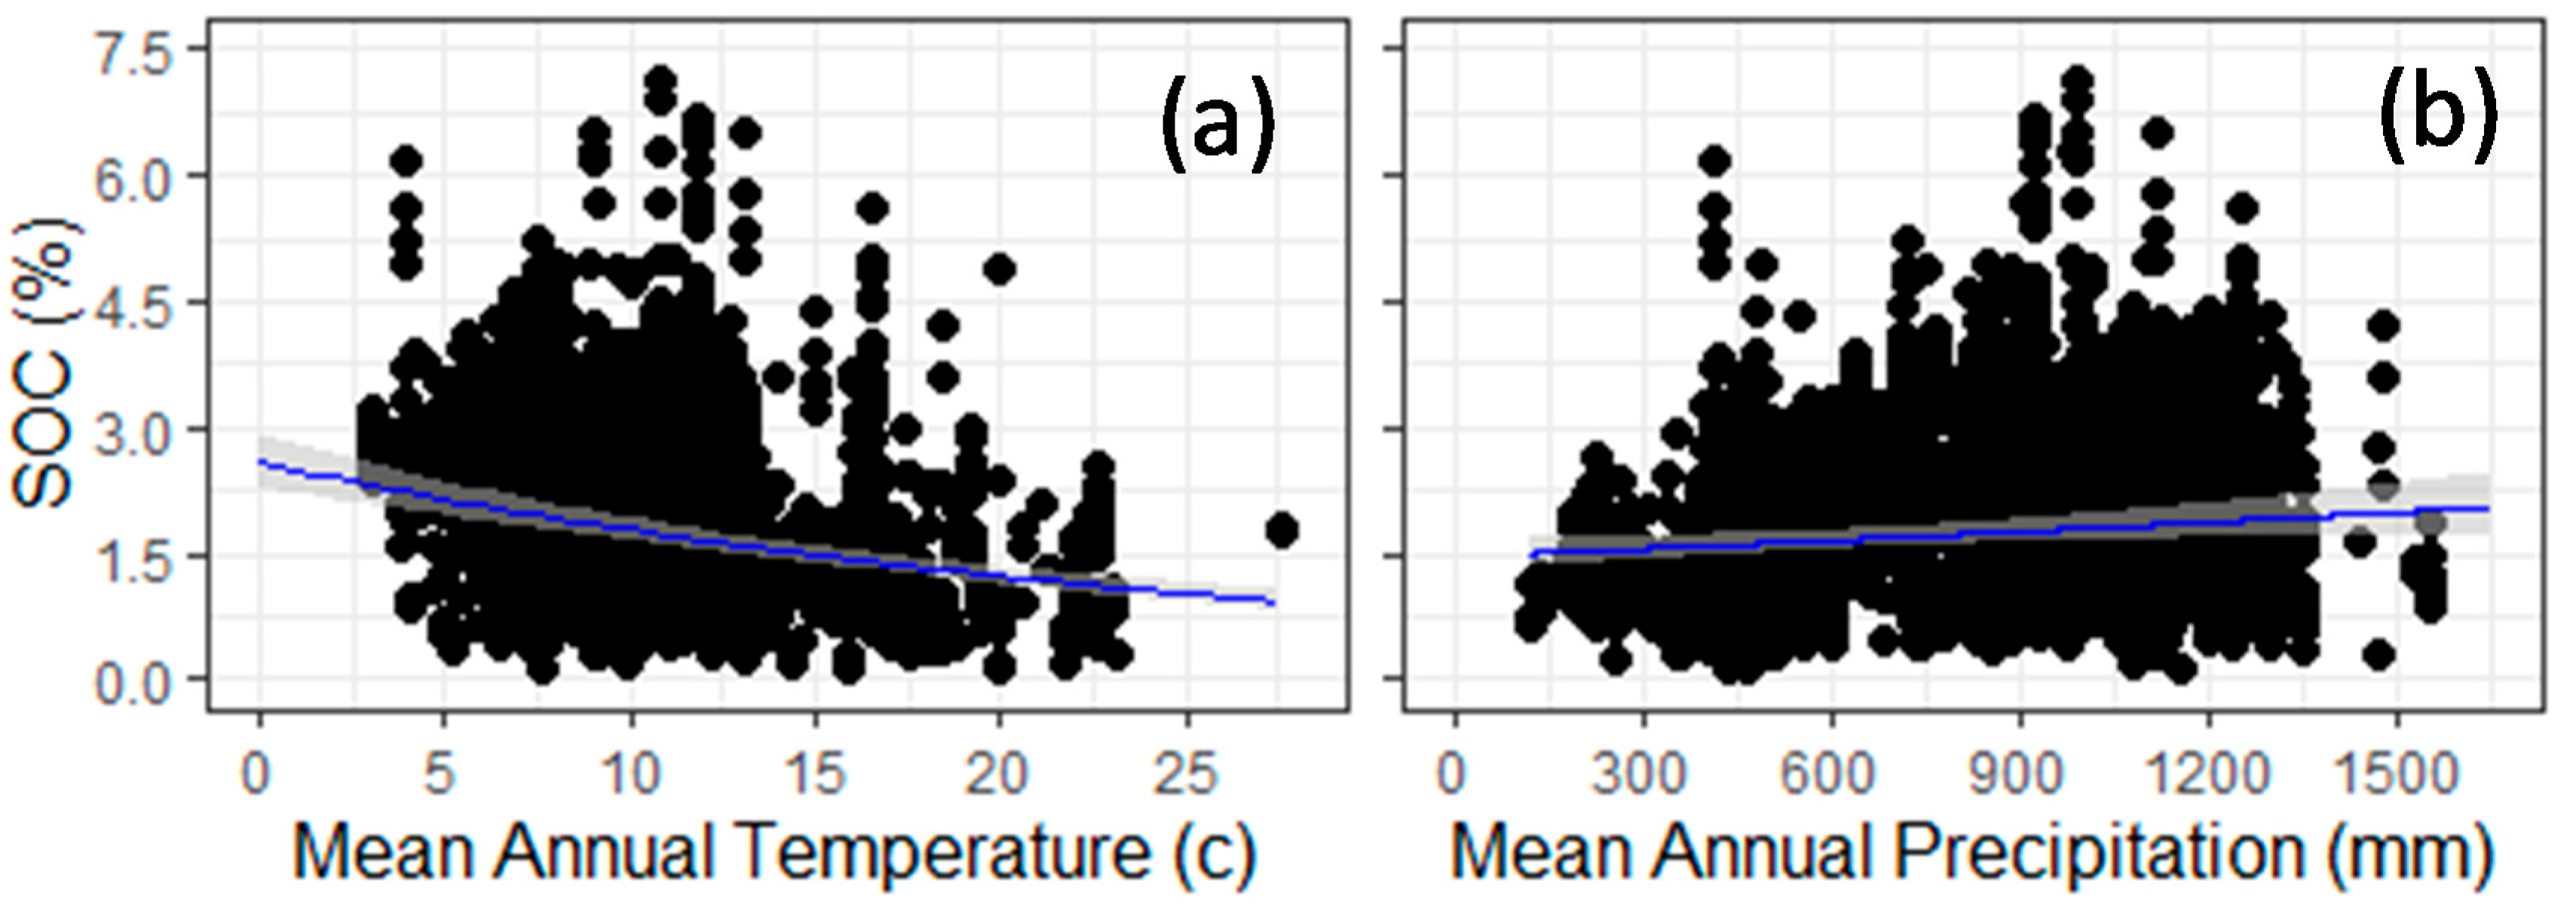
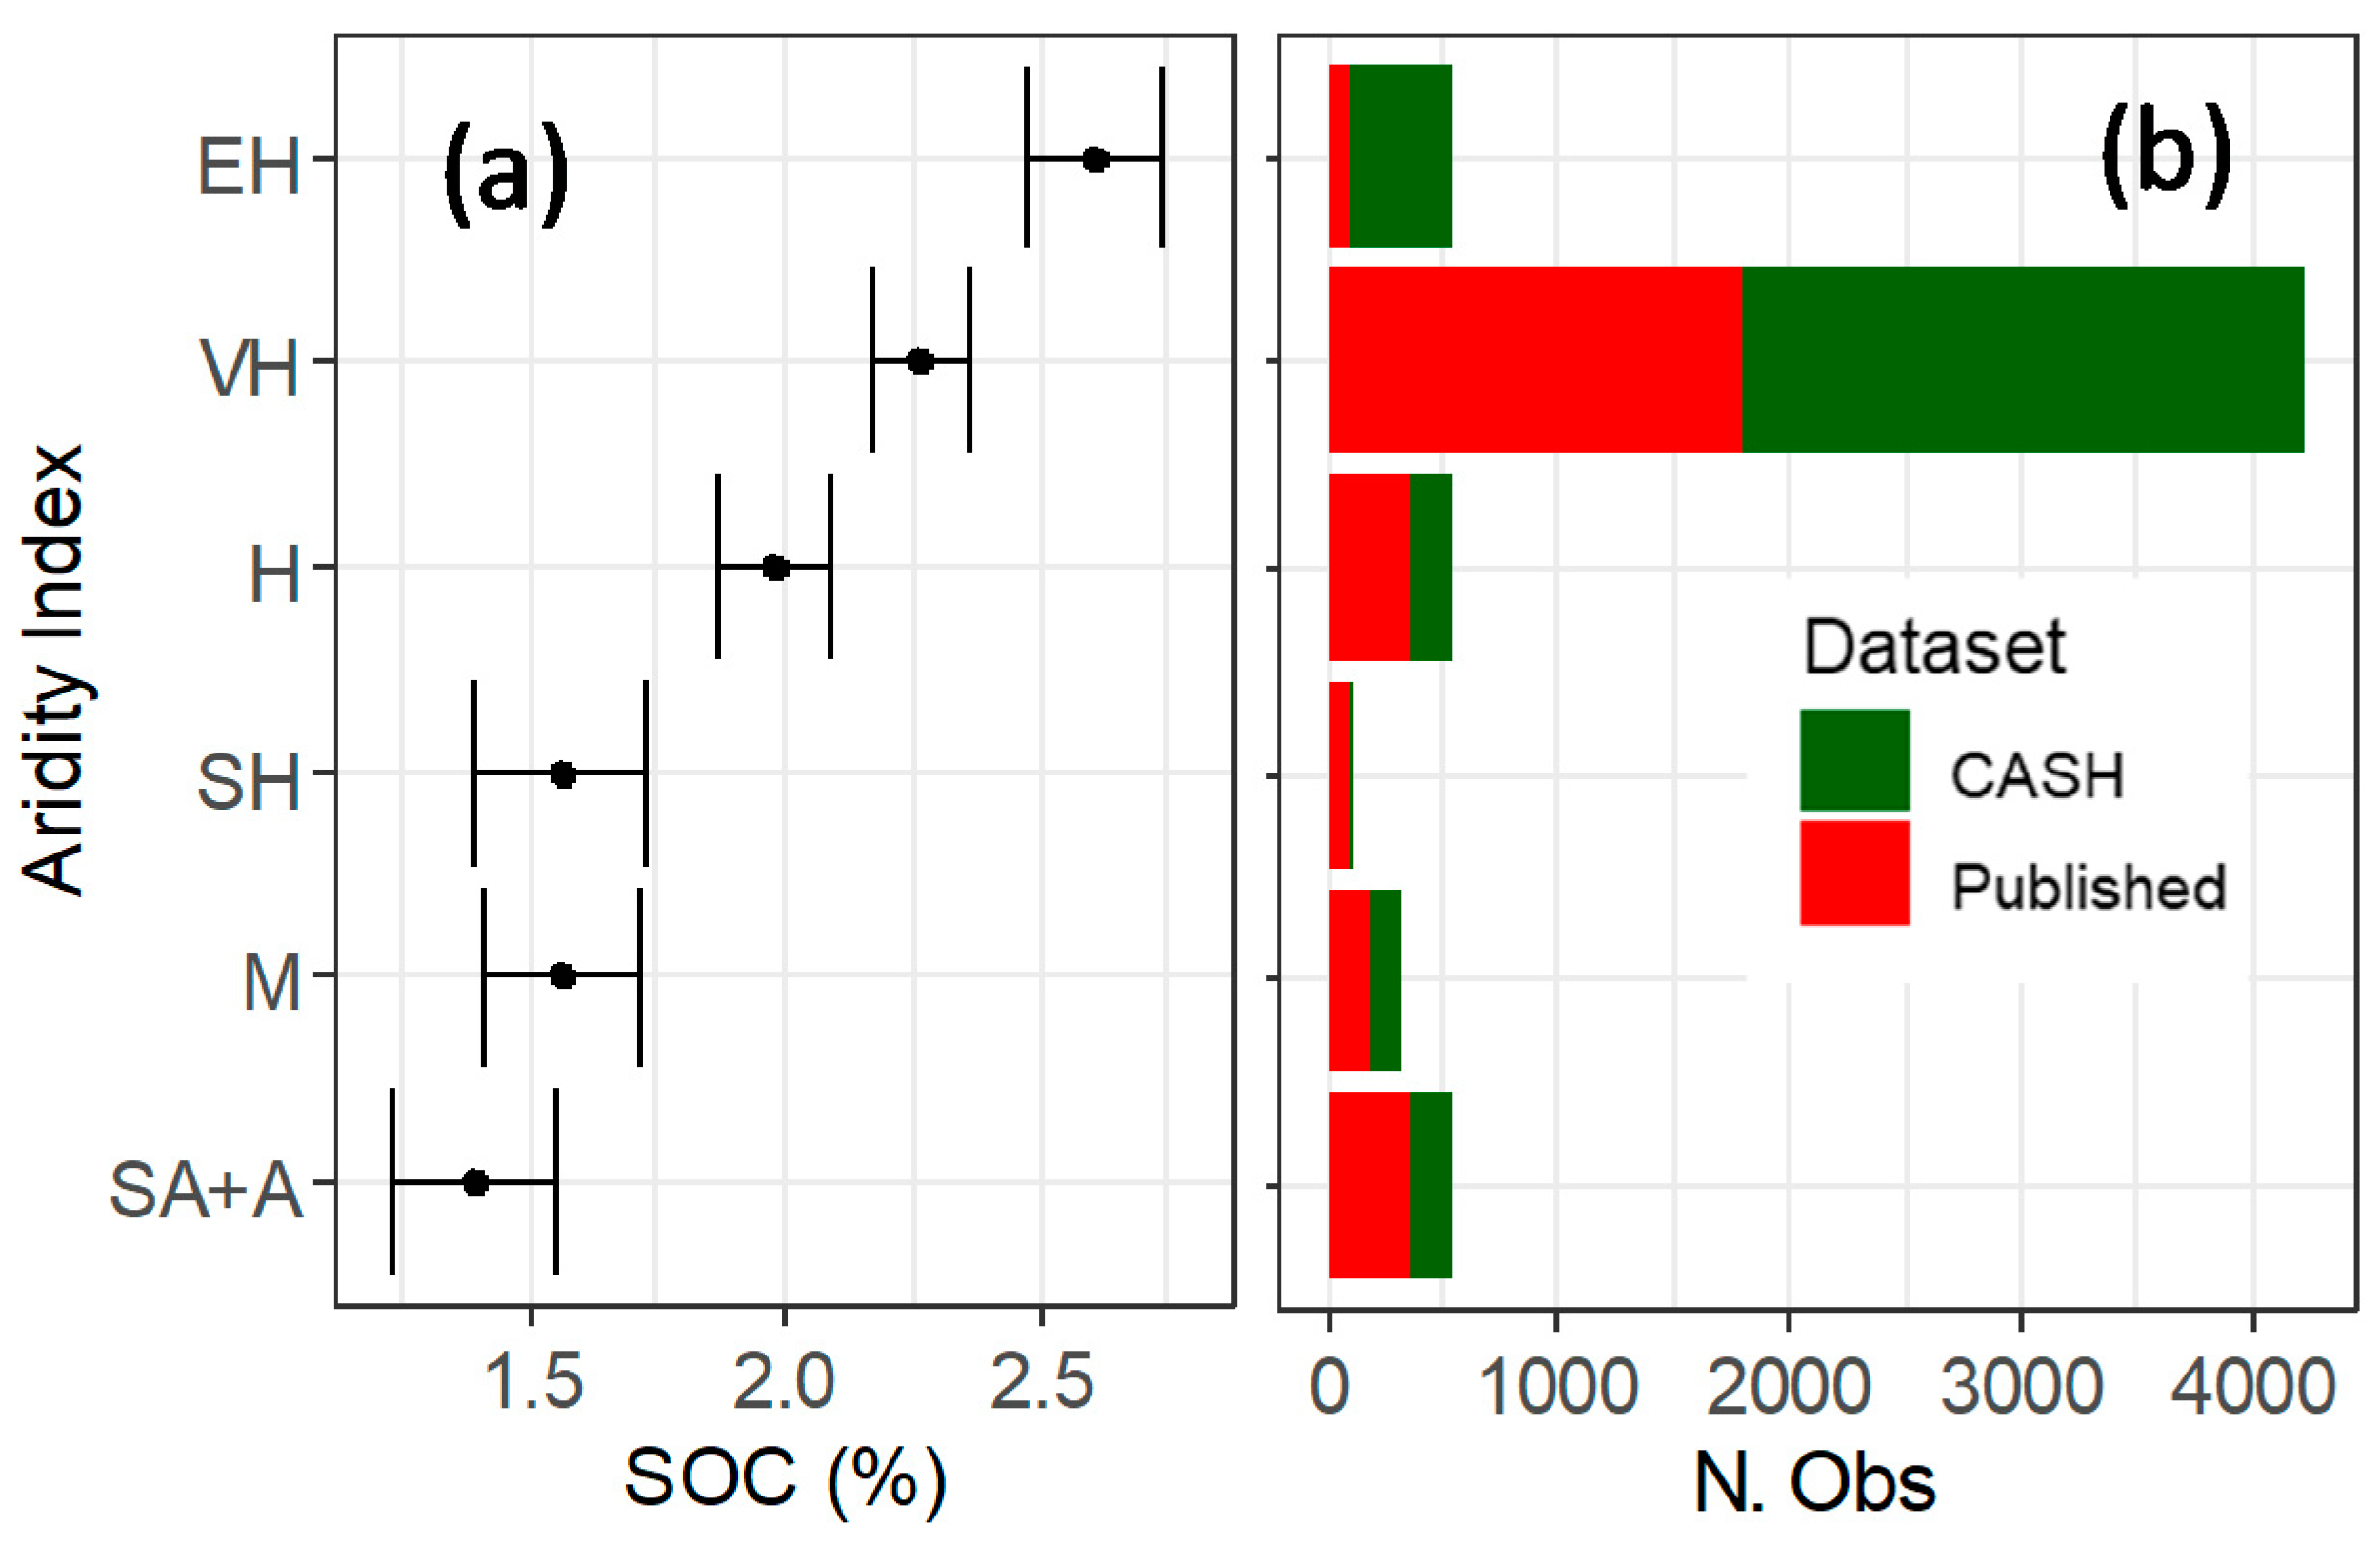
Topsoil SOC concentrations across the U.S. were significantly affected by climate (aridity index, precipitation, and temperature), soil texture, and soil taxonomy suborder. SOC was highest in fine-textured soils, as shown in Figure 4, which can be explained by the strong association between C pools and clay particles that stabilize and protect SOM [54]. SOC concentrations decreased with mean annual temperature but increased with mean annual precipitation, as shown in Figure 5, and aridity indices, as shown in Figure 6. As a soil-forming factor [55], climate has long been known to be a key determinant of SOM content. SOC concentration and climate relationships result from complex interactions among plant traits, soil microbes, mineralogy, and chemical processes [54,56,57]. The results of this study are consistent with those of Burke et al. [19] who reported that, across the U.S. Great Plains, SOC increased with mean annual precipitation and decreased with mean annual temperature. Furthermore, the positive effects of precipitation and the negative effects of temperature on SOC have been observed globally [58].
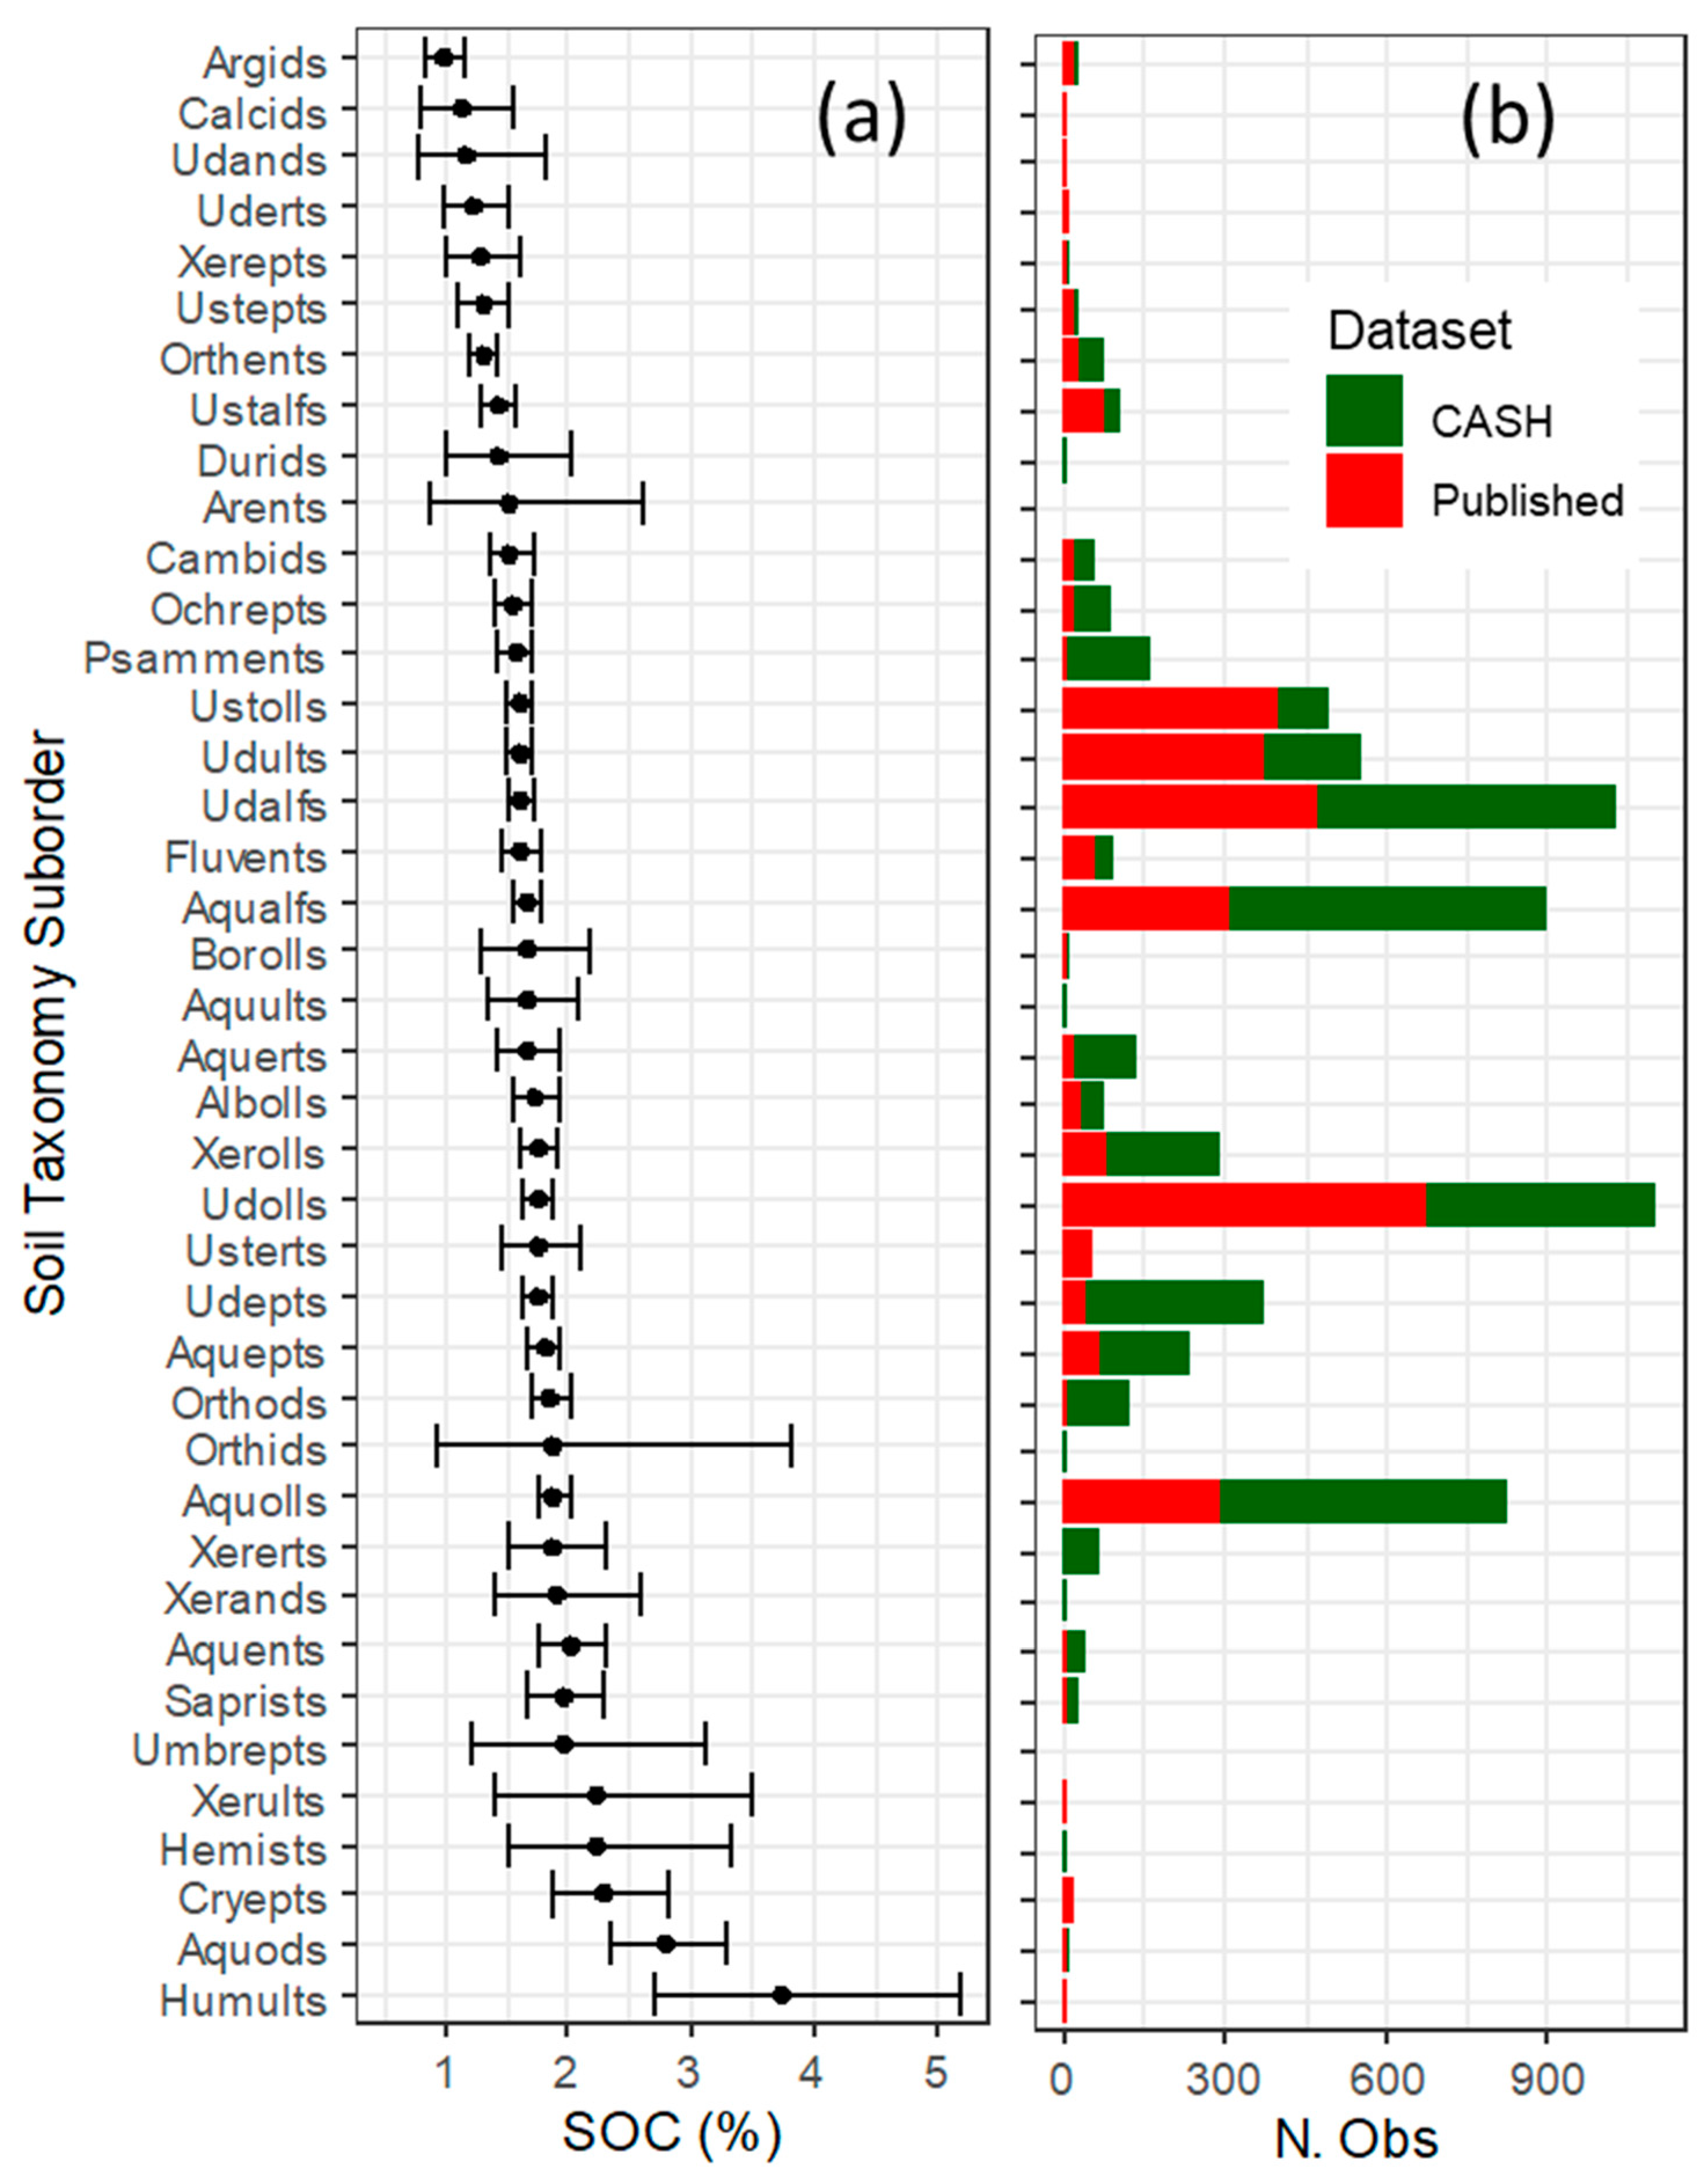
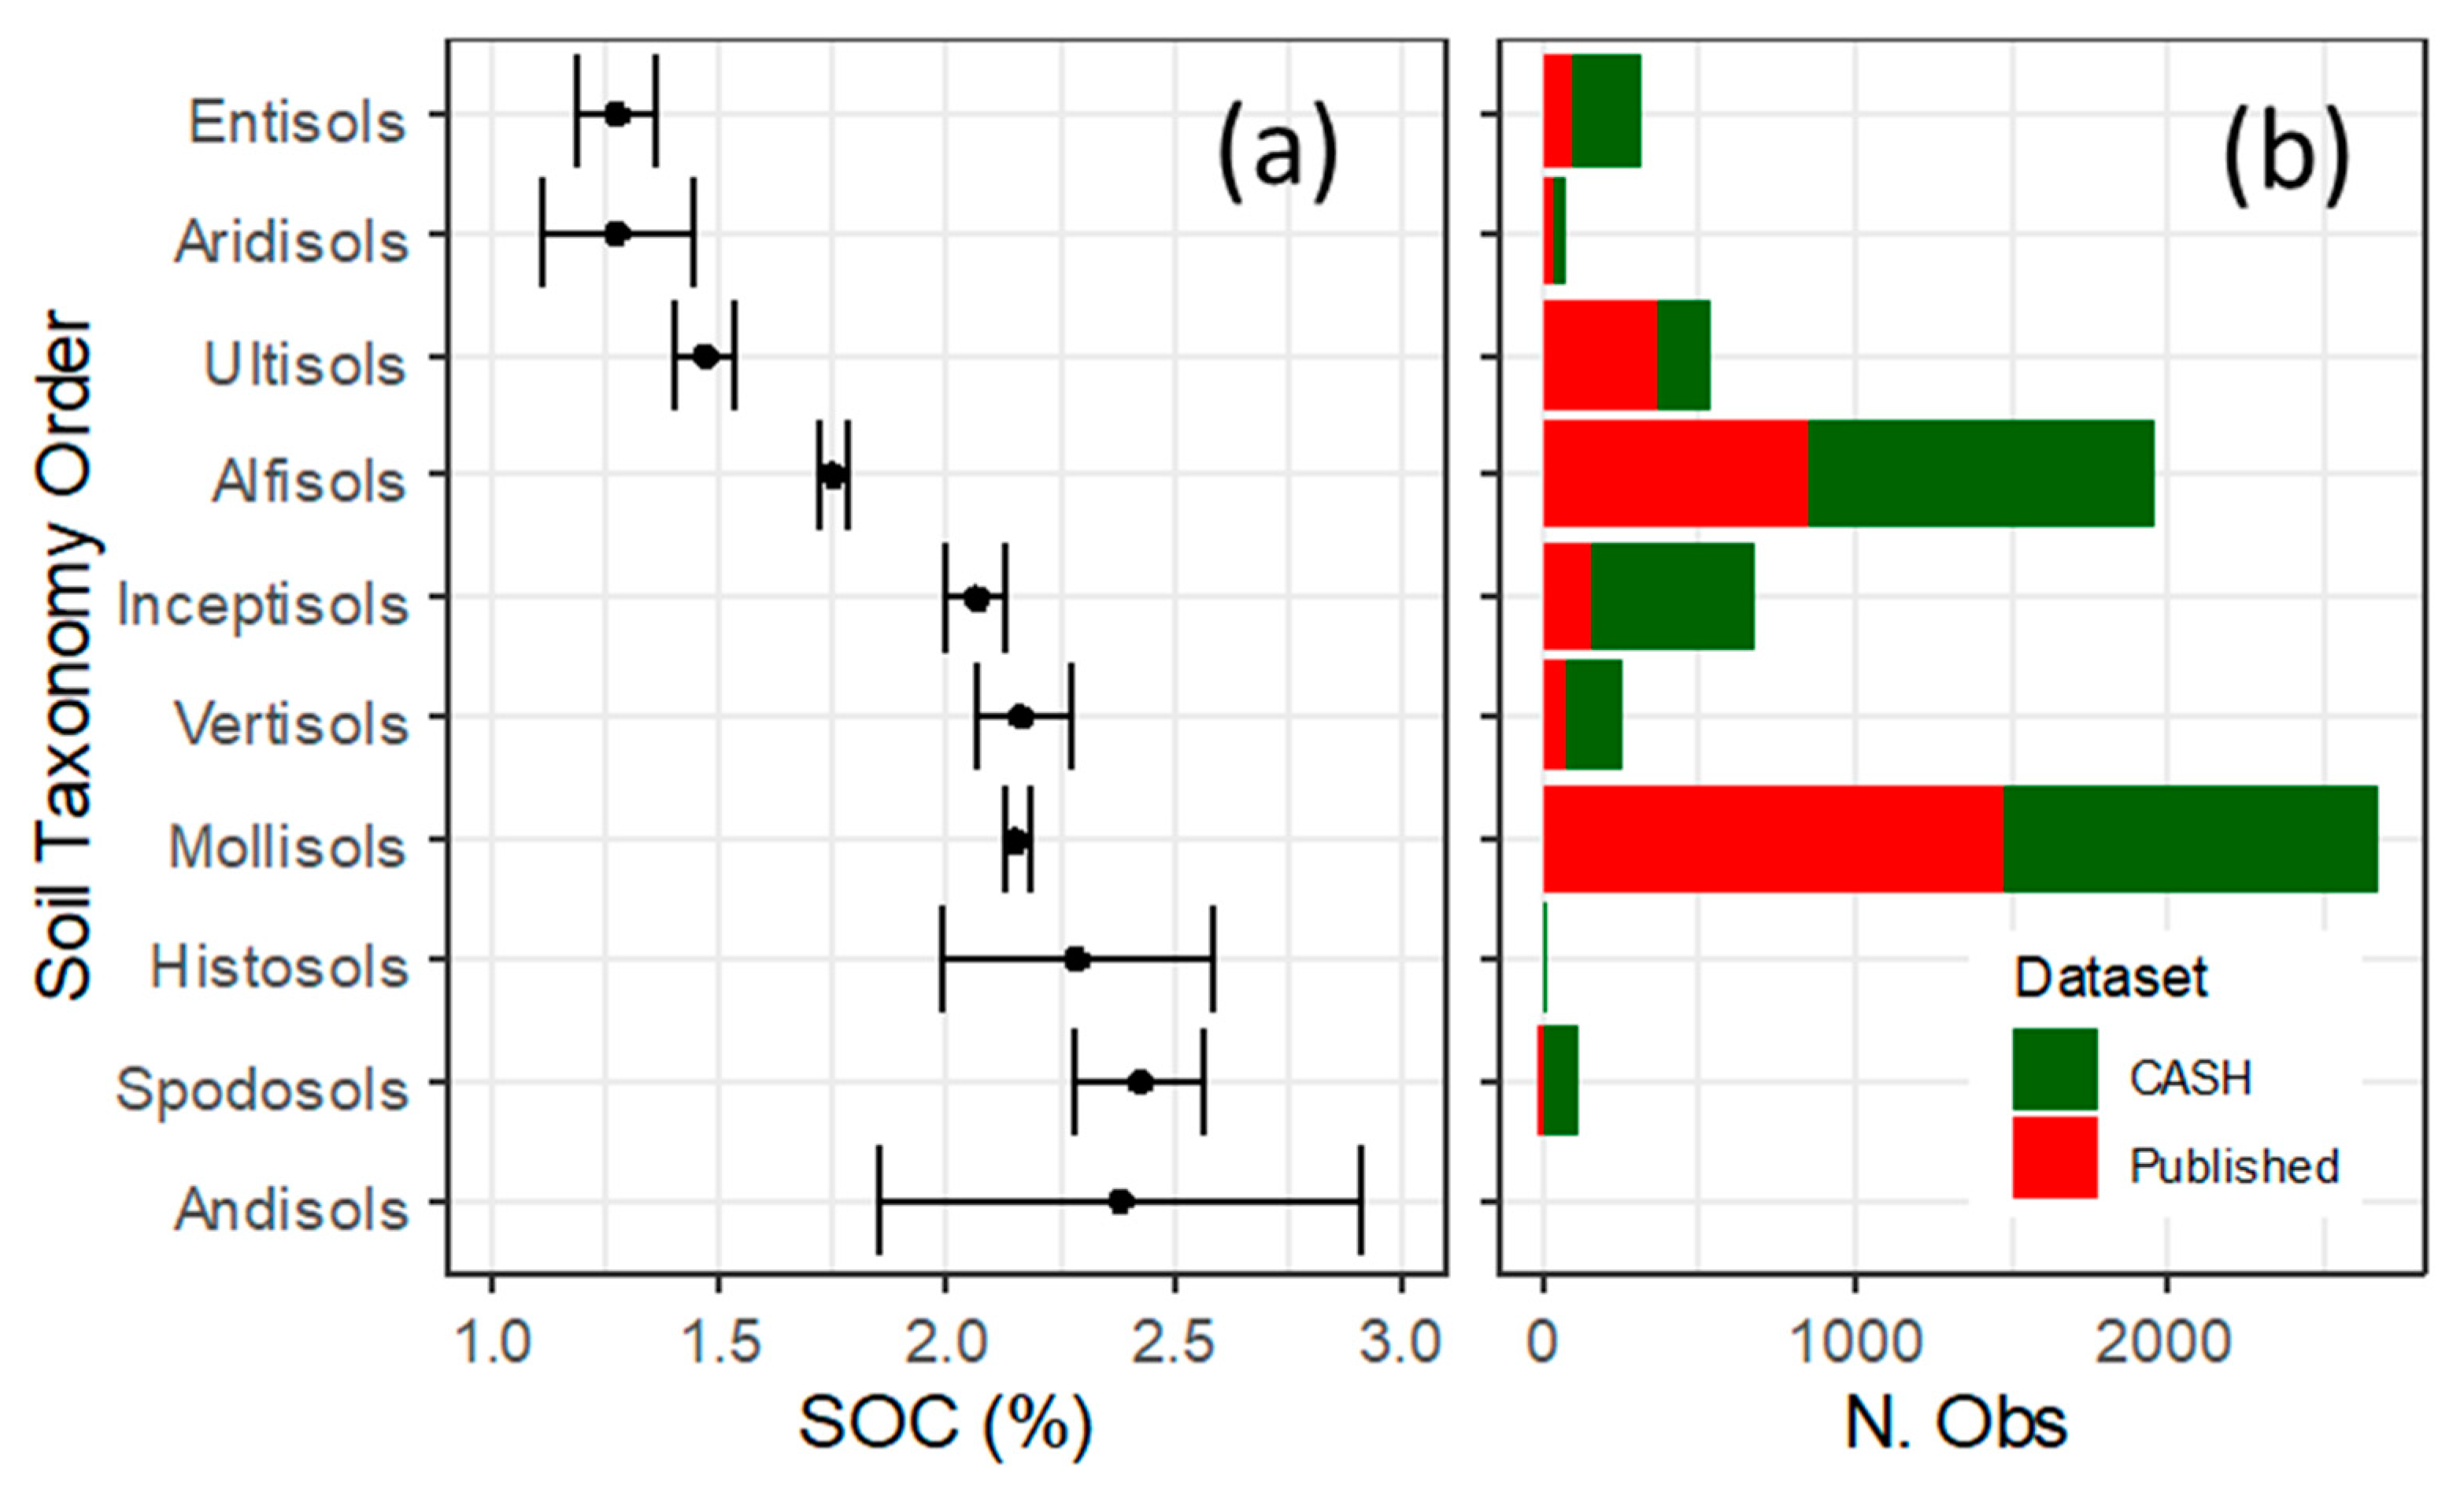
Soils are dynamic systems, formed in response to climate, organisms, relief, parent material, and time [55]. Soil taxonomy integrates the multiple soil characteristics that define how a soil functions within an ecosystem [59,60] and provides context for soil health assessments [5]. In this study, forty soil taxonomy suborders were identified during the analysis and demonstrated a wide range in mean SOC concentrations by soil suborder, as shown in Figure 7. Furthermore, there were significant differences among soil orders, as shown in Figure 8. In general, Histosols, Andisols, and Spodosols had the highest SOC, while Aridisols and Entisols tended to have the lowest mean values, thus confirming the importance of soil taxonomy when assessing SOC content.
3.4. Correlation Analysis
Pearson correlations among SOC concentration and other soil health indicators were developed for nine cases: each region individually (eight) and all sites combined. Overall, positive and significant (α = 0.05) correlations were observed between SOC and MBC, BG, AC, AS, and TN, while negative and significant correlations were found between SOC and BD, PR, and pH, as shown in Table 4. These results suggest that increasing topsoil SOC concentrations can improve both the size and activity of the soil microbial community (i.e., MBC and BG), SOM quality (i.e., AC and TN), and soil physical condition by decreasing BD and PR and increasing AS [6]. Furthermore, Pearson correlation coefficients also suggest that the influence of SOC content on soil health varies depending on the U.S. region and soil health indicator, as shown in Table 4. For example, increasing topsoil SOC concentration can improve the size and activity of the soil microbial community (i.e., MBC, BG) and increase nutrient concentration (i.e., TN) within the topsoil layer, independent of the U.S. region. The consistency of these results across regions suggests that SOC is one of the strongest drivers of biological soil health, which is in agreement with several past studies (i.e., in [3,7,8]). In contrast, the effect of SOC content on BD and PR (soil compaction) and soil pH was not consistent across regions, as shown in Table 4. Although SOC can influence these indicators, the main factors affecting these relationships are likely related to the adopted agricultural practices within each region. Soil compaction, for example, is strongly related to machinery traffic [61], meanwhile, soil pH is related to the soil addition of fertilizers (nitrogen) and lime.
Collectively, this large-scale study highlighted topsoil SOC sensitivity to inherent factors, which must be considered when interpreting SOC as a soil health indicator and using it to guide the implementation of various agricultural management practices. In the long-term, conservation practices can promote steady improvement in topsoil SOC, thus substantially affecting biological, physical, and chemical soil functions, as shown in Table 4. This is especially true for regulation and production functions that can create new soil phenoforms [2].
3.5. Bias in Output Data
As is well known, agriculture activity is a major industry in the U.S. and occurs in all states. However, cultivated crop types vary across the country, as shown in Table 1. For example, most of the annual cropping systems (i.e., corn, soybean, wheat) are concentrated within the Great Plains at the Corn Belt and Wheat Belt regions. Meanwhile, the Central Valley of California, among other regions, produces fruits, vegetables, and nuts, and the South regions have historically been a large producer of cotton, tobacco, and rice. Consequently, agricultural practices (i.e., tillage depth and intensity, addition of organic amendments) also tend to vary accordingly to crop type and region. In addition, the inherent conditions (i.e., climate and soil) are expected to be different across the nation. As a consequence, the measurements for each factor within the nationwide datasets (Published and/or CASH) tended to be unevenly distributed. We acknowledge the potential for bias in output data, which can affect the results presented herein. For example, based on the published studies, SOC was greater in RT than in CT in the Northwest, South Central, and Northeast regions, with the smallest sample sizes, while there was no significant difference among those tillage intensities within the other regions where the dataset was larger, as shown in Table 2. Thus, the results must be interpreted carefully. Finally, we highlight that, to calibrate and validate the regional or continental hypothesis of SOC variability, new and larger datasets are needed. This kind of dataset is also important in order to develop scoring curves to improve the interpretation of soil health indicators, including SOC.
4. Conclusions
This continental U.S. study confirmed that surface-layer SOC is sensitive to changes induced by agricultural practices such as: (1) reducing intensity and depth of tillage; (2) increasing cropping system diversity; (3) applying organic amendments; (4) maintaining crop residues on the soil surface; (5) converting row crops to perennial systems. Topsoil SOC concentrations were positively correlated with biological, physical, and chemical soil health indicators. It also confirmed the benefits of conservation practices and highlighted the potential to enhance soil health through their adoption. Furthermore, these results confirmed that several inherent factors significantly affect topsoil SOC. Higher SOC concentrations were associated with fine-textured soils and climates with lower temperature and higher moisture. Those inherent effects must, therefore, be accounted for when interpreting SOC values using soil health assessment tools, such as the Soil Management Assessment Framework (SMAF) or Comprehensive Assessment of Soil Health (CASH) protocols.
Author Contributions
Conceptualization, M.R.N., H.M.v.E. and J.P.A.; methodology, M.R.N.; data acquisition: M.R.N., J.P.A. and H.M.v.E.; statistical analysis, M.R.N.; writing—original draft preparation, M.R.N.; writing—review and editing, J.P.A., D.L.K., H.M.v.E., and K.S.V.; funding acquisition, D.L.K. All authors have read and agreed to publish this manuscript.
Funding
This study was supported by the Natural Resources Conservation Service (NRCS), U.S. Department of Agriculture (USDA), under agreement award number 67-3A75-17-391, “ARS Soil Management Assessment Framework (SMAF) meta-analysis for indicator interpretations and tool development for use by NRCS Conservation Planners” and by NRCS staff.
Acknowledgments
We thank the NRCS for supporting this study. Mention of trade names or commercial products in this publication is solely for the purpose of providing specific information and does not imply recommendation or endorsement by the USDA. The USDA is an equal opportunity provider and employer.
Conflicts of Interest
The authors declare no conflict of interest.
References
- Karlen, D.L.; Mausbach, M.J.; Doran, J.W.; Cline, R.G.; Harris, R.F.; Schuman, G.E. Soil quality: A concept, definition, and framework for evaluation. Soil Sci. Soc. Am. J. 1997, 61, 4–10. [Google Scholar] [CrossRef] [Green Version]
- Rossiter, D.; Bouma, J. A new look at soil phenoforms – Definition, identification, mapping. Geoderma 2018, 314, 113–121. [Google Scholar] [CrossRef]
- Doran, J.W.; Parkin, T.B. Quantitative indicators of soil quality: A minimum data set. In Methods for Assessing Soil Quality; Doran, J.W., Jones, A.J., Eds.; SSSA, Inc.: Madison, WI, USA, 1996; Special Publication 49; pp. 25–37. Available online: https://0-acsess-onlinelibrary-wiley-com.brum.beds.ac.uk/doi/abs/10.2136/sssaspecpub49.c2 (accessed on 26 February 2020).
- Nortcliff, S. Standardization of soil quality attributes. Agric. Ecosyst. Environ. 2002, 88, 161–168. [Google Scholar] [CrossRef]
- Andrews, S.S.; Karlen, D.L.; Cambardella, C.A. The soil management assessment framework: A quantitative soil quality evaluation method. Soil Sci. Soc. Am. J. 2004, 68, 1945–1962. [Google Scholar] [CrossRef]
- Stott, D.E. Recommended Soil Health Indicators and Associated Laboratory Procedures; Soil Health Technical Note No. 450-03; U.S. Department of Agriculture, Natural Resources Conservation Service: Washington, DC, USA, 2019.
- Lal, R. Soil health and carbon management. Food Energy Secur. 2016, 5, 212–222. [Google Scholar] [CrossRef]
- Lal, R. Societal value of soil carbon. J. Soil Water Conserv. 2014, 69, 186A–192A. [Google Scholar] [CrossRef] [Green Version]
- Karlen, D.L.; Wollenhaupt, N.C.; Erbach, D.C.; Berry, E.C.; Swan, J.B.; Eash, N.S.; Jordhal, J.L. Long-term tillage effects on soil quality. Soil Tillage Res. 1994, 32, 313–327. [Google Scholar] [CrossRef]
- Fließbach, A.; Oberholzer, H.R.; Gunst, L.; Mäder, P. Soil organic matter and biological soil quality indicators after 21 years of organic and conventional farming. Agric. Ecosyst. Environ. 2007, 118, 273–284. [Google Scholar] [CrossRef]
- Veum, K.S.; Kremer, R.J.; Sudduth, K.A.; Kitchen, N.R.; Lerch, R.N.; Baffaut, C.; Stott, D.E.; Karlen, D.L.; Sadler, E.J. Conservation effects on soil quality indicators in the Missouri Salt River Basin. J. Soil Water Cons. 2015, 70, 232–246. [Google Scholar] [CrossRef]
- Nunes, M.R.; van Es, H.M.; Schindelbeck, R.R.; Ristow, A.J.; Ryan, M. No-till and cropping system diversification improve soil health and crop yield. Geoderma 2018, 328, 30–43. [Google Scholar] [CrossRef]
- Luo, Z.; Wang, E.; Sun, O.J. Can no-tillage stimulate carbon sequestration in agricultural soils? A meta-analysis of paired experiments. Agric. Ecosyst. Environ. 2010, 139, 224–231. [Google Scholar] [CrossRef]
- Powlson, D.S.; Stirling, C.M.; Thierfelder, C.; White, R.P.; Jat, M.L. Does conservation agriculture deliver climate change mitigation through soil carbon sequestration in tropical agro-ecosystems? Agric. Ecosyst. Environ. 2016, 220, 164–174. [Google Scholar] [CrossRef]
- Bending, G.D.; Turner, M.K.; Rayns, F.; Marx, M.C.; Wood, M. Microbial and biochemical soil quality indicators and their potential for differentiating areas under contrasting agricultural management regimes. Soil Biol. Biochem. 2004, 36, 1785–1792. [Google Scholar] [CrossRef]
- Moore, T.R.; Dalva, M. The influence of temperature and water table position on carbon dioxide and methane emissions from laboratory columns of peatland soils. J. Soil Sci. 1993, 44, 651–664. [Google Scholar] [CrossRef]
- Yang, J.S.; Liu, J.S.; Sun, L.N. Effects of temperature and soil moisture on wetland soil organic carbon mineralization. Ecol. Sci. 2008, 27, 38–42. [Google Scholar]
- Zhang, L.; Zheng, Q.; Liu, Y.; Liu, S.; Yu, D.; Shi, X.; Xing, S.; Chen, H.; Fan, X. Combined effects of temperature and precipitation on soil organic carbon changes in the uplands of eastern China. Geoderma 2019, 337, 1105–1115. [Google Scholar] [CrossRef]
- Burke, I.C.; Yonker, C.M.; Parton, W.J.; Cole, C.V.; Flach, K.; Schimel, D.S. Texture, climate, and cultivation effects on soil organic matter content in U.S. grassland soils. Soil Sci. Soc. Am. J. 1989, 53, 800–805. [Google Scholar] [CrossRef]
- Pribyl, D.W. A critical review of the conventional SOC to SOM conversion factor. Geoderma 2010, 156, 75–83. [Google Scholar] [CrossRef]
- Moebius-Clune, B.N.; Moebius-Clune, D.J.; Gugino, B.K.; Idowu, O.J.; Schindelbeck, R.R.; Ristow, A.J.; van Es, H.M.; This, J.E.; Shayler, H.A.; McBride, M.B.; et al. Compr. Assess. of Soil Health, 3rd ed.; Cornell University: Geneva, NY, USA, 2016; Available online: http://www.css.cornell.edu/extension/soil-health/manual.pdf (accessed on 19 February 2020).
- Kettler, T.A.; Doran, J.W.; Gilbert, T.L. Simplified method for soil particle-size determination to accompany soil-quality analyses. Soil Sci. Soc. Am. J. 2001, 65, 849. [Google Scholar] [CrossRef] [Green Version]
- Weil, R.; Islam, K.R.; Stine, M.A.; Gruver, J.B.; Samson-Liebig, S.E. Estimating active carbon for soil quality assessment: A simple method for laboratory and field use. Am. J. Altern. Agric. 2003, 18, 3–17. [Google Scholar]
- Storer, D.A. A simple high sample volume ashing procedure for determination of soil organic matter. Comm. Soil Sci. Plant Anal. 1984, 15, 7. [Google Scholar] [CrossRef]
- Kuznetsova, A.; Brockhoff, P.B.; Christensen, R.H.B. LmerTest package: Tests in linear mixed effects models. J. Stat. Soft. 2017, 82. [Google Scholar] [CrossRef] [Green Version]
- Wickham, H. ggplot2: Elegant Graphics for Data Analysis. Springer-Verlag New York. 2016. Available online: https://r4ds.had.co.nz/ (accessed on 25 January 2020).
- De Martonne, E. Traité de Géographie Physique; Dunod Editeur: Paris, France, 1925. [Google Scholar]
- Baltas, E. Spatial distribution of climatic indices in northern Greece. Meteorol. Appl. 2007, 14, 69–78. [Google Scholar] [CrossRef]
- Croitoru, A.E.; Piticar, A.; Imbroane, A.M.; Burada, D.C. Spatiotemporal distribution of aridity indices based on temperature and precipitation in the extra-Carpathian regions of Romania. Theor. Appl. Climatol. 2013, 112, 597–607. [Google Scholar] [CrossRef]
- Angers, D.A.; Eriksen-Hamel, N.S. Full-inversion tillage and organic carbon distribution in soil profiles: A meta-analysis. Soil Sci. Soc. Am. J. 2008, 72, 1370–1374. [Google Scholar] [CrossRef]
- Veum, K.S.; Goyne, K.W.; Kremer, R.J.; Miles, R.J.; Sudduth, K.A. Biological indicators of soil quality and soil organic matter characteristics in an agricultural management continuum. Biogeochemistry 2014, 117, 81–99. [Google Scholar] [CrossRef]
- Meurer, K.H.E.; Haddaway, N.R.; Bolinder, M.A.; Kätterer, T. Tillage intensity affects total SOC stocks in boreo-temperate regions only in the topsoil-A systematic review using an ESM approach. Earth Sci. Rev. 2018, 177, 613–622. [Google Scholar] [CrossRef]
- Nunes, M.R.; Karlen, D.J.; Denardin, J.E.; Cambardella, C.A. Corn root and soil health indicator response to no-till production practices. Agric. Ecosyst. Environ. 2019, 285, 106607. [Google Scholar] [CrossRef]
- Nunes, M.R.; Karlen, D.L.; Veum, K.S.; Moorman, T.B.; Cambardella, C.A. Biological soil health indicators respond to tillage intensity: A US meta-analysis. Geoderma 2020, 369, 114335. [Google Scholar] [CrossRef]
- Karlen, D.L.; Cambardella, C.A.; Kovar, J.L.; Colvin, T.S. Soil quality response to long-term tillage and crop rotation practices. Soil Tillage Res. 2013, 133, 54–64. [Google Scholar] [CrossRef] [Green Version]
- Martins, M.R.; Angers, D.A.; Corá, J.E. Co-accumulation of microbial residues and particulate organic matter in the surface layer of a no-till Oxisol under different crops. Soil Biol. Biochem. 2012, 50, 208–213. [Google Scholar] [CrossRef]
- Moore, E.B.; Wiedenhoeft, M.H.; Kaspar, T.C.; Cambardella, C.A. Rye cover crop effects on soil quality in no-till corn silage–soybean cropping systems. Soil Sci. Soc. Am. J. 2014, 78, 968. [Google Scholar] [CrossRef]
- Franzluebbers, A.J. Farming strategies to fuel bioenergy demands and facilitate essential soil services. Geoderma 2015, 259–260, 251–258. [Google Scholar] [CrossRef]
- Blanco-Canqui, H.; Lal, R.; Post, W.M.; Izaurralde, R.C.; Shipitalo, M.J. Soil hydraulic properties influenced by corn stover removal from no-till corn in Ohio. Soil Tillage Res. 2007, 92, 144–155. [Google Scholar] [CrossRef]
- Xu, H.; Sieverding, H.; Kwon, H.; Clay, D.; Stewart, C.; Johnson, J.M.F.; Qin, Z.; Karlen, D.L.; Wang, M. A global meta-analysis of soil organic carbon response to corn stover removal. GCB Bioenergy 2019, 11, 1215–1233. [Google Scholar] [CrossRef] [Green Version]
- Qin, Z.; Dunn, J.B.; Kwon, H.; Mueller, S.; Wander, M.M. Soil carbon sequestration and land use change associated with biofuel production: Empirical evidence. GCB Bioenergy 2016, 8, 66–80. [Google Scholar] [CrossRef] [Green Version]
- Qin, Z.; Canter, C.E.; Dunn, J.B.; Mueller, S.; Kwon, H.; Han, J.; Wander, M.M.; Wang, M. Land management change greatly impacts biofuels’ greenhouse gas emissions. GCB Bioenergy 2018, 10, 370–381. [Google Scholar] [CrossRef] [Green Version]
- Moebius-Clune, B.N.; van Es, H.M.; Idowu, J.O.; Schindelbeck, R.R.; Moebius-Clune, D.J.; Wolfe, D.W.; Abawi, G.S.; Thies, J.E.; Gugino, B.K.; Lucey, R. Long-Term Removal of Maize Residue for Bioenergy: Will It Affect Soil Quality? Soil Sci. Soc. Am. J. 2008, 72, 960–969. [Google Scholar] [CrossRef]
- Owen, J.J.; Parton, W.J.; Silver, W.L. Long-term impacts of manure amendments on carbon and greenhouse gas dynamics of rangelands. Glob. Change Boil. 2015, 21, 4533–4547. [Google Scholar] [CrossRef]
- Xia, L.; Lam, S.; Yan, X.; Chen, D. How does recycling of livestock manure in agroecosystems affect crop productivity, reactive nitrogen losses, and soil carbon balance? Environ. Sci. Technol. 2017, 13, 7450–7457. [Google Scholar] [CrossRef]
- Lal, R. Soil carbon sequestration impacts on global climate change and food security. Science 2004, 304, 1623–1627. [Google Scholar] [CrossRef] [PubMed] [Green Version]
- Lynch, D.; Voroney, R.; Warman, P. Soil physical properties and organic matter fractions under forages receiving composts, manure or fertilizer. Compost. Sci. Util. 2005, 13, 252–261. [Google Scholar] [CrossRef] [Green Version]
- Blair, N.; Faulkner, R.D.; Till, A.R.; Poulton, P.R. Long-term management impacts on soil C, N and physical fertility. Soil Tillage Res. 2006, 91, 30–38. [Google Scholar] [CrossRef]
- Cabrera, V.E.; Stavast, L.J.; Baker, T.T.; Wood, M.K.; Cram, D.S.; Flynn, R.P.; Ulery, A.L. Soil and runoff response to dairy manure application on New Mexico rangeland. Agric. Ecosyst. Environ. 2009, 131, 255–262. [Google Scholar] [CrossRef]
- Glover, J.D.; Cox, C.M.; Reganold, J.P. Future farming: A return to roots? Sci. Am. 2007, 297, 66–73. [Google Scholar] [CrossRef]
- Stott, D.E.; Karlen, D.L.; Cambardella, C.A.; Harmel, R.D. A soil quality and metabolic activity assessment after fifty-seven years of agricultural management. Soil Sci. Soc. Am. J. 2013, 77, 903–913. [Google Scholar] [CrossRef]
- Presley, D.R.; Ransom, M.; Kluitenberg, G.; Finnell, P. Effects of thirty years of irrigation on the genesis and morphology of two semiarid soils in Kansas. Soil Sci. Soc. Am. J. 2004, 68, 1916–1926. [Google Scholar] [CrossRef]
- Adhikari, K.; Hartemink, A.E. Soil organic carbon increases under intensive agriculture in the Central Sands, Wisconsin, USA. Geoderma Reg. 2017, 10, 115–125. [Google Scholar] [CrossRef]
- Torn, M.S.; Trumbore, S.E.; Chadwick, O.A.; Vitousek, P.M.; Hendricks, D.M. Mineral control of soil organic carbon storage and turnover. Nature 1997, 389, 170–173. [Google Scholar] [CrossRef]
- Jenny, H. Factors of Soil Formation: A System of Quantitative Pedology; McGraw Hill: New York, NY, USA, 1941. [Google Scholar]
- De Deyn, G.B.; Cornelissen, J.H.C.; Bardgett, R.D. Plant functional traits and soil carbon sequestration in contrasting biomes. Ecol. Lett. 2008, 11, 516–531. [Google Scholar] [CrossRef]
- Schmidt, M.W.; Torn, M.S.; Abiven, S.; Dittmar, T.; Guggenberger, G.; Janssens, I.A.; Kleber, M.; Kögel-Knabner, I.; Lehmann, J.; Manning, D.A.C.; et al. Persistence of soil organic matter as an ecosystem property. Nature 2011, 478, 49–56. [Google Scholar] [CrossRef] [PubMed] [Green Version]
- Jobbagy, E.G.; Jackson, R.B. The vertical distribution of soil organic carbon and its relation to climate and vegetation. Ecol. Appl. 2000, 10, 423–436. [Google Scholar] [CrossRef]
- Karlen, D.L.; Ditzler, C.A.; Andrews, S.S. Soil quality: Why and how? Geoderma 2003, 114, 145–156. [Google Scholar] [CrossRef]
- Karlen, D.L.; Veum, K.S.; Sudduth, K.A.; Obrycki, J.F.; Nunes, M.R. Soil health assessment: Past accomplishments, current activities, and future opportunities. Soil Tillage Res. 2019, 195, 104365. [Google Scholar] [CrossRef]
- Lima, R.P.; Silva, A.P.; Giarola, N.F.B.; Silva, A.R.; Rolim, M.M.; Keller, T. Impact of initial bulk density and matric suction on compressive properties of two Oxisols under no-till. Soil Tillage Res. 2018, 175, 168–177. [Google Scholar] [CrossRef]
Figure 1.
Locations where soil organic carbon data for different agricultural production systems originated.
Figure 1.
Locations where soil organic carbon data for different agricultural production systems originated.

Figure 2.
The regional number of SOC observations from the Comprehensive Assessment of Soil Health (CASH) and Published datasets.
Figure 2.
The regional number of SOC observations from the Comprehensive Assessment of Soil Health (CASH) and Published datasets.

Figure 3.
Regional mean SOC concentrations. Horizontal bars signify 95% confidence intervals for Midwest (MW); Plains States (PS); East Central (EC); Northwest (NW); Northeast (NE); Southwest (SW); Southeast (SE); South Central (SC) regions.
Figure 3.
Regional mean SOC concentrations. Horizontal bars signify 95% confidence intervals for Midwest (MW); Plains States (PS); East Central (EC); Northwest (NW); Northeast (NE); Southwest (SW); Southeast (SE); South Central (SC) regions.

Figure 4.
Mean SOC concentrations and 95% confidence intervals (horizontal bars) for sand (S), loamy sand (LS), sandy loam (SL), loam (L), sandy clay loam (SCL), silt loam (SiL), silt (Si), clay loam (CL), silty clay loam (SiCL), silty clay (SiC), and clay (C) textured soils from across the U.S. (a); the number of observations for each texture group from Published and CASH (b) datasets.

Figure 5.
SOC as a function of mean annual temperature (a) and mean annual precipitation (b) across the U.S.
Figure 5.
SOC as a function of mean annual temperature (a) and mean annual precipitation (b) across the U.S.

Figure 6.
Mean SOC concentrations and 95% confidence intervals (horizontal bars) in semi-arid (SA), arid (A), Mediterranean (M), semi-humid (SH), humid (H), very humid (VH), and extremely humid (EH) climate zones across the U.S. (a); number of observations for each from Published or CASH (b) datasets.

Figure 7.
Mean SOC concentrations and 95% confidence intervals (horizontal bars) for several soil suborders across the U.S. (a); number of observations for each within the Published or CASH (b) datasets.
Figure 7.
Mean SOC concentrations and 95% confidence intervals (horizontal bars) for several soil suborders across the U.S. (a); number of observations for each within the Published or CASH (b) datasets.

Figure 8.
Mean SOC concentrations and 95% confidence intervals (horizontal bars) in Andisols, Spodosols, Histosols, Mollisols, Vertisols, Inceptisols, Alfisols, Ultisols, Aridisols, and Entisols across the U.S. (a); number of observations for each within Published or CASH (b) datasets.
Figure 8.
Mean SOC concentrations and 95% confidence intervals (horizontal bars) in Andisols, Spodosols, Histosols, Mollisols, Vertisols, Inceptisols, Alfisols, Ultisols, Aridisols, and Entisols across the U.S. (a); number of observations for each within Published or CASH (b) datasets.


Table 1.
Regional number of CASH dataset samples analyzed for SOC concentrations used to assess tillage depth and cropping system effects.
Table 1.
Regional number of CASH dataset samples analyzed for SOC concentrations used to assess tillage depth and cropping system effects.
| Management | MW | PS | SE | SC | NW | EC | NE | SW | Overall |
|---|---|---|---|---|---|---|---|---|---|
| Tillage 1 | 813 | 246 | 214 | 39 | 134 | 116 | 1037 | 144 | 2746 |
| Deep | 71 | 11 | 75 | 2 | 53 | 19 | 367 | 38 | 636 |
| Shallow | 207 | 16 | 50 | 18 | 22 | 15 | 307 | 61 | 696 |
| No-till | 525 | 219 | 89 | 19 | 59 | 82 | 363 | 45 | 1404 |
| System 2 | 776 | 253 | 169 | 36 | 178 | 128 | 1069 | 160 | 2769 |
| Mix Veg | 45 | 6 | 23 | 3 | 1 | 9 | 141 | 13 | 241 |
| Perennial | 22 | 77 | 27 | 1 | 23 | 2 | 168 | 10 | 330 |
| Dairy Crop | 3 | 8 | 0 | 3 | 1 | 17 | 166 | 8 | 206 |
| Single Veg | 3 | 11 | 3 | 4 | 26 | 19 | 205 | 24 | 295 |
| Annual Grain | 703 | 148 | 114 | 23 | 55 | 46 | 323 | 63 | 1475 |
| Fruit | 0 | 3 | 2 | 2 | 72 | 35 | 66 | 42 | 222 |
1 Shallow = tillage depth ≥ 2 and ≤ 17 cm; Deep = tillage depth > 17 cm (conventional tillage). 2 Annual Grain = annual crops (e.g., corn, soybean, wheat, barley, etc.); Dairy Crop = crops present in dairy systems (alfalfa, alfalfa grass, alfalfa trefoil grass, and corn silage); Mix Veg = mixed vegetables (small systems); Single Veg = large-scale vegetable production systems (e.g., broccoli, cabbage, cauliflower, tomato, pepper, lettuce, carrots, squash, radish, etc.); Fruit = fruit production systems (e.g., apples, grape, nectarines, etc.); Perennial = perennial pastures (pasture rotational graze, pasture with improved grasses) and perennial grasses.
Table 2.
U.S. SOC concentrations (%) as affected by tillage intensity (conventional tillage (CT), reduced tillage (RT), and no-tillage (NT)), cover crop (Yes or No), crop residue management (no removal (NR), moderate removal (MR), and high removal (HR)), and manure additions (Yes or No), using data only from published studies.
| Management | Level | Region | Overall | ||||||
|---|---|---|---|---|---|---|---|---|---|
| practice | MW | PS | SE | NW | SC | EC | NE | ||
| Tillage Intensity | CT | 1.91b | 1.37b | 1.08b | 1.42b | 0.85b | 1.41b | 1.34b | 1.32c |
| RT | 2.01ab | 1.43ab | 1.25ab | 1.87a | 1.01a | 1.69ab | 1.51ab | 1.48b | |
| NT | 2.19a | 1.57a | 1.39a | 2.02a | 1.08a | 1.91a | 1.70a | 1.67a | |
| Tillage | p-value | 0.019 | 0.018 | 0.000 | 0.000 | 0.007 | 0.001 | 0.003 | 0.000 |
| Tillage x Time | p-value | 0.802 | 0.046 | 0.455 | 0.056 | 0.962 | 0.134 | 0.450 | 0.317 |
| n | 795 | 650 | 467 | 125 | 189 | 139 | 71 | 2416 | |
| Cover crop | No | 1.94 | 1.35 | 1.13 | 1.49 | 0.79 | 1.37 | 1.30 | 1.32 |
| Yes | 2.31 | 1.45 | 1.24 | 1.85 | 1.10 | 1.48 | 1.44 | 1.51 | |
| Cover crop | p-value | 0.000 | 0.228 | 0.142 | 0.046 | 0.000 | 0.270 | 0.333 | 0.000 |
| Cover crop x Time | p-value | 0.058 | 0.859 | 0.125 | 0.069 | 0.000 | ID | ID | 0.115 |
| n | 448 | 406 | 350 | 84 | 106 | 92 | 59 | 1545 | |
| Residue removal | NR | 2.39a | 2.26 | 1.80a | 1.36 | 1.36 | - | 1.58 | 2.08a |
| MR | 2.24a | 2.12 | 1.81a | 1.59 | 1.59 | - | 1.49 | 1.98ab | |
| HR | 1.90b | 2.19 | 1.48b | 1.50 | 1.50 | - | 1.52 | 1.91b | |
| Residue | p-value | 0.014 | 0.386 | 0.047 | 0.869 | 0.812 | ID | 0.889 | 0.044 |
| Residue x Time | p-value | 0.869 | 0.279 | ID | ID | ID | ID | ID | 0.699 |
| n | 141 | 215 | 27 | 28 | 22 | 3 | 52 | 488 | |
| Manure addition | No | 1.35 | 1.37 | 1.51 | 1.50 | 1.38 | 0.87 | 1.31 | 1.36 |
| Yes | 1.88 | 1.67 | 1.77 | 2.07 | 1.74 | 1.23 | 1.71 | 1.61 | |
| Manure | p-value | 0.000 | 0.013 | 0.142 | 0.000 | 0.005 | 0.002 | 0.046 | 0.000 |
| Manure x Time | p-value | 0.115 | 0.717 | ID | ID | ID | ID | ID | 0.018 |
| n | 83 | 41 | 56 | 18 | 61 | 15 | 36 | 330 |
Mean, followed by the same letter within a column and for a given management practice, are not significantly different based on Tukey HSD test (α = 0.05). ID: insufficient data to test.
Table 3.
SOC (%) as a function of tillage depth and cropping system for each region, based on the CASH dataset.
Table 3.
SOC (%) as a function of tillage depth and cropping system for each region, based on the CASH dataset.
| Management | Tillage Level | MW | PS | SE | SC | NW | EC | NE | SW | Overall |
|---|---|---|---|---|---|---|---|---|---|---|
| Tillage 1 | Deep | 1.96b | 1.51a | 1.21b | - | 1.52b | 2.13a | 1.70b | 1.52b | 1.68c |
| Shallow | 1.97b | 1.68a | 1.55b | 1.32a | 1.82a | 2.03a | 1.74b | 1.80a | 1.80b | |
| No-till | 2.07a | - | 2.19a | 1.36a | 1.73a | 2.06a | 2.08a | 1.72a | 1.97a | |
| p-value | 0.044 | 0.834 | 0.000 | 0.221 | 0.001 | 0.876 | 0.000 | 0.017 | 0.000 | |
| System 2 | Mix Veg | 2.58a | - | 2.94a | - | - | - | 2.37a | 2.21a | 2.41a |
| Perennial | 2.34a | 1.83b | 3.04a | - | 2.34a | - | 2.23a | 2.03ab | 2.18b | |
| Dairy Crop | - | - | - | - | - | 2.14a | 1.94b | 1.51ab | 1.94c | |
| Single Veg | - | - | - | - | 1.94b | 2.20a | 1.61c | 1.97ab | 1.70d | |
| Annual Grain | 1.65b | 2.48a | 1.27b | - | 1.82b | 1.86b | 1.62c | 1.82ab | 1.71d | |
| Fruit | - | - | - | - | 1.44c | 2.17a | 1.87bc | 1.48b | 1.66d | |
| p-value | 0.000 | 0.000 | 0.000 | - | 0.000 | 0.039 | 0.000 | 0.000 | 0.000 |
1 Deep = tillage depth > 17 cm (conventional tillage), Shallow = tillage depth ≥ 2 and ≤ 17 cm. 2 Mix Veg = mixed vegetables (small systems); Perennial = perennial pastures (pasture rotational graze, pasture with improved grasses) and perennial grasses; Dairy Crop = crops presents in dairy systems (alfalfa, alfalfa grass, alfalfa trefoil grass, and corn silage); Single Veg = large-scale vegetable production systems (e.g., broccoli, cabbage, cauliflower, tomato, pepper, lettuce, carrots, squash, radish, etc.); Annual Grain = annual crops (e.g., corn, soybean, wheat, barley, etc.); Fruit = fruit production systems (e.g., apples, grape, nectarines, etc.).
Table 4.
Pearson product–moment correlation coefficients between SOC and other soil health indicators (microbial biomass-C (MBC), active-C (AC), beta-glucosidase (BG), bulk density (BD), wet macroaggregate stability (AS), penetration resistance (PR), soil pH, total N (TN), extractable P and K) within eight U.S. regions and overall regions.
| Region/SHI | MBC | BG | AC | AS | BD | PR | pH | TN | P | K |
|---|---|---|---|---|---|---|---|---|---|---|
| Midwest | ||||||||||
| N | 181 | 133 | 1864 | 298 | 582 | 67 | 603 | 620 | 258 | 280 |
| R | 0.46 | 0.15 | 0.70 | 0.30 | −0.46 | −0.20 | 0.10 | 0.72 | −0.17 | 0.19 |
| p value | 0.000 | 0.094 | 0.000 | 0.000 | 0.000 | 0.103 | 0.014 | 0.000 | 0.005 | 0.003 |
| Plain States | ||||||||||
| N | 91 | 22 | 400 | 74 | 407 | 0 | 235 | 304 | 160 | 77 |
| R | 0.51 | 0.01 | 0.68 | 0.47 | −0.50 | - | −0.04 | 0.87 | −0.33 | 0.01 |
| p value | 0.000 | 0.980 | 0.000 | 0.000 | 0.000 | - | 0.508 | 0.000 | 0.000 | 0.944 |
| Southeast | ||||||||||
| N | 90 | 24 | 265 | 8 | 295 | 8 | 118 | 227 | 108 | 55 |
| r | 0.56 | 0.72 | 0.80 | 0.95 | −0.57 | −0.02 | 0.15 | 0.76 | 0.21 | 0.47 |
| p value | 0.000 | 0.000 | 0.000 | 0.000 | 0.000 | 0.946 | 0.109 | 0.000 | 0.031 | 0.000 |
| South Central | ||||||||||
| n | 117 | 109 | 74 | 34 | 52 | 0 | 218 | 225 | 80 | 33 |
| r | 0.72 | 0.69 | 0.90 | 0.87 | 0.19 | - | 0.03 | 0.92 | 0.31 | 0.38 |
| p value | 0.000 | 0.000 | 0.000 | 0.000 | 0.181 | - | 0.668 | 0.000 | 0.006 | 0.027 |
| Northwest | ||||||||||
| n | 67 | 64 | 232 | 15 | 56 | 22 | 37 | 43 | 11 | 42 |
| r | 0.37 | 0.12 | 0.17 | 0.04 | −0.69 | −0.65 | −0.32 | 0.87 | 0.95 | −0.38 |
| p value | 0.002 | 0.345 | 0.011 | 0.892 | 0.000 | 0.001 | 0.054 | 0.000 | 0.000 | 0.013 |
| Northeast | ||||||||||
| n | 17 | 0 | 1307 | 48 | 36 | 36 | 89 | 70 | 61 | 61 |
| r | 0.82 | - | 0.85 | 0.67 | −0.60 | −0.38 | -0.16 | 0.69 | 0.04 | 0.47 |
| p value | 0.000 | - | 0.000 | 0.000 | 0.000 | 0.023 | 0.130 | 0.000 | 0.411 | 0.000 |
| East Central | ||||||||||
| n | 4 | 38 | 144 | 0 | 24 | 0 | 94 | 116 | 35 | 84 |
| r | 0.48 | 0.80 | 0.76 | - | −0.22 | - | −0.12 | 0.92 | 0.68 | 0.63 |
| p value | 0.521 | 0.000 | 0.000 | - | 0.304 | - | 0.241 | 0.000 | 0.000 | 0.000 |
| Southeast | ||||||||||
| n | 22 | 10 | 184 | 8 | 8 | 0 | 23 | 54 | 17 | 15 |
| r | 0.22 | 0.12 | 0.62 | 0.53 | −0.56 | - | −0.35 | 0.70 | −0.07 | 0.01 |
| p value | 0.212 | 0.726 | 0.000 | 0.180 | 0.150 | - | 0.105 | 0.000 | 0.783 | 0.947 |
| Overall | ||||||||||
| n | 589 | 400 | 4470 | 485 | 1460 | 134 | 1414 | 1659 | 730 | 647 |
| r | 0.56 | 0.50 | 0.73 | 0.49 | −0.46 | 0.20 | −0.15 | 0.83 | −0.05 | 0.06 |
| p value | 0.000 | 0.000 | 0.000 | 0.000 | 0.000 | 0.018 | 0.001 | 0.000 | 0.170 | 0.100 |
© 2020 by the authors. Licensee MDPI, Basel, Switzerland. This article is an open access article distributed under the terms and conditions of the Creative Commons Attribution (CC BY) license (http://creativecommons.org/licenses/by/4.0/).
Share and Cite
MDPI and ACS Style
Nunes, M.R.; van Es, H.M.; Veum, K.S.; Amsili, J.P.; Karlen, D.L. Anthropogenic and Inherent Effects on Soil Organic Carbon across the U.S. Sustainability 2020, 12, 5695. https://0-doi-org.brum.beds.ac.uk/10.3390/su12145695
AMA Style
Nunes MR, van Es HM, Veum KS, Amsili JP, Karlen DL. Anthropogenic and Inherent Effects on Soil Organic Carbon across the U.S. Sustainability. 2020; 12(14):5695. https://0-doi-org.brum.beds.ac.uk/10.3390/su12145695
Chicago/Turabian StyleNunes, Márcio R., Harold M. van Es, Kristen S. Veum, Joseph P. Amsili, and Douglas L. Karlen. 2020. "Anthropogenic and Inherent Effects on Soil Organic Carbon across the U.S" Sustainability 12, no. 14: 5695. https://0-doi-org.brum.beds.ac.uk/10.3390/su12145695
Note that from the first issue of 2016, this journal uses article numbers instead of page numbers. See further details here.