The Impact of Land Use Change on Ecosystem Service Value in the Upstream of Xiong’an New Area

1
Key Laboratory of Agricultural Water Resources, Center for Agricultural Resources Research, Institute of Genetics and Developmental Biology, Chinese Academy of Sciences, Shijiazhuang 050021, China
2
College of Advanced Agricultural Sciences, University of Chinese Academy of Sciences, Beijing 100049, China
*
Authors to whom correspondence should be addressed.
Sustainability 2020, 12(14), 5707; https://0-doi-org.brum.beds.ac.uk/10.3390/su12145707
Submission received: 18 June 2020
/
Revised: 3 July 2020
/
Accepted: 13 July 2020
/
Published: 16 July 2020
(This article belongs to the Section Environmental Sustainability and Applications)
Abstract
:The development of the Xiong’an New Area is a crucial strategy for the next millennium in China. The ecosystem upstream of the Xiong’an New Area, serving for the development of the Xiong’an New Area, changed with land use changes. To analyze the contribution rate of the land use change to the ecosystem service value, we analyzed the land use changes of three small watersheds (7318.56 km2) upstream of the Xiong’an New Area based on a total of six phases of land use data from 1980 to 2015. Then, the ecosystem service value (ESV) was calculated using the equivalent factor method. The results showed that the construction land and arable land were the largest land use types that increased and decreased in the area of the study area, respectively. The grassland and construction land were the land use types with the largest transfer-out area and transfer-in area, respectively. The regulating services accounted for the largest proportion of total ESV among different ecosystem service functions, and the grassland and woodland accounted for the largest proportion of total ESV among different land use types. ESV in the study area fluctuated slightly from 1980 to 2015. The decrease of ESV mainly occurred in the surrounding areas of mountain towns, and the conversion of cultivated land to construction land was the main reason for the decrease of ESV in this area. The conversion of grassland to construction land had the largest contribution rate to the decrease of ESV in the study area, while the conversion of grassland to waters had the largest contribution rate to the increase of ESV. In conclusion, controlling the development of construction land and strengthening water resources’ protection may improve the ecosystem service value in the upstream Xiong’an New Area in the future.
1. Introduction
On 1 April 2017, the Chinese government officially announced the establishment of the Xiong’an New Area to centralize the relief of non-capital functions in Beijing. Xiong’an New Area is designed as a new urban area with a beautiful ecological environment and green ecological livability [1]. Compared with other new large cities in China, such as Shenzhen and Shanghai, the Xiong’an New Area has a larger “policy dividend”, which may lead to excessive urban population agglomeration and thus exceed the carrying capacity of regional resources and the environment [2,3]. Therefore, in addition to policy restrictions, improving the carrying capacity of resources and the environment of Xiong’an New Area is also an important measure to prevent such situations from happening. The upstream of Xiong’an New Area (the area studied in this paper) is the most important water supply and ecological security barrier area for Xiong’an New Area. The Chinese government requires the upstream of Xiong’an New Area to implement ecosystem protection and restoration projects, optimize the ecological security barrier system, strengthen the water source interconnection and enhance the function of vegetation retention, so as to improve the regional ecosystem quality, form a multi-source complementary water supply pattern, ensure the water supply safety and flood control capacity and improve the resources and environment carrying capacity of the downstream Xiong’an New Area [4]. In order to achieve this goal, it is necessary to understand the ecological environment status and its influencing factors in the upstream of Xiong’an New Area. The estimation of ecosystem service value (ESV) is an important means to study the current situation of the regional ecological environment [5].
Ecosystem functions refer variously to habitat, biological or system properties or processes of ecosystems [6]. Ecosystem products (such as food) and services (such as maintaining nutrient cycle) represent the benefits human populations derive, directly or indirectly, from ecosystem functions. For simplicity, we collectively refer to ecosystem products and services as ecosystem services [7]. According to the labor theory of value, ecosystem services are not valuable because they involve no human labor time, so there is no value. However, according to the utility theory of value, ecosystem services meet two conditions: one is the ecosystem service with utility in humans, the second is the ecosystem service is scarce, therefore ecosystem services have a utility value [8]. A large part of the contributions to human welfare by ecosystem services is of a purely public goods nature. They accrue directly or indirectly to humans without passing through the monetary economy at all. In many cases, people are not even aware of them. Examples include fresh water, clean air, and aesthetic landscape [9]. Therefore, the ESV cannot be determined based on observable or indirect market behavior. Many of the valuation techniques used in the related studies are based, either directly or indirectly, on attempts to estimate the “willingness-to-pay” of individuals for ecosystem services [10]. On the basis of comprehensive previous research, Costanza et al. used the “willingness-to-pay” method to formulate an ecological service value coefficient table per unit area of the ecosystem, and evaluated the global ESV [11]. The Chinese scholar Xie et al. modified the above table by using the willingness survey value assessment method and combining expert knowledge to obtain a value coefficient table that is consistent with China’s actual situation. Meanwhile, ecosystem services were divided into four primary types, namely provisioning services, regulating services, supporting services and cultural services, and 11 secondary types [12,13]. The change of ESV is affected by many factors, such as land use change, climate change and biodiversity [14,15]. Among all these factors, as the most direct reflection of human activities, land use change has been identified as one of the most important drivers of change in ESV [16].
Human activities influence ecosystems through different land use strategies, change ecological processes, and then affect ecosystem services. For example, the destruction of forests and grasslands by human beings not only leads to reduced biodiversity and fragile ecosystem services, but also reduces the erosion resistance of soils, weakening related ecosystem services such as water conservation and soil conservation [17]. In the early studies on the impact of land use change on ESV, most of them focused on the impact of a single land use type change on ESV [18,19]. However, different transfers between land types can lead to differences in ESV changes [20]. For example, the conversion of grassland to forest land will increase ESV, while the conversion of grassland to farmland will reduce ESV. Therefore, clarifying the impact of different land use transfer types on ESV can further reveal the mechanism of land use change on ESV. Besides, in the current research on the impact of land use change on ESV, the research period is mainly concentrated after 2000, and the research time scale is short [21,22]. However, land use change will present different characteristics on short time scales and long time scales, and the degree of impact of land use change on ESV also varies at different time scales [23]. Therefore, it is necessary to study the impact of land use change on ESV on a long-term scale.
In this article, we analyze the land use change in the upstream of Xiong’an New Area from 1980 to 2015 and quantify the impact of land use change on the value of ecosystem services. This study is of great significance to the rational planning of land use patterns, macro-control of social and economic activities, and the scientific formulation of ecological environment management policies in the upstream of Xiong’an New Area.
2. Materials and Methods
2.1. Study Area
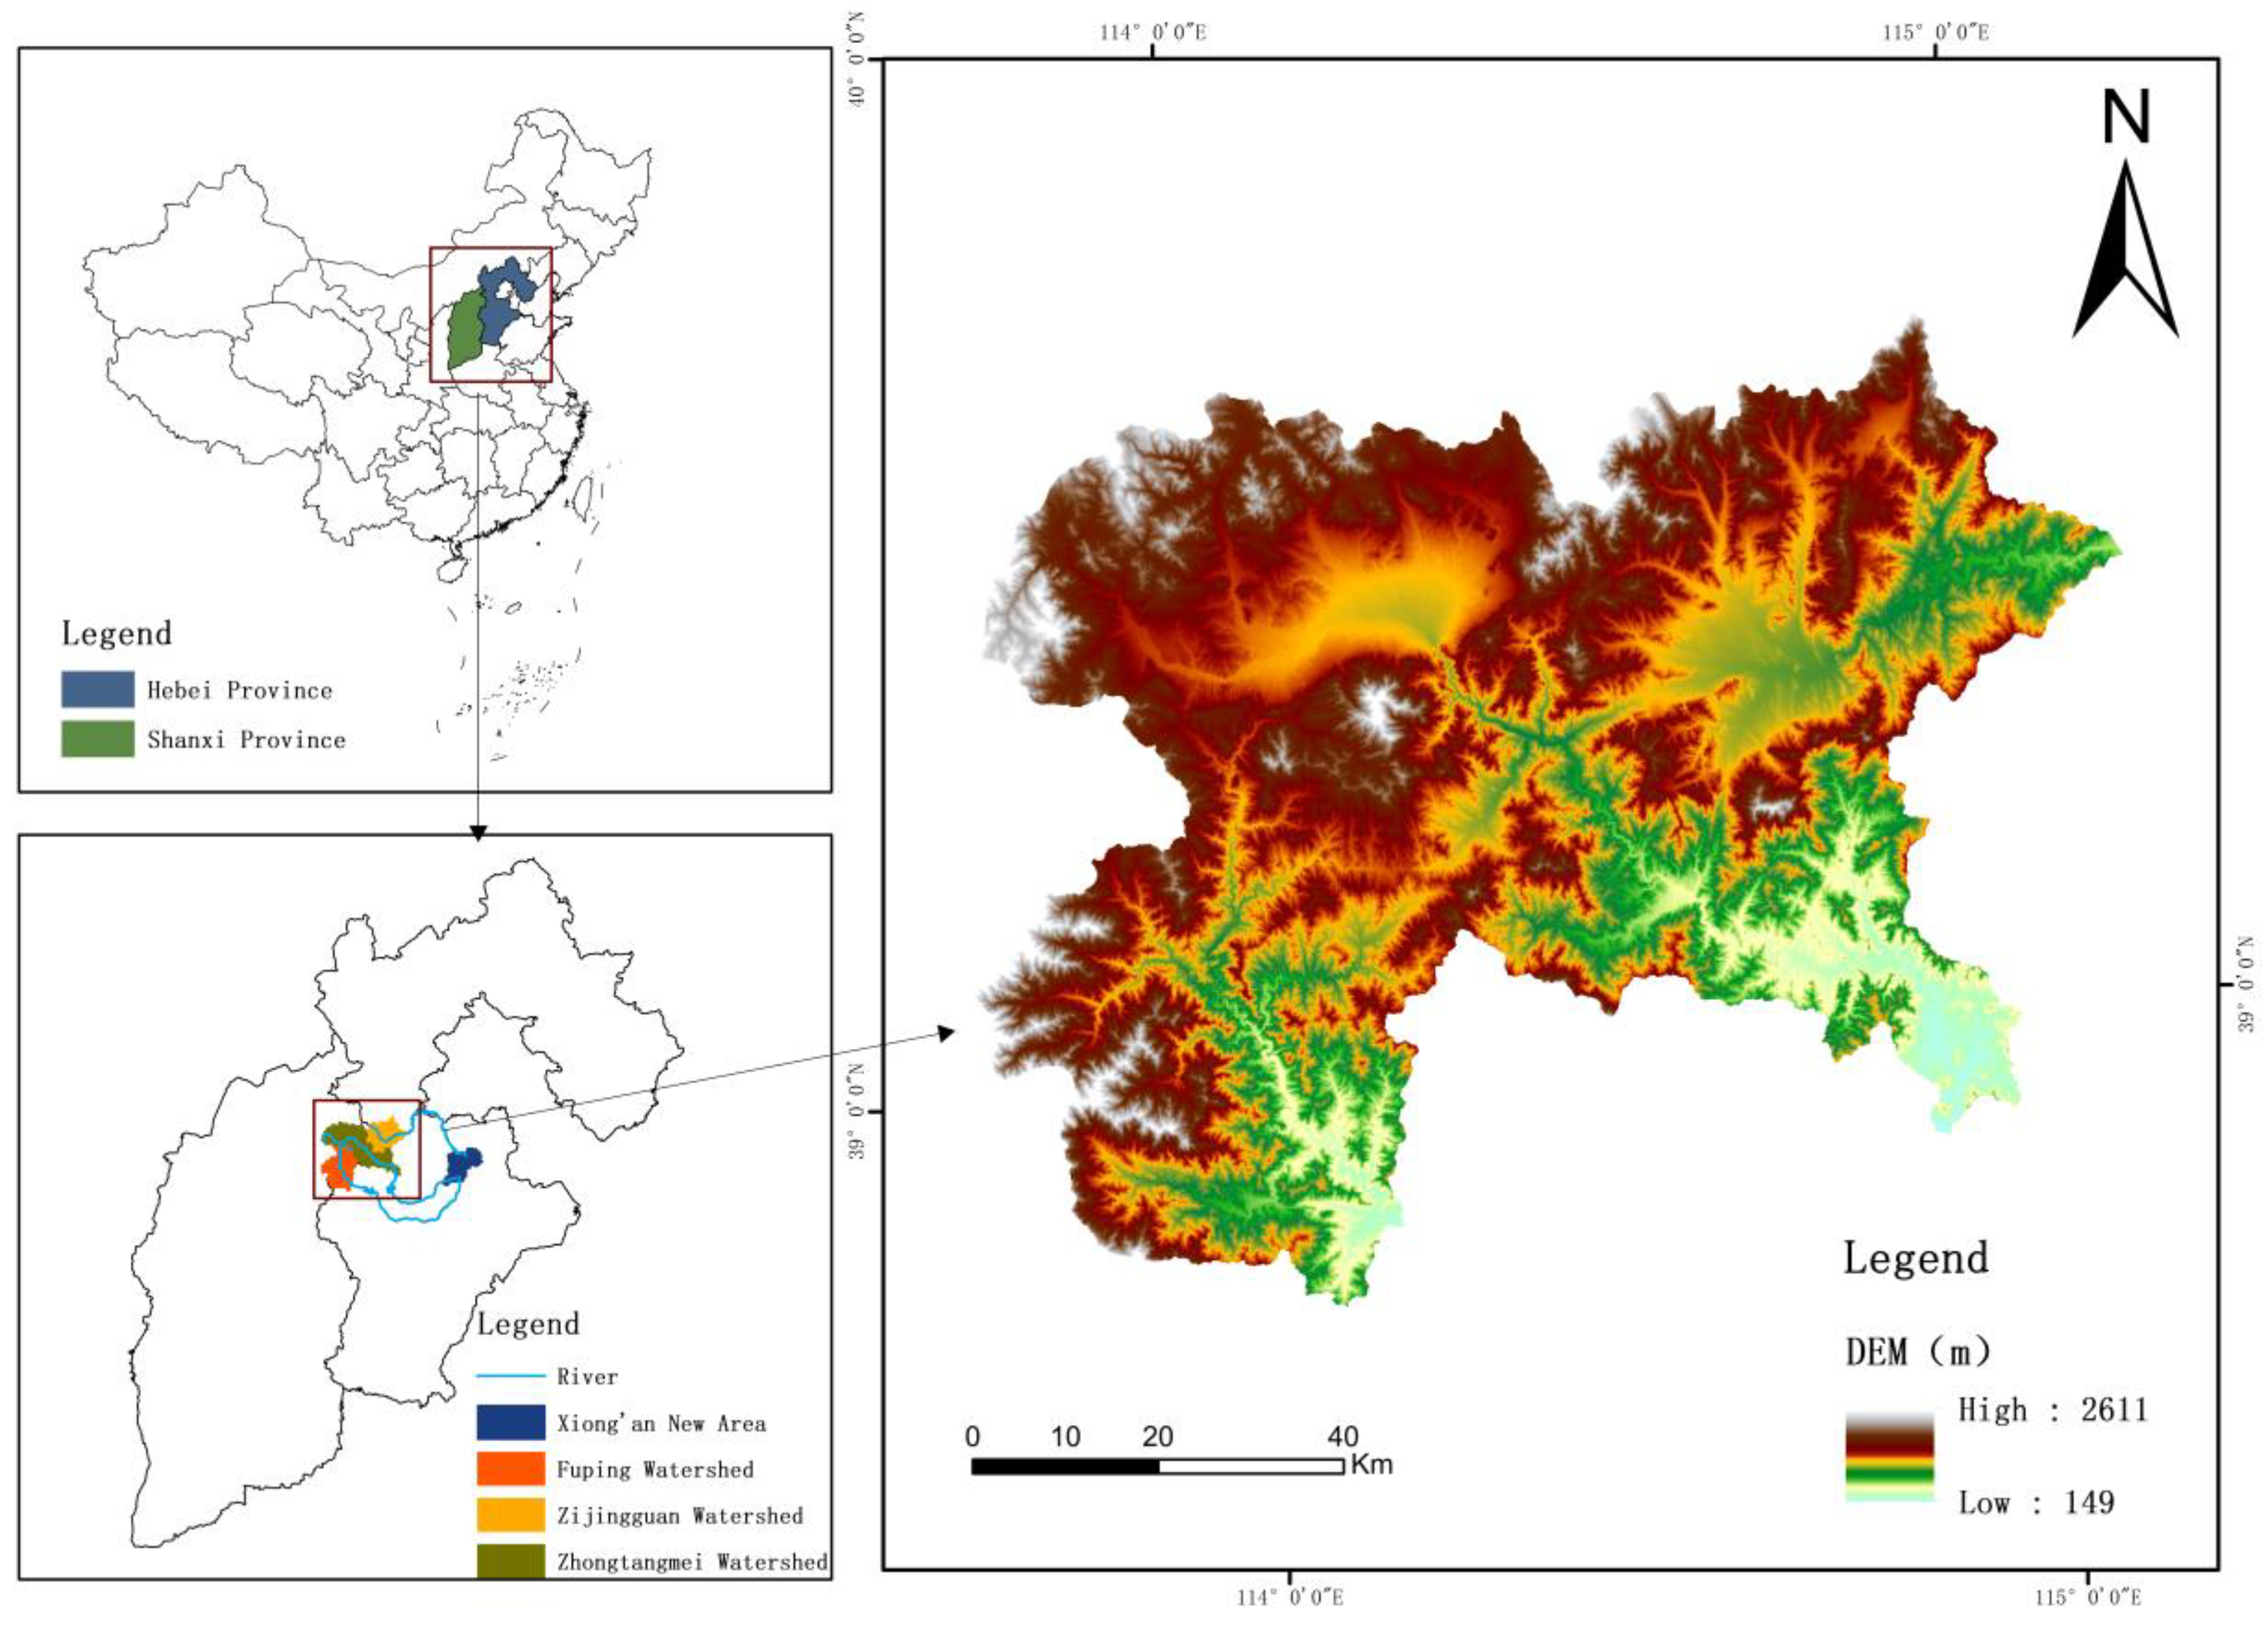
The study area included three small watersheds controlled by three hydrological stations in the upstream of Xiong’an New Area, with a total area of 7318.56 km2. It stretches across Hebei and Shanxi provinces, and the geographical coordinates are distributed between 38° 76′–39° 71′ N and 113° 64′–115° 18′ E (Figure 1). The mean elevation is 1109 m and the mean slope is around 19°. The area belongs to the mountainous and hilly area, with high terrain in the northwest and low terrain in the southeast. The area is a temperate monsoon region with an average annual temperature of 7.4 to 12.8 °C and an annual precipitation of 550 to 790 mm [24]. Affected by the monsoon, the region’s precipitation is uneven throughout the year. In total, 70% of precipitation occurs in summer and makes rivers prone to flood [25].
The study area is located within the scope of ecological engineering construction such as the Three-North Shelter Forest Project and Taihang Mountain Greening Project. The construction of ecological projects has changed the land use pattern in the study area. Besides, the study area is an important ecological function support area and a water conservation function area, and also belongs to poor areas with slow economic development. Coordinating the contradiction between economic development and ecological environmental protection has become the main task for the future development of the study area.
2.2. Data Sources
The data used in this research mainly included the land use data and socio-economic data. The land use data obtained from the Resource Environmental Data Center of the Chinese Academy of Sciences, including six periods of land use data in the upstream of Xiong’an New Area in 1980, 1990, 2000, 2005, 2010 and 2015. The data is based on Landsat TM/ETM remote sensing images as the main data source and is generated by manual visual interpretation. After a field investigation, the accuracy of the interpretation of the first-class land use type reached over 93% [26]. According to the research needs, the reclassification function of AcrMap10.1 software is used to divide the land use into six main categories: arable land, woodland, grassland, waters, construction land, and unused land. Socio-economic data contains a grain sown area and grain production, which is obtained from the China County Statistical Yearbook and the National Economic and Social Development Statistics. This work was guided on ‘‘Observation Methodology for Longterm Forest Ecosystem Research’’ of the National Standards of the People’s Republic of China (GB/T 33027-2016).
2.3. Research Methods
2.3.1. Analysis of Land Use Transfer Characteristics
The land use transition matrix can fully reveal the evolution process of land use type patterns by quantitatively describing the transformation between each land use type in a certain time unit [27]. We established a land use transition matrix using the spatial analysis function in ArcMap10.1. The codes for arable land, woodland, grassland, waters, construction land and unused land were 1, 2, 3, 4, 5 and 6, respectively. The formula is as follows:
where N is the new map unit formed by the land use code during the study stage, A is the land use map unit in the pre-study stage and B is the land use map unit in the later stage of the study.
2.3.2. Estimating the Value of Ecosystem Services
The estimation method of ecosystem service value (ESV) was based on the unit area value equivalent factor (equivalent factor method), which was widely used in the estimation of ESV [11]. The construction of the value equivalent factor table is a prerequisite for the estimation of ESV using the equivalent factor method. In this study, we based our table on the table of value equivalent factors proposed by Xie et al. and modified the value equivalent factors according to the actual situation in the study area [13]. Specifically, the arable land, waters, and unused land are selected from the basic equivalent values of dry land, river systems, and bare land, respectively. The basic equivalent values of woodland and grassland were determined based on the area ratios of coniferous and shrub forests (1:1) and grasslands and shrubs (1:2), respectively [28]. The basic equivalent value of construction land is not calculated in the value equivalent factor table. We determined that the base equivalent value of the construction land was 0 according to related research [29,30]. Then, we settled the correction coefficient for ESV of one standard equivalent factor as 0.70, which was the ratio of grain yield per unit area in the study area (3495.80 kg/hm2) to those in the whole country (4973.60 kg/hm2) in 2010. Therefore, the revised ESV of one standard equivalent factor in the study area was 2394.33 yuan/hm2. According to the revised value equivalent factor table and the ESV of one standard equivalent factor, we calculated the value coefficient (VC) of ecosystem services per unit area in the study area (Table 1).
The calculation formula of ESV is as follows [31]:
where, and refer to the ESVs of land use type , ecosystem service function and the entire ecosystem, respectively; is the area of land use type ; is the value coefficient for land use type with the ecosystem service function j; and represents the value coefficient of land use type.
2.3.3. Ecological Contribution Rate of Land Use Change
The contribution rate of land use changes for ecosystem service values referring to the change rate of ecosystem service values caused by the conversion of class land use type to class land use type [20]. Its expression is:
where is the contribution of land use change to the ecosystem service value; and represent the value coefficients of land use types and, respectively; and is the area from land use typeto land use type during the study period.
2.3.4. Sensitivity Analysis of Ecological Service Value
Due to the uncertainty in the selection of the value coefficient, we conducted a sensitivity analysis to examine the creditability of the results. The coefficient of sensitivity (CS) was used to analyze the dependence of the value of ecosystem services (ESV) on changes in the value coefficient (VC) over time [32]. Its expression is:
where CS is the coefficient of sensitivity; represents the value coefficient after the adjustment of land use type ; represents the value coefficient before the adjustment of land use type ; represents the ESV of the entire ecosystem in the study area after VC adjustment; represents the ESV of the entire ecosystem in the study area before VC adjustment; and when CS > 1, it indicates that ESV is elastic to VC, and the results are less credible. When CS < 1, it indicates that ESV is inelastic to VC, and the results are more reliable. This article adjusts the VC of each land use type in the study area by (±) 50% to calculate CS.
3. Results
3.1. Analysis of Land Use Change
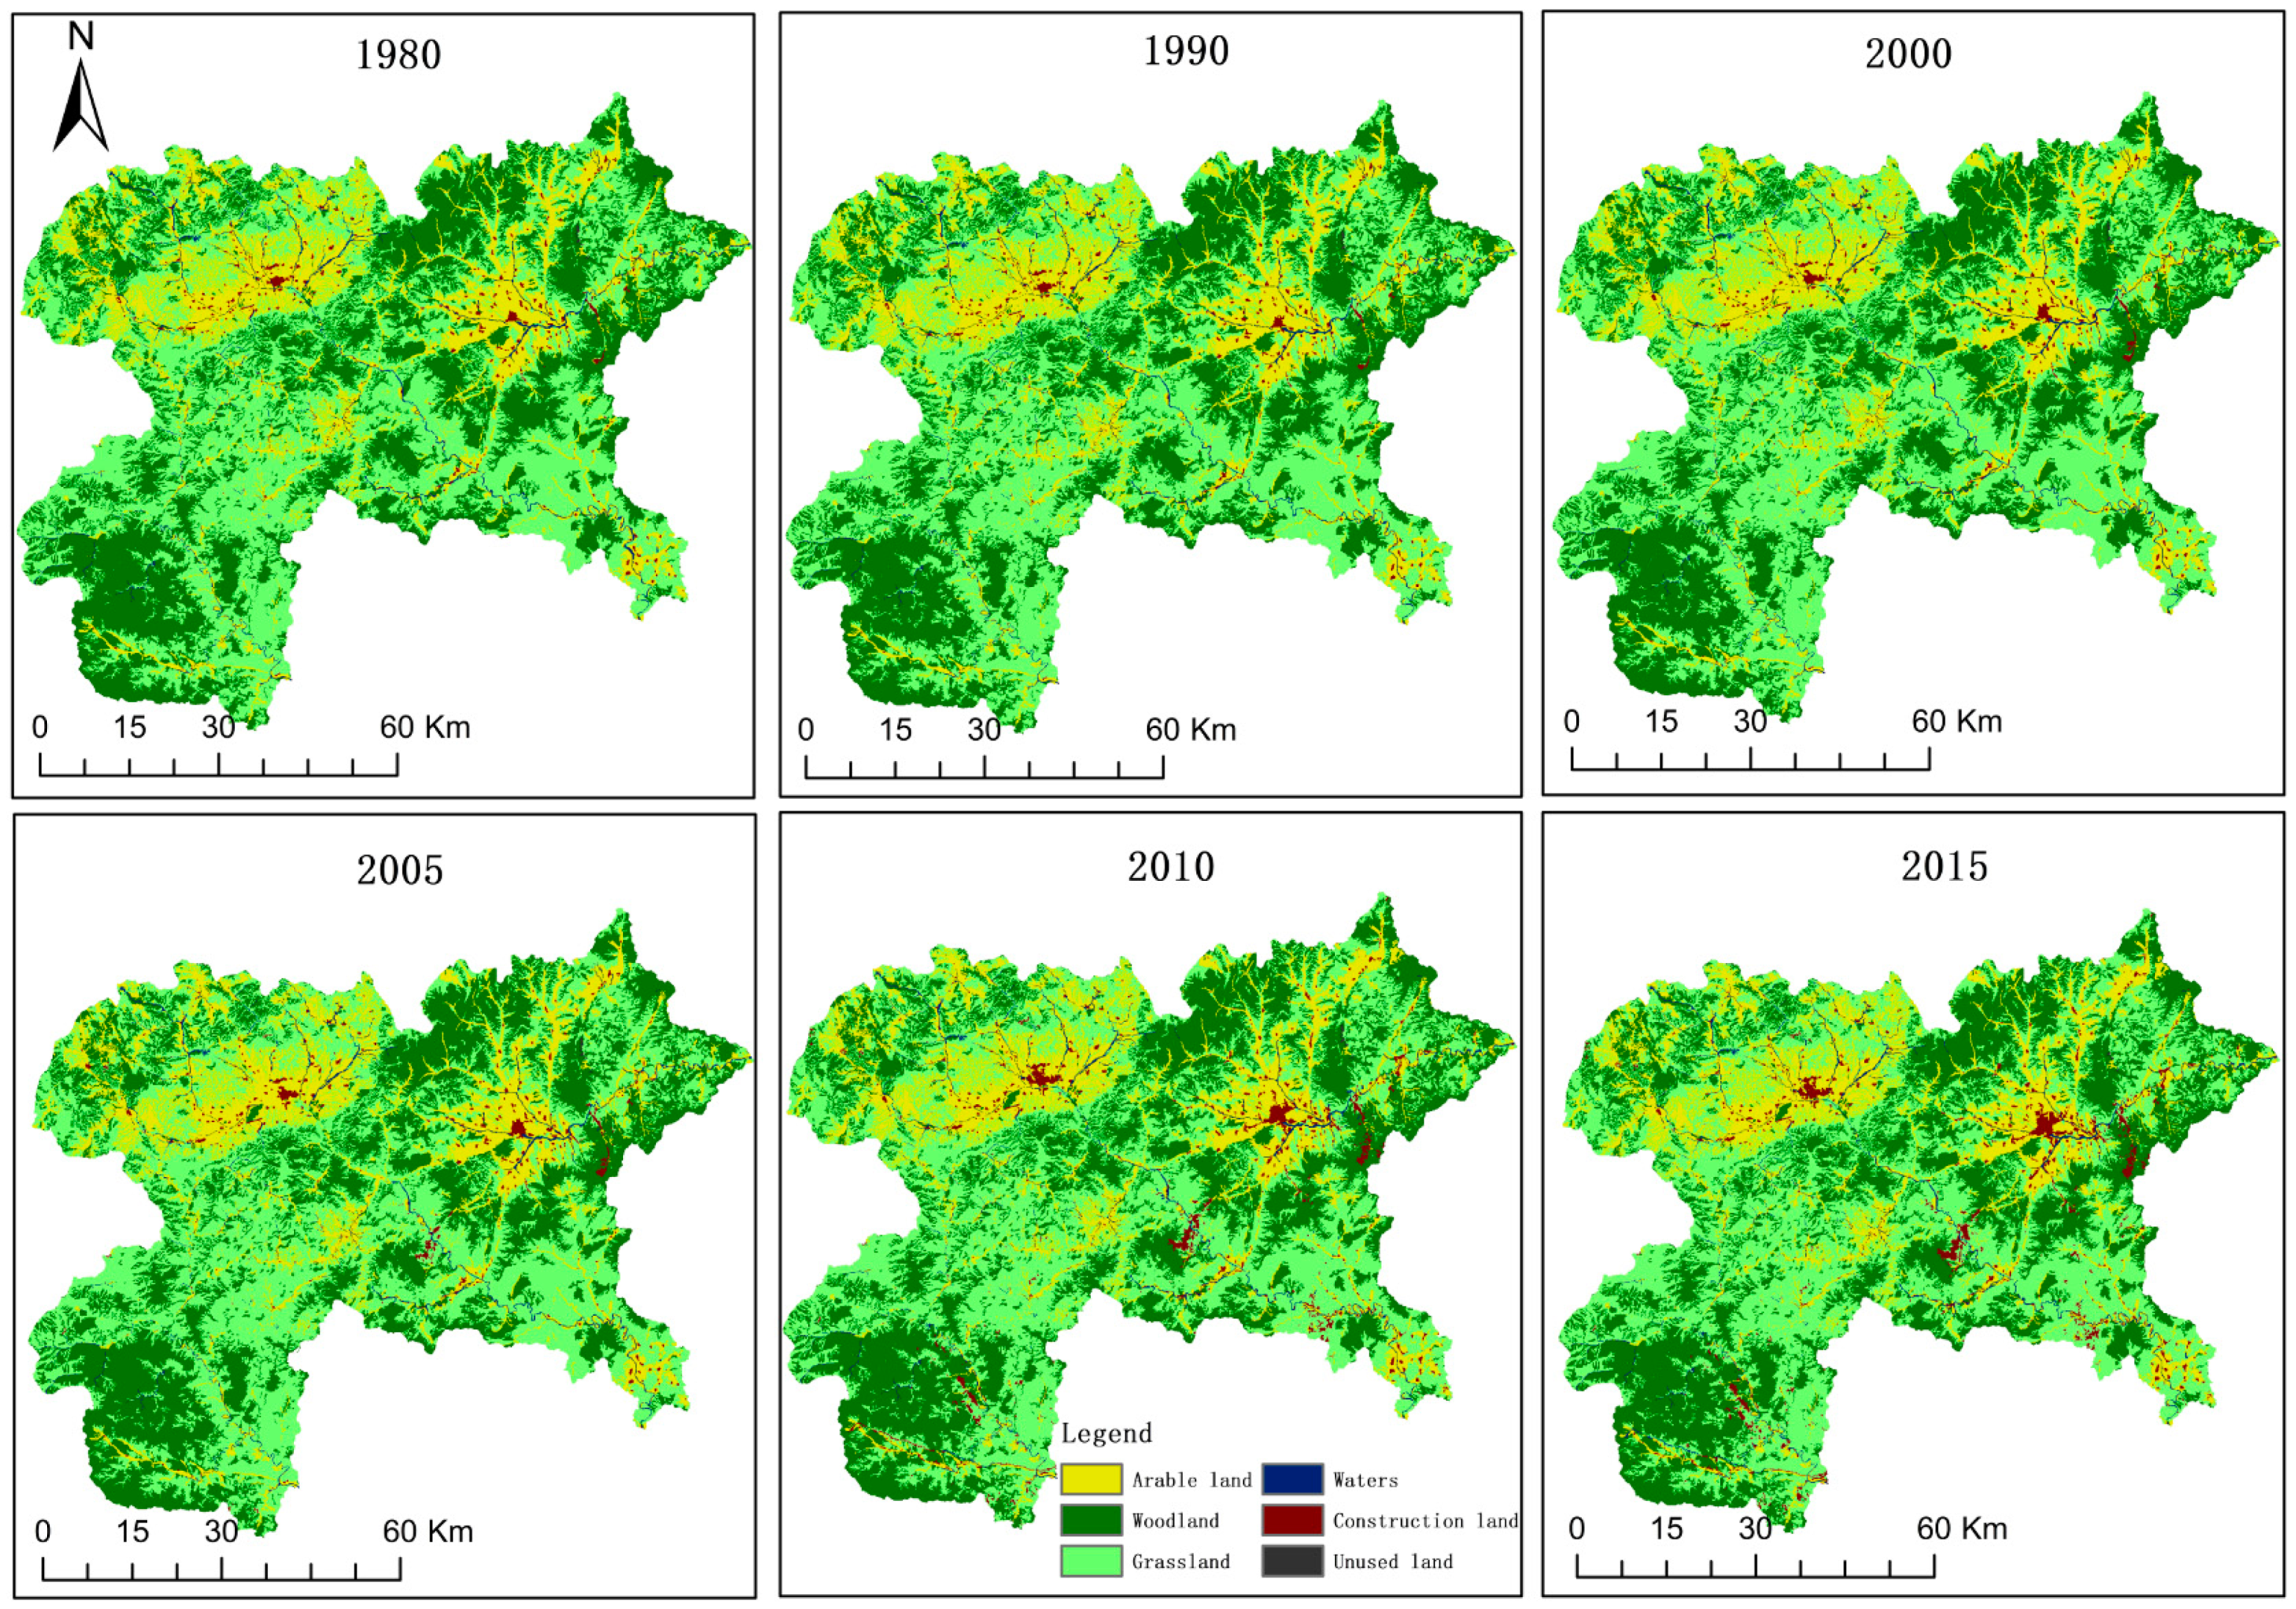
From 1980 to 2015, grassland, woodland and arable land occupied the first three positions among all land use types, amounting to 96.41% in 2015 and 97.83% in 1980 of total area (Table 2 and Figure 2).
Up to 2015, the area of construction land and waters added 104.38 km2 and 1.33 km2, with an increasing proportion of 174.98% and 1.37%, respectively (Table 2). On the contrary, the arable land, woodland, grassland and unused land showed a reduction of 34.37 km2, 4.82 km2, 65.83 km2 and 0.7 km2, with decreasing proportions of 2.98%, 0.19%, 1.87% and 44.03%, respectively (Table 2).
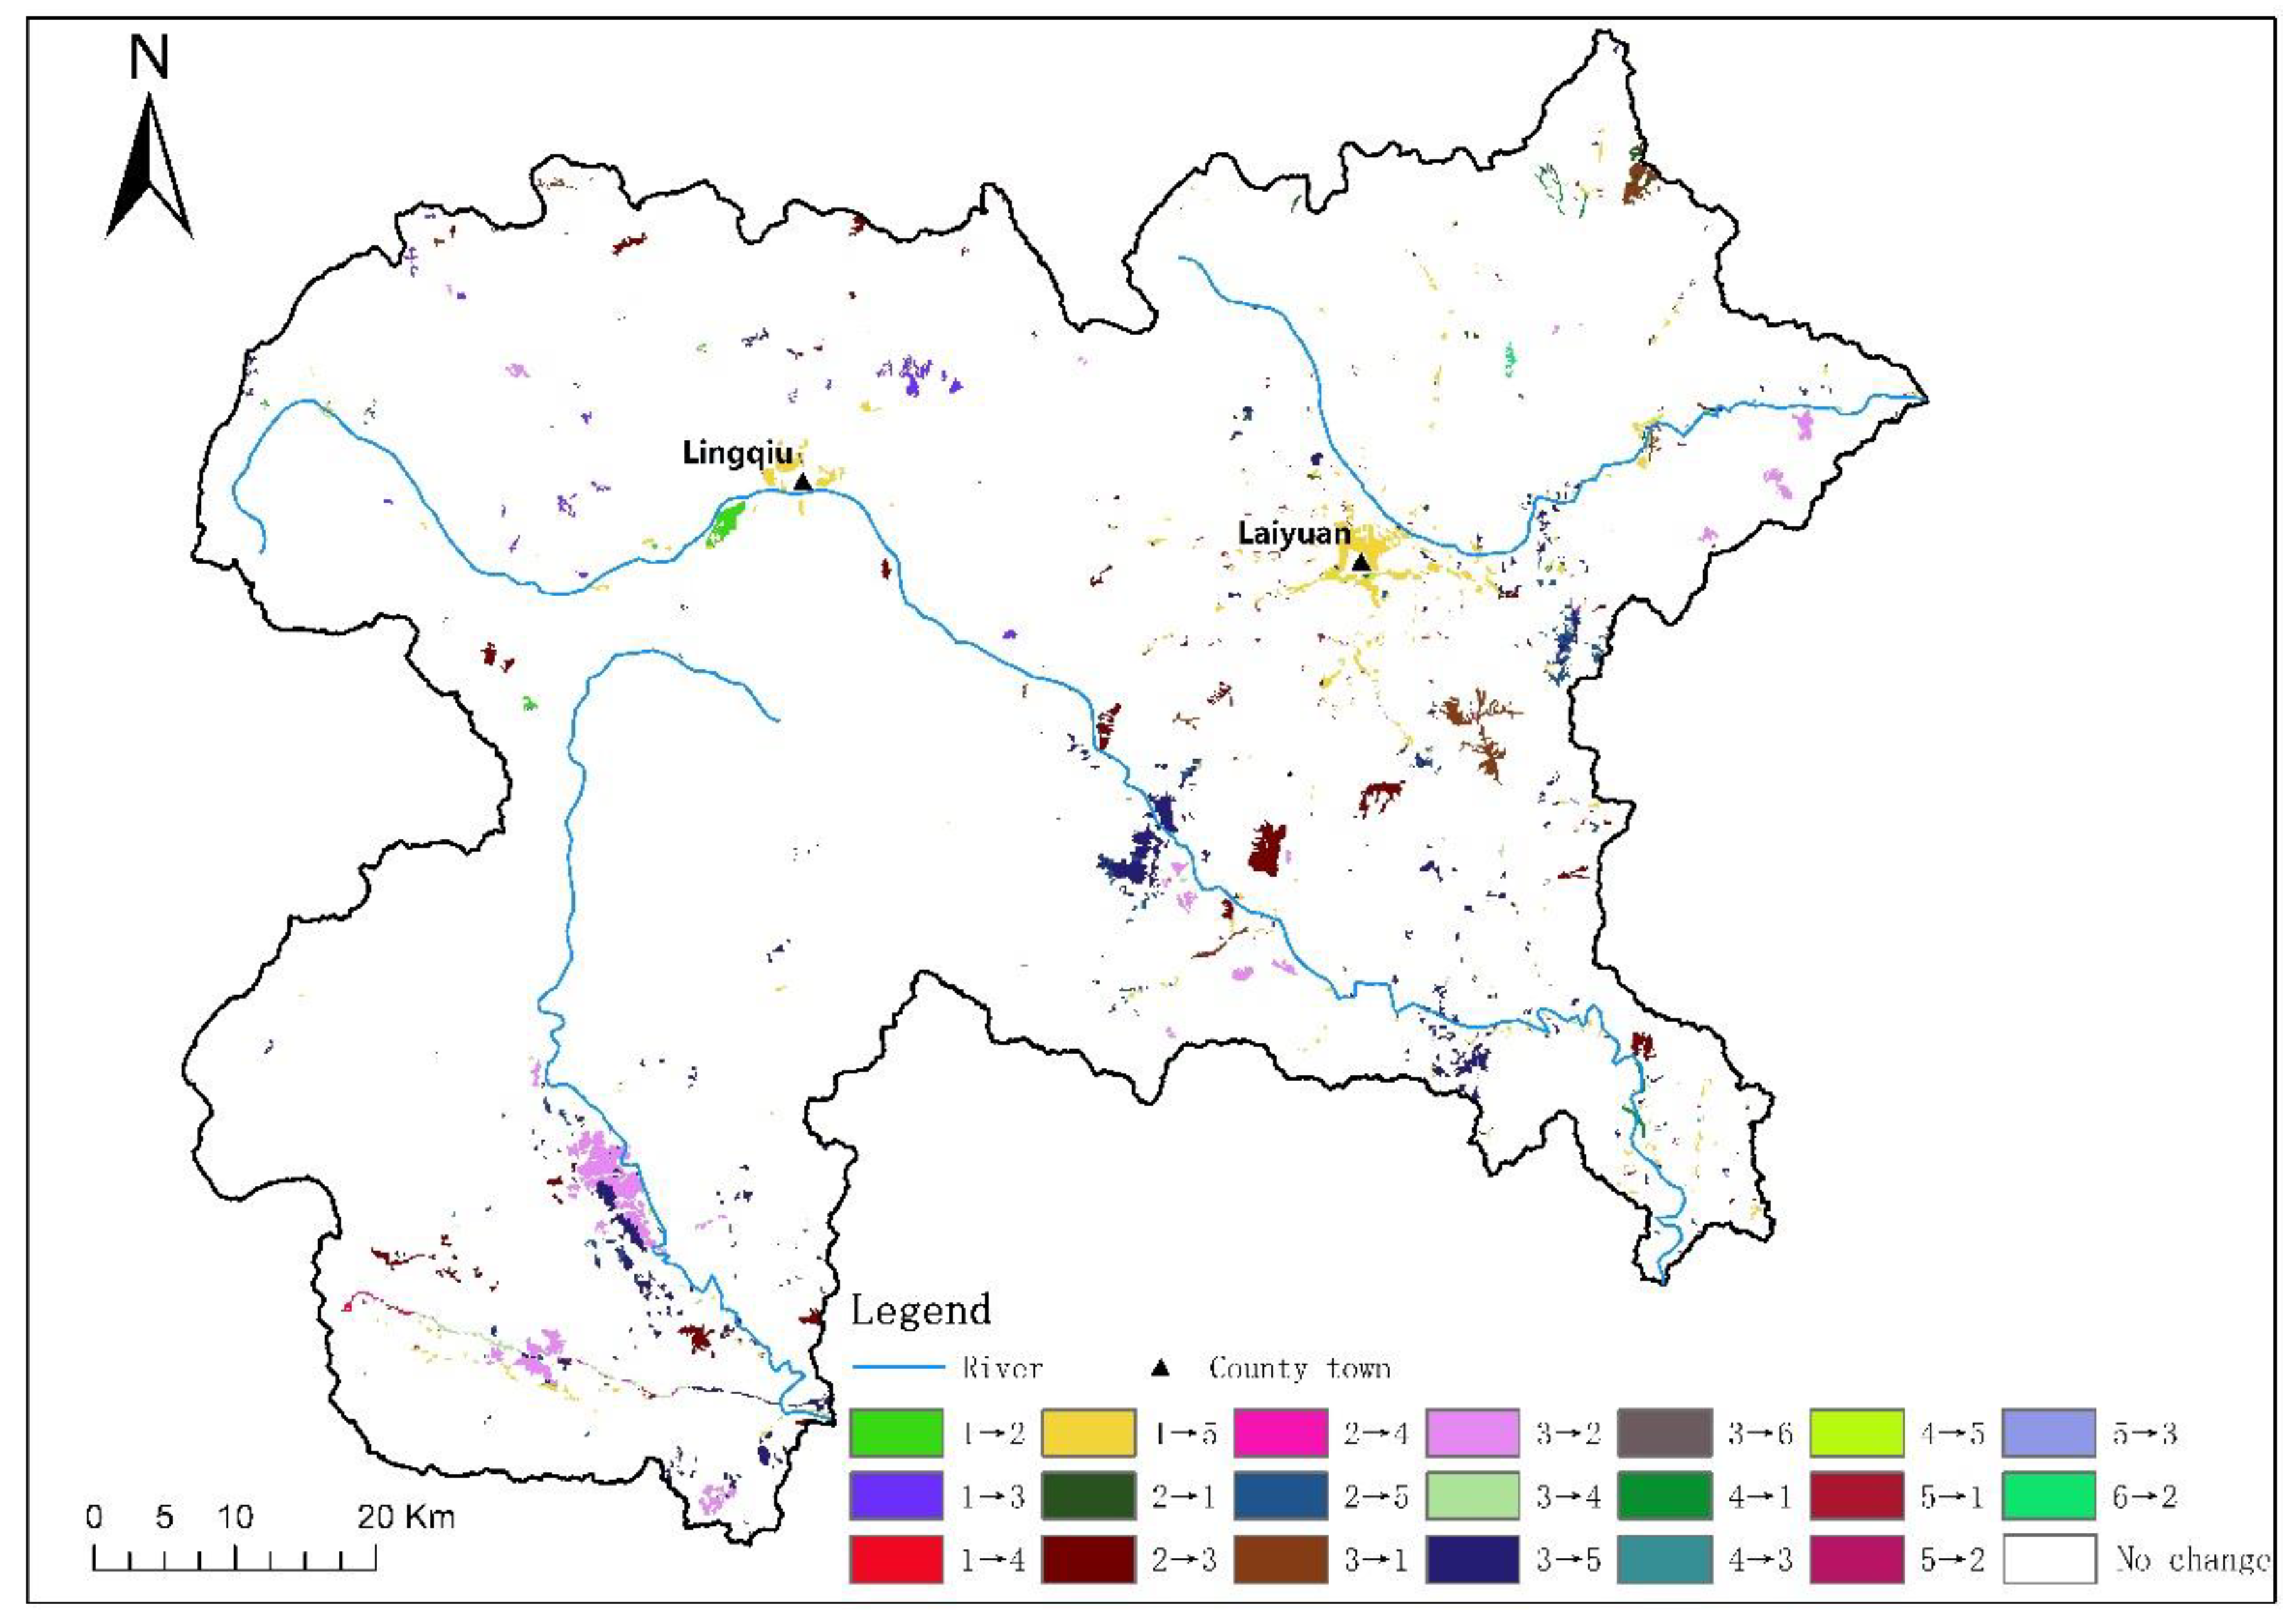
From 1980 to 2015, there were 20 types of land use transfer, which accounted for 2.99% of the study area with a total area of 218.59 km2 (Table 3 and Figure 3). Among them, the grassland and unused land accounted for the largest area and proportion in the transfer-out situation with the value of 105.65 km2 and 50.94%, respectively (Table 3). The construction land was responsible for the largest transfer-in situation by the increasing area of 109.29 km2 (Table 3). The conversion from grassland to construction land occurred at the sides of the river with an area of 52.16 km2, accounting for most of the area of grassland transferred out and construction land transferred in (Figure 3). The area of arable land converted to construction land accounted for 71.16% of the area of arable land transferred out and 39.52% of the area of construction land transferred in, mainly distributed around the Laiyuan County town and Lingqiu County town in the study area (Figure 3). The area converted from waters to arable land and construction land was 4.23 km2 and 1.61 km2, accounting for 59.20% and 37.97% of the area of waters transferred out, respectively (Table 3).
3.2. Analysis of Ecosystem Service Value
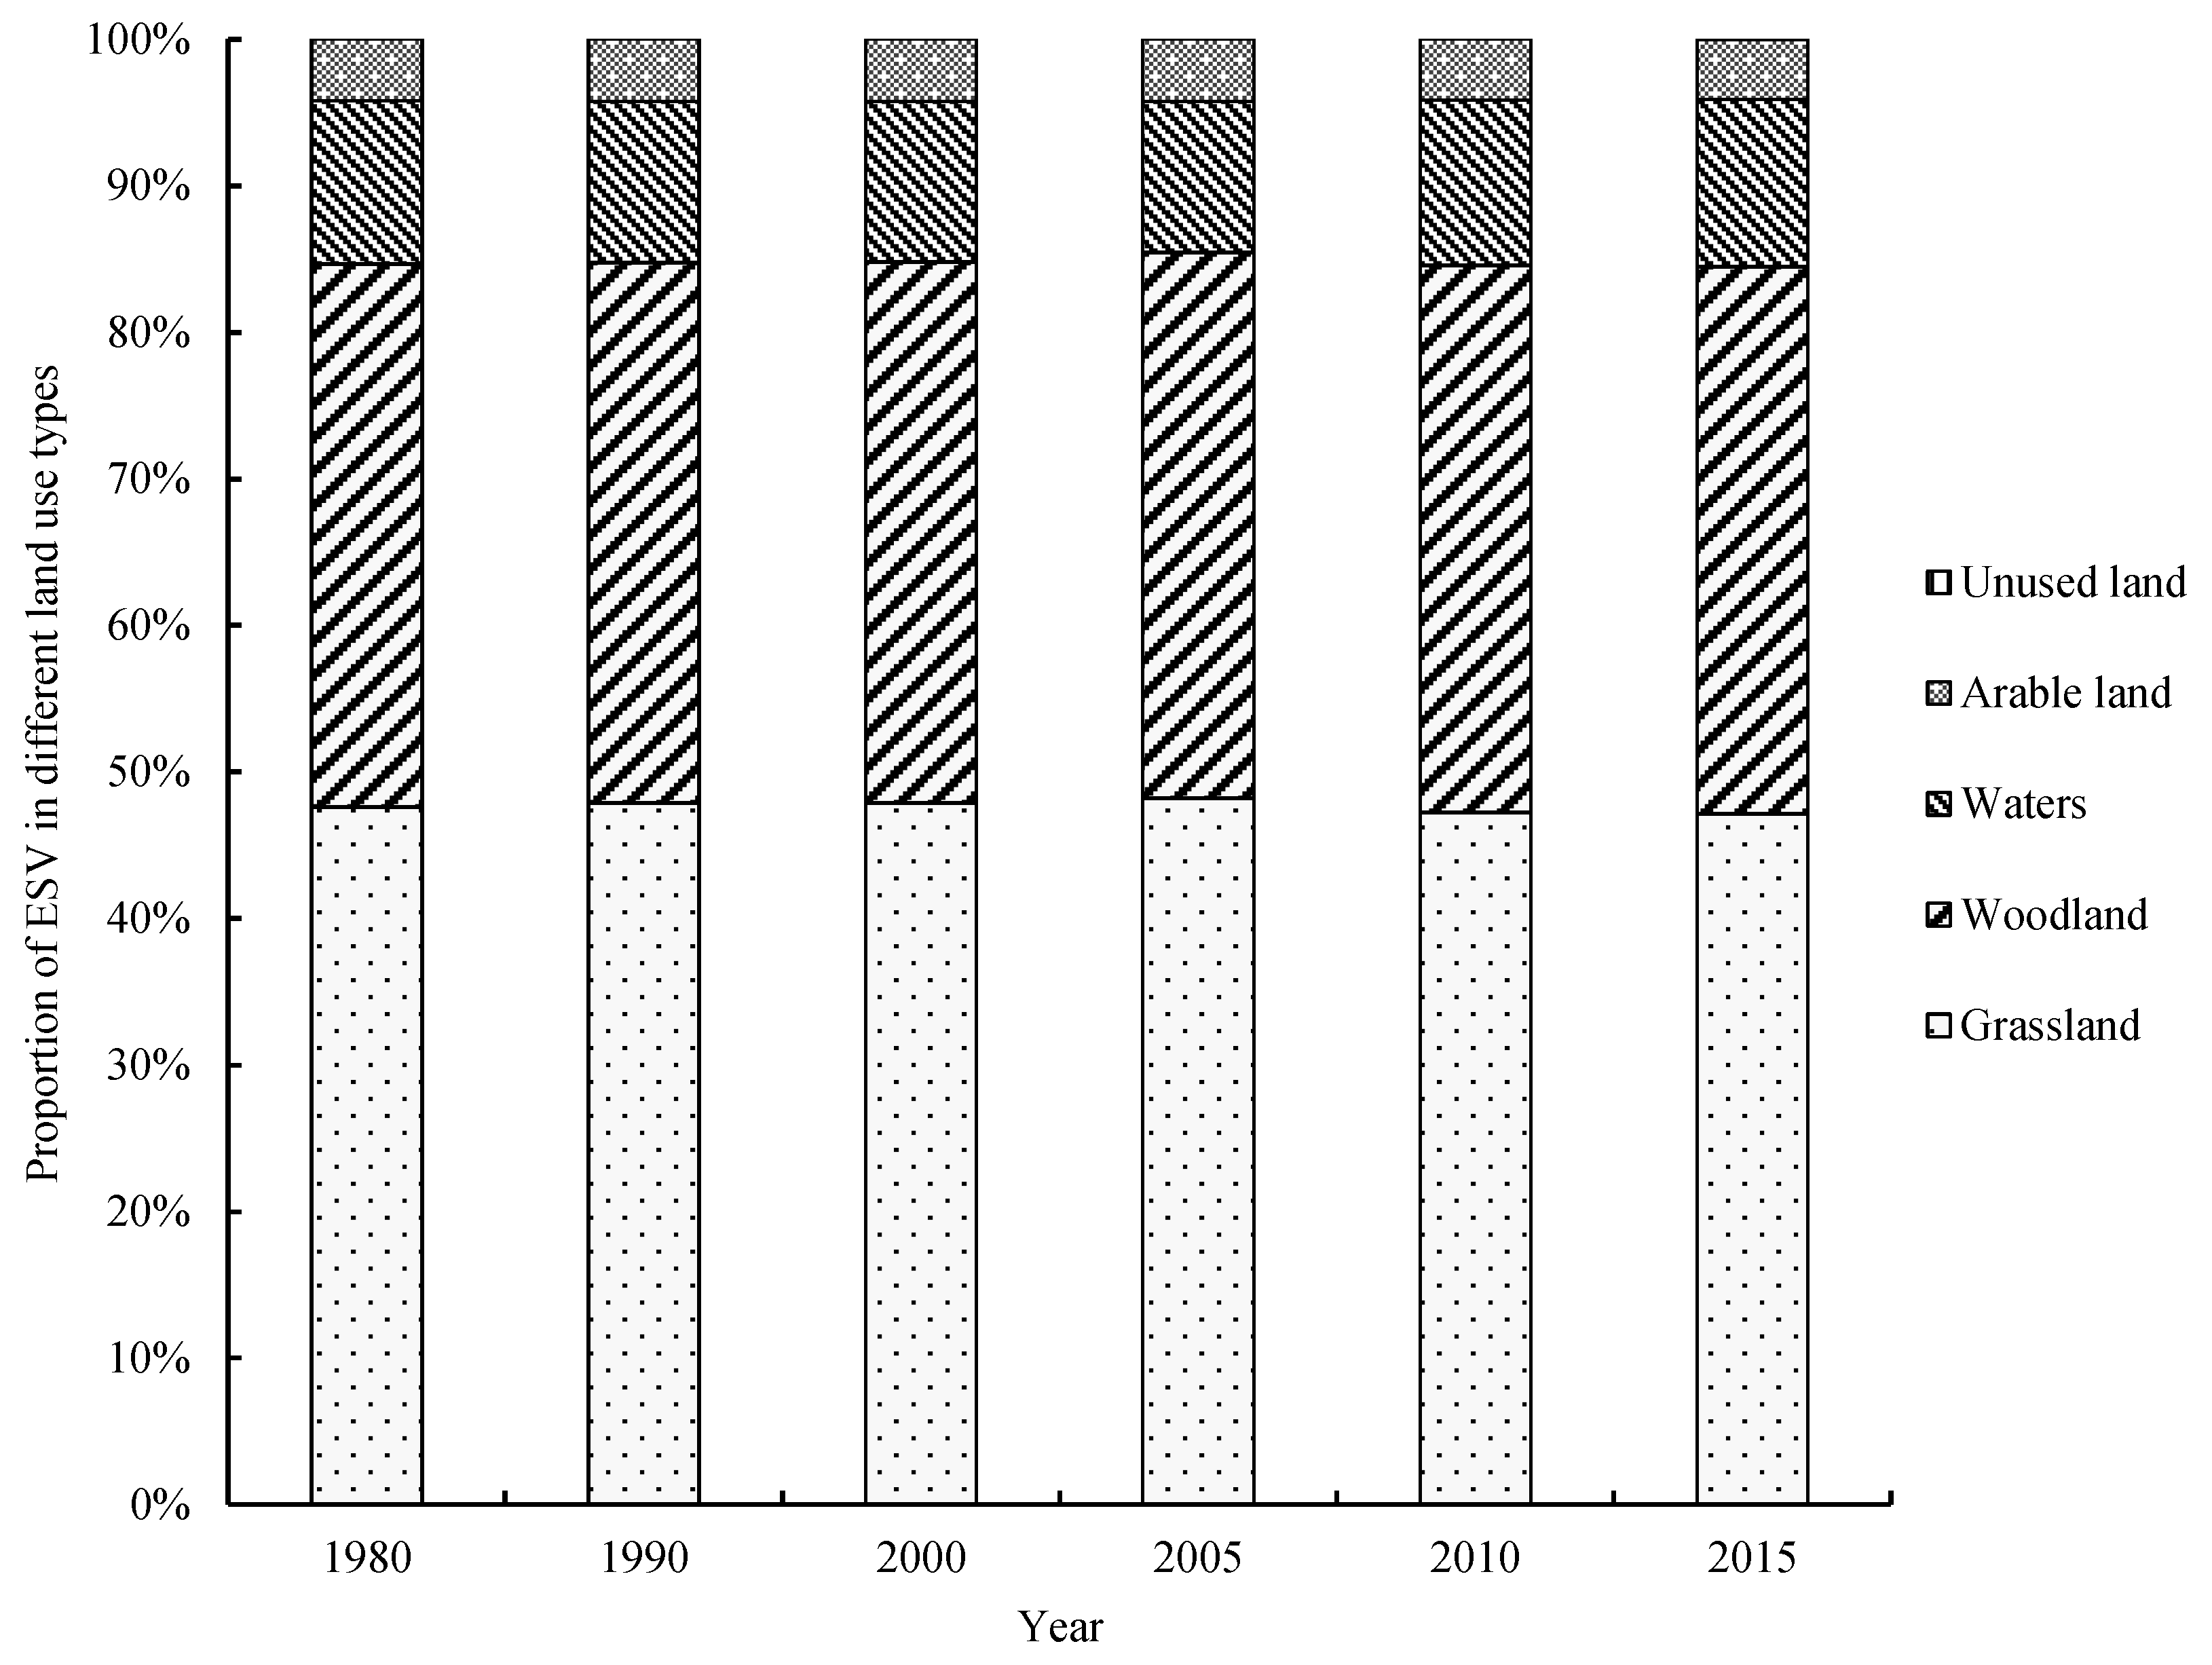
The ecosystem service value (ESV) of the study area remained stable from 1980 to 2015, with a slight downward trend (Table 4). Around 66.52% in 2005–66.81% in 2015 of total ESV was regulating services value dominated by hydrological regulation and climate regulation (Table 4). The supporting services value, provisioning services value and cultural services value accounted for 21.65% in 2015–21.89% in 2005, 7.28% in 2015–7.31% in 2000, and 4.25% in 2015–4.29% in 2005 of total ESV, respectively (Table 4). In addition, an average of 47.66%, 37.14% and 10.99% of the total ESV was provided by grassland, woodland and waters, respectively. The ESV was provided by residual land use types of less than 5% (Figure 4).
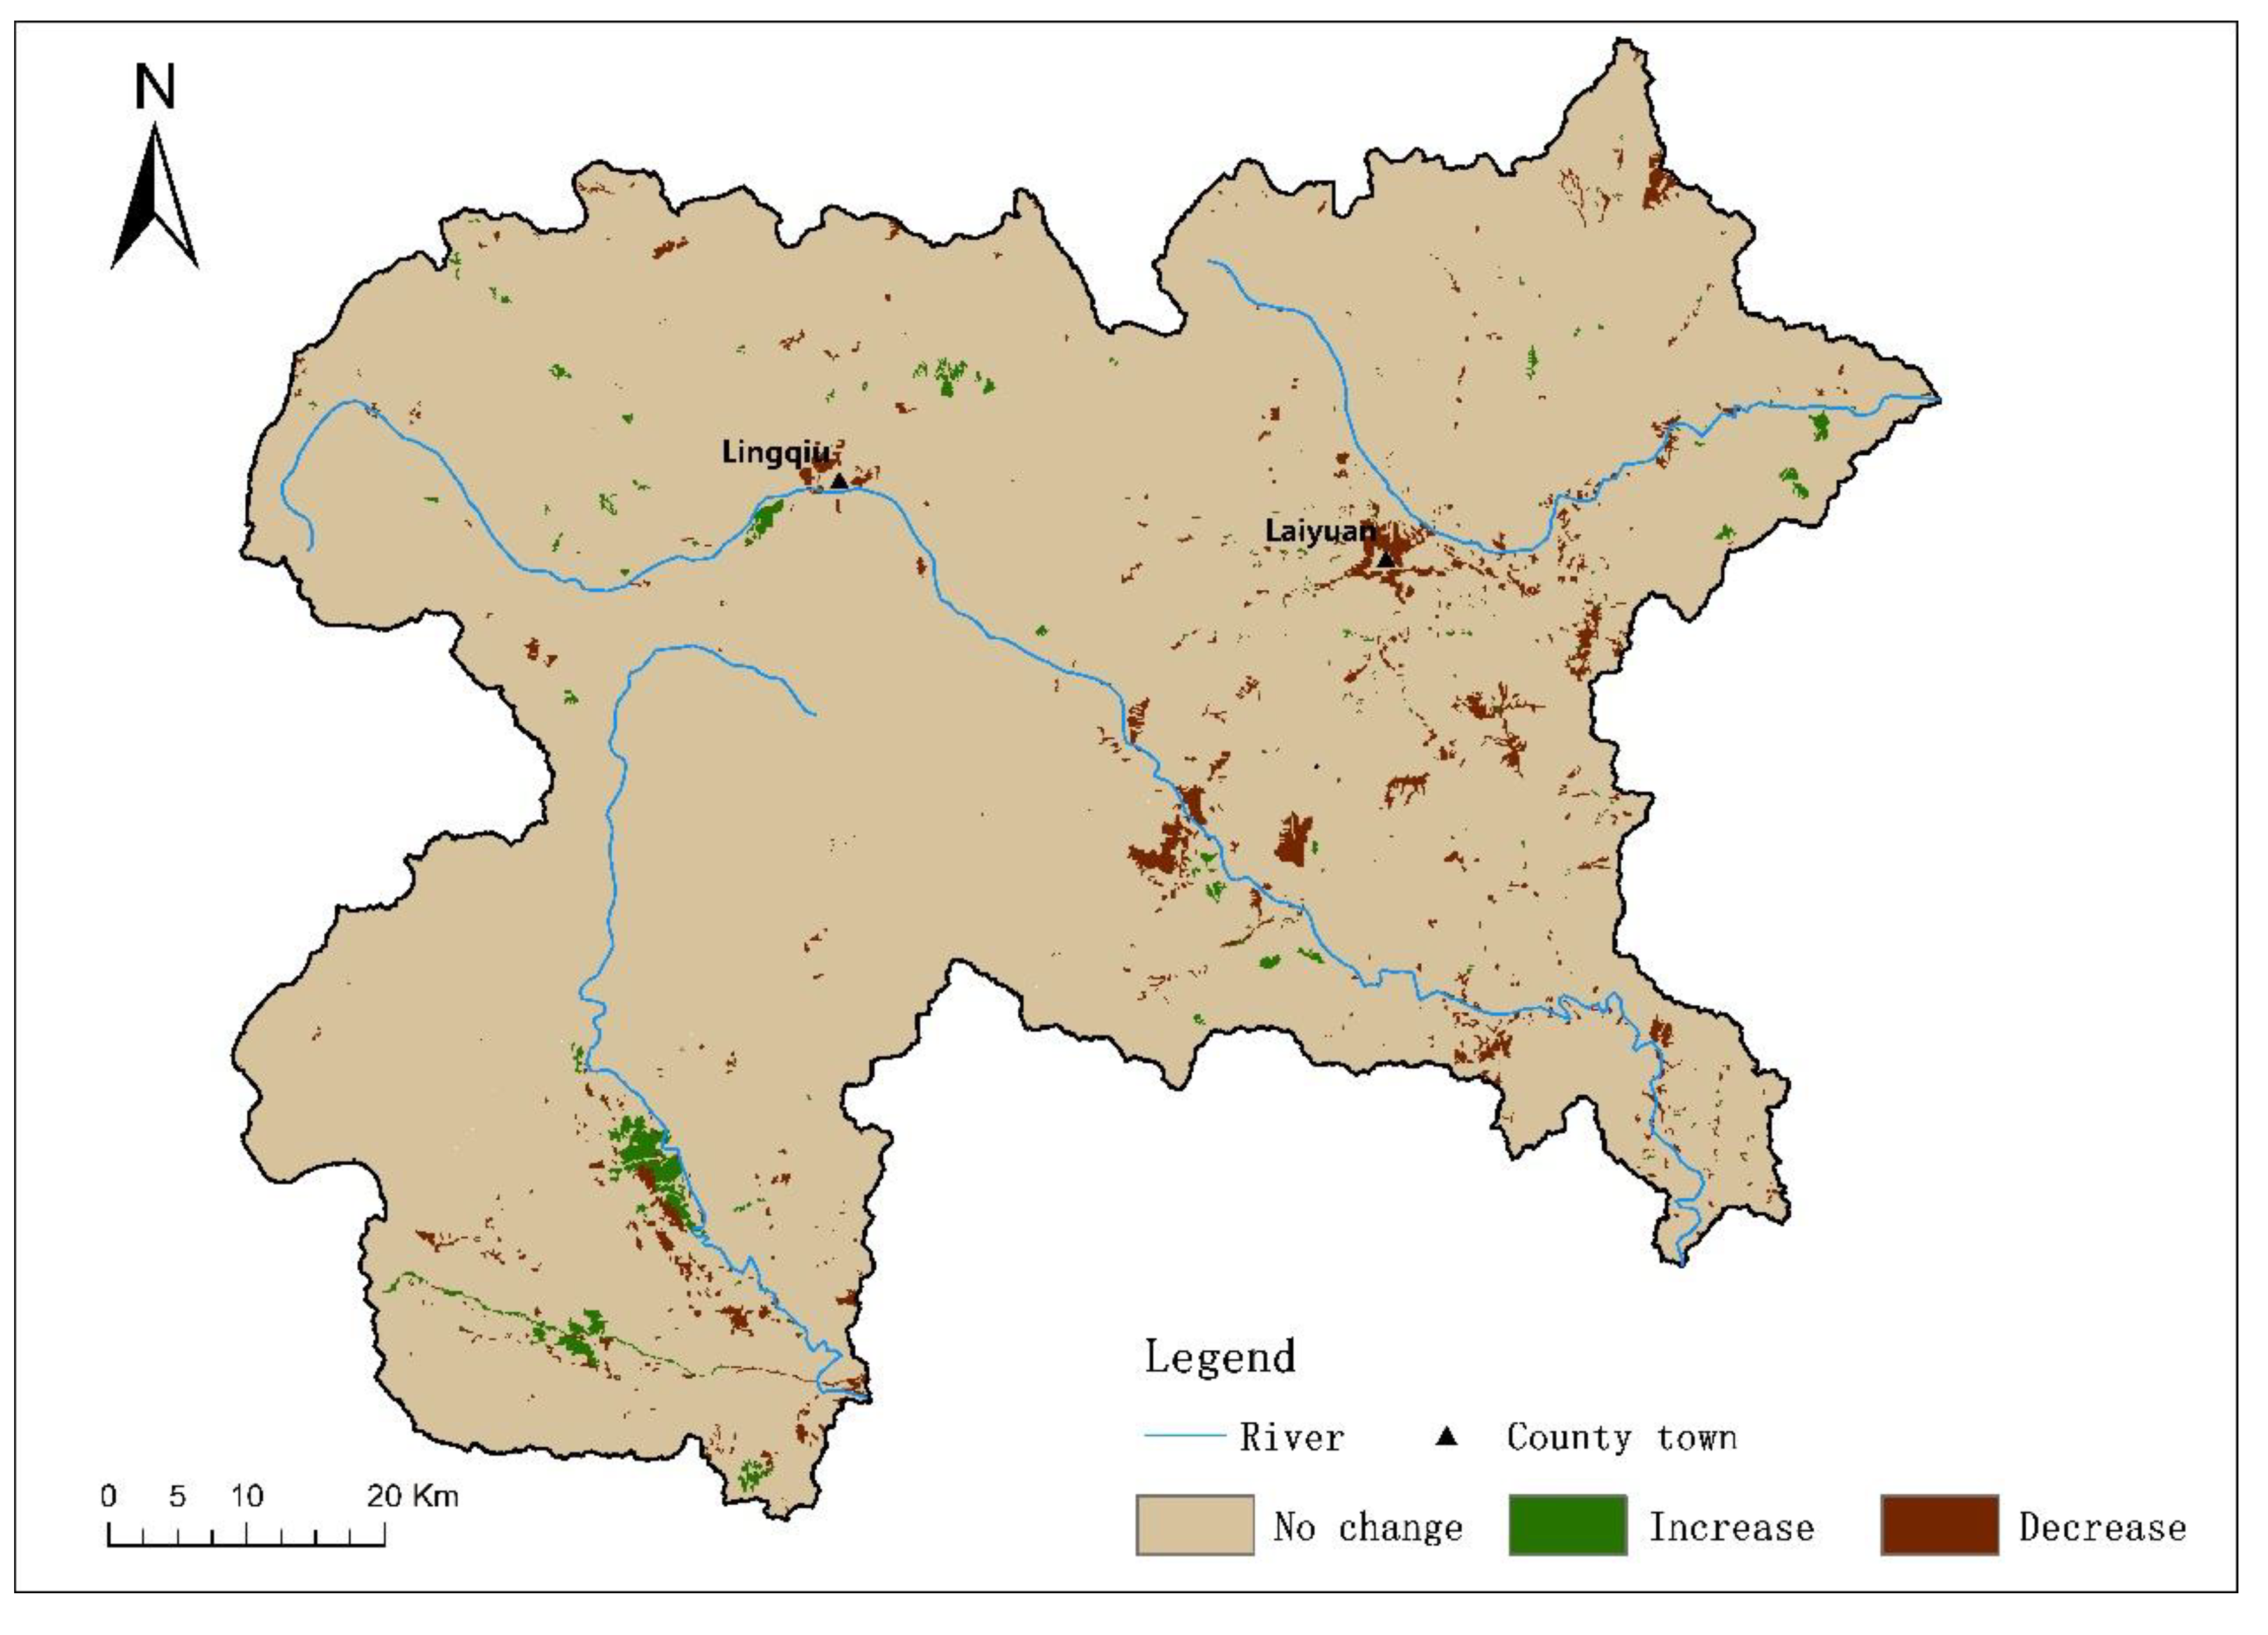
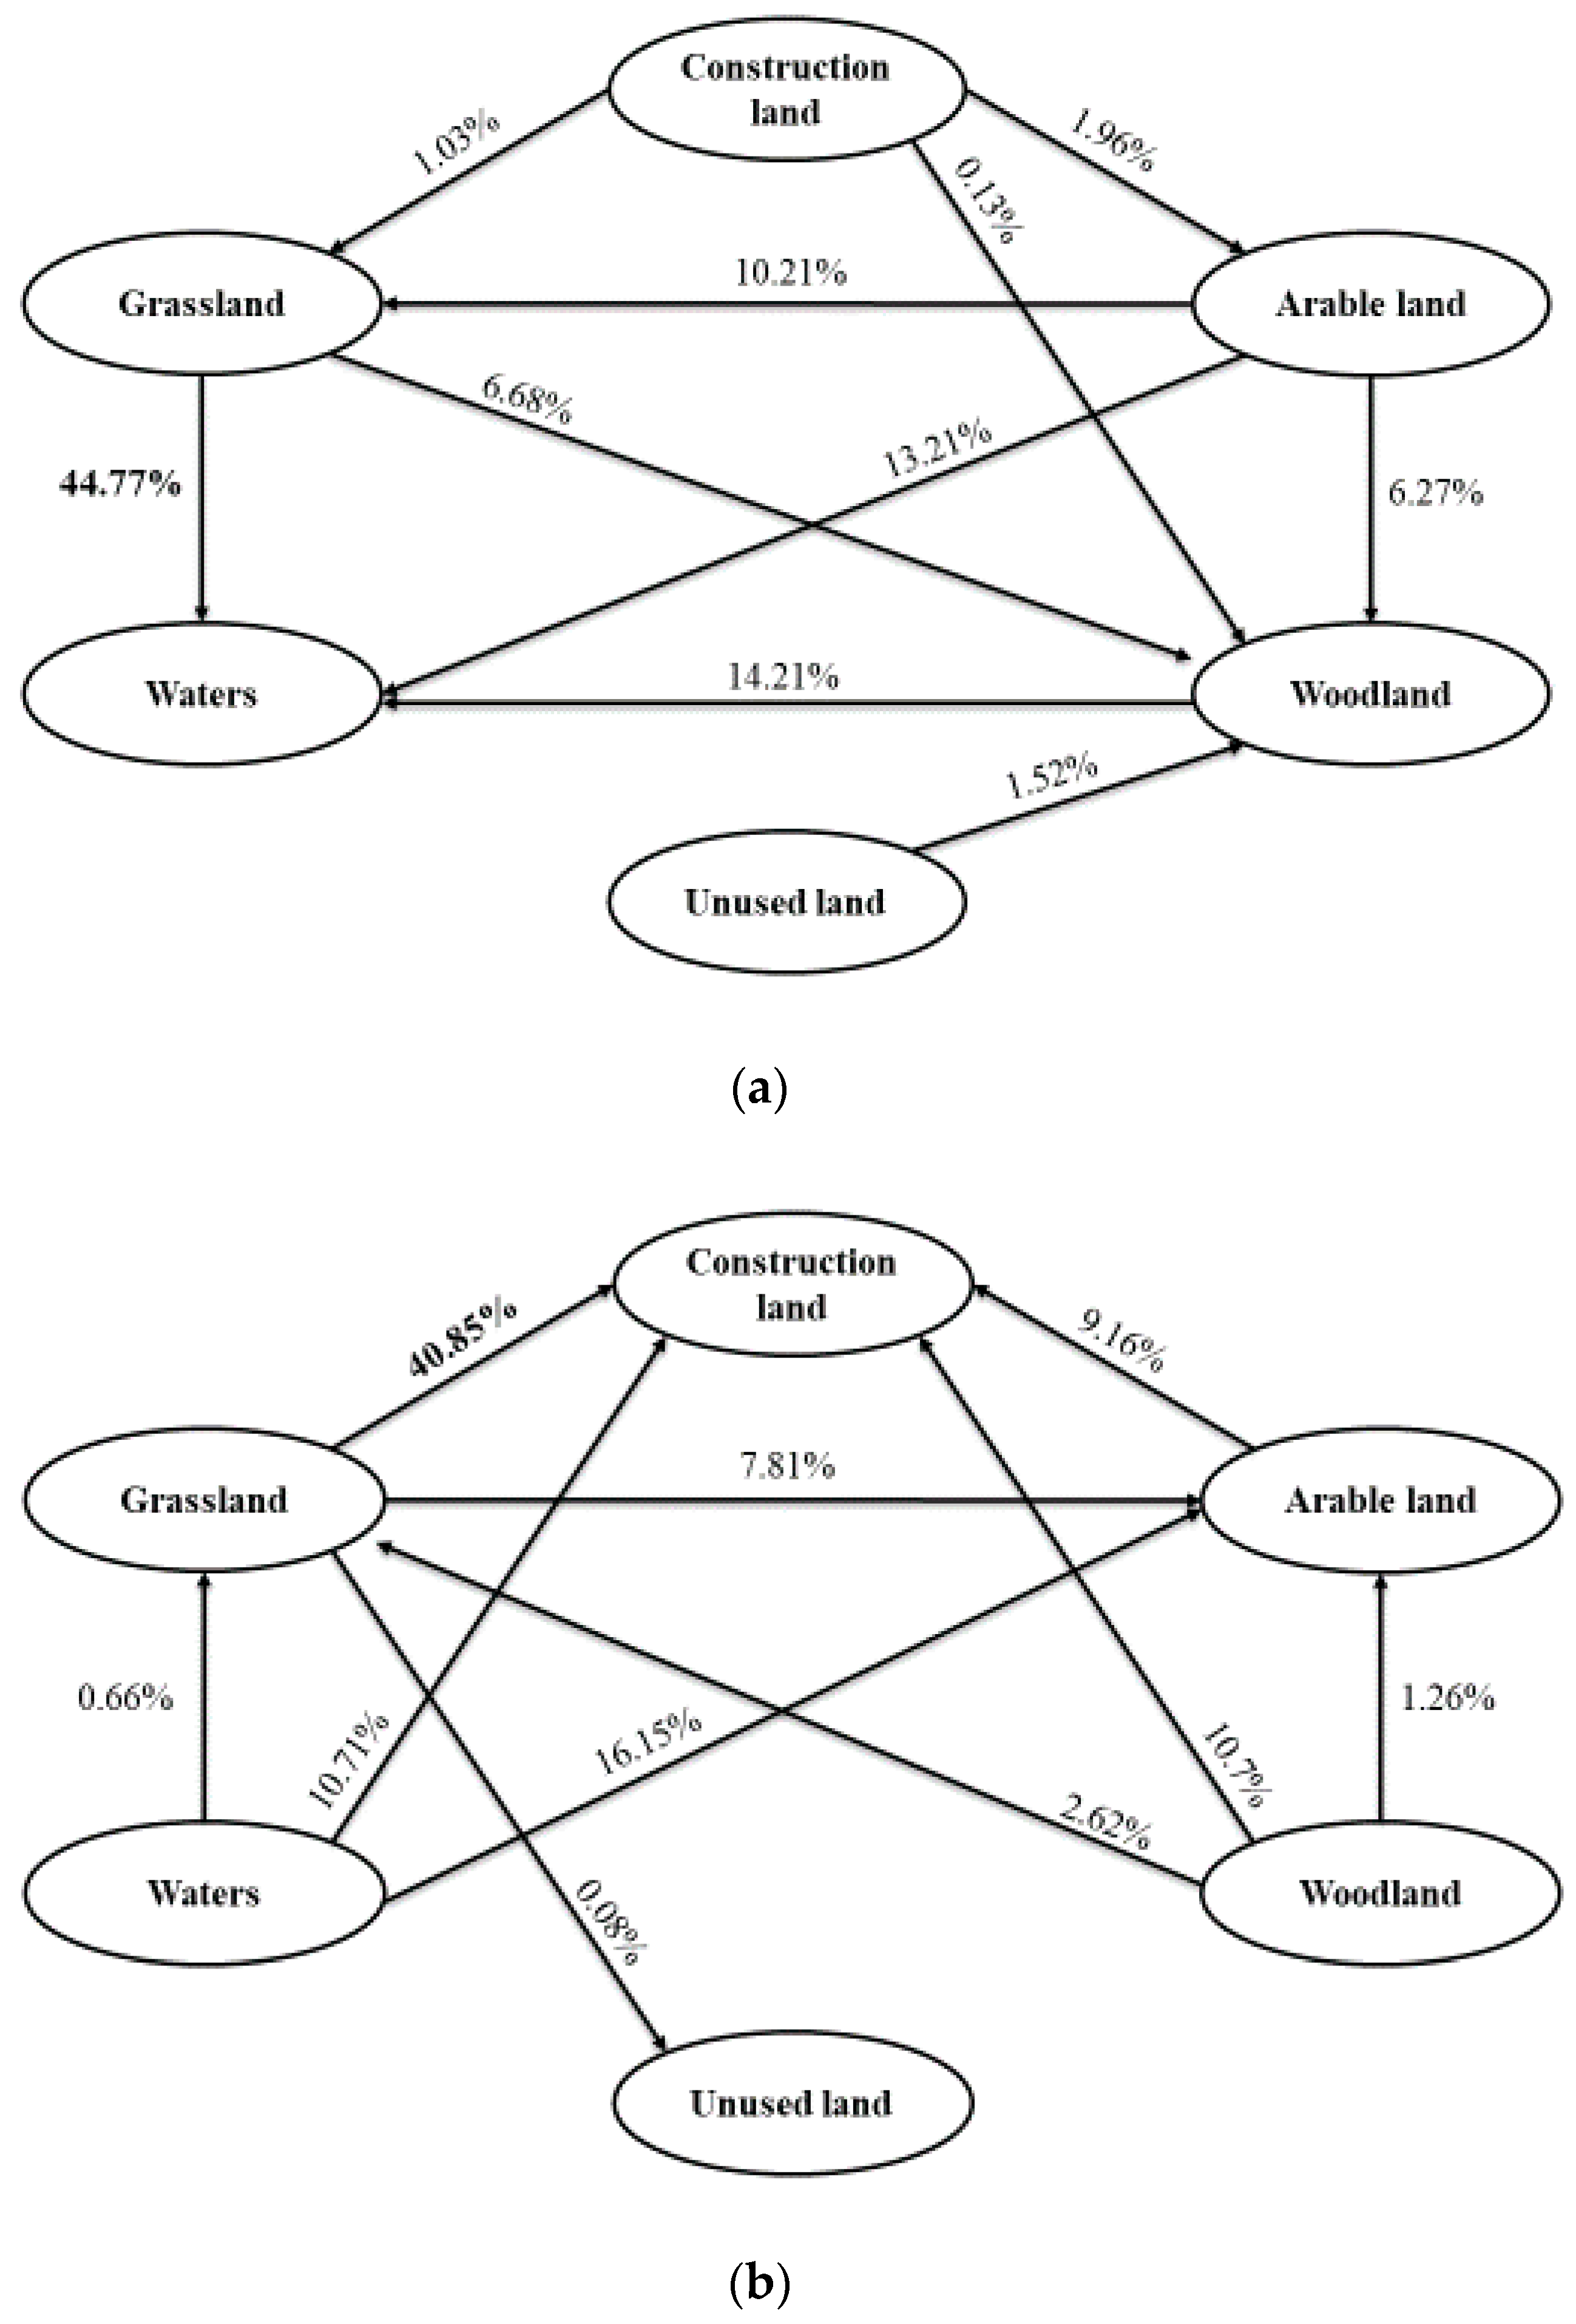
From 1980 to 2015, the area where ESV changed accounted for 2.99% of the total area (Figure 5). Among them, the area that ESV increased was 60.07 km2, which was mainly distributed in the southwest of the study area, amounting to 27.48% of the changing area (Figure 5). The increasing ESV was 164.85 million yuan caused by 10 types of land use transfer (Figure 6a). The conversion of grassland to waters took the greatest responsibility for the increased ESV. The followed types that caused ESV to increase were the conversion of woodland to waters and arable land to waters (Figure 6a). The area that ESV decreased accounted for 72.52% of the changing area distributed around the county seat and riverbanks (Figure 5). In total, 10 types of land use transfers caused the decrease of 359.68 million yuan for ESV (Figure 6b). Among them, the conversion of grassland contributed most to the total decreasing ESV, followed by the waters converted to arable land (Figure 6b). Overall, the increased waters and construction land contributed 72.19% and 71.42% to the increased and decreased ESV, respectively (Figure 6).
3.3. Sensitivity Analysis of Ecosystem Services Value
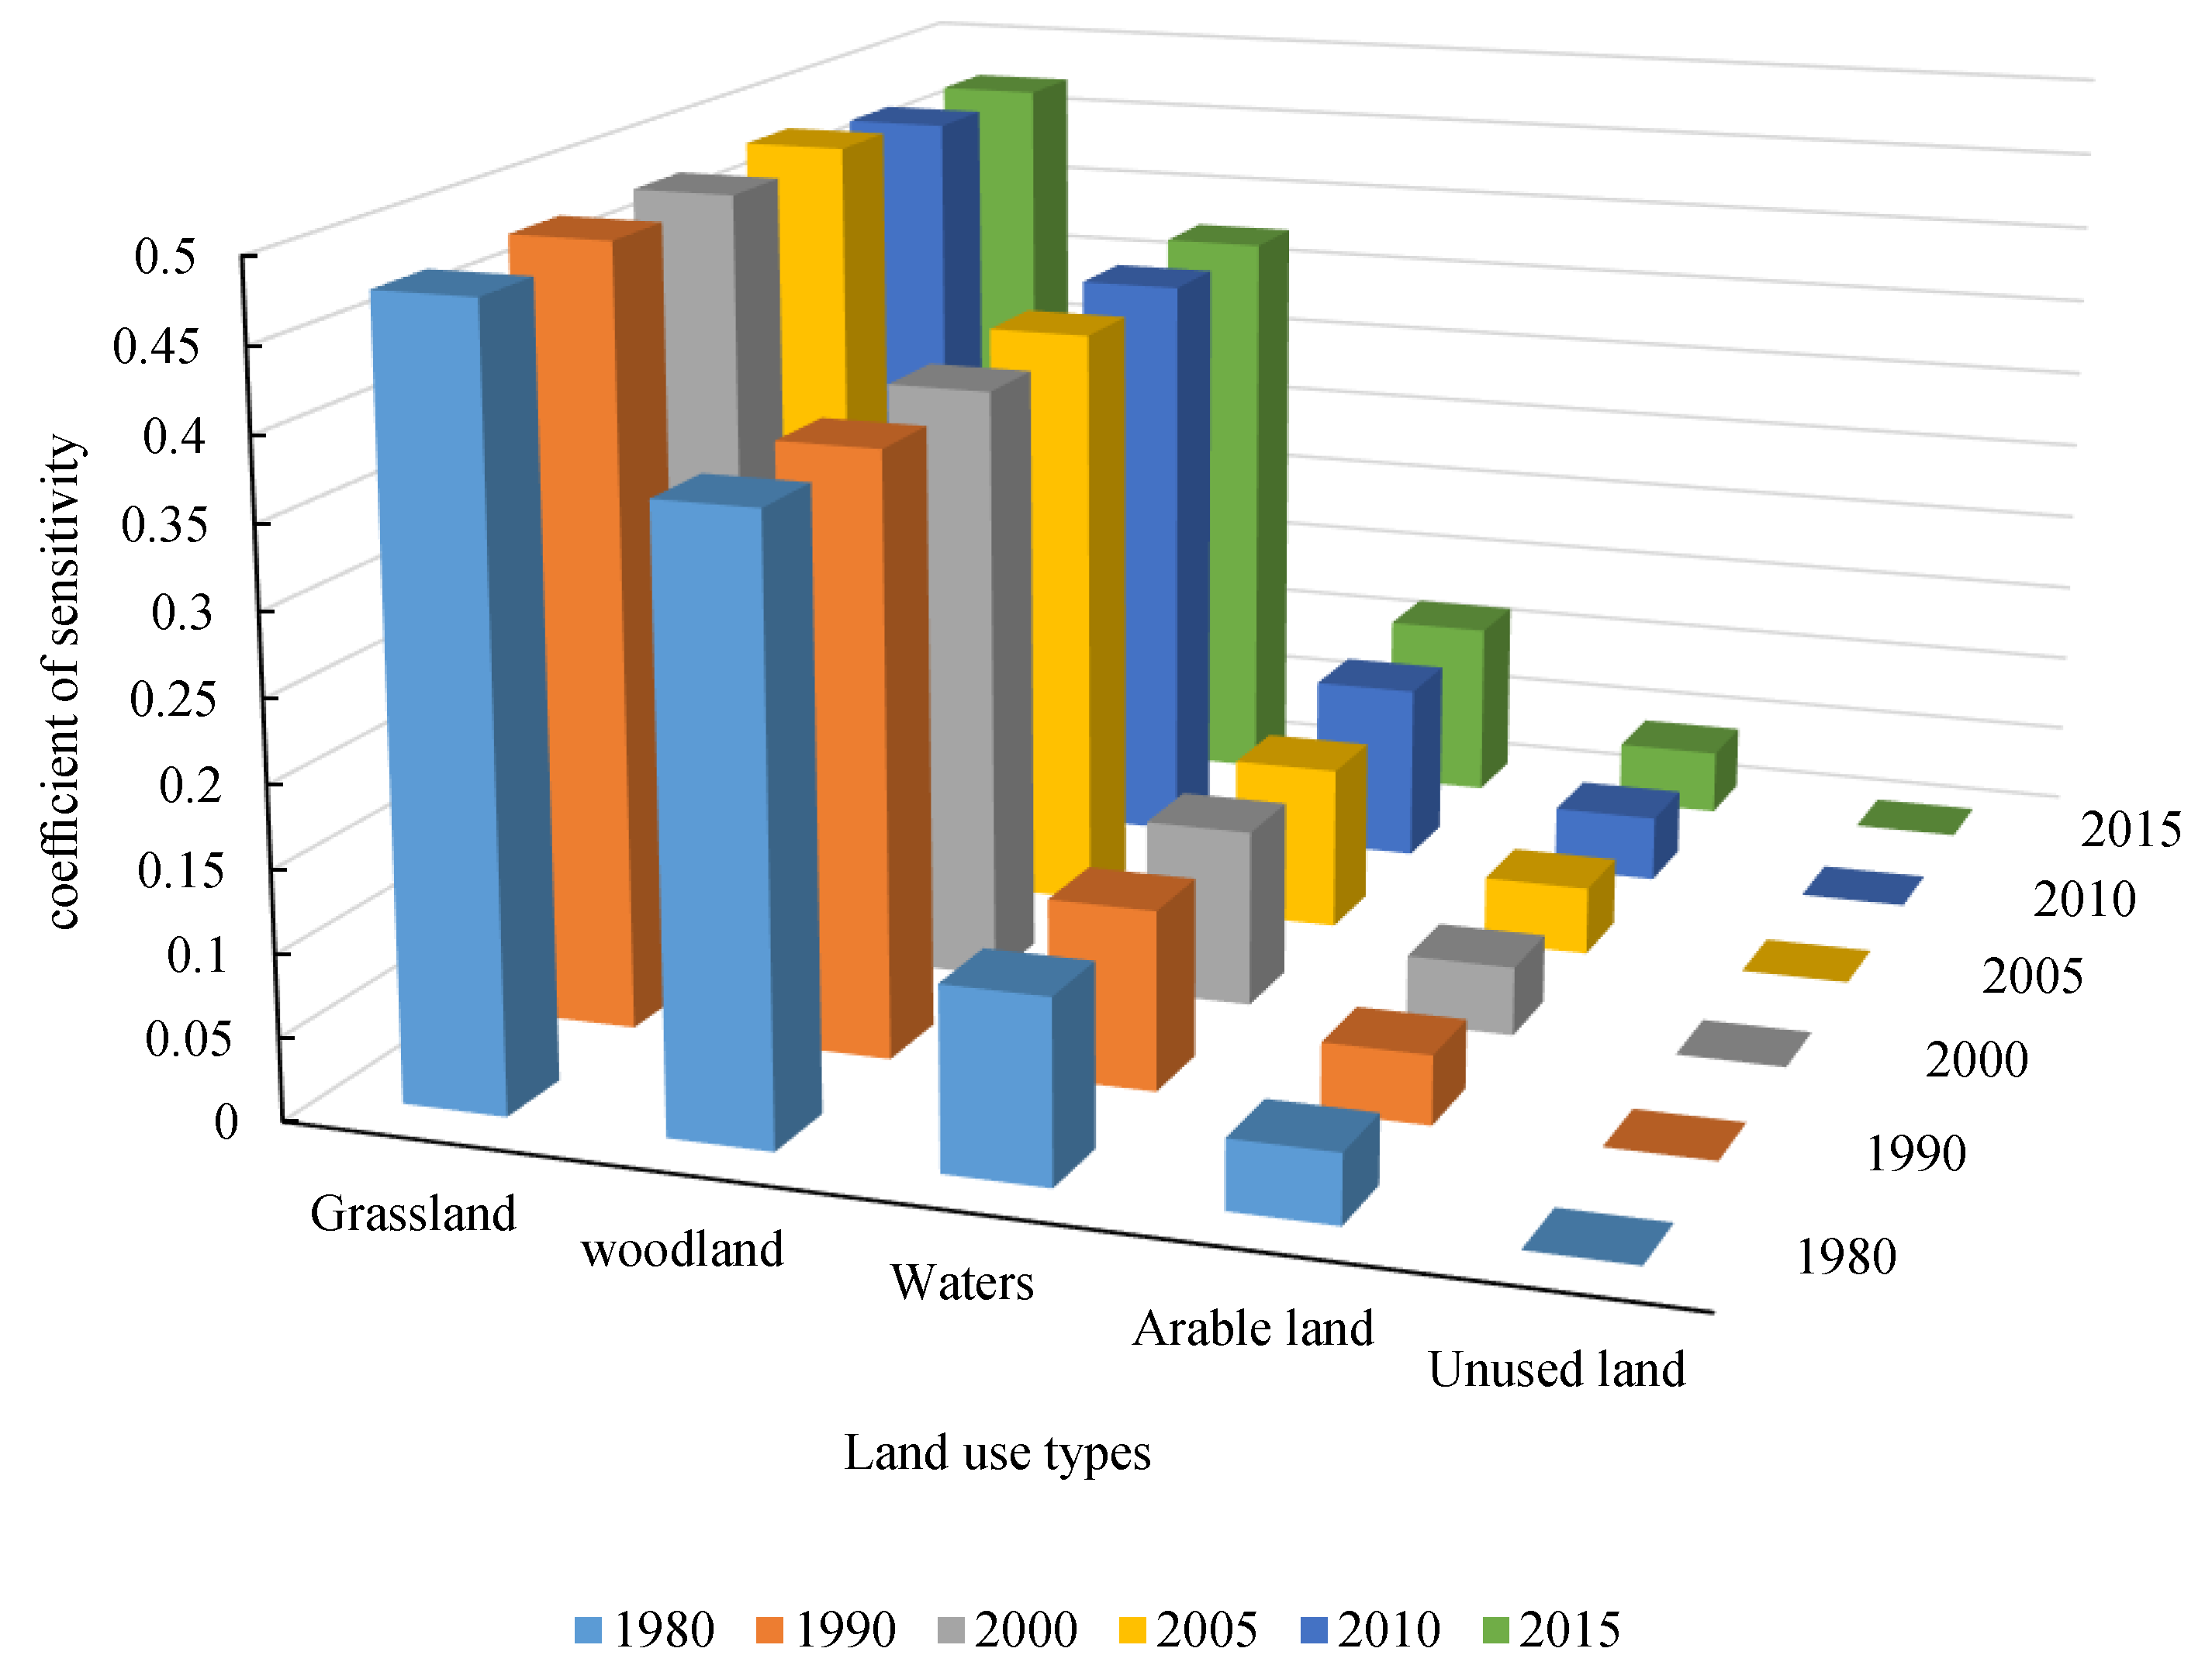
It can be known by the analysis of Figure 7 that after the value coefficient (VC) was adjusted by ±50%, the CS value in different periods was less than 1, and the CS value in each period changes little, indicating that the ecosystem service value (ESV) in the upstream of Xiong’an New Area was inelastic to the VC. Among the various land use types, the CS of grassland was the largest: 0.47~0.48. The unused land has the lowest CS, with values ranging from 1.63 × 10⁻⁶ to 3.31 × 10⁻⁶ (Figure 7). Besides, the CS of other land use types did not exceed 0.4 (Figure 7). Therefore, the VC calculated by this study was relatively reliable, which accords with the actual situation of the study area.
4. Discussion
At present, there are many methods for the estimation of ecosystem services values (ESVs), but a unified system has not yet been formed [33,34]. Compared with other estimation methods, the equivalent factor method was easy to use and had less of a data demand. It has been widely used in the estimation of ESV at regional and global scales [35,36]. Determining the value of the standard equivalent was the premise of applying the equivalent factor method. Most studies determine the value of the standard equivalent through the average area and average price of grain for many years [37,38]. However, the accuracy of these studies was usually restricted by a large error of the statistical data in the early stage. Besides, the purpose of this study was not to give an accurate price tag upstream of the Xiong’an New Area, but was, more importantly, to explore the changes in the value of ecosystem services during the evolution of land use. Therefore, we determined the value of the standard equivalent based on the 2010 grain data in the study area. This method has a high degree in matching with the basic equivalent scale used in the research [13], which improved the accuracy of ESV assessment in the base year, and can more scientifically reflect the trend of ESV changes with land use [39,40].
Our results indicated that the grassland and woodland supported most of the ESV in the study area for 35 years. This was similar to the conclusions of Wang et al. in the Hengduan Mountains [41]. The terrain of this study area and the Hengduan Mountains was steep and less affected by human activities. Furthermore, strict vegetation protection policies have been implemented in the two areas, resulting in a large proportion of woodland and grassland in both areas, with both above 80% [42]. Besides, woodland and grassland can provide strong regulation and support service functions, so they have a higher ESV per unit area. The combination of these two factors has resulted in the largest proportion of ESV in grassland and woodland in the total ESV in the two study areas.
Among different ecosystem service functions, the ESV indicated that regulating services was the main body of the ESV in the study area, and that the most important components of regulating services were climate regulation and hydrological regulation. This was related to the composition of land use types that were mainly woodland and grassland in the study area. The predominance of climate regulation and hydrological regulation found in the upstream of Xiong’an New Area was common in other grassland and woodland-ruled regions [43,44]. The reason was that forest land and grassland can adjust climate factors such as regional temperature and humidity by absorbing atmospheric CO2 and plant transpiration [45]. At the same time, it can also affect the hydrological cycle process of surface runoff formation, soil infiltration, and surface evapotranspiration through canopy interception and litter interception [46,47].
We also found that the ESV fluctuated slightly during 1980 to 2015. Specifically, from 1980 to 2005, the total value of the ecosystem decreased but increased in 2010. From 2005 to 2010, the construction land increased rapidly, but the increase in the water area and forest area reduced the damage of construction land to the ecological environment to some extent. Among them, the increase in forest area is related to the implementation of the Taihang Mountain Greening Project in the study area during this period [48]. From the perspective of spatial distribution, the decrease of ESV mainly occurs in the surrounding areas of mountain towns and the conversion of cultivated land to construction land was the main reason for the decrease of ESV in this area. This was similar to the research results in the Qihe River Basin and Luohe River Basin [49,50]. Economic development was the main reason for this phenomenon. During the study period, the GDP of Fuping County, Wuyuan County and Lingqiu County in the study area increased from 33.86, 79.82 and 34.15 million yuan in 2005 to 106.16, 445.77 and 210.42 million yuan in 2010, respectively. With the development of the economy, the increasing demand for urban housing and the construction of transportation facilities had promoted the conversion of arable land to construction land. The increase of ESV mainly occurs in the southwest of the study area, and the conversion of grassland to woodland was the main reason for the increase of the ESV in this area. Analysis of land use change indicates that such transfers occurred mainly between 2005 and 2010. During this period, the second phase of the Taihang Mountain Greening Project was under construction. The project increased the forest coverage in the Taihang Mountains through artificial afforestation and aerial sowing [48]. The southwestern part of the study area was within the scope of afforestation planning, and the land use type transfer from grassland to forest land has been achieved through afforestation in the region. This shows that the greening projects in this region have been more successful.
From the perspective of the contribution rate, the conversion of grassland to construction land had the largest contribution rate to the decrease of ESV in the study area. The conversion of grassland to construction land caused the loss of regional ecosystem services functions, and the ESV per unit area decreased significantly. Besides, the conversion of grassland to construction land occurs mainly in the riverside area. The riverside area had high soil fertility, flat terrain, convenient water intake and a large number of people moved into the area, resulting in a large area of grassland converted to construction land in the area [51]. The combination of the two factors has caused grassland to construction land conversion to become the main factor for ESV reduction in the study area. The conversion of grassland to waters had the largest contribution rate to the increase of ESV in the study area. This is similar to the conclusions of Chen et al. who claimed that the increase in waters contributed 32.99% to the improvement of ecosystem functions in the middle reaches of the Yangtze River, which was the main reason for the improvement of ecosystem functions [52]. Among different land use types, the hydrological regulation capacity of waters is quite prominent, and its unit area ESV was also the largest among land use types. Although the area converted from grassland to waters was small, the ESV per unit area caused by this type of transfer has increased significantly, so it has become the main reason for the increase in ESV in the study area.
According to the contribution rate analysis and the above discussion, it can be seen that the increase in construction land is the main reason for the decrease in ESV in the study area, and the increase in water area contributes the most to the increase in ESV in the study area. The conclusions of this paper can provide a theoretical basis for environmental policy development in the upstream of Xiong’an New Area, but in actual work, it should also be adjusted according to the characteristics of the study area. The Chinese government requires the Xiong’an New Area to adhere to the environmental policy of ecological priority and green development and build itself into a green and livable eco-city [53]. This puts forward higher requirements for water resources supply regulation, water quality safety and environmental purification in the upstream of the Xiong’an New Area. The study area is the mountainous and hilly area with shrub and grassland vegetation, which belongs to a fragile ecological environment and has a large number of poor people [54]. Therefore, ecomigration projects in the research area can be considered to achieve the dual effect of ecological environment protection and anti-poverty. The ecomigration project has been successfully applied in China’s Karst region and Heihe River Basin, etc. and the national policies and implementation methods are relatively mature [55,56]. However, when applying in this study area, the geographical location of the study area and the particularity of the regional policy should be taken into consideration, and ecological compensation and resettlement work should be done well. The increase in water area can improve the regional water resources supply and hydrological regulation capacity. However, blindly increasing the water area will also have a negative impact on the ecological environment. For example, the construction of artificial lakes by building dams can improve the ecological environment in a small area, but it would have a significant negative impact on the ecological environment of a large area and downstream areas, which would be contrary to the goal we pursue [57,58]. Therefore, reasonable measures should be taken to increase the water area of the study area. For example, the ecomigration project mentioned above can reduce the amount of artificial water extraction and agricultural irrigation, thus increasing the water area of the basin.
This study also has limitations. The land use change in the study area was small from 1980 to 2015; whether the conclusions drawn in a small area where the land use type changes can represent the entire study area has yet to be further verified in future research work. However, as the influence of the Xiong’an New Area continues to expand, large land use changes may occur in the study area in the future. The purpose of our research is to reveal the internal relationship between land use and ESV, so as to lay the foundation for the formulation of policies for environmental protection and development planning in the future research area and Xiong’an New Area. Therefore, the research conclusions and recommendations of this paper are consistent with the environmental policies of the research area and are providing services for the policies.
5. Conclusions
As important for water conservation and an ecological barrier area, the upstream of Xiong’an New Area has an important impact on the construction and development of the Xiong’an New Area. Analysis of the land use change in the upstream of Xiong’an New Area and its impact on the ecosystem services value (ESV) can provide a scientific basis for the sustainable use of land resources and the formulation of ecological environmental protection policies in the region. This study analyzed the land use change in the study area based on the six periods of land use data from 1980 to 2015. The results show that grassland was the land use type with the largest area proportion in the study area, while unused land was the land use type with the smallest area proportion. Analysis of land use change indicates that construction land and cultivated land are the largest land use types that increase and decrease in the area of the study area, respectively. The land use transfer matrix indicates that grassland and construction land were the land use types with the largest transfer-out area and transfer-in area, respectively. ESV analysis showed that the regulating services account for the largest proportion of total ESV among different ecosystem service functions. Furthermore, grassland and woodland account for more than 84% of the total ESV among different land use types. We found that ESV in the study area fluctuated slightly from 1980 to 2015. From the perspective of spatial distribution, the decrease of ESV mainly occurs in the surrounding areas of mountain towns and the conversion of cultivated land to construction land was the main reason for the decrease of ESV in this area. The increase of ESV mainly occurs in the southwest of the study area and the conversion of grassland to woodland is the main reason for the increase of ESV in this area. From the perspective of the contribution rate, the conversion of grassland to construction land had the largest contribution rate to the decrease of ESV in the study area, while the conversion of grassland to waters has the largest contribution rate to the increase of ESV in the study area.
Author Contributions
Conceptualization, Z.W. and J.C.; methodology, Z.W.; software, Z.W.; validation, Z.W., C.Z.; formal analysis, Z.W.; investigation, Z.W., J.C., C.Z. and H.Y.; writing—original draft preparation, Z.W.; writing—review and editing, Z.W. and C.Z.; visualization, Z.W.; supervision, J.C., C.Z. and H.Y.; project administration, J.C., C.Z. and H.Y.; funding acquisition, J.C. All authors have read and agreed to the published version of the manuscript.
Funding
This research was funded by the National Natural Science Foundation of China (No. 41877170), National Key Research and Development Program of China (No. 2018YFC0406501-02) and Hebei Province Key Research and Development Program of China (No. 20324203D and No. 20536001D). This work is supported by CFERN & BEIJING TECHNO SOLUTIONS Award Funds on excellent academic achievements.
Conflicts of Interest
The authors declare no conflict of interest.
References
- Song, C.; Ke, L.; Pan, H.; Zhan, S.; Liu, K.; Ma, R. Long-term surface water changes and driving cause in Xiong’an, China: From dense Landsat time series images and synthetic analysis. Sci. Bull. 2018, 63, 708–716. [Google Scholar] [CrossRef] [Green Version]
- Güneralp, B.; Seto, K.C. Environmental impacts of urban growth from an integrated dynamic perspective: A case study of Shenzhen, South China. Glob. Environ. Chang. 2008, 18, 720–735. [Google Scholar] [CrossRef]
- Li, M.; Finlayson, B.; Webber, M.; Barnett, J.; Webber, S.; Rogers, S.; Chen, Z.; Wei, T.; Chen, J.; Wu, X.; et al. Estimating urban water demand under conditions of rapid growth: The case of Shanghai. Reg. Environ. Chang. 2017, 17, 1153–1161. [Google Scholar] [CrossRef]
- Liu, S. Strategic interpretation and strategic planning of Xiong’an New Area. Academics 2017, 229, 316–320. [Google Scholar]
- Barbier, E.B.; Hacker, S.D.; Kennedy, C.; Koch, E.W.; Sitier, A.C.; Silliman, B.R. The value of estuarine and coastal ecosystem services. Ecol. Monogr. 2011, 81, 169–193. [Google Scholar] [CrossRef]
- Petter, M.; Mooney, S.; Maynard, S.M.; Davidson, A.; Cox, M.; Horosak, I. A Methodology to Map Ecosystem Functions to Support Ecosystem Services Assessments. Ecol. Soc. 2013, 18, 31. [Google Scholar] [CrossRef] [Green Version]
- Parthum, B.; Pindilli, E.; Hogan, D. Benefits of the fire mitigation ecosystem service in The Great Dismal Swamp National Wildlife Refuge, Virginia, USA. J. Environ. Manag. 2017, 203, 375–382. [Google Scholar] [CrossRef] [PubMed]
- Costanza, R.; Farber, S.C.; Maxwell, J. Valuation and management of wetland ecosystems. Ecol. Econ. 1989, 1, 335–361. [Google Scholar] [CrossRef]
- De Groot, R.S. Environmental Functions as a Unifying Concept for Ecology and Economics. Environmentalist 1987, 7, 105–109. [Google Scholar] [CrossRef]
- Aylward, B.; Barbier, E.B. Valuing environmental functions in developing countries. Biodivers. Conserv. 1992, 1, 34–50. [Google Scholar] [CrossRef]
- Costanza, R.; d’Arge, R.; de Groot, R.; Farber, S.; Grasso, M.; Hannon, B.; Limburg, K.; Naeem, S.V.; O’Neill, R.; Paruelo, J.G.; et al. The value of the world’s ecosystem services and natural capital. Nature 1997, 387, 253–260. [Google Scholar] [CrossRef]
- Xie, G.; Zheng, L.; Lu, C.; Xiao, Y.; Chen, C. Expert Knowledge Based Valuation Method of Ecosystem Services in China. J. Nat. Resour. 2008, 5, 911–919. [Google Scholar]
- Xie, G.; Zhang, C.; Zhang, L.; Chen, W.; Li, S. Improvement of ecosystem service value method based on unit area value equivalent factor. J. Nat. Resour. 2015, 30, 1243–1254. [Google Scholar]
- Pennekamp, F.; Pontarp, M.; Tabi, A.; Altermatt, F.; Alther, R.; Choffat, Y.; Fronhofer, E.A.; Ganesanandamoorthy, P.; Garnier, A.; Griffiths, J.I.; et al. Biodiversity increases and decreases ecosystem stability. Nature 2018, 563, 109–112. [Google Scholar] [CrossRef] [PubMed] [Green Version]
- Scholes, R.J. Climate change and ecosystem services. Wiley Interdiscip. Rev. Clim. Chang. 2016, 7, 537–550. [Google Scholar] [CrossRef]
- Wang, Z.; Mao, D.; Li, L.; Jia, M.; Dong, Z.; Miao, Z.; Ren, C.; Song, C. Quantifying changes in multiple ecosystem services during 1992-2012 in the Sanjiang Plain of China. Sci. Total Environ. 2015, 514, 119–130. [Google Scholar] [CrossRef]
- Wang, J.; Zhou, W.; Pickett, S.T.A.; Yu, W.; Li, W. A multiscale analysis of urbanization effects on ecosystem services supply in an urban megaregion. Sci. Total Environ. 2019, 662, 824–833. [Google Scholar] [CrossRef]
- Xue, M.; Ma, S. Optimized Land-Use Scheme Based on Ecosystem Service Value: Case Study of Taiyuan, China. J. Urban Plan. Dev. 2018, 144, 04018016. [Google Scholar] [CrossRef]
- Ye, Y.; Bryan, B.A.; Zhang, J.e.; Connor, J.D.; Chen, L.; Qin, Z.; He, M. Changes in land-use and ecosystem services in the Guangzhou-Foshan Metropolitan Area, China from 1990 to 2010: Implications for sustainability under rapid urbanization. Ecol. Indic. 2018, 93, 930–941. [Google Scholar] [CrossRef]
- Yi, L.; Zhang, Z.; Zhao, X.; Liu, B.; Wang, X.; Wen, Q.; Zuo, L.; Liu, F.; Xu, J.; Hu, S. Have Changes to Unused Land in China Improved or Exacerbated Its Environmental Quality in the Past Three Decades? Sustainability 2016, 8, 184. [Google Scholar] [CrossRef] [Green Version]
- Wang, Y.; Gao, J.; Wang, J.; Qiu, J. Value assessment of ecosystem services in nature reserves in Ningxia, China: A response to ecological restoration. PLoS ONE 2014, 9, e89174. [Google Scholar] [CrossRef]
- Yuan, K.; Li, F.; Yang, H.; Wang, Y. The Influence of Land Use Change on Ecosystem Service Value in Shangzhou District. Int. J. Environ. Res. Public Health 2019, 16, 1321. [Google Scholar] [CrossRef] [PubMed] [Green Version]
- Easterling, W.E. Why regional studies are needed in the development of full- scale integrated assessment modelling of global change processes. Glob. Environ. Chang. 1997, 7, 337–356. [Google Scholar] [CrossRef]
- Li, J.; Feng, P.; Chen, F. Effects of land use change on flood characteristics in mountainous area of Daqinghe watershed, China. Nat. Hazards 2013, 70, 593–607. [Google Scholar] [CrossRef]
- Deng, X.; Ren, W.; Feng, P. Design flood recalculation under land surface change. Nat. Hazards 2015, 80, 1153–1169. [Google Scholar] [CrossRef]
- Liu, J.; Kuang, W.; Zhang, Z.; Xu, X.; Qin, Y.; Ning, J.; Zhou, W.; Zhang, S.; Li, R.; Yan, C.; et al. Spatiotemporal characteristics, patterns, and causes of land-use changes in China since the late 1980s. J. Geogr. Sci. 2014, 24, 195–210. [Google Scholar] [CrossRef]
- Jiang, Z.; Sun, X.; Liu, F.; Shan, R.; Zhang, W. Spatio-temporal variation of land use and ecosystem service values and their impact factors in an urbanized agricultural basin since the reform and opening of China. Environ. Monit. Assess. 2019, 191, 1–14. [Google Scholar] [CrossRef]
- Xu, M.; Li, Y.; Wang, K.; Cao, Y.; Yu, H.; Li, X.; Li, L.; Jing, F.; Li, J.; Xie, F. Grassland resource distribution and vegetation characteristics in Hebei Province. Acta Prataculturae Sin. 2009, 18, 1–11. [Google Scholar]
- Li, Z.; Sun, Z.; Tian, Y.; Zhong, J.; Yang, W. Impact of Land Use/Cover Change on Yangtze River Delta Urban Agglomeration Ecosystem Services Value: Temporal-Spatial Patterns and Cold/Hot Spots Ecosystem Services Value Change Brought by Urbanization. Int. J. Environ. Res. Public Health 2019, 16, 123. [Google Scholar] [CrossRef] [Green Version]
- Yirsaw, E. Effect of Temporal Land Use/Land Cover Changes on Ecosystem Services Value in Coastal Area of China: The Case of Su-Xi-Chang Region. Appl. Ecol. Environ. Res. 2016, 14, 409–422. [Google Scholar] [CrossRef]
- Palomo, I.; Martín-López, B.; Zorrilla-Miras, P.; García Del Amo, D.; Montes, C. Deliberative mapping of ecosystem services within and around Doñana National Park (SW Spain) in relation to land use change. Reg. Environ. Chang. 2013, 14, 237–251. [Google Scholar] [CrossRef]
- Kreuter, U.P.; Harris, H.G.; Matlock, M.D.; Lacey, R.E. Change in ecosystem service values in the San Antonio area, Texas. Ecol. Econ. 2001, 39, 333–346. [Google Scholar] [CrossRef]
- Shi, Y.; Wang, R.; Huang, J.; Yang, W. An analysis of the spatial and temporal changes in Chinese terrestrial ecosystem service functions. Chin. Sci. Bull. 2012, 57, 2120–2131. [Google Scholar] [CrossRef] [Green Version]
- Zhang, B.; Li, W.; Xie, G. Ecosystem services research in China: Progress and perspective. Ecol. Econ. 2010, 69, 1389–1395. [Google Scholar] [CrossRef]
- Costanza, R.; de Groot, R.; Sutton, P.; van der Ploeg, S.; Anderson, S.J.; Kubiszewski, I.; Farber, S.; Turner, R.K. Changes in the global value of ecosystem services. Glob. Environ. Chang. 2014, 26, 152–158. [Google Scholar] [CrossRef]
- Wang, W.; Guo, H.; Chuai, X.; Dai, C.; Lai, L.; Zhang, M. The impact of land use change on the temporospatial variations of ecosystems services value in China and an optimized land use solution. Environ. Sci. Policy 2014, 44, 62–72. [Google Scholar] [CrossRef]
- Qian, D.; Yan, C.; Xiu, L.; Feng, K. The impact of mining changes on surrounding lands and ecosystem service value in the Southern Slope of Qilian Mountains. Ecol. Complex. 2018, 36, 138–148. [Google Scholar] [CrossRef]
- Zhang, Z.; Xia, F.; Yang, D.; Huo, J.; Wang, G.; Chen, H. Spatiotemporal characteristics in ecosystem service value and its interaction with human activities in Xinjiang, China. Ecol. Indic. 2020, 110, 105826. [Google Scholar] [CrossRef]
- Xu, N.; Guo, L.; Xue, D.; Sun, S. Land use structure and the dynamic evolution of ecosystem service value in Gannan region, China. Acta Ecol. Sin. 2019, 39, 1969–1978. [Google Scholar]
- Xu, N.; Su, S.; Xue, D.; Guo, L. Ecosystem service value and its spatial response to human interference on the basis of terrain gradient in Gannan region, China. Acta Ecol. Sin. 2019, 39, 97–107. [Google Scholar]
- Wang, Y.; Dai, E.; Yin, L.; Ma, L. Land use/land cover change and the effects on ecosystem services in the Hengduan Mountain region, China. Ecosyst. Serv. 2018, 34, 55–67. [Google Scholar] [CrossRef]
- Dai, E.; Wang, Y.; Ma, L.; Li, S.; Zhang, H.; Xin, L.; Xue, E.; Gao, J.; Zhu, L.; Wang, Y. Land use change and resource ecological effects of typical mountainous areas in China. Chin. J. Nat. 2018, 40, 33–40. [Google Scholar]
- Yang, Y.; Song, G.; Lu, S. Study on the ecological protection redline (EPR) demarcation process and the ecosystem service value (ESV) of the EPR zone: A case study on the city of Qiqihaer in China. Ecol. Indic. 2020, 109, 105754. [Google Scholar] [CrossRef]
- Zheng, X.; Zhang, J.; Cao, S. Net value of grassland ecosystem services in mainland China. Land Use Policy 2018, 79, 94–101. [Google Scholar] [CrossRef]
- Seidl, R.; Albrich, K.; Erb, K.; Formayer, H.; Leidinger, D.; Leitinger, G.; Tappeiner, U.; Tasser, E.; Rammer, W. What drives the future supply of regulating ecosystem services in a mountain forest landscape? For. Ecol. Manag. 2019, 445, 37–47. [Google Scholar] [CrossRef]
- Bent, G.C. Effects of forest-management activities on runoff components and ground-water recharge to Quabbin Reservoir, central Massachusetts. For. Ecol. Manag. 2001, 143, 115–129. [Google Scholar] [CrossRef]
- Ferreira, S.; Ghimire, R. Forest cover, socioeconomics, and reported flood frequency in developing countries. Water Resour. Res. 2012, 48, W08529. [Google Scholar] [CrossRef]
- Liu, L.; Wang, Z.; Wang, Y.; Zhang, Y.; Shen, J.; Qin, D.; Li, S. Trade-off analyses of multiple mountain ecosystem services along elevation, vegetation cover and precipitation gradients: A case study in the Taihang Mountains. Ecol. Indic. 2019, 103, 94–104. [Google Scholar] [CrossRef]
- Duan, H.; Wu, Q.; Yang, Y.; LI, T. Land Use Change and Driving Force Analysis of Bayin River Basin in the Past 10 Years. Res. Soil Water Conserv. 2020, 27, 172–177. [Google Scholar]
- Ren, H.; Zhang, J.; Zhu, W.; Wang, L.; Zhang, L.; Zhu, L. Impact of land use change on habitat in the Qihe River Basin of Taihang Mountains. Prog. Geogr. 2018, 37, 1693–1704. [Google Scholar]
- Fernandes, M.R.; Aguiar, F.C.; Martins, M.J.; Rivaes, R.; Ferreira, M.T. Long-term human-generated alterations of Tagus River: Effects of hydrological regulation and land-use changes in distinct river zones. Catena 2020, 188, 104466. [Google Scholar] [CrossRef]
- Chen, W.; Li, J.; Zhu, L. Spatial heterogeneity and sensitivity analysis of ecosystem services value in the Middle Yangtze River region. J. Nat. Resour. 2019, 34, 325–337. [Google Scholar]
- Peng, J.; Li, H.; Liu, Y.; Hu, Y.; Yang, S. Identification and optimization of ecological security pattern in Xiong’an New Area. Acta Geogr. Sin. 2018, 73, 701–710. [Google Scholar]
- Tian, Y.; Wang, Z.; Zhao, J.; Jiang, X.; Guo, R. A Geographical Analysis of the Poverty Causes in China’s Contiguous Destitute Areas. Sustainability 2018, 10, 1895. [Google Scholar] [CrossRef] [Green Version]
- Lu, J.; Qiao, M.; He, X.; Liu, W.; Yang, Z. Ecological protection and resettlement of Ejina Oasis in the lower reaches of the Heihe River Basin. J. Econ. Water Resour. 2002, 6, 62–65. [Google Scholar]
- Yu, Y.; Wang, K.; Cheng, H.; Xu, L.; Fu, W.; Zhang, W. Farmer’s perception and response towards environmental migration and restoration plans based on participatory rural appraisal: A case study of emigration region in the karst Southwetern China. Acta Ecol. Sin. 2009, 29, 1170–1180. [Google Scholar]
- Takahasi, Y. Dams, environment and regional development in Japan. Int. J. Water Resour. Dev. 2004, 20, 35–45. [Google Scholar] [CrossRef]
- Yalcin, E.; Tigrek, S. Hydropower production without sacrificing environment: A case study of Ilisu Dam and Hasankeyf. Int. J. Water Resour. Dev. 2015, 32, 247–266. [Google Scholar] [CrossRef]
Figure 1.
The location of study area.

Figure 2.
Land use pattern of upstream of Xiong’an New Area from 1980 to 2015.

Figure 3.
Land use transition map in the upstream of Xiong’an New Area from 1980 to 2015. (1: Arable land; 2: Woodland; 3: Grassland; 4: Waters; 5: Construction land; 6: Unused land).
Figure 3.
Land use transition map in the upstream of Xiong’an New Area from 1980 to 2015. (1: Arable land; 2: Woodland; 3: Grassland; 4: Waters; 5: Construction land; 6: Unused land).

Figure 4.
Ecosystem service value of different land use types (unused land, arable land, waters, woodland, grassland) in the upstream of Xiong’an New Area from 1980 to 2015.
Figure 4.
Ecosystem service value of different land use types (unused land, arable land, waters, woodland, grassland) in the upstream of Xiong’an New Area from 1980 to 2015.

Figure 5.
Spatial distribution map of ecosystem service value changes.

Figure 6.
Contribution rate of different land use transfer types for the increase (a) and decrease (b) of ecosystem service value.
Figure 6.
Contribution rate of different land use transfer types for the increase (a) and decrease (b) of ecosystem service value.

Figure 7.
Coefficient of sensitivity of ecosystem services value.


Table 1.
Value coefficient of ecosystem services per unit area in the study area (yuan/hm2·a).
| Ecosystem Service Functions | Arable Land | Woodland | Grassland | Waters | Construction Land | Unused Land | |
|---|---|---|---|---|---|---|---|
| Provisioning services | Food production | 2035.18 | 502.81 | 694.36 | 1915.46 | 0.00 | 0.00 |
| Raw material production | 957.73 | 1149.28 | 1005.62 | 550.70 | 0.00 | 0.00 | |
| Water supply | 47.89 | 598.58 | 550.70 | 19,849.00 | 0.00 | 0.00 | |
| Regulating services | Gas regulation | 1604.20 | 3735.15 | 3543.61 | 1843.63 | 0.00 | 47.89 |
| Climate regulation | 861.96 | 11,133.63 | 9385.77 | 5483.02 | 0.00 | 0.00 | |
| Purification environment | 239.43 | 3328.12 | 3088.69 | 13,288.53 | 0.00 | 239.43 | |
| Hydrological regulation | 646.47 | 7997.06 | 6871.73 | 244,796.30 | 0.00 | 71.83 | |
| Supporting services | Soil conservation | 2466.16 | 4525.28 | 4333.74 | 2226.73 | 0.00 | 47.89 |
| Maintain nutrient cycle | 287.32 | 359.15 | 335.21 | 167.60 | 0.00 | 0.00 | |
| Biodiversity | 311.26 | 4142.19 | 3926.70 | 6105.54 | 0.00 | 47.89 | |
| Cultural services | Aesthetic landscape | 143.66 | 1819.69 | 1723.92 | 4525.28 | 0.00 | 23.94 |
| Total | 9601.26 | 39,290.96 | 35,460.03 | 300,751.79 | 0.00 | 478.87 | |
Table 2.
Area of land use types in the upstream of Xiong’an New Area from 1980 to 2015 (km2).
| Years | Land Use Types | |||||
|---|---|---|---|---|---|---|
| Arable Land | Woodland | Grassland | Waters | Construction Land | Unused Land | |
| 1980 | 1155.22 | 2479.69 | 3525.39 | 97.02 | 59.65 | 1.59 |
| 1990 | 1157.27 | 2461.20 | 3540.77 | 95.85 | 61.87 | 1.61 |
| 2000 | 1159.90 | 2459.76 | 3535.18 | 95.29 | 66.84 | 1.59 |
| 2005 | 1152.31 | 2463.95 | 3534.16 | 88.91 | 77.61 | 1.62 |
| 2010 | 1127.75 | 2476.12 | 3471.18 | 97.54 | 144.28 | 1.70 |
| 2015 | 1120.85 | 2474.88 | 3459.56 | 98.35 | 164.03 | 0.89 |
Table 3.
Land use transition matrix in the upstream of Xiong’an New Area from 1980 to 2015 (km2).
| 1980 | 2015 | ||||||
|---|---|---|---|---|---|---|---|
| Arable Land | Woodland | Grassland | Waters | Construction Land | Unused Land | The Area of Transferred Out | |
| Arable land | 1098.51 | 4.38 | 8.19 | 0.94 | 43.19 | 0.00 | 56.71 |
| Woodland | 1.92 | 2433.41 | 30.91 | 1.13 | 12.33 | 0.00 | 46.28 |
| Grassland | 13.68 | 36.20 | 3419.75 | 3.50 | 52.16 | 0.11 | 105.65 |
| Waters | 2.51 | 0.00 | 0.11 | 92.78 | 1.61 | 0.00 | 4.24 |
| Construction land | 4.23 | 0.07 | 0.60 | 0.00 | 54.74 | 0.00 | 4.91 |
| Unused land | 0.00 | 0.81 | 0.00 | 0.00 | 0.00 | 0.78 | 0.81 |
| The area of transferred in | 22.34 | 41.46 | 39.82 | 5.57 | 109.29 | 0.11 | 218.59 |
Table 4.
Ecosystem service value of different ecosystem service functions in the upstream of Xiong’an New Area from 1980 to 2015 (106 Yuan).
Table 4.
Ecosystem service value of different ecosystem service functions in the upstream of Xiong’an New Area from 1980 to 2015 (106 Yuan).
| Ecosystem Service Functions | Value | ||||||
|---|---|---|---|---|---|---|---|
| 1980 | 1990 | 2000 | 2005 | 2010 | 2015 | ||
| Provisioning services | Food production | 623.16 | 623.49 | 623.46 | 620.83 | 613.72 | 611.61 |
| Raw material production | 755.49 | 755.04 | 754.53 | 753.83 | 747.02 | 745.10 | |
| Water supply | 540.67 | 538.10 | 536.61 | 524.12 | 538.37 | 539.24 | |
| Regulating services | Gas regulation | 2378.68 | 2377.33 | 2375.13 | 2373.94 | 2353.82 | 2348.28 |
| Climate regulation | 6222.42 | 6215.80 | 6208.87 | 6208.43 | 6165.48 | 6153.05 | |
| Purification environment | 2070.77 | 2067.86 | 2064.98 | 2057.41 | 2052.87 | 2049.77 | |
| Hydrological regulation | 6855.20 | 6822.45 | 6803.96 | 6650.11 | 6826.03 | 6836.56 | |
| Supporting services | Soil conservation | 2956.45 | 2954.99 | 2952.44 | 2950.60 | 2924.68 | 2917.56 |
| Maintain nutrient cycle | 242.05 | 241.94 | 241.77 | 241.56 | 239.32 | 238.70 | |
| Biodiversity | 2506.65 | 2504.38 | 2501.33 | 2498.54 | 2483.35 | 2478.55 | |
| Cultural services | Aesthetic landscape | 1119.48 | 1118.26 | 1116.82 | 1114.42 | 1109.32 | 1107.36 |
| Total | 26,271.02 | 26,219.64 | 26,179.91 | 25,993.79 | 26,054.00 | 26,025.78 | |
© 2020 by the authors. Licensee MDPI, Basel, Switzerland. This article is an open access article distributed under the terms and conditions of the Creative Commons Attribution (CC BY) license (http://creativecommons.org/licenses/by/4.0/).
Share and Cite
MDPI and ACS Style
Wang, Z.; Cao, J.; Zhu, C.; Yang, H. The Impact of Land Use Change on Ecosystem Service Value in the Upstream of Xiong’an New Area. Sustainability 2020, 12, 5707. https://0-doi-org.brum.beds.ac.uk/10.3390/su12145707
AMA Style
Wang Z, Cao J, Zhu C, Yang H. The Impact of Land Use Change on Ecosystem Service Value in the Upstream of Xiong’an New Area. Sustainability. 2020; 12(14):5707. https://0-doi-org.brum.beds.ac.uk/10.3390/su12145707
Chicago/Turabian StyleWang, Zhiyin, Jiansheng Cao, Chunyu Zhu, and Hui Yang. 2020. "The Impact of Land Use Change on Ecosystem Service Value in the Upstream of Xiong’an New Area" Sustainability 12, no. 14: 5707. https://0-doi-org.brum.beds.ac.uk/10.3390/su12145707
Note that from the first issue of 2016, this journal uses article numbers instead of page numbers. See further details here.