1. Introduction
Economic growth and industrialization have brought about many benefits, such as better standards, prosperity, and urbanization. However, this development has caused a lot of negative effects and issues on the global level that could potentially harm the well-being of future generations. Increasing industrial production in the 1960s and 1970s has led to the growth of consumerism, which was followed by massive pressure on natural resources and the environment, which eventually have led to the undermining of the nature balance [
1]. Scientists and practitioners worldwide have become aware of the severity of the problem, so they started to emphasize the importance of ecological and environmental preservation, and the term sustainability was introduced. Initially, this term represented a connection between development and environment, but over time, it became broader and now includes all aspects of development, i.e., economic, social, and environmental [
2]. The goals of sustainable development that are nowadays followed are somewhat different relative to those pursued in the 1990s. Acquiring new technologies, especially information and communication, has sped up the globalization process, which provoked new economic, environmental, and social challenges [
3].
To define the main priorities regarding sustainable development, the United Nations in 2000 proposed the Millennium Development Goals (MDGs). The MDGs contain eight goals referred to as environment devastation, poverty, hunger, gender inequality, and school issues, which had to be achieved until 2015. During that period, some of the countries have accomplished significant improvement towards the MDGs, while others have not. Namely, the situation varied regarding the country, the goal, and the regions. However, for nearly fifteen years, the mentioned goals were at the center of attention of policy makers worldwide. This resulted in the proposing of the new set of goals called Sustainable Development Goals (SDGs), that will be in focus for the next fifteen years [
4]. Namely, United Nations Members States adopted the “Agenda 2030” in 2015, which backbone is the 17 SDGs pointed to the improvement of the overall situation in the world and hence required joint action.
SDGs contain 17 goals, as is stated previously, of which goals 1–6 belong to the earlier introduced MDGs, while goals 7–17 represent the brand new goals that bring a spotlight on the new sustainability issues. Each goal includes between 5 and 12 targets and, to better monitor the progress and gained achievement relative to the set goals and targets, about 303 indicators are proposed [
5]. The creation of the targets and indicators occupied a lot of the attention and caused the discussions which resulted in their assessment, with the aim to define that there is existing adequate scientific evidence for them [
6,
7]. The final results have shown that about 17% of the proposed targets require revision [
5], and the SD Solution Network (SDSN) proposed 100 Global Monitoring indicators as reliable. Besides, some authors argue that there are inter-linkages among the goals, which, by neglecting, could cause the contradictory final results [
8].
Five years have passed from the SDGs’ adoption and publication of the “Agenda 2030.” There is evidence of assessment of the progress towards certain SDGs. One of the topics that is elaborated, referred to in the SDGs, is under-5 child mortality in the national, regional, and global conditions [
9]. Additionally, child mortality in China for the period 1996–2015 [
10] and neonatal and under-5 child mortality in Africa have been investigated [
11], with assessment of the significance for achieving the SD goals. Also, the scientist observed the maternity mortality from 1990 to 2015, with projections relative to achievement of the SDGs [
12]. Besides, the resources needed for financing the health systems strengthening towards achieving the SDGs in the low-income and middle-income countries are estimated [
13]. The questions of the achievements reached in the field of health are elaborated in the articles of the other authors as well [
14,
15,
16,
17].
Further, how different policy models contribute or hinder the achievement of the SDGs has also been investigated [
18]. Pedercini et al. [
19] addressed the significance of the application of the simulation integrated models as an aid for SDGs’ strategy planning. Mohammed et al. [
20] studied whether there is a connection between smart growths and achieving the sustainability goals, while Salvia et al. [
21] assessed mentioned achievement, but from the local and global perspective. By using a few proven actual methods, Allen et al. [
22] assessed the progress of Australia towards accomplishing the SDGs. Besides the given issues, the authors have discussed the assessment of land degradation [
23], sustainable well-being [
24], renewable energy [
25], and life below water [
26] regarding the achievement of the SDGs. The presented research articles show that the authors have mainly studied achievement of the particular SD goal, and not of all of them. Bearing in mind the fact that there are 17 SDGs, the problem of the assessment of the progress towards their achievement could be considered as the Multiple-Criteria Decision-Making (MCDM) problem.
The MCDM is the field of the operational research and management science that is inclusive of the various techniques pointed to facilitation of the decision-making process [
27,
28]. These methods are widely used in different business fields for prioritization of the given alternatives, and they contribute to the increasing of the reliability of performed decision process [
29,
30,
31]. The comprehensive overview of the proposed methods could be found in the articles of the following authors: Dammak et al. [
32], Zavadskas et al. [
33], and Zavadskas and Turskis [
34]. During the time, the authors have development of certain extensions of the proposed methods based on the fuzzy, interval, or neutrosophic numbers. The state-of-art of the introduced extensions and their applications are presented in the following articles [
35,
36]. As it stated previously, the MCDM methods and models find their application in resolving many real-world and business problems and, only to mention some of them: tourism [
37], information technologies [
38], personnel selection [
39], supply chain management [
40], and many more.
In the area of the assessment of the progress towards achieving the SDGs, the possibilities of the MCDM methods are not fully examined and used. Therefore, the main hypothesis of the paper is that the evaluation of the progress of the considered countries will be facilitated if the assessment approach involves the application of the MCDM methods. In that way, the position of the country towards achieving the particular goal as well as its position relative to the other countries will be determined more easily and with greater extent of reliability. As a result, the adequate methodology will be proposed and the certain conclusion concerned regarding the present situation in the field of sustainability will be derived. Because of that, in this paper is proposed the application of the hybrid model based on the Combined Compromise Solution (CoCoSo) method [
41] and Shannon entropy [
42,
43]. The guiding idea of the paper is to propose a methodology based on the MCDM, which will facilitate the estimation process of the countries’ progress towards SDGs. For demonstrating and testing the applicability of the proposed hybrid model, the 17 indicators regarding the 17 SDGs for the period 2015–2018 are introduced. The evaluation was performed based on the selected indicators connected to each goal, for which the data were available. Although the evaluation and ranking are performed for all mentioned years, because of the paper length, the computational procedure is demonstrated only for data of 2016. The structure of the paper is as below displayed:
Section 1 gives an explanation of the proposed methodology;
Section 2 contains the case study; in
Section 3, the discussion of the results are presented, and the last section presents the conclusion.
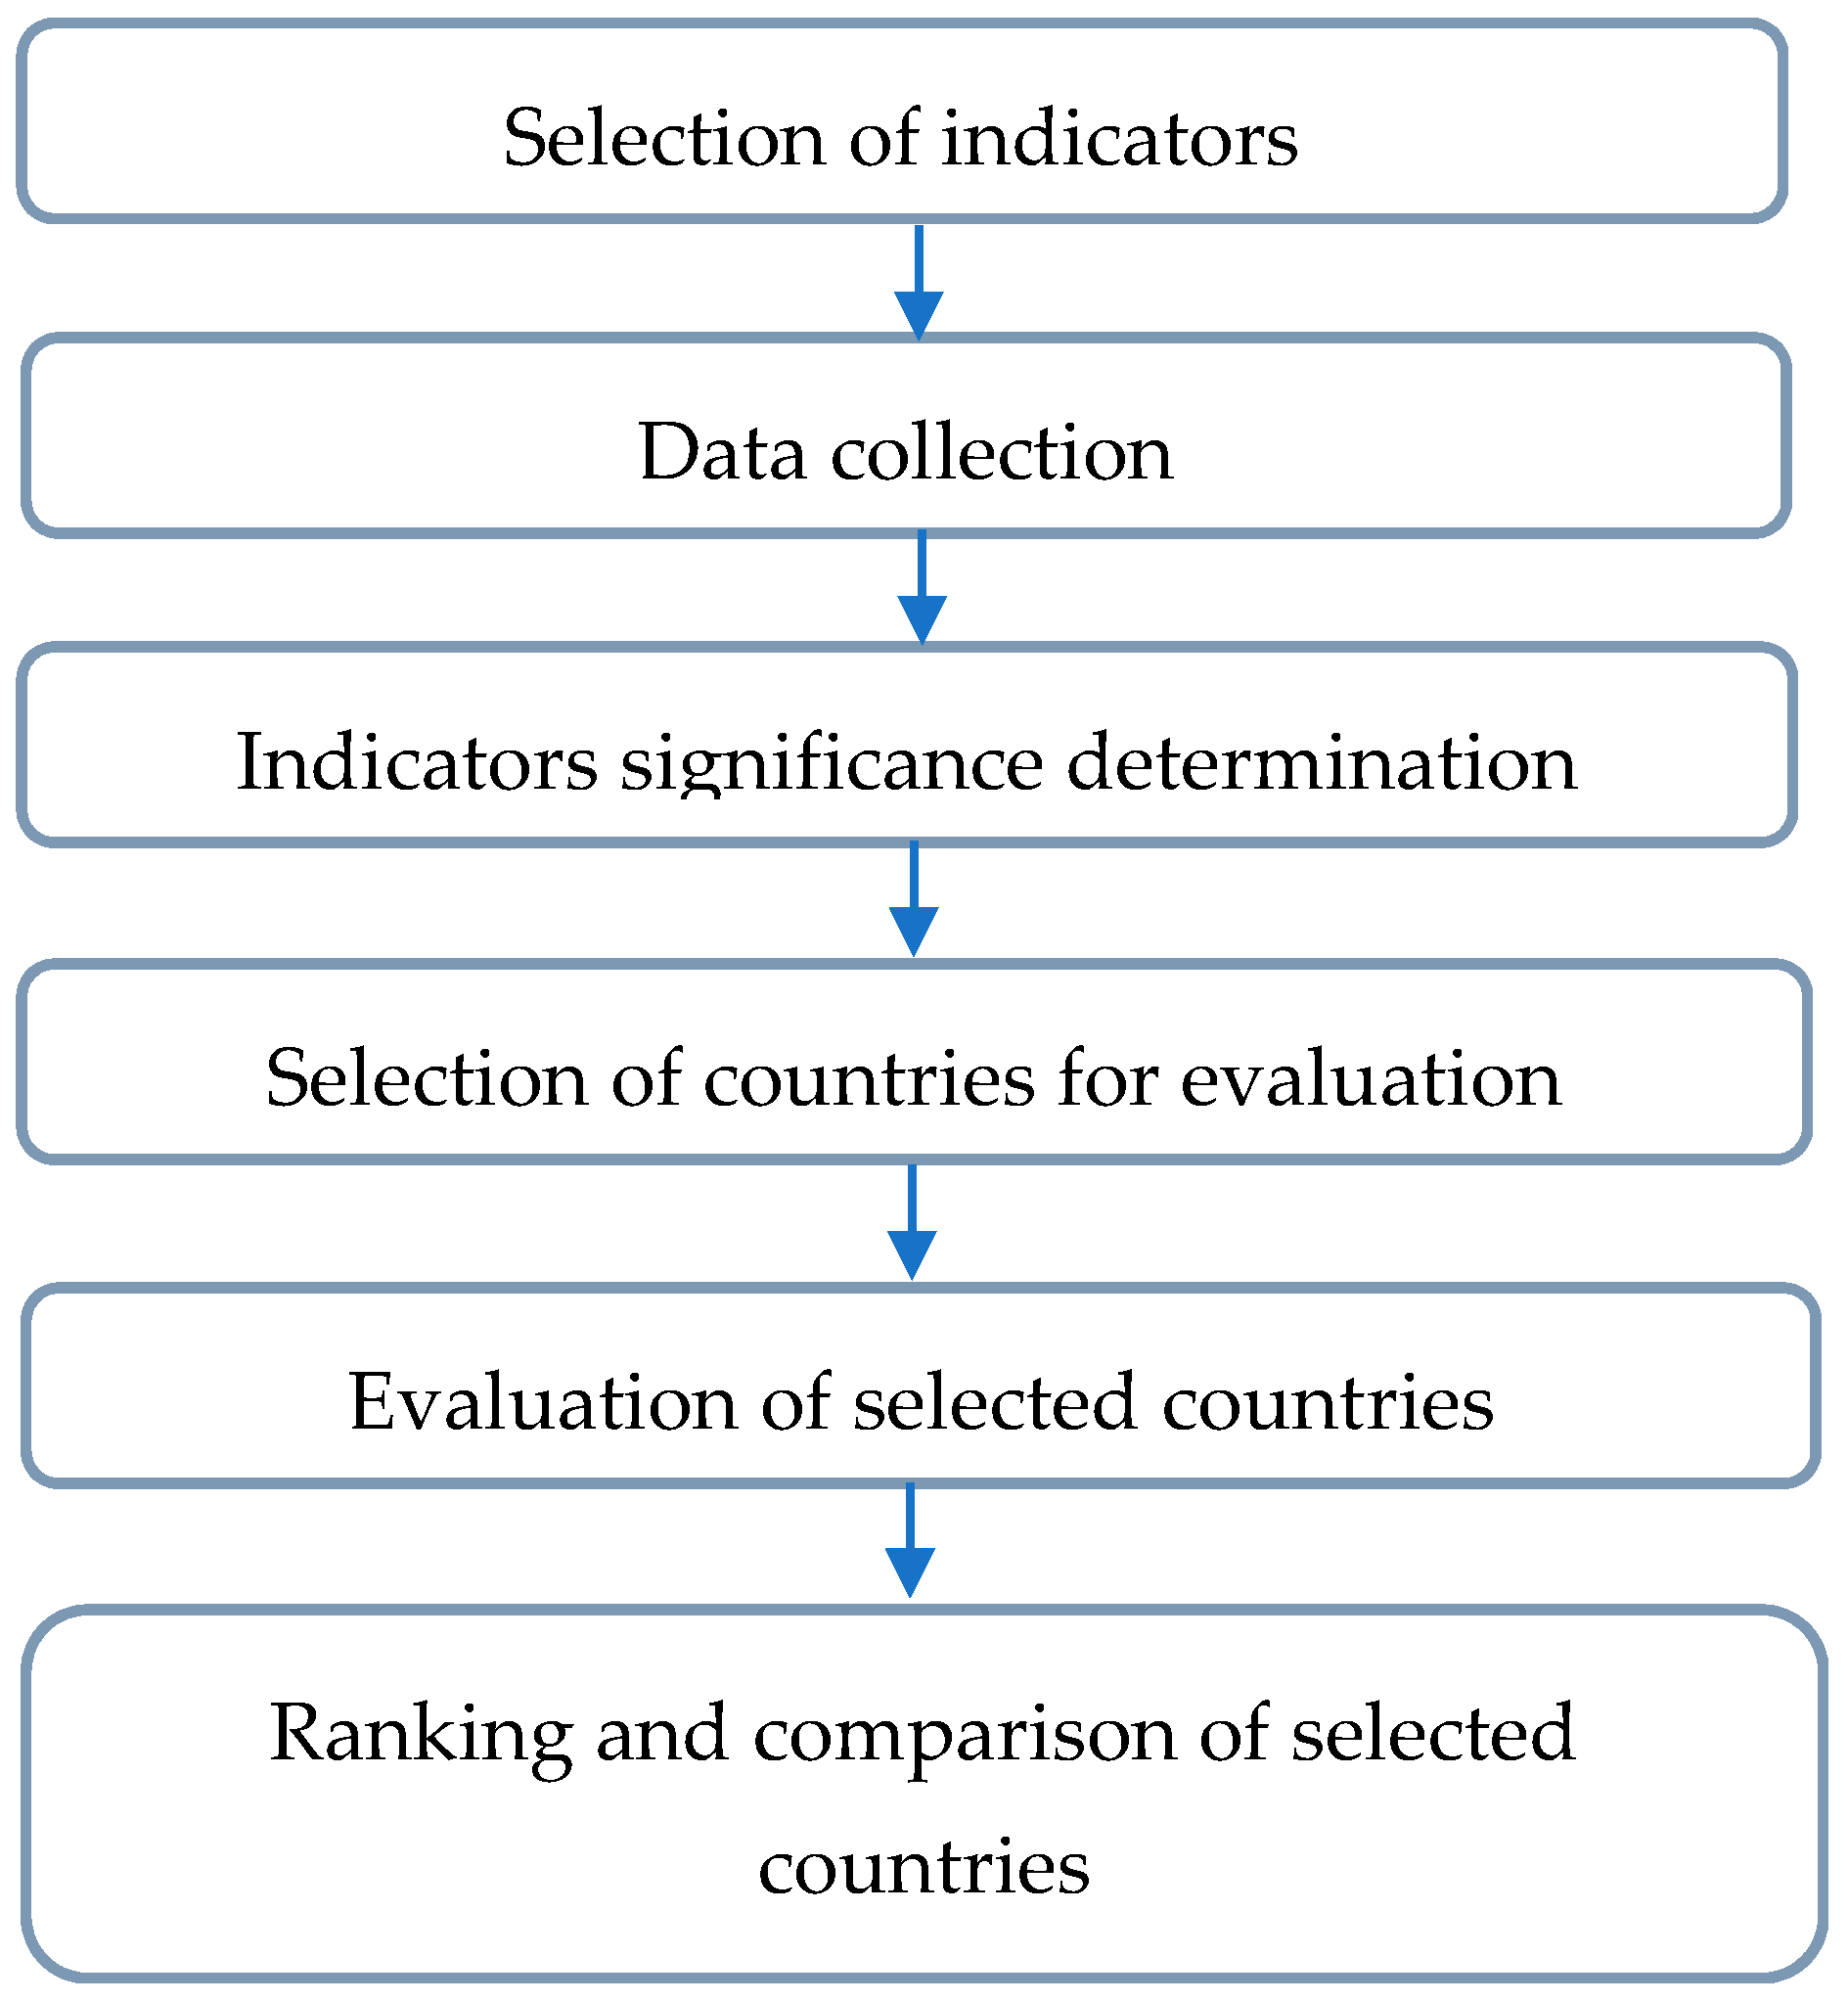
3. Results
The assessing progress towards achieving the goals defined by the implementation of the “Agenda 2030” strategy by using CoCoSo and the Entropy methods, shown in
Figure 1, can be also expressed by applying the following steps:
Step 1. Selection of indicators for evaluation
Step 2. Data collection
Step 3. Determining the significance of indicators
Step 4. Selection of countries for evaluation
Step 5. Evaluation of selected countries
Step 6. Ranking and comparison of selected countries
In this case, 27 EU countries have been evaluated based on 17 indicators adopted from “Agenda 2030” for the period 2015–2018. Due to the paper length, the computational procedure is presented only for 2016. The indicators used for evaluation are shown in
Table 1 and the data regarding the considered indicators for the EU countries are presented in
Table 2.
Normalized decision-making matrix, constructed using Equation (2), is shown in
Table 3. The significances of indicators, obtained using Equations (8)–(11), and optimization directions of indicators are also shown in
Table 3.
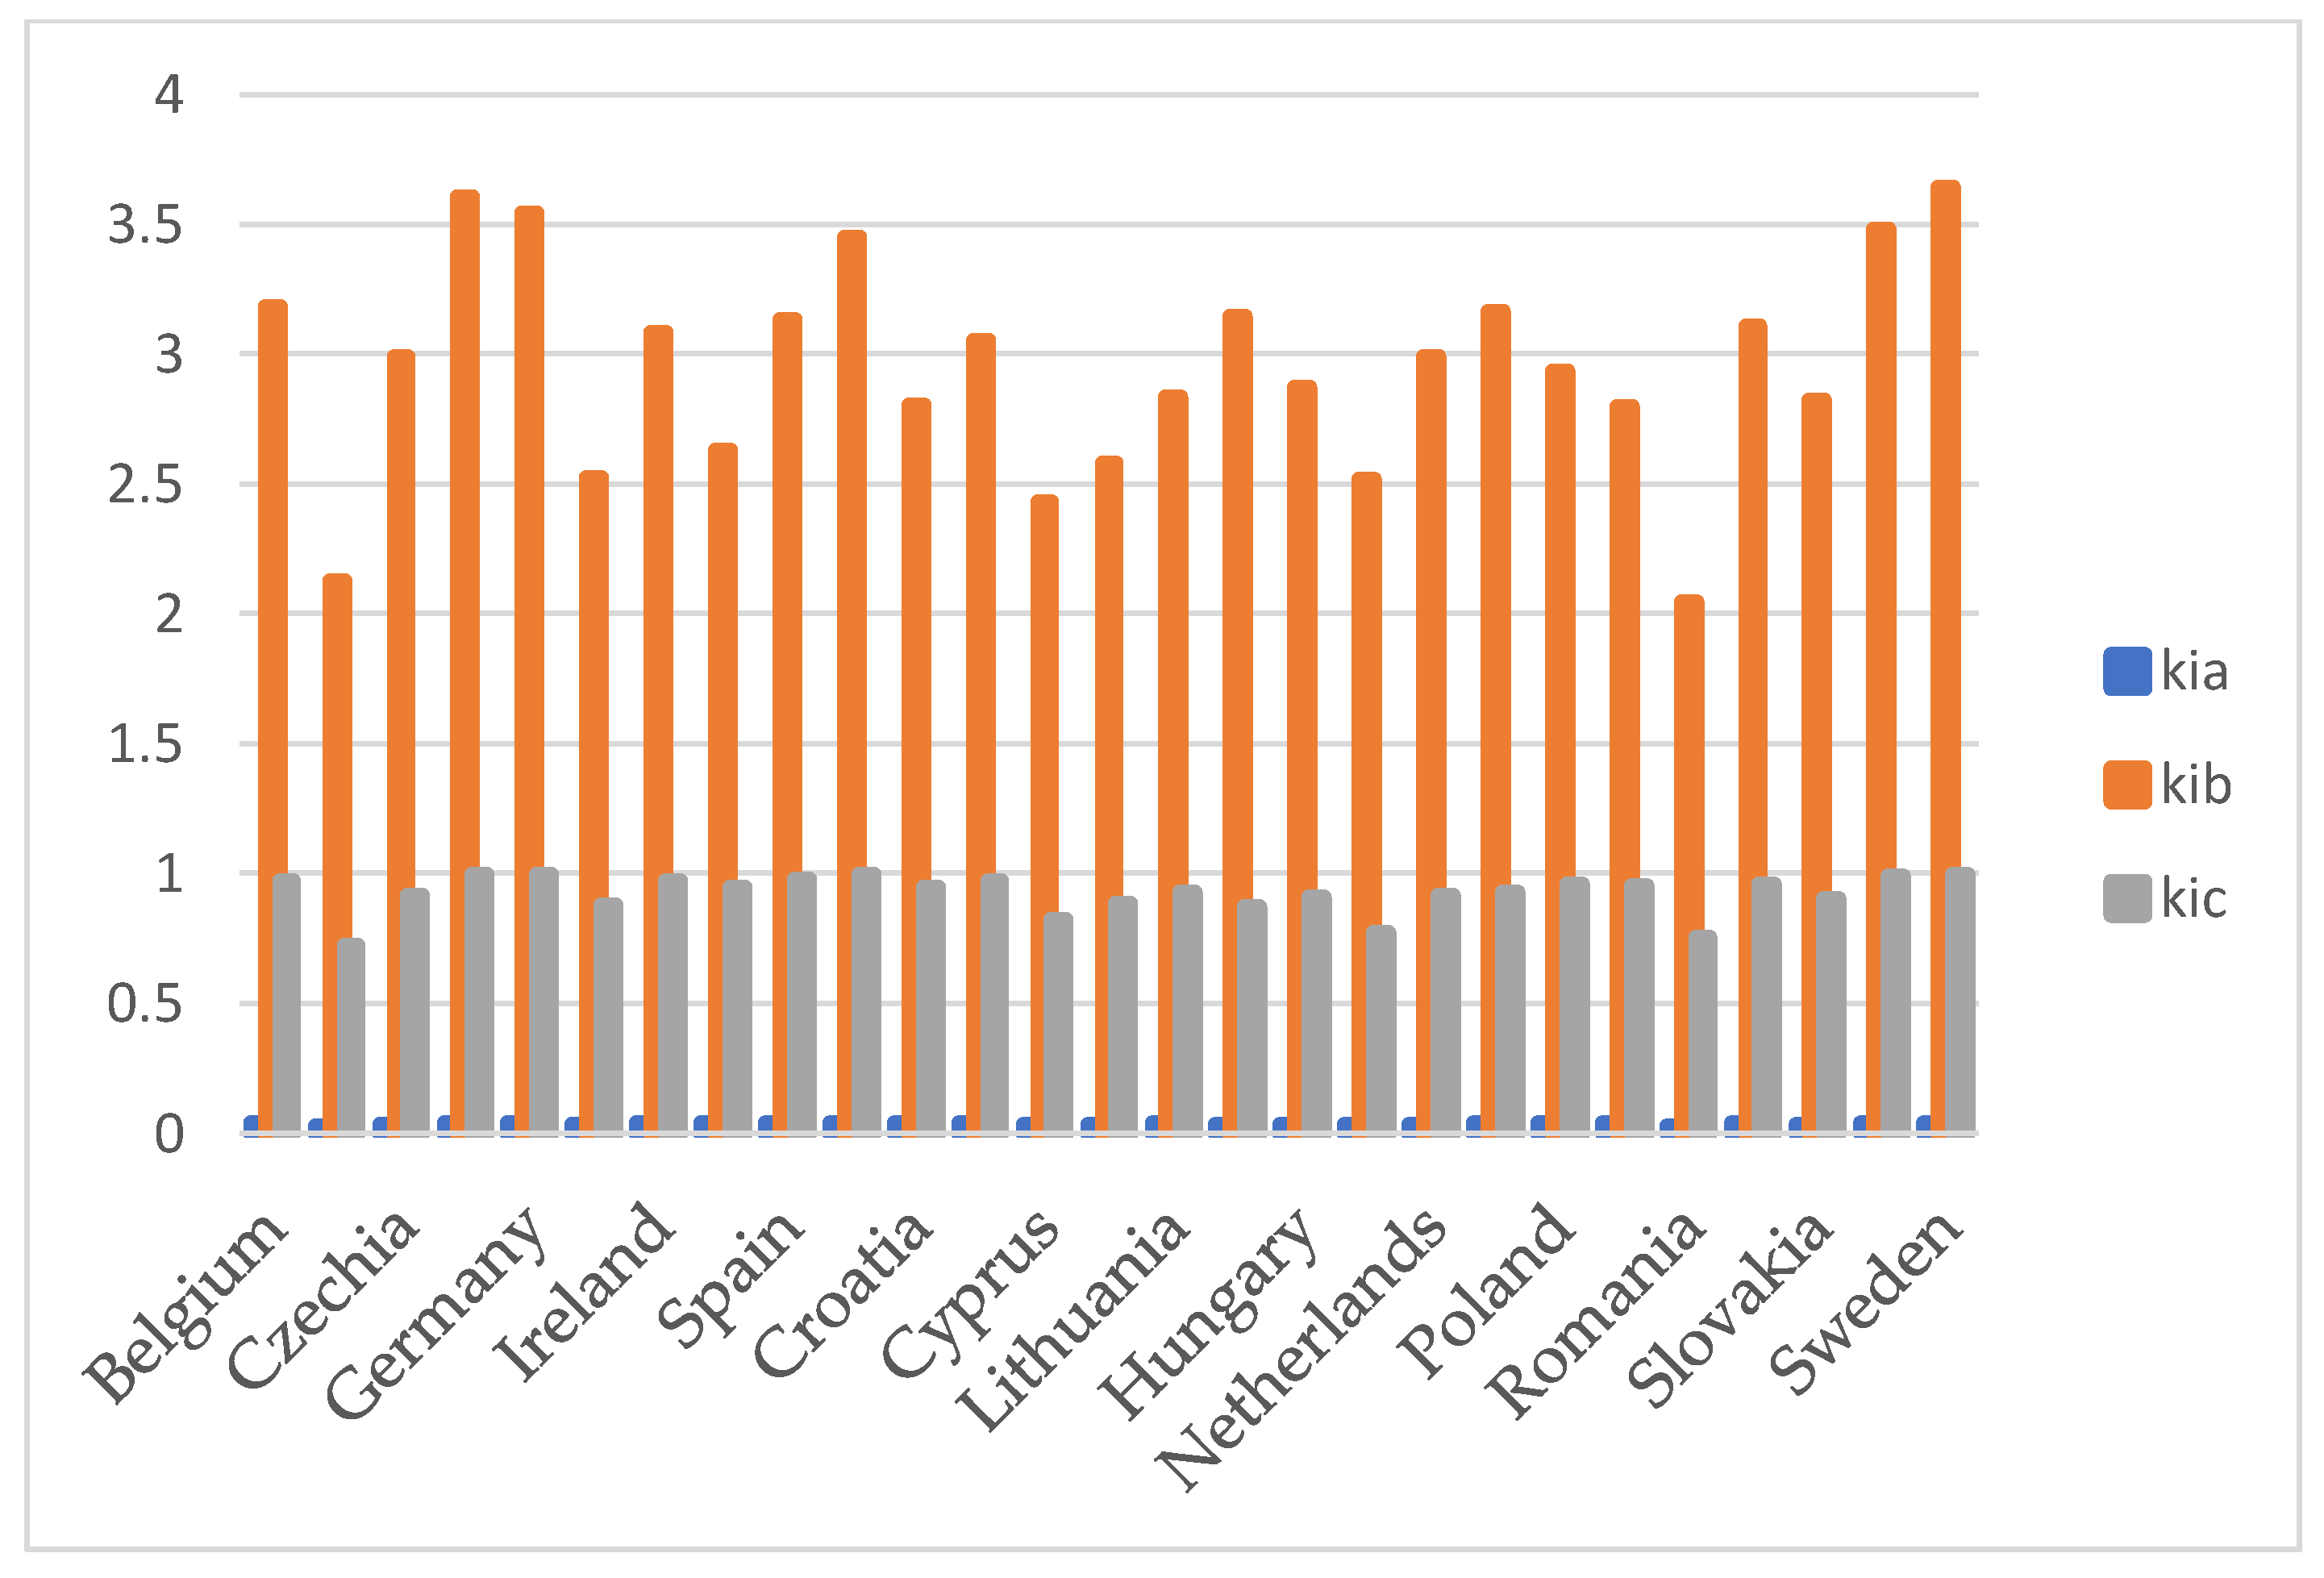
Based on data from
Table 4, the sum of weighted and power-weighted comparability sequences are calculated, using Equations (1) and (2), as it is shown in
Table 4. Values of three aggregated appraisal scores
kia,
kib, and
kic, obtained using Equations (5)–(7), are also presented in
Table 4.
The assessments of progress based on the three scores
kia,
kib, and
kic are shown in
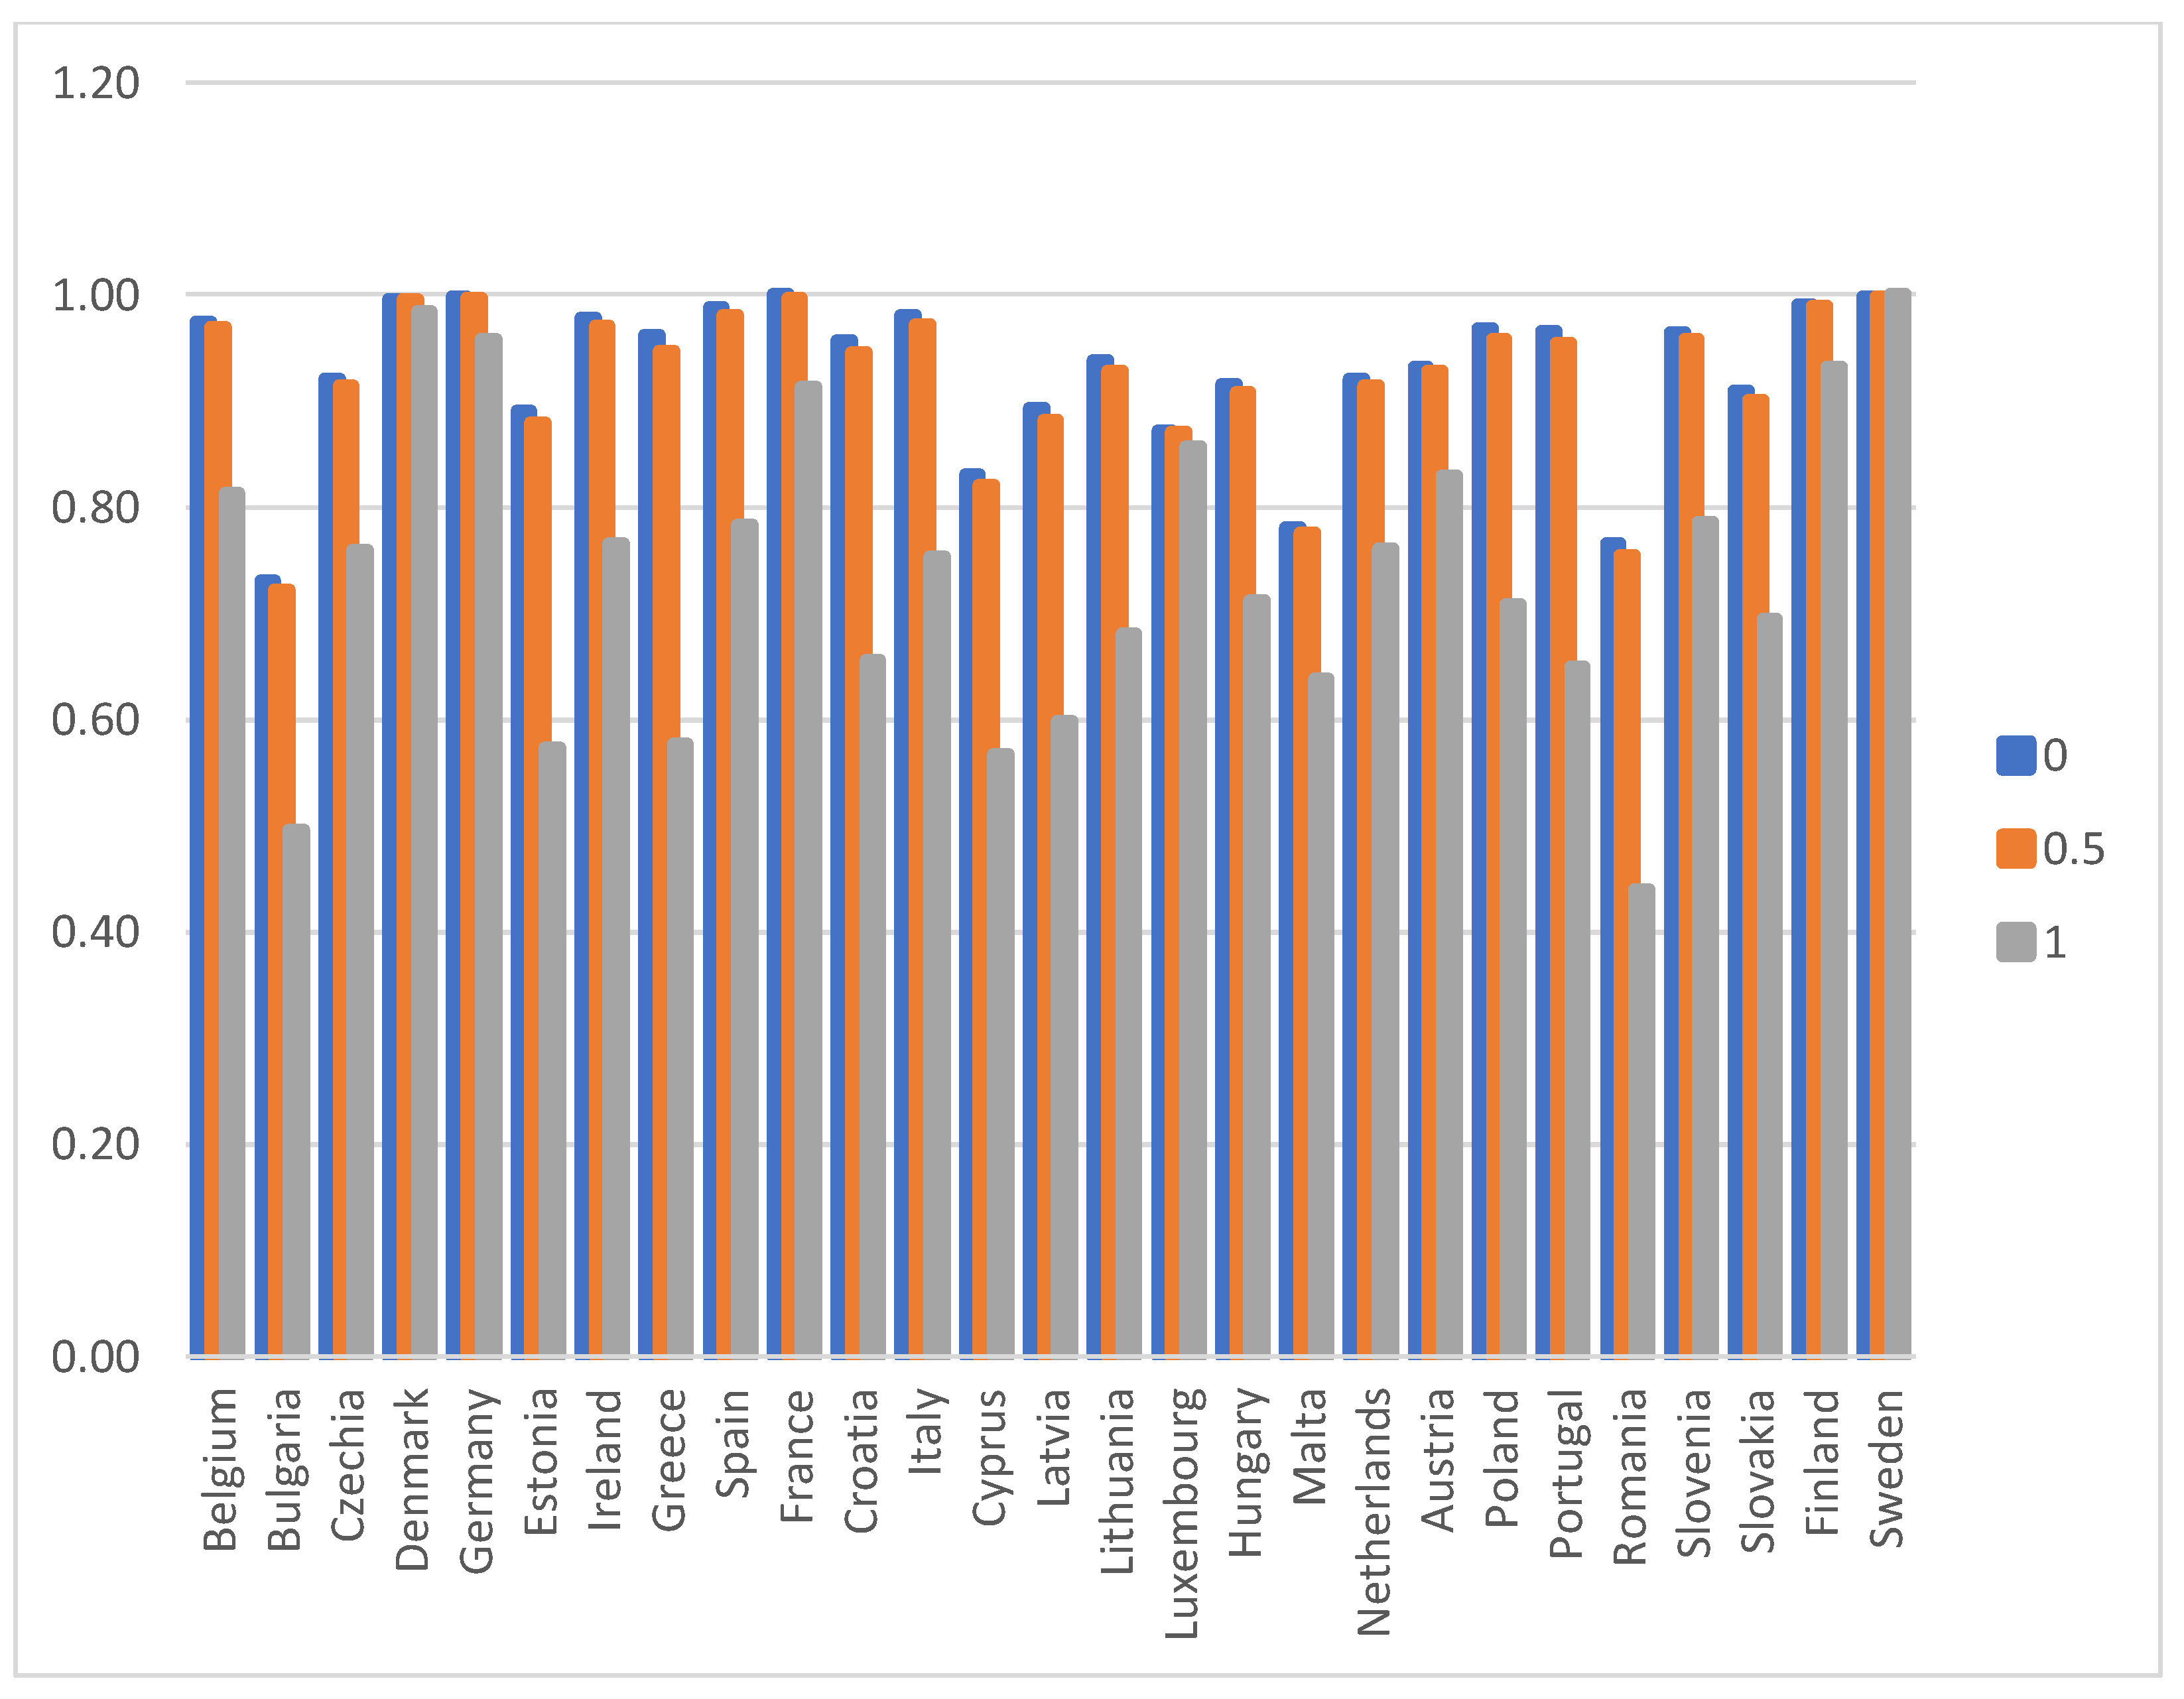
Figure 2, while the impact of coefficient λ to the
kic is shown in
Figure 3.
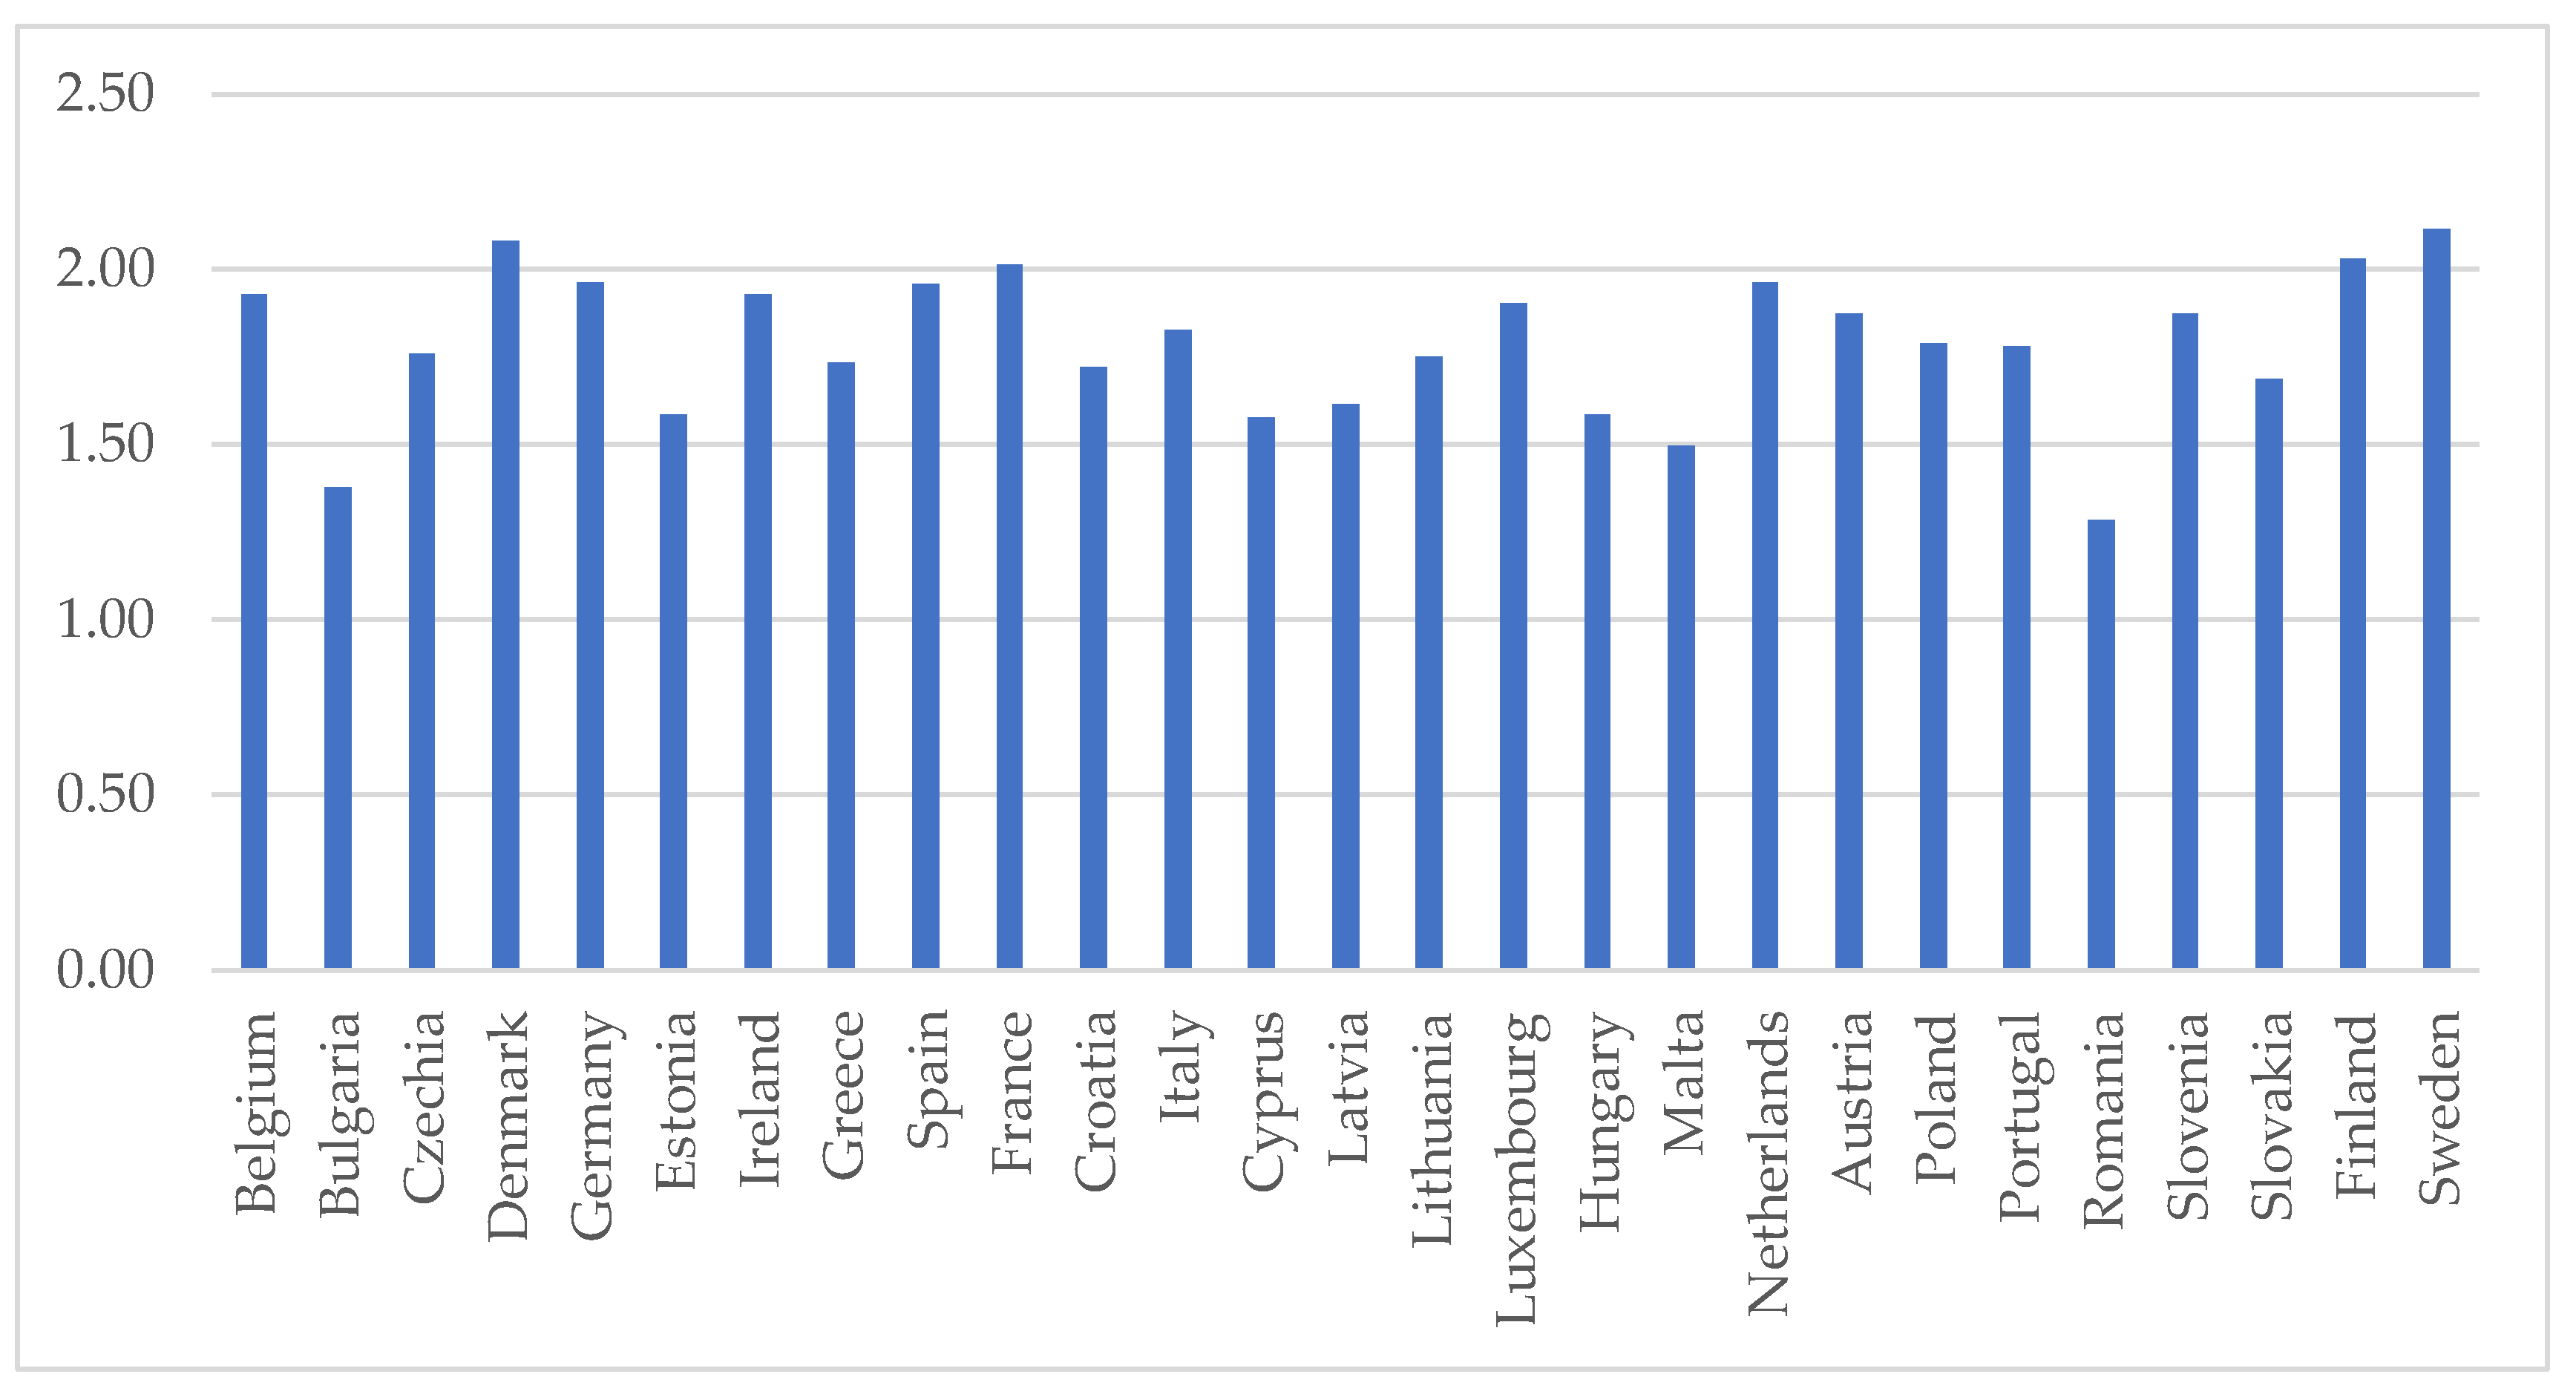
Assessment of progress towards achieving sustainable development goals of the “Agenda 2030” for 2016 has been done based on relative performance score
ki, calculated using Equation (4), as it is shown in
Table 5 and in
Figure 4.
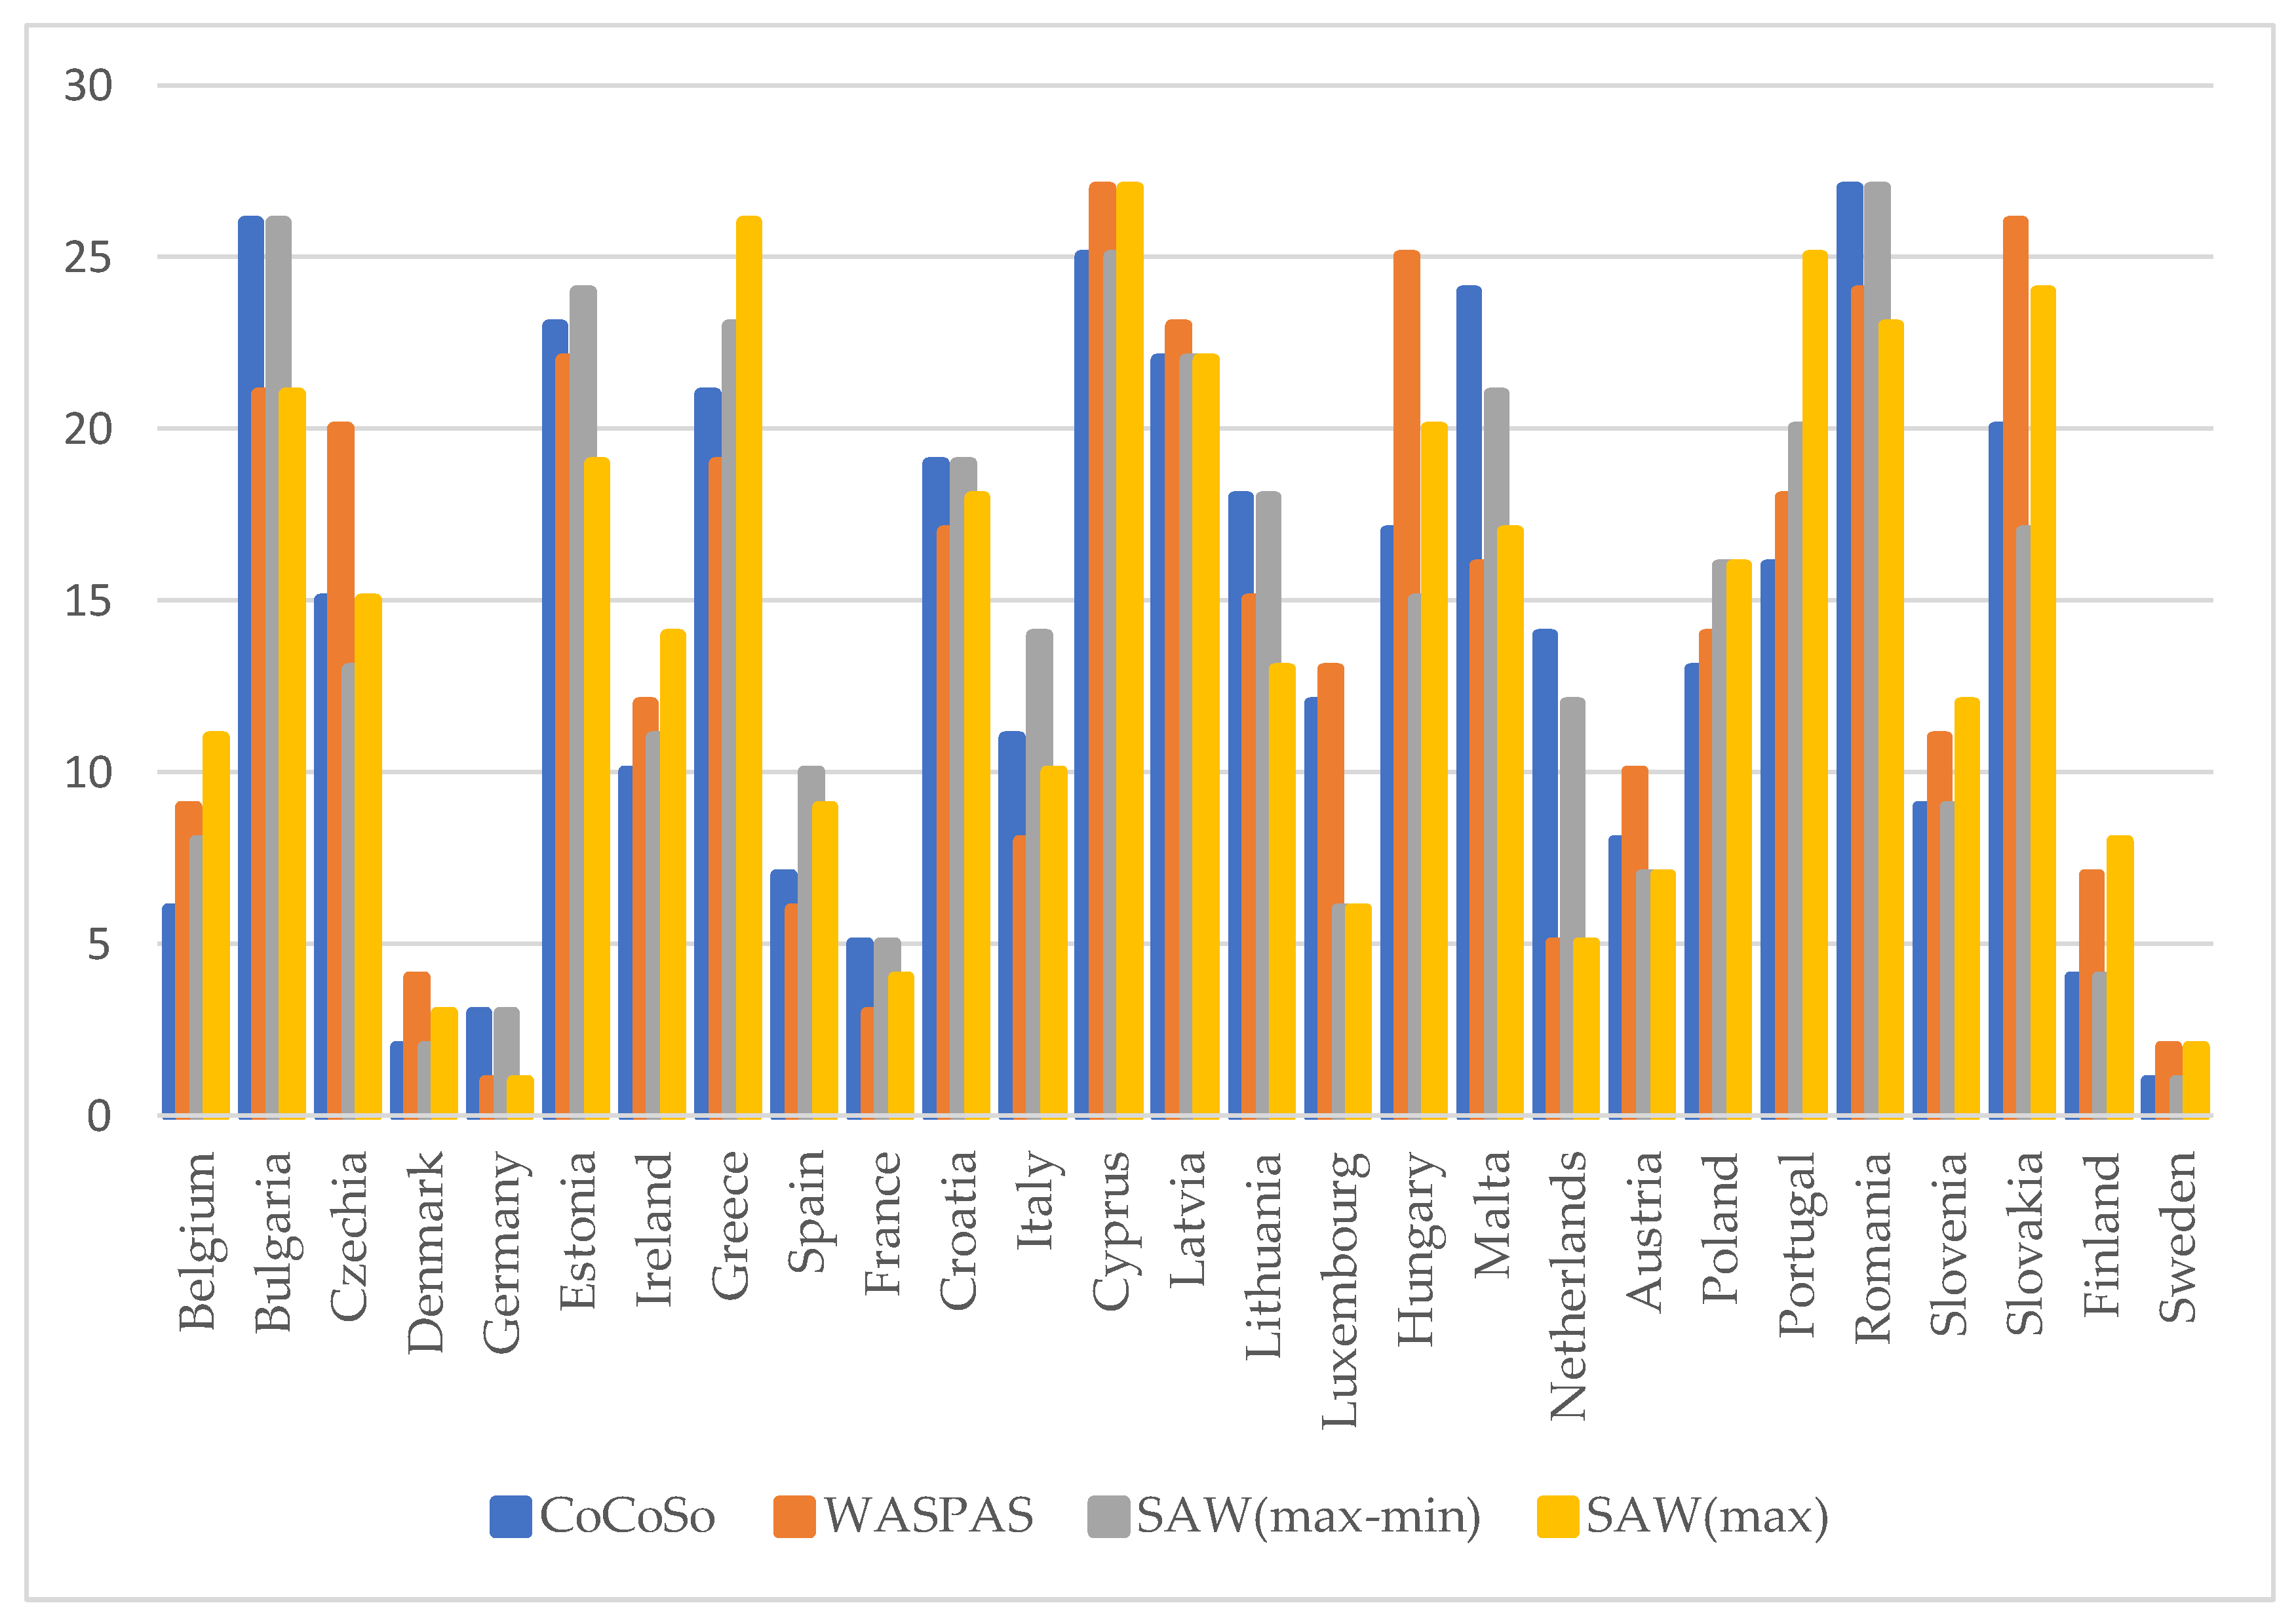
To verify obtained results about assessment of progress, similar calculations have been done with the WASAS method and SAW method with two different normalization procedures that are used in the CoCoSo and WASPAS methods. Obtained results are shown in
Table 6 and
Figure 5.
As it can be seen from
Table 6, results obtained using the CoCoSo method are similar, or very similar, with results obtained using the WASPAS and SAW methods.
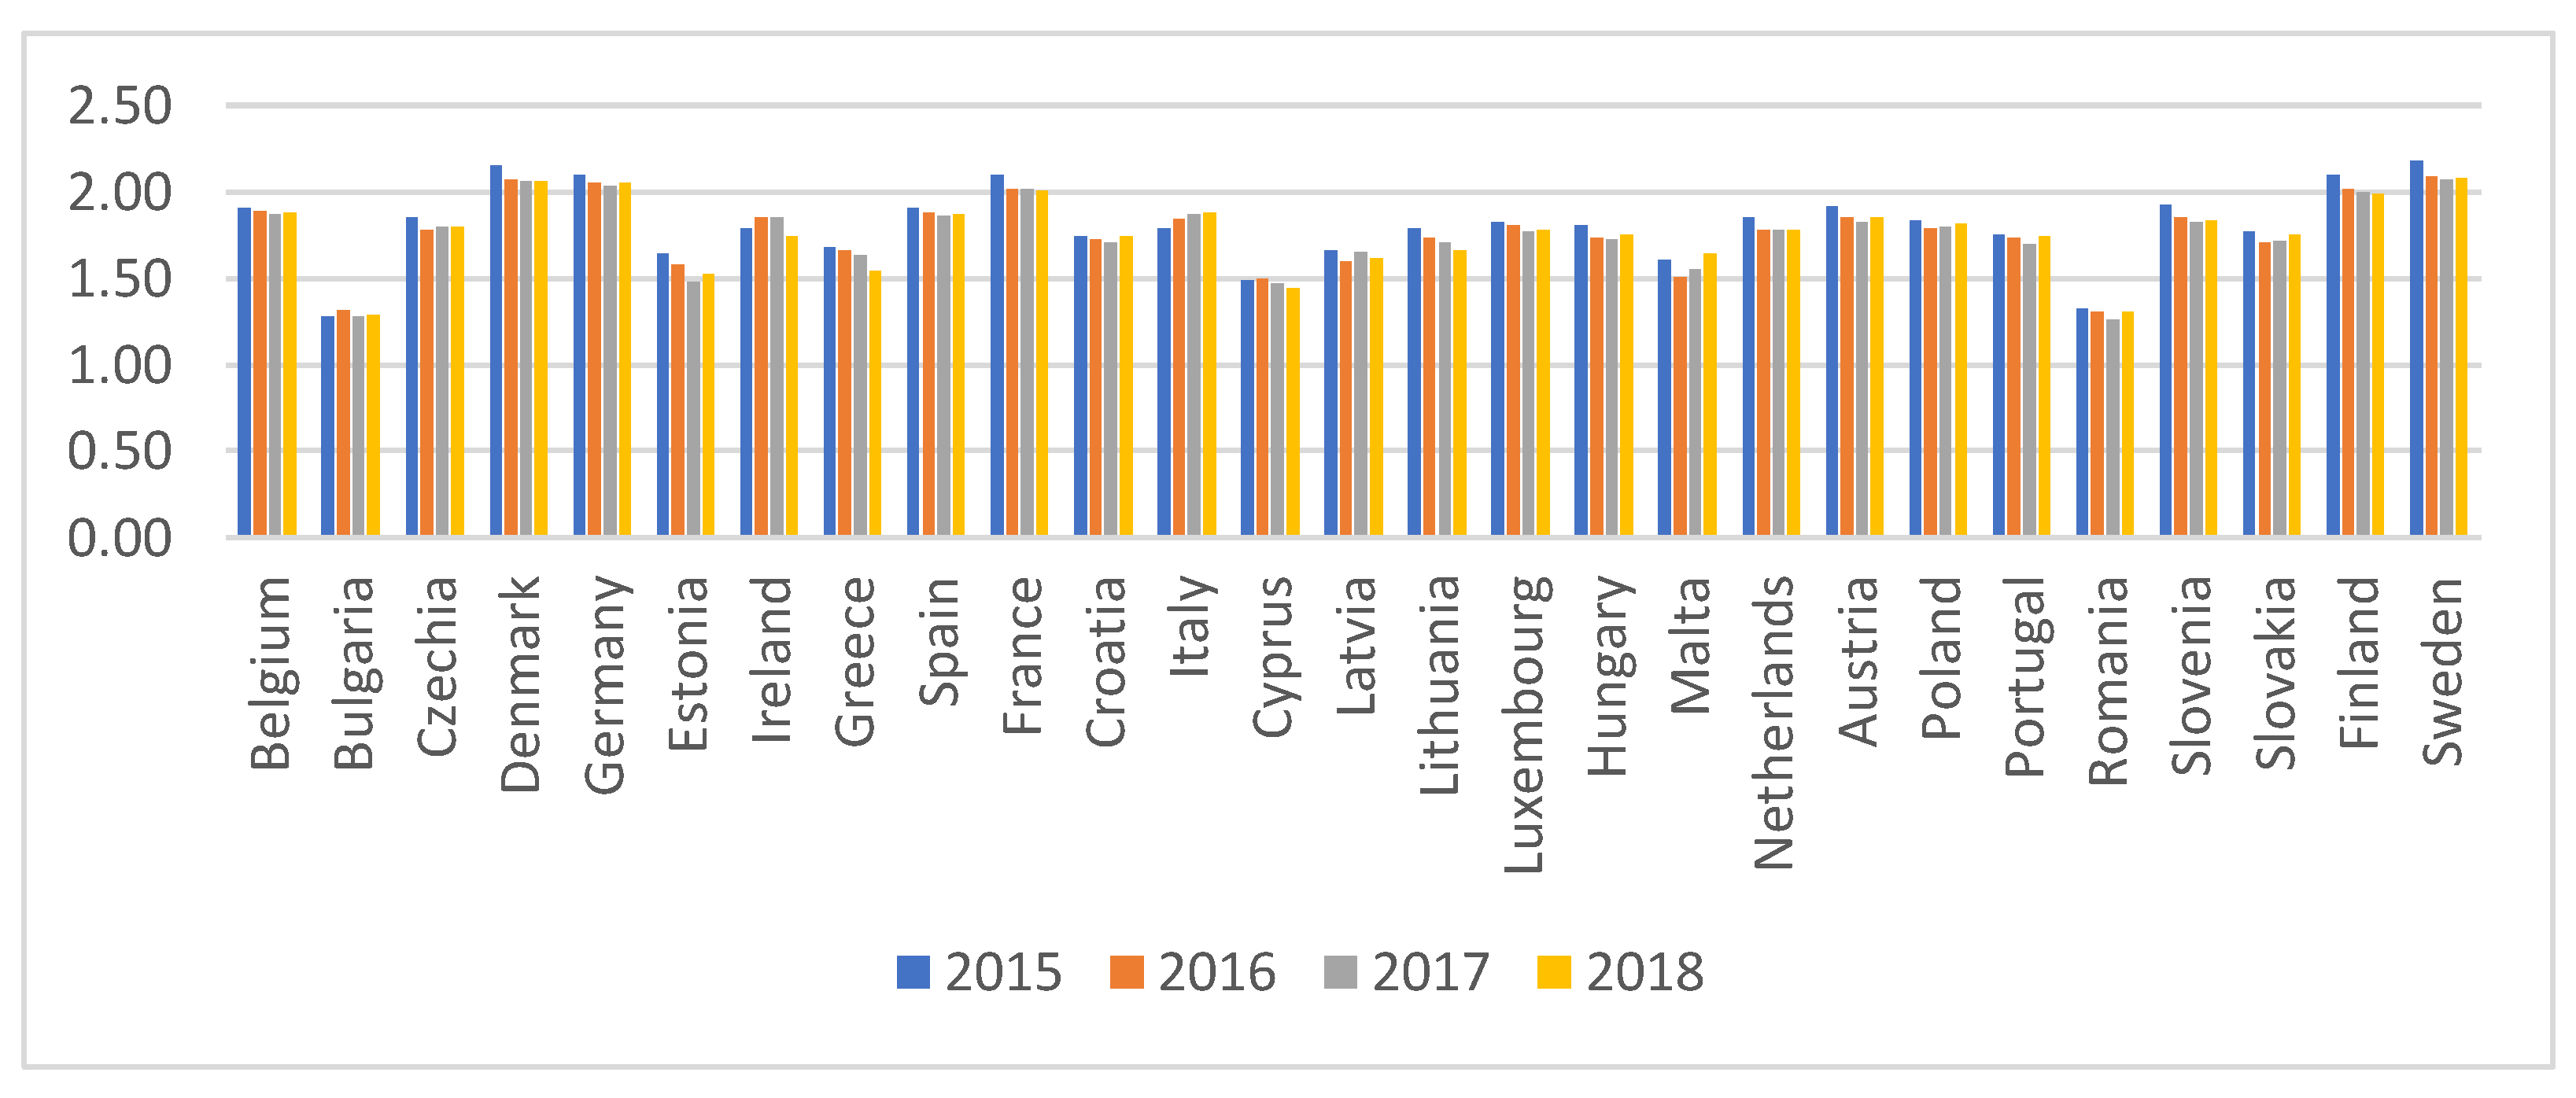
The comparison of the introduced methodology with the proved methods such as WASPAS and SAW confirmed its applicability and the reliability of the obtained results. Therefore, we applied the proposed methodology on the data for 2015, 2017, and 2018 year to provide a more complete picture about the current state regarding the achievement of the SDGs. The gained results are presented in
Table 7 and
Figure 6.
4. Discussion
According to the obtained results, the countries that have made the greatest prosperity towards the SDGs for the period 2015–2018 are as follows: Sweden, Denmark, Germany, France, and Finland. The final results emphasize Sweden as a country that makes the most significant progress towards achievement of the set goals of the “Agenda 2030.” Observation of the input data shows that the gained achievement is not the best in all segments. Despite that, Sweden makes stable and equable progress towards all considered goals. In some areas, such as gross domestic expenditure on R&D by sector, Sweden has the best results from all EU countries. Achievements of Sweden relative to the “Agenda 2030” and expressed results have never been among the worst, but always between medium and the best, which placed Sweden as a country which makes the most considerable progress towards set SDGs.
It is interesting to note that the best-ranked countries belong to Scandinavia and Northern Europe (Sweden, Denmark, and Finland), and Western Europe (France and Germany). Besides, all of these countries joined the EU quietly long since. To be more precise, France and Germany joined the EU in 1957, Denmark in 1973, while Sweden and Finland joined the EU in 1995. The reason for good results in incorporating the positive practice relative to achievement of the sustainable development goals is that the people who live in this part of the Europe much longer work on the adopting of this practice because they are longer in the aegis of the EU. The fact that led to this kind of conclusion is as follows: on the last two positions are Bulgaria (1.38) and Romania (1.28). Both of the mentioned countries are located in Eastern Europe and both joined the EU in 2007. What does this mean? This means that these countries have not incorporated sustainability as a postulate in their policies properly, yet. They should invest time and energy in order to change the point of view and attitude towards the question of sustainable development and sustainable goals. The key issues with which Bulgaria and Romania are faced with are: poverty, high death rate, a lot of households without a bathroom and toilet in the house, low real GDP per capita, low gross domestic expenditure on R&D, low purchasing power, insufficient recycling, high rate of crime and violation. Only resolving of all the mentioned problems and improvement of all considered aspects could change the current state in the given countries and enable them to compete with first positioned countries. Only in that way, they will improve the present position and make achievement relative to the set SDGs and requirements of the “Agenda 2030.”
Furthermore, the countries that possessed the first five places have relatively high GDP per capita. For illustration, according to the data from the Eurostat [
48], average GDP per capita of the first-ranked Sweden for the period 2015–2018 amounts to 46,865 euros. That amount for the same period for Denmark, Finland, Germany, and France is 50,045 euros, 40,382.5 euros, 38,687.5 euros, and 33,950 euros, respectively. Romania, which is in the last position, has the GDP per capita which is five times smaller than, for example, the GDP of Sweden. The higher GDP per capita does not guarantee better achievements towards the set goals. The example of that is Luxembourg, which has extremely high GDP per capita but it is on the twelfth to fifteenth position considering the progress towards SDGs for the observed period of time. The higher GDP points to the economic stability and prosperity of the certain country, but these do not mean that the country is automatically committed to the sustainability goals. Thus, it is evident that the countries with medium-to-high GDP per capita gain better results than that one with quite small GDP per capita. Additionally, the average net income of the households of the best-ranked countries is very high for the analyzed period of time and, for example, for the Sweden amounted to 25,559 euros in 2018 [
49]. On the contrary, the net income of the households for 2018 in the last-ranked Bulgaria and Romania is 3585 euros and 3284 euros, respectively, and it is quite low for the whole considered period. When the income of the households is on the low degree, it is quite understandable that they will not invest in “green solutions.” For example, investing in technologies for the use of renewable energy resources (such as, for example, geothermal energy) requires significant financial resources, but later, the operative costs are lower and these technologies enable producing of “clean” energy. This decreases the pressure on the nonrenewable resources; the GHG emissions are reduced and the sustainability goals are met. However, in the case when the income is quite modest, the less popular solutions regarding sustainability are often chosen.
With the main objective of defining the progress of the EU countries towards the SDGs, Mateusz et al. [
50] applied the TOPSIS (Technique for Order Preference by Similarity) and VIKOR (Vlse Kriterijumska Optimizacija i Kompromisno Resenje) method. In the mentioned paper, Austria, Belgium, Germany, Denmark, Finland, Italy, and Luxembourg are in first place, while Bulgaria and Romania are in the last position among some other countries. For analyzing the improvements in the area of poverty in the EU, Piwowarski et al. [
51] applied the TOPSIS method and VMCM (Vector Measure Construction) method. The finals results outlined Luxembourg, Finland, Austria, Malta, and Spain as the countries that have the best results towards reducing poverty. In the mentioned case, Romania and Bulgaria are in last place, again. To estimate the achieving of the sustainable development goals, Martín and Carnero [
52] applied the AHP (Analytical Hierarchy Process). The obtained ranking emphasizes Norway as a country with very high sustainability, while Sweden, Denmark, the United Kingdom, and the Netherlands achieved a high degree of sustainability. In this case, Romania and Bulgaria are again among the countries that are on the very low level regarding sustainability. By observation of the results obtained by other researchers, it is obvious that there are similarities with the results presented in this paper here. As can be seen, there are some overlaps between the results regarding the first- as well as the last- positioned countries.
Finally, it can be concluded that the applied methodology is fully adequate and that the obtained results are real and justified, which confirms the stated hypothesis at the beginning of the paper. For the purpose of this paper, the combination of the Shannon Entropy and CoCoSo methods was used. The Shannon Entropy was applied for determination of the criteria weights, i.e., significance of the considered indicators. The main reason for the application of the Shannon Entropy relies in its objectivity, which enables minimizing the subjectivity onto the lowest level. The final ranking of the EU countries is performed by using the CoCoSo method, which is applicable and easy to use. Results obtained in this way represents a compromise solution that acknowledges differences among the evaluation criteria. In that way, this avoids the situation of the better ranking of countries that have good achievements only relative to certain goals, while the others are quietly bad. This compromise solution gives the perspective about the balanced achievements of the countries that are assessed. Besides, the comparison with other proved MCDM methods verified the usefulness and reliability of the proposed method. Although some authors, such as, for example, Miola and Schiltz [
53], stated that the position of the country strongly depends on the chosen methodology and indicators, it could not be denied that involving the SDG indicators in the appropriate decision model would contribute to having a clear picture about sustainability level achieved in the particular country and their position relative to the others.
The main constraint of this paper is connected to involving the data for only 17 indicators in the evaluation process. By taking into consideration all proposed indicators, the obtained results will be more robust and reliable. Besides, the estimation of the progress of the countries by each goal separately and set of indicators connected to it will enable gaining more realistic insight into the current situation in the field of sustainability, and it will contribute to better projection of future trends. Because the proposed methodology proved its usefulness in the area of the assessment of the achievements regarding sustainability, the preposition for future work involves conducting the assessment procedure based on the MCDM methods, considered goals and indicators, and targeted values. Introducing the targeted values in the assessment model will ensure acquiring of the objective results that will better illustrate the current position and progress towards desired goals and emphasize the possible shortcomings that should be resolved. Besides, the proposed model could be improved by fuzzy, grey. or neutrosophic extensions and for the determining of the weights of the criteria the objective-subjective approach could be implemented. Despite this, the model based on the Shannon Entropy and CoCoSo methods proved its applicability and proves to be very convenient for estimating the progress of the EU countries towards achieving requirements from the “Agenda 2030.”

 ,
, 


