Article

Mechanical Characteristics of Soda Residue Soil Incorporating Different Admixture: Reuse of Soda Residue

1
Department of Civil Engineering, Qingdao University of Technology, Qingdao 266033, China
2
Cooperative Innovation Center of Engineering Construction and Safety in Shandong Blue Economic Zone, Qingdao University of Technology, Qingdao 266033, China
*
Author to whom correspondence should be addressed.
Sustainability 2020, 12(14), 5852; https://0-doi-org.brum.beds.ac.uk/10.3390/su12145852
Submission received: 2 July 2020 / Revised: 16 July 2020 / Accepted: 18 July 2020 / Published: 21 July 2020

Abstract

:
Soda residue (SR), a waste by-product of sodium carbonate production, occupies land resources and pollutes the environment seriously. To promote the resource reusing of waste SR, this paper studies the feasibility of utilizing SR for the preparation of soda residue soil (SRS) through laboratory and field tests. The SR and fly ash (FA) were mixed with six different proportions (SR:FA is 1:0, 10:1, 8:1, 6:1, 3:1, 1:1) to prepare SRS, and the optimum water content, maximum dry density, shear strength, and unconfined compression strength of the SRS were measured. The representative SRS (SR:FA is 10:1) was selected to investigate the compression performance and collapsibility. The preparation and filling method of SRS in the field was proposed, and the effects of gravel, sand, and lime on the mechanical properties of SRS were studied through field tests. The results show that the addition of FA contributed to the strength development of SR, and the addition of lime, sand and rubble have a significant effect on the subgrade bearing capacity of SRS. The subgrade bearing capacity and deformation modulus of SRS in field tests is more than 210 kPa and 34.48 MPa, respectively. The results provide experimental basis and reference for the preparation of SRS, the scientific application of SRS in geotechnical engineering to promote sustainable development.

1. Introduction

Sodium carbonate is one of the important organic chemical raw materials, widely used in the chemical industry, food industry, metallurgical industry, textile industry, and many other fields [1,2,3]. The ammonia soda process is the common method for manufacturing sodium carbonate, but this method produces a large amount of soda residue (SR) during production [4,5]. According to statistics [6,7], in China, the production of sodium carbonate using the ammonia soda process exceeds 10 million tons per year, and the resulting SR reaches 3 million tons per year [8]. At present, building a storage yard next to the soda plant and discharging the SR into the storage yard is a common way to dispose of the SR [9,10,11]. However, this approach has the disadvantage of occupying amounts of land, polluting the local ecology, and failing to achieve sustainable resource and economic development [12,13]. From the remote sensing maps (Figure A1), more than 15 km2 of land areas near the soda plant were occupied by the storage of soda residue in four stacking fields, and the effective utilization rate of SR is less than 5% [14]. The dry SR powder was dispersed by the wind, and the pollution range is up to 5 km, which can stimulate human eyes and the respiratory tract. In addition, the alkalinity and chloride ion from SR pollute the local soil and water ecological environment through seepage [15]. By monitoring the water quality of the wells around the SR storage yard, the chlorine ion content of one well increased from 86 mg/L to 1490 mg/L within four years, the chloride content of another well increased from 141 mg/L to 3720 mg/L within nine years, and the PH values were all greater than 9 [16]. The scientific treatment of SR has been a troublesome problem.
Therefore, seeking sustainable methods to dispose of the SR has become the main subject of many studies. Previous studies showed that the free chloride ion in SR can react with the fly ash (FA), and the gelling substances generated by the reacting can fill the pores of the SR and reduce the seepage rate of chloride ion and the PH of SR [17]. Moreover, FA can adsorb free chlorine ions in SR and effectively inhibit the dissolution of chlorine ions from SR [18,19]. Mixing SR with FA and other materials can effectively reduce the pollution of the local environment caused by chloride ion seepage from SR. The chemical composition of SR and alinite mineral is very similar, but differing in content of Cao, CaCI2 [20,21]. Hou [22] fired a white cement using SR as raw material. The main component of the cement is alinite minerals, the chemical formula is Ca11(Si0.75Al0.25)O18CI, which is synthesized by Cao, SiO2, Al2O3, MgO, and CaCI2. The cement has the advantages of the concrete hardening quickly and early strength being high. Kesim et al. [23] used soda sludge (73.5 wt %), clay (26.3 wt %) and iron ore (0.2 wt %) as material to prepare a cement successfully and studied the properties of the cement. The reach of reference [23] showed that the compressive strength of the prepared cement is 26.6 MPa. Some scholars also used SR as the raw material, using different admixtures, different methods to produce different cement and mortar [1,4,8,12]. It is estimated that 7.8 –10.0 million tons of SR have been output annually; less than one percent of the SR is reused scientifically, referenced from the literature [10,14]. It can be seen that the SR consumption of these methods is little, and the application of SR is also well below its discharge.
Fly ash (FA) is a by-product of coal combustion for electricity production, and an average of 0.3 tons of FA output are following the 1.0 ton in the process of coal combustion [24,25,26,27]. FA is a corrosive waste, and large amounts of fly ash pollute the local air and environment. The main chemical compositions of FA consist of silicon, aluminum, and iron oxides, and the lime content is less than 10% [25,28]. SR has positive effects on the early strength, good stability, and microstructure of the FA [29], and the mixture of SR and FA as the potential cement and engineering soil alternative for building material. Sun et al. [30] used SR and FA as the main materials to prepare the new non-clinker solidified soil, and investigated the engineering properties of the solidified soil. The research showed that, when the mass percentage of the curing agent is 20%, the mechanical properties of the solidified soil is similar to the solidified soil with 10% composite cement. Zhao et al. [10] developed an alkali-activated fly ash cement that was composed of SR, FA, and NaOH. The results showed that the compressive strength of the mixture is 22.04 MPa, the mixture can be used as an engineering soil. Yan et al. [31] studied the properties of the mixture of SR and FA through laboratory tests. Ji et al. [32] investigated the feasibility of using alkali waste to backfill the waste salt caverns through laboratory model test and found that the compressibility of the SR is very high, the compression modulus is 2.51 MPa. In the subsequent study, FA was used to improve the mechanical properties of the backfilled SR, and the research showed that the mixing of fly ash can enhance the strength and compressibility effectively of the mixture. However, studies on the disposal of SR are not comprehensive and in depth; most scholars used laboratory test to study the mechanical characteristics of soda residue soil (SRS). Moreover, previous studies have not investigated the method and feasibility of field filling of SRS; field tests can better simulate the real stress state of soil, and the test results are more accurate and reliable. It has rarely been reported that sand, rubble, and lime are used as raw materials for preparing the soda residue soil (SRS) through field test, and the feasibility of the field-filling method of SRS has not been investigated in previous studies.
The main objective of this paper was to reuse the SR into a value-added product, as well as study the feasibility of utilizing SR and FA as raw materials to prepare SRS for geotechnical engineering through laboratory and field tests. Five types of SRS with different FA contents were prepared, and the optimum water content, maximum dry density, direct shear strength, and unconfined compression strength were studied. The tests can be used to study the compaction characteristics of SRS with different ratios and the influence of age and mixing proportions on the strength of SRS. The compaction coefficient and collapsibility coefficient of SRS (SR: FA is 10:1) were also investigated. These experiments can be used to study the influence of water content and compaction coefficient on the compressibility characteristics and the water stability of SRS. Moreover, the mechanical properties of SRS with different mixing proportions were studied and probed through a series of field tests. The test results will provide an experimental basis for sustainable resource utilization of SR and FA.

2. Materials and Methods

2.1. Materials

The main raw materials for the test were soda residue (SR) and F class fly ash (FA), which were taken from a soda plant and a power plant in Shandong province of China, respectively. In this study, the chemical composition of SR and FA were obtained using XRF-1800X X-ray fluorescence spectrometer. After drying and grinding the samples, they were passed through a 240 mesh sieve. The samples were dispersed on a plexiglass support, and overlapped particles were manually separated by using a spatula, referenced from the literature [33,34]. The prepared sample was put into the sample table of the spectrometer; the cooling water switch was turned on, and the circulating water pump, and the test was conducted. After the test, we turned off the spectrometer, and we turned off the circulating water pump and the main power supply 15 min later. The chemical composition of SR and FA can be identified by comparing the measured X-ray energy values with the known characteristic X-ray energy values of each element, referenced from the literature [35]. The calibration and test methods refer to the spectrometer: test methods for main performance of energy dispersive X-ray fluorescence spectrometer (GB/T 31364-2015). The chemical composition of SR and FA are shown in Table 1 [34].
The main chemical composition of SR is insoluble salts, including calcium carbonate (CaCO3), calcium sulfate (CaSO4), and oxides of iron (Fe2O3). The SR includes 67.01% mass percentage of the calcium-containing components, such as calcium carbonate, calcium sulfate, and calcium chloride (CaCI2). It can be seen that the main components of the soil skeleton are present in the SR, which offers the possibility of using SR to make engineering soil.
The main chemical composition of FA consists of oxides of silicon (SiO2), aluminum (Al2O3) and iron (Fe2O3), compounds of calcium, and magnesium. The silicon oxide and alumina oxide give FA the properties of volcanic ash [10]. When the FA is mixed with SR, most of the FA is hydrated to form gelling substances, and gelling substances filled in the pores of the mixture, which can improve the strength of the mixture [15].

2.2. Methods

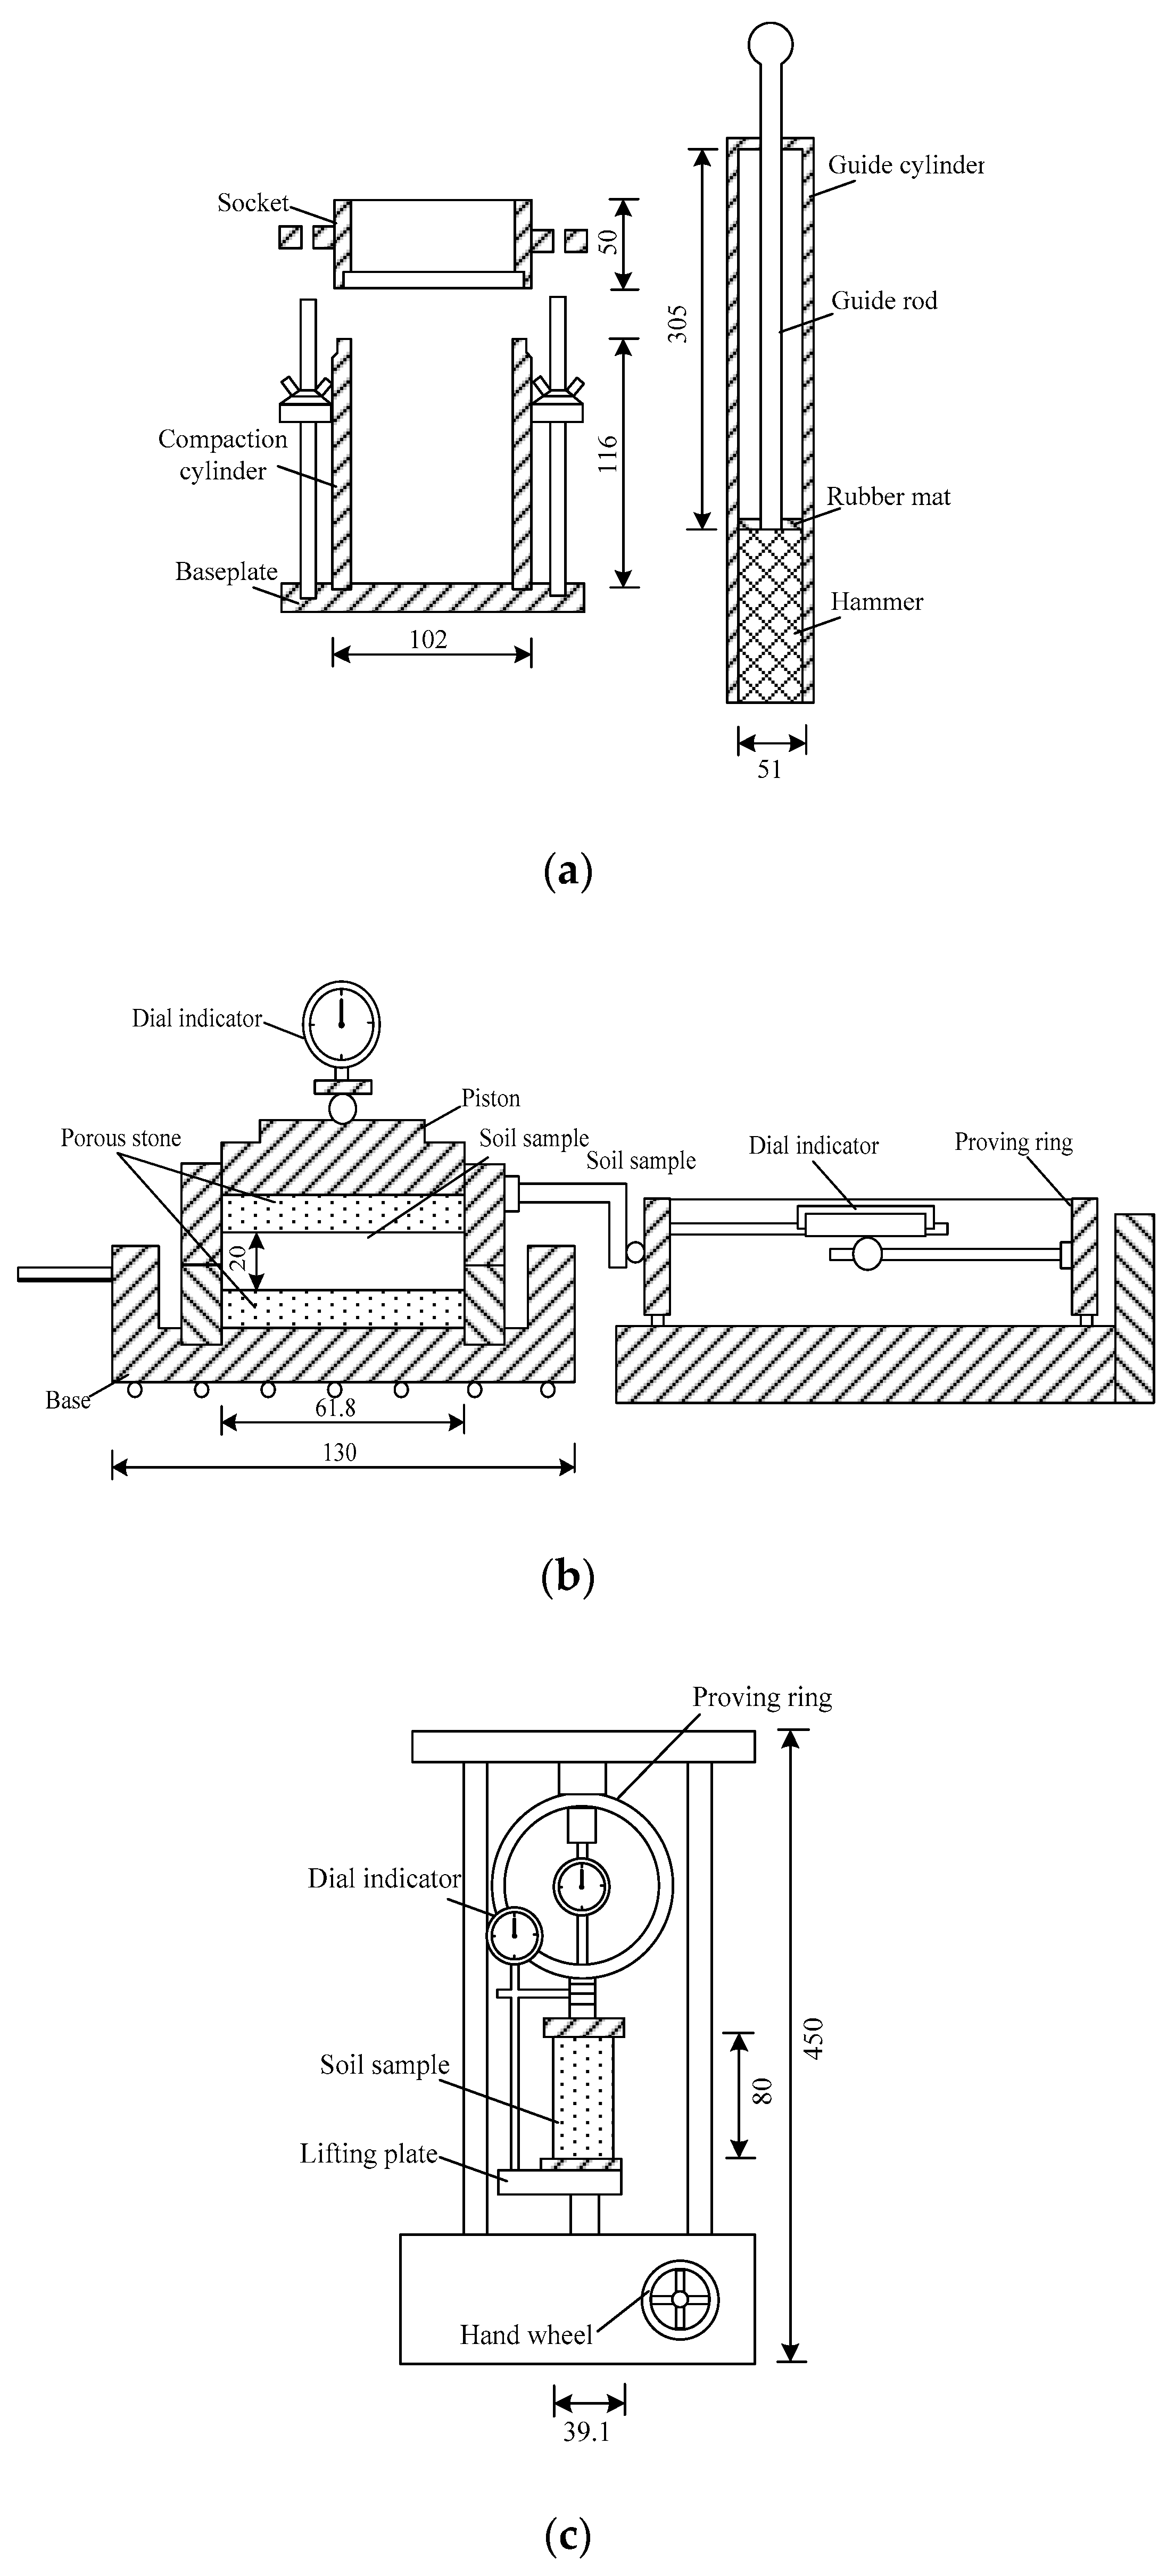
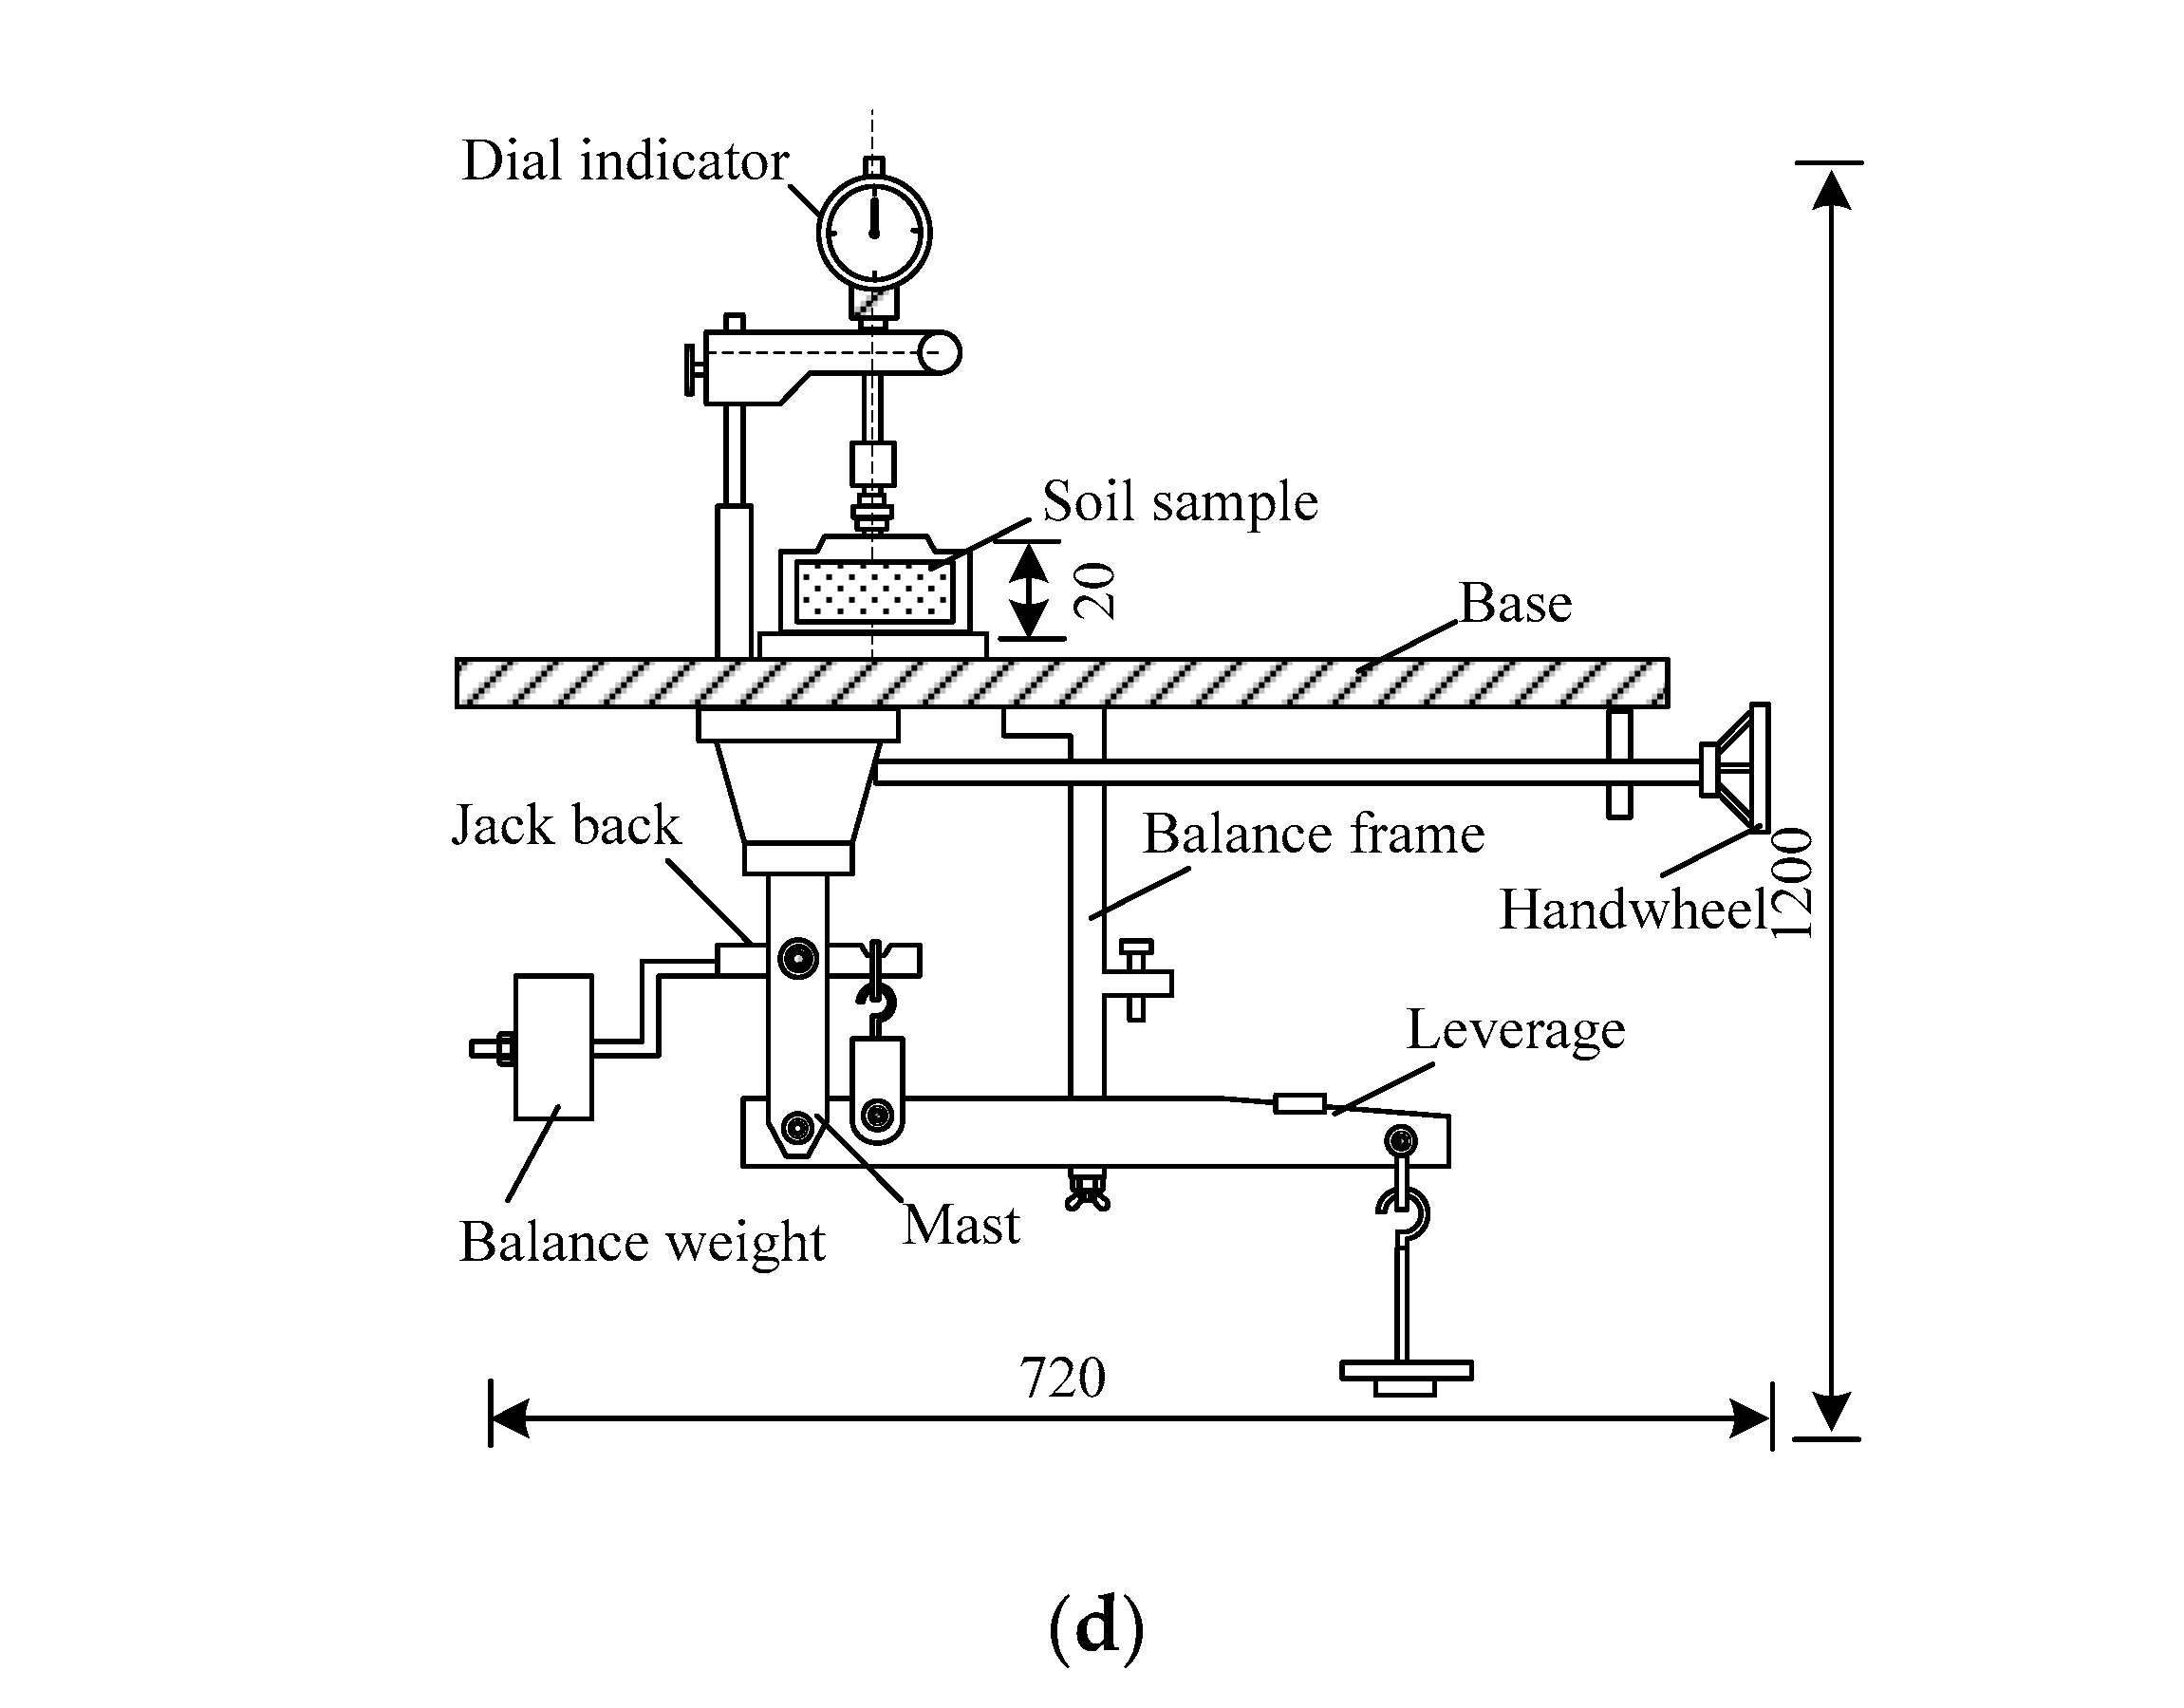
2.2.1. Laboratory Test Methods

In order to investigate the mechanical properties of the SRS, the compaction test, direct shear test, and unconfined compressive strength test were performed with different mix proportions of SRS; the confined compression test and collapsibility test were performed with selected representative proportions.
Compaction test. The SR and FA were dried, crushed, and passed through the 2.5 mm fine screen. Thereafter, the SR and FA were mixed by mass ratio 1:0, 10:1, 8:1, 6:1, 3:1, 1:1, and each ratio prepared 5 samples of different water content. After the mixing and blending, the SRS was loaded into the test tube, and the standard electric compaction apparatus was used to conduct the compaction test according to the Chinese National Standard GB/T 22541-2008. According to the literature [15,30], the distribution range of particle size of SR and FA is 1.0–35.0 μm; light compaction is used to determine the optimum water content and maximum dry density of the SRS. The maximum dry density is the maximum density in the compaction curve. The optimal water content is the water content corresponding to the maximum dry density in the compaction curve. The schematic diagram of the equipment used in the compaction test is shown in Figure 1a.
Direct shear test. According to the results of the compaction test, samples with mass proportions of SR and FA of 1:0, 10:1, 8:1, 6:1, 3:1, and 1:1 were prepared, and two samples of each proportion were prepared for parallel testing. The water content and dry density of the samples were controlled to make it close to the optimal water content and maximum dry density. The mass of SRS required for each sample was calculated from the dry density and volume of the sample, and the samples were compacted by the compact cylinder and hammer. Thereafter, the direct shear test was carried out according to the Chinese National Standard GB/T 50123-2019. The test instrument is the direct shear apparatus, and the test method is quick shear, that is, after applying vertical pressure to the sample, apply horizontal shear stress quickly to the sample to make it shear failure. Cohesion forces is the mutual attraction between soil particles, and internal friction angle is the index of internal friction between soil particles. The values of cohesion forces and internal friction angle are the intercept and inclination of the shear strength line of the direct shear test. The schematic diagram of the equipment used in the direct shear test is shown in Figure 1b.
Unconfined compression strength test. Unconfined compressive strength is the ultimate strength of the sample against axial pressure without lateral pressure. In the test, the pressure when a clear fracture surface appears on the side of the sample is the unconfined compressive strength. The sample preparation method of the unconfined compression strength test is the same as that of the direct shear test, but 6 samples of each proportion were needed for the unconfined compressive strength test. After the samples preparation, the samples were kept in a constant temperature and humidity oven at (20 ± 2) °C and 90% relative humidity for 7 d, 28 d, and 90 d, and the unconfined compressive strength test was performed according to the Chinese National Standard GB/T 21043-2007. The test axial strain rate is 1–3% per minute. The test was completed within 8–10 min. When the dynamometer reached a peak, the test was stopped after 3–5% axial strain. When there is no peak reading, the test should be carried out until the strain reaches 20% axial strain. The schematic diagram of the equipment used in unconfined compression strength test is shown in Figure 1c.
Confined compression test. In order to study the effect of water content and compaction coefficient on the compression performance of the SRS, the representative ratio (SR:FA = 10:1) was selected for the confined compression test. The samples were prepared according to the Chinese National Standard GB/T 50123-2019, two for each sample, and the confined compression test was performed on the samples with different water content and compaction coefficients by high-pressure consolidation apparatus. The schematic diagram of the equipment used in unconfined compression strength test is shown in Figure 1d.
Collapsibility test. In order to study the collapsibility of the SRS, the representative ratio (SR:FA = 10:1) was selected for collapsibility test. The samples were prepared by the cutting ring and tested by the double-line method according to the Chinese National Standard GB 50025-2018. The schematic diagram of the equipment used in the collapsibility test is the same as that in the unconfined compression strength test, as shown in Figure 1d.

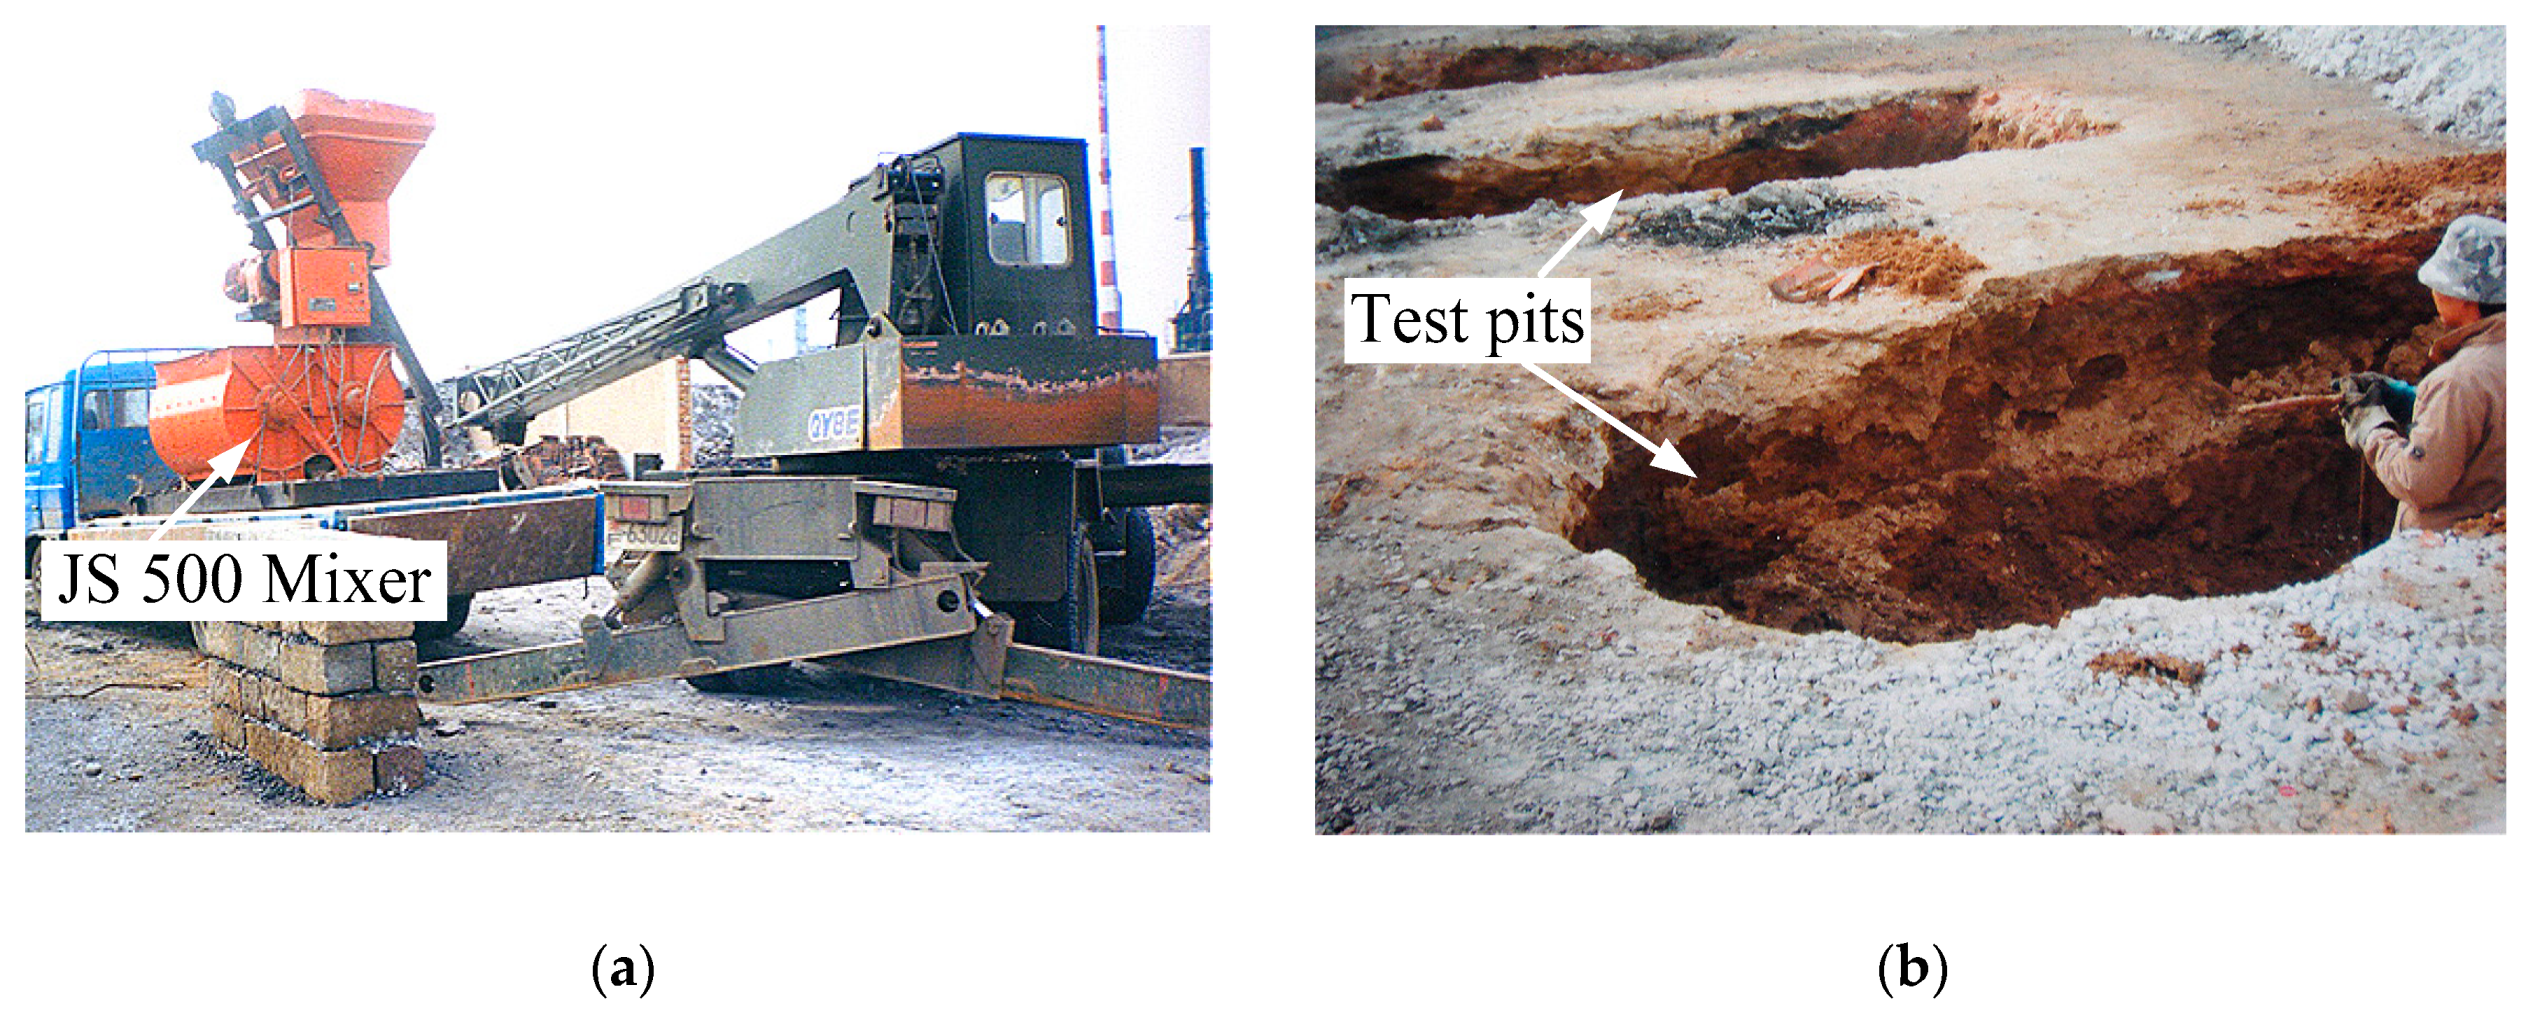
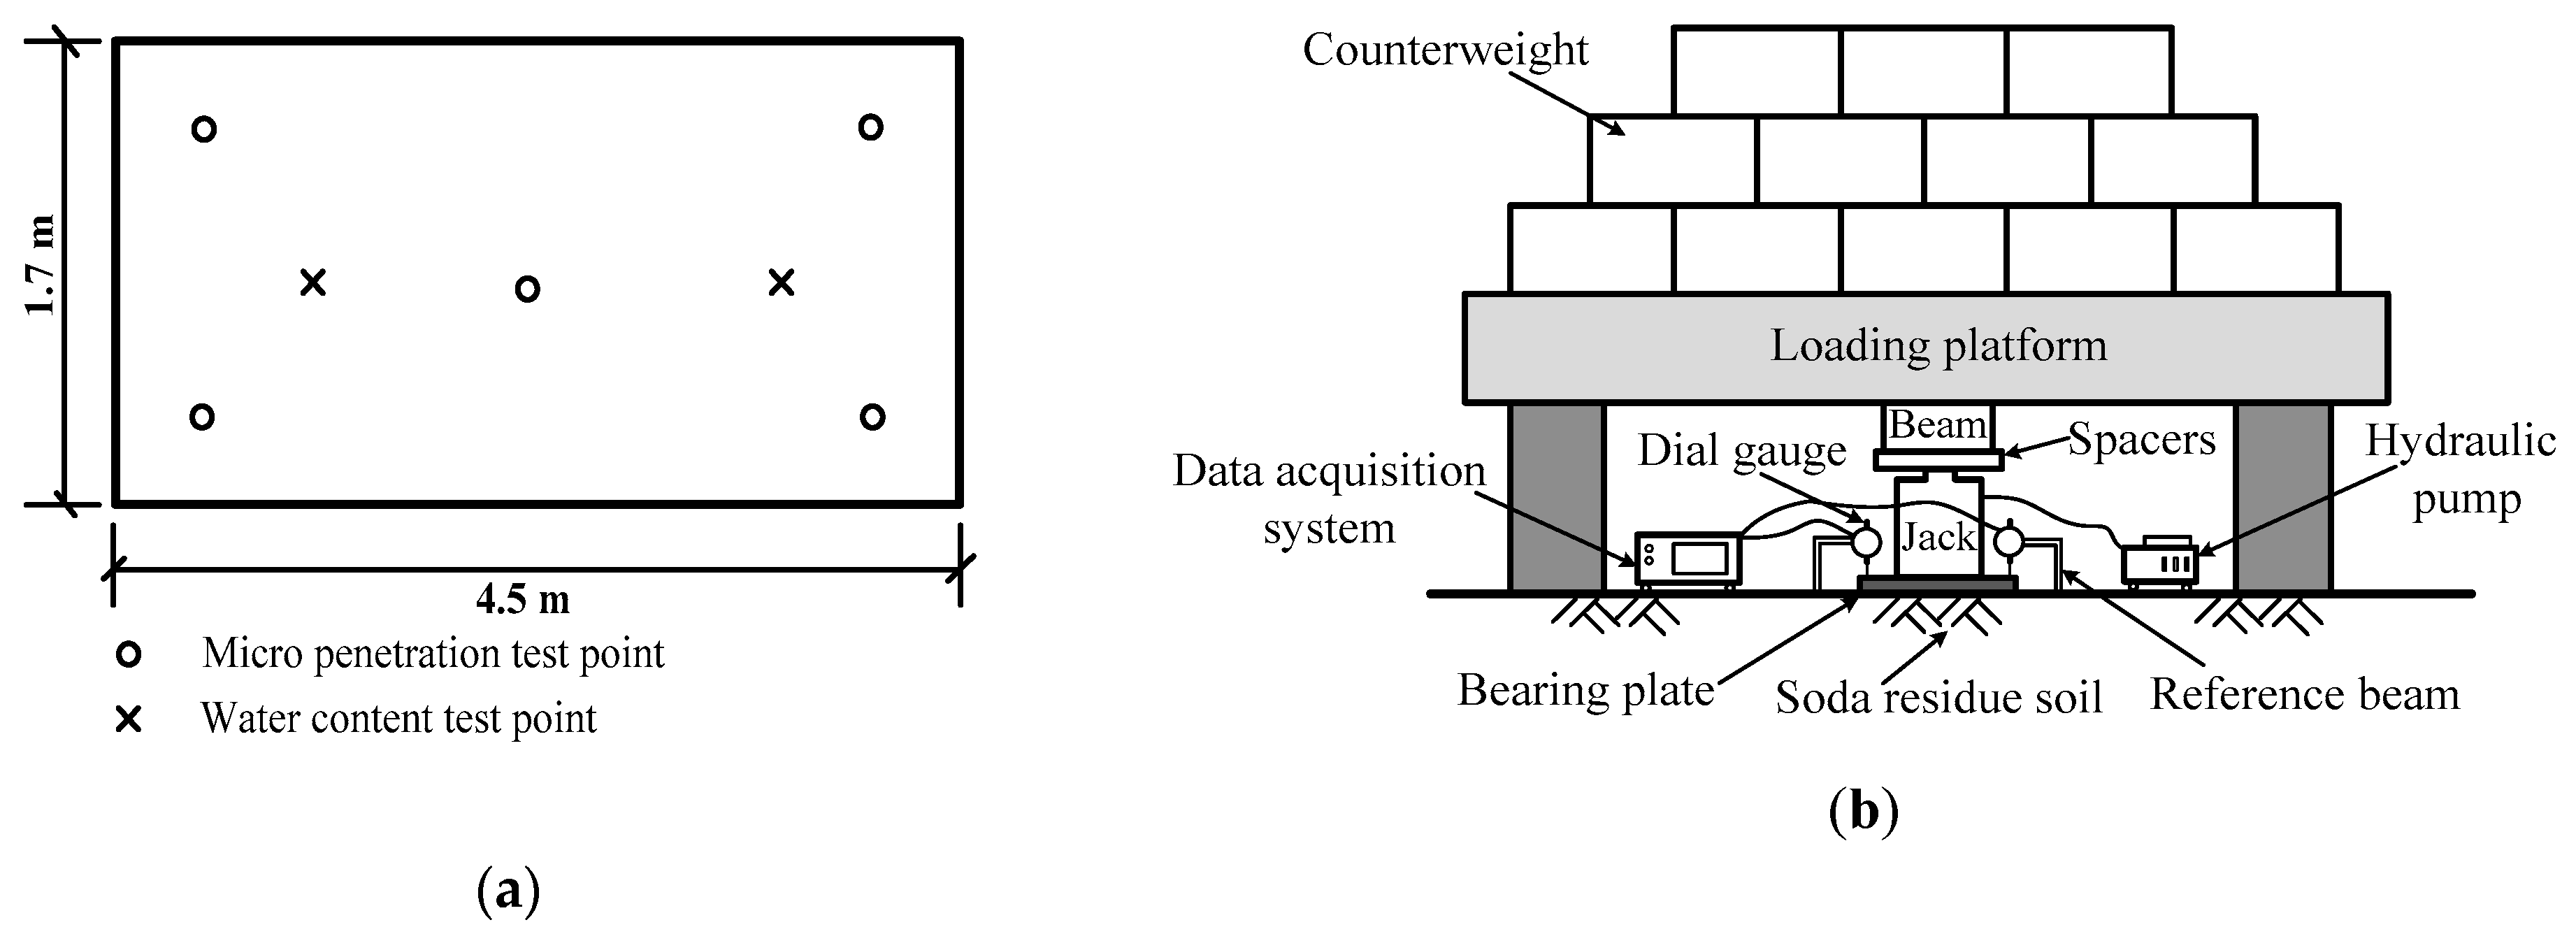
2.2.2. Field Test Methods

Based on the results of the laboratory tests and taking all aspects into consideration, five mixing proportions of the SRS were selected for the field tests. In order to consume as much SR as possible, the proportions of SR to FA were chosen to be 12:1 and 10:1 according to the actual discharge of waste from the soda plants and power plant. For further application of SRS and considering the feasibility of practical engineering, three other formulations of SRS were prepared, referenced from the literature [15,36]. The SRS was prepared using the common building materials such as standard sand (S), II class rubble (R), and II class lime powder (L). The specific mixing proportions of the SRS used in the field test are presented in Table 2.
The raw materials of SRS were weighed according to the mixing proportion and mixed the raw materials with JS 500 mixer, as shown in Figure 2a. The mechanical agitation of the mixer can destroy the aggregate skeleton, compound salt skeleton and internal electric field of the SR, promote the dissolution and precipitation of CaCl2, accelerate the dehydration and solidification, and enhance the strength of SRS. When the mixing of the SRS was completed, the SRS was dried out naturally, and when the water content of the SRS was close to the optimum water content determined by the laboratory test, the preparation for SRS filling begins.
The test pits were excavated manually with the dimensions of 4.5 m × 1.7 m × 1.3 m (length × width × depth), which are shown in Figure 2b. Then, the SRS A1 to A5 were filled into separate test pits. The filling of SRS using a superficial compaction method. The SRS were filled in five layers, the thickness of each filling layer of the SRS being 30 cm, with frog-rammer tamped 3 times. In order to guarantee the compaction quality, the center of the SRS should be tamped first, and then the surrounding area should be tamped evenly. After compaction of each layer, the micro penetration test was carried out with a WY-4 soil penetration meter produced by the Nanjing soil instrument factory according to the Chinese National Standard GB/T 50123-2019. The blow count of WY-4 soil penetration meter was recorded when the meter penetrated into the SRS at 10 cm. After 25 days of filling, the soil penetration meter was used again to detect the compactness of the surface SRS. When the SRS A1 and SRS A2 were filled, the water content and dry density were determined by taking samples with a cutting ring and calculating the compaction coefficient of the SRS. The micro penetration test points and compaction coefficient test points are shown in Figure 3a.
In order to further study the bearing capacity of the SRS, the plate load test was carried out according to the Chinese National Standard GB 50007-2011. The bearing plate size used in the test was 0.5 m × 0.5 m. The test adopted the method of step-by-step loading and monitored the settlement of the soil through the observation system. The plate load test system is shown in Figure 3b. Three test points were taken for each of the SRS A1 and SRS A2 and were recorded as A1-1, A1-2, A1-3, A2-1, A2-2, and A2-3. One test site was taken for each of A3 alkali cinder, A4 alkali cinder, and A5 alkali cinder, which was recorded as A3, A4, and A5. Due to time constraints, one test site was taken for each of SRS A3, SRS A4, and SRS A5, and recorded as A3, A4, and A5.

3. Laboratory Test Results and Analysis

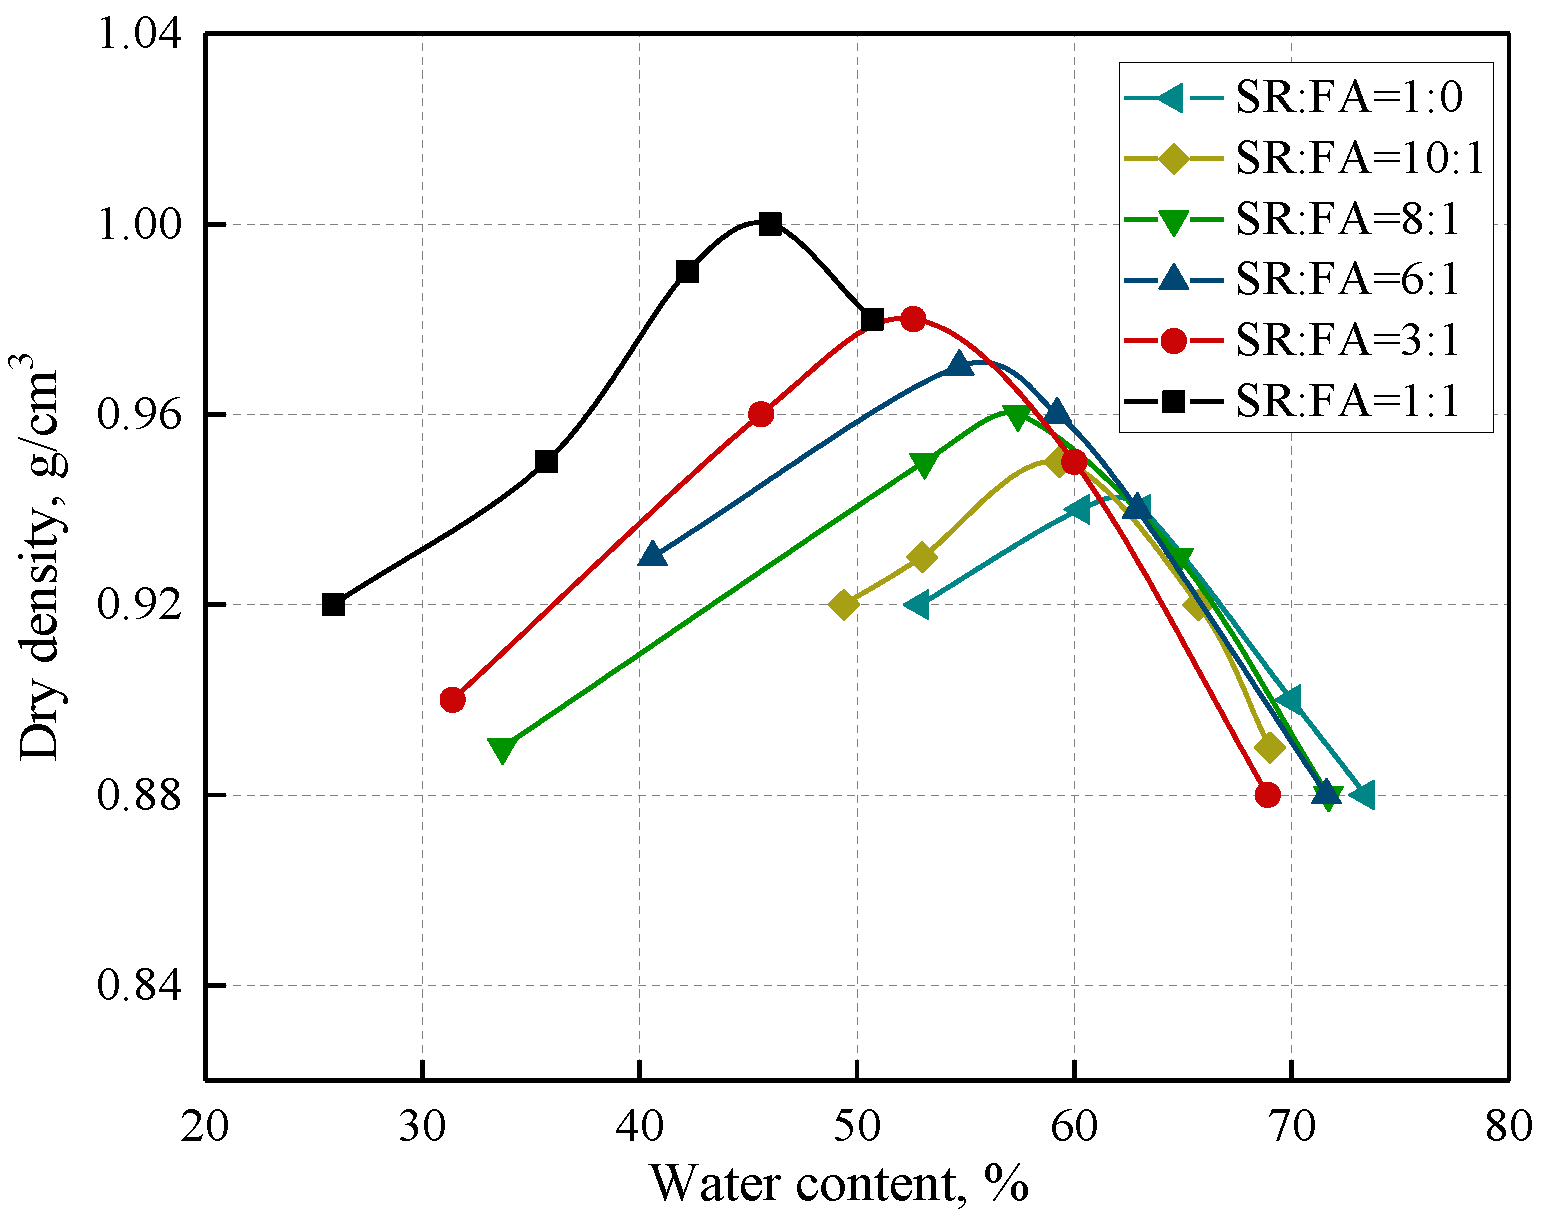
3.1. Compaction Test Analysis

Compaction test is to determine the relation curve between water content and dry density. The maximum dry density and optimal water content of soil samples can be obtained by the compaction curve, so as to study the compaction characteristics of SRS. The compaction test results are shown in Figure 4. It can be seen that, with the increase in the amount of FA added, the dry density of the SRS is gradually increasing, and the optimal moisture content is gradually decreasing. The maximum dry densities of the SRS with the mixing proportion of 1:1 and 1:0 are 1.00 g/cm3 and 0.94 g/cm3, and the optimal water content was 46.0% and 63.1%, respectively. It can be seen that, with the increase of FA addition, the optimal water content of SRS decreases and the maximum dry density increases. This means that the addition of FA can absorb the water in the SR and fill in the voids in the SR agglomerate to increase its compactness. This reaction took place in a short time, increasing the strength of the soda residue soil. The increase of calcium ions and hydroxide ions leads to the following reactions [10,37]:
Ca2+ + CO32− = CaCO3
Mg2+ + 2OH = Mg(OH)2
Ca2+ + SO42− = CaSO4
From the above equations, it can be seen that the strengthening mechanism of the SRS is as follows: the calcium oxide absorbs water and reduces the water content of the SRS; the ions in the pore water of the SR exchange reaction, resulting in precipitation, and the crystals act as cementation between the particles. Compared with the general engineering soil, the dry density of the SRS is less, and the use of SRS as the backfill soil will produce less additional stress and additional deformation, which is suitable for filling works.

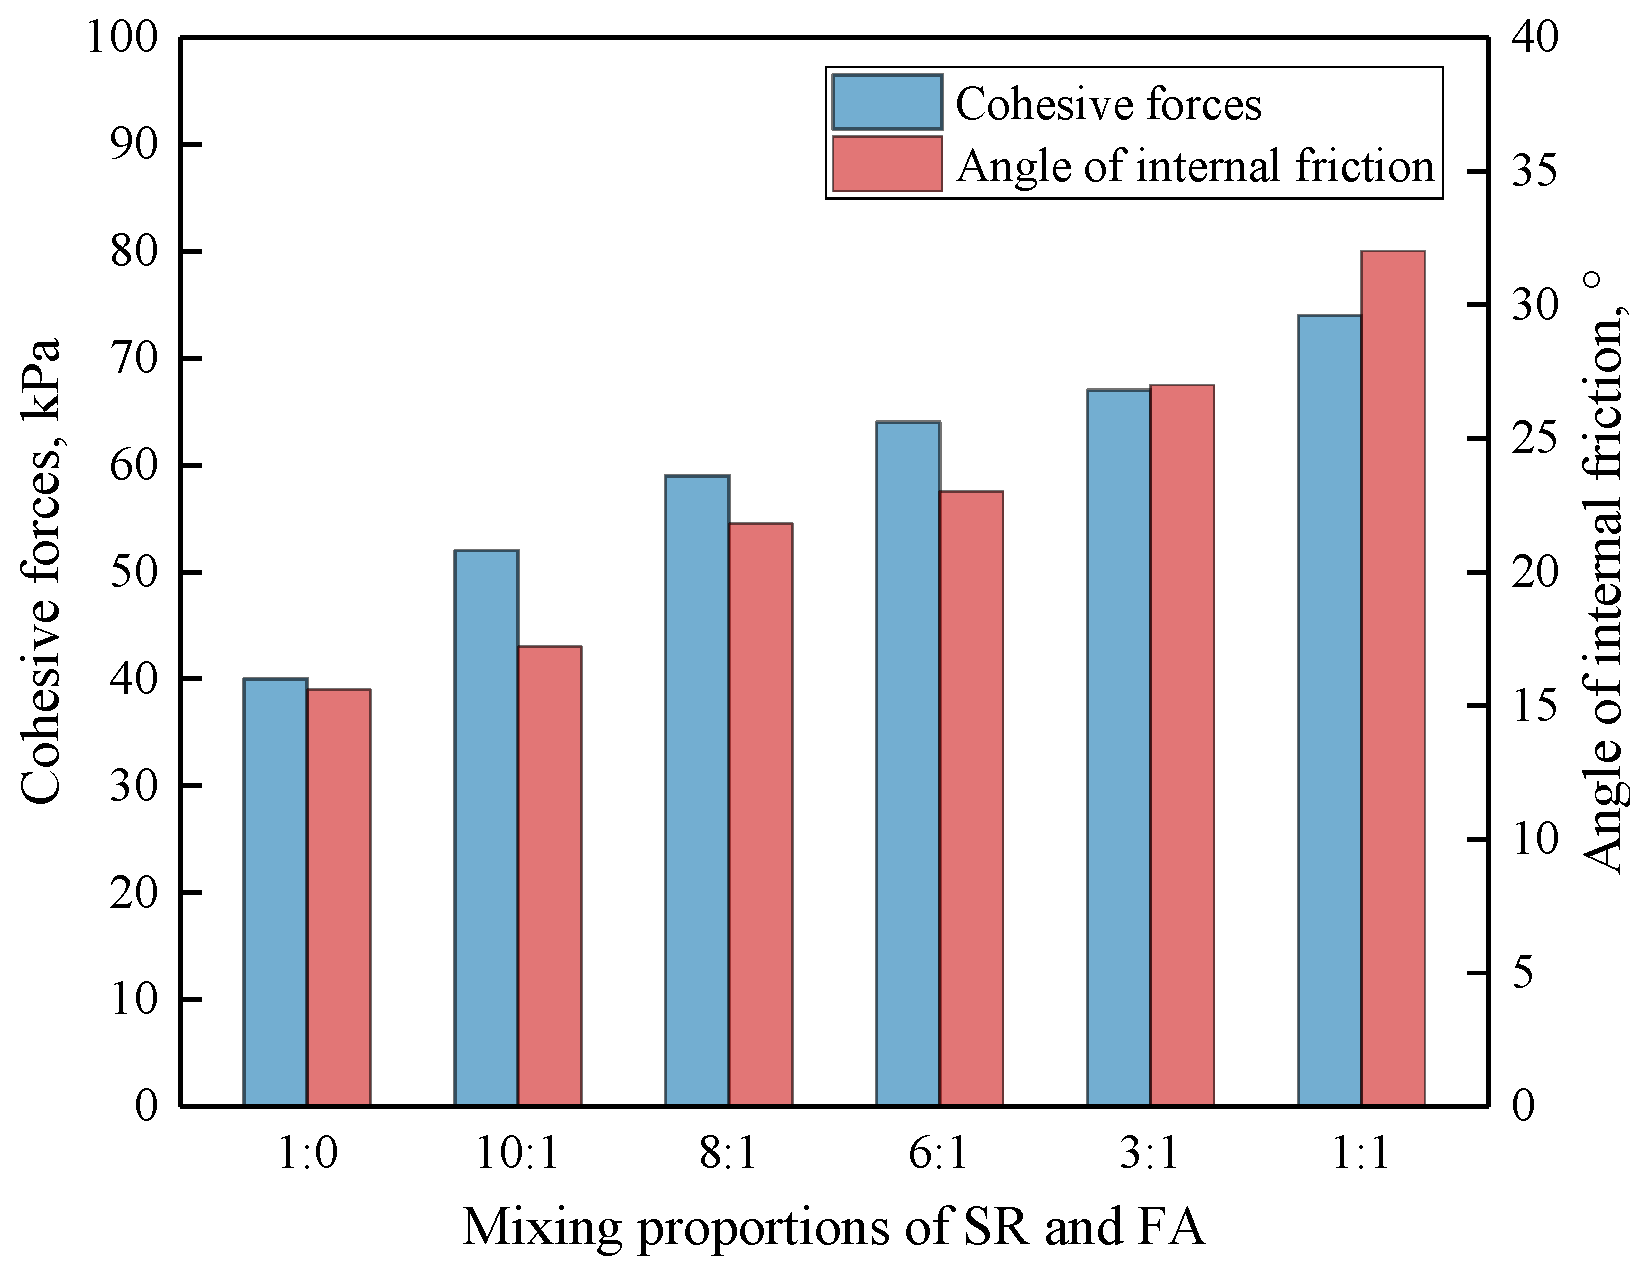
3.2. Direct Shear Test Analysis

The direct shear test results of the SRS with different proportions are shown in Figure 5. With the increase of FA content, the cohesion forces and internal friction angle of the SRS are improved, but there are some differences in their trends. When the addition of FA is small, the angle of internal friction increases slowly (increase of only 1.6°), and with the increase of the addition of FA, the angle of internal friction increases rapidly (increase of 4.6°). This is due to the fact that when the FA is mixed in small amounts, most of the FA is hydrated to form gelling substances. The hydration reaction of the FA is as follows: when the fly ash and soda residue were mixed, calcium oxide in FA reacts with the water in SR to form calcium hydroxide [37]:
CaO + H2O→Ca(OH)2
Calcium hydroxide reacts with silicon dioxide and aluminum oxide to form hydrate calcium silicate and hydrated calcium aluminate:
m Ca(OH)2 + (n − 1)H2O + SiO2→mCaO·SiO2·nH2O
mCa(OH)2 + (n − 1)H2O + Al2O3→mCaO·Al2O3·nH2O
The calcium sulfate in the soda residue reacts with these hydrates to form ettringaite:
mCaO·Al2O3·nH2O + CaSO4·2H2O→mCaO·Al2O3·CaSO4·(n + 2)H2O
The hydrate calcium silicate, hydrated calcium aluminate, and ettringaite are hydraulically setting compositions, which form crystals on the surface of the fly ash vitreous gradually, and play a cementing role on soda residue particles, thus improving the strength of the soda residue soil.
With the increase of FA content in the SRS, due to the limited stimulation effect of SR, the FA filled in the pores of the SR to improve the density and surface mechanical bite force, resulting in the rapid increase of the angle of internal friction.
There are some differences in the trends of cohesion force and internal friction angle with FA addition. With the incremental addition of FA, the internal friction angle was dramatically enhanced, with an increase of 12 kPa for 10:1 SRS, compared with that of 1:0 SRS. With the continuous increase of FA addition, the increase of cohesion was 7 kPa, 5 kpa, and 3 kPa, respectively. This indicated that the hydration reaction between SR and FA produces gelling substances, which can improve the cohesive force of SRS. However, due to the limited stimulation effect of SR on FA, the increase rate of cohesive force decreases.

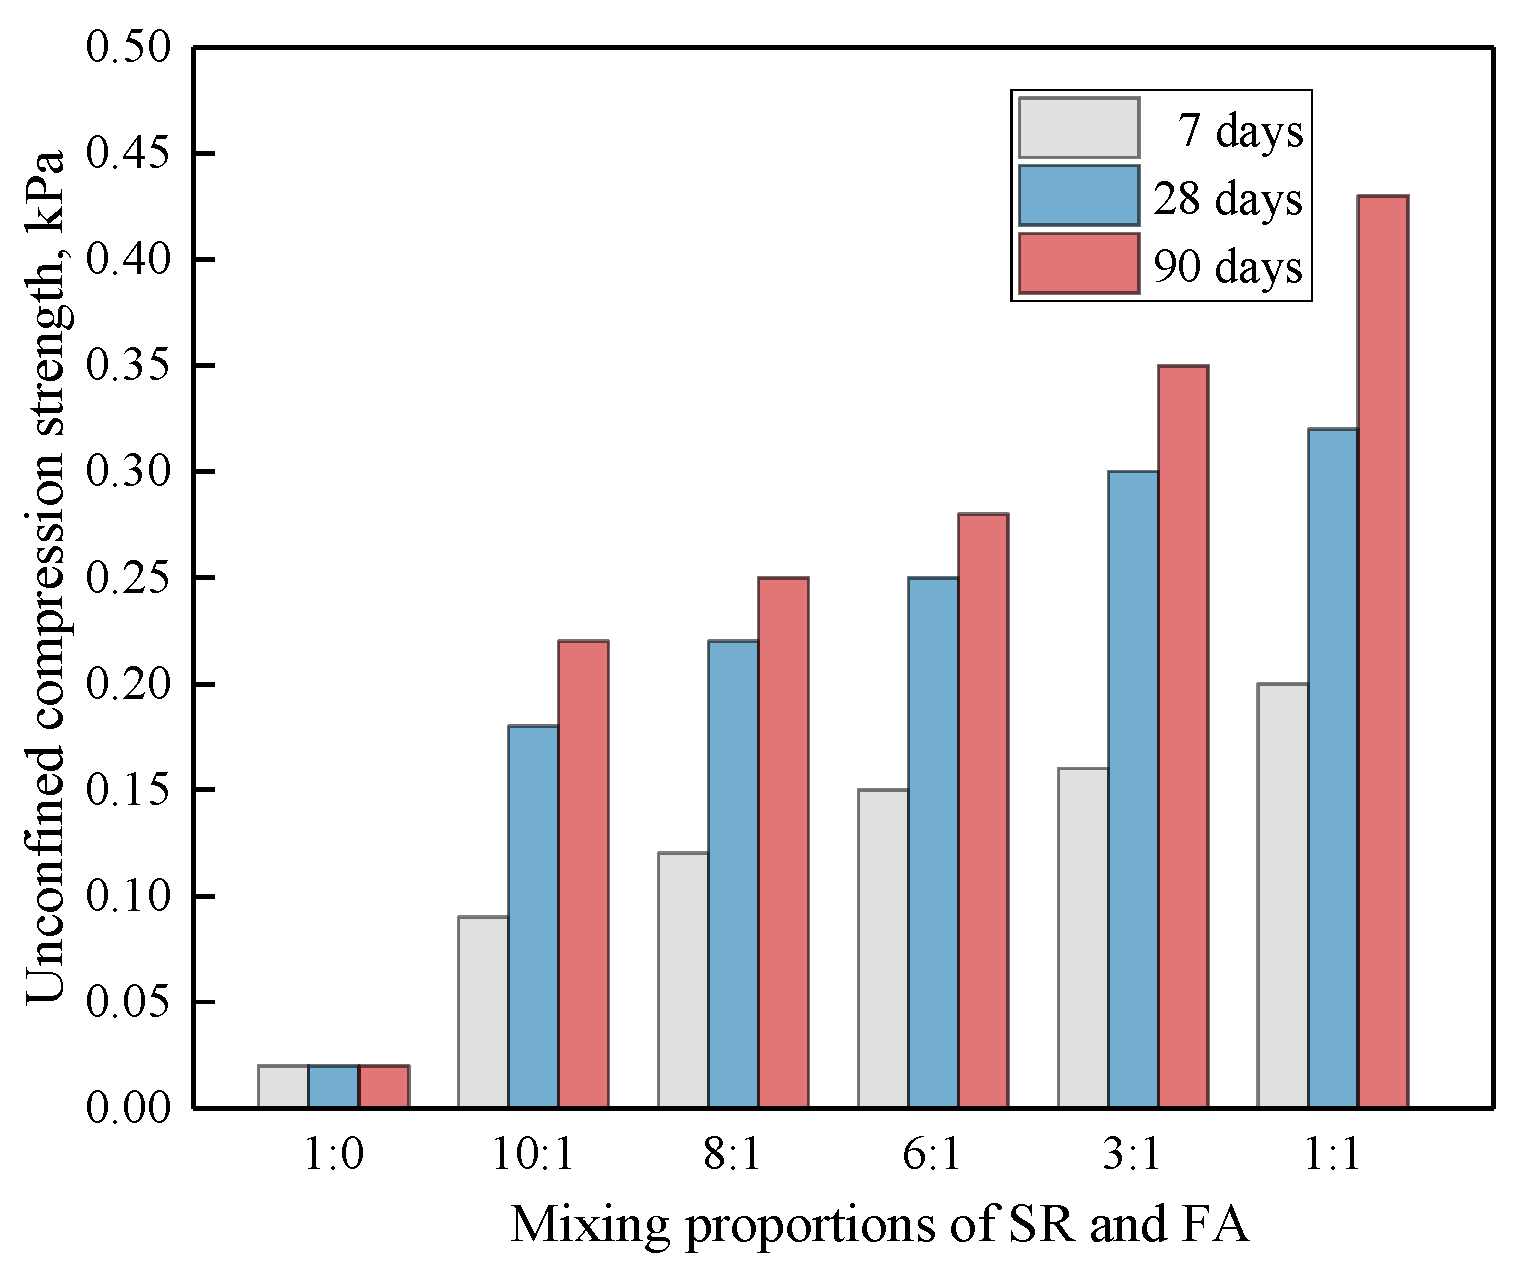
3.3. Unconfined Compression Strength Test Analysis

The unconfined compression strength test results of the SRS with different proportions are shown in Figure 6. It can be seen that the SRS compression strength of all ages gradually increases with the increase of FA admixture. The unconfined compression strength of the SRS sample cured for 90 d at the proportion of 1:1 is 21 times that of the SR sample. The unconfined compression strength of the SRS of each proportion cured for 90 days is 1.8 to 2.4 times that of the SRS cured for 7 days. It indicates that the compression strength of the SRS is age-dependent, and the hydration of the FA is a slow process. Liu et al. [38] studied the microstructure of the SRS by scanning electron microscope (SEM) and found that, when the age is early, the SR pores were filled with FA, the FA did not appear to erode and hydrate. With the growth of age, the phenomenon of flocculent gelling material and erosion appeared on the surface of the FA; when curing to 90 days, most of the fly ash was eroded, hydration reaction was sufficient, gelling material filled in the pores, which can explain the SRS with the unconfined compression strength with the age of increasing reasons [39,40].

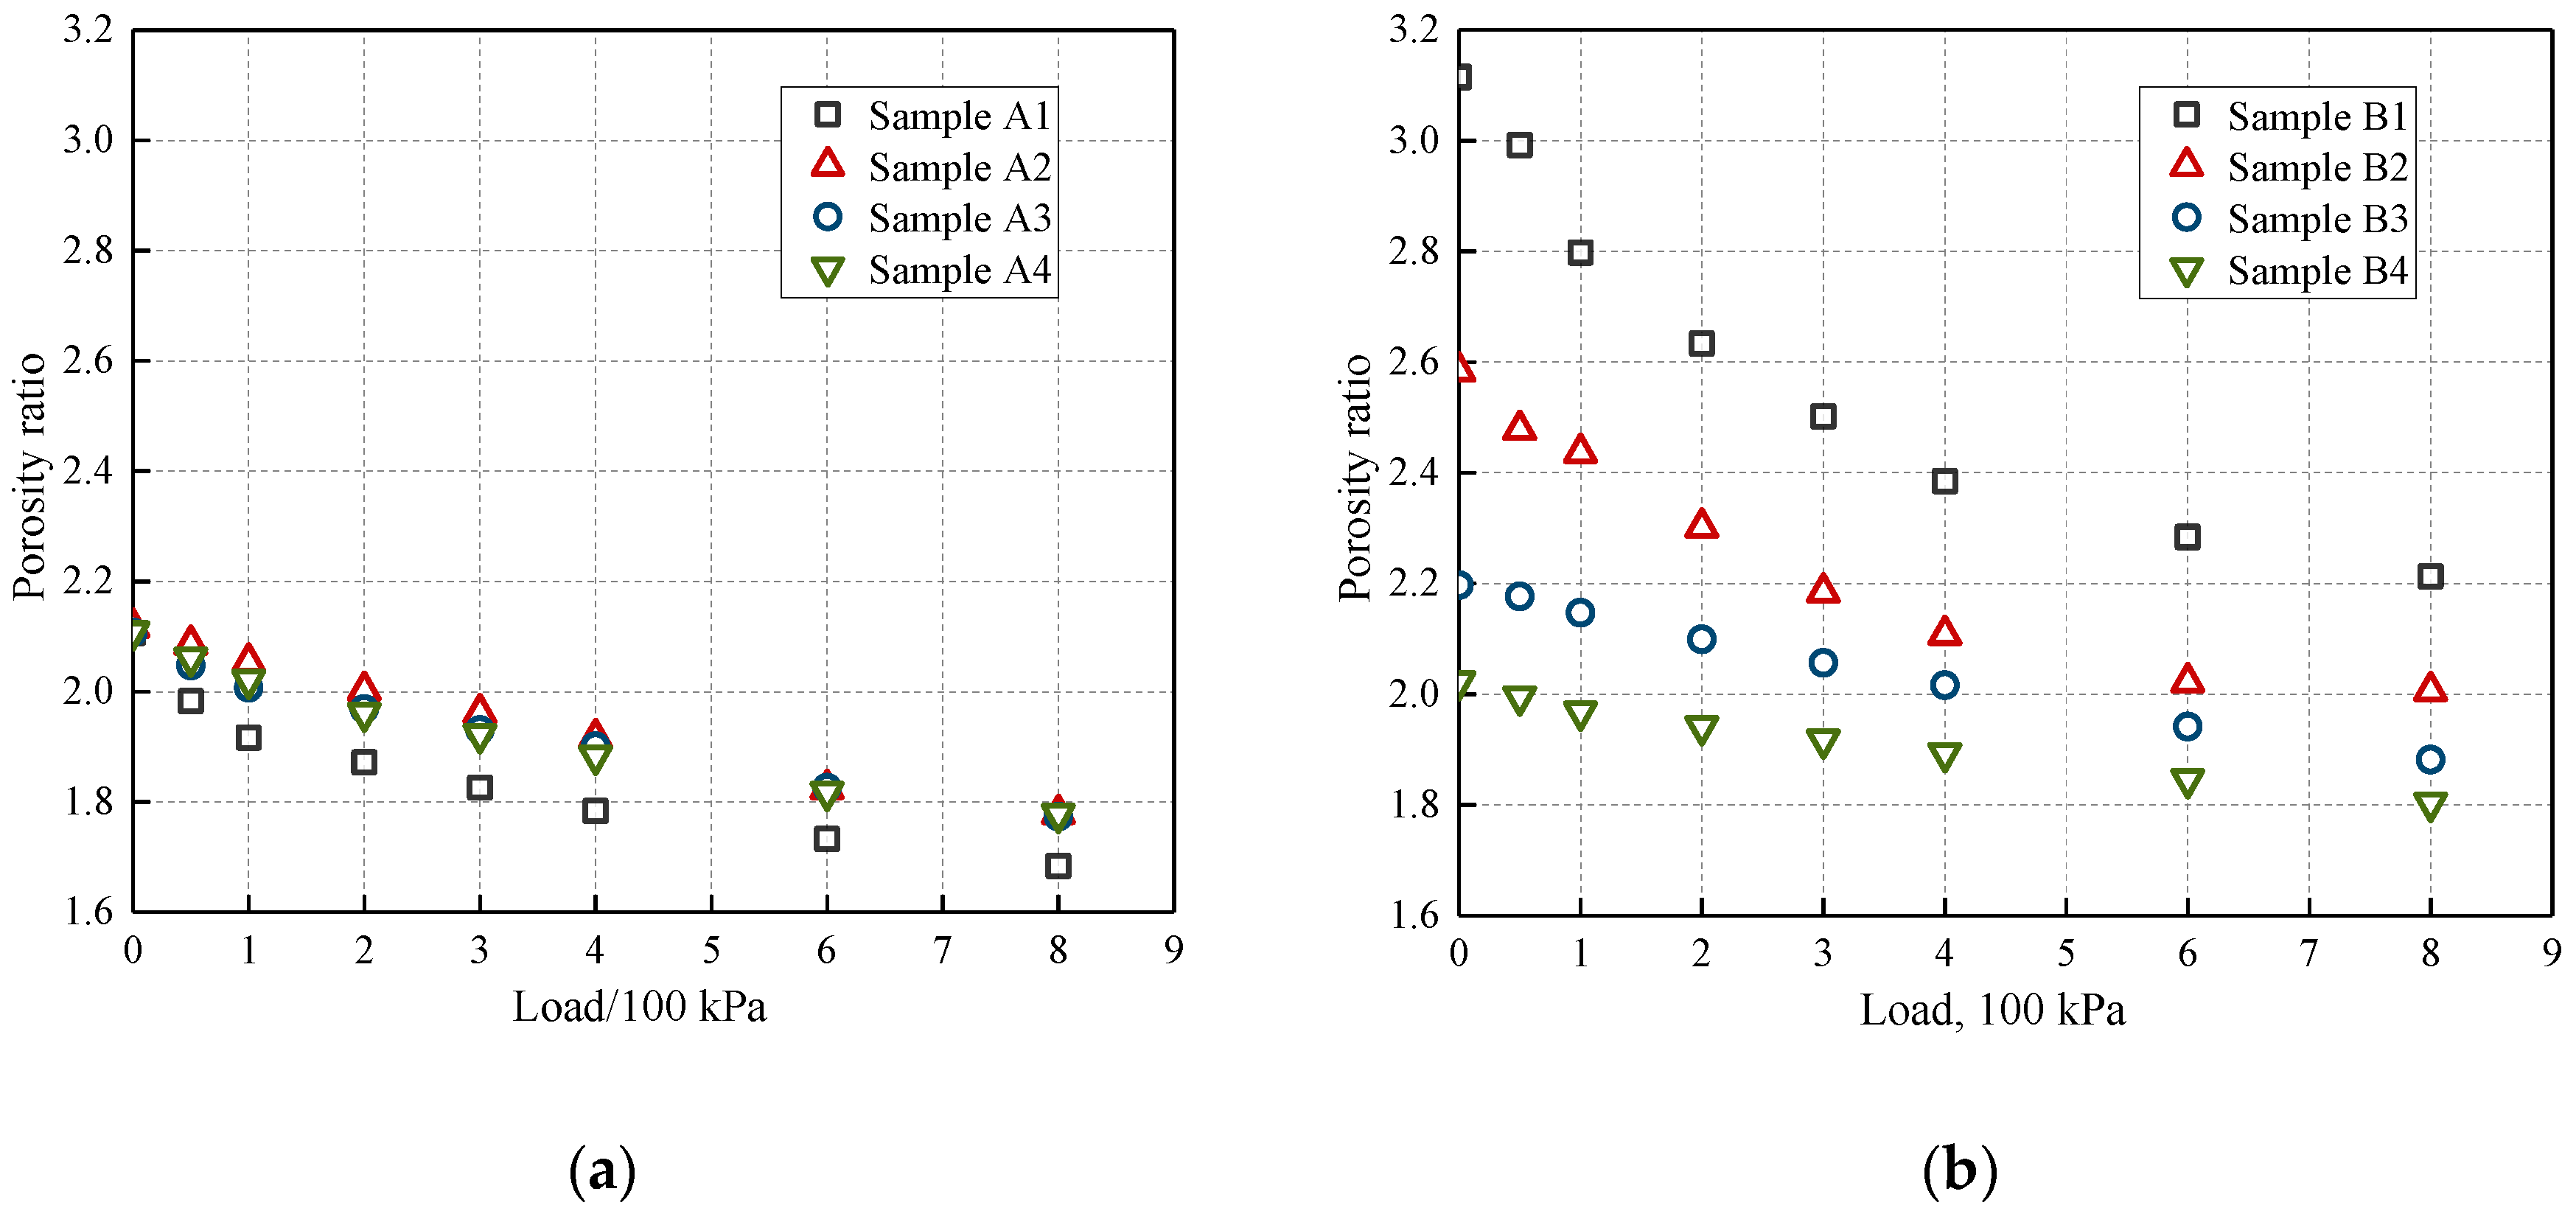
3.4. Confined Compression Test Analysis

Samples A1 to A4, B1 to B1 were prepared for confined compression test. The water content and compaction coefficient of the samples are listed in Table 3. The influence of water content (43.2%, 54.1%, 65.2%, 69.9%) and compaction coefficient (0.70, 0.80, 0.90, 0.95) on the coefficient and modulus of compressibility of the SRS were investigated. The confined compression test results are shown in Figure 7. The coefficient and modulus of compressibility of each sample are illustrated in Table 4.
As shown in Figure 8 and Table 4, it can be seen that, when the compaction coefficient is 0.9, the compressibility coefficient a1-2 of the SRS is 0.1 MPa−1 < a1-2 < 0.5 MPa−1, the SRS is of medium compressibility soil. When the compaction coefficient is the same, the water content has less influence on the compressibility of the SRS. The coefficient of compression of SRS A4 with a water content of 69.9% is higher than that of SRS A1 with a water content of 43.2%, the difference between the two is only 0.043 MPa−1. It is indicated that the SRS has good water stability, even in water its compressibility does not change greatly. When the water content is the same, the compaction coefficient of the SRS compression properties has a greater impact. When the compaction coefficient is 0.7 and 0.8, the modulus of compressibility of the SRS B1 and SRS B2 is 2.310 Mpa and 2.551 Mpa, respectively, the SRS is of high compressibility. As the compaction coefficient increases, the modulus of compressibility increases, and the modulus of compressibility of SRS B4 is 11.016 MPa, about 5 times that of SRS B1.
As shown in Table 5, the compressibility coefficient a1-2 is usually used to judge the compressibility of soil. When the water content and compaction coefficient are 65.2% and 0.95, respectively, B4 SRS has the best compressibility and compressibility coefficient of 0.267, which is medium-compressibility soil. Therefore, in practical engineering, the medium-compressibility soil can be obtained by controlling the compaction coefficient and water content of the SRS [41,42].

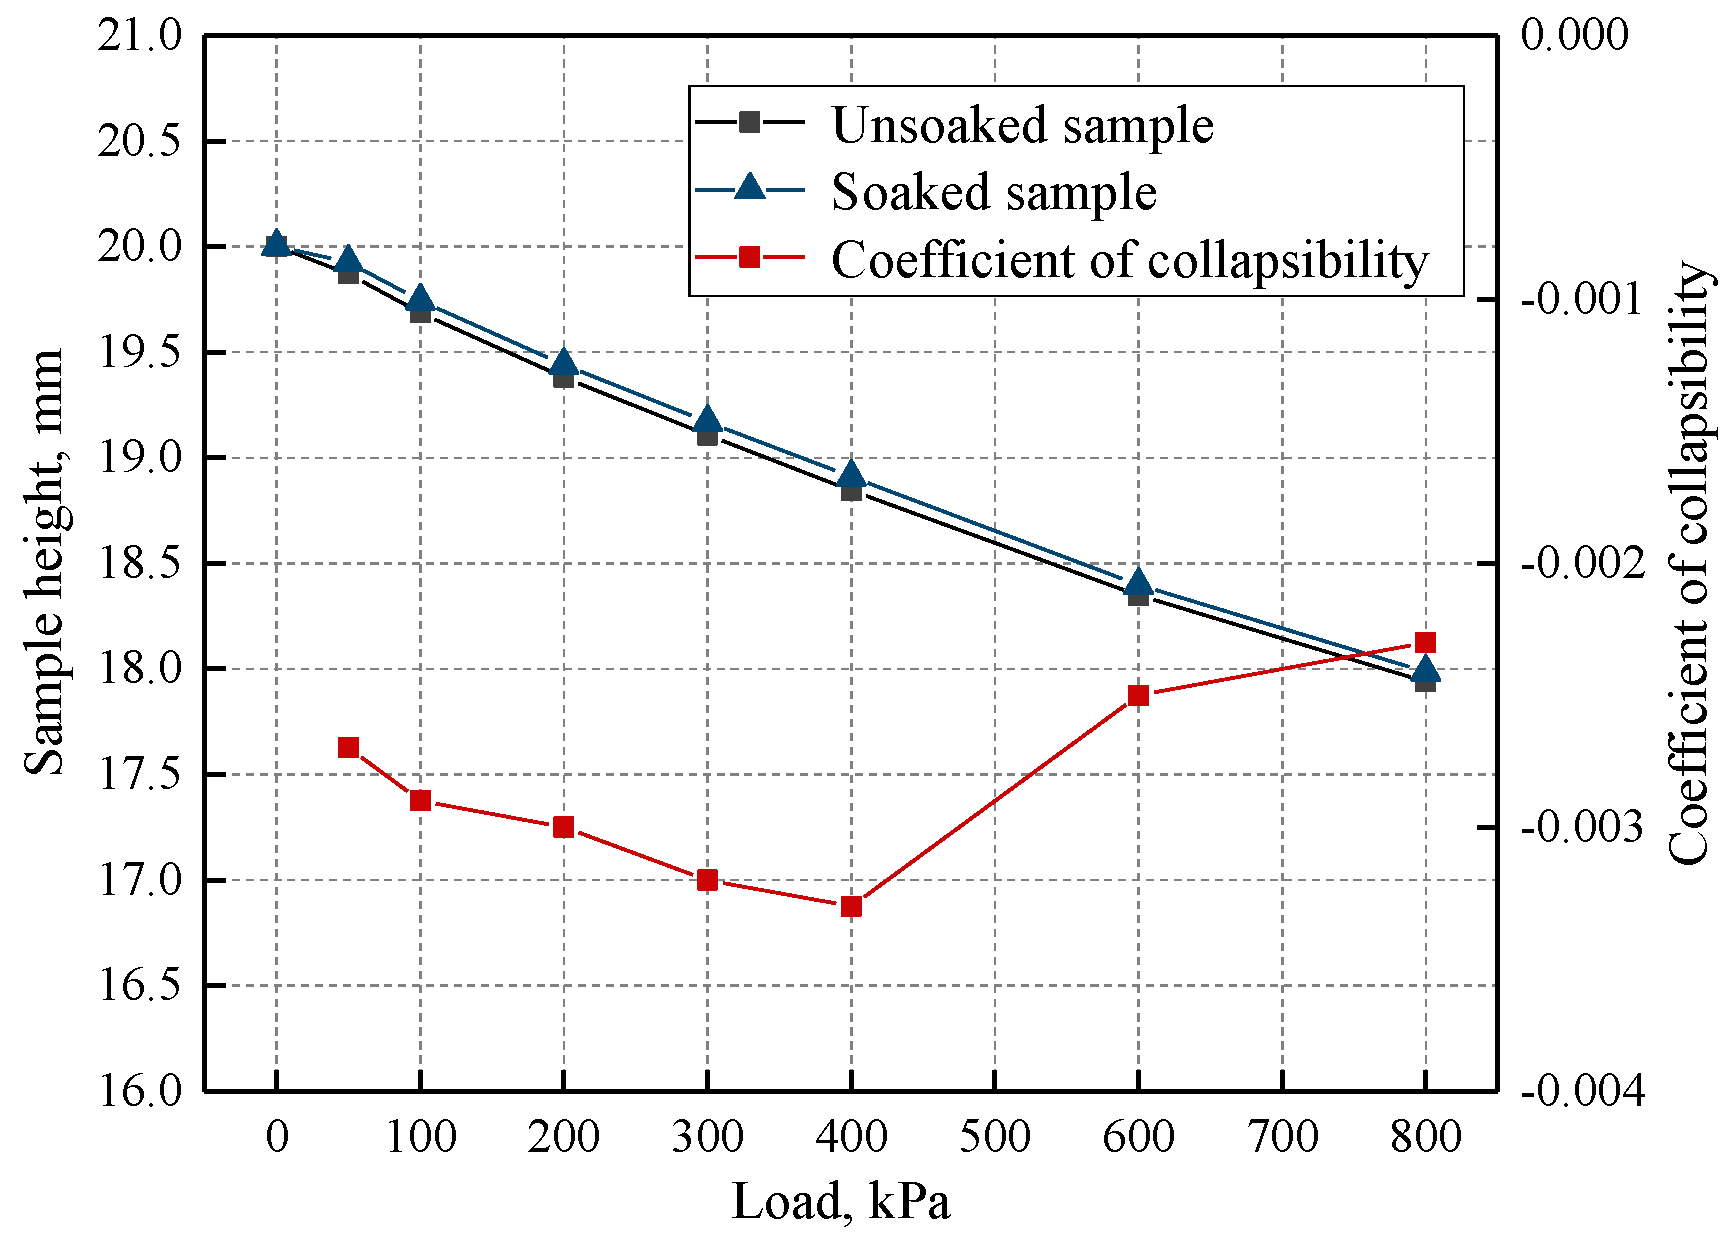
3.5. Collapsibility Test Analysis

The results of the collapsibility test of the SRS are shown in Figure 8. With increasing axial stress, the height of the SRS sample after water immersion is slightly higher than that of the no-water immersion SRS sample; the collapsibility coefficient first decreases and then increases, but is less than 0.015. According to the specification GB 50025-2018, the SRS belongs to non-collapsible soil. This is because the structure of SRS is different from that of the collapsible soil. When the collapsible soil meets water, the cohesion between the soil particles weakens, and the soil structure is destroyed rapidly, resulting in settlement. This indicates that the SRS can maintain a stable soil structure after being exposed to the water and will not collapse. SRS will not settle when it meets water, which will affect the bearing capacity, so it can be used as engineering soil.

4. Field Test Results and Analysis

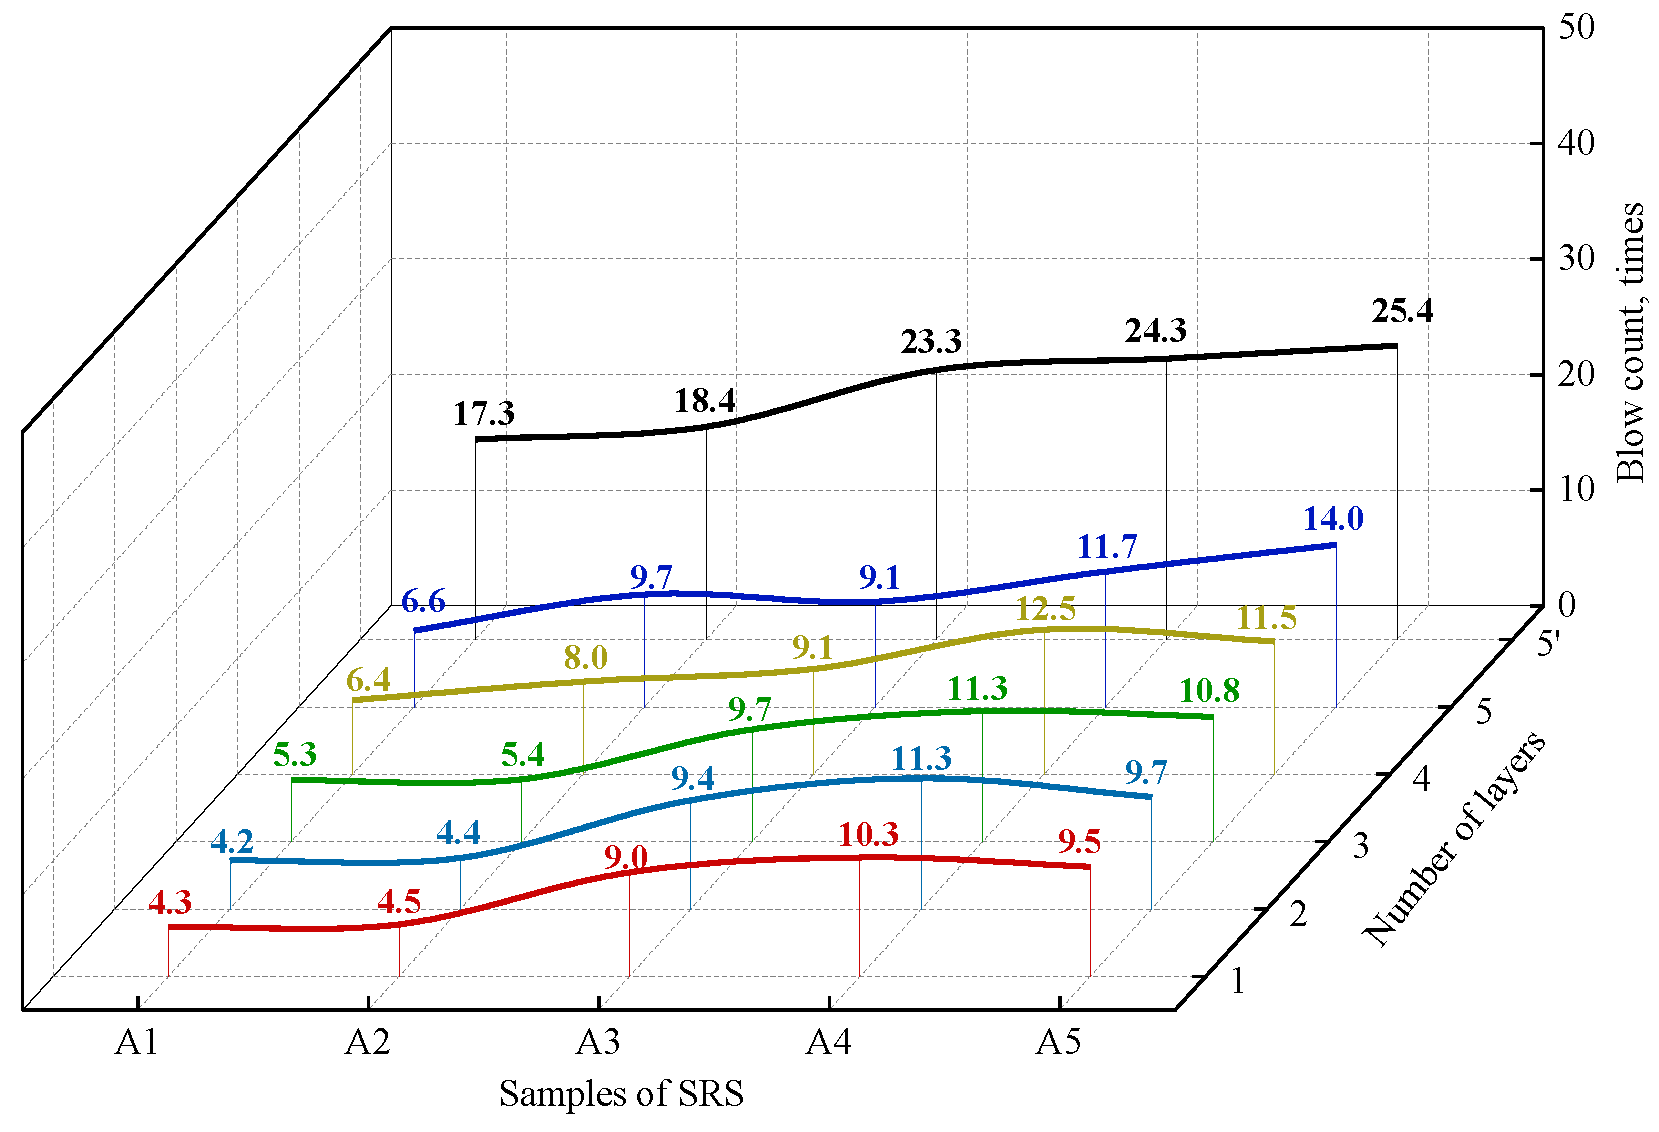
4.1. Micro Penetration Test Analysis

The results of the micro penetration test are shown in Figure 9. It can be seen that the hammer numbers of A2 SRS are slightly higher than that of A1 SRS. The blow counts of A3 SRS, A4 SRS, and A5 SRS are significantly higher compared to that of A1 SRS and A2 SRS. These results indicated that the strength of SRS can be improved by increasing FA content and adding sand, rubble, and lime to SRS. The hammer numbers of A1 SRS, A2 SRS, A3 SRS, A4 SRS, and A5 SRS increased by 2.62, 1.90, 2.56, 2.08, and 1.81 times, respectively, compared to that of SRS 25 days ago. These results can be attributed to the hydration reaction of SR and FA. As confirmed in the researches of Zhao et al. [1], Liu et al. [38], and Wang et al. [43], the hydration reaction between SR and FA is slow, and the strength of SRS is increased gradually with the increasing of age, which is consistent with the results of the unconfined compression strength test.

4.2. Compaction Coefficient Test Analysis

Table 6 presents the water content, density, and compaction coefficient of the SRS with different mixing proportions. The formula of compaction coefficient is shown in Formula (8). It can be seen that the compaction coefficient of A1 SRS soil is 0.94 and that of A2 SRS is 0.99. The compaction coefficient of the filling foundation should not be less than 0.90 according to the Chinese National Standard GB 50007-2011. It indicates that the compaction quality of SRS by the filling method used in the test is good, which can improve the soil compactibility, reduce the permeability of soil, and reduce the height of capillary water, so as to prevent the soil-base softening caused by water accumulation. The reason is that mechanical compaction can change the soil structure of soil and improve its strength and stability.
K = ρ d ρ dmax
where K is the compaction coefficient, ρd is the dry density, ρdmax is the maximum dry density.

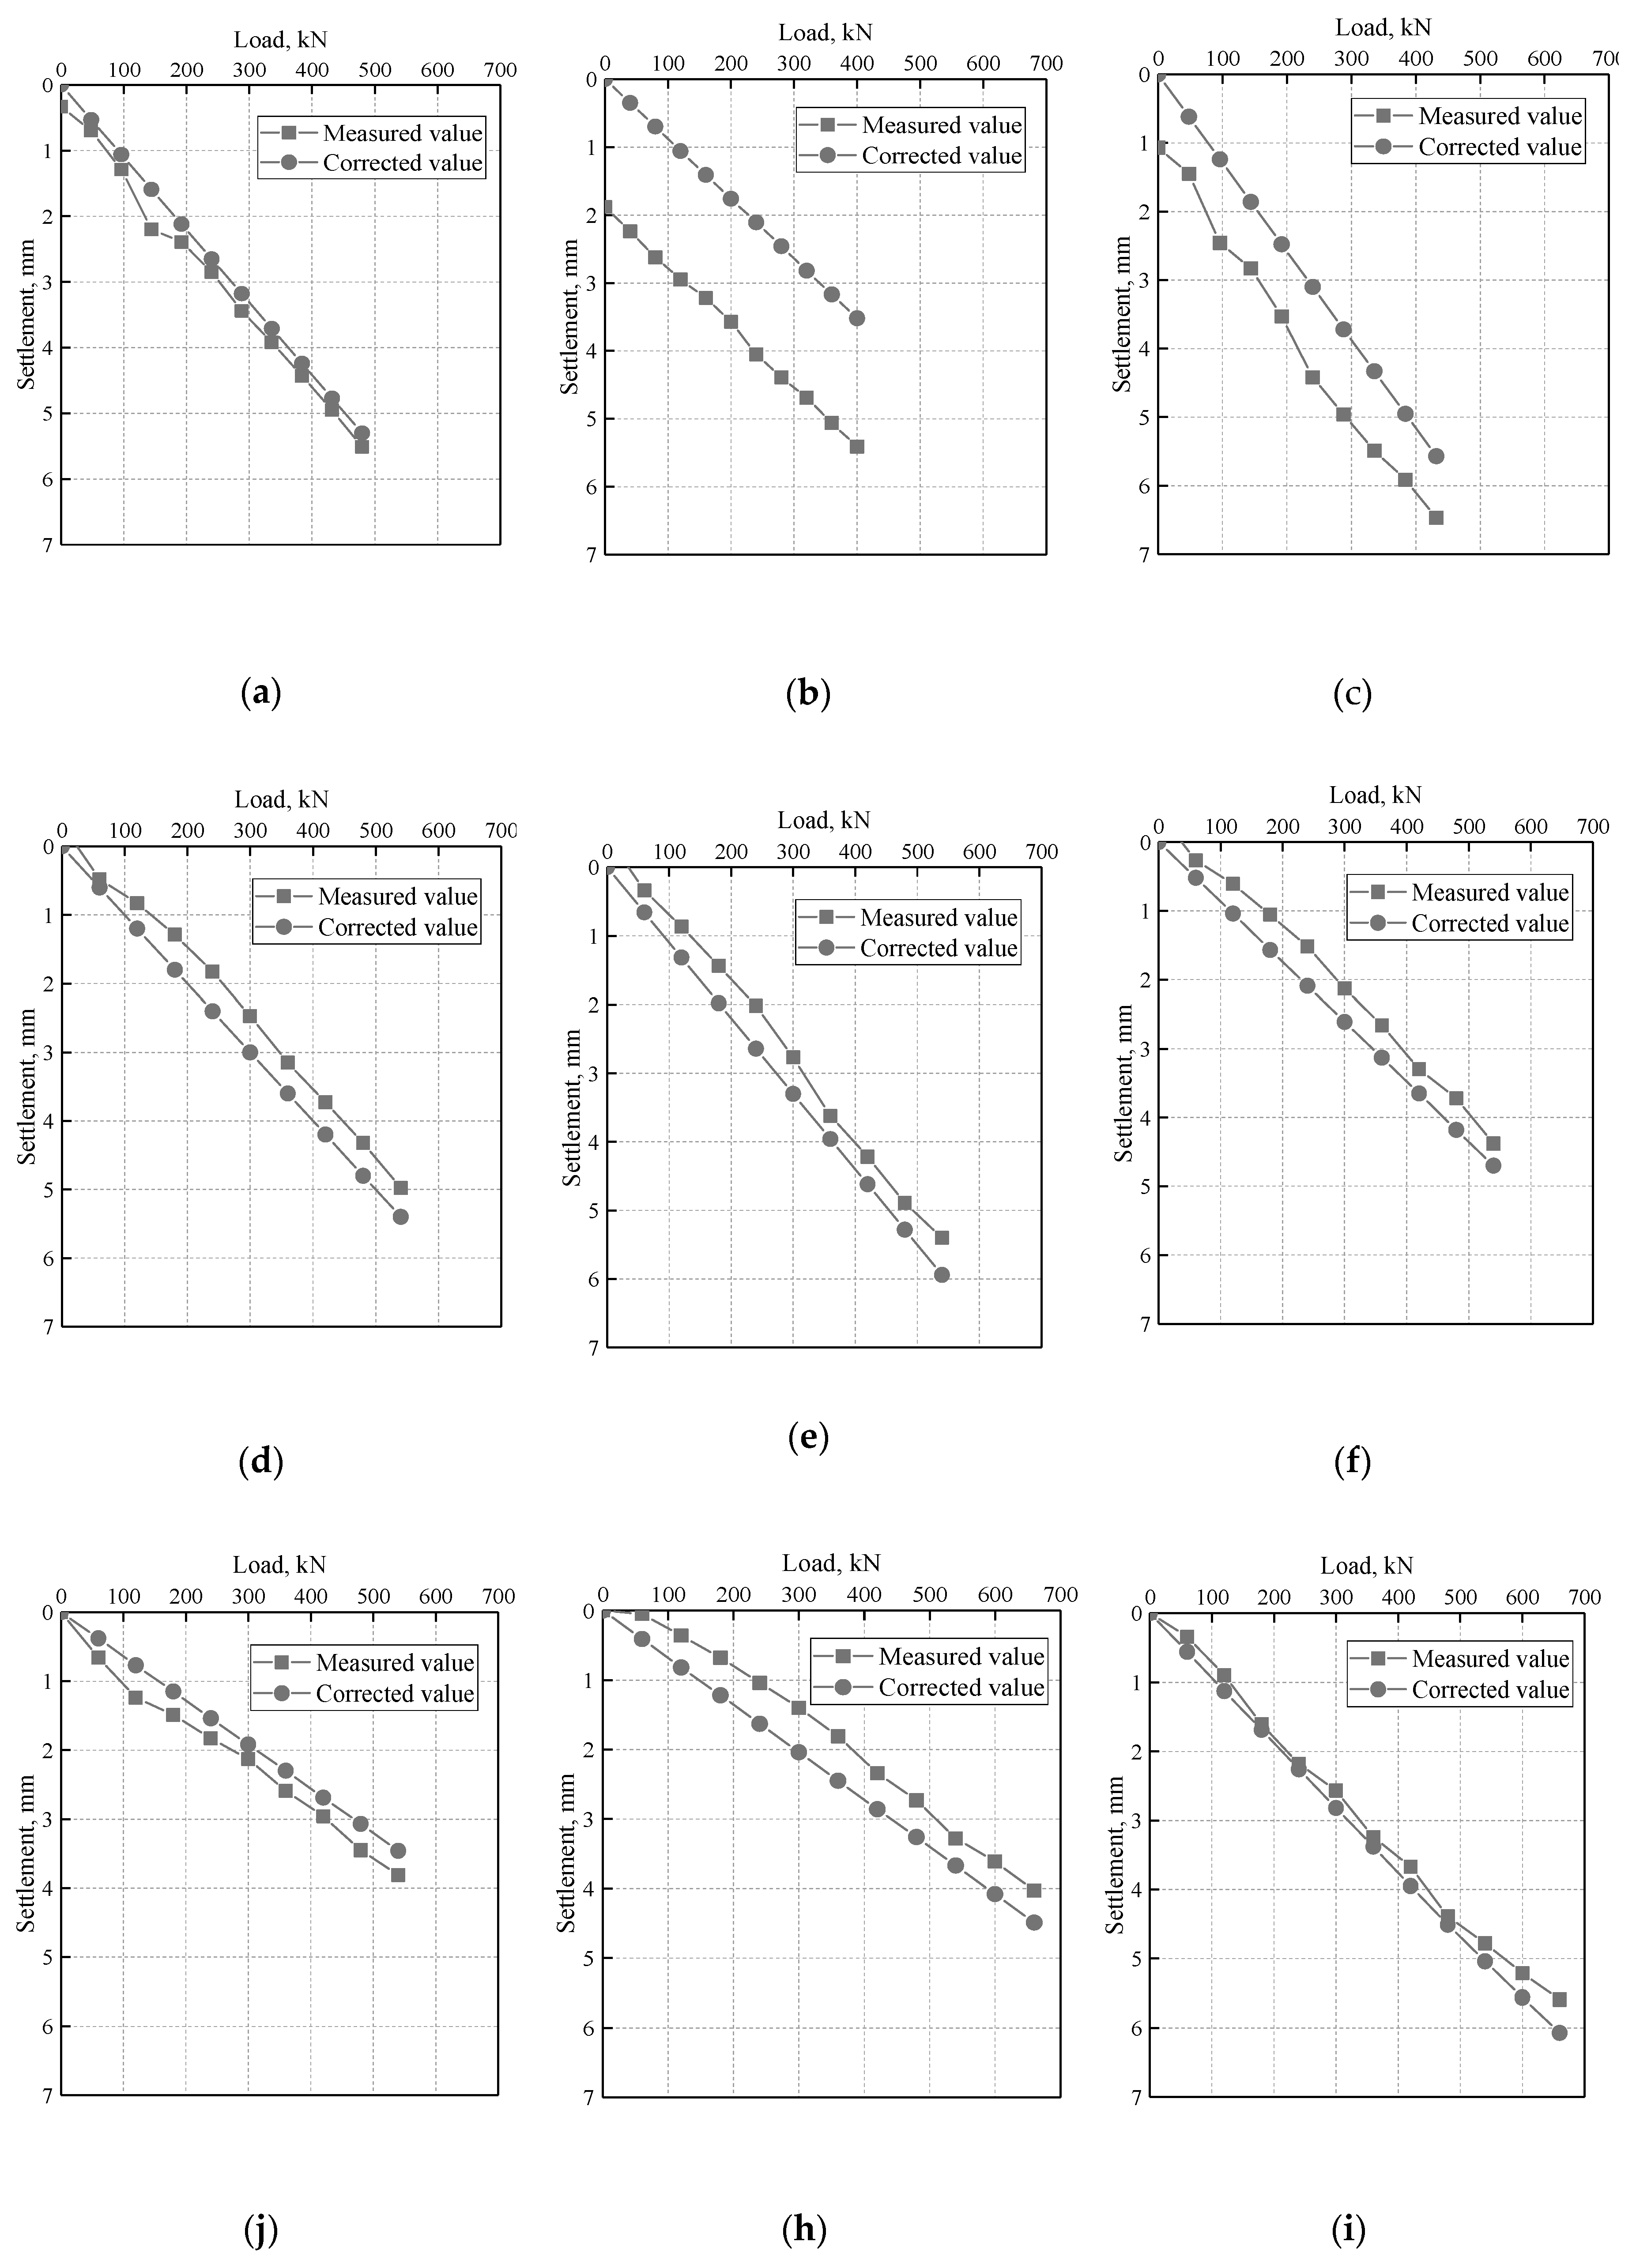
4.3. Plate Loading Test Analysis

The plate loading test is the most reliable test method for determining the soil parameters such as bearing capacity and deformation modulus. The load-settlement curves for each test point were obtained by monitoring the settlement of the SRS under load. Due to the influence of various factors, there is a certain discrepancy between the measured settlement and the actual settlement, and the measured settlement needs to be corrected by the least squares method, which is calculated by the formulas according to the Chinese National Standard GB 50007-2011:
N s 0 + c 0 p s = 0
s 0 p + c 0 p 2 p s = 0
where N is the load series, s0 is the corrected settlement, c0 is the slope of the curve, p is the load, s’ is the initial settlement value under different loads.
Combining Formulas (9) and (10), the corrected settlement s0 and slope c0 can be calculated:
c 0 = N p s p s N p 2 ( p ) 2
s 0 = s p 2 p p s N p 2 ( p ) 2
The measured load-settlement curves and corrected load-settlement curves for each test point are shown in Figure 10. In the test, due to the limitation of the upper limit of loading, the SRS all did not reach the ultimate destruction state, so there is no descending section in the load-settlement curve. Modulus of deformation of the SRS is calculated by the formulas:
E 0 = I 0 ( 1 μ 2 ) p d s
where E0 is the modulus of deformation, I0 is the shape coefficient of the bearing plate, s is the settlement of the bearing plate, d is the length of side of the bearing plate, μ is the Poisson’s ratio of the soil. According to the load-settlement curves in Figure 10, the subgrade bearing capacity and modulus of deformation of the SRS with different admixture can be obtained, as shown in Table 6.
As shown in Figure 10 and Table 7, the Subgrade bearing capacities of A1 SRS, A2 SRS, and A3 SRS are 210 kPa, 220 kPa, and 270 kPa, respectively, and the deformation moduli are 34.48 MPa, 44.68 MPa, and 73.24 MPa, respectively. With the increased FA content, the subgrade bearing capacity and deformation modulus of SRS increased. The strength and compression property of SRS can be improved by adding lime. It is because the water in SRS is absorbed by lime, and the water content of SRS is reduced. Meanwhile, the FA is activated by NaOH to form N-A-S-H gels to fill the pores of solid particles, and the pozzolanic reaction between SR and FA is accelerated to form C-S-H gels to improve the subgrade bearing capacity and deformation modulus of SRS, referenced from the literature [15,38].
The subgrade bearing capacities of A4 SRS and A5 SRS are more than 330 kPa, and the deformation moduli are 68.93 MPa and 50.40 MPa, respectively. The subgrade bearing capacities of A4 SRS (addition sand ) and A5 SRS (addition rubble) are 60 kPa higher than that of A3 SRS, but the deformation moduli of A4 SRS and A5 SRS are 4.31 MPa and 22.84 MPa, which is lower than that of A3 SRS. It can be seen that the addition of sand and rubble had a significant effect on the subgrade bearing capacity of SRS, but a slight influence on modulus of deformation. This is because sand and gravel can serve as the soil skeleton of SRS, significantly improving the strength of the soil [44]. The compressibility of SRS is related to grain composition [45]. When the grain composition of the soil is not good, the rubble (sand) were wrapped by the mixture of SR and FA, the first stage soil skeleton between rubble (sand) cannot be formed. Rubble (sand) becomes the filling material of the second-stage soil skeleton, so the deformation modulus of soil cannot be improved significantly. Therefore, although the strength of A4 SRS and A5 SRS is higher, the deformation modulus is smaller than that of A3 SRS.
The comparison of subgrade bearing capacity and deformation modulus between soda residue soil and general soil are listed in Table 8 [46,47]. It can be seen that the subgrade bearing capacity and deformation modulus of A4 SRS are 330 kPa and 68.93 MPa, respectively, which are obviously higher than clay and sand soil. The maximum subgrade bearing capacity of SRS is 330 kPa (A4 and A5 SRS), which is significantly higher than the test result (180 kPa) of Yan et al. [31], and the maximum modulus of deformation of SRS is 73.24 MPa (A3 SRS). The minimum subgrade bearing capacity and deformation modulus of SRS are 210 kPa and 34.48 MPa, respectively, which are close to that of sand soil. It indicates that the SRS can be used as engineering soil (such as: atrium filling soil, workshop foundation soil, road subgrade backfill soil) in geotechnical engineering. However, SRS should not be used in drinking water sources, cultivated land, and environmentally sensitive areas to avoid secondary pollution of surrounding soil and groundwater, and the effect of cost should be considered in actual filling engineering.

5. Conclusions

The objective of this paper was to validate the feasibility of using soda residue as the main raw material for preparation of soda residue soil; the preparation method in the field was proposed, and mechanical properties of soda residue soil with different mixing proportions and materials were investigated. Conclusions could be drawn as follows:
(1)
The main chemical composition of SR is insoluble salts, and cohesive forces, angle of internal friction, and unconfined compression strength of SR are 40 kPa, 15.6°, and 0.02 kPa, respectively. The mechanical properties of SR need to be improved.
(2)
The addition of FA contributed to the strength development of SR, incorporating about 50% FA makes the admixture possess the highest cohesive forces, angle of internal friction, and unconfined compression strength, which account for 74 kPa, 32°, and 0.43 kPa, respectively. The SRS optimum water content range is 46–63%, and the corresponding dry density is 0.94–1.00 g/cm3. The SRS has good water stability and will not collapse.
(3)
The addition of sand and rubble in SRS has a significant effect on subgrade bearing capacity, but a slight effect on the modulus of deformation. The subgrade bearing capacity and deformation modulus can be improved by adding lime. The subgrade bearing capacity and deformation modulus of SRS in field tests are more than 210 kPa and 34.48 MPa, respectively.
In summary, the research investigated the mechanical properties of SRS with different mixing proportions. However, to further promote the engineering application of SRS, it is necessary to investigate the effect of other admixtures (such as sodium silicate and sodium sulphate), different mixing proportions and the particle size of raw material on the mechanical characteristics of SRS.

Author Contributions

Conceptualization, M.Z. and N.Y.; methodology, N.Y., J.L., and J.M.; data curation, Y.W., J.L., and J.M.; writing—original draft preparation, J.M.; writing—review and editing, X.B., N.Y., and M.Z. All authors have read and agreed to the published version of the manuscript.

Funding

This research was funded by the National Natural Science Foundation of China, grant number 51809146; the Shandong Key Research and Development Program, grant number 2018GSF117008.

Conflicts of Interest

The authors declare no conflict of interest.

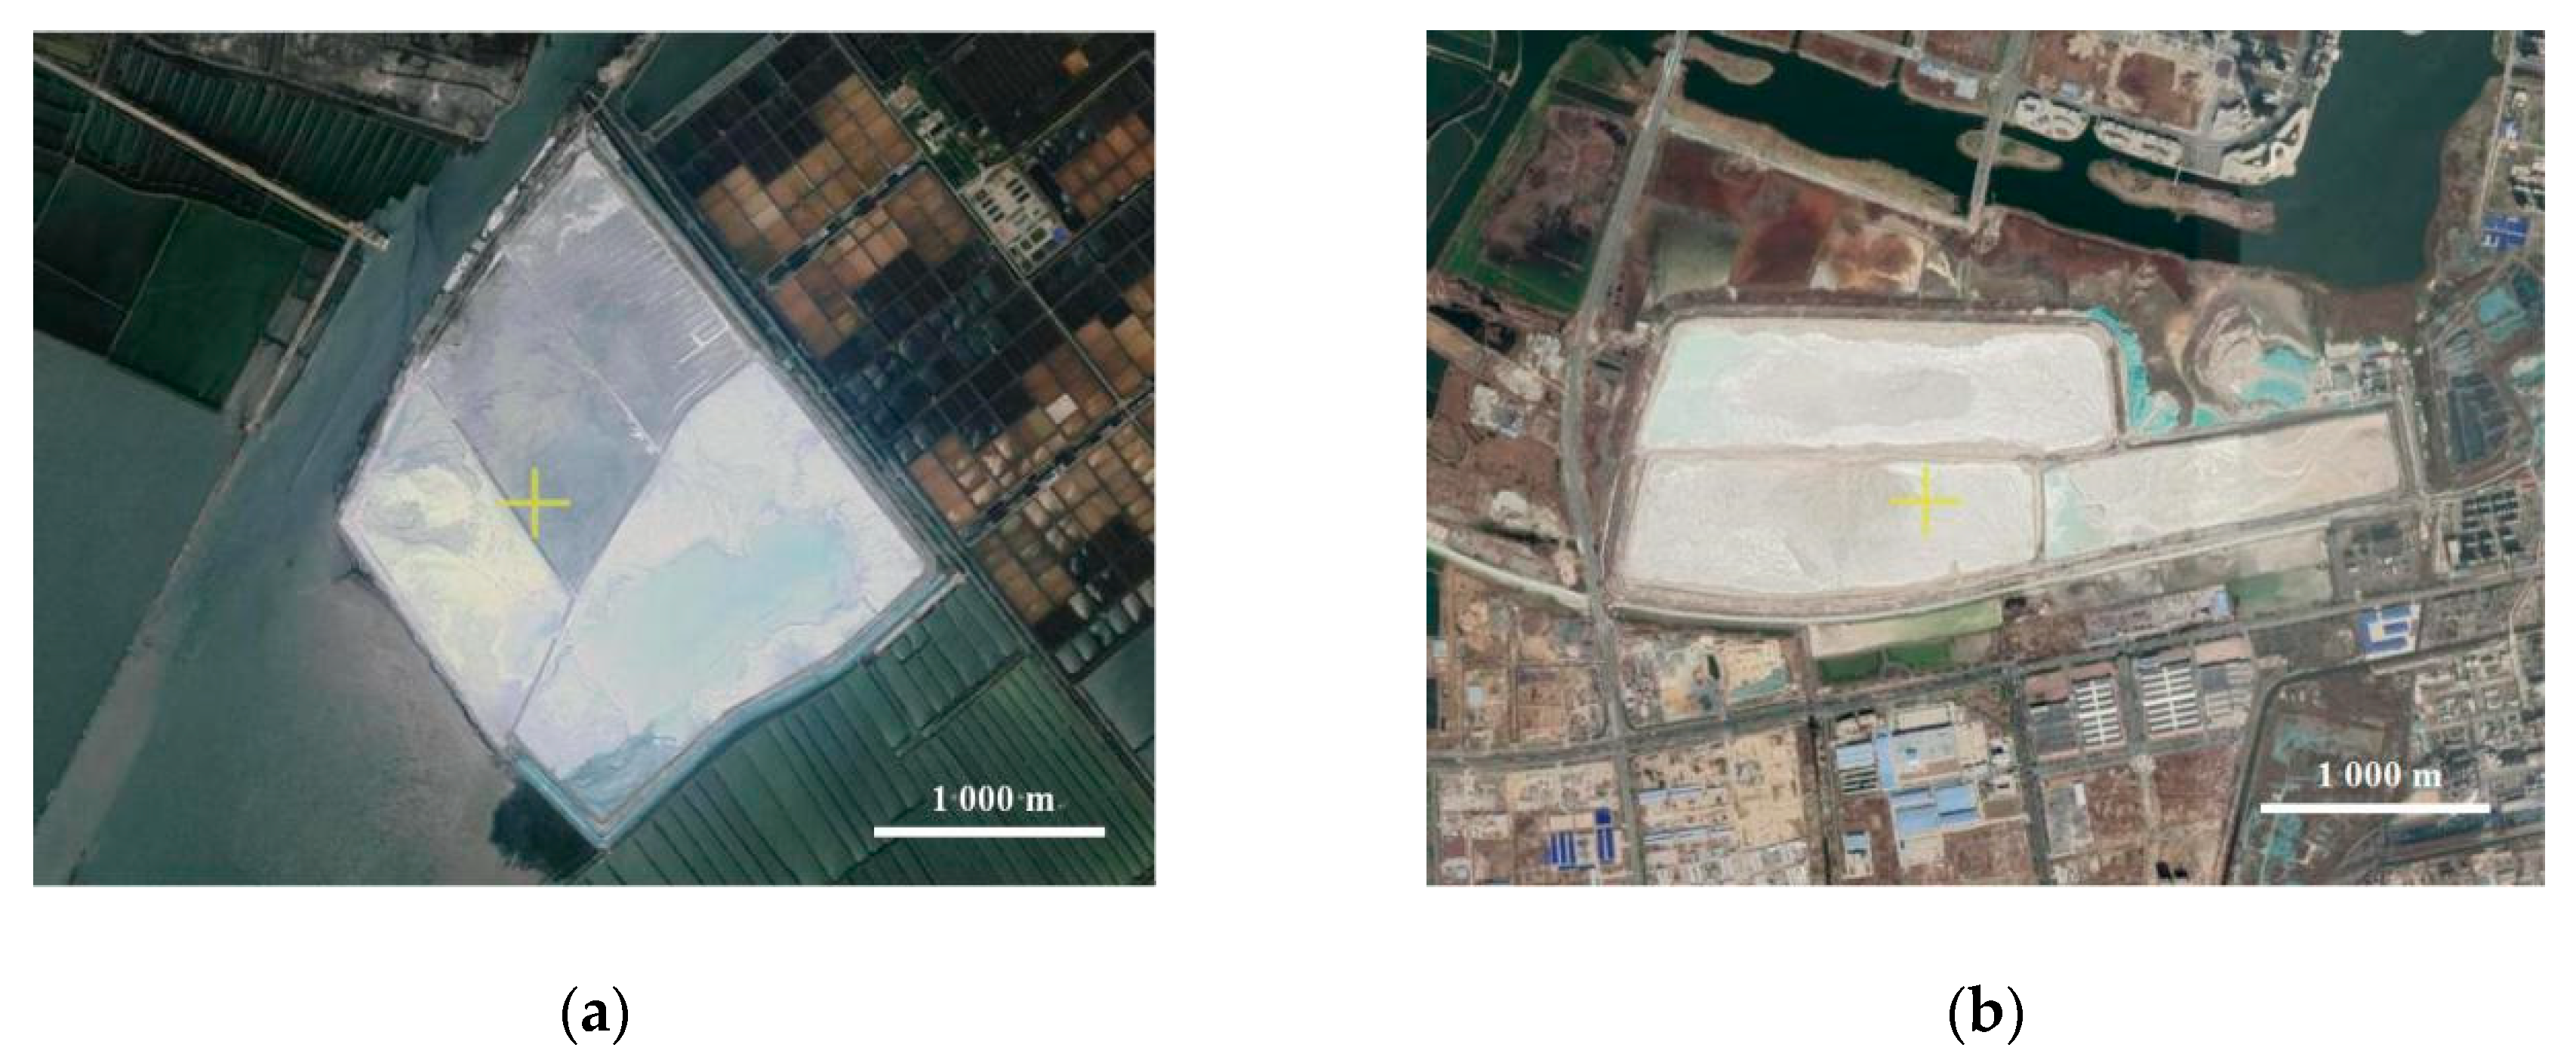
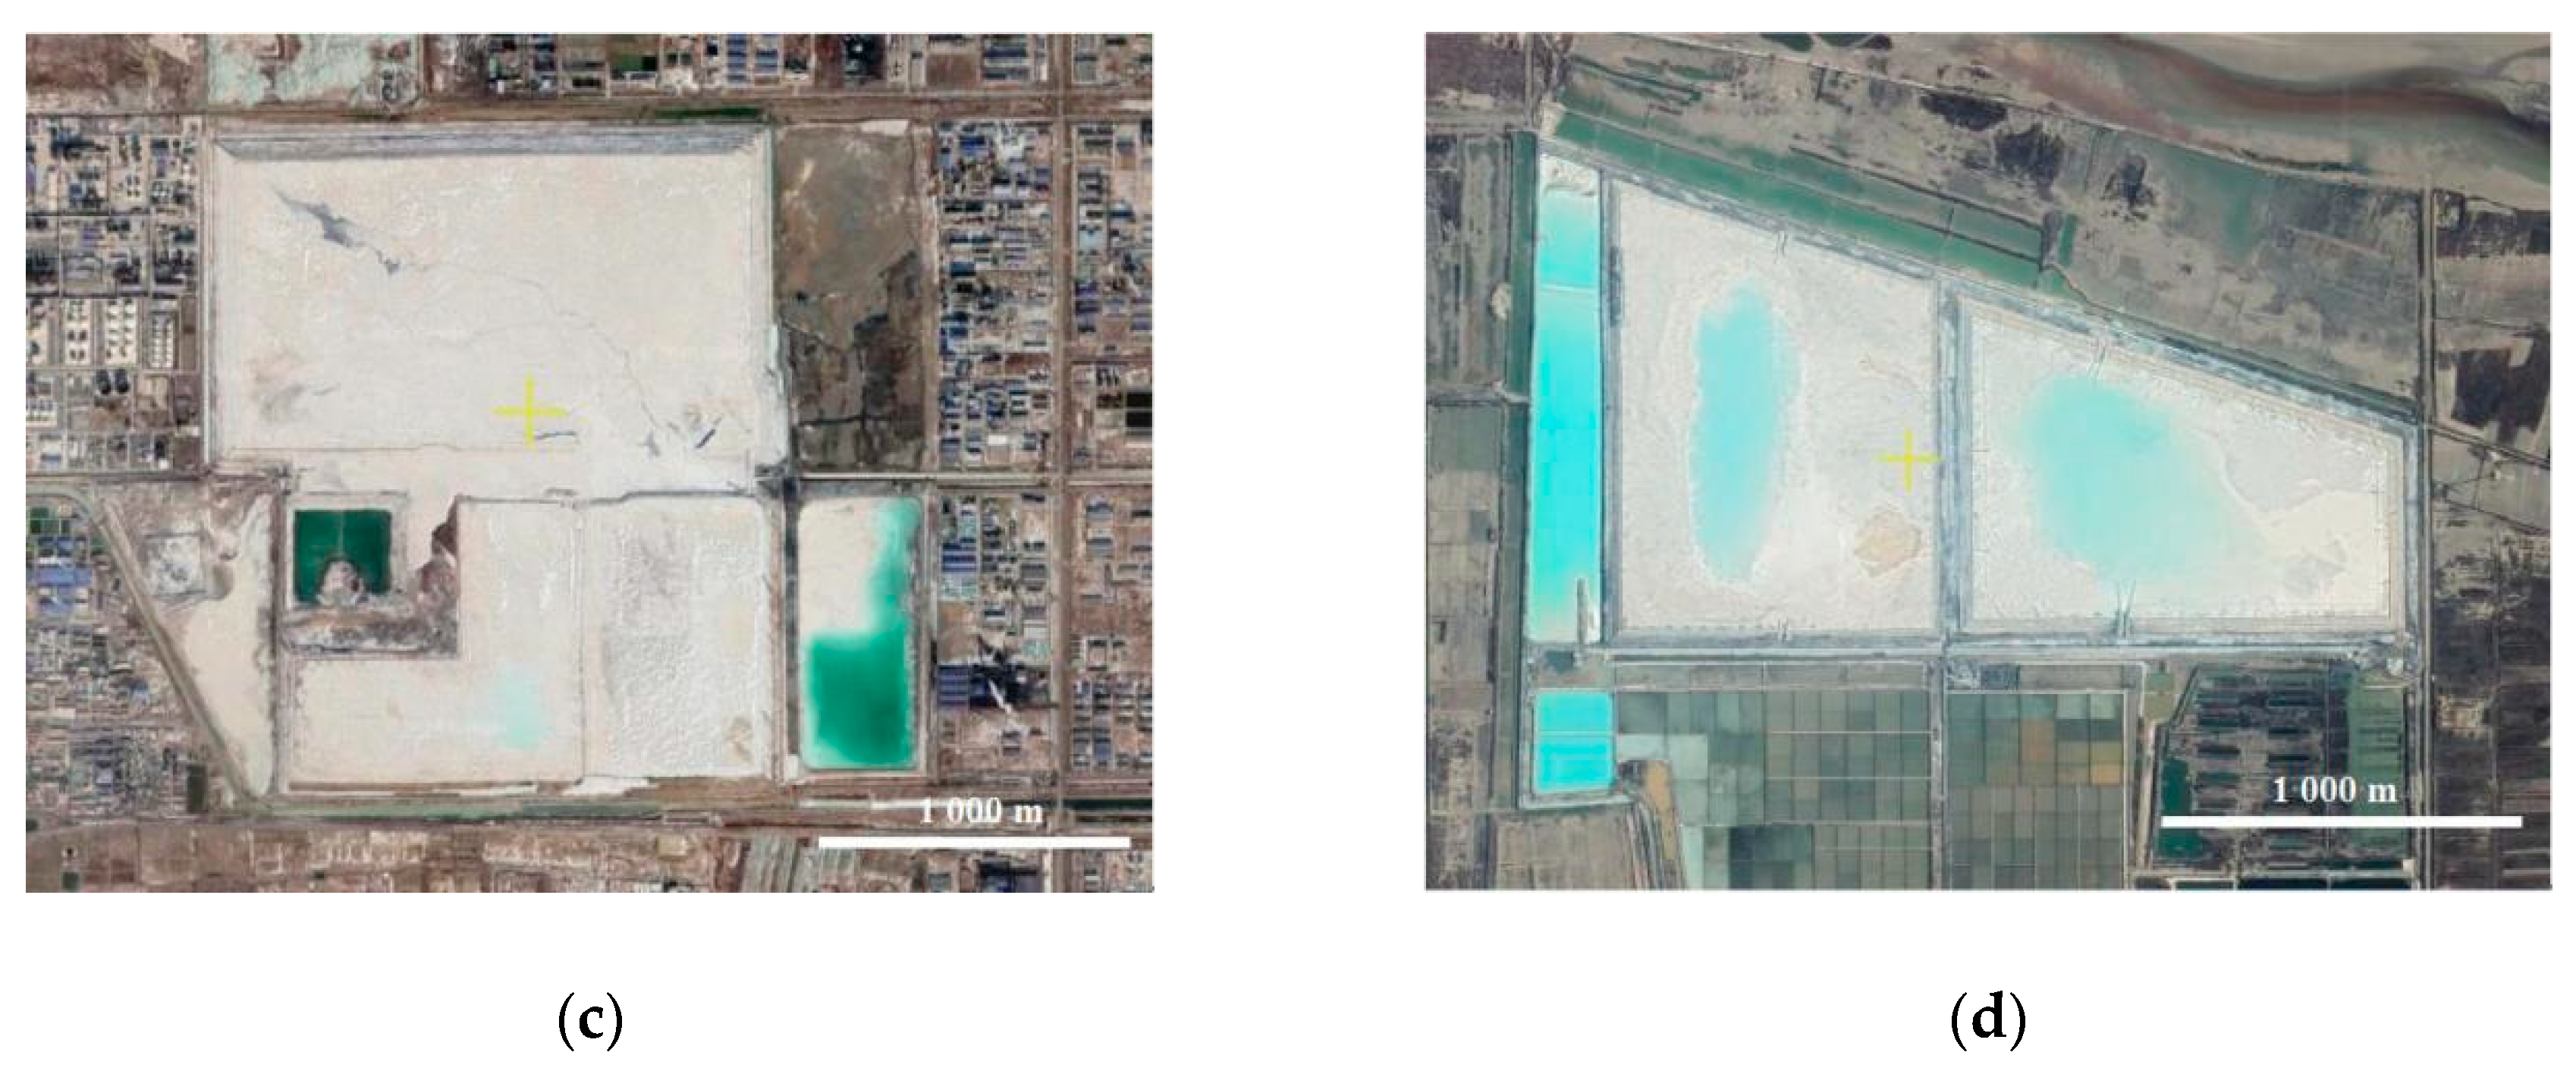
Appendix A. Remote Sensing Maps of Stacked Waste Soda Residues in China

Remote sensing maps of stacked waste soda residues in China as shown in Figure A1.
Figure A1. Remote sensing maps of stacked waste soda residues in China: (a) Tangshan; (b) Lianyungang; (c) Weifang; (d) Qingdao.
Sustainability 12 05852 g0a1aSustainability 12 05852 g0a1b

References

  1. Zhao, X.H.; Liu, C.Y.; Wang, L.; Zuo, L.M.; Zhu, Q.; Ma, W. Physical and mechanical properties and micro characteristics of fly ash-based geopolymers incorporating soda residue. Cem. Concr. Comp. 2019, 98, 125–136. [Google Scholar] [CrossRef]
  2. Liu, R.Z.; Li, J.L.; Wang, Y.W.; Liu, D.W. Flotation separation of pyrite from arsenopyrite using sodium carbonate and sodium humate as depressants. Colloid. Surface. A 2020, 595, 124669. [Google Scholar] [CrossRef]
  3. Erabi, M.; Goshadrou, A. Bioconversion of Glycyrrhiza glabra residue to ethanol by sodium carbonate pretreatment and separate hydrolysis and fermentation using Mucor hiemalis. Ind. Crop. Prod. 2020, 152, 112537. [Google Scholar] [CrossRef]
  4. Ucal, G.O.; Mahyar, M.; Tokyay, M. Hydration of alinite cement produced from soda waste sludge. Construct. Build. Mater. 2018, 164, 178–184. [Google Scholar] [CrossRef]
  5. Zha, F.S.; Pan, D.D.; Xu, L.; Kang, B.; Yang, C.B.; Chu, C.F. Investigations on engineering properties of solidified/stabilized pb-contaminated soil based on alkaline residue. Adv. Civ. Eng. 2018, 8595419, 1–8. [Google Scholar] [CrossRef]
  6. Yan, C.; Song, X.K.; Zhu, P.; Sun, H.Y.; Li, Y.P.; Zhang, J.F. Experimental study on strength characteristics of soda residue with high water content. Chin. J. Geotech. Eng. 2007, 29, 1683–1688. [Google Scholar]
  7. Gomes, H.I.; Mayes, W.M.; Rogerson, M.; Stewart, D.I.; Burke, I.T. Alkaline residues and the environment: A review of impacts, management practices and opportunities. J. Clean. Prod. 2015, 112, 3571–3582. [Google Scholar] [CrossRef] [Green Version]
  8. Wang, B.M.; Wang, L.J.; Mohd Zain, M.F.; Lai, F.C. Development of soda residue concrete expansion agent. J. Wuhan Univ. Technol. Mater. Sci. Ed. 2003, 18, 79–82. [Google Scholar]
  9. Matthews, D.A.; Eddler, S.W. Decreases in pollutant loading from residual soda ash production waste. Water Air Soil Poll. 2003, 146, 55–73. [Google Scholar] [CrossRef]
  10. Zhao, X.H.; Liu, C.Y.; Zuo, L.M.; Zhu, Q.; Ma, W.; Liu, Y. Preparation and characterization of press-formed fly ash cement incorporating soda residue. Mater. Lett. 2019, 259, 126852. [Google Scholar] [CrossRef]
  11. Yang, J.J.; Xie, W.; Zhang, L.; He, C.S.; Bao, G.D. Study on experimental preparation of cement mortar incorporating fly ash-soda residue. Bull. Chin. Ceram. Soc. 2010, 29, 1211–1216. [Google Scholar]
  12. Kuznetsova, T.V.; Shatov, A.A.; Dryamina, M.A.; Badertdinov, R.N. Use of wastes from soda production to produce nonshrinking oil-well cement. Russ. J. Appl. Chem. 2005, 78, 698–701. [Google Scholar] [CrossRef]
  13. Zhang, G.; Li, X.; Li, Y.; Wu, T.; Sun, D.; Lu, F. Removal of anionic dyes from aqueous solution by leaching solutions of white mud. Desalination 2011, 274, 255–261. [Google Scholar] [CrossRef]
  14. Zhao, X.H.; Liu, C.Y.; Zuo, L.M.; Wang, L.; Zhu, Q.; Liu, Y.C.; Zhou, B.Y. Synthesis and characterization of fly ash geopolymer paste for goaf backfill: Reuse of soda residue. J. Clean. Prod. 2020, 260, 121045. [Google Scholar] [CrossRef]
  15. Zhao, X.H.; Liu, C.Y.; Zuo, L.M.; Wang, L.; Zhu, Q.; Wang, M.K. Investigation into the effect of calcium on the existence form of geopolymerized gel product of fly ash based geopolymers. Cement Concrete Comp. 2018, 103, 279–292. [Google Scholar] [CrossRef]
  16. Yuan, X.M.; Zhang, H.; Liu, X.M.; Xiong, F. Influence of alkaline residue site on carst groundwater. Admin. Tech. Environ. Monit. 2010, 22, 36–39. [Google Scholar]
  17. Yu, S.J.; Bi, W.Y. Research on the impact of CI- to environment when industrial soda residue is appiled in highway project. Energy Environ. Prot. 2007, 21, 47–50. [Google Scholar] [CrossRef]
  18. Ohenoja, K.; Pesonen, J.; Yliniemi, J.; Illikainen, M. Utilization of fly ashes from fluidized bed combustion: A review. Sustainability 2020, 12, 2988. [Google Scholar] [CrossRef] [Green Version]
  19. Czop, M.; Lazniewska-Piekarczyk, B. Evaluation of the leachability of contaminations of fly ash and bottom ash from the combustion of solid municipal waste before and after stabilization process. Sustainability 2020, 11, 5384. [Google Scholar] [CrossRef] [Green Version]
  20. Ilyukhin, V.V.; Nevsky, N.N.; Bickbau, M.J. Crystal structure of alinite. Nature 1977, 269, 397–398. [Google Scholar] [CrossRef]
  21. Vaidyanathan, D.; Kapur, P.C.; Singh, B.N. Production and properties of alinite cements from steel plant wastes. Cement. Concrete. Res. 1990, 20, 15–24. [Google Scholar]
  22. Hou, G.H. Design and research of the mineral composition of white alinite cement. J. Build. Mater. 2002, 5, 80–83. [Google Scholar]
  23. Kesim, A.G.; Tokyay, M.; Yaman, I.O.; Ozturk, A. Properties of alinite cement produced by using soda sludge. Adv. Cem. Res. 2013, 25, 104–111. [Google Scholar] [CrossRef]
  24. Sumajouw, D.M.J.; Hardjito, D.; Wallah, S.E.; Rangan, B.V. Fly ash-based geopolymer concrete: Study of slender reinforced columns. J. Mater. Sci. 2007, 42, 3124–3130. [Google Scholar] [CrossRef]
  25. Moreno, N.; Querol, X.; Andres, J.M.; Stanton, K.; Towler, M.; Nugteren, H.; Janssen-Jurkovicova, M.; Jones, R. Physico-chemical characteristics of European pulverized coal combustion fly ashes. Fuel 2005, 84, 1351–1363. [Google Scholar] [CrossRef]
  26. Nuccetelli, C.; Pontikes, Y.; Leonardi, F.; Trevisi, R. New perspectives and issues arising from the introduction of (NORM) residues in building materials: A critical assessment on the radiological behaviour. Constr. Build. Mater. 2015, 82, 323–331. [Google Scholar] [CrossRef]
  27. Cherian, C.; Siddiqua, S. Pulp and paper mill fly ash: A review. Sustainability 2019, 11, 4394. [Google Scholar] [CrossRef] [Green Version]
  28. Park, S.M.; Khalid, H.R.; Seo, J.H.; Yoon, H.N.; Son, H.M.; Kim, S.H.; Lee, N.K.; Lee, H.K.; Jang, J.G. Pressure-induced geopolymerization in alkali-activated fly ash. Sustainability 2018, 10, 3538. [Google Scholar] [CrossRef] [Green Version]
  29. Liu, Y.L.; Wang, Y.S.; Fang, G.H.; Alrefaei, Y.; Dong, B.Q.; Xing, F. A preliminary study on capsule-based self-healing grouting materials for grouted splice sleeve connection. Construct. Build. Mater. 2018, 170, 418–423. [Google Scholar] [CrossRef]
  30. Sun, J.Y.; Gu, X. Engineering properties of the new non-clinker incorporating soda residue solidified soil. J. Build. Mater. 2014, 17, 1031–1035. [Google Scholar]
  31. Yan, S.W.; Hou, J.F.; Liu, R. Research on geotechnical properties and environmental effect of mixture of soda waste and fly ash. Rock Soil Mech. 2006, 27, 2305–2308. [Google Scholar]
  32. Ji, G.D.; Yang, C.H.; Liu, W.; Zuo, J.J.; Lei, G.W. An experimental study on the engineering properties of backfilled alkali wastes reinforced by fly ash. Rock Soil Mech. 2015, 36, 2169–2176. [Google Scholar]
  33. Otsuki, A.; Gonçalves, P.P.; Stieghorst, C.; Révay, Z. Non-destructive characterization of mechanically processed waste printed circuit boards: X-ray fluorescence spectroscopy and prompt gamma activation analysis. J. Compos. Sci. 2019, 3, 54. [Google Scholar] [CrossRef] [Green Version]
  34. Otsuki, A.; Gonçalves, P.P.; Leroy, E. Selective milling and elemental assay of printed circuit board particles for their recycling purpose. Metals 2019, 9, 899. [Google Scholar] [CrossRef] [Green Version]
  35. Otsuki, A.; Mensbruge, L.D.L.; King, A.; Serranti, S.; Fiore, L.; Bonofazi, G. Non-destructive characterization of mechanically processed waste printed circuit boards-particle liberation analysis. Waste Manag. 2020, 102, 510–519. [Google Scholar] [CrossRef]
  36. Han, F.Q.; Zhang, M.Y.; Zhou, Y.Z. Laboratory research on strength and deformation of soda residue soil. J. Qingdao Univ. Tech. 2004, 25, 20–22. [Google Scholar]
  37. Li, Y.Y.; Yan, S.W.; Zhang, J.Y.; Yin, X.T. Engineering properties and microstructural features of the soda residue. Chin. J. Geotech. Eng. 1999, 21, 100–103. [Google Scholar]
  38. Liu, C.Y.; Hu, L.; Zhu, Q.; Zhao, X.H.; Liu, Y.C.; Ma, W. Experimental study on performance of fly ash reinforced soda residue padding pad. J. Hebei Univ. Tech. 2018, 47, 87–93. [Google Scholar]
  39. Ahmadi, S.F.; Eskandari, M. Vibration analysis of a rigid circular disk embedded in a transversely isotropic solid. J. Eng. Mech. 2014, 140, 04014048. [Google Scholar] [CrossRef]
  40. Eskandari, M.; Samea, P.; Ahmadi, S.F. Axisymmetric time-harmonic response of a surface-stiffened transversely isotropic half-space. Meccanica 2017, 52, 183–196. [Google Scholar] [CrossRef]
  41. Ahmadi, S.F.; Samea, P.; Eskandari, M. Axisymmetric response of a bi-material full-space reinforced by an interfacial thin film. Int. J. Solids. Struct. 2016, 90, 251–260. [Google Scholar] [CrossRef]
  42. Wang, Z.Y.; Zhang, N.; Li, Q.; Chen, X.H. Dynamic response of bridge abutment to sand-rubber mixtures backfill under seismic loading conditions. J. Vibroeng. 2017, 19, 434–446. [Google Scholar]
  43. Wang, Q.; Li, J.J.; Yao, G.; Zhu, X.N.; Hu, S.G.; Qiu, J.; Chen, P.; Lyu, X.J. Characterization of the mechanical properties and microcosmic mechanism of Portland cement prepared with soda residue. Constr. Build. Mater. 2020, 241, 1–11. [Google Scholar] [CrossRef]
  44. Li, G.X. On soil skeleton and seepage force. Chin. J. Geotech. Eng. 2016, 38, 1522–1528. [Google Scholar]
  45. San José Martínez, F.; Martín, M.A.; Caniego, F.J.; Tuller, M.; Guber, A.; Pachepsky, Y.; García-Gutiérrez, C. Multifractal analysis of discretized X-ray CT images for the characterization of soil macropore structures. Geoderma 2010, 156, 32–42. [Google Scholar] [CrossRef] [Green Version]
  46. Kuang, Z.; Zhang, M.Y.; Bai, X.Y. Load-bearing characteristics of fibreglass uplift anchors in weathered rock. Proc. Inst. Civ. Eng-Geotech. En. 2020, 173, 49–57. [Google Scholar] [CrossRef]
  47. Chen, X.Y.; Zhang, M.Y.; Bai, X.Y. Axial resistance of bored piles socketed into soft rock. KSCE J. Civ. Eng. 2019, 23, 46–55. [Google Scholar] [CrossRef]
Figure 1. The schematic diagram of the equipment used in laboratory test: (a) Compaction apparatus; (b) Strain-controlled direct shear apparatus; (c) Unconfined compressive strength test apparatus; (d) High-pressure oedometer.
Sustainability 12 05852 g001aSustainability 12 05852 g001b
Figure 2. The preparation process of soda residue soil (SRS): (a) Mixing of raw materials by JS 500 mixer; (b) Excavation of test pits.
Sustainability 12 05852 g002
Figure 3. The field test process of soda residue soil: (a) The distribution of the test points; (b) Schematic diagram of plate load test system.
Sustainability 12 05852 g003
Figure 4. Compaction curve of soda residue soil (SRS) with different proportions.
Sustainability 12 05852 g004
Figure 5. Cohesive forces and angle of internal friction of SRS with different proportions.
Sustainability 12 05852 g005
Figure 6. Unconfined compression strength of SRS with different proportions.
Sustainability 12 05852 g006
Figure 7. Porosity ratio and load curves of samples with different water content and compaction coefficient: (a) samples A1 to A4; (b) samples B1 to B4.
Sustainability 12 05852 g007
Figure 8. Collapsibility test curve of SRS
Sustainability 12 05852 g008
Figure 9. Micro penetration blow count of SRS.
Sustainability 12 05852 g009
Figure 10. Measured and corrected plate load curves of soda residue soil: (a) A1-1 test point; (b) A1-2 test point; (c) A1-3 test point; (d) A2-1 test point; (e) A2-2 test point; (f) A2-3 test point; (j) A3 test point; (h) A4 test point; (i) A5 test point.
Sustainability 12 05852 g010
Table 1. Chemical compositions of soda residue (SR) and fly ash (FA).
Soda ResiduePercentage (wt %)Fly AshPercentage (wt %)
CaCO351.22SiO251.64
Mg(OH)212.78Al2O325.17
NaCl10.87Fe2O313.24
CaSO49.24CaO3.23
Fe2O35.23MgO2.51
CaCl24.45LOI *3.14
CaO2.10Others1.07
Acid insoluble4.11--
* LOI: loss on ignition at 1000 °C (wt %).
Table 2. The mixing proportions of the soda residue soil (SRS).
No.Mixing Proportions *
A1SR:FA = 12: 1
A2SR:FA = 10: 1
A3SR:FA:L = 13:6:1
A4SR:FA:S:L = 10:5:4:1
A5SR:FA:R:L = 10:5:4:1
* SR: soda residue, FA: fly ash, S: sand, R: rubble, L: lime powder. The proportions are the mass proportions.
Table 3. Water content and compaction coefficient of each sample.
No.A1A2A3A4B1B2B3B4
Water content/%43.254.165.269.965.265.265.265.2
Coefficient of compaction/MPa0.900.900.900.900.700.800.900.95
Table 4. The coefficient and modulus of compressibility of each sample.
No.A1A2A3A4B1B2B3B4
Coefficient of compressibility/MPa10.4490.4950.3880.4921.6441.3470.4800.267
Modulus of compressibility/MPa6.4966.6197.7516.1402.3102.5516.55611.016
Table 5. The criterion for judging the compressibility of soil.
Compressibility of SoilCoefficient of Compressibility a1-2/MPa−1
Low-compressibility soila1-2 < 0.1
Medium-compressibility soil0.1 ≤ a1-2 < 0.5
High-compressibility soila1-2 ≥ 0.5
Table 6. Compaction coefficient of the SRS.
No.Density
/g·cm−3
Water Content
/%
Dry Density
/g·cm−3
Maximum Dry Density/g·cm−3Compaction CoefficientAverage *
A11.4971.80.880.960.920.94
1.5467.10.920.960.96
A21.5567.50.930.940.990.99
1.5165.30.910.930.98
* This is the average of the compaction coefficients.
Table 7. Subgrade bearing capacity and modulus of deformation of the SRS.
No.A1-1A1-2A1-3A2-1A2-2A2-3A3A4A5
Subgrade bearing capacity/kPa≥210≥220≥270≥330≥330
Modulus of deformation/MPa34.4844.6873.2468.9350.40
Table 8. Comparison of mechanical indexes between soda residue soil and general soil.
Mechanical IndexesA4 SRSClaySand Soil
Subgrade bearing capacity/kPa>330120~180150~220
Modulus of deformation/MPa68.9310~2216~35

