Urban Resilience Assessment: Mapping Knowledge Structure and Trends


1
Graduate School of Humanities and Social Sciences, Hiroshima University, Higashi-Hiroshima 739-8530, Japan
2
Graduate School of Advanced Science and Engineering, Hiroshima University, Higashi-Hiroshima 739-8530, Japan
3
Network for Education and Research on Peace and Sustainability (NERPS), Hiroshima University, Higashi-Hiroshima 739-8530, Japan
Sustainability 2020, 12(15), 5918; https://0-doi-org.brum.beds.ac.uk/10.3390/su12155918
Submission received: 1 July 2020
/
Revised: 21 July 2020
/
Accepted: 21 July 2020
/
Published: 23 July 2020
(This article belongs to the Collection Indicators, Assessment Tools, and Rating Systems for Mainstreaming Sustainability in Urban Planning and Development)
Abstract
:The literature on urban resilience assessment has grown rapidly over the past two decades. This paper aims to provide a better understanding of the state of knowledge on urban resilience assessment through mapping the knowledge domain and highlighting emerging trends during different periods. The objects of study were 420 papers published in the Web of Science from 1998 to 2020. Science mapping was done using VOSviewer and CiteSpace, two widely known software tools for bibliometrics analysis and scientometric visualization. The results show that research published on urban resilience assessment was very limited and fragmented until 2009, and the focus has mainly been on risk mitigation and vulnerability assessment. The intellectual base grew between 2010 and 2014, when a paradigm shift from approaches based on robustness and reliability toward more adaptation-oriented approaches occurred. Finally, the annual publication trends have grown rapidly over the past five years and there has been more emphasis on climate change adaptation and flood resilience. Overall, in terms of dimensional focus, more attention has been paid to infrastructural, institutional, and environmental aspects at the expense of social and economic dimensions. In addition to information on thematic focus and evolution, this paper also provides other bibliometrics information on the influential authors, institutions, journals, and publications that lay the foundation of the field and can be used by various interested groups as points of reference to gain better knowledge about the structure and thematic evolution of urban resilience assessment. The paper concludes by highlighting gaps and making some recommendations for future improvement of the field. Major gaps are related to assessing resilience against socio-economic and health risks (e.g., economic recession and pandemics such as COVID-19).
1. Introduction
As global urbanization trends continue, urban resilience has become a major area of interest to researchers and policy makers alike [1]. While cities have traditionally faced various natural and human-made risks, the compounding effects of climate change and urbanization are expected to increase the intensity and frequency of such risks, making it imperative to build on urban resilience [2]. Understanding this need, many cities around the world have taken actions to enhance their resilience. In the meantime, over the past two decades, there has been a surge of interest in developing and implementing indicator sets, methods, and tools for assessing urban resilience [3,4]. This can be explained by the multiple benefits of resilience assessment for different stakeholders, including local authorities, funding agencies and donor organization, citizens, and academic researchers. Among other things, local authorities can utilize assessment processes and results to track achievement of resilience-building initiatives, identify priority intervention areas, engage different stakeholders in the resilience-building efforts, and enhance transparency of the decision-making processes. Funding agencies and donor organizations can use assessment results for evidence-based evaluation of funded projects and allocation of future investments. Citizens can also benefit from resilience assessment processes and findings by gaining a better understanding of the major risks and vulnerabilities, and resilience-building activities that can be pursued to address them. Finally, through continued engagement in resilience assessment activities, researchers can develop better approaches for untangling the complexities inherent in the resilience concept and better strategies for enhancing urban resilience [3].
Despite over two decades of research on urban resilience assessment, there is still no study mapping the knowledge structure and research development trends. There are some review papers that provide information related to either single sectors such as energy [5], transportation [6], street networks [7], and water [8], or single types of stressors such flooding [9]. However, there is still a lack of comprehensive reviews that cover different sectors and stressors. Two major approaches can be taken to fill this gap. One is based on the traditional systematic review of the literature that would be a challenging task, considering that a vast body of research should be examined manually to distill the required information. A more recent approach is to rely on the data analytics and text mining features provided by software tools. Such features make it possible to map the knowledge structure of a field, identify its dominant areas of focus, and highlight emerging/underexplored areas [10,11]. They also provide information on various performance metrics related to authors, references, journals, institutions, and countries that have contributed to the development of the research field [10,11].
VOSviewer and CiteSpace are two software tools widely used for the purpose of science mapping and bibliometrics analysis. For instance, they have been used to detect and map intellectual base, thematic focus, emerging trends, and new developments in various fields such as emergency evacuation [12] and regenerative medicine [13]. Utilizing these tools, the main purpose of this paper is to provide a better understanding of the knowledge structure and trends in urban resilience assessment. Other objectives are to identify major thematic clusters of the existing research, to highlight performance and interconnections between different items related to the field (i.e., authors, publications, journals, intuitions, and countries), to explore intellectual transitions that have occurred over time, and to highlight underexplored areas that warrant further research. This approach to bibliometrics analysis and science mapping has multiple utilities. Researchers new to the field can refer to the findings to gain an overall understanding of the intellectual base of urban resilience assessment and its development trends. Additionally, they can gain more in-depth understanding of the field by referring to the influential studies highlighted by bibliometrics analysis [14]. This can provide them with a more rapid and effective way to develop ideas for their future research. Similarly, since this is a fast-growing field, regular overall mapping of the intellectual base is needed to keep up with new developments, gain knowledge about dominant and emergent areas, and identify gaps and understudied areas that need further attention [10].
The research materials and methods are presented in the following section. The results related to different bibliometrics analyses are reported and discussed in Section 3. These include results related to different citation, co-citation, bibliographic coupling, and term co-occurrence analyses conducted using VOSviewer and CiteSpace. Finally, Section 4 concludes the study by summarizing the results and providing recommendations for future research.
2. Materials and Methods
The data for analysis was retrieved from the Web of Science Core Collection database, using a search string that includes various terms related to urban resilience assessment (see the Supplementary Materials). The search string was designed in a way to, as much as possible, include all types of studies focused on assessing urban resilience. The literature search was conducted on 8 June 2020 for an unlimited time span and returned 641 documents. Titles and abstracts of all the retrieved documents were examined to exclude those that were not focused on urban resilience. Two major groups of studies were excluded during this screening process. One group was mainly related to psychology and included studies related to adolescent resilience in urban contexts, and the other included studies that have referred to “resilience measures” in the abstract but are not focused on assessing/measuring resilience. At the end of the screening process, 420 documents remained in the database. These are mainly research papers (~93%), review papers (~5%), and proceeding papers and book chapters (~2%). The “Full Record and Cited References” of these articles were downloaded and used as input data for bibliometrics analysis and science mapping using VOSviewer and CiteSpace.
VOSviewer and CiteSpace are Java applications for analyzing and visualizing bibliometric networks. In addition to providing information on major thematic focus areas, these tools can be used to untangle complex interrelationships between different underlying components of a research field. This is done through different methods for understanding term co-occurrence, citation, co-citation, and bibliographic coupling relations. Both applications are freely available to download (VOSviewer at: https://www.vosviewer.com/; and CiteSpace at: http://cluster.cis.drexel.edu/~cchen/citespace/). The application websites also offer free access to user manuals that provide detailed information on various bibliometrics analysis techniques and various steps that should be taken for data pruning and analysis.
In this study, VOSviewer was mainly used to conduct four types of analyses: term co-occurrence, citation, co-citation, and bibliographic coupling [11]. Term co-occurrence analysis is used to identify frequently co-occurred terms and major thematic clusters that form the intellectual base of the field. To account for different variants of some terms (e.g., “earthquakes” and “earthquake”), before doing the co-occurrence analysis, a thesaurus file was added to the VOSviewer database. This way synonymous terms were merged. Citation and co-citation analyses were conducted to identify and categorize most influential journals, publications, and authors. Citation analysis is used to identify the most influential authors and references based only on the citation data of the documents retrieved from literature search. In contrast, co-citation analysis also includes references cited by the retrieved documents in the analysis. Co-citation refers to the link between two documents that are simultaneously cited by a third document [15]. Finally, bibliographic coupling is a measure of similarity between documents that was used to identify the countries and institutions that have played a more significant role in the development of a research field. “A bibliographic coupling link is a link between two items that both cite the same document” [15]. In addition to detailed numerical information on performance analysis, the main outputs of these analyses are network graphs composed of nodes and links. The size of each node is proportional to the frequency of the object that is used as the unit of analysis (e.g., citation, document count, etc.), and the link thickness indicates the strength of connections between two nodes. Furthermore, node proximity is an indication of closer relationships. More details about these analyses and their scientific meanings can be found in the work of Van Eck and Waltman [15].
CiteSpace was used to complement the VOSviewer outputs and explore intellectual transitions over time. The application allows detecting major thematic focus areas during different time spans. In addition, it provides timeline visualization for different thematic clusters that includes information on various temporal patterns related to major publications that have shaped the knowledge structure, and the shifting thematic focus over time [13,16].
3. Results
Before reporting the results, it is worth noting that resilience is a multi-faceted concept and there is still no universal definition for it. There are, however, three commonly used approaches toward defining resilience: engineering, ecological, and adaptive. Engineering resilience is more focused on physical characteristics such as robustness that enable preventing shocks. Ecological resilience emphasizes characteristics such as flexibility and the capacity of the system to absorb shocks and return to an equilibrium state (or states) in a timely manner. Finally, adaptive resilience underscores the capacity to live with risk and learn from the adverse event to not only bounce back, but also bounce forward to a more advanced state that facilitates better absorption, response, and recovery capacities [5]. Overall, urban resilience literature often adopts one or a combination of these approaches to enhance the ability to plan and prepare for, absorb, recover from, and adapt to adverse events [5,17,18]. Here, to avoid confusion, relationship between resilience and sustainability should also be briefly mentioned. These are indeed distinct concepts. Resilience is a characteristic of the system that entails the ability to deal with shocks. It can, however, contribute to alignment with sustainability pathways by, among other things, enabling maintenance of equilibrium states.
3.1. Publication Trends
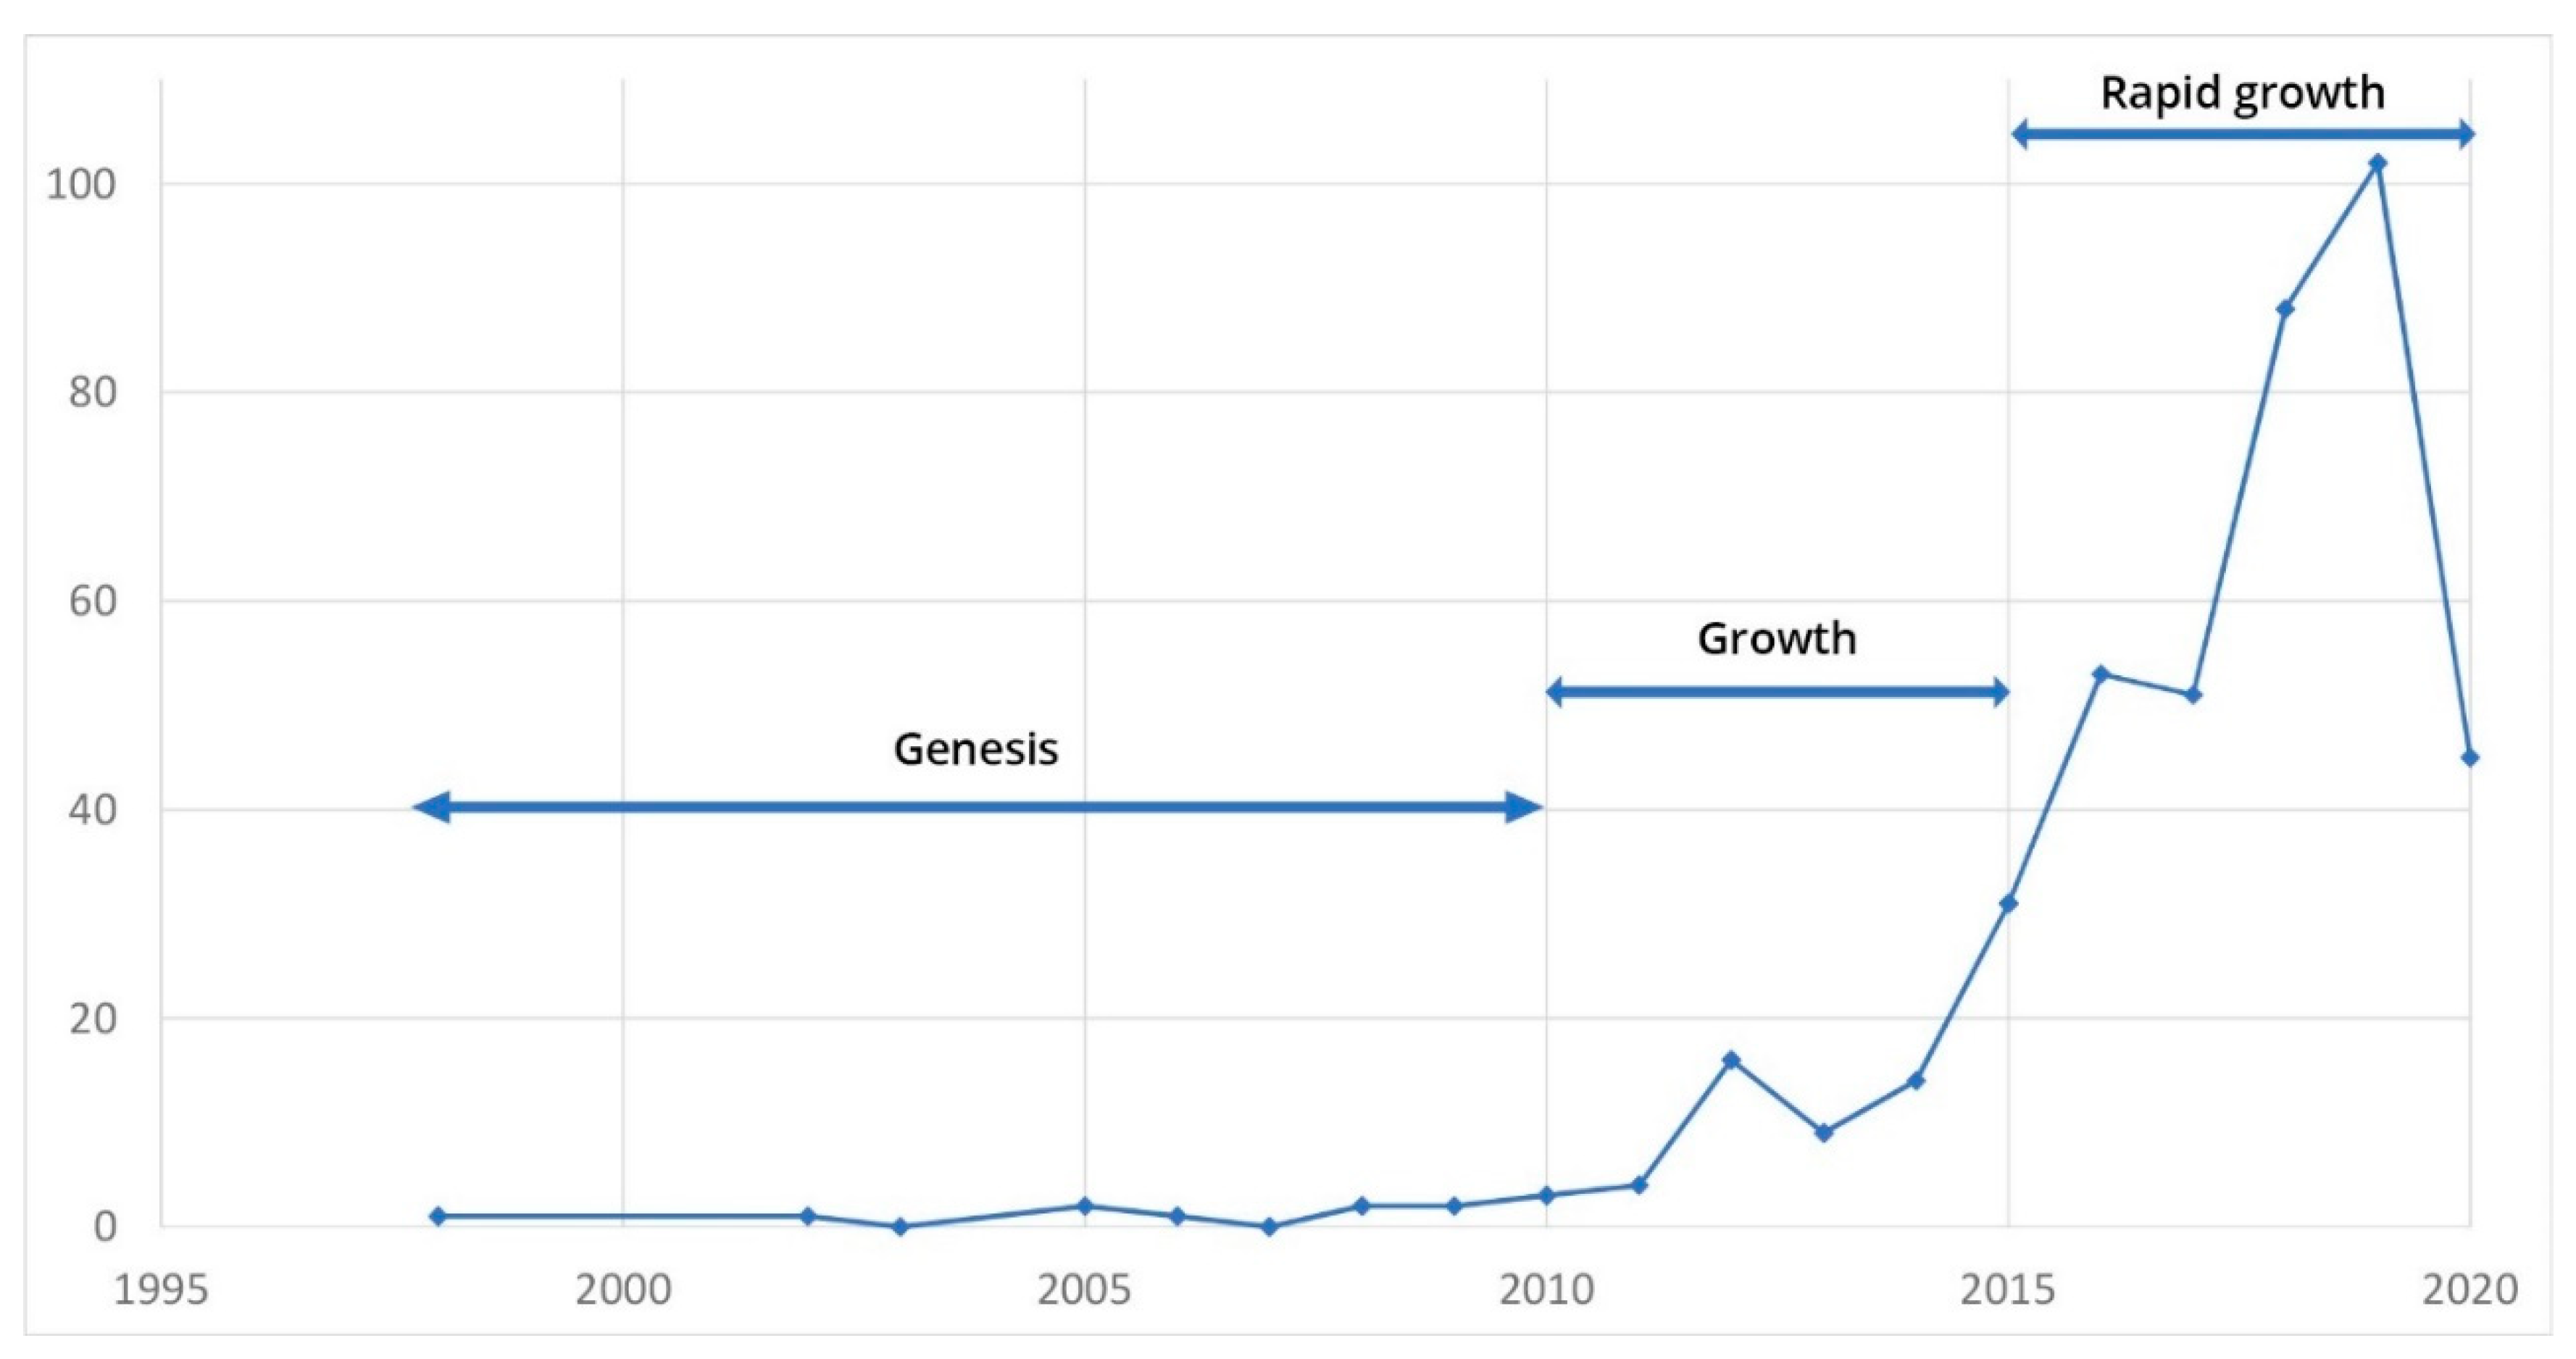
The first paper on this topic was published in 1998. As Figure 1 shows, the study period (1998–2020) can be divided into three sub-periods in terms of the growth speed of publication trends. Until 2010 (the Genesis period), only nine papers were published. However, an initial growth can be observed during the second sub-period (the growth period), when the number of publications increased by a factor of about 5.1. Finally, the number of papers published over the past five years (the rapid growth period) has increased drastically, by a factor of about eight compared to the previous sub-period. This rapid rate of growth could be explained by the increasing recognition of the significance of urban resilience in international and local policy frameworks released since 2015. In fact, frequent references to the need for fostering resilience have been made in related UN agreements and policy frameworks such as the Paris Agreement [19], the United Nations Sustainable Development Goals (particularly, SDG 11 and SDG 13), the Sendai Framework for Disaster Risk Reduction [20], and the New Urban Agenda [21].
3.2. Major Contributing Countries and Institutions
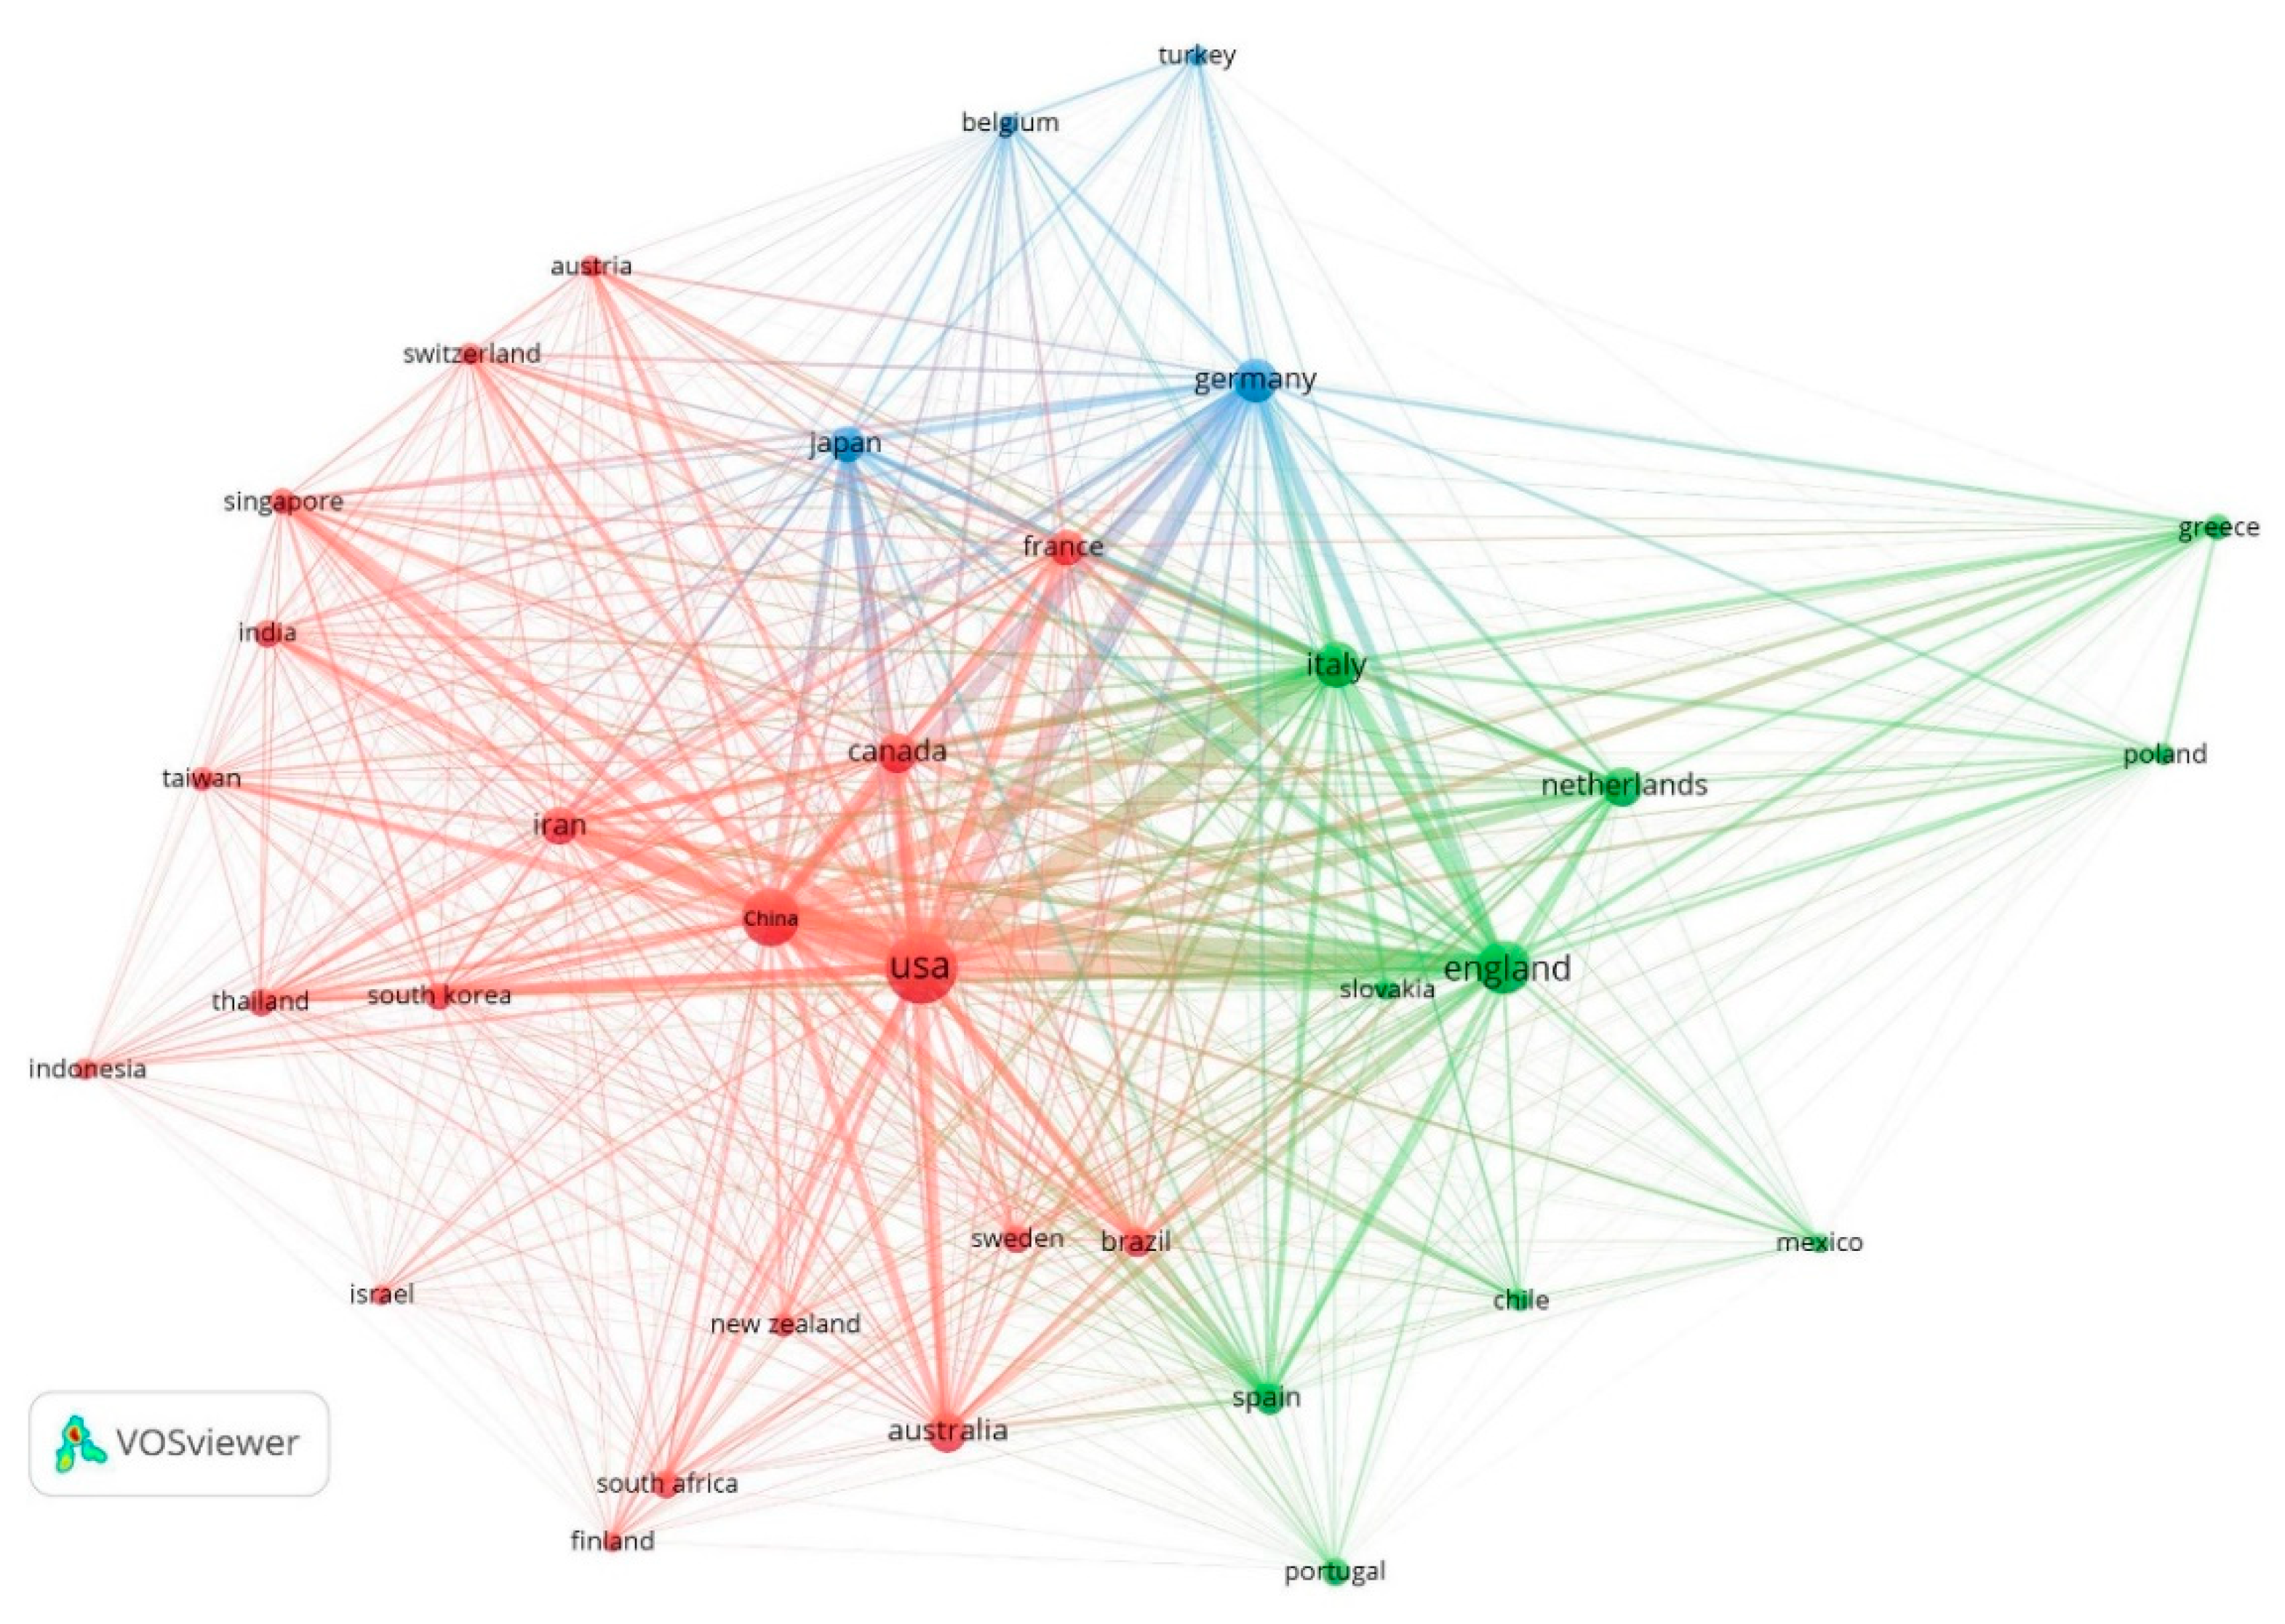
According to the WoS database, authors from 70 countries have contributed to the 420 papers in the review database. The results of the bibliographic coupling analysis conducted in VOSviewer, for a minimum number of four documents per country, shows that, in terms of the number of publications, US (~27%), China (~15%), and England (~12%) are the primary contributors (see Table 1). Note that the minimum number in this case and other VOSviewer analyses should be determined in a trial-and-error manner so that reasonable results can be achieved. In this case, smaller numbers will return a larger number of countries that is not desirable for presentation purpose and does not add important information on major countries. More information about the influential countries and their cooperative networks can be obtained from Figure 2. Here, node size is proportional to the number of publications and link thickness indicates the strength of connections between the countries. The node size and central position of countries such as the US, China, England, Italy, Germany, and Canada indicate that they have made relatively more contribution to the field and are more involved in collaborative research. The closest research collaboration is among the US, China, and Canada. A noteworthy finding is that urban resilience assessment literature mainly comes from countries in the Global North. Given their lower adaptive capacity, cities in the Global South are expected to be disproportionately impacted by disasters [22]. Accordingly, more research in Global South cities is needed.
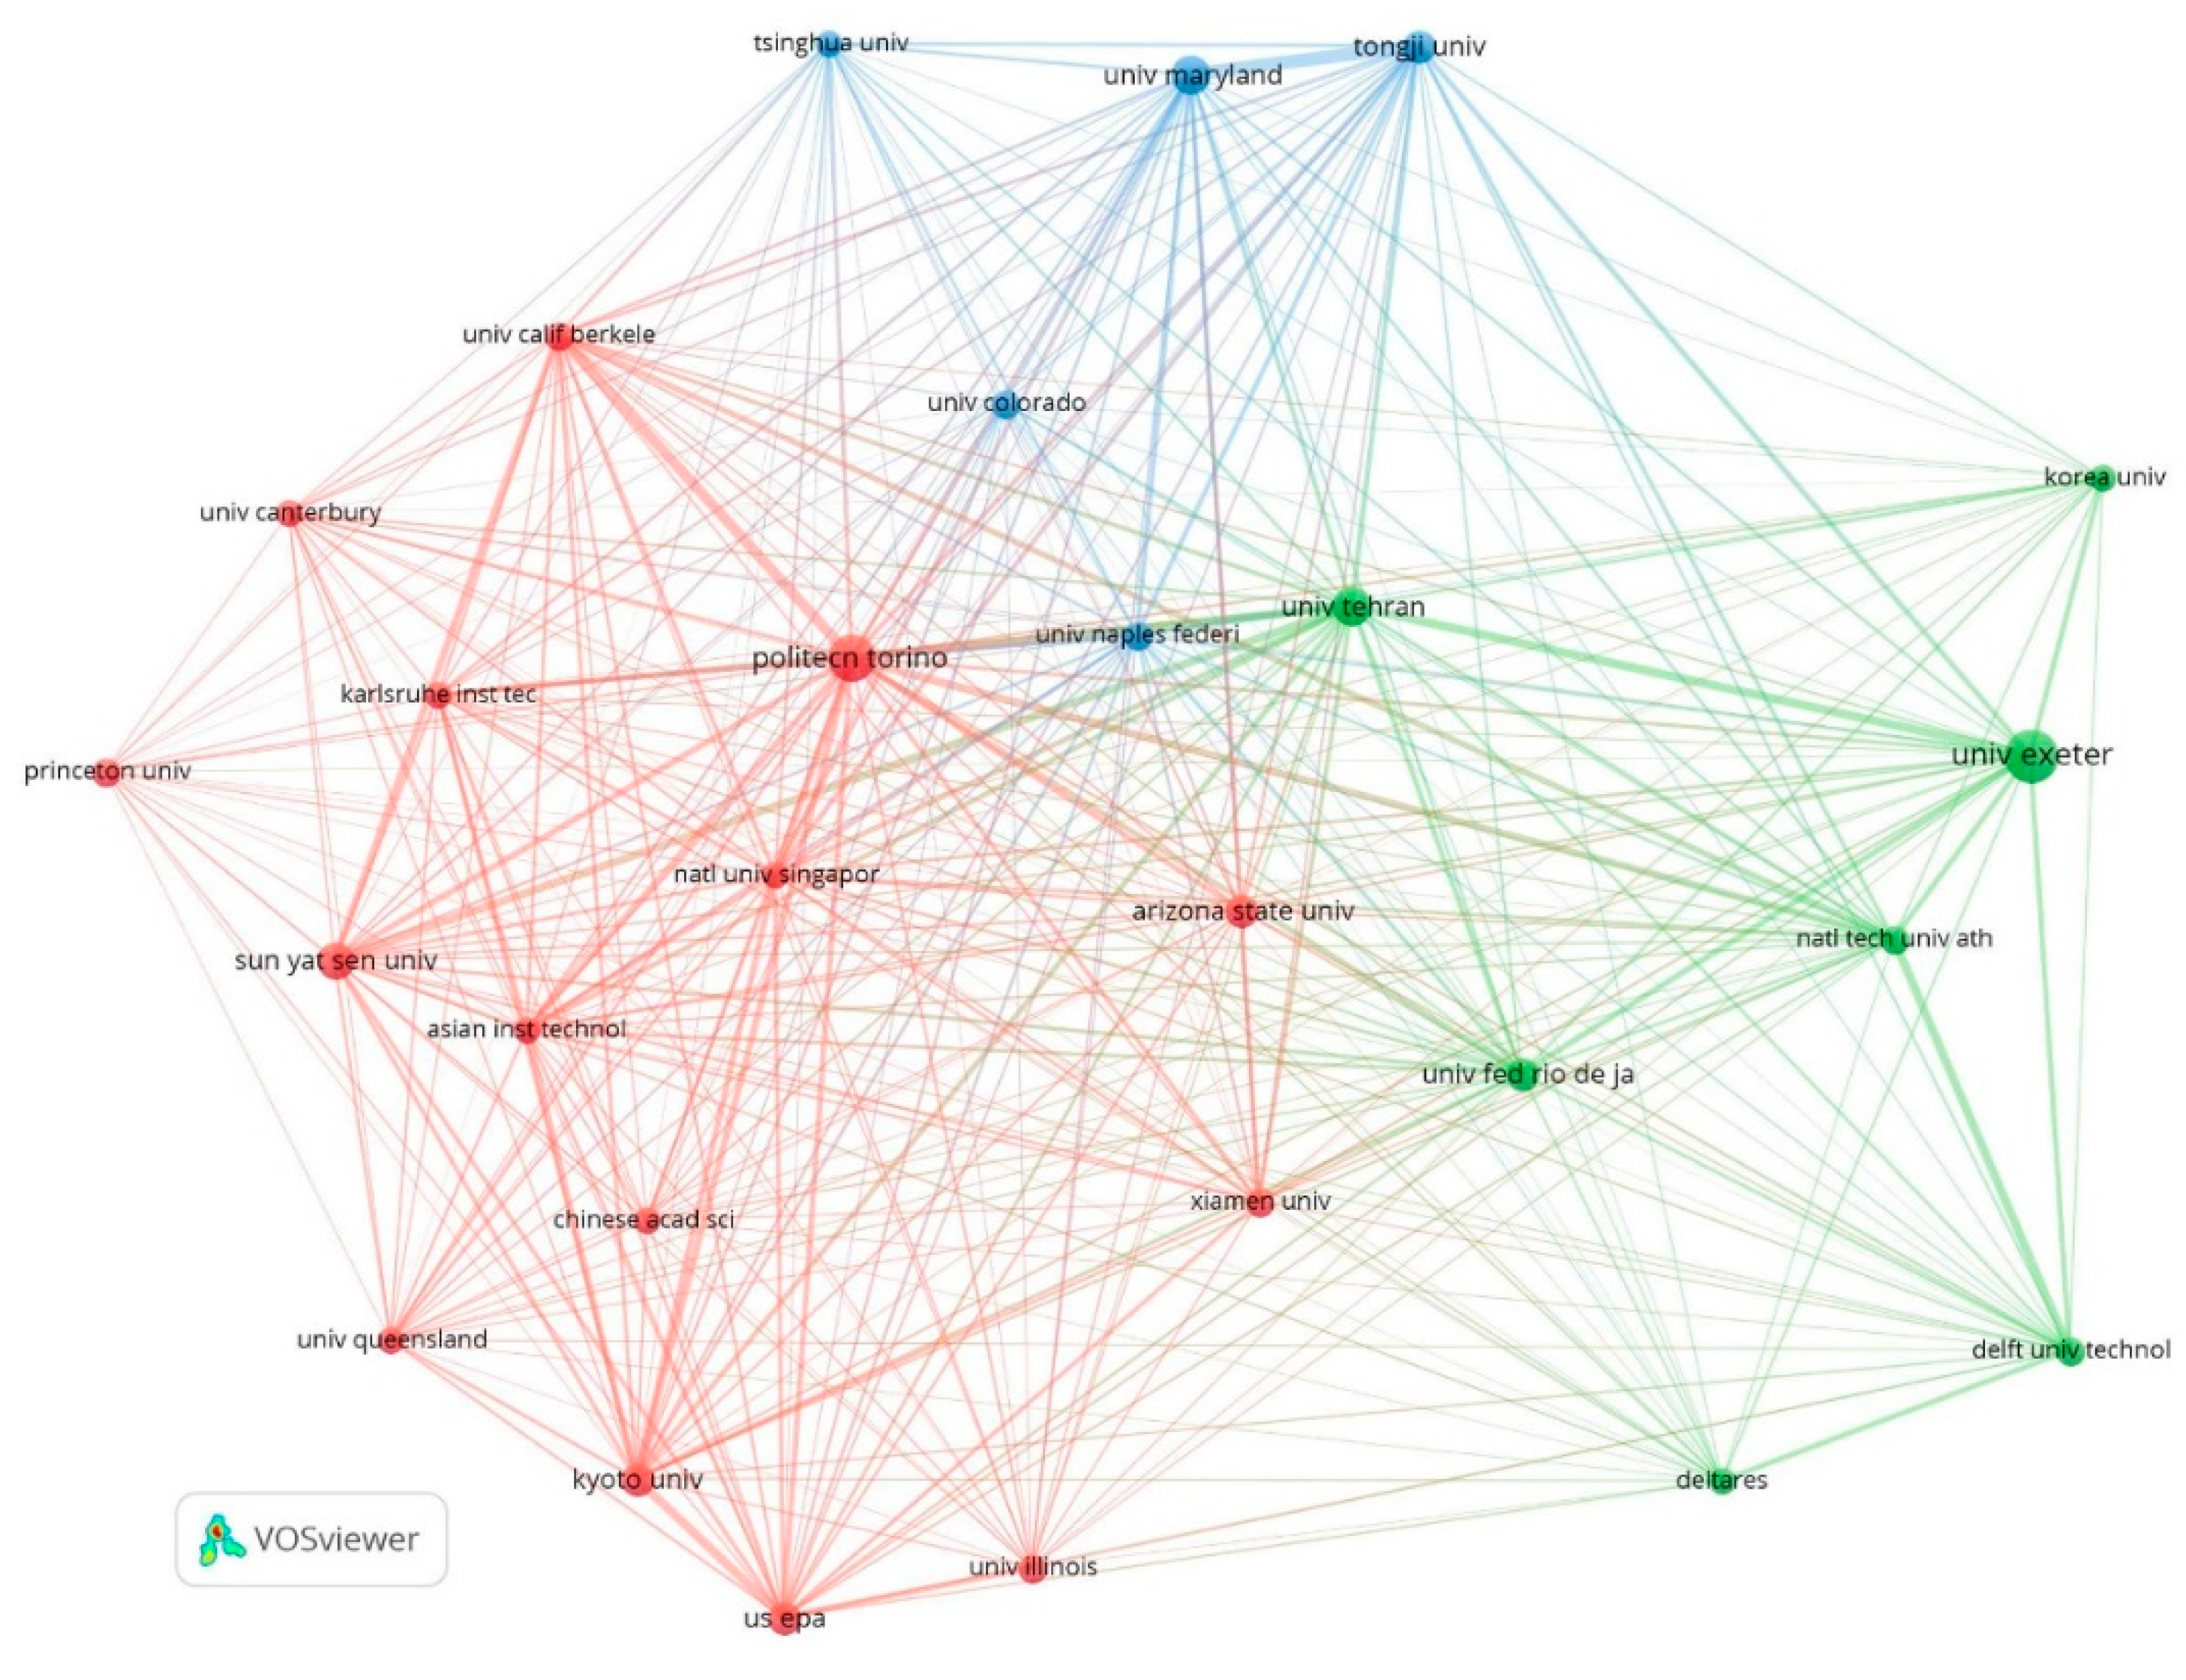
Regarding the contributing institutions, the results show that existing research has been generated by 635 institutions, with American and Chinese institutes being dominant. In terms of the number of publications, University of Exeter (England), Politecnico di Torino (Italy), and University of Maryland (US) have contributed the most, with 13, 11, and 8 documents, respectively (see Table S1). Figure 3 shows that Politecnico di Torino, Arizona State University, and University of Tehran have central positions, indicating that they are more involved in collaborative research.
3.3. Thematic Focus Areas and Their Transition
3.3.1. Thematic Clusters
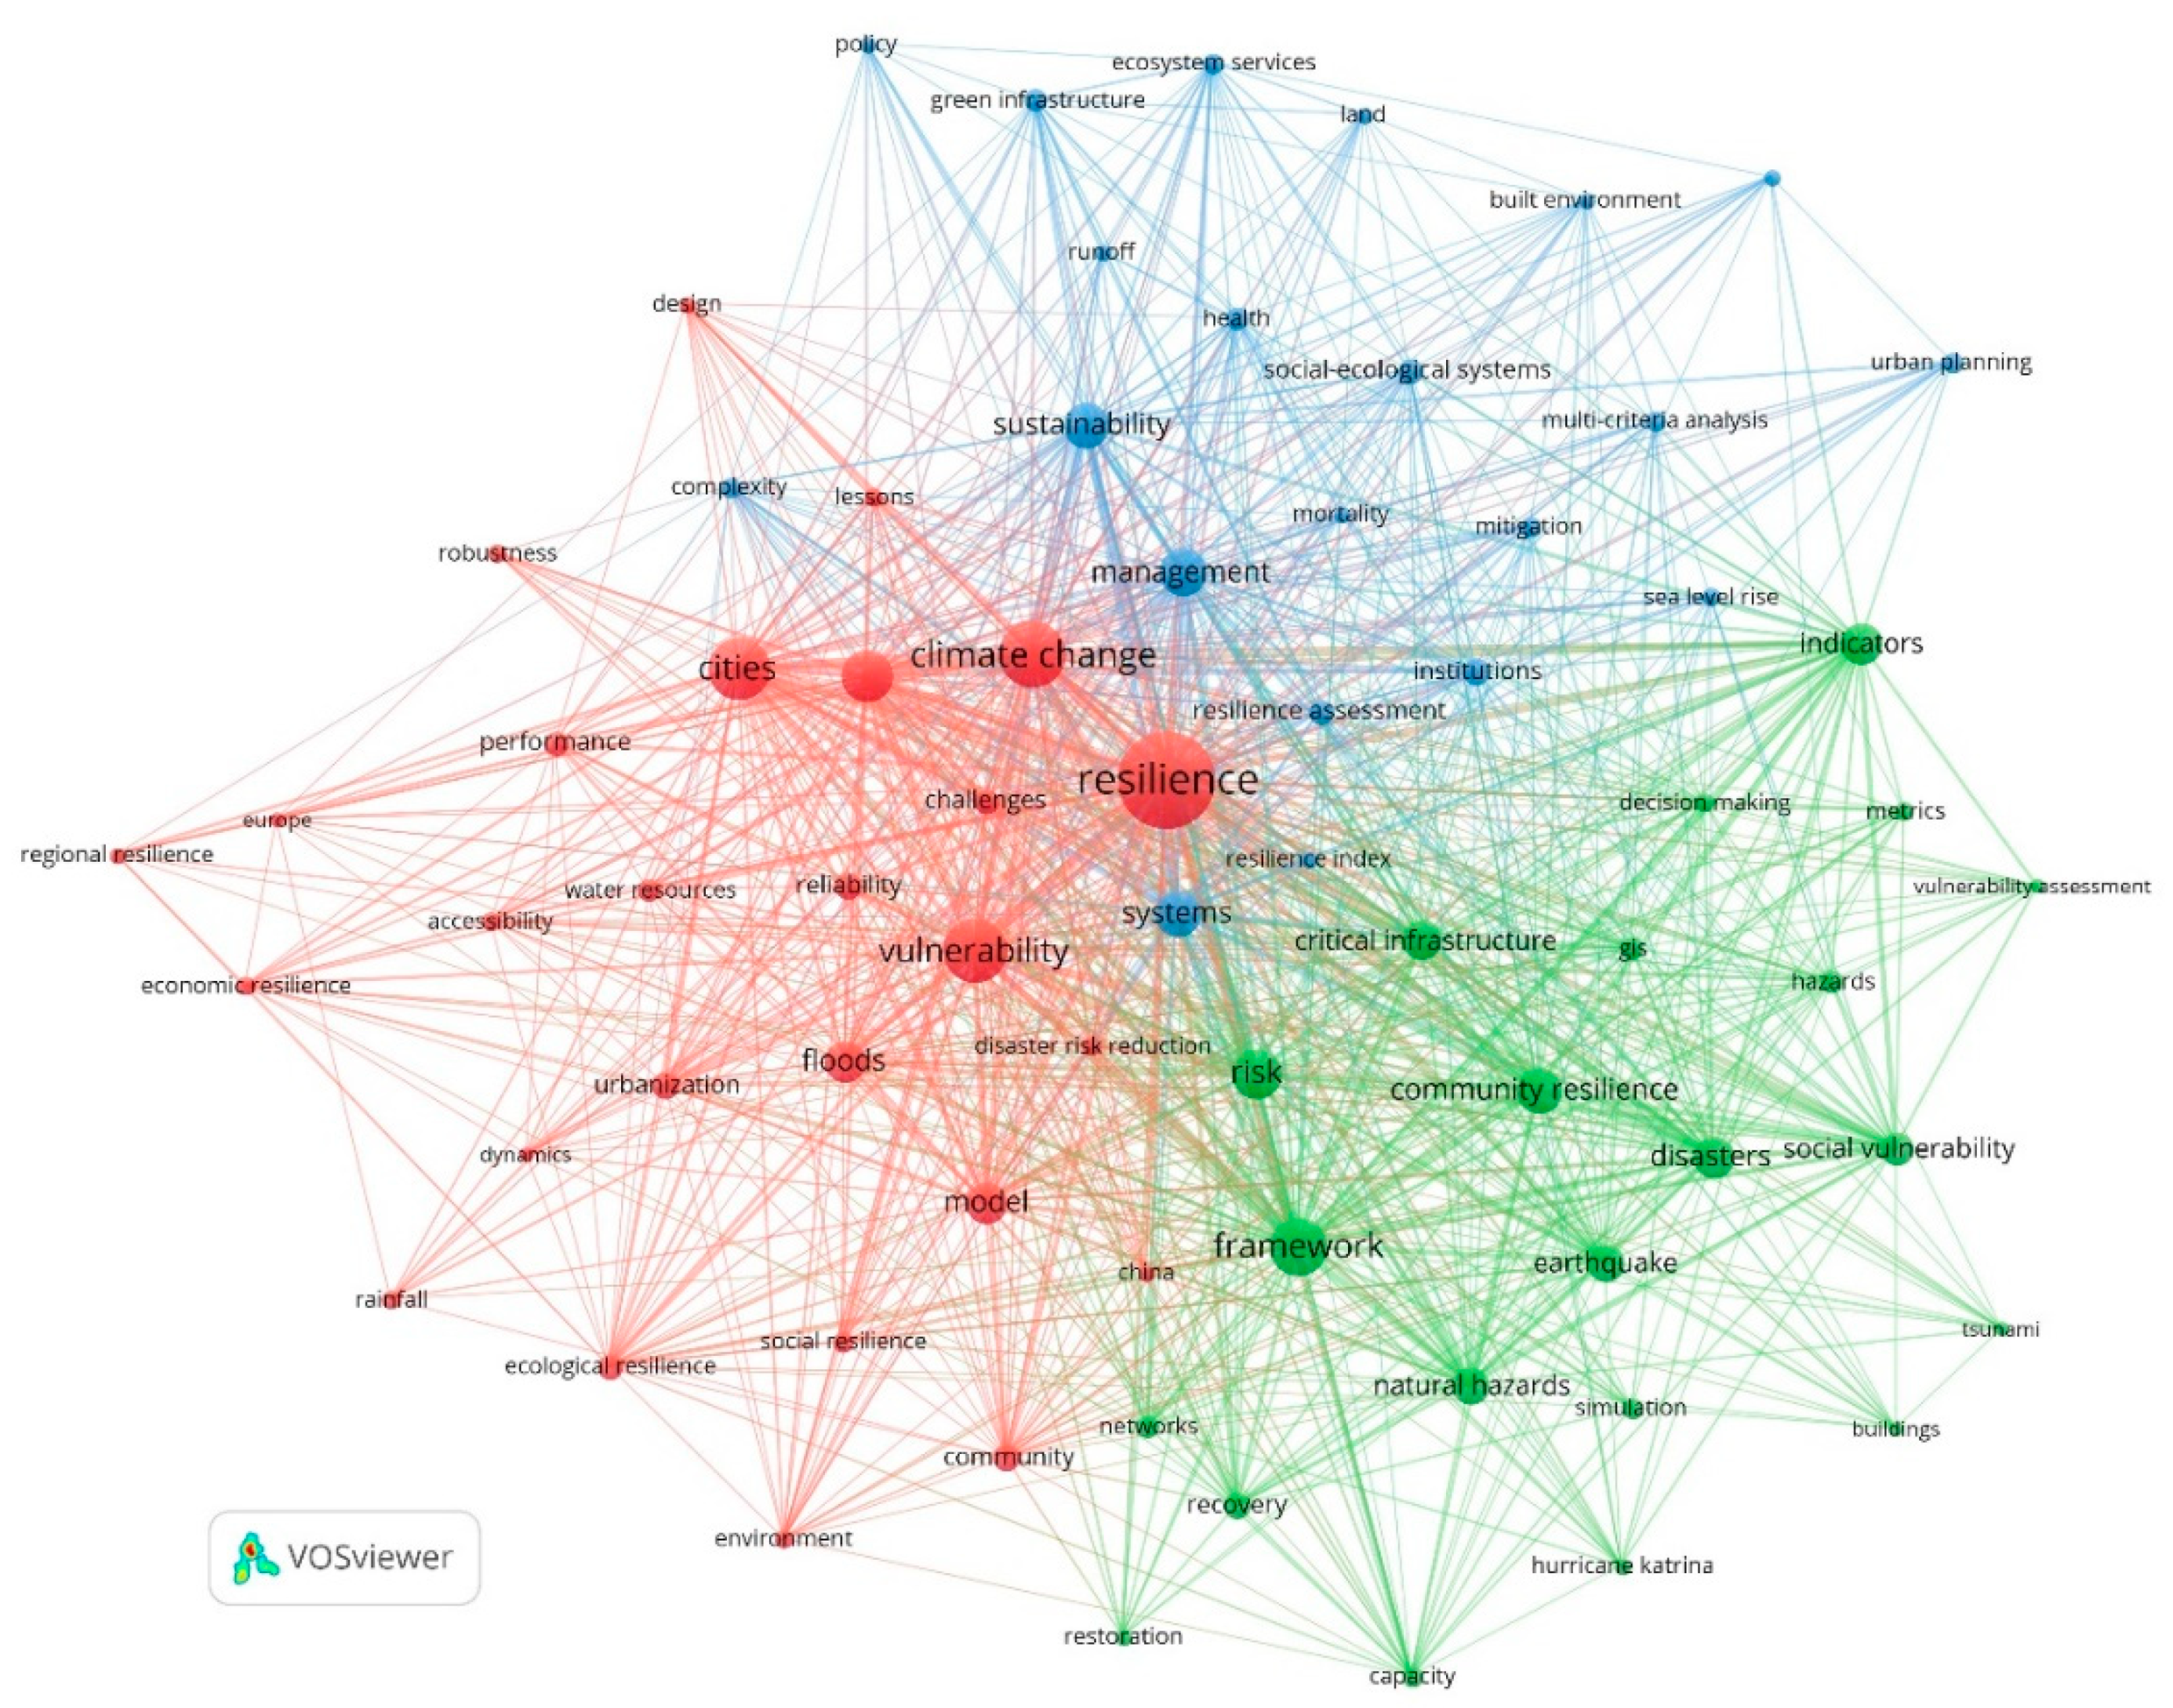
The term co-occurrence analysis of the VOSviewer application was used to identify major thematic clusters. Setting the minimum number of keyword occurrence to 6, the result presented in Figure 4 was obtained. Here node size is proportional to the term frequency and link thickness indicates link strength. Detailed quantitative information of the top-30 highly occurred terms is available in Table S2. The terms most frequently used are resilience, climate change, vulnerability, cities, framework, adaptation, risk, management, sustainability, and community resilience. This is a clear indication of the dominance of research on urban climate change resilience assessment. In fact, many papers have been published on assessing resilience to climatic impacts over the past decade (e.g., [23,24,25]).
Considering the density of term co-occurrence, three major clusters can be identified that are shown using different colors in Figure 4. Terms that have co-occurred more frequently are closer to each other, resulting in higher density. The density visualization map (Figure S1) shows that the red cluster has the highest density, followed by the green cluster. The red cluster includes 27 terms mainly related to urban resilience to climate change impacts. Given the presence of terms such as floods, rainfall, and water, it is clear that many studies have been published on water-related risks and vulnerabilities [26,27,28]. Other important climate-related risks such as heat stress [29] and energy-related shocks are under-studied [5].
The cluster in green includes 22 terms and has two major thematic focus areas. One is focused on resilience of communities and critical infrastructure systems to natural disasters such as earthquakes/tsunamis [30] and hurricanes [31]. In fact, many papers related to resilience of infrastructure systems have been published over the past two decades [32,33]. The other is concentrated on indicators, metrics, and assessment frameworks that can be used to inform decision making toward community disaster resilience [34,35]. The term “recovery” appears in this cluster, indicating that more attention has been paid to assessing the recovery process [36,37]. While the literature argues that resilience capacities should also be evaluated during other stages such as planning and absorption [18], these terms have not occurred frequently. This may indicate that they have received comparatively limited attention.
Finally, the third cluster includes 21 terms that are weakly connected, as shown in the density map (Figure S1). This indicates that terms in this cluster are comparatively less popular in the literature and also the cluster is fragmented. Despite this, two major themes can be detected. One is focused on institutional and management aspects of urban resilience [38], and the other is related to planning and design-related measures such as land use planning and green infrastructure development [39]. These are important themes that need more attention and should be better connected through more integrated approaches.
In addition to these cluster classifications, some important overarching issues related to the methodological approaches and the coverage of different resilience dimensions can be observed from this analysis. Commonly used methods are modeling [40], spatial analysis [41], and multi-criteria analysis [42,43] that have mainly been used in the context of the first two dominant clusters (i.e., red and green). As for dimensional coverage, society and well-being, economy, environment/ecology, infrastructure, and governance/institutions are major dimensions mentioned in the literature [44]. This term co-occurrence analysis shows that current focus is mainly on the latter three dimensions, and social and economic dimensions of resilience have received relatively less attention.
3.3.2. Thematic Focus Transition over Time
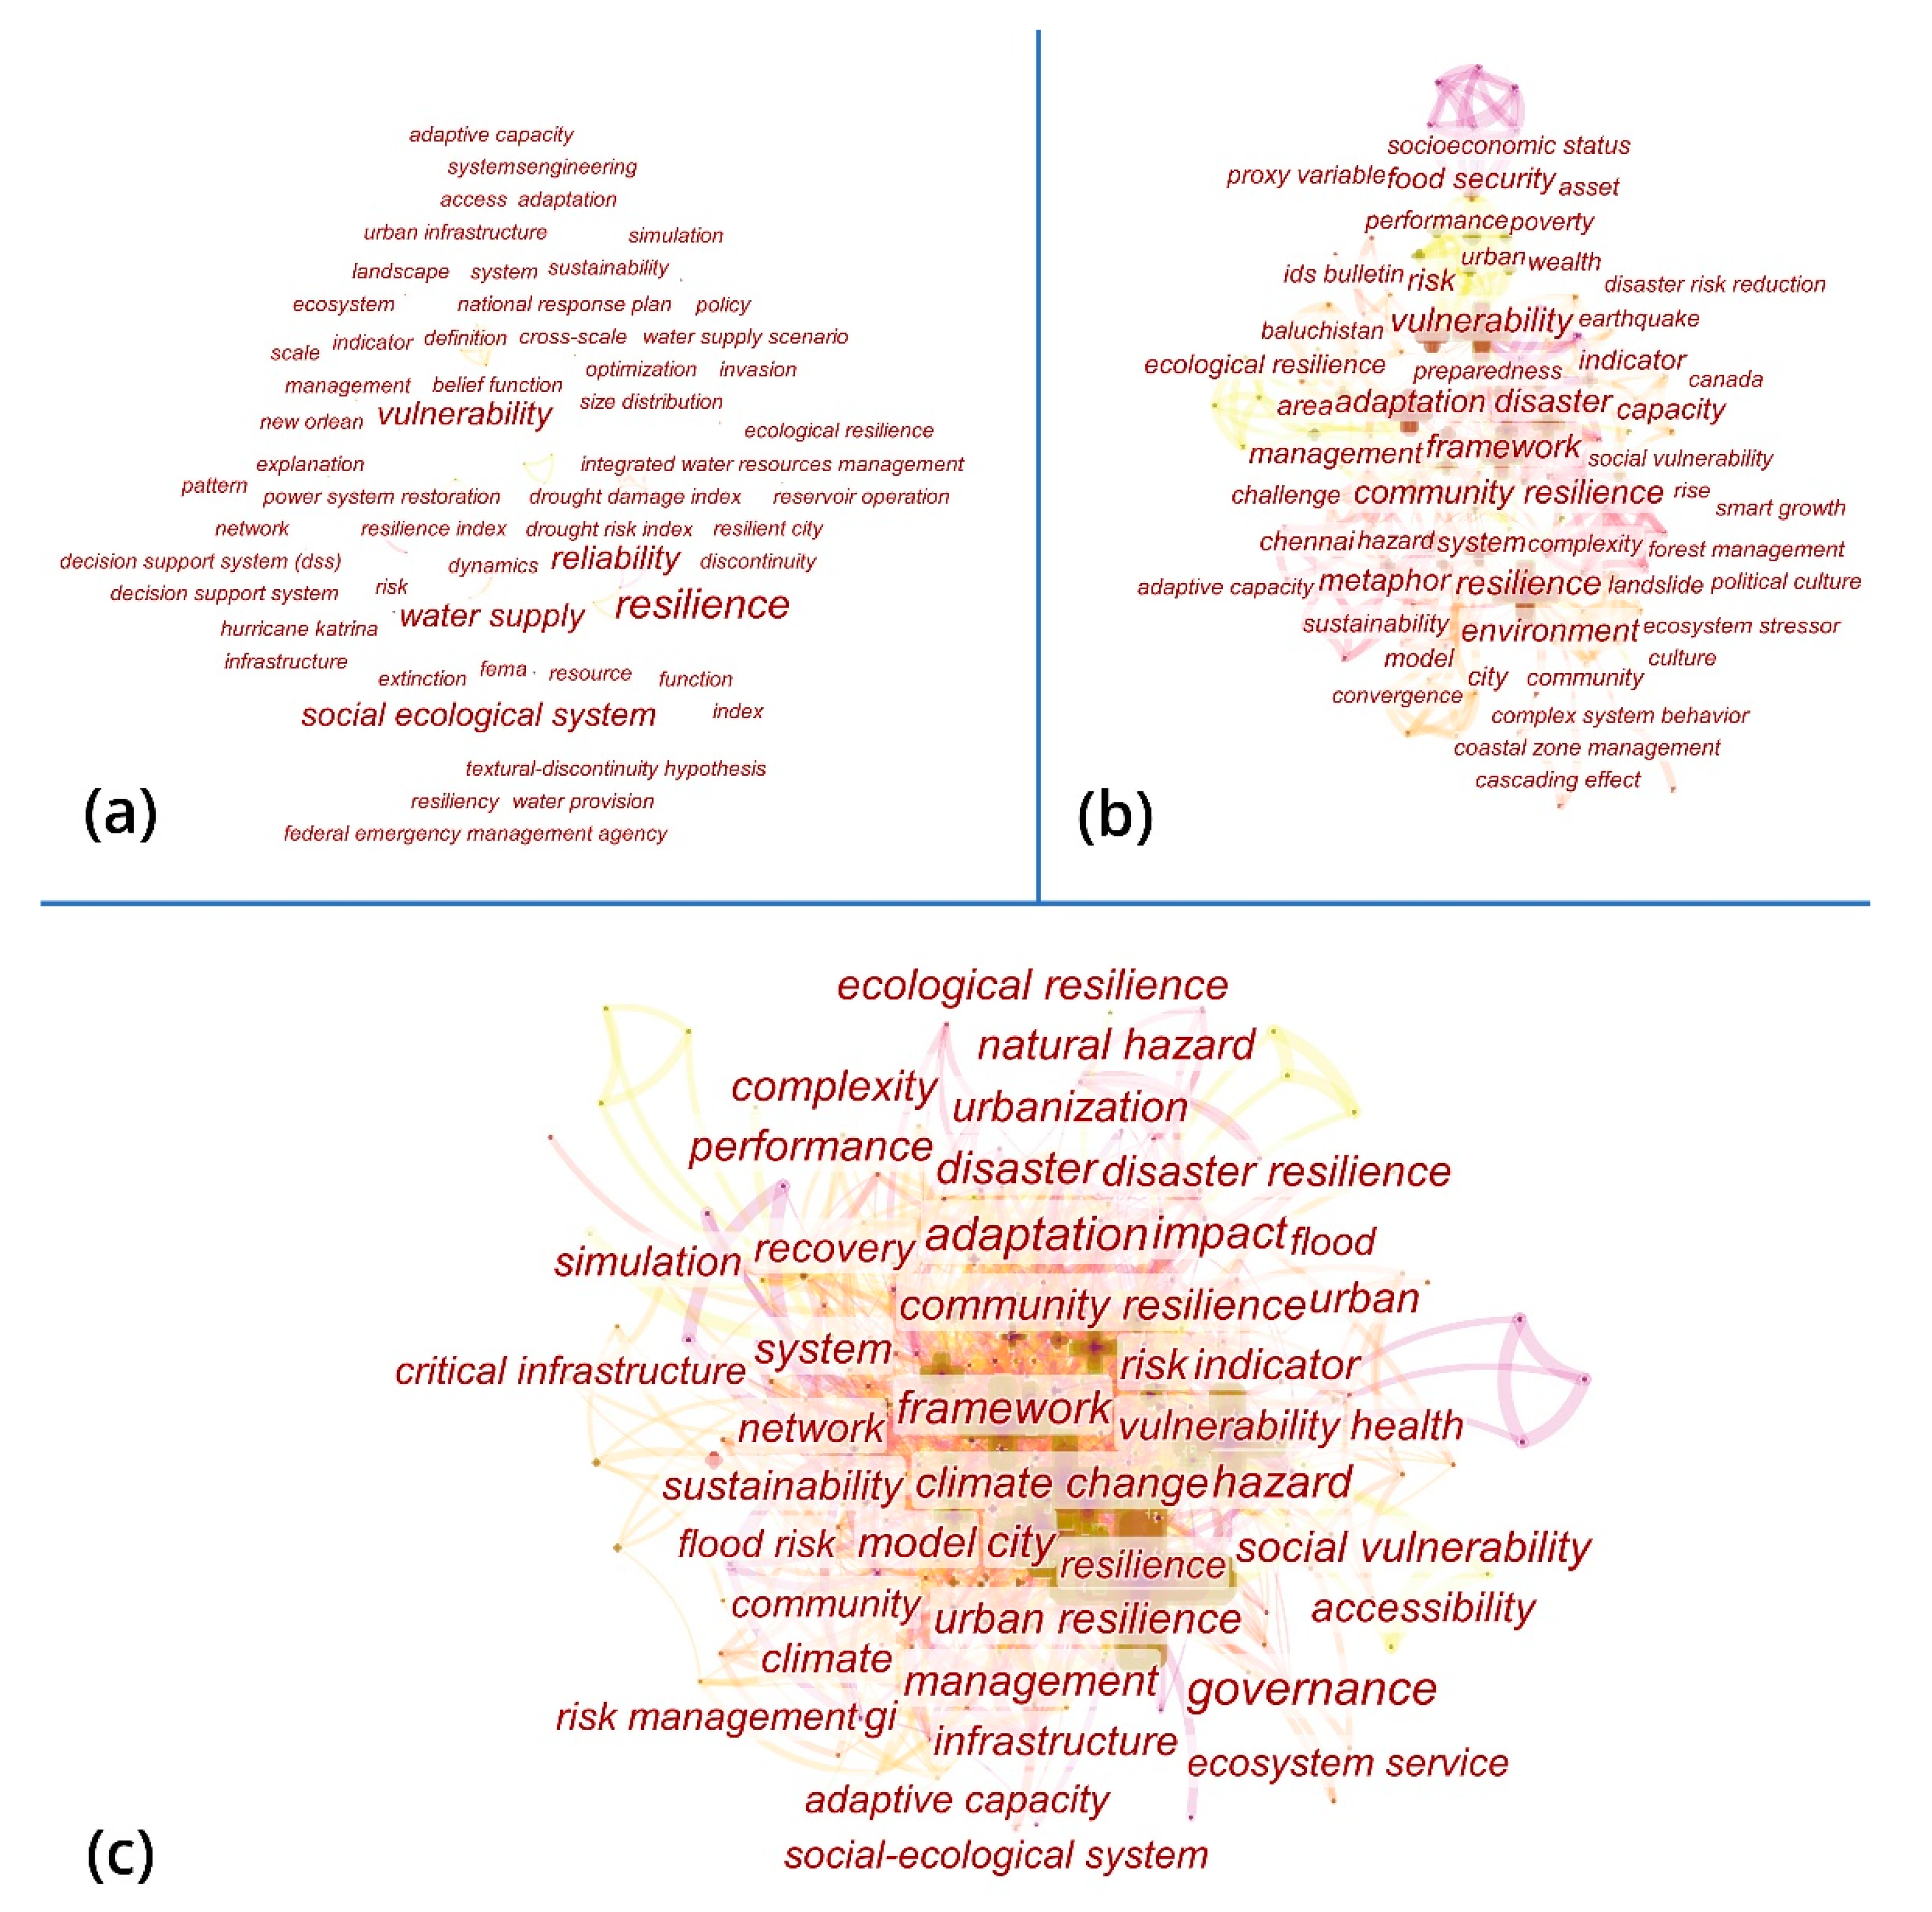
One way to examine how the thematic focus of a field of research has changed over time is to identify frequently occurred keywords during different periods. In other words, research hotspots in each period can be determined based on keyword frequency [12]. In CiteSpace, it is possible to explore frequency and co-occurrence of keywords during different time slices. For the three time periods introduced in Figure 1, the results presented in Figure 5 and Figure S2 were obtained. Supporting quantitative details for these three periods are presented in Tables S3–S5. The results show that from 1998 to 2009 few keywords existed that were loosely connected and not frequently used. Resilience, water supply, reliability, social ecological system, and vulnerability are the main terms that have not occurred more than three times. In identifying major research hotspots using keyword co-occurrence networks, Chen, Dubin, and Kim [13] suggested that other measures such as betweenness centrality and citation burst can also be considered. A node with higher betweenness centrality has a more important position in the network as it belongs to and connects different terms/clusters. In addition, citation burst indicates a surge of citation of a certain document that includes certain keywords, during a specific time period. Citation burst can, therefore, be indicative of research hotspots during specific periods. During the first period, the centrality value of all keywords (except “reliability”) is zero, indicating that the intellectual base of “urban resilience assessment”, as an emerging field, was still fragmented. In addition, no citation bursts were found, indicating the lack of research hotspots between 1998 and 2009.
With more research being published during the growth period (2010–2014), the intellectual base also expanded and terms with high centrality values emerged. As Figure 5b shows, the keywords were no longer isolated and term co-occurrence clusters emerged. Frequent and highly central keywords during this period are resilience, vulnerability, adaptation, framework, disaster, system, risk, and community resilience. Compared to the previous period, there is more emphasis on adaptation, indicating a paradigm shift from approaches based on robustness and reliability toward more adaptation-oriented approaches [45]. While earlier focus was mainly on characteristics such as robustness and stability, this paradigm shift reflects the better recognition of other characteristics such as diversity, modularity, self-organization, connectivity, and adaptive capacity [5,45]. Additionally, high frequency and centrality of keywords related to assessment (e.g., indicators and framework) in this period show that research on indicator-based frameworks has become more mature. In fact, several major studies providing information on development and implementation of such frameworks were published during this period [35,36]. Again, no citation bursts were observed, meaning that no specific topics have dominated the field.
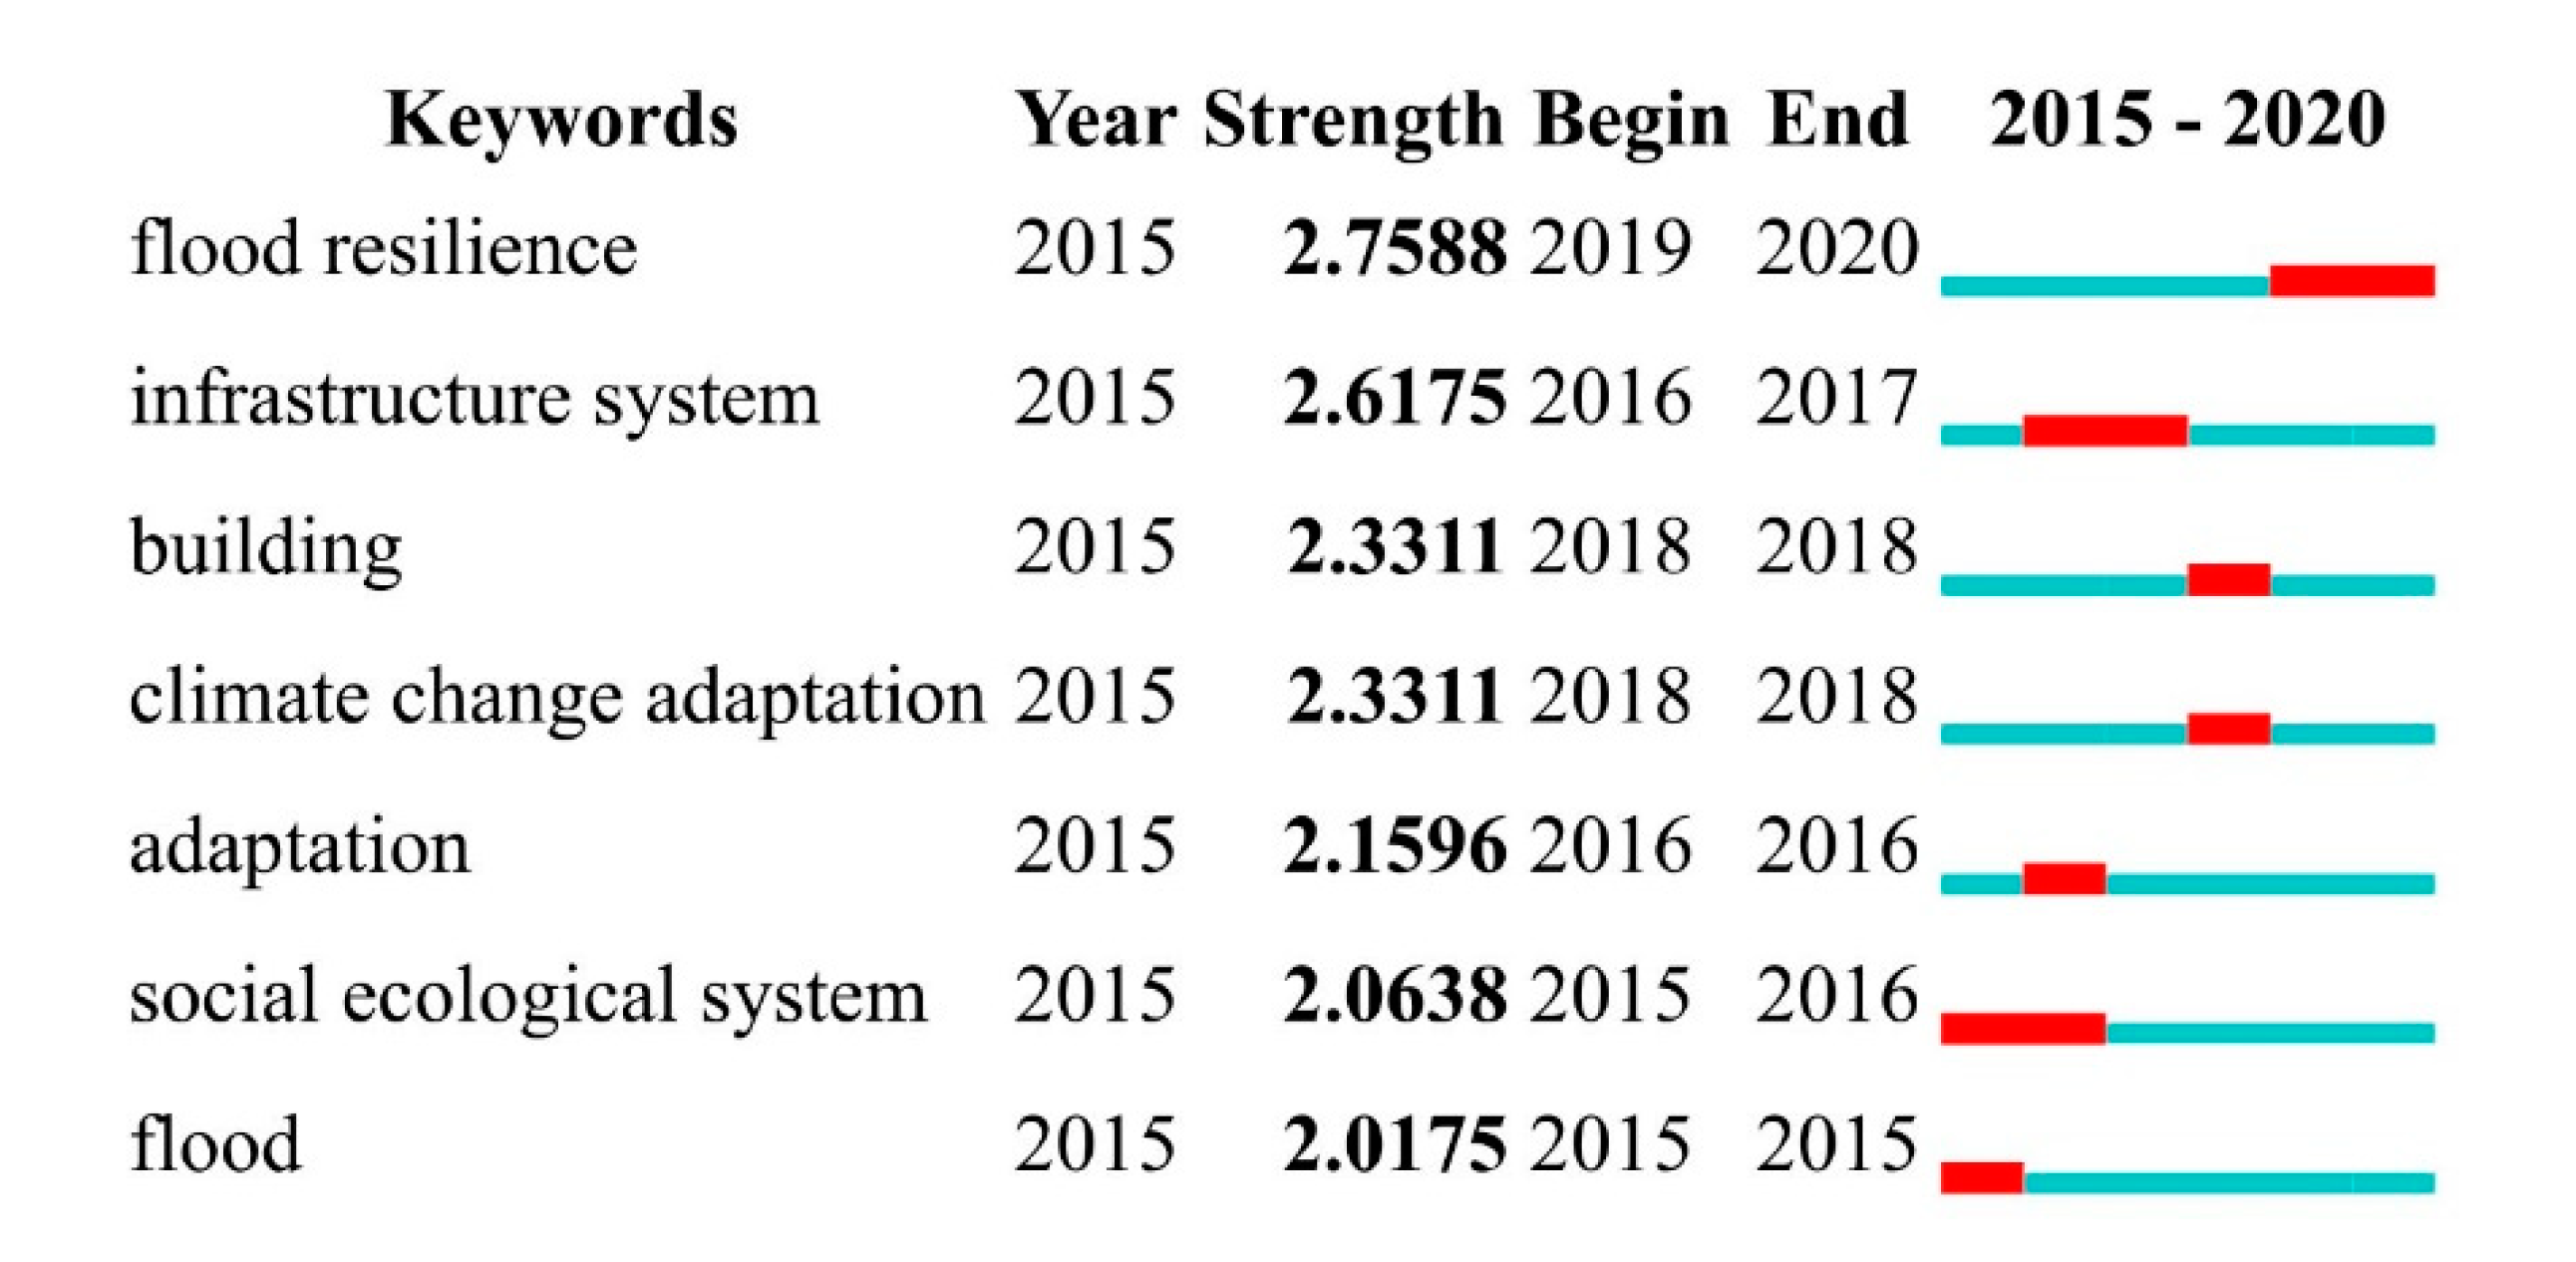
Analyzing results of the last period (rapid growth: 2015–2020) shows that the intellectual base of the field further expanded and consolidated around the major keywords mentioned for the previous period (Figure 5c). A major change is the emergence of keywords related to climate change and governance, as new highly central themes. In addition, for the first time, keywords with citation bursts were observed (Figure 6). Some of these are directly related to climate change (for example, “climate change adaptation” and “flood resilience”), confirming that urban resilience assessment has paid significant attention to this issue over the past five years [26,46,47]. Keywords related to flood resilience have the strongest burst, confirming the findings of the term co-occurrence analysis regarding the relatively high attention to resilience against water related risks [26,46,47]. Other keywords with high citation burst values are related to climate change adaptation and resilience of infrastructure systems [48,49]. Considering the projections about further increases in the frequency and intensity of climate-induced disasters, these keywords are likely to maintain their frontier position during the coming years. Another interesting output of the CiteSpace application is the “timeline view” that allows gaining information about the emergence date of different keywords and their interconnections (Figure S2). In the timeline view, node size is proportional to the term frequency and lines indicate the term co-occurrence. This output shows how, over time, the intellectual base of the field has expanded by linking terms such as resilience and vulnerability with a wide range of terms associated with different climatic and non-climatic stressors.
3.4. Influential Sources
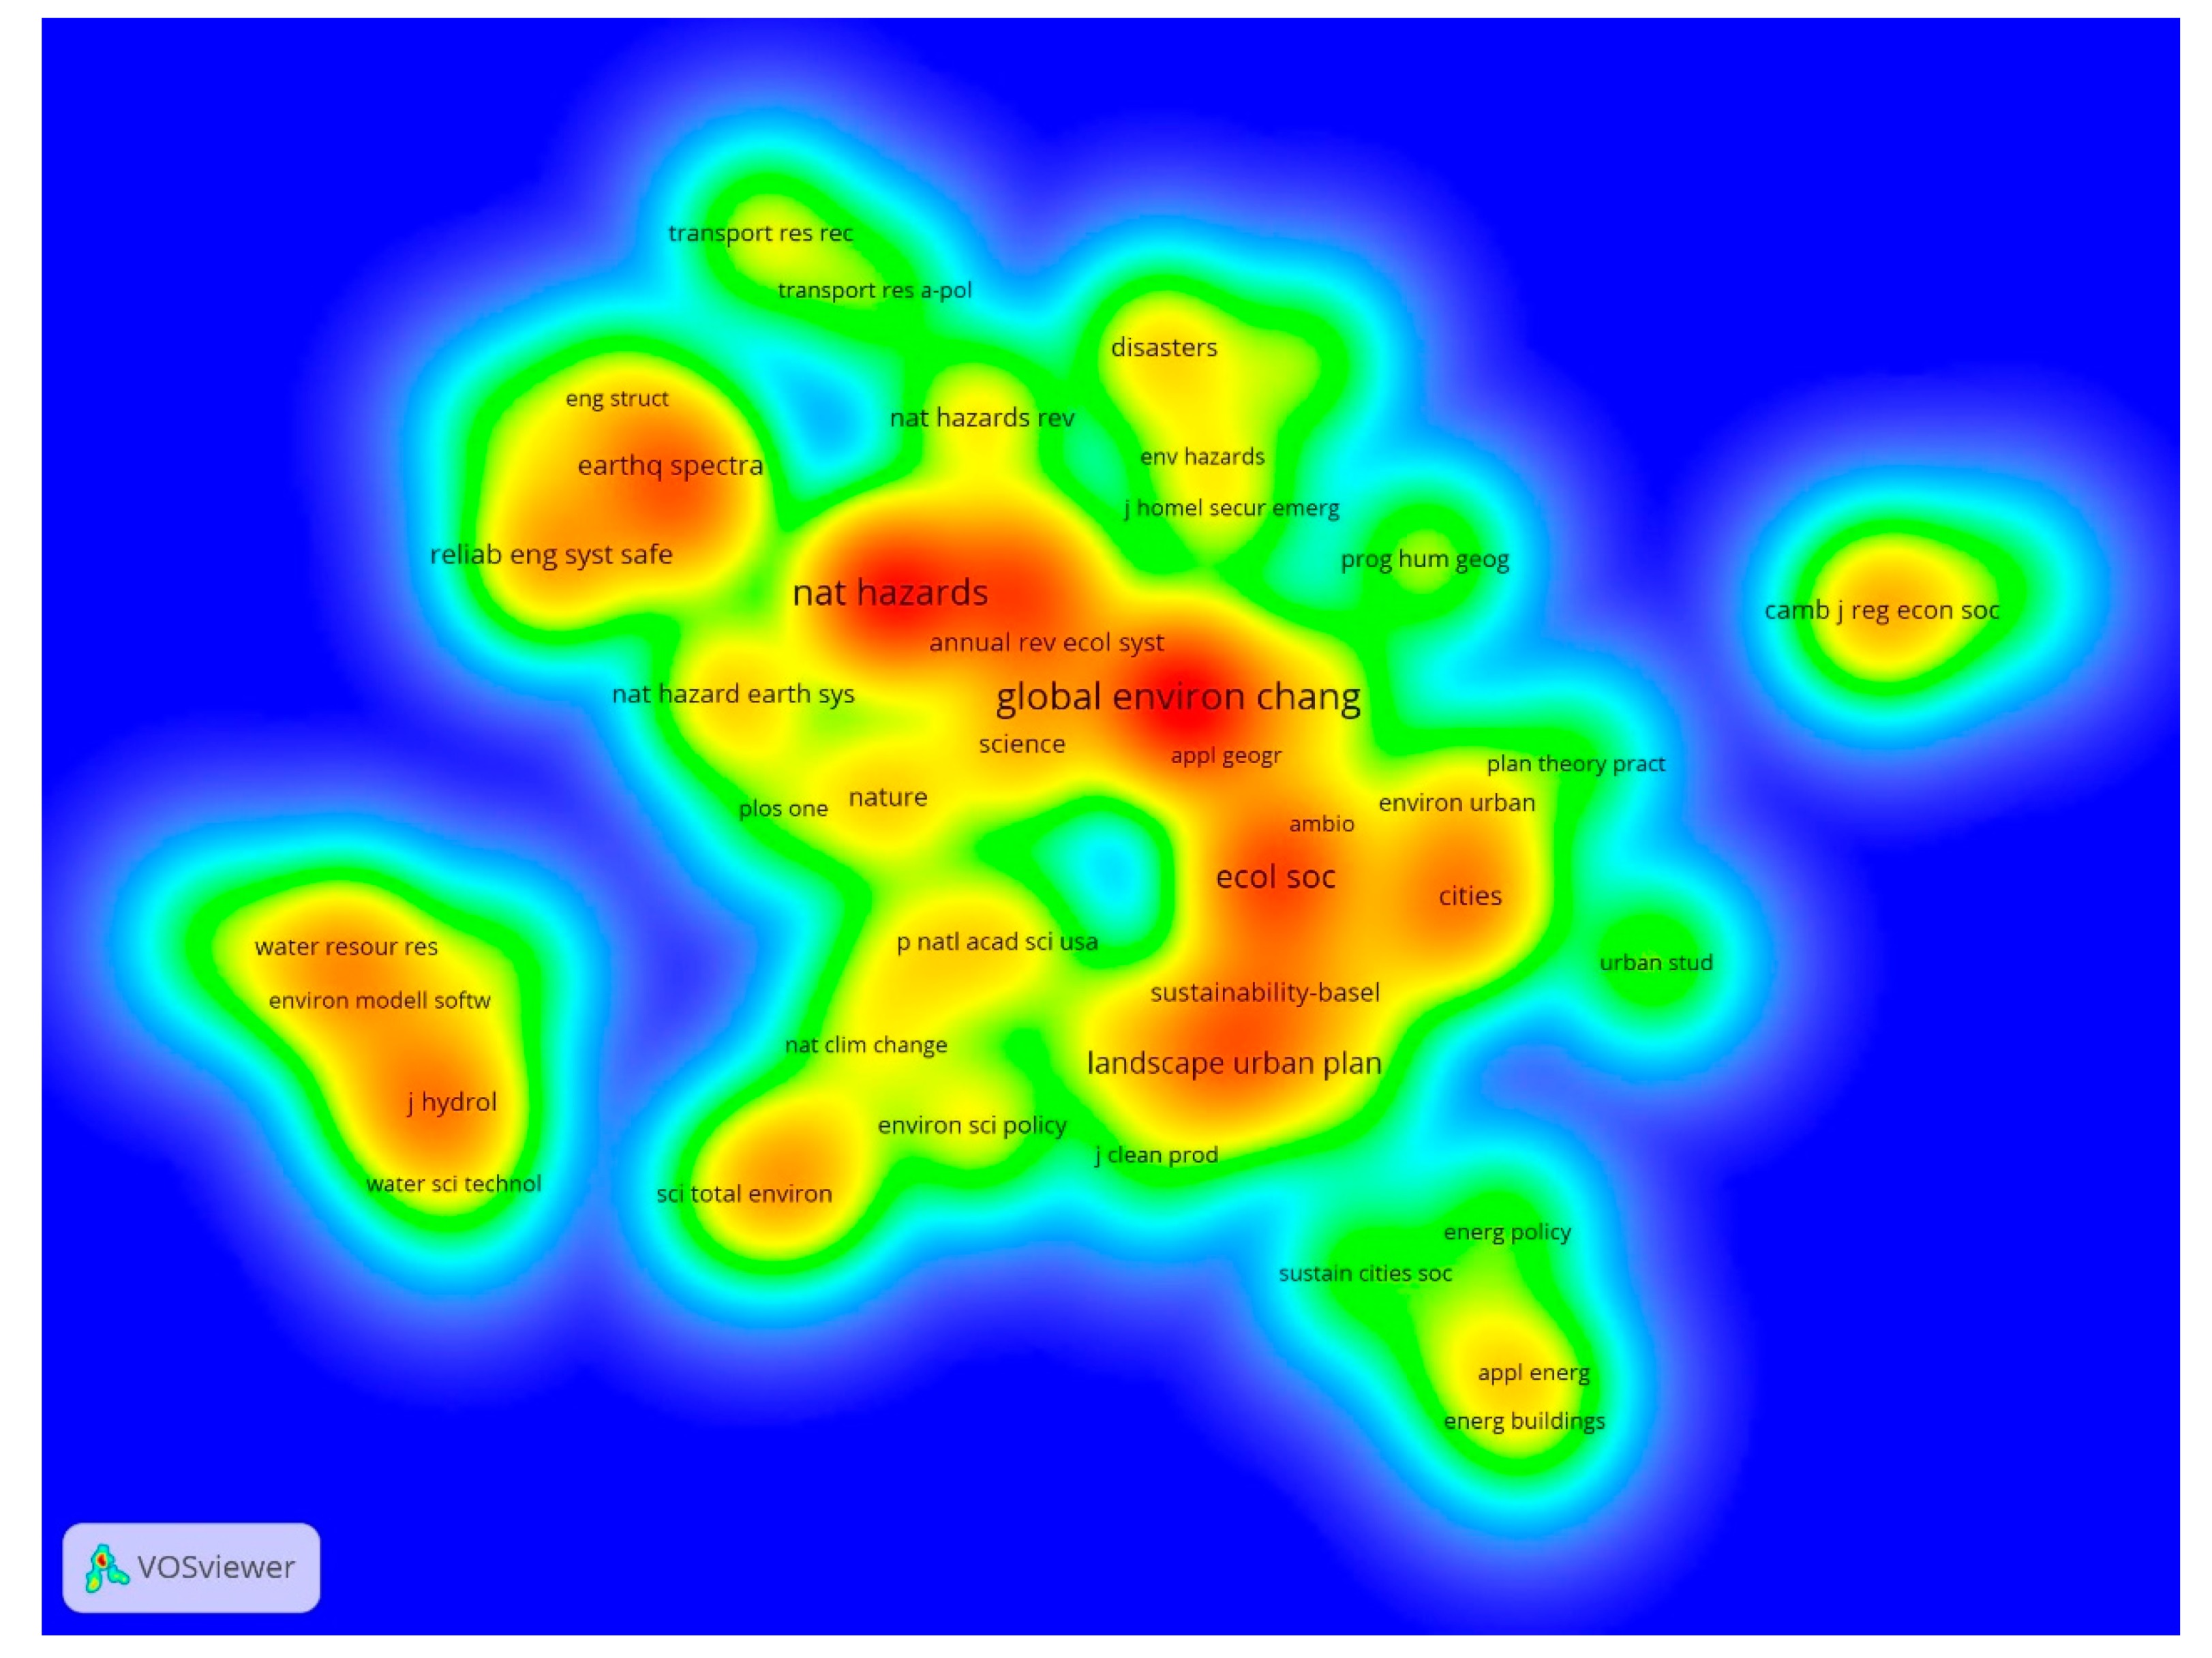
Co-citation analysis was used to understand which journals have made more contribution to the development of the field. In VOSviewer, co-citation analysis was conducted by setting the minimum number of citations per document to 50. The resulting co-citation density map is shown in Figure 7. Supporting quantitative data can be found in Table S6.
The top five most influential journals are: “Global Environmental Change”, “Natural Hazards”, “Ecology and Society”, “International Journal of Disaster Risk Reduction”, and “Landscape and Urban Planning”. In the density map shown in Figure 7, warmer colors (red) indicate higher citation count and journals with stronger co-citation links are clustered together. The clusters are, to a large extent, in line with the thematic focus clusters introduced in Section 3.3.1. The central cluster includes the above-mentioned most influential journals and is focused on resilience to various climate change impacts. In terms of dimensional focus, ecology, and governance are major aspects addressed by this group of journals.
As expected, based on the thematic clusters mentioned earlier, there is a high-density cluster at the bottom-left corner of the figure that is consisted of journals focused on hydrology and water management. These are journals such as “Journal of Hydrology”, “Water Resources Research”, “Water Resource Management”, and “Water Science & Technology” that mainly address issues related to flood resilience and stormwater management.
The thematic clustering in Section 3.3.1 shows that assessing earthquake resilience has received considerable attention in the literature. The clusters at the top-left corner show that this line of research has mainly been published in journals such as “Earthquake Spectra” and “Reliability Engineering and System Safety”. Closely related to this is a group of journals that are mainly focused on resilience of critical infrastructure systems. These are journals such as “Engineering Structures”, “Journal of Infrastructure Systems”, “Transportation Research Record”, and “Transportation Research Part A”. The latter two are clearly focused on transportation infrastructure systems.
In addition to these major clusters, there are also two less dense but noteworthy clusters. One at the bottom of the figure includes journals such as “Energy and Buildings”, “Building and Environment”, “Applied Energy”, and “Sustainable Cities and Society”. These journals are mainly focused on urban energy resilience and resilience at the building scale. Another cluster includes journals such as “Cambridge Journal of Regions Economy and Society” and “The Journal of Economic Geography”. However, this cluster is small and not well connected with the others, confirming the above statement about the limited research on the economic dimensions.
At the end of this section, it is worth noting that this co-citation analysis includes not only the 420 articles retrieved from the WoS, but also all references that have been cited by them. Focusing on the retrieved papers only (by doing citation analysis instead of co-citation analysis) would yield different results, as shown in Table S7. The results show that the following journals have published more on this topic: “Sustainability”, “International Journal of Disaster Risk Reduction”, “Natural Hazards”, “Water Resources”, and “Sustainable Cities and Society”. As co-citation is better capable of clustering influential journals based on their thematic focus, in this study it was used as the main method for analysis.
3.5. Influential Documents
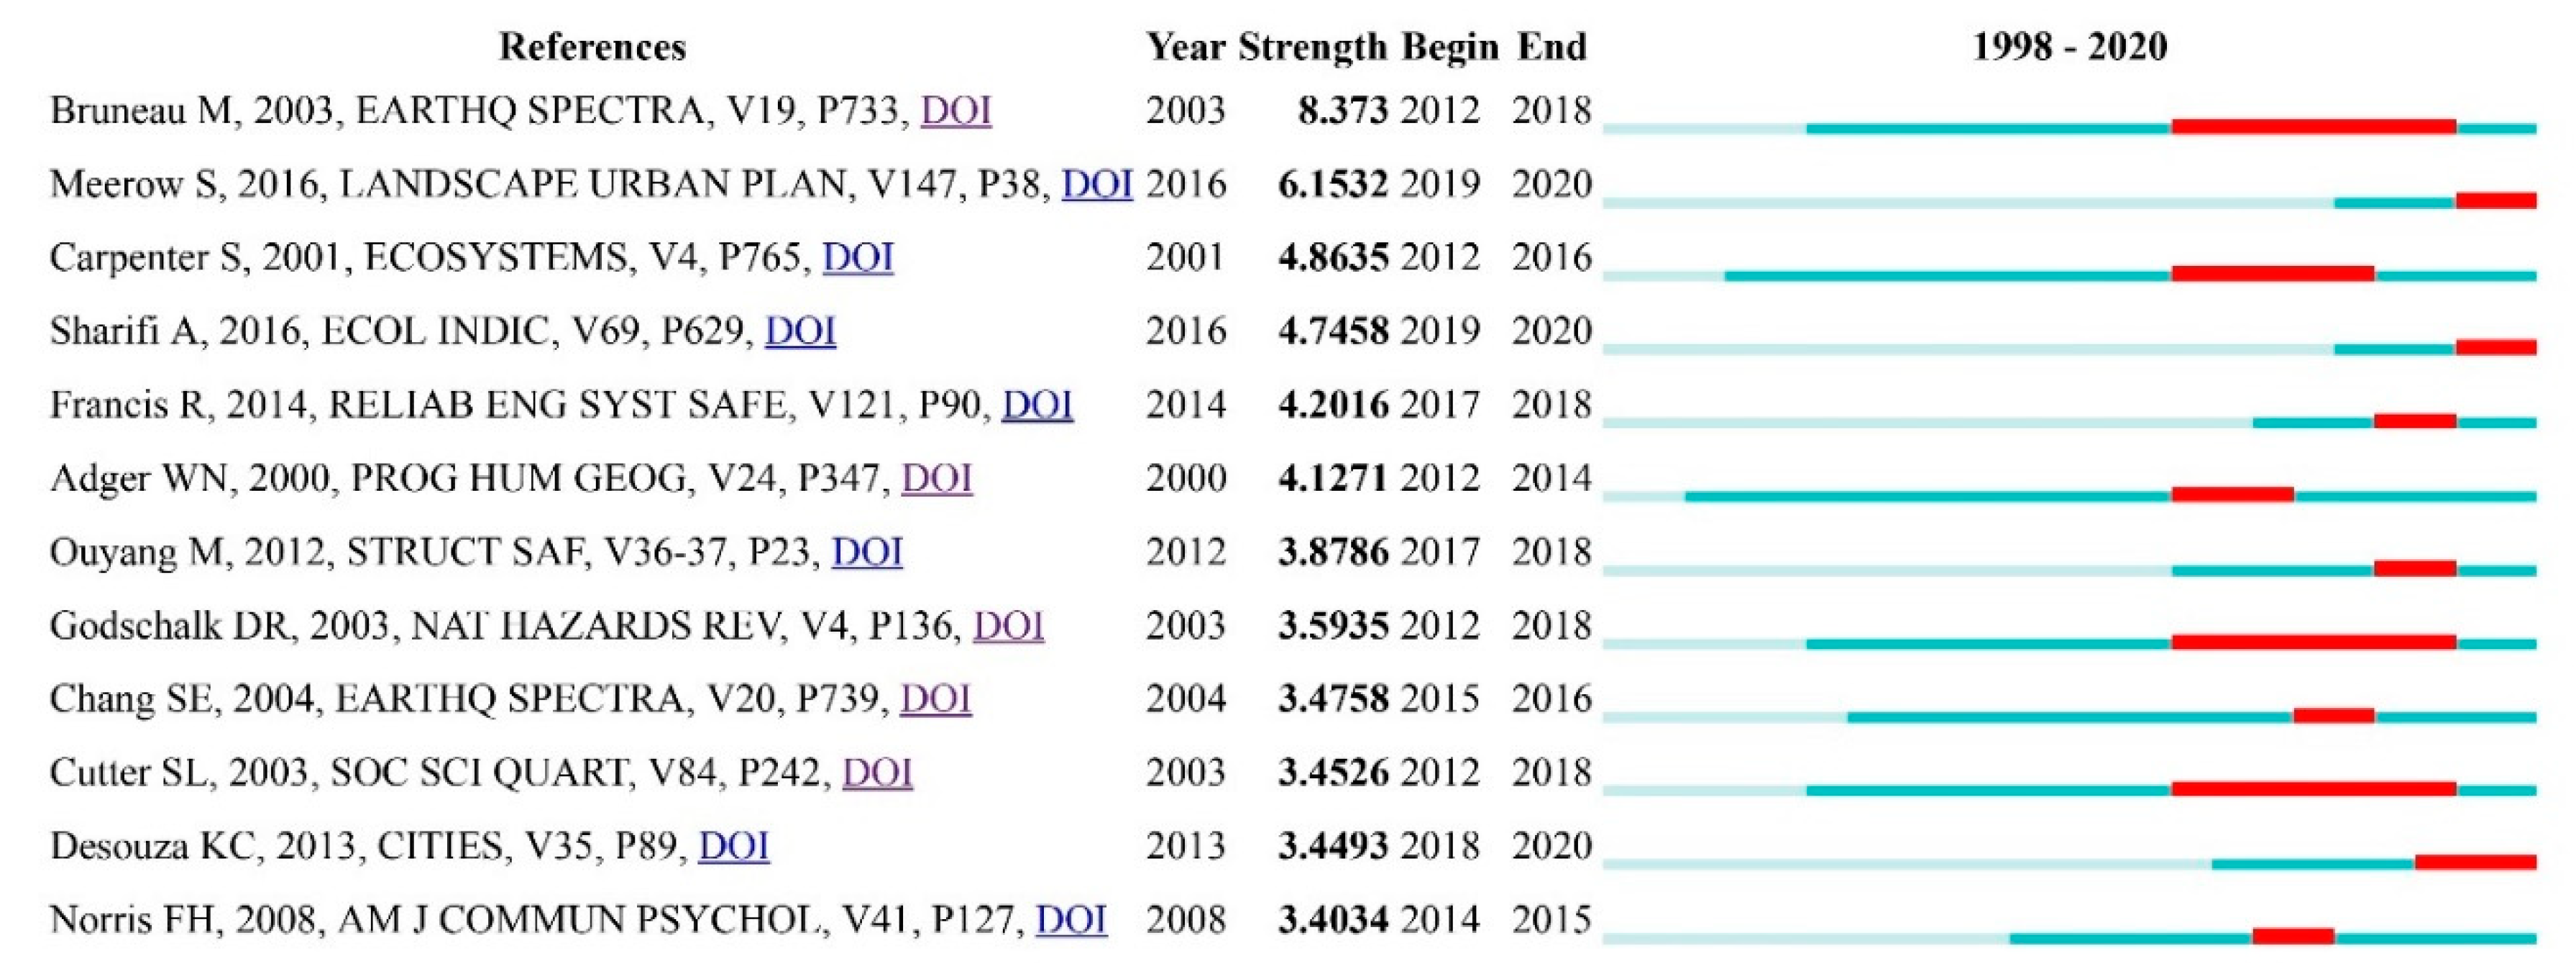
Co-citation analysis was also used to identify articles that have played relatively more important roles in the development of the field. Setting the minimum number of citations per reference to 19, the density map presented in Figure 8 was obtained. In addition, the CiteSpace application was used to detect references with strongest citation bursts and the timeline view of the influential references (Figure 9 and Figure S3).
Warmer colors in the density map indicate higher citation frequency density and stronger co-citation links. Four major clusters can be identified that are related to: conceptual frameworks and definitions, resilience assessment tools and indicator frameworks, resilience of infrastructure systems, and vulnerability-resilience linkages. Not surprisingly, the most cited documents with the largest link strengths are those that explore the conceptual underpinning of resilience (first major cluster). Well-known examples are the classic works of Holling [50] on the resilience and stability of ecological systems and the study on the resilience of social-ecological systems by Folke [51]. Other noteworthy works are the review article by Meerow, Newell, and Stults [17] on the definitions of urban resilience and other conceptual works by Ahern [45], Walker and Salt [52], and Godschalk [53].
As expected, papers focused on resilience indicators and assessment tools also form a high-density cluster (the second major cluster at the bottom right of the figure). Clearly, articles by Susan Cutter and her colleagues on vulnerability index and resilience indicators, and their applications for benchmarking community performance, have proved very influential in the development of the field (e.g., Cutter et al. [54], Cutter, Burton, and Emrich [35], and Cutter et al. [55]). Other works contributing significantly to the development of resilience indicators are focused on composite resilience indices [56], and multiple tools and frameworks are available for assessing urban and community resilience [3].
The third major cluster (top right corner of the figure) is focused on resilience of infrastructure systems, with a major emphasis on earthquake resilience. The most prominent article of this cluster elaborates on the conceptual underpinnings of seismic resilience and introduces quantitative measures for assessing resilience [57]. Similarly, Cimellaro et al. [58] developed a framework for quantitative evaluation of seismic resilience of healthcare infrastructure and Chang and Shinozuka [59] designed quantitative seismic resilience measures and applied them to the case of water distribution network of Memphis, Tennessee. Another noteworthy work is by Ouyang et al. [60], who developed a framework for analyzing resilience of critical infrastructure systems to a multiple array of hazards and applied it to the power transmission grid in Texas, USA.
The fourth major cluster consists of papers that discuss linkages between resilience and other concepts such as vulnerability. As Figure S2 indicates, these concepts have a longer history and papers belonging to this cluster have made significant contributions to clarifying similarities and differences between resilience and vulnerability. Representative articles are those by Gallopín [61] and Adger [62].
While Section 3 discusses that there is a thematic focus on resilience to water-related risks, no cluster of frequently cited documents related to these risks exists. Only one paper that explores analytical approaches for investigating resilience of urban drainage systems appears in the density map [63]. This is, however, not surprising considering that literature focused on floods and other water-related risk has mainly been published over the past few years (as evident from the citation bursts on Figure 6). Several years need to pass for these papers to accumulate citations. It is expected that flood-related papers will constitute a major cluster in the coming years.
As discussed above, the “citation bursts” analysis of the CiteSpace application can be used to gain information about specific time periods during which influential documents have accumulated more citations. Citation bursts also offer additional insights on time periods during which specific areas of research have received more attention. The red bars in Figure 9 are indicative of bursts and the beginning and end of the period is also shown on the left side of the bars. Overall, 12 documents have experienced citation bursts that have all occurred since 2012. This indicates that the field has grown rapidly since then. Documents related to infrastructure resilience, particularly to seismic risks [57,59,60,64], different conceptual underpinnings of resilience [17,53,65,66,67], and resilience indicators and assessment tools [3,55], have experienced citation bursts. This is in line with what is discussed above about influential research hotspots.
3.6. Influential Authors
The final analysis was to identify authors who have been more influential in the development of the field. This can be done using either co-citation or citation analysis. Co-citation analysis ranks the authors based on their frequency of being cited together in the retrieved articles. In contrast, citation analysis ranks the authors based on only the citation data of the retrieved articles.
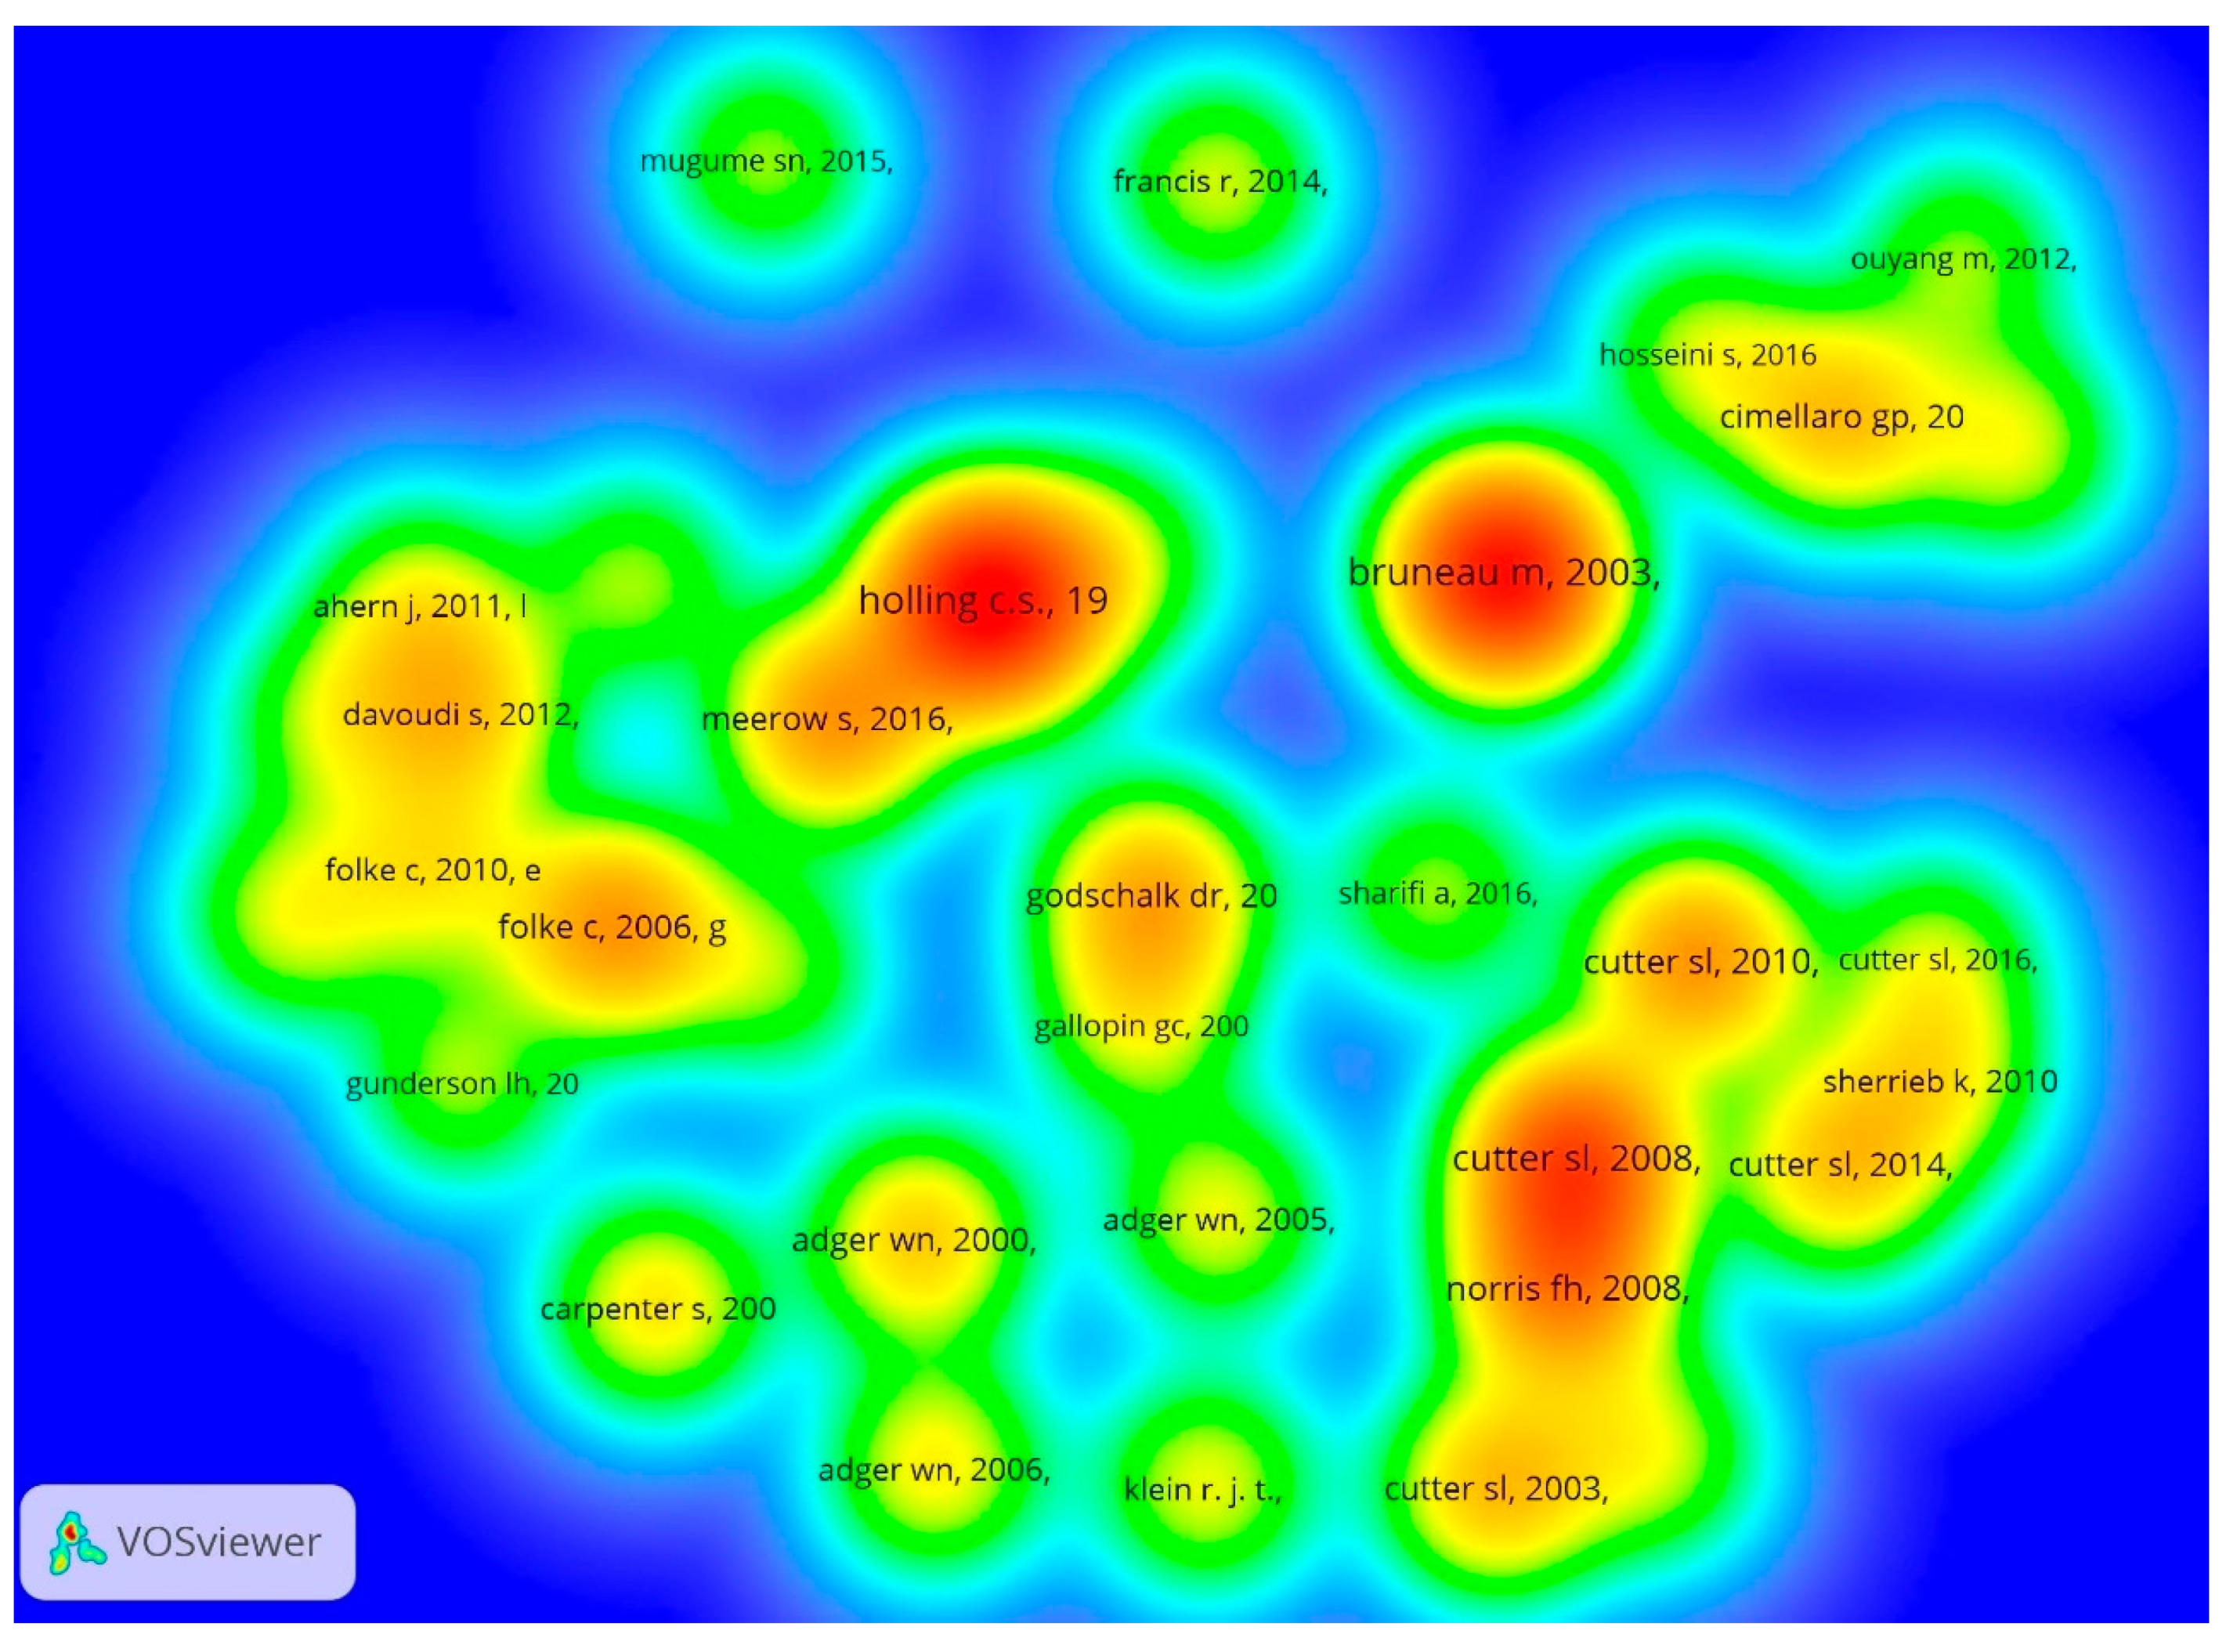
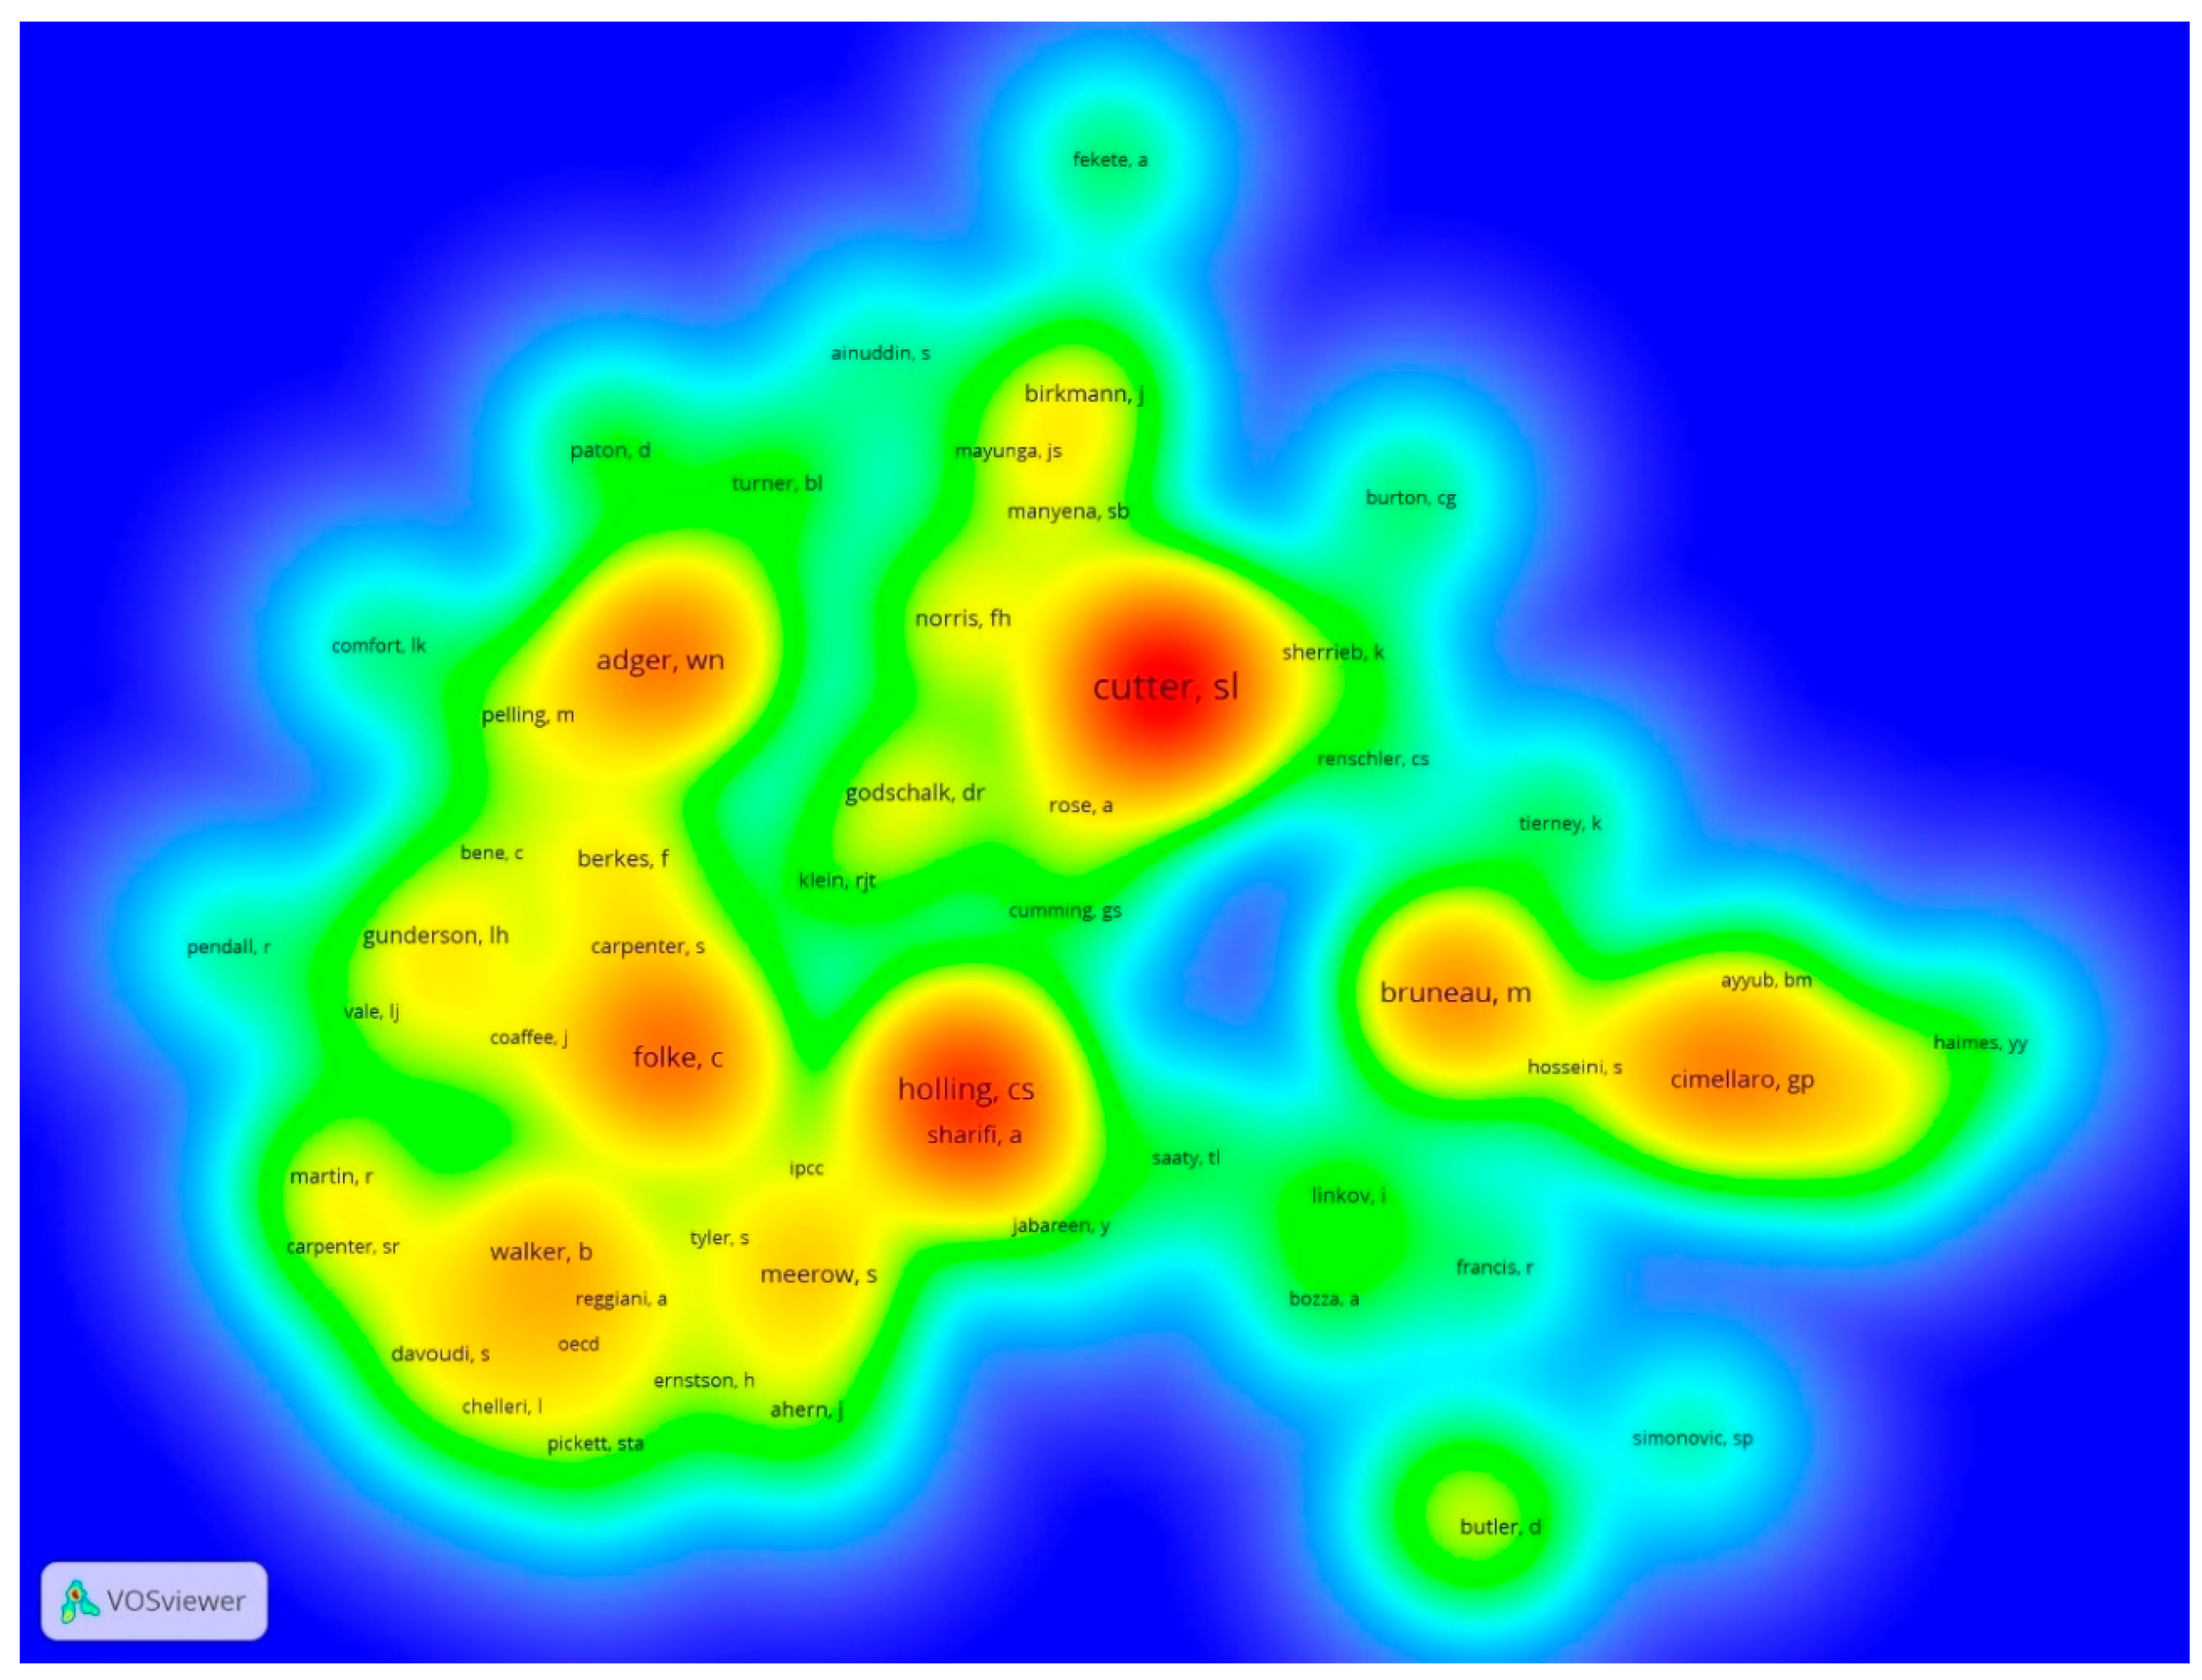
For the co-citation analysis, setting the minimum number citations per author to 20, the density map presented in Figure 10 was obtained. The supporting quantitative data related to this figure are available in Table S10 of the Appendix. These are the top 10 authors who have been co-cited frequently: Susan Cutter, Crawford Holling, Carl Folke, Neil Adger, Michel Bruneau, Gian Paolo Cimellaro, Brian Walker, Ayyoob Sharifi, Sara Meerow, and Min Ouyang. Additionally, Figure 10 shows that there are some clusters of authors who work on similar topics. For instance, Michel Bruneau, Gian Paolo Cimellaro, and Min Ouyang are prominent scholars working on resilience of critical infrastructure systems, particularly in the context of seismic risks. Susan Cutter, Kathleen Sherrieb, and Fran Norris are major researchers working on community resilience and indicators. Other authors highlighted in Figure 10 either work specifically on various issues related to urban resilience (e.g., Sara Meerow and Ayyoob Sharifi) or are prominent experts dealing with vulnerability and resilience of socio-ecological systems (e.g., Crawford Holling, Carl Folke, and Brian Walker).
Using citation analysis as the basis for ranking leads to different results that are presented in Table 2. This analysis shows that highly-cited scholars mainly work on topics such as community resilience indicators, infrastructure resilience, seismic resilience, and flood resilience that, as discussed above, are major thematic focus areas of the field.
4. Summary and Conclusions
The ever-growing concentration of humans and economic activities in urban areas requires taking actions to reduce vulnerabilities to a multitude of climatic and non-climatic risks that threaten proper functioning of cities. This need is well-recognized in science and policy circles and there are now numerous publications and policy frameworks aimed at providing solutions on how to enhance urban resilience. There have also been many efforts to guide resilience planning through development and implementations of indicators and assessment tools. The main objective of this study was to provide a better understanding of the knowledge structure and trends in “urban resilience assessment” studies and to identify journals, documents, and authors that have played more influential roles in the development of the field. Two bibliometrics analysis and science mapping applications, namely VOSviewer and CiteSpace, were used for this purpose. These applications allow performance analysis, as well as knowledge domain visualization.
The results show that until 2010 the knowledge base of the field was very limited, but the number of publications has progressively increased ever since. The growth rate has been particularly high over the past five years, which could be explained by the increasing emphasis on the significance of urban resilience in major policy documents such as the UN SDGs, the Sendai Framework for Disaster Risk Reduction, and the New Urban Agenda. Dividing the analysis period into three sub-periods (1998–2009, 2010–2014, and 2015–2020), it was found that, during the first period, the intellectual base was limited and fragmented, and the few papers published were mainly focused on engineering-based resilience characteristics such as robustness and stability. However, during the second period, the knowledge base started to grow and a paradigm shift toward more adaptation-based approaches that promote characteristics such as diversity, modularity, self-organization, connectivity, and adaptive capacity occurred. Major progress in the development of indicators for assessing urban resilience was achieved during this period. Finally, within the past five years, the intellectual base has further expanded and more knowledge about indicators, tools, and methods for assessing urban resilience has been produced. In particular, more attention has been paid to assessing resilience to climatic impacts.
In terms of thematic focus, overall, several major clusters were found. The dominant one is focused on resilience to climate change impacts, with a clear emphasis on urban flooding. However, assessing resilience to other important stressors such as extreme heat has, comparatively, received limited attention. It was argued that, given the projections about the increase in frequency and intensity of climatic impacts, further research on climatic stressors is expected to be published in the coming years. Another major cluster is mainly focused on resilience of critical infrastructure systems to natural hazards such as earthquakes and tsunamis. This has been a persistent focus area throughout the analysis period. Finally, there are, comparatively, less developed clusters on institutional aspects of urban resilience, and planning- and design-related measures such as land use planning and green infrastructure development. Overall, these clusters cover issues related to three major dimensions of urban resilience: environment/ecology, infrastructure, and governance/institutions. However, economy and society/well-being are two important dimensions that are comparatively understudied. Further research on assessing social and economic dimension of resilience should, therefore, be conducted. Since the recent COVID-19 pandemic has instigated new discussions on the significance of urban resilience, more research on health-related indicators is expected to be conducted in the coming years.
In addition to identifying major thematic focus areas, this paper highlights key sources, authors, and publications that lay the foundation of the field of urban resilience assessment. Network analyses of these components resulted in clusters that are in line with the thematic clusters discussed above. Furthermore, the CiteSpace application allowed progressive visualization of the knowledge domain and influential authors/publications over the analysis period. This information can be used by interested groups as a point of reference to gain better knowledge about the structure and thematic evolution of urban resilience assessment. Overall, this study has gone some way toward providing a better understanding of the current status of research on urban resilience assessment that is a rapidly growing field of research. Further work is, however, needed to gain more detailed information about the different thematic clusters and research hotspots identified in this study. In addition, further manual analysis is needed to gain more details about the geographic focus of the literature and the socioeconomic and climatic conditions that have received more attention. This can be done using systematic review approaches. Such approaches are likely to provide more qualitative information to better interpret the quantitative details identified by bibliometrics analysis. In addition, further research is needed to fill the knowledge gaps related to economic and social dimensions of urban resilience assessment and resilience to climatic stressors other than flooding. Finally, future research should also make efforts to fill the knowledge gap related to the implementation of urban resilience assessment tools and methods.
Supplementary Materials
The following are available online at https://0-www-mdpi-com.brum.beds.ac.uk/2071-1050/12/15/5918/s1, Figure S1: Density visualization of the frequently occurred terms, Figure S2: Keyword timeline view of the urban resilience assessment field for 1998–2020, Figure S3: Timeline view of influential references for 1998–2020, Table S1: Most influential institutions, Table S2: Frequently used terms in the urban resilience assessment literature, Table S3: Top keywords for 1998–2009, Table S4: Top keywords for 2010–2014, Table S5. Top keywords for 2015–2020, Table S6: Top 20 most influential journals based on co-citation analysis, Table S7: List of top journals based on the number of publications, Table S8: Top 20 most influential articles based on co-citation analysis, Table S9: List of top references based on the number of citations, Table S10: Top 20 authors based on the co-citation analysis.
Funding
This research received no external funding.
Conflicts of Interest
The author declares no conflict of interest.
References
- Sharifi, A.; Yamagata, Y. Resilience-Oriented Urban Planning. In Resilience-Oriented Urban Planning: Theoretical and Empirical Insights; Yamagata, Y., Sharifi, A., Eds.; Springer International Publishing: Cham, Switzerland, 2018; pp. 3–27. [Google Scholar]
- Leichenko, R. Climate Change and Urban Resilience. Curr. Opin. Environ. Sustain. 2011, 3, 164–168. [Google Scholar] [CrossRef]
- Sharifi, A. A Critical Review of Selected Tools for Assessing Community Resilience. Ecol. Indicat. 2016, 69, 629–647. [Google Scholar] [CrossRef] [Green Version]
- Sharifi, A.; Yamagata, Y. Towards an Integrated Approach to Urban Resilience Assessment. APN Sci. Bull. 2017, 7. [Google Scholar] [CrossRef] [Green Version]
- Sharifi, A.; Yamagata, Y. Principles and Criteria for Assessing Urban Energy Resilience: A Literature Review. Renew. Sustain. Energ. Rev. 2016, 60, 1654–1677. [Google Scholar] [CrossRef] [Green Version]
- Faturechi, R.; Miller-Hooks, E. Measuring the Performance of Transportation Infrastructure Systems in Disasters: A Comprehensive Review. J. Infrastruct. Syst. 2015, 21, 04014025. [Google Scholar] [CrossRef]
- Sharifi, A. Resilient Urban Forms: A Review of Literature on Streets and Street Networks. Build. Environ. 2019, 147, 171–187. [Google Scholar] [CrossRef]
- Shuang, Q.; Liu, H.J.; Porse, E. Review of the Quantitative Resilience Methods in Water Distribution Networks. Water 2019, 11, 1189. [Google Scholar] [CrossRef] [Green Version]
- Bulti, D.T.; Girma, B.; Megento, T.L. Community Flood Resilience Assessment Frameworks: A Review. SN Appl. Sci. 2019, 1, 1163. [Google Scholar] [CrossRef] [Green Version]
- Chen, C.; Song, M. Visualizing a Field of Research: A Methodology of Systematic Scientometric Reviews. PLoS ONE 2019, 14, e0223994. [Google Scholar] [CrossRef] [Green Version]
- Van Eck, N.; Waltman, L. Software Survey: VOSviewer, a Computer Program for Bibliometric Mapping. Scientometrics 2009, 84, 523–538. [Google Scholar] [CrossRef] [Green Version]
- Liu, H.; Chen, H.; Hong, R.; Liu, H.; You, W. Mapping Knowledge Structure and Research Trends of Emergency Evacuation Studies. Saf. Sci. 2020, 121, 348–361. [Google Scholar] [CrossRef]
- Chen, C.; Dubin, R.; Kim, M.C. Emerging Trends and New Developments in Regenerative Medicine: A Scientometric Update (2000–2014). Expet. Opin. Biol. Ther. 2014, 14, 1295–1317. [Google Scholar] [CrossRef] [PubMed] [Green Version]
- Chen, C. CiteSpace II: Detecting and Visualizing Emerging Trends and Transient Patterns in Scientific Literature. J. Am. Soc. Inf. Sci. Technol. 2006, 57, 359–377. [Google Scholar] [CrossRef] [Green Version]
- Van Eck, N.; Waltman, L. VOSviewer Manual for VOSviewer Version 1.6.14; Leiden University Press: EZ Leiden, Netherlands, 2020. [Google Scholar]
- Chen, C. Searching for Intellectual Turning Points: Progressive Knowledge Domain Visualization. Proc. Natl. Acad. Sci. USA 2004, 101, 5303. [Google Scholar] [CrossRef] [Green Version]
- Meerow, S.; Newell, J.P.; Stults, M. Defining Urban Resilience: A Review. Landsc. Urban. Plan. 2016, 147, 38–49. [Google Scholar] [CrossRef]
- National Research Council. Disaster Resilience: A National Imperative; The National Academies Press: Washington, DC, USA, 2012. [Google Scholar]
- UNFCCC Paris Agreement, United Nations Framework Convention on Climate Change. 2015. Available online: https://unfccc.int/files/essential_background/convention/application/pdf/english_paris_agreement.pdf (accessed on 24 May 2020).
- UNISDR, U. In Sendai Framework for Disaster Risk Reduction 2015–2030. In Proceedings of the 3rd United Nations World Conference on DRR, Sendai, Japan, 14–18 March 2015; pp. 14–18. [Google Scholar]
- Habitat, U. New Urban Agenda. 2017. Available online: http://habitat3.org/wp-content/uploads/NUA-English.pdf (accessed on 5 March 2020).
- Intergovernmental Panel on Climate Change. Climate Change 2007: Impacts, Adaptation and Vulnerability, Contribution of Working Group II to the Fourth Assessment Report of the Intergovernmental Panel on Climate Change; Parry, M.L., Canziani, O.F., Palutikof, J.P., van der Linden, P.J., Hanson, C.E., Eds.; Cambridge University Press: Cambridge, UK, 2007; pp. 745–777. [Google Scholar]
- Doherty, M.; Klima, K.; Hellmann, J.J. Climate Change in the Urban Environment: Advancing, Measuring and Achieving Resiliency. Environ. Sci. Policy 2016, 66, 310–313. [Google Scholar] [CrossRef] [Green Version]
- Owrangi, A.M.; Lannigan, R.; Simonovic, S.P. Mapping Climate Change-caused Health Risk for Integrated City Resilience Modeling. Nat. Hazards 2015, 77, 67–88. [Google Scholar] [CrossRef]
- Feldmeyer, D.; Wilden, D.; Kind, C.; Kaiser, T.; Goldschmidt, R.; Diller, C.; Birkmann, J. Indicators for Monitoring Urban Climate Change Resilience and Adaptation. Sustainability 2019, 11, 2931. [Google Scholar] [CrossRef] [Green Version]
- Leandro, J.; Chen, K.F.; Wood, R.R.; Ludwig, R.A. Scalable Flood-resilience-index for Measuring Climate Change Adaptation: Munich City. Water Res. 2020, 173, doi. [Google Scholar] [CrossRef]
- Amarasinghe, P.; Liu, A.; Egodawatta, P.; Barnes, P.; McGree, J.; Goonetilleke, A. Modelling Resilience of a Water Supply System under Climate Change and Population Growth Impacts. Water Resour. Manag. 2017, 31, 2885–2898. [Google Scholar] [CrossRef]
- Zhong, M.; Lin, K.R.; Tang, G.P.; Zhang, Q.; Hong, Y.; Chen, X.H. A Framework to Evaluate Community Resilience to Urban Floods: A Case Study in Three Communities. Sustainability 2020, 12, 152. [Google Scholar] [CrossRef] [Green Version]
- Chiesa, G.; Palme, M. Assessing Climate Change and Urban Heat Island Vulnerabilities in a Built Environment. Techne-J. Technol. Archit. Environ. 2018, 15, 237–245. [Google Scholar]
- Capozzo, M.; Rizzi, A.; Cimellaro, G.P.; Domaneschi, M.; Barbosa, A.; Cox, D. Multi-Hazard Resilience Assessment of a Coastal Community Due to Offshore Earthquakes. J. Earthq. Tsunami. 2019, 13. [Google Scholar] [CrossRef]
- Mensah, A.F.; Duenas-Osorio, L. Efficient Resilience Assessment Framework for Electric Power Systems Affected by Hurricane Events. J. Struct. Eng. 2016, 142, C4015013. [Google Scholar] [CrossRef]
- Feng, K.; Wang, N.; Li, Q.; Lin, P. Measuring and Enhancing Resilience of Building Portfolios Considering the Functional Interdependence among Community Sectors. Struct. Saf. 2017, 66, 118–126. [Google Scholar] [CrossRef]
- Alizadeh, H.; Sharifi, A. Assessing Resilience of Urban Critical Infrastructure Networks: A Case Study of Ahvaz, Iran. Sustainability 2020, 12, 3691. [Google Scholar] [CrossRef]
- Sharifi, A.; Yamagata, Y. On the Suitability of Assessment Tools for Guiding Communities towards Disaster Resilience. Int. J. Disaster Risk Reduct. 2016, 18, 115–124. [Google Scholar] [CrossRef] [Green Version]
- Cutter, S.L.; Burton, C.G.; Emrich, C.T. Disaster Resilience Indicators for Benchmarking Baseline Conditions. J. Homel. Secur. Emerg. Manag. 2010, 7. [Google Scholar] [CrossRef]
- Jordan, E.; Javernick-Will, A. Indicators of Community Recovery: Content Analysis and Delphi Approach. Nat. Hazards Rev. 2013, 14, 21–28. [Google Scholar] [CrossRef]
- Zhu, Y.Q.; Wang, Y.; Liu, T.X.; Sui, Q. Assessing Macroeconomic Recovery after a Natural Hazard Based on ARIMA-A Case Study of the 2008 Wenchuan Earthquake in China. Nat. Hazards 2018, 91, 1025–1038. [Google Scholar] [CrossRef]
- Polonenko, L.M.; Hamouda, M.A.; Mohamed, M.M. Essential Components of Institutional and Social Indicators in Assessing the Sustainability and Resilience of Urban Water Systems: Challenges and Opportunities. Sci. Total. Environ. 2020, 708, doi. [Google Scholar] [CrossRef] [PubMed]
- Voghera, A.; Giudice, B. Evaluating and Planning Green Infrastructure: A Strategic Perspective for Sustainability and Resilience. Sustainability 2019, 11, 2726. [Google Scholar] [CrossRef] [Green Version]
- Joyce, J.; Chang, N.B.; Harji, R.; Ruppert, T.; Imen, S. Developing a Multi-scale Modeling System for Resilience Assessment of Green-grey Drainage Infrastructures under Climate Change and Sea Level Rise Impact. Environ. Modell. Softw. 2017, 90, 1–26. [Google Scholar] [CrossRef]
- Chun, H.; Chi, S.; Hwang, B.G. A Spatial Disaster Assessment Model of Social Resilience Based on Geographically Weighted Regression. Sustainability 2017, 9, 2222. [Google Scholar] [CrossRef] [Green Version]
- Bertilsson, L.; Wiklund, K.; Tebaldi, I.D.; Rezende, O.M.; Verol, A.P.; Miguez, M.G. Urban Flood Resilience—A Multi-criteria Index to Integrate Flood Resilience into Urban Planning. J. Hydrol. 2019, 573, 970–982. [Google Scholar] [CrossRef]
- Moghadas, M.; Asadzadeh, A.; Vafeidis, A.; Fekete, A.; Kötter, T. A Multi-criteria Approach for Assessing Urban Flood Resilience in Tehran, Iran. Int. J. Disaster Risk Reduct. 2019, 35, 101069. [Google Scholar] [CrossRef]
- Sharifi, A.; Yamagata, Y. Urban Resilience Assessment: Multiple Dimensions, Criteria, and Indicators. In Urban Resilience; Yamagata, Y., Maruyama, H., Eds.; Springer: Tokyo, Japan, 2016. [Google Scholar]
- Ahern, J. From Fail-safe to safe-to-fail: Sustainability and Resilience in the New Urban World. Landsc. Urban. Plan. 2011, 100, 341–343. [Google Scholar] [CrossRef] [Green Version]
- Feofilovs, M.; Romagnoli, F.; Campos, J.I.; Gotangco, C.K.; Josol, J.C.; Jardeleza, J.M.P.; Litam, J.E.; Abenojar, K. Assessing Resilience against Floods with a System Dynamics Approach: A Comparative Study of Two Models. Int. J. Disaster Resil. Built Environ. 2020. [Google Scholar] [CrossRef]
- Waghwala, R.K.; Agnihotri, P.G. Flood Risk Assessment and Resilience Strategies for Flood Risk Management: A Case Study of Surat City. Int. J. Disaster Risk Reduct. 2019, 40. [Google Scholar] [CrossRef]
- Zheng, Y.; Xie, X.L.; Lin, C.Z.; Wang, M.; He, X.J. Development as Adaptation: Framing and Measuring Urban Resilience in Beijing. Adv. Clim. Chang. Res. 2018, 9, 234–242. [Google Scholar] [CrossRef]
- Goldbeck, N.; Angeloudis, P.; Ochieng, W.Y. Resilience Assessment for Interdependent Urban Infrastructure Systems Using Dynamic Network Flow Models. Reliab. Eng. Syst. Saf. 2019, 188, 62–79. [Google Scholar] [CrossRef]
- Holling, C.S. Resilience and Stability of Ecological Systems. Annu. Rev. Ecol. Systemat. 1973, 4, 1–23. [Google Scholar] [CrossRef] [Green Version]
- Folke, C. Resilience: The Emergence of a Perspective for Social–ecological Systems Analyses. Glob. Environ. Chang. 2006, 16, 253–267. [Google Scholar] [CrossRef]
- Walker, B.H.; Salt, D. Resilience Thinking: Sustaining Ecosystems and People in a Changing World. In Resilience Thinking; Island Press: Washington, DC, USA, 2006. [Google Scholar]
- Godschalk, D.R. Urban Hazard Mitigation: Creating Resilient Cities. Nat. Hazards Rev. 2003, 4, 136–143. [Google Scholar] [CrossRef]
- Cutter, S.L.; Barnes, L.; Berry, M.; Burton, C.; Evans, E.; Tate, E.; Webb, J. A Place-based Model for Understanding Community Resilience to Natural Disasters. Glob. Environ. Chang. 2008, 18, 598–606. [Google Scholar] [CrossRef]
- Cutter, S.L.; Boruff, B.J.; Shirley, W.L. Social Vulnerability to Environmental Hazards. Soc. Sci. Q. 2003, 84, 242–261. [Google Scholar] [CrossRef]
- Sherrieb, K.; Norris, F.H.; Galea, S. Measuring Capacities for Community Resilience. Soc. Indic. Res. 2010, 99, 227–247. [Google Scholar] [CrossRef]
- Bruneau, M.; Chang, S.E.; Eguchi, R.T.; Lee, G.C.; O’Rourke, T.D.; Reinhorn, A.M.; Shinozuka, M.; Tierney, K.; Wallace, W.A.; von Winterfeldt, D. A Framework to Quantitatively Assess and Enhance the Seismic Resilience of Communities. Earthq. Spectra 2003, 19, 733–752. [Google Scholar] [CrossRef] [Green Version]
- Cimellaro, G.P.; Reinhorn, A.M.; Bruneau, M. Framework for Analytical Quantification of Disaster Resilience. Eng. Struct. 2010, 32, 3639–3649. [Google Scholar] [CrossRef]
- Chang, S.E.; Shinozuka, M. Measuring Improvements in the Disaster Resilience of Communities. Earthq. Spectra 2004, 20, 739–755. [Google Scholar] [CrossRef]
- Ouyang, M.; Dueñas-Osorio, L.; Min, X. A Three-stage Resilience Analysis Framework for Urban Infrastructure Systems. Struct. Saf. 2012, 36–37, 23–31. [Google Scholar] [CrossRef]
- Gallopín, G.C. Linkages between Vulnerability, Resilience and Adaptive Capacity. Glob. Environ. Chang. 2006, 16, 293–303. [Google Scholar] [CrossRef]
- Adger, W.N. Vulnerability. Glob. Environ. Chang. 2006, 16, 268–281. [Google Scholar] [CrossRef]
- Mugume, S.N.; Gomez, D.E.; Fu, G.T.; Farmani, R.; Butler, D. A Global Analysis Approach for Investigating Structural Resilience in Urban Drainage Systems. Water. Res. 2015, 81, 15–26. [Google Scholar] [CrossRef] [Green Version]
- Francis, R.; Bekera, B. A Metric and Frameworks for Resilience Analysis of Engineered and Infrastructure Systems. Reliab. Eng. Syst. Saf. 2014, 121, 90–103. [Google Scholar] [CrossRef]
- Desouza, K.C.; Flanery, T.H. Designing, Planning and Managing Resilient Cities: A Conceptual Framework. Cities 2013, 35, 89–99. [Google Scholar] [CrossRef]
- Carpenter, S.; Walker, B.; Anderies, J.M.; Abel, N. From Metaphor to Measurement: Resilience of What to What? Ecosystems 2001, 4, 765–781. [Google Scholar] [CrossRef]
- Adger, W.N. Social and Ecological Resilience: Are They Related? Prog. Hum. Geogr. 2000, 24, 347–364. [Google Scholar] [CrossRef]
- Ouyang, M.; Duenas-Osorio, L. Time-dependent Resilience Assessment and Improvement of Urban Infrastructure Systems. Chaos 2012, 22, 033122. [Google Scholar] [CrossRef] [Green Version]
- Ainuddin, S.; Routray, J.K. Community Resilience Framework for an Earthquake Prone Area in Baluchistan. Int. J. Disaster Risk Reduct. 2012, 2, 25–36. [Google Scholar] [CrossRef]
Figure 1.
Publication trends for 1998–2020. Note that the smaller number of articles in 2020 compared with 2019 is because the literature search was done in early June 2020. Overall, the upward trend is expected to continue in 2020.
Figure 1.
Publication trends for 1998–2020. Note that the smaller number of articles in 2020 compared with 2019 is because the literature search was done in early June 2020. Overall, the upward trend is expected to continue in 2020.

Figure 2.
Most influential countries and their inter-relationships. Node size is proportional to the number of publications and link thickness indicates the strength of connections between the countries. In addition, different colors refer to clusters of closely linked countries.
Figure 2.
Most influential countries and their inter-relationships. Node size is proportional to the number of publications and link thickness indicates the strength of connections between the countries. In addition, different colors refer to clusters of closely linked countries.

Figure 3.
Most influential institutions. Node size is proportional to the number of publications and link thickness indicates the strength of connections between the institutes. In addition, different colors refer to clusters of closely linked institutes.
Figure 3.
Most influential institutions. Node size is proportional to the number of publications and link thickness indicates the strength of connections between the institutes. In addition, different colors refer to clusters of closely linked institutes.

Figure 4.
Term co-occurrence map. Node size is proportional to the term frequency and link thickness indicates link strength. In addition, different colors refer to clusters of terms that co-occur frequently.
Figure 4.
Term co-occurrence map. Node size is proportional to the term frequency and link thickness indicates link strength. In addition, different colors refer to clusters of terms that co-occur frequently.

Figure 5.
Keyword occurrence map during: (a) the genesis period 1998–2009; (b) the growth period (2010–2014); and (c) the rapid growth period (2015–2020).
Figure 5.
Keyword occurrence map during: (a) the genesis period 1998–2009; (b) the growth period (2010–2014); and (c) the rapid growth period (2015–2020).

Figure 6.
Top nine keywords with the strongest citation bursts.

Figure 7.
The most influential sources.

Figure 8.
The most influential documents.

Figure 9.
Top 12 references with the strongest citation bursts.

Figure 10.
The most influential authors based on the co-citation analysis.


Table 1.
The top 10 countries publishing research on urban resilience assessment.
| Rank | Country | Documents | Citations | Total Link Strength |
|---|---|---|---|---|
| 1 | USA | 115 | 2058 | 26,023 |
| 2 | China | 65 | 326 | 19,026 |
| 3 | England | 53 | 636 | 12,353 |
| 4 | Italy | 34 | 263 | 12,537 |
| 5 | Germany | 28 | 355 | 9683 |
| 6 | Australia | 23 | 273 | 4493 |
| 7 | Canada | 22 | 156 | 6019 |
| 8 | Netherlands | 22 | 182 | 4823 |
| 9 | Iran | 19 | 57 | 6367 |
| 10 | France | 17 | 215 | 5318 |
Table 2.
Influential authors based on citation analysis.
| Rank | Author | Citations | Thematic Focus | Most Cited Document |
|---|---|---|---|---|
| 1 | Cutter, Susan | 499 | Community disaster resilience indicators | [54] |
| 2 | Emrich, Christopher | 499 | Community disaster resilience indicators | [35] |
| 3 | Burton, Christopher | 468 | Community disaster resilience indicators | [54] |
| 4 | Sharifi, Ayyoob | 217 | Resilience assessment tools | [3] |
| 5 | Butler, David | 149 | Water/flood risk assessment | [63] |
| 6 | Yamagata, Yoshiki | 123 | Energy resilience | [5] |
| 7 | Miller-hooks, Elise | 121 | Infrastructure resilience | [6] |
| 8 | Duenas-osorio, Leonardo | 104 | Infrastructure resilience | [68] |
| 9 | Ainuddin, Syed | 100 | Seismic resilience assessment | [69] |
| 10 | Routray, Jayant Kumar | 100 | Seismic resilience assessment | [69] |
© 2020 by the author. Licensee MDPI, Basel, Switzerland. This article is an open access article distributed under the terms and conditions of the Creative Commons Attribution (CC BY) license (http://creativecommons.org/licenses/by/4.0/).
Share and Cite
MDPI and ACS Style
Sharifi, A. Urban Resilience Assessment: Mapping Knowledge Structure and Trends. Sustainability 2020, 12, 5918. https://0-doi-org.brum.beds.ac.uk/10.3390/su12155918
AMA Style
Sharifi A. Urban Resilience Assessment: Mapping Knowledge Structure and Trends. Sustainability. 2020; 12(15):5918. https://0-doi-org.brum.beds.ac.uk/10.3390/su12155918
Chicago/Turabian StyleSharifi, Ayyoob. 2020. "Urban Resilience Assessment: Mapping Knowledge Structure and Trends" Sustainability 12, no. 15: 5918. https://0-doi-org.brum.beds.ac.uk/10.3390/su12155918
Note that from the first issue of 2016, this journal uses article numbers instead of page numbers. See further details here.