Article

Can the Tragedy of the Commons be Avoided in Common-Pool Forage Resource Systems? An Application to Small-Holder Herding in the Semi-Arid Grazing Lands of Nigeria

by
Rhoda F. Aderinto
1,
J. Alfonso Ortega-S.
2,
Ambrose O. Anoruo
1,
Richard Machen
3 and
Benjamin L. Turner
4,*
1
Department of Agriculture, Agribusiness, and Environmental Science, Texas A&M University-Kingsville, Kingsville, TX 78363, USA
2
Department of Range and Wildlife Science and Caesar Kleberg Wildlife Research Institute, Texas A&M University-Kingsville, Kingsville, TX 78363, USA
3
Department of Animal Science and King Ranch® Institute for Ranch Management, Texas A&M University-Kingsville, Kingsville, TX 78363, USA
4
Department of Agriculture, Agribusiness, and Environmental Science and King Ranch® Institute for Ranch Management, Texas A&M University-Kingsville, Kingsville, TX 78363, USA
*
Author to whom correspondence should be addressed.
Sustainability 2020, 12(15), 5947; https://0-doi-org.brum.beds.ac.uk/10.3390/su12155947
Submission received: 24 June 2020 / Revised: 20 July 2020 / Accepted: 21 July 2020 / Published: 23 July 2020

Abstract

:
There exist common-pool resource systems where it is difficult to prevent prospective beneficiaries from receiving profits from the use or harvest of shared resources, and they are often subject to continual utilization, leading to resource degradation and economic erosion (a behavior known as the ‘tragedy of the commons’). Nigerian nomadic grazing systems currently undergoing the tragedy of the commons pose a great challenge to agrarian communities, herders and political stability throughout the country due to violent conflicts and property destruction as herders migrate in search of forage resources for livestock. We modeled these dynamics in order to better understand the Nigerian grazing lands, with the objective of identifying potential leverage points capable of reversing overgrazing-induced forage degradation, in order to ensure a sustainable livestock production sector. Model what-if experiments (crop restrictions, crop marketing and increased labor costs) were run, resulting in partial solutions that were effective only in the short-term or limited in geographic-scope. A sustainable solution should include a combination of strategies, as the impact of one strategy alone cannot effectively resolve these Nigerian grazing issues (e.g., collaboration between farmers, herdsmen and government stakeholders to increase market integration via crop market expansion while simultaneously providing forage regeneration time for grazing lands). The resulting model could be used by Nigerian policy-makers to evaluate the long-term effects of decisions which were previously unexplored.

1. Introduction

Grazing livestock are of central importance to rural livelihoods and economic conditions in developing countries, being assets to smallholders that provide a source of income, employment and family equity while simultaneously providing an important protein source for billions of people [1]. Livestock assets fulfill multiple roles for smallholders, including draught power, manure fertilizer, and milk and meat for consumption [2]. Population growth and rising incomes in sub-Saharan Africa will provide an economic incentive to grow livestock populations in order to meet protein needs and preferences. Sustainable development therefore requires that livestock numbers be balanced with forage carrying capacity, which means that the short-term economic motivations of smallholder herders to increase herd sizes must be tempered by the long-term ecosystem conservation efforts needed to sustain grazing productivity in the long-term. This poses a major challenge for sub-Saharan grassland-based livestock production, which has traditionally relied on open-access forage available to all smallholders, a form of common-pool resource system.
A common-pool resource (CPR) is a resource that is open and available to all users, such that users are not constrained in their access to and use of the resource [3], usage of the resource by one user reduces the availability of the resource for other users, and the prohibition of users is extremely difficult or impossible [4,5]. The exploitation of CPRs often leads to a behavior known as the ‘tragedy of the commons’ (TOC) [6]. The assumptions underlying TOC include: that individuals operate solely out of economic self-interest, that they are ‘free’ (i.e., there are no social, supra-individual limitations on individual choices), that the commons are not owned by anyone, and that each person’s rationality works against the ‘group rationality’ (since individual exploitation diminishes the cumulative long-term utility of the resource [7]). Population density has also been said to be the central variable in TOC, since overexploitation often occurs when the population density driving consumption rises above the natural regeneration rate of the resource base. Importantly, the environmental degradation resulting from TOC has been shown to be independent of social and historical context [7].
The TOC occurs in forage-based CPR systems due to exploitation by users via livestock overgrazing. These forage-based CPR problems become increasingly difficult to manage due to feedback between forage resources, animal performance and economic outcomes, and environmental factors such as temperature and rainfall that regulate forage growth [8]. Trade-offs exist between forage productivity and animal performance based on grazing intensity [9,10,11,12], as well as other factors such as diet selection, nutrient intake and growth stage [13,14,15,16,17,18,19,20,21]. Fluctuations in the timing and abundance of rainfall are the key limiting factors of sustainable livestock and biomass production in semi-arid sub-Saharan African savannahs [22], and have significant impacts on the hydrologic cycle and water quality of the region [23,24]. Continuous grazing can degrade the desired biomass during the foraging process due to increased selectivity [25], which may expose and erode topsoil and accelerate invasive species growth on sparsely covered or bare ground [15,26,27]. When forage biomass becomes lacking, animal intake becomes restricted and animal performance (typically measured in weight gained per unit area) declines. Due to the important role livestock play as critical assets for smallholders, reduced production threatens livelihoods and incentivizes herders to increase animal numbers to compensate for reduced animal performance, accelerating the vicious process of TOC as rangeland degradation due to overstocking continues [20,21,28,29,30].
In this study, we investigate the pressing forage-based CPR problem occurring in northern Nigeria due to excessive, long-term overgrazing using a system dynamics (SD) modeling approach to better understand the degradation dynamics occurring in Nigeria, and seek alternative strategies or policies that would assist in curtailing the livestock overgrazing problem. Our primary objectives were to: (1) determine the sensitivity of herders’ net worth to decreasing animal herd sizes; and (2) evaluate several what-if strategies aimed at sustaining forage productivity and equity amongst diverse right-holders that have not been explored. The SD approach facilitates deeper investigations of the systemic, root-causes of problems in order to recognize contributing factors that were originally not obvious [31,32], and is particularly useful when real-world experimentation would be too costly, take too long or be unethical (e.g., a challenge to smallholder livelihoods). We hypothesize that without greatly reducing herd size at the regional-level, negative externalities in forage resources, livestock performance and social outcomes would persist.

2. Materials and Methods

2.1. Study Area, Problem Background and Context

Nigeria is about 923,768 km² in size, and has the largest population of any African country (190.8 million). Located on the Gulf of Guinea, Nigeria largely remains an agricultural society, with roughly 70 percent of the population involved in agriculture and possessing generally small holdings [33,34]. Nigerian agriculture contributed 24% of its national gross domestic product in 2015 [33], which is expected to decline as economic growth in the nation continues to expand non-agricultural goods and services [33].
Livestock production is an integral part of agriculture in Nigeria, which has over 19.5 million cattle, 72.5 million goats, 41.3 million sheep, 7.1 million pigs and 28,000 camels [35,36]. About 90% of all Nigerian smallholder farmers own cattle and provide a significant locally sourced protein supply to the country [33,34,35,36]. A large portion of these smallholders reside in the northern region, which includes over 16 million hectares of savanna grazing lands in public reserve (i.e., publically owned land) with no distinct property rights [37,38], accounting for 80–85% of all forage production used as a CPR for livestock grazing [33].
Before the British Colonial Administration period, Nigerian cattle production was dominated by nomadic pastoralism, whereby herders would group their livestock into larger herds and collectively graze across the landscape in search of the most favorable forage and water conditions [39]. This form of grazing system remains the dominant practice in the northern region, which is an arid- to semi-arid region. The annual rainfall varies from 508–2032 mm, distributed between May to October, and the dry seasons span from November to April [23,24,33,40].
The depletion of CPRs and TOC in northern Nigeria has been a consistent growing concern among many stakeholders (local farmers and herders, local industry, government employees, etc.) over decades. In 1967, the Nigerian government, recognizing the need to develop the natural resource management capacity needed to preserve CPR grazing lands, partnered with the United States Bureau of Land Management (US-BLM) and the United States Agency for International Development (USAID) to develop a road map for private–public partnerships and livestock development on public lands that would be supported by rangeland research stations [37]. Unfortunately, due to political and financial pressure by those with vested livestock interests, the implementation occurred only in the short-term, which resulted in continued long-term degradation. The existing grazing laws and policies governing herding activities have been in place since independence (1960), but the monitoring and enforcement of these laws have been weak [37,41,42,43], accelerating TOC.
Long-term unrestricted access to forage with little to no penalty for overgrazing has incentivized the continued growth of nomadic cattle herds without accounting for forage availability or rangeland health (i.e., sustained stocking rates above the forage’s natural carrying capacity), resulting in severe overgrazing [44] (Figure 1). Coupled with recent droughts, herders have been forced to migrate their livestock to non-traditional grazing lands and croplands occupied by non-nomadic communities. Although grazing on or near croplands is prohibited, enforcement has not occurred [38]. With no other feed resource available, herdsmen have grazed their livestock through cultivated areas, consuming and destroying crops that provide the livelihoods of non-nomadic smallholder farmers. This has led to social conflicts between herders and farmers that have escalated to violent attacks and the loss of life. One contemporary source described the situation as follows:
“Stories of tragedy and economic loss persist for farmers in Nigeria as suspected Fulani herdsmen’s attack and destruction of lives and hectares of farmlands continue unabated. The cries of residents of the agrarian community have reached high heavens but the incessant attacks have remained a permanent pain… While some farmers came out of the attacks alive, some were not so lucky. They paid the supreme price for accommodating their fellow countrymen.” [45]
Despite legislative efforts to curtail the TOC and its unintended consequences, the land remains continuously grazed.

2.2. Model Overview

A system dynamics (SD) modeling approach was used to represent the key feedbacks between the smallholder herders’ total grazing animals, herders’ economic status, common forage availability, and the interaction between livestock and croplands in northern Nigeria. The models are mathematical representations of the mechanisms governing natural phenomenon that are not easily understood or managed [46,47]. This approach has been used in previous agricultural systems research, including natural resource, livestock production and grazing management problems [15,27,47,48,49,50,51,52,53,54], as well as Nigerian beef supply problems [55]. A mathematical SD model was constructed in the Vensim® modeling environment (Ventana Corp., Harvard, MA, USA) to link common forage, animal population, crops and the net worth of herders (stylized in Figure 2). The model time-step was one month (with a dt = 0.25), while the time horizon of the simulation was 50 years. A time-step of one month was chosen due to the seasonal variability in forage production and livestock grazing activities. The model was divided into four separate yet highly cohesive sections: common-pool forage dynamics, animal herd dynamics, crops dynamics and financial net worth. We followed an SD modeling process which will be described in detail in the following sections: (1) defining the objectives and dynamic hypothesis formation; (2) constructing the mathematical model; (3) model calibration for internal and behavioral consistency; (4) testing and evaluating alternative management strategies or policies aimed at resolving the problem.

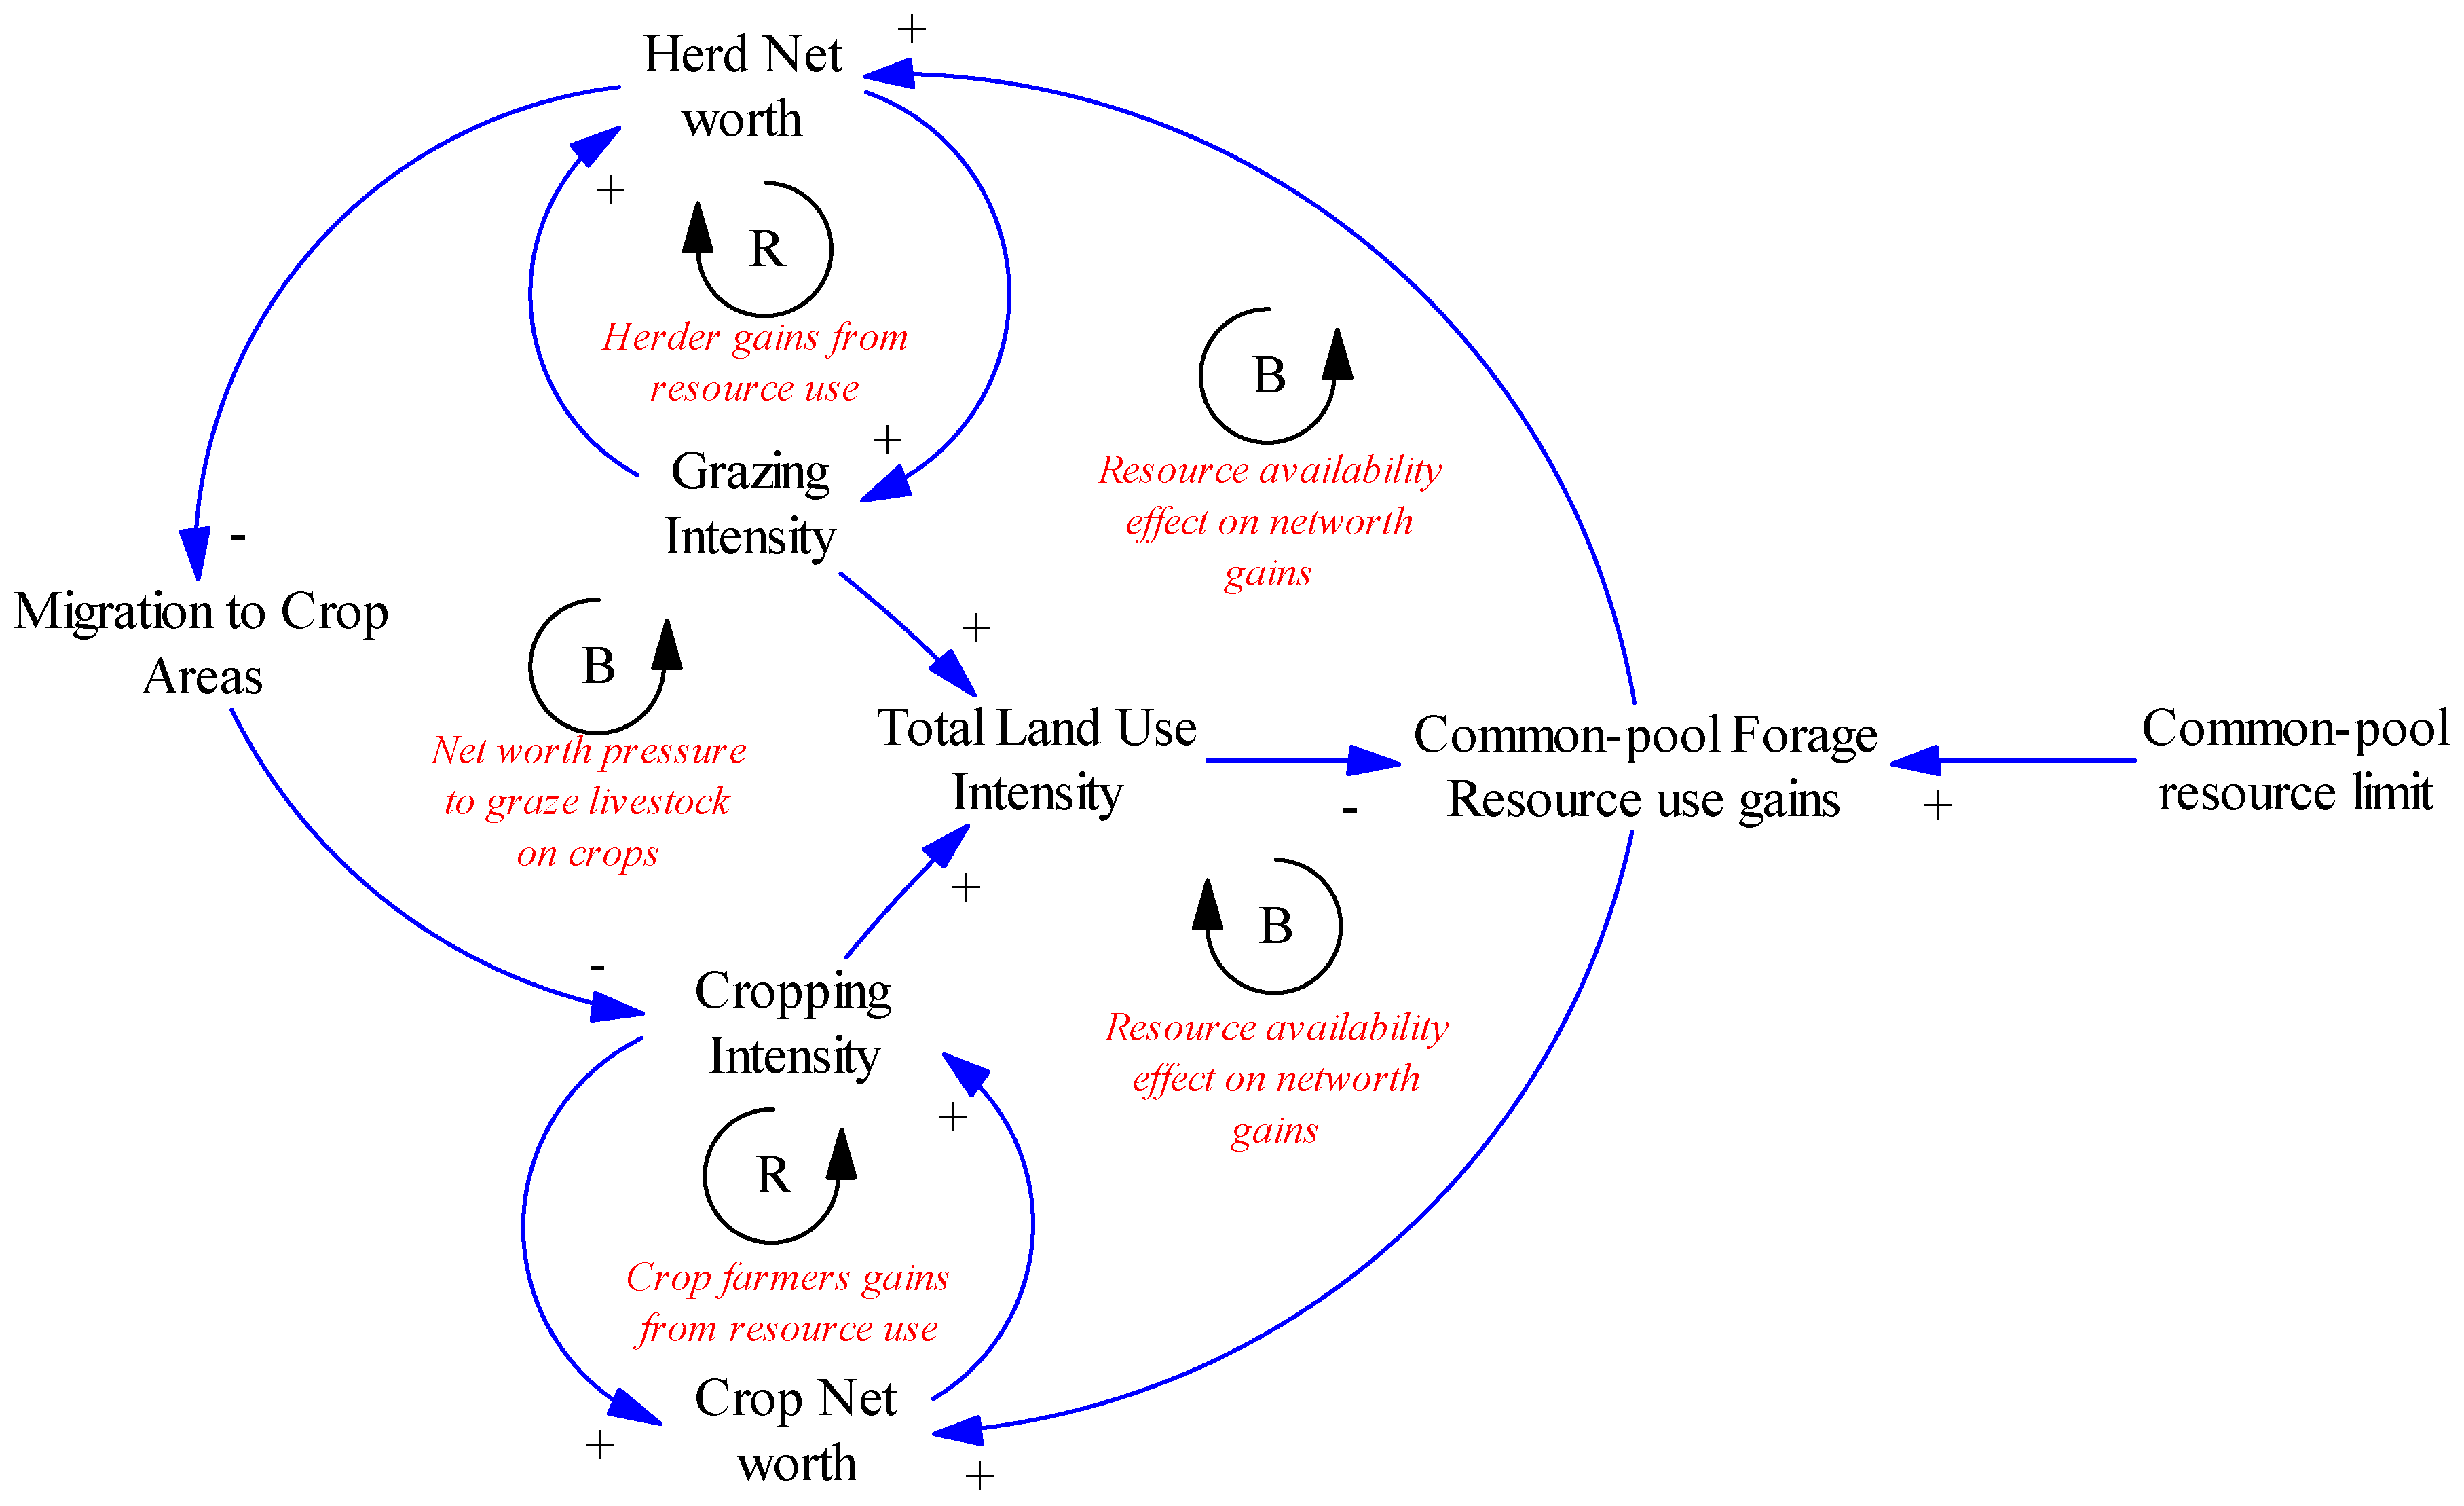
2.3. Statement of Objectives and Dynamic Hypothesis Formation

The primary model objectives were: (1) to determine the sensitivity of herders’ net worth to decreasing animal herd sizes; and (2) to evaluate the effectiveness of CPR management strategies aiming to sustain forage productivity and equity amongst diverse right-holders that have not been explored. With these objectives established, a dynamic hypothesis (defined as an operational theory of how the problem endogenously arose through its feedback structure [56]) was formed. The dynamic hypothesis for this project was as follows: Nigeria’s nomadic grazing system is currently posing a great challenge to the government and agrarian communities due to the management of open-access grazing by cattle herdsmen, who are adding animals to their herds to increase their net worth, causing severe rangeland degradation in the Nigerian uplands. This has resulted in depleted common-pool forage resources (i.e., forages are consumed at a faster rate than they can be replenished) on the rangeland. Herdsmen therefore seek feed resources elsewhere by moving their herds to graze nearby croplands or croplands in southern regions, severely destroying crops and killing the farmers who try to restrict grazing. This situation has resulted in serious conflicts, leading to social, economic and political tension. With no remedies to rangeland health, the problems are perpetuated via a vicious cycle of overgrazing forage resources, migration to croplands spurring conflict and tension, and re-migration back to depleted rangelands (Figure 2).

2.4. Quantitative Model Development

The model (stylized in Figure 2) was segmented into four separate but integrated parts. The common forage stock is the center piece which drives the number of animals that can graze, and also influences the production and livestock movement patterns (onto or off of grazing crops) annually. As animals graze common forage, the animals gain weight and are sold, which generates revenue and increases the herders’ net worth. Herders’ net worth determines the number of animal additions to be purchased and added to the stock of animals that are grazing the common forage area. As common forage diminishes and animal forage demand exceeds the available feed for weight gain, the herders’ revenue and net worth diminish. This pressures herders to move their herds to farmland forcing their livestock to begin crop grazing, thus increasing the available feed for weight gain and maintaining their revenue and net worth. Unfortunately, this comes at the cost (i.e., externalities) of destroyed land, property and the economic potential of farmers who have little-to-no crop production potential post-grazing events, insurance mechanisms to recover damages, or security authority to restrict grazing by livestock. Detailed structures of each component (forage, animals, net worth and crops) are described below and in Table A1.

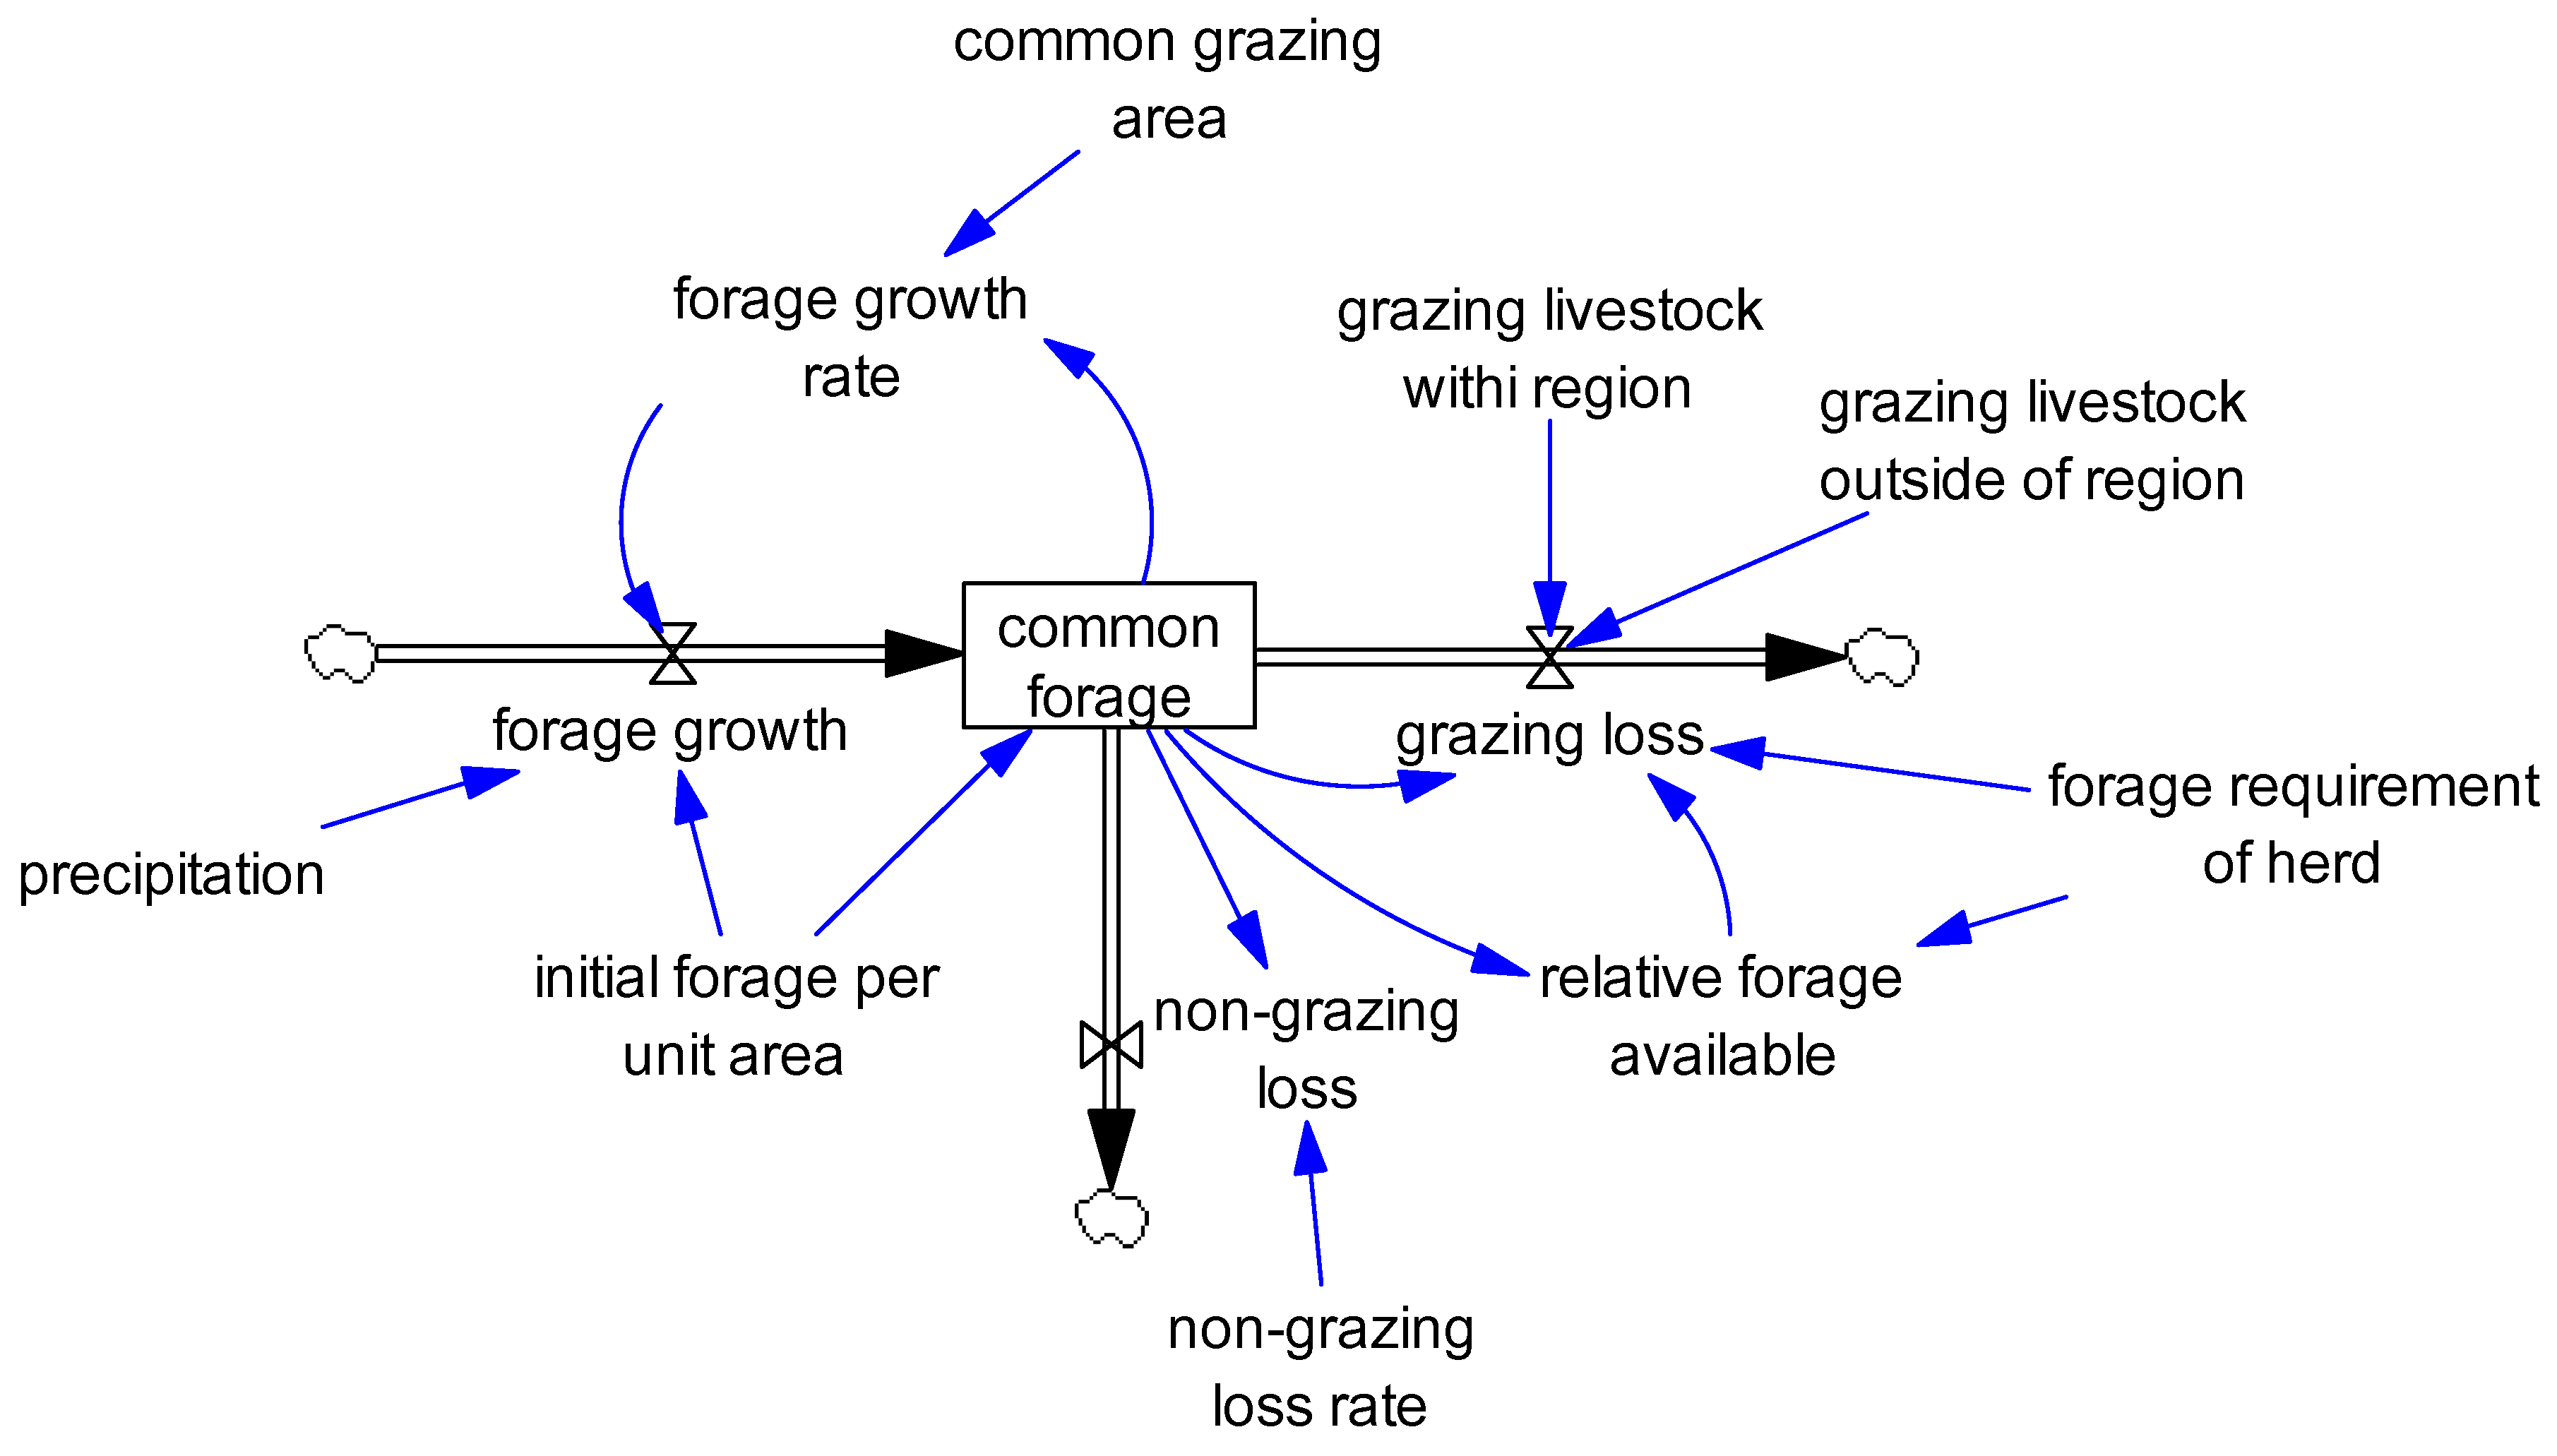
2.4.1. Forage Resource Dynamics

Forage resource dynamics (Figure 3) were characterized by the stock of common forage (initial forage per hectare = 400 kg), a function of forage growth, grazing loss and non-grazing loss. Contemporary research estimates of forage productivity and availability in this region are not available; therefore, we used data from a management study in northern Nigeria [37]. Monthly forage growth was a function of forage growth rate (a table function using the input common forage), initial forage per unit area and precipitation (normalized to mean precipitation = 1, a dimensionless scaler). The larger the stock of common forage, the slower the forage growth rate. If precipitation was lacking, the forage growth was reduced or stopped. In the case that common forage was reduced to zero (which mathematically precluded subsequent forage growth), the stock would be reset back to the initial forage per unit area when grazing loss stopped. Forage losses included grazing, where animal stocks were moved to graze on common forage according to the forage requirement of the herd and the relative forage available, and non-grazing losses (e.g., natural plant senescence).

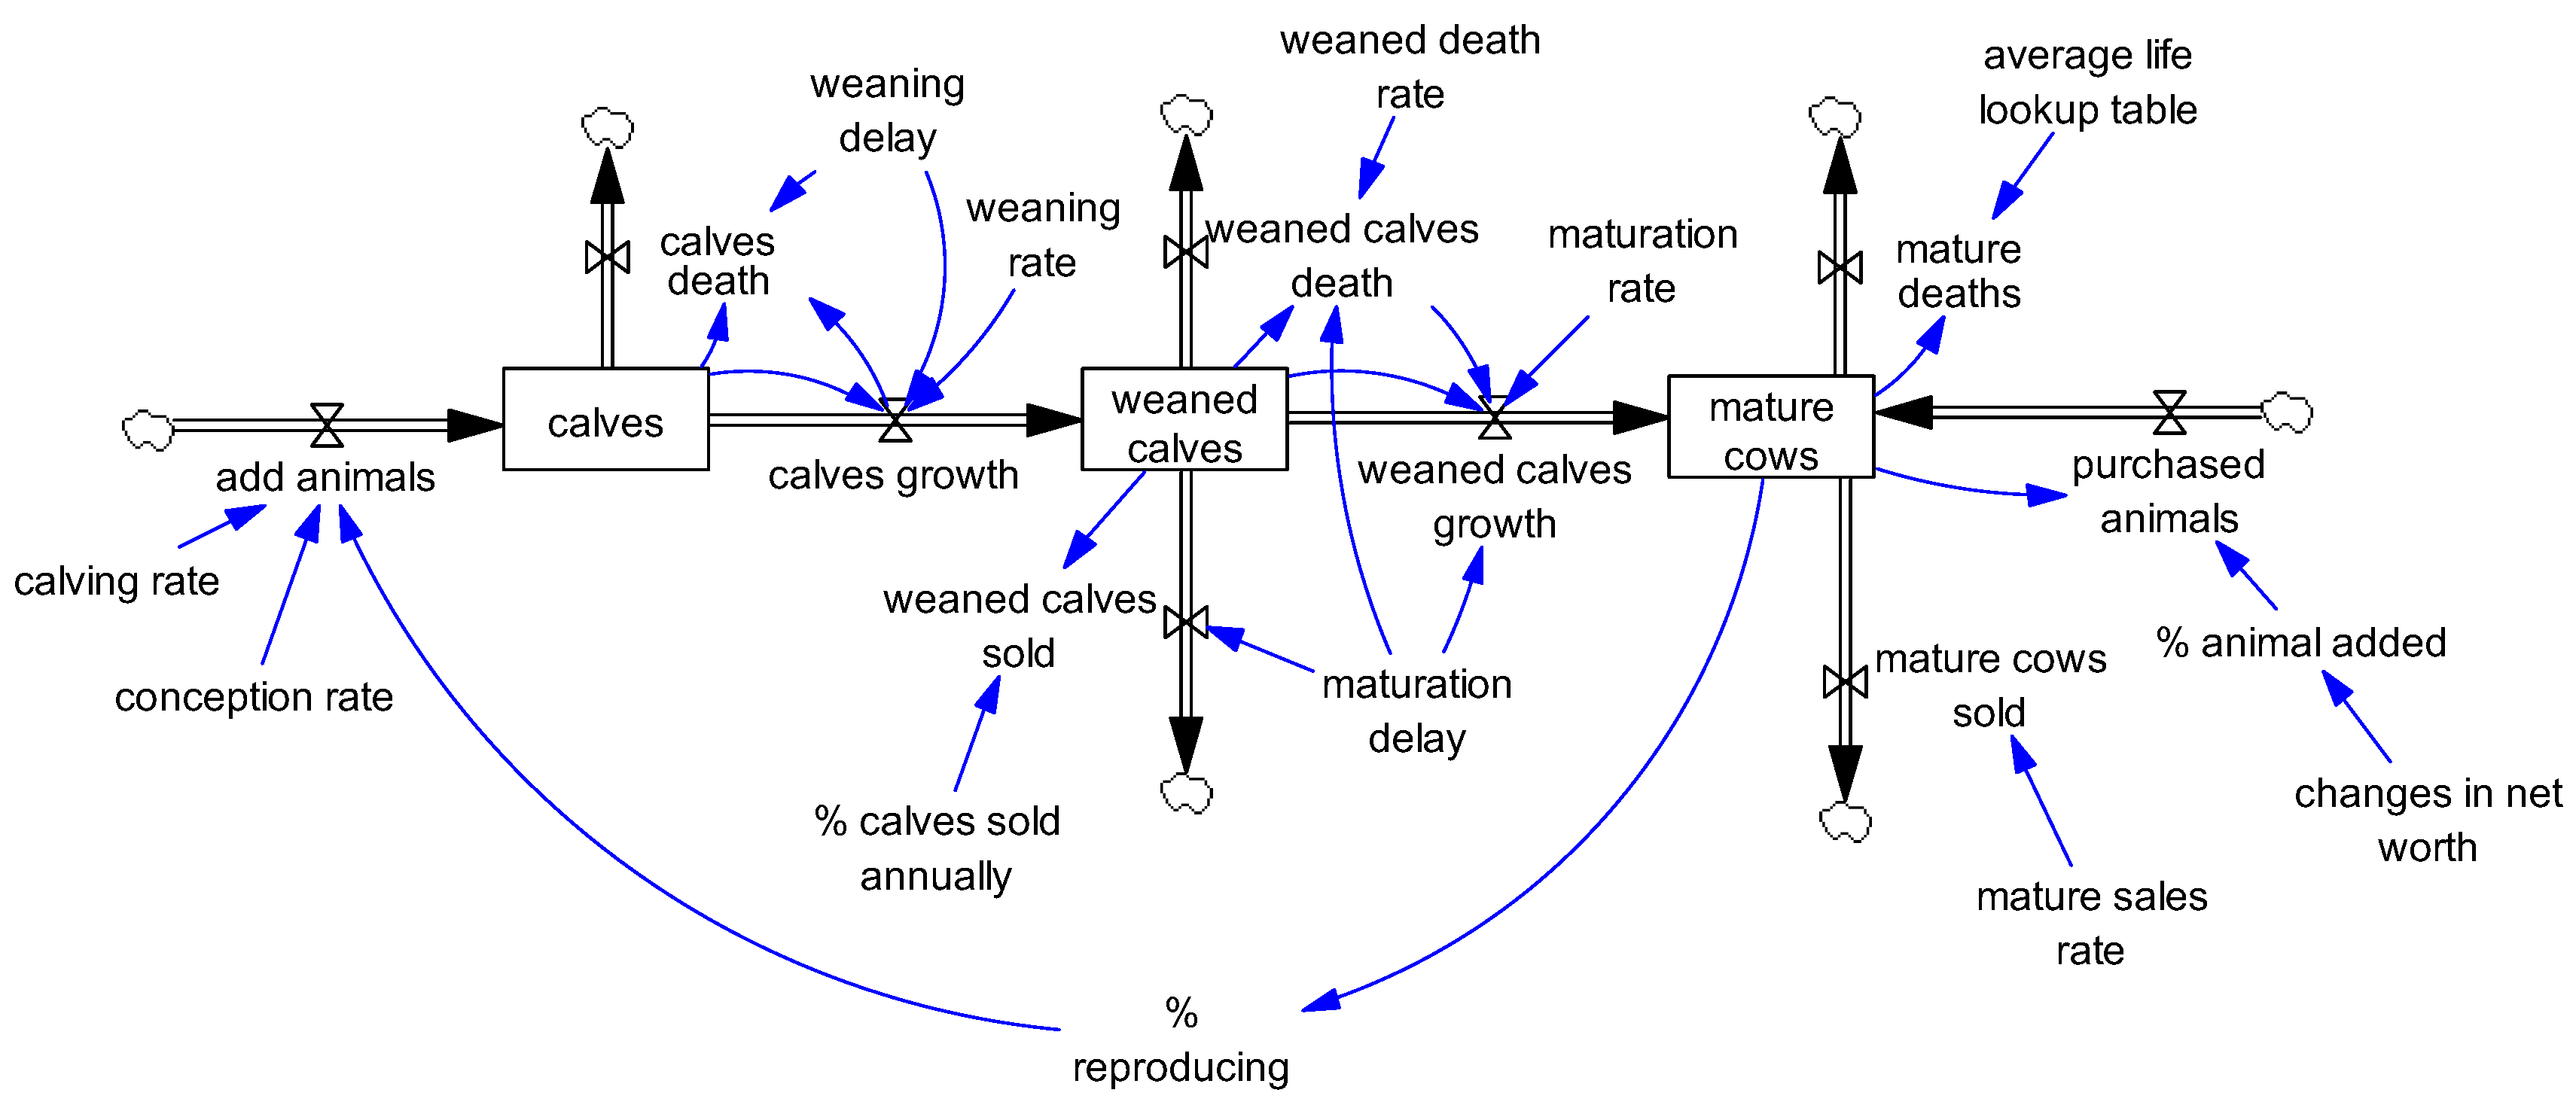
2.4.2. Cowherd Dynamics

The animal herd component shows the population of grazing animals, including calves, weaned calves and mature cows (Figure 4). Together, these make up the total animals in the grazing area. The forage requirement of the herd was calculated by multiplying the forage requirement per animal and the total animals in each age group of the population. The average animal weight drives the forage requirement per animal. The forage requirement per animal was calculated by multiplying average animal weight by the percentage of body weight forage demanded per day, scaled by days per month. The average animal weight was a function of weight gain and maintenance energy use. Weight gain was calculated by multiplying the maximum rate of weight gain by the average animal weight, and scaled by the weight gain index (the function of relative forage available), while maintenance energy use was calculated by multiplying the maintenance requirement rate by the average animal weight.
The stock of mature cows regulates the number of offspring produced, as well as the number of mature cows sold annually. The stock of mature animals has an initial value which reflects an equilibrium animal inventory. To begin the production cycle, the stock of mature cows are subject to a predetermined yet adjustable conception rate, and after a gestation period and applying a calving rate, calves are produced and are accounted for in the calves stock. With weaning delay accounted for, the calves stock exit either by calves’ death or calves growth to weaned calves. After the expected maturation delay, weaned calves exit one of three ways: (1) as weaned calves sold; (2) weaned calves deaths or; (3) weaned calves growth, which enter the mature cows stock. In total, 80% of weaned calves and 2% mature cows are sold annually to generate income. The order of animal sales is determined by a variety of factors, such as animal weight, feed availability, religious activity and the season of the year. Cows are first selected and kept for the reproduction and replacement of old cows, while some of the best performing (i.e., high weaning weight) calves are also kept for breeding. The majority of weaned calves are sold after six months. All of the weaned calves that reach maturity at eighteen months are considered for sale, and are moved into the main herd for reproductive purposes or transferred to herder’s children as inheritance.
All of the animals migrate together, continuously grazing the common forage unless the forage available becomes limiting and herders migrate to graze croplands. The number of mature cows sold was calculated by multiplying mature cows by the mature sales rate, a function of forage availability and changes in net worth. Besides mature cow sales, herders can also purchase animals via the percentage of animals to add, a function of net worth (increasing/decreasing net worth leads to increasing/decreasing purchase rate). These annual animal sales by herders in the Nigerian uplands drive the income and net worth function shown in the financial model and discussed in Section 2.4.4.

2.4.3. Cropland Production Dynamics

Crop production is performed in both the northern Nigerian uplands and the southern region by crop growers. Nigeria’s land tenure systems enable farmers to occupy or hold some area of land for farming activities. The Nigerian government does not have proper demarcation between the grazing land and the crop production land [37]. The farmers’ land holdings are also not demarcated or fenced to prevent intruders from grazing on crops. The crop growers in Nigeria practice subsistent farming, where manual tools are used in their cropping activities [33]. At the beginning of the crop production year, the crop stock (Figure 5) is accumulated by means of planting; planting is a function of the planting density and planting month. The plant growth is calculated by multiplying crops by growth index and scaled by precipitation forcing. Crops diminish by means of harvesting, where harvesting is calculated by multiplying crops by harvesting rate at the harvest month; grazing by livestock is a function of the crops available and forage requirements of the herd.
The Nigerian uplands are a semi-arid region with a seasonality of wet and dry periods; during the dry season, the region experiences times of inadequate rainfall volume and distribution [23,24]. This leads to lack of forage production, thereby reducing herder’s income and net worth. The herders, in an attempt to minimize their net worth loss, move their herds to graze croplands in their region. However, when conditions remain unfavorable, they move further away to graze crops outside the region (replicated from Figure 5). The herds feed on farm crops at the cost (i.e., externalities) of the destroyed land, property and other economic potential of farmers who have little-to-no crop production potential post-grazing events.

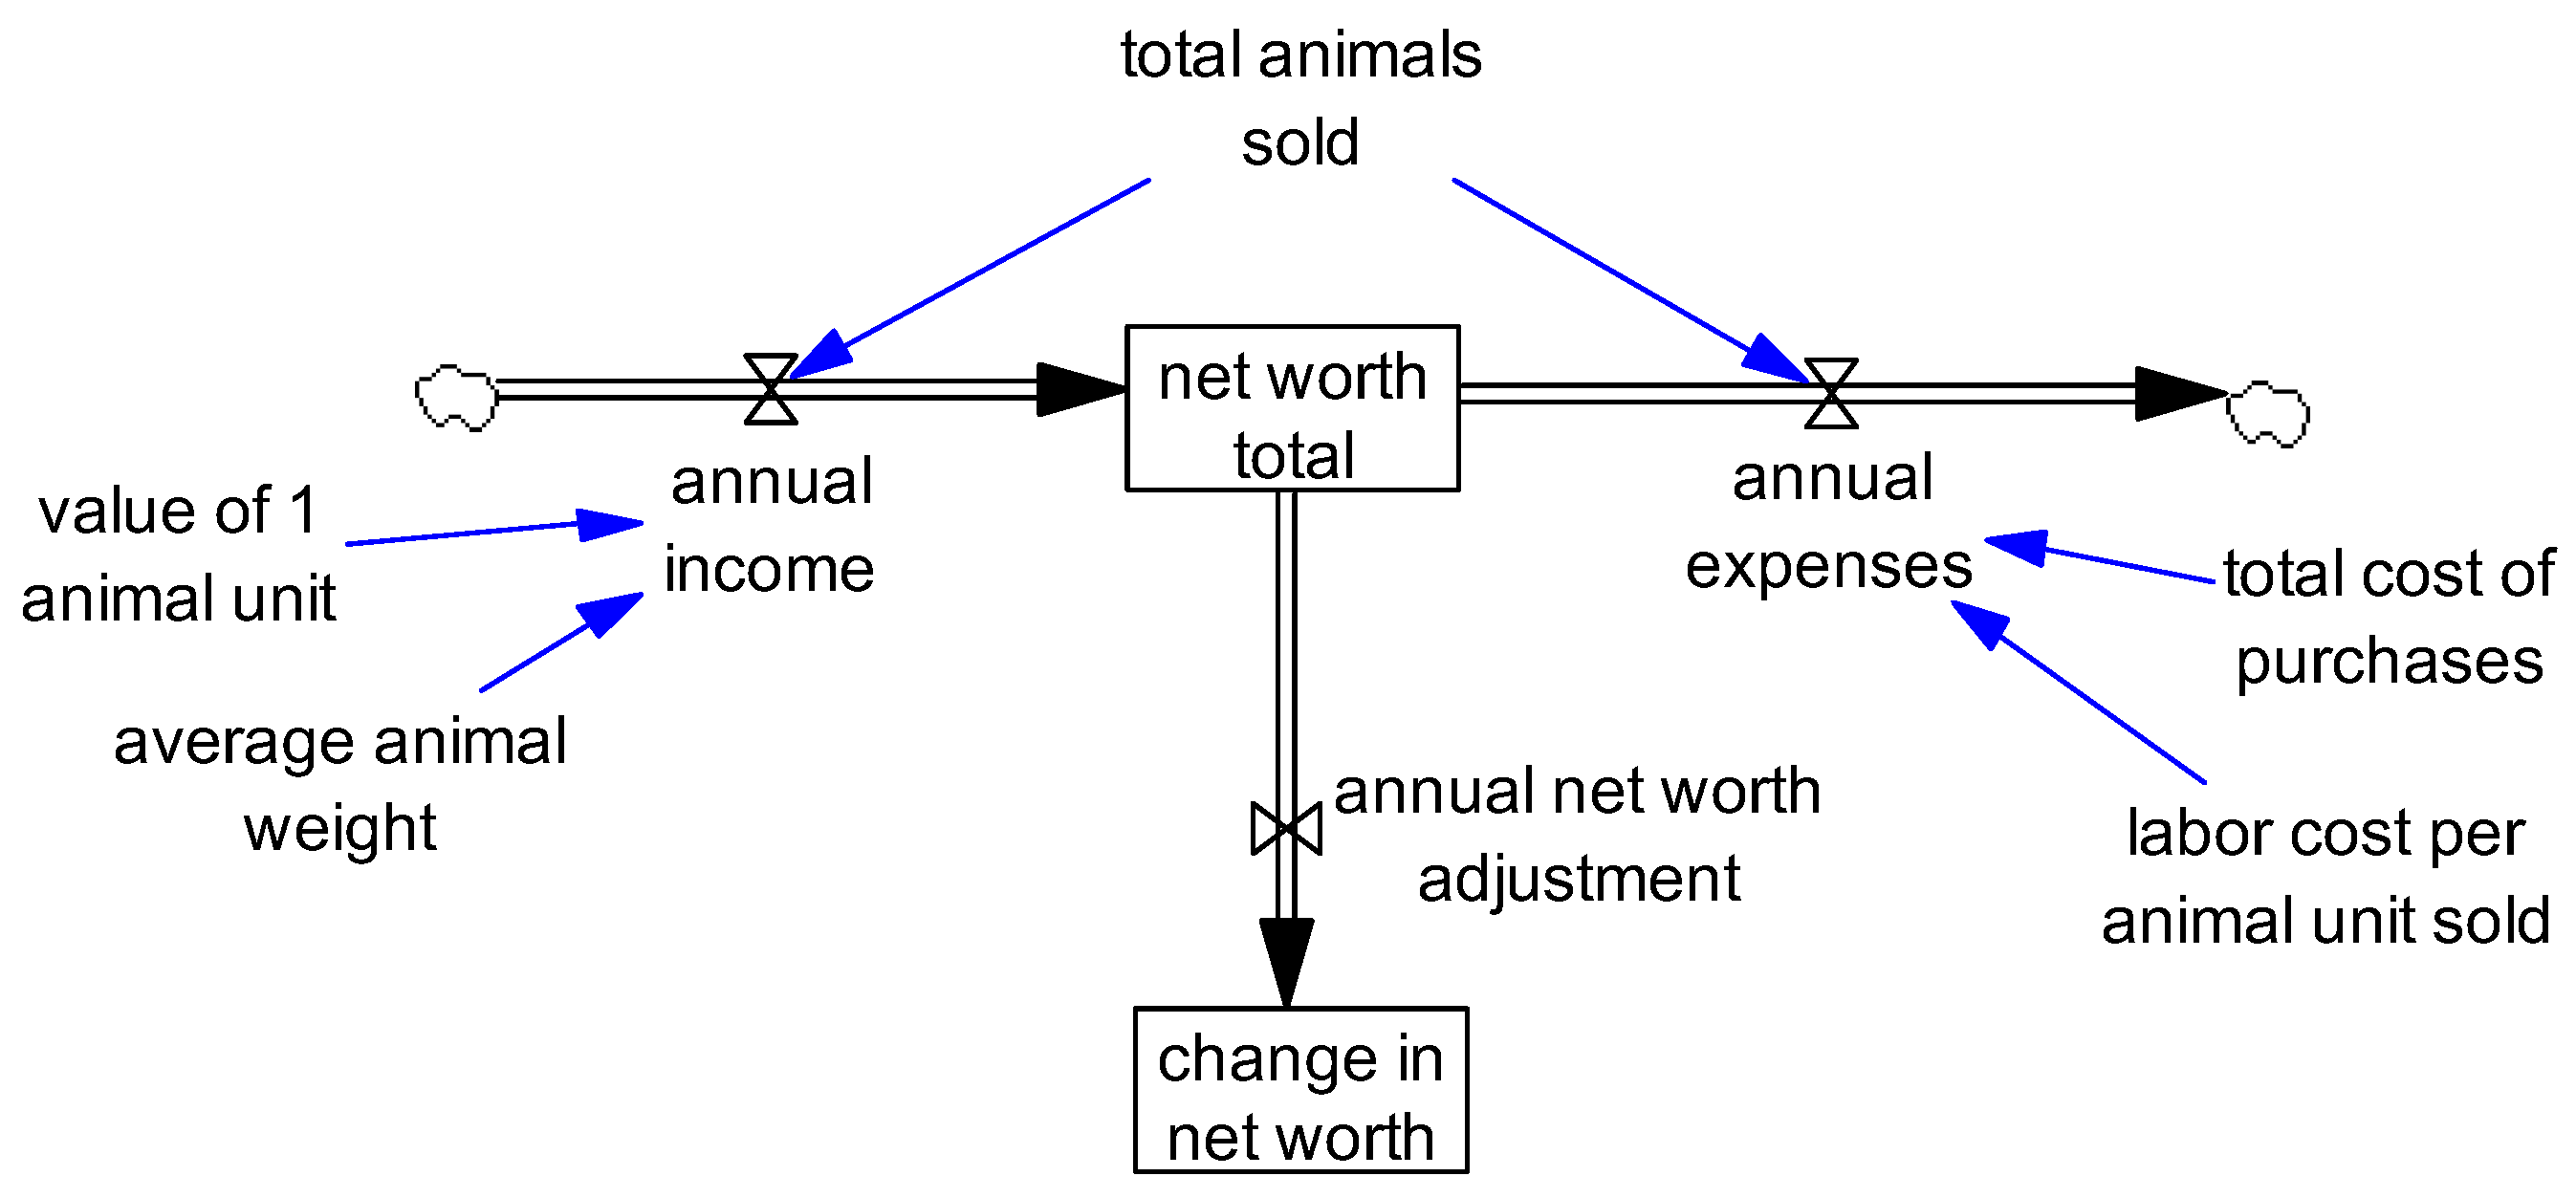
2.4.4. Financial Dynamics

The model’s financial component (Figure 6) captures changes in net worth given changes in livestock production. The central stock of the financial component is the net worth total (i.e., annual income minus annual expenses). The cash inflow (i.e., annual income) results from the total number of total animals sold (the sale of weaned calves and mature cows). Each unit of animals sold is multiplied by the value of one animal unit’s weight and the average animal weight to generate the annual income. The annual expense (i.e., cost of production) is calculated by multiplying total animals sold by labor cost per animal unit sold. The labor cost per animal unit sold is calculated by multiplying the average animal life by the labor per animal month (i.e., labor scaled by the total animal). There is no additional feed cost or transportation cost associated with livestock production due to the nomadic movement of cattle to common-pool forage or to supplement herds during times of forage depletion by grazing on the croplands of farmers. The model integrates net worth (income minus expenses) on a monthly basis. Net worth influences the forage requirement of the herd by driving the rates of change in livestock sales and purchases which alter the total number of grazing animals.

2.4.5. Model Data, Evaluation and Calibration

The model’s calibration involved estimating the parameter values in the model’s structure and obtaining data from the real-world system in order to tune the model for the accurate simulation of the dynamic hypothesis. The variables within each of the model’s four segments were matched as closely as possible to those of the current production system. The model’s initialization included forage production [33,37], animal production [33], and estimated crop production and net worth values (Table 1). Accessing data through Nigerian government agencies proved difficult. The data used for this research were collected from the Food and Agricultural Organization’s [33] report of various research on livestock and agricultural production in Nigeria. This has been a major limitation necessitating the use of estimated (model-driven) data for mathematical equation formulation. Nigerian rainfall and climate data were collected from the Nigerian Bureau of Statistics (NBS) website, as well as [23,24,40].
The assessment of the model’s output behavior patterns was a crucial and iterative step in finding flaws within the model’s structure. In order for the model to reproduce Nigerian uplands conditions, several series of tests were performed. During the calibration, adjustments were made to the percentage of livestock actively reproducing, calving percentage, conception and birthing rates, mortality percentages, and maturation delays, enabling the model to reach equilibrium using average precipitation data. The equilibrium animal herd size was determined to be 9.7 million head (Table 1), using the average forage production over 6 million hectares of grazing land (this is approximately 9.8 million head less than real system inventory, which is estimated to be 18–20 million head). In addition to animal herd calibration, the financials were also calibrated with the total number of herders and the herd size to mimic changes to herders’ cumulative net worth. Similarly to the calibration, the model must be evaluated and verified for its intended use. To facilitate the evaluation and verification of this model, consultation was made with herders and grazing experts in Nigeria, and core model structures were refined and corroborated with the objectives previously stated based on their feedback.

2.5. Experimental Simulations

2.5.1. Calibration Testing

Before what-if (policy) experiments were conducted, trust in the model had to be generated through testing to build confidence in the model’s structures and behaviors. Several calibration tests were conducted to test the internal and external validity of the model. The variables used for calibration included: precipitation (average precipitation versus the severe drought condition), the initial total of animals, the percentage animal added, the calving percentage and the percentage reproducing (used to arrive at equilibrium herd levels; Table 1). The model variables observed and used for the analysis included the total number of animals, common forage, total crop harvest, change in net worth and net worth total. The model was built using the average precipitation conditions and equilibrium herd sizes, which were then altered to replicate the grazing conditions in the Nigerian upland. The expected behavior pattern was the accelerated utilization of common forage and accelerated growth in total animals, resulting in positive growth in net worth. However, when common forage is fully utilized, herders will migrate their herds to graze on croplands, first locally in the region and then farther outside the region, in order to maintain herd size and net worth. To replicate the expected pattern of behavior, the model was adjusted by interpolation so that herders add a percentage of animals to the herd through new animal additions (i.e., animals added to the herd are a function of the change in herders net worth; up 15% for every $10 million increase in net worth). Two follow-up calibration tests were performed by stressing common forage to a drought condition and altering the calving rate of the reproducing cowherd. The objectives of the follow-up tests were to examine the responses of the animal herd given a reduction in the available forage resources or altered production characteristics.

2.5.2. What-If Scenarios

To achieve objectives 1 and 2: to determine the sensitivity of herder’s net worth due to decreasing the animal herd sizes and to identify the CPR management strategies (e.g., grazing and cropping land policies, labor policies, etc.) that share benefits equitably among the diverse right-holders, a number of what-if scenarios were designed and tested individually to the calibrated model. These what-if scenarios were developed based on contemporary hypotheses being suggested by Nigerian stakeholders and media at the onset of the recent conflicts (2017–2018) and through conversation with various experts in the field. First, livestock grazing was restricted from crop growing areas, in such a way that grazing could only be performed on common forage (using a switch to restrict animal movements to cropland). It was hypothesized that restrictions on cropland grazing would accelerate reductions in common forage and force total animal numbers to be brought in line with forage availability. Second, we instituted a crop marketing scenario where herders were allowed to buy crops from farmers in order to graze their herd when common forage is depleted. We hypothesize that, through crop marketing, the herders’ net worth total will reduce relative to the base (calibrated) case, hence lowering the percentage of animals added and the total animal numbers. Third, because herders move their animals with the help of their children and therefore pay nothing for labor costs, a labor scenario was simulated where the labor cost per animal unit sold was increased due to a number of potential policies, such as compulsory child education. The scenario increased the labor cost per animal month by increasing the dollars per hour of labor from $1.6 to $5. We hypothesize that herders’ annual expense will increase and thereby reduce their net worth total, thus reducing herd expansion. Lastly, a combination policy-test was run, where grazing on cropland was prohibited. However, a percentage of the crop harvest (1%) was bought by the Nigerian government and sold to herders needing to meet their livestock needs at a subsidized price (99% government-paid, 1% herder-paid). We hypothesize that restricting crop grazing and purchasing crops will benefit farmers, while the lower cost of feed supporting livestock will cause less harm to net worth and therefore changes in herd size. Since livestock nutritional needs could be met more cheaply through the subsidized program, herders would feel less financial pressure to continually expand their herds, giving forage resources more adequate time for recovery.

3. Results

3.1. Model Calibration

The relationships between the model stock variables were clearly illustrated in the resulting model behaviors. Initially, the stocks of common forage (Figure 7a), the total number of animals (Figure 7b), average animal weight (Figure 7c) and livestock grazing on crops (Figure 7e) were all in equilibrium, while the net worth total (Figure 7d) was growing linearly due to positive returns each year. The initial common forage and the total number of animals in the area (9.1 million) were balanced (Figure 7a,b; forage volume was adequate; therefore, animal movement to neighboring crop lands did not occur) as seen in crops grazed by livestock (Figure 7e; no crop grazing runs on the x-axis). To replicate the observed conditions (denoted ‘real-world’ in Figure 7), the percentage of animals added graphical function was added (Table 1). Under this scenario, dis-equilibrium conditions were created in the model, resulting in large shifts (a decrease) in common forage (Figure 7a) due to the increase in the total number of animals (Figure 7b). Because of the relative forage available to each animal, the average weights also declined (Figure 7c), as well as the total net worth (Figure 7d). Importantly, livestock grazing on crops (both in and out of the immediate region) became problematic around every 10 years due to declines in common forage availability, as forage regrowth could not sustain the additional forage demand (Figure 7e). Once forage availability recovered to the point to sustain livestock again, herds migrated off crop lands back to common forage. Because of the reduction in animal performance (mean animal weight), total net worth continued to increase, albeit more slowly than in the equilibrium simulation (Figure 7d, Table 2).
The second two tests for the model’s internal validity included simulation runs for an imposed drought and adjustment to the calving percentage. With the drought switch implemented from 120 to 140 months, forage growth was severely impacted (Figure 7a) and could not meet the animal demands (Figure 7b), requiring more animals to be sold or resulting in animal deaths, and without adequate forage growth, mean animal weights declined (Figure 7c). Lower animal performance during the years of drought reduced the slope of net worth to below the equilibrium case; however, after drought recovery, financial gains resumed (Figure 7d). Due to lack of common forage, the migration of animals to crop land became necessary (Figure 7e), but only for the period of the drought before common forage became available again. Adjusting the calving percentage (50% of the ordinary graphical function in Table 1) resulted in near equilibrium common forage, herd size and animal weight (Figure 7a–c); however, net worth declined relative to the equilibrium case due to fewer calves being sold each year (Figure 7e).
The model calibration results track with the realistic values commonly seen in the cattle production system in the Nigerian uplands. During the model’s calibration, consultations were made with herders and livestock industry professionals from the Nigerian uplands to better understand the expected patterns of behavior the model should produce. The feedback received informed the calibration process of the model, which—after the above tests—was deemed acceptable, given the reproduction of current grazing behaviors in the Nigerian uplands. Having calibrated the model to the real-world base-case, four other scenarios were tested to evaluate the impact of the hypothesized changes to Nigerian grazing policies through varying the policy and economic structure of the model.

3.2. What-If Tests

The ratio of forage supply to forage demand was balanced at 9.1 million head without further degradation due to opportunistic animal additions, and resulted in a net worth total that was $1.1 billion greater than the net worth when expanding herd sizes to 20 million head under the real-world replication (mean = 17.3 million head). Comparing the experimental results to the equilibrium simulation (Table 2) showed that the total number of animals increased to nearly 20 million head (in most simulations) before common forage was depleted by 17–84% (Table 2, Figure 8). Given this, animal numbers would need to be reduced at least 50–55% from current levels to sustain long-term forage productivity without adversely effecting herders’ financial net worth. The specific results of each policy scenario are described below.

3.2.1. Crop Restriction Scenario

The crop restriction scenario tested the impact of restricting livestock grazing on neighboring crop lands both in and out of the immediate grazing region. Restrictions were made in such a way that grazing could be performed on common forage only. It was hypothesized that restrictions on cropland grazing would eliminate cropland grazing, as well as reducing the common forage and total animals due to the increased reliance on common forage. Under the crop restriction scenario, common forage (Figure 8a, Table 2) continued to decline from 17 billion (2218.7 kg/hectare) to near total depletion (357.7 kg/hectare). The total number of animals increased from 13.5 million head to over 20 million head (from time = 0–95 months) before declining due to the lack of common forage availability needed to support grazing livestock (Figure 8b).
Because the degradation of common forage induced stress to livestock, average animal weight was severely reduced (Figure 8c). As the total number of animals and average weight declined, the potential for generating financial returns eroded, to the point that no new financial gains were achieved after the mid-point of the simulation (Figure 8d). Total crop harvest was at equilibrium (i.e., zero, shown along x-axis in Figure 8e) through the simulation period, since livestock were not permitted to graze crops.
The restriction of livestock grazing on cropland scenario showed that decision-making responses, when constrained by regulations, often worsen the problem the regulations were meant to solve. The hypothesis that restrictions on cropland grazing would reduce the common forage and the total number of animals in the region held true. However, in the long-term, the forage depletion problem was made worse by maintaining the total animal numbers at a greater level than what common forage could support, a result of the animal increases when positive financial gains occurred in the first decade of the simulation.
This scenario pointed to imminent range degradation if a permanent resolution was not sought. As illustrated, this scenario is a short term fix (fixes that fail) for crop growers, and it reiterates the existing CPR problems in the Nigerian uplands: (a) herders migrate farther away to graze livestock (i.e., although restrictions on crop grazing assume proper enforcement, this has yet to be seen in the real-world due to a lack of resource monitoring and enforcing existing regulations by the regulatory agencies); (b) local and regional conflict from grazing activity [i.e., total animal nutritional maintenance demand could not be met by common forage, which caused the animals to lose body condition to a minimum of 100 kg (Figure 8c); if the neighboring crop land were not grazed, the herders would likely simply migrate further away to other regions to graze their animals, which is a trigger for additional conflicts between herdsmen and farmers]; and (c) resource use maximization behavior among herders on common land [i.e., herders seek to maximize resource use on common land] does not allow forages to fully recover (i.e., grazing loss exceeded the total forage growth per month), especially whenever regulations or constraints are put in place to manage common-pool resources, which further reinforces the problem, exemplifying TOC.

3.2.2. Crop Marketing Scenario

As a way to minimize the accelerated degradation under the crop restriction scenario, a crop marketing test was run to evaluate the impact of market organization, such that herders would need to purchase feed from crop growers if they were to migrate away from common forage regions to graze on croplands (i.e., feed would be available for grazing at a cost, rather than exploiting for no-cost). Crop marketing revealed large changes in common forage levels (Figure 8a), while the total number of animals showed a heavily pronounced oscillatory behavior (Figure 8b), illustrating the feedback between common forage availability and animal additions (i.e., animal are added when forage is adequate, contrasted with massive reductions due to the cost of feeding when forage is not). Because the herd was more responsive to forage availability, the average animal weight oscillated between 300 and 400 kg (Figure 8c). Unfortunately, total net worth became negative (8d) due to the feed costs incurred, which could not be fully recovered.
We hypothesized that, through crop marketing, the herders’ net worth total will decline relative to the base-case, and hence the percentage of animals added and the total animal numbers would decline until animals and forage availability were balanced. It was observed that herders’ net worth did decline; however, herd sizes continued to exceed the common forage availability during favorable years, such that the necessity to migrate herds to croplands was only reinforced. This scenario was therefore only a temporary solution to the problem, and continued shifting the burden of rangeland degradation back to the farmers rather than the herders in the short-term (i.e., herders incurred debt due to paying for crop grazing, which reinforced financial pressure, herd expansion and migration back to croplands). This scenario would lead to additional problems in the long-term, such as: (a) economic loss and a reduction in the quality-of-life of herders because of negative net worth, which would lead to migration farther away to graze livestock in other regions whenever they are not able to afford payment for crops, thereby causing (b), increased regional conflict, a fall out of the migration of livestock to other, currently less affected, regions. Though crop growers would benefit from the sales to livestock herders, the crop marketing scenario reflected a regulation or intervention that would reinforce the problem (i.e., conflicts and community destruction) rather than resolve it, as observed in the model behavior.

3.2.3. Labor Restriction Scenario

Because herders move their animals with the help of their children and therefore have minimal labor expenses, a labor scenario was executed in such a way that the labor cost per animal unit sold was increased due to a number of potential policies (e.g., compulsory child education). Under this scenario, the labor cost was increased from $1.6 to $5 per hour. We hypothesized that the herders annual expense would increase and thereby reduce the net worth total, thus reducing herd expansion and providing relief to common forage. The results showed that the increased labor costs did not collapse common forage, but rather led to a long-term oscillation between common forage (Figure 8a) and the total number of animals (Figure 8b). A similar long-term oscillation was observed in average animal weight (Figure 8c), resulting from the relationship between forage availability and the total number of animals. Interestingly, even with the increased labor costs, net worth continued to increase (Figure 8d) and ended with a slightly higher value (3%) than the real-world calibration (Table 2). The hypothesis that herders’ annual expenses would increase to the point needed to induce a reduction in herd expansion was not held; thus, forage degradation continued. The labor scenario was shown to be an ineffective socio-economic solution; migration to graze livestock on crops would continue to be encouraged during forage shortages (and therefore induce economic loss to crop growers, Figure 8e). This would only reinforce, rather than dissolve, local and regional conflict.

3.2.4. Combination Policies

In attempts to overcome the failures of the previous policy-tests, we implemented a combination policy whereby a percentage of farmers’ crop harvest (1%) was bought by the Nigerian government and sold to herders at a reduced (subsidized) price (99% government-paid, 1% herder-paid). Rather than a policy ‘switch’ parameter value change at the beginning of the simulation, the policy conditions of the combination policy were not induced until the herders required assistance due to a lack of forage availability. As shown in the behavior-over-time graph, common forage becomes nearly depleted (Figure 8a), necessitating reductions in the total number of animals (Figure 8b). However, once feeding is required to maintain livestock (month = 95), the subsidized program is triggered at a cost of around $2 million to the government and $25,000 to the herders (Figure 8f). Although animal numbers were declining, the total number of animals does not collapse, as common forage is able to recover while crops met animal nutrient requirements (Figure 8a), resulting in a new equilibrium of the total number of animals between four and five million head (Figure 8b). Because common forage is able to recover, the average animal weights recover to between 500 and 600 kg (Figure 8c), which result in greater production and therefore net worth (Figure 8d). Unlike previous policy tests where herders were unconstrained to add animals, the annual cost of the safety net program was enough to offset the herd expansion rate, maintain the total number of animals, improve animal performance and achieve an ending net worth that was similar to the labor cost but with only one-third of the animals (Table 2). We hypothesized that this combination policy would benefit farmers and herders alike by providing a consistent market for farmers and a lower cost of feed for herders when faced with reductions in forage availability. The results corroborate this test; however, the model was extremely sensitive to changes in parameter values for the percentage of crop harvest (1%) and subsidy rates (99%). Sensitivity analyses revealed that the combination policy was successful for only a small range of harvest and subsidy rates (Figure A1).

4. Discussion

Rangeland degradation and common-pool resource (CPR) sustainability are major issues facing Nigeria. The Nigerian grazing problem, captured in our dynamic hypothesis (DH), was examined here using a system dynamics (SD) model, which accurately represented the cowherd dynamics, migration patterns and conflicts with cropland (agrarian) communities currently unfolding across Nigeria. Several what-if policy experiments were run in order to identify means by which grazing and livestock production could be improved. Leverage points, or places to intervene in a system where applying minimal pressure would have a large impact on the system as a whole [57], were sought to better inform local policy-makers. In terms of grazing management, one of the most influential leverage points is the stocking rate, and correctly managing the stocking rate is central to overcoming any particular grazing problem [12,15,58,59,60], including TOC.
The application of archival rainfall data for the prediction of forage production and forage quality is a cost-effective method for helping to adjust stocking rates [61,62,63]. Stocking rate adjustments provide a means to maintain forage reserves and mitigate drought risk and degradation from overgrazing by allowing an adequate plant recovery time post-herbivory [59,64]. Where rotational grazing is possible, increasing paddock numbers to permit short periods of grazing followed by sufficient plant recovery times can result in improvements to rangeland conditions and ecosystem functions [58,59,65,66]. The conservative management of rangelands can sustain or recover soil health and productive capability while simultaneously providing support for the delivery of diverse ecosystem services, including agricultural yields [67,68]. Equipping managers and smallholders to be able to make appropriate stocking rate decisions requires that scientific recommendations be compatible with the socioeconomic and decision-making processes of those involved [69,70,71,72].
Managing stocking rate in these ways may be effective in private land use systems, but in CPR systems, such as the Nigerian grazing lands, these approaches are less effective without concerted, coordinated effort amongst all resource users. Thus far, this has not been achieved in Nigeria, and simplified policy responses similar to those included in our model experiments are not robust enough to address the underlying structural (relational) causes driving degradation and TOC in Nigerian grazing lands. The short-term responses of the system to these simplified policy changes are often misleading due to the fact that longer-term and unintended consequences become unavoidable. For example, in the crop restriction scenario, croplands were preserved, but at the severe costs of degrading what common forage resources remained, further stressing herdsmen to the point that migrations would occur to regions outside of our model boundary (and potentially other countries) and spur the greater use of violence to maintain herder livelihoods. In the crop marketing scenario, farmers were compensated for damages, but the herdsmen’s net worth became a net loss rather than a gain. If this were to occur, the well-intentioned policy aimed at market development would spur still greater frustration among the herdsmen (e.g., the feeling of being taken advantage of for geopolitical, economic, or cultural/spiritual motivations), likely to lead to further retaliation against agrarian communities.
However, examples exist of successful long-term CPR management without resulting in TOC. Solving CPR problems requires two critically essential elements: (1) limiting or restricting access to the resource; and (2) creating incentives (e.g., the share of rights to resource uses) for users to invest in the resource rather than exploiting it [5]. Community organization and user-group unity has also been shown to be beneficial to sustained CPR systems [73]. Levine [74] showed that the majority of ancient evidence reveals that CPRs were carefully preserved through cohesion and community cooperation, sufficient to meet demands of population growth, closely self-controlled at the community level and protective of environmental quality. A key lesson is that managing the commons is essential, and can take many forms—such as self-supervision, participatory democracy, shared mutualism and local organization—in order to reinforce conservation ethics amongst users to mitigate against TOC [49,50,73,74]. These insights point to potential policy-alternatives that could improve the Nigerian grazing TOC by incorporating multiple perspectives and accounting for trade-offs among simplified policy responses (as described above). An effective sustainable solution should be a combination of different measures, because the impact of one scenario alone cannot resolve the Nigerian CPR problem. Our combination policy-test aimed to achieve this by representing a participatory, democratic, collaborative means of market integration whereby a public institution acts as a clearinghouse to purchase crops from farmers and redistribute them at a subsidized price back to herdsmen, thereby providing forage relief to the grazing system. In such a scheme, all parties would need to (1) contribute to an annual fund that would ensure the viability of the clearinghouse (i.e., the farmers’ customer) and the solvency of the public subsidy (i.e., so that herdsmen’s net worth is not so diminished that they resort to violence, thus undermining the agreement) and (2) elect local representatives to negotiate use in times of stress (particularly drought). Similar approaches have been used in CPR water agreements, where all of the users contribute to an annual fund that maintains the infrastructure needed to deliver water, and all users benefit from and elect local leaders to negotiate water-sharing agreements during drought years [47,50].
Another important insight from research on CPR systems and overcoming TOC problems is that the decision-making processes of resource users (e.g., the criteria used for changing herd sizes) is often more important than simple biophysical strategies aimed at conserving CPR dynamics (i.e., collective, local and flexible decision-making frameworks often outperform static resource use adjustments; in this case, simply forcing a reduction in the stocking rate). The conscious education and training of stakeholders on the forage system’s dynamics and the links to agrarian communities is central to the sustainability of both. Socio-psychological factors (e.g., cooperativeness) and the presence of the non-profit institutional monitoring and managing of the CPR grazing lands could enhance the success of resource sustainability efforts without top-level regulations in the region (which the first three what-if scenarios represented). These scenarios partially addressed the Nigerian TOC grazing problem, but government incentives should also be put into place in order to encourage herders to avoid the full depletion of forage by not continually increasing livestock numbers (e.g., CPR grazing lands preservation incentives such as rewards for good land stewardship).

Model Strengths, Weaknesses and Possible Extensions

In general, the SD model was able to integrate the various segments of the CPR forage and livestock system in northern Nigeria. Although the model fit the purpose and objectives we aimed to capture, the inclusion of livestock marketing dynamics would make for a more complete representation of the Nigerian cattle industry. The current results also did not account for wide variations in climate, specifically in times of drought. The Nigerian uplands are semi-arid regions which experience wide variations in precipitation. The model’s calibration used average annual precipitation for all of the simulations (except during the drought calibration test). Extreme precipitation was not tested in any of the what-if scenarios. If it were, the results would be an extreme decline in common forage and total crop harvest, and therefore a reduced total number of animals and net worth total, because the scenario results observed for the analysis were generated with average annual precipitation, rather than the precipitation fluctuations and seasonality which are characteristic of the region. Lastly, the crop model assumed the production of only one crop in the system, which is not reflective of the real system due to varying crops, growing seasons and production potentials. The determination and inclusion of actual stocking rate and carrying capacity field experiment data in the model’s structure would also be helpful for the proper representation of cattle production in the Nigerian uplands. A more precise estimation of production and maintenance requirements of the livestock in the region could also be determined and improved. Lastly, the rate of animal additions and sales also needs to be determined with market (field) data in the region. Unfortunately, much of the needed field-level data for the forage, livestock and decision-making currently does not exist.

5. Conclusions

Nigerian nomadic grazing problems pose a great challenge to the government and agrarian communities due to the prevailing management practice of open-access grazing by herdsmen. Herd additions by herders to increase their net worth cause severe rangeland degradation and depleted CPR forages, resulting in serious conflict, crop destruction and the loss of life (in particular), and increased social, economic and political tension (in general). We modeled the problem using system dynamics and evaluated a series of what-if policy experiments in order to understand the degradation dynamics and identify possible high-leverage policies to reverse the situation. Three what-if scenarios (i.e., crop restriction, crop marketing and increased labor costs) resulted in only partial solutions, and were very short-term in nature and/or limited in geographic scope. An effective sustainable solution could be a combination of different measures, because the impact of one scenario alone could not effectively resolve the problem. For example, collaboration between herdsmen, farmers and government agencies for market integration could lead to more consistent markets for farmers, lower feed costs and greater common forage recovery times for herdsman, and less political turmoil and violence that stresses government emergency response efforts. Understanding these dynamics and the underlying system of forage, crops, animals and people illustrates the importance of matching the stocking rate to the carrying capacity, and the potential value that collaboration and cooperation among stakeholders could have in achieving sustainable, equitable outcomes in the region. The system dynamics model can be used to test the impact of alternative management decisions on Nigerian grazing lands not explored here (e.g., alternative drought mitigation strategies or social policies). In addition, the model’s structure provides an educational tool that can be used to better understand the feedback processes and dynamics operating within CPR systems; more specifically, it can be used to understand and communicate the complexity of Nigerian cattle production problems. Raising awareness that increasing animal numbers beyond that level which can sustainably graze in the region has negative effects on rangeland health (i.e., common forage sustainability), net worth totals, crop harvest and the total number of grazing animals is critically important. More importantly, understanding the structure that drives these behaviors is not an easy task, but is an essential one for local stakeholders and policy-makers. The purpose of this model was to fill the void and provide a new and unique tool with which the Nigerian cattle production system could be evaluated. Future research and modeling work is needed in the common-pool resource management fields, especially in Sub-Saharan African regions, pertaining to ecosystem service provisions, small holder livelihoods, and the interactions and tradeoffs between ecosystem conservation and livestock animal production needed for policy-makers to balance food supply with a changing demand [55].

Author Contributions

Conceptualization, R.F.A. and B.L.T.; methodology, R.F.A. and B.L.T.; software, B.L.T.; investigation, R.F.A.; writing—original draft preparation, R.F.A.; writing—review and editing, R.F.A., B.L.T., J.A.O.-S., A.O.A. and R.M.; visualization, R.F.A.; project administration, B.L.T., J.A.O.-S., A.O.A. and R.M. All authors have read and agreed to the published version of the manuscript.

Funding

This research received no external funding.

Acknowledgments

This work was partially supported by the Norman Borlaug Fellowship in Global Food Security (for R. Aderinto). We also thank Funsho Oluwunmi and Taiye Adewuyi, FMARD, for their helpful feedback during the model development phase.

Conflicts of Interest

The authors declare no conflict of interest.

Appendix A

Table A1. Summary of key model equations used in Vensim PLE to capture cow herd, common forage, crop and financial components. ‘Aux’ represents auxiliary variables, while ‘dmnl’ represents dimensionless variables (e.g., a percentage or ratio). Equations have kept the form of their Vensim programming language for easy model replication.
S/NVariableEquationUnitType
1$ per hour”1.6dollars/hrsAux.
2“percent animals added”WITH LOOKUP (Change in Net-worthXdollar conversion, ([(0,0)–(1e+008, 0.2)],(0,0),(1e+008, 0)))DmnlAux.
3“percent cows of total sales”Mature Cow Sold/Total Animal SoldDmnlAux.
4“percent of body weight forage demanded”0.0251/day/hdAux.
5“percent reproducing”(Weaned Calves*assumed annual maturation rate) + Mature CowsDmnlAux.
6“percent weaned of total sales”Weaned Calve Sold/Total Animal SoldDmnlAux.
7hectare conversion1hectareAux.
8Add AnimalIF THEN ELSE (Month counter = 3, “percent reproducing”*conception rate*Calving rate, 0)hd/MonthInflow
9adjusted relative forage for livestock(((Common Forage+Crop within region+Crop outside region)/month conversion)/(Forage requirement of herd))*kg conversion/month conversionkg/MonthAux.
10Adjustment to LaborLabor/TIME STEPdollars/MonthOutflow
11animal weight resetIF THEN ELSE (Month counter = 12, Ave animal weight, 0)Kg/MonthOutflow
11Annual expenses(((Total Animal SoldXlabor cost per animal unit sold)*month conversion) + Total cost of purchases)/month conversiondollars/MonthOutflow
12Annual income(Value of 1 animal unit weight)*(Ave animal weight/kg conversion) × (Total Animal Sold/hd conversion)dollars/MonthInflow
13assumed annual maturation rate0.1685DmnlAux.
14assumed annual weaning rate0.85DmnlAux.
15Ave animal weightINTEG (Weight gain-Weight loss, Initial weight of animal)kgStock
16average life lookupWITH LOOKUP (adjusted relative forage for livestock,([(0,0)–(5,200)],(0,46),(5,112)))MonthAux.
17Average rainfall 11inchesAux.
18average time invested per head(“percent cows of total sales”*average life lookup) + (“percent weaned of total sales”*maturation delay)MonthAux.
19CalvesINTEG (Add Animal-Calves Death-Calves Growth, initial total animals in area*”initial calves percent”)hdStock
20Calves Death(Calves-Calves Growth*month conversion)/weaning delayhd/MonthOutflow
21Calves Growth(Calves*Weaning rate)/weaning delayhd/MonthInflow
22Calving rate0.8hd/MonthAux.
23Change in LaborHour required per herd*”$ per hour”*total number of herdersdollars/MonthInflow
24Common ForageINTEG (Forage growth-Grazing loss-Non grazing loss, initial total forage)kgStock
25Common grazing area15,000,000hectareAux.
26Conception rate0.8DmnlAux.
27Crop area outside the region5,000,000hectareAux.
28Crop area within the region10,000,000hectareAux.
29Crop outside regionINTEG (Growth outside+Planting outside-grazing by livestock outside region-Harvest outside,0)kgStock
30crop per hectare outside regionCrop outside region/Crop area outside the regionkg/hectareAux.
31crop per hectare within regionCrop within region/Crop area within the regionkg/hectareAux.
32Crop within regionINTEG (Growth within+Planting within-grazing by livestock within region-Harvest within, 0)kgStock
33Crops available for harvest outsideCrop outside region/(kg conversion/Forage requirement of herd)kg/MonthAux.
34Crops available for harvest within(Crop within region)/(kg conversion/Forage requirement of herd)kg/MonthAux.
35“days/month”30kg/MonthAux.
36dollar conversion11/dollarsAux.
37drought switch0DmnlAux.
38FINAL TIME 600MonthAux.
39Forage growthIF THEN ELSE (Common Forage/hectare conversion > initial forage per hectare,(Forage growth rate*(Common Forage)*(Precipitation/inche conversion)/month conversion),((initial total forage)*Forage growth rate*(Precipitation/inche conversion)/month conversion))Kg/MonthInflow
40Forage growth rateWITH LOOKUP (Common Forage/common grazing area, ([(100,0)–(1200,1)], (100,1), (200,0.975), (300,0.9), (400,0.8), (500,0.7), (600,0.6), (700,0.5), (800,0.4), (900,0.3), (1000,0.2), (1100,0.1), (1200,0)))DmnlAux.
41forage per hectareCommon Forage/common grazing areakg/hectareAux.
42Forage requirement of herdForage requirement per animal*(Total Animal)kg/MonthAux.
43Forage requirement per animalAve animal weightX”percent of body weight forage demanded”*”days/month”kg/(MonthXhd)Aux.
44grazing by livestock outside regionGrazing on crops outside the regionkg/MonthAux.
45grazing by livestock within regionGrazing on crops within the regionkg/MonthAux.
46Grazing lossIF THEN ELSE(Common Forage/month conversion > Forage requirement of herd, Forage requirement of herd, MAX((((Common Forage/month conversion)/Forage requirement of herd)*Forage requirement of herd)-grazing by livestock outside region-grazing by livestock within region, 0))kg/MonthOutflow
47Grazing on crops outside the regionIF THEN ELSE (Forage requirement of herd > ((Crop within region + Common Forage)/month conversion), MIN(Forage requirement of herd-(Crop within region-Common Forage)/month conversion, Crop outside region/month conversion), 0)kg/MonthAux.
48Grazing on crops within the regionIF THEN ELSE (Forage requirement of herd > ((Common Forage*sensitivity of herders to forage availability)/month conversion), MIN(ABS((Forage requirement of herd-(Common Forage/month conversion))),Crop within region/month conversion), 0)kg/MonthAux.
49Growth index outsideWITH LOOKUP (crop per hectare outside region, ([(0,0)–(7000, 0.9)],(0,0.9),(2568.81,0.264474),(7000, 0)))DmnlAux.
50Growth index withinWITH LOOKUP (crop per hectare within region, ([(0,0)–(3500, 0.8)],(0,0.75),(1498.47,0.319298),(3500, 0)))DmnlAux.
51Growth outsideIF THEN ELSE(Month counter=Harvest month outside, 0, Growth index outsideX(Precipitation/inche conversion)X(Crop outside region/month conversion))kg/MonthInflow
52Growth withinIF THEN ELSE(Month counter=Harvest month within, 0, Growth index withinX(Precipitation/inche conversion)*(Crop within region/month conversion))kg/MonthInflow
53Harvest month outside11MonthAux.
54Harvest month within11MonthAux.
55Harvest outsideIF THEN ELSE(Month counter = Harvest month outside, Crop outside region/TIME STEP, 0)kg/MonthOutflow
56Harvest withinIF THEN ELSE(Month counter = Harvest month within, Crop within region/TIME STEP, 0)kg/MonthOutflow
57hd conversion1hdAux.
58Hour required per herd240hrs/Month/personAux.
59hrs conversion1hrsAux.
60inche conversion1inchesAux.
61“initial calves percent”0.01DmnlAux.
62initial forage per hectare1000Kg/hectareAux.
63“initial mature percent”1-”initial calves percent”-”initial weaned percent”DmnlAux.
64INITIAL TIME 0MonthAux.
65initial total animals in area9,700,000hdAux.
66initial total foragecommon grazing areaXinitial forage per hectarekgAux.
67“initial weaned percent”0.05DmnlAux.
68Initial weight of animal75kgAux.
69kg conversion1kgAux.
70LaborINTEG (Change in Labor-Adjustment to Labor,2)dollarsStock
71labor cost per animal unit soldlabor per animal monthXaverage time invested per headdollars/hdAux.
72labor per animal month(Labor/Total Animal)/month conversiondollars/(hdX
Month)
Aux.
73Maintenance requirements0.025DmnlAux.
74maturation delay18MonthAux.
75Maturation rateassumed annual maturation rateDmnlAux.
76Mature Cow Sold(Mature CowsXmature sales rate)/month conversionhd/MonthOutflow
77Mature Cows= INTEG ((((Purchased animals+Weaned Calve Growth)*month conversion)-(Mature Cow Sold
*month conversion)-(Mature Death*month conversion))/month conversion, initial total animals in area*”initial mature percent”)
hdStock
78Mature DeathMature Cows/average life lookuphd/MonthOutflow
79mature sales rate0.00167
0.00167 = 2 percent per year
DmnlAux.
80Max rate of weight gainWITH LOOKUP (Ave animal weight, ([(75,0)–(700,2)],(75,1.13),(320,1),(330,0.875),(340,0.75),(350,0.625),(360,0.5),(370,0.375),(380,0.25),(390,0.125),(400,0.1),(700,0)))kg/MonthAux.
81month conversion1MonthAux.
82Month counterMODULO(Time, 12)MonthAux.
83Net-worth totalINTEG (Annual income-Annual expenses,1000000000)dollarsStock
84Non grazing lossIF THEN ELSE (Month counter > 2:AND: Month counter < 11, 0, Non grazing loss rate*Common Forage)kg/MonthOutflow
85Non grazing loss rate0.21/MonthAux.
86onset of droughtWITH LOOKUP (Time, ([(0,0)–(600, 2)],(0,1),(159.633,0.921053),(201.835,0.719298),(220.183,0.394737),(244.037,0.833333),(288.073,0.938596),(339.45,0.958772),(420.183,0.975),(455.046,0.985088),(477.064,0.99386),(600, 1)))MonthAux.
87planting density outside100DmnlAux.
88planting density within100DmnlAux.
89planting month outside3MonthAux.
90planting month within3MonthAux.
91Planting outsideIF THEN ELSE(Month counter = planting month outside, (planting density outside/TIME STEP)X(Crop area outside the region/hectare conversion)*(kg conversion), 0)kg/MonthInflow
92Planting withinIF THEN ELSE(Month counter=planting month within, (planting density within/TIME STEP)*(Crop area within the region/hectare conversion)*(kg conversion), 0)kg/MonthInflow
93PrecipitationIF THEN ELSE (drought switch = 0, Average rainfall 1*(1 + random distribution), Average rainfall 1*(1 + random distribution)*(onset of drought/month conversion))inchesAux.
94Purchased animals(“percent animals added”*Mature Cows)/month conversionhd/MonthInflow
95random distributionRANDOM UNIFORM(−0.25, 0.25, 2589)DmnlAux.
96Relative Forage availablekg conversion/(Common Forage/Forage requirement of herd)kg/MonthAux.
97SAVEPERTIME STEPMonthAux.
98sensitivity of herders to forage availability1DmnlAux.
99TIME STEP 0.25MonthAux.
100Total AnimalMature Cows+Weaned Calves+CalveshdAux.
101Total Animal SoldWeaned Calve Sold+Mature Cow Soldhd/MonthAux.
102Total cost of purchasesPurchased animals*Value per mature replacement*month conversiondollarsAux.
103Total crop harvestHarvest within+Harvest outsidekg/MonthAux.
104total number of herders45000personAux.
105Value of 1 animal unit weight1dollarsAux.
106Value per mature replacement0.5dollars/hdAux.
107Weaned Calve Death(Weaned Calves/18)/month conversion-Weaned Calve Growth-Weaned Calve Soldhd/MonthOutflow
108Weaned Calve Growth(Weaned Calves*Maturation rate)/month conversionhd/MonthInflow
109Weaned Calve Sold((Weaned Calves/month conversion)*(1-Maturation rate-Weaned Death rate))hd/MonthOutflow
110Weaned CalvesINTEG (Calves Growth-Weaned Calve Death-Weaned Calve Growth-Weaned Calve Sold, initial total animals in area*”initial weaned percent”)hdStock
111Weaned Death rate0.0041DmnlAux.
112weaning delay6MonthAux.
113Weaning rateassumed annual weaning rateDmnlAux.
114Weight gainIF THEN ELSE(Month counter = 12, Initial weight of animal/month conversion, MIN((Max rate of weight gain)*(Ave animal weight/kg conversion)*(Weight gain index*month conversion/kg conversion), (Max rate of weight gain)*(Ave animal weight/kg conversion)))kg/MonthInflow
115Weight gain indexWITH LOOKUP (Relative Forage available, ([(1.4,0)–(5,1)],(1.4,0.04),(1.8,0.1),(2.2,0.16),(2.6,0.245),(3,0.33),(3.4,0.44),(3.8,0.55),(4.2,0.655),(4.6,0.82),(5,1)))kg/MonthAux.
116Weight lossIF THEN ELSE(Month counter = 12, Ave animal weight/month conversion, Maintenance requirements*Ave animal weight/month conversion)kg/MonthOutflow
For the sensitivity analysis of the combination policy test (Section 3.2.4), the model was run for 200 simulations, varying the percentage of the harvest sold to the herders (0% to 1%), the percentage of the feed purchased subsidized (90% to 100%) and the cost per kg of feed purchased ($0.25 to 1 per kg). Figure A1 illustrates the individual traces (or individual trial simulation results) for the 200 simulation sensitivity tests.
Figure A1. Individual traces for each of the 200 sensitivity simulation runs of the combination policy test, illustrating the common forage panel (a), total number of animals panel (b), average animal weight panel (c) and net worth total panel (d). The black lines are each resulting test; the single blue line is the crop-restriction policy test for visual comparison, with and without the safety-net program.
Sustainability 12 05947 g0a1

References

  1. Herrero, M.; Grace, D.; Njuki, J.; Johnson, N.; Enahoro, D.; Silvestri, S.; Rufino, M.C. The roles of livestock in developing countries. Animal 2013, 7, 3–18. [Google Scholar] [CrossRef] [Green Version]
  2. Meltzer, M.I. Livestock in Africa: The economics of ownership and production, and the potential for improvement. Agric. Hum. Values 1995, 12, 4–18. [Google Scholar] [CrossRef]
  3. Moxnes, E. Not only the tragedy of the commons: Misperceptions of feedback and policies for sustainable development. Syst. Dyn. Rev. 2000, 16, 325–348. [Google Scholar] [CrossRef]
  4. Heikkila, T.; David, P.C. Common Pool Resources; Oxford Bibliographies; Oxford University Press: Oxford, UK, 2017. [Google Scholar]
  5. Ostrom, E.; Burger, J.; Field, C.B.; Norgaard, R.B.; Policansky, D. Revisiting the Commons: Local Lessons, Global Challenges. Science 1999, 284, 278–282. [Google Scholar] [CrossRef] [PubMed] [Green Version]
  6. Hardin, G. The Tragedy of the Commons. Science 1968, 162, 1243–1248. [Google Scholar] [PubMed]
  7. Hardin, G. An Operational Analysis of ‘Responsibility’. In Managing the Commons; Hardin, G., Baden, J., Eds.; W. H. Freeman: San Francisco, CA, USA, 1977; pp. 66–75. [Google Scholar]
  8. Moore, A.D.; Donnelly, J.R.; Freer. M. GRAZPLAN: Decision support systems for Australian Grazing Enterprises. III. Pasture growth and soil moisture sub models, and the GrassGro DSS. Agric. Syst. 1997, 55, 535–582. [Google Scholar] [CrossRef]
  9. Bement, R.E. A stocking-rate guide for beef production on blue-grama range. J. Range Manag. 1969, 22, 83–86. [Google Scholar] [CrossRef] [Green Version]
  10. Hart, R.H.; Samuel, M.J.; Test, P.S.; Smith, M.A. Cattle, vegetation, and economic responses to grazing systems and grazing pressure. J. Range Manag. 1988, 41, 282–286. [Google Scholar] [CrossRef] [Green Version]
  11. Manley, W.A.; Hart, R.H.; Samuel, M.J.; Smith, M.A.; Waggoner, J.W. Vegetation, cattle, and economic responses to grazing strategies and pressures. J. Range Manag. 1997, 50, 638–646. [Google Scholar] [CrossRef]
  12. Smart, A.; Derner, J.D.; Hendrickson, J.R.; Gillen, R.L.; Dunn, B.H.; Mousel, E.M.; Johnson, P.S.; Gates, R.N.; Sedivec, K.K.; Harmoney, K.R.; et al. Effects of grazing pressure on efficiency of grazing in North American Great Plains rangelands. Rangel. Ecol. Manag. 2010, 63, 397–406. [Google Scholar] [CrossRef]
  13. Blackburn, H.D.; Kothmann, M.M. A forage dynamics model for use in range and pasture environments. Grass Forage Sci. 1989, 44, 283–294. [Google Scholar] [CrossRef]
  14. Blackburn, H.D.; Kothmann, M.M. Modeling diet selection and intake for grazing herbivores. Ecol. Model. 1991, 57, 145–163. [Google Scholar] [CrossRef]
  15. Teague, W.R.; Kreuter, U.P.; Grant, W.E.; Diaz-Solis, H.; Kothmann, M.M. An ecological economic simulation model for assessing fire and grazing management effects on mesquite rangelands in Texas. Ecol. Econ. 2008, 64, 611–624. [Google Scholar] [CrossRef]
  16. Zhao, H.L.; Li, S.G.; Zhang, T.H.; Ohkuro, T.; Zhou, R.L. Sheep gain and species diversity: In sandy grassland, Inner Mongolia. J. Range Manag. 2004, 57, 187–190. [Google Scholar] [CrossRef]
  17. Sasaki, T.; Okayasu, T.; Takeuchi, K.; Jamsran, U.; Jadambaa, S. Patterns of floristic composition under different grazing intensities in Bulgan, South Gobi, Mongolia. Grassl. Sci. 2005, 51, 235–242. [Google Scholar] [CrossRef]
  18. Zhou, H.K.; Tang, Y.H.; Zhao, X.Q.; Zhou, L. Long-term grazing alters species composition and biomass of a shrub meadow on the Qinghai-Tibet Plateau. Pak. J. Bot. 2006, 38, 1055–1069. [Google Scholar]
  19. Cheng, Y.; Tsubo, M.; Ito, T.Y.; Nishihara, E.; Shinoda, M. Impact of rainfall variability and grazing pressure on plant diversity in Mongolian grasslands. J. Arid. Environ. 2011, 75, 471–476. [Google Scholar] [CrossRef]
  20. Muya, M.S.; Kamweya, M.A.; Muigai, W.T.A.; Kariuki, A.; Ngene, M.S. Using range condition assessment to optimize wildlife stocking in Tindress wildlife sanctuary, Nakuru District, Kenya. Rangel. Ecol. Manag. 2013, 66, 410–418. [Google Scholar] [CrossRef]
  21. Lwiwski, C.T.; Koper, N.; Henderson, C.D. Stocking rates and vegetation structure, heterogeneity, and community in a northern mixed-grass prairie. Rangel. Ecol. Manag. 2015, 68, 322–331. [Google Scholar] [CrossRef]
  22. Fynn, R.W.S.; O’Conner, T.G. Effects of stocking rate and rainfall on rangeland dynamics and cattle performance in a semi-arid savanna, South Africa. J. Appl. Ecol. 2000, 37, 491–507. [Google Scholar] [CrossRef]
  23. Oguntunde, P.G.; Abiodun, B.J.; Lischeid, G. Rainfall trends in Nigeria, 1901–2000. J. Hydrol. 2011, 411, 3–4. [Google Scholar] [CrossRef]
  24. Ifabiyi, I.P.; Ojoye, S. Rainfall Trends in the Sudano-Sahelian Ecological Zone of Nigeria. Earth Sci. Res. 2013, 2, 2. [Google Scholar]
  25. Baker, B.B.; Bourdon, R.M.; Hanson, J.D. FORAGE: A model of forage intake in beef cattle. Ecol. Model. 1992, 60, 257–279. [Google Scholar] [CrossRef]
  26. Eastburn, D.J.; Leslie, M.R.; Morgan, P.D.; Philip, R.B.; Chip, S.B.; George, G.; Elise, S.G. Seeding plants for long-term multiple ecosystem service goals. J. Environ. Manag. 2018, 211, 191–197. [Google Scholar] [CrossRef] [PubMed]
  27. Glasscock, S.N.; Grant, W.E.; Drawe, D.L. Simulation of vegetation dynamics and management strategies on south Texas, semi-arid rangeland. J. Environ. Manag. 2005, 75, 379–397. [Google Scholar] [CrossRef]
  28. Oldeman, L.H. World Map of the Status of Human-Induced Soil Degradation: An Explanatory Note; International Soil Reference and Information Center (ISRIC): Washington, DC, USA, 1991. [Google Scholar]
  29. Suttle, J.L. Grasslands of the World; Food and Agriculture Organization of the United Nations: Rome, Italy, 2005. [Google Scholar]
  30. Eldridge, D.J.; Beecham, G.; Grace, J.B. Do shrubs reduce the adverse effects of grazing on soil properties? Ecohydrology 2015, 8, 1503–1513. [Google Scholar] [CrossRef]
  31. Turner, B.L.; Menendez, H.M.; Gates, R.; Tedeschi, L.O.; Atzori, A.S. System dynamics modeling for agricultural and natural resource management issues: Review of some past cases and forecasting future roles. Resources 2016, 5, 40. [Google Scholar] [CrossRef] [Green Version]
  32. Grant, W.E. Ecology and Natural Resource Management. Reflections from a Systems Perspective. Ecol. Model. 1997, 108, 67–76. [Google Scholar] [CrossRef]
  33. FAO. FAO Country Programming Framework (CPF) Federal Republic of Nigeria; Food and Agricultural Organisation: Rome, Italy, 2017. [Google Scholar]
  34. Encyclopedia of the Nations. Nigeria—Agriculture; Advameg, Inc.: Flossmoor, IL, USA, 2018. [Google Scholar]
  35. FMARD. Food and the Future, Nigeria Must Mainstream Food Safety in Its Agricultural Production; Federal Ministry of Agriculture and Rural Development: Abuja, Nigeria, 2017.
  36. The Guardian. Nigeria: The Ekiti State Grazing Law. Available online: https://guardian.ng/opinion/the-ekiti-grazing-law/ (accessed on 30 May 2018).
  37. FAO. Land Management Study of Northern Nigeria; Food and Agricultural Organisation: Rome, Italy, 1967. [Google Scholar]
  38. Adewuyi, O.T.; Mohammed, M.D.; Olofin, A.E. Assessment of the Effects of Emerging Grazing Policies on Land Degradation in Nigeria. J. Appl. Sci. Environ. Manag. 2017, 21, 1183–1187. [Google Scholar]
  39. Fakoya, E.O. Utilization of Crop—Livestock Production Systems for Sustainable Agriculture in Oyo State, Nigeria. J. Soc. Sci. 2007, 15, 31–33. [Google Scholar] [CrossRef]
  40. NBS. Commercial Agriculture Development Project; National Bureau of Statistics Baseline Survey Report, Nigeria Bureau of Statistics: Abuja, Nigeria, 2010. Available online: http://nigerianstat.gov.ng/elibrary (accessed on 5 June 2018).
  41. Frantz, C. Fulbe continuity and change under five flags atop West Africa. Territoriality, ethnicity, stratification and national integration. In Change and Development in Nomadic and Pastoral Societies; Galaty, J.G., Salzmann, P.C., Eds.; Brill: Leiden, The Netherlands, 1981; pp. 89–115. [Google Scholar]
  42. Frantz, C. Ecology and social organization among Nigerian Fulbe (Fulani). In The Nomadic Alternative. Modes of Interactions in African-Asian Desert and Steppes; Weissleder, W., Ed.; Mouton Publishers: Paris, France, 1978. [Google Scholar]
  43. Frantz, C. The open niche, pastoralism and sedentarization in the Mambila grasslands of Nigeria. In When Nomads Settle; Salzman, P., Ed.; Praeger: New York, NY, USA, 1980. [Google Scholar]
  44. Tarawali, G.; Pamo, T. A Case for On-farm Trials of Fodder Bank on the Adamawa Plateau in Cameroon; Cambridge University Press: Cambridge, England, 1992. [Google Scholar]
  45. Vanguard News. Herdsmen: “The Rapist of Our Women, the Killers of Our Men Are Walking the Streets Free”. Available online: https://www.vanguardngr.com/2018/02/rapists-women-killers-men-attackers-farms-walking-streets-free/ (accessed on 30 May 2018).
  46. Tedeschi, L. Assessment of the adequacy of mathematical models. Agric. Syst. 2005, 89, 225–247. [Google Scholar] [CrossRef]
  47. Turner, B.L.; Tidwell, V.; Fernald, A.; Rivera, J.A.; Rodriguez, S.; Guldan, S.; Ochoa, C.; Hurd, B.; Boykin, K.; Cibils, A. Modeling acequia irrigation systems using system dynamics: Model development, evaluation, and sensitivity analyses to investigate effects of socio-economic and biophysical feedbacks. Sustainability 2016, 8, 1019. [Google Scholar] [CrossRef] [Green Version]
  48. Turner, B.L.; Rhoades, R.D.; Tedeschi, L.O.; Hanagriff, R.D.; McCuistion, K.C.; Dunn, B.H. Analyzing ranch profitability from varying cow sales and heifer replacement rates for beef cow-calf production using system dynamics. Agric. Syst. 2013, 114, 6–14. [Google Scholar] [CrossRef]
  49. Turner, B.L.; Wuellner, M.; Nichols, T.; Gates, R.; Tedeschi, L.O.; Dunn, B. A systems approach to forecast agricultural land transformation and soil environmental risk from economic, policy, and cultural scenarios in the north central United States (2012–2062). Int. J. Agric. Sustain. 2017, 15, 102–123. [Google Scholar] [CrossRef]
  50. Gunda, T.; Turner, B.L.; Tidwell, V.C. The influential role of sociocultural feedbacks on community-managed irrigation system behaviors during times of water stress. Water Resour. Res. 2018, 54, 2697–2714. [Google Scholar] [CrossRef]
  51. Wayland, T.; West, L.; Mata, J.; Turner, B.L. Why are proposed public land transfers a source of extreme conflict and resistance? Rangelands 2018, 40, 53–64. [Google Scholar] [CrossRef]
  52. Tinsley, T.L.; Chumbley, S.; Mathis, C.; Machen, R.; Turner, B.L. Managing cow herd dynamics in environments of limited forage productivity and livestock marketing channels: An application to semi-arid Pacific island beef production using system dynamics. Agric. Syst. 2018, 173, 78–93. [Google Scholar] [CrossRef]
  53. Oniki, S.; Shindo, K.; Yamasa, S.; Toriyama, K. Simulation of Pastoral Management in Mongolia: An Integrated System Dynamics Model. Rangel. Ecol. Manag. 2018, 71, 370–381. [Google Scholar] [CrossRef]
  54. Nicholson, C.F.; Simões, A.R.P.; LaPierre, P.A.; Van Amburgh, M.E. Modeling complex problems with system dynamics: Applications in animal agriculture. J. Anim. Sci. 2019, 97, 1903–1920. [Google Scholar] [CrossRef] [Green Version]
  55. Odoemena, K.G.; Waters, J.P.; Kleeman, H.M. A system dynamics model of supply-side issues influencing beef consumption in Nigeria. Sustainability 2020, 12, 3241. [Google Scholar] [CrossRef] [Green Version]
  56. Sterman, J. Business Dynamics: System Thinking and Modeling for a Complex World; Irwin/McGraw-Hill: Boston, MA, USA, 2000. [Google Scholar]
  57. Meadows, D. Places to Intervene in a System. Whole Earth Rev. 1997, 91, 78–84. [Google Scholar]
  58. Teague, W.R.; Kreuter, U.P.; Grant, W.E.; Diaz-Solis, H.; Kothmann, M.M. Economic implications of maintaining rangeland ecosystem health in a semi-arid savanna. Ecol. Econ. 2009, 68, 1417–1429. [Google Scholar] [CrossRef]
  59. Teague, W.R.; Dowhower, S.L.; Baker, S.A.; Haile, N.; DeLaune, P.B.; Conover, D.M. Grazing management impacts on vegetation, soil biota, and soil chemical, physical and hydrological properties in tall grass prairie. Agric. Ecosyst. Environ. 2011, 141, 310–322. [Google Scholar] [CrossRef]
  60. Fulbright, T.E.; Ortega-Santos, A. White-Tailed Deer Habitat: Ecology and Management, 2nd ed.; Texas A&M University Press: College Station, TX, USA, 2013. [Google Scholar]
  61. Pickup, G. A simple model for predicting herbage production from rainfall in rangelands and its calibration using remotely sensed data. J. Arid Environ. 1995, 30, 227–245. [Google Scholar] [CrossRef]
  62. Pickup, G. Estimating the effects of land degradation and rainfall variation on productivity in rangelands. An approach using remote sensing and models of grazing and herbage dynamics. J. Appl. Ecol. 1996, 33, 819–832. [Google Scholar] [CrossRef]
  63. McCuistion, K.; Grigar, M.; Wester, B.D.; Rhoades, R.; Mathis, C.; Tedeschi, L. Can we predict forage nutritive value with weather parameters? Rangelands 2014, 36, 2–9. [Google Scholar] [CrossRef] [Green Version]
  64. Diaz-Solis, H.; Grant, W.E.; Kothmann, M.M.; Teague, W.R.; Diaz-Garcia, J.A. Adaptive management of stocking rates to reduce the effects of drought on cow-calf production systems in semi-arid rangelands. Agric. Syst. 2009, 100, 43–50. [Google Scholar] [CrossRef]
  65. Loewer, O.J.; Taul, K.L.; Turner, L.W.; Gay, N.; Muntifering, R. GRAZE: A Model of Selective Grazing by Beef Animals. Agric. Syst. 1987, 25, 297–309. [Google Scholar] [CrossRef]
  66. Teague, R.; Grant, B.; Wang, H.H. Assessing optimal configurations of multi-paddock grazing strategies in tallgrass prairie using a simulation model. J. Environ. Manag. 2015, 150, 262–273. [Google Scholar] [CrossRef]
  67. Diaz-Solis, H.; Kothmann, M.M.; Hamilton, W.T.; Grant, W.E. A simple ecological sustainability simulator (SESS) for stocking rate management in semi-arid grazelands. Agric. Syst. 2003, 76, 655–680. [Google Scholar] [CrossRef]
  68. Zilverberg, J.C.; Williams, J.; Jones, C.; Harmoney, K.; Angerer, J.; Metz, J.L.; Fox, W. Process-based simulation of prairie growth. Ecol. Model. 2017, 351, 24–35. [Google Scholar] [CrossRef] [Green Version]
  69. Lubell, M.N.; Cutts, B.B.; Roche, L.M.; Hamilton, M.; Derner, J.D.; Kachergis, E.; Tate, K.W. Conservation program participation and adaptive rangeland decision-making. Rangel. Ecol. Manag. 2013, 66, 609–620. [Google Scholar] [CrossRef]
  70. Marshall, N.A.; Stokes, C.J. Identifying thresholds and barriers to adaptation through measuring climate sensitivity and capacity to change in an Australian primary industry. Clim. Chang. 2014, 126, 399–411. [Google Scholar] [CrossRef]
  71. Roche, L.M.; Cutts, B.; Derner, J.D.; Lubell, M.N.; Tate, K.W. On-ranch grazing strategies: Context for the rotational grazing dilemma. Rangel. Ecol. Manag. 2015, 68, 248–256. [Google Scholar] [CrossRef]
  72. Wilmer, H.; Fernandez-Gimenez, M.E. Rethinking rancher decision-making: A grounded theory of ranching approaches to drought and succession management. Rangel. J. 2015, 37, 517–528. [Google Scholar] [CrossRef]
  73. Ostrom, E. Governing the Commons; Cambridge University Press: Cambridge, UK, 1990. [Google Scholar]
  74. Levine, B.L. The Tragedy of the Commons and the Comedy of Community. The Commons in History. J. Community Psychol. 1986, 14, 81–99. [Google Scholar] [CrossRef]
Figure 1. Causal Loop Diagram representing the Dynamic Hypothesis of Tragedy of the common-pool resources in the Nigerian Uplands. The variables influencing the cattle grazing activities are shown above. Each arrow head is accompanied by a ‘+’ or a ‘−‘. an arrow with a ‘+’ denotes that the variable is expected to change in the same direction, while a ‘−’ changes in the opposite direction. As an example for a ‘+’ arrow; as common-pool resources increase, herder’s net worth also increases, whereas for a ‘−’, as the total activity increases, common-pool resources decrease. The ‘B’ at the center of the loop denotes a balancing or a negative feedback loop in which a change in one variable feeds back to balance out or oppose the effect of the initial change. The ‘R’ denotes a reinforcing or positive feedback loop in which a change in one variable feeds back to reinforce or support the initial change. The common-pool resource availability increases both crop and herder’s net worth, but their combined activity reduces the available common-pool resources. To compensate, herders migrate to cropping areas to graze and increase their net worth as resources are depleted, thereby reducing the crop activity and weakening farmers’ ability to recover net worth.
Sustainability 12 05947 g001
Figure 2. A stylized view of the stock-flow model created to capture the endogenous, feedback structure contributing to tragedy of the commons on forage land and the spill-over effect to neighboring croplands. Stocks variable (denoted as boxes) accumulations which can increase or decrease depending on the inflows and outflows (denoted as thick black arrows). Auxiliary variables, which represent information and decision-making links at alter inflows, outflows, and stocks, are represented as thin blue arrows. Forage resources drives animal population, and as animals graze on available forage resources, the animals gain weight that when sold, increases the net worth of herders. The net worth of herders determine the additional animals to be added to the common-pool grazing area each year.
Sustainability 12 05947 g002
Figure 3. A synthesized stock-flow model representing common forage dynamics in the model. Stocks, flows and information links follow the same convention as used in previous figures.
Sustainability 12 05947 g003
Figure 4. A synthesized stock-flow model representing the cow herd dynamics in the model.
Sustainability 12 05947 g004
Figure 5. A synthesized stock-flow model representing the crop dynamics in the model.
Sustainability 12 05947 g005
Figure 6. A synthesized stock-flow model representing the financial dynamics in the model.
Sustainability 12 05947 g006
Figure 7. Behaviors-over-time plots for the common forage panel (a), total animals panel (b), average animal weight panel (c), net worth total panel (d) and livestock grazing on crops (both in and out of the region; panel (e) for each calibration run (equilibrium, drought, calving rate reduction and replication of real-world behaviors).
Sustainability 12 05947 g007
Figure 8. Behaviors-over-time plots for the common forage panel (a), total animals panel (b), average animal weight panel (c), net worth total panel (d), livestock grazing on crops (both in and out of the region) panel (e); for each policy-test (implementing crop restrictions, instituting crop marketing, increased labor costs and the combination strategy of market integration for funding rangeland improvements), as well as mean program costs to the government and to herders for the combination policy-test only panel (f).
Sustainability 12 05947 g008
Table 1. Calibration input data showing the initial calibration and the adjusted values for each calibration simulation.
Parameters UsedEquilibriumReal-World ReplicationDrought CalibrationCalving Rate
Initial total animals (million hd)9.79.79.79.7
percent animal added a015%00
Precipitation forcing b1101
Calving percentage cFunction of mean animal weightFunction of mean animal weightFunction of mean animal weightFunction of mean animal weight × 0.5
a See Table A1 for formulation of the graphical function percentage of animals added. b The precipitation forcing equal to 1 used mean precipitation, while a value of 0 instituted a two-year drought from years 10 to 12; all other years used mean precipitation values. c See Table A1 for formulation of the graphical function calving percentage.
Table 2. Summary of results comparing equilibrium, calibration and what-if policy simulations.
Simulation ExperimentCommon Forage (kg/Hectare)Mean Animal (Million hd)Ave Animal Weight (kg)Ending Net-Worth ($ mil)
Equilibrium run2218.79.1477.93972
%∆ equilibrium 1----
%∆ calibration 2158%−47%73%38%
Real-world859.017.3276.42875
%∆ equilibrium 1−61%90%−42%−28%
%∆ calibration 2----
Crop restriction357.77.3216.61655
%∆ equilibrium 1−84%−20%−55%−58%
%∆ calibration 2−58%−58%−22%−42%
Crop marketing1271.715.8355.6−1469
%∆ equilibrium 1−43%74%−26%−137%
%∆ calibration 248%−9%29%−151%
Labor scenario1026.616.5320.01967
%∆ equilibrium 1−54%81%−33%−50%
%∆ calibration 220%−5%16%−32%
Combo. scenario1840.906.6453.91942
%∆ equilibrium 1−17%−27%−5%−51%
%∆ calibration 2114%−62%64%−32%
1% Change of the observed scenario compared to the data in the equilibrium run (observed-equilibrium/equilibrium). 2% The change of the observed scenario compared to the data in the calibration run (observed-calibration/calibration).

