Identifying Sustainable Grassland Management Approaches in Response to the Invasive Legume Lespedeza cuneata: A Functional Group Approach


Abstract
:1. Introduction
2. Materials and Methods
2.1. Study Species
2.2. Field Surveys
2.3. Greenhouse Experiment
2.4. Statistical Analysis of the Field Surveys
2.5. Statistical Analysis of the Greenhouse Experiment
3. Results
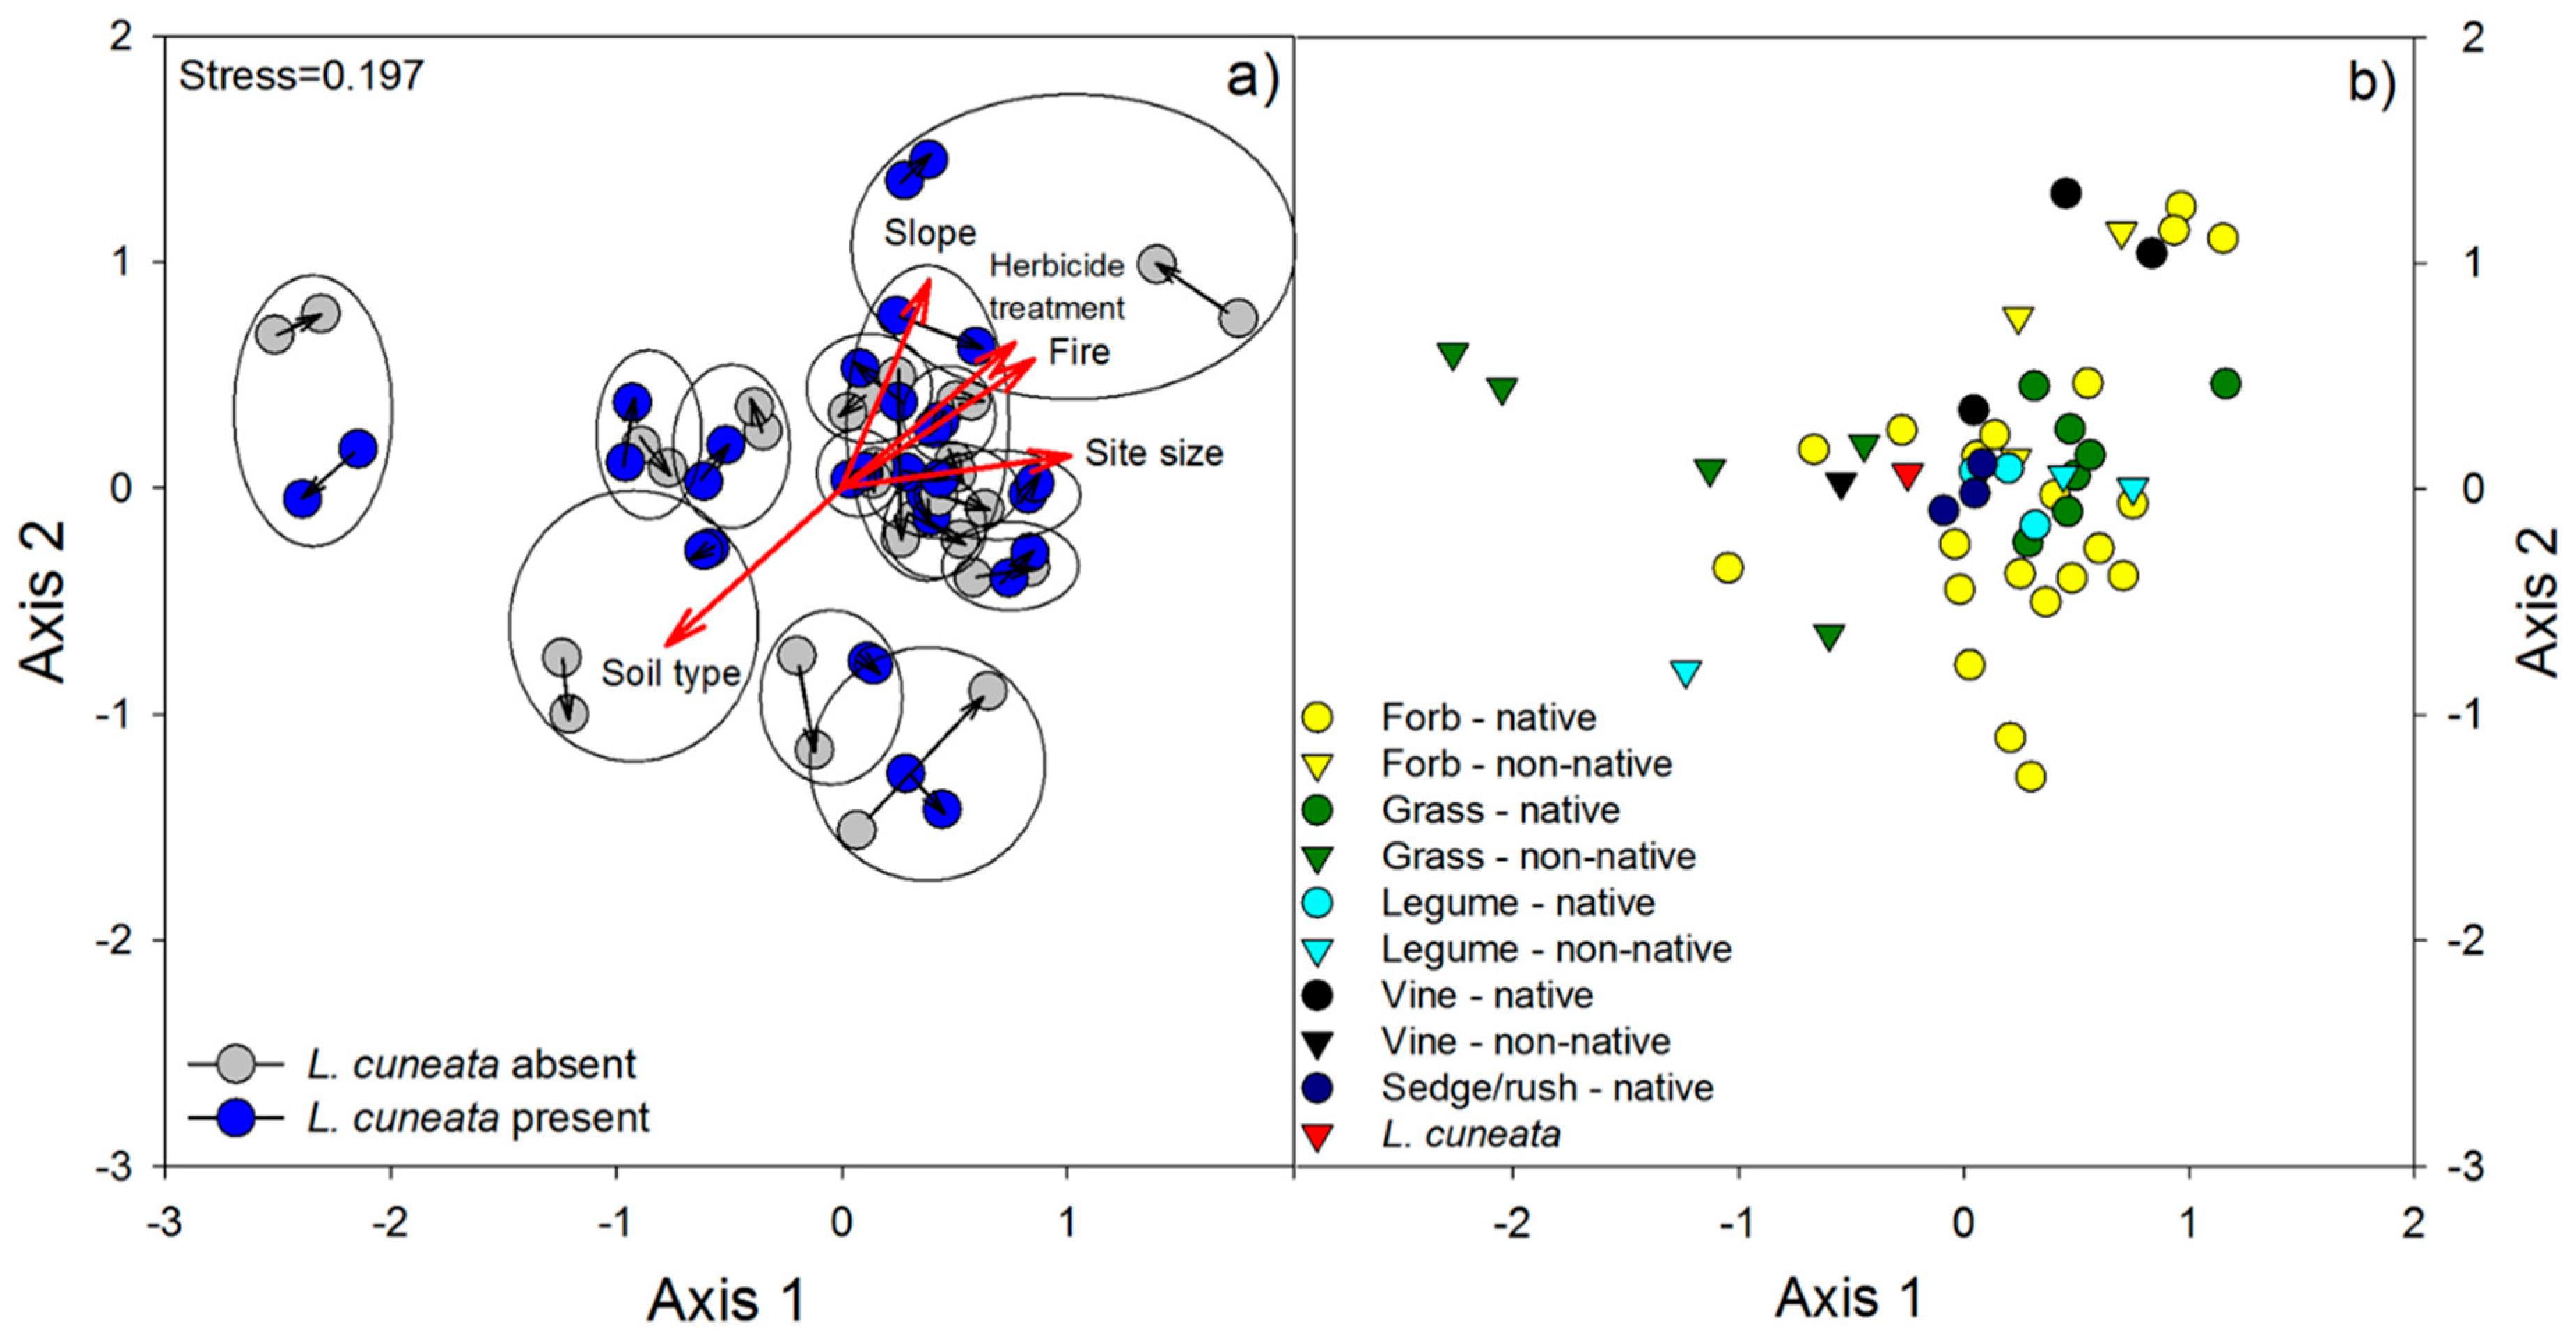
3.1. Field Surveys
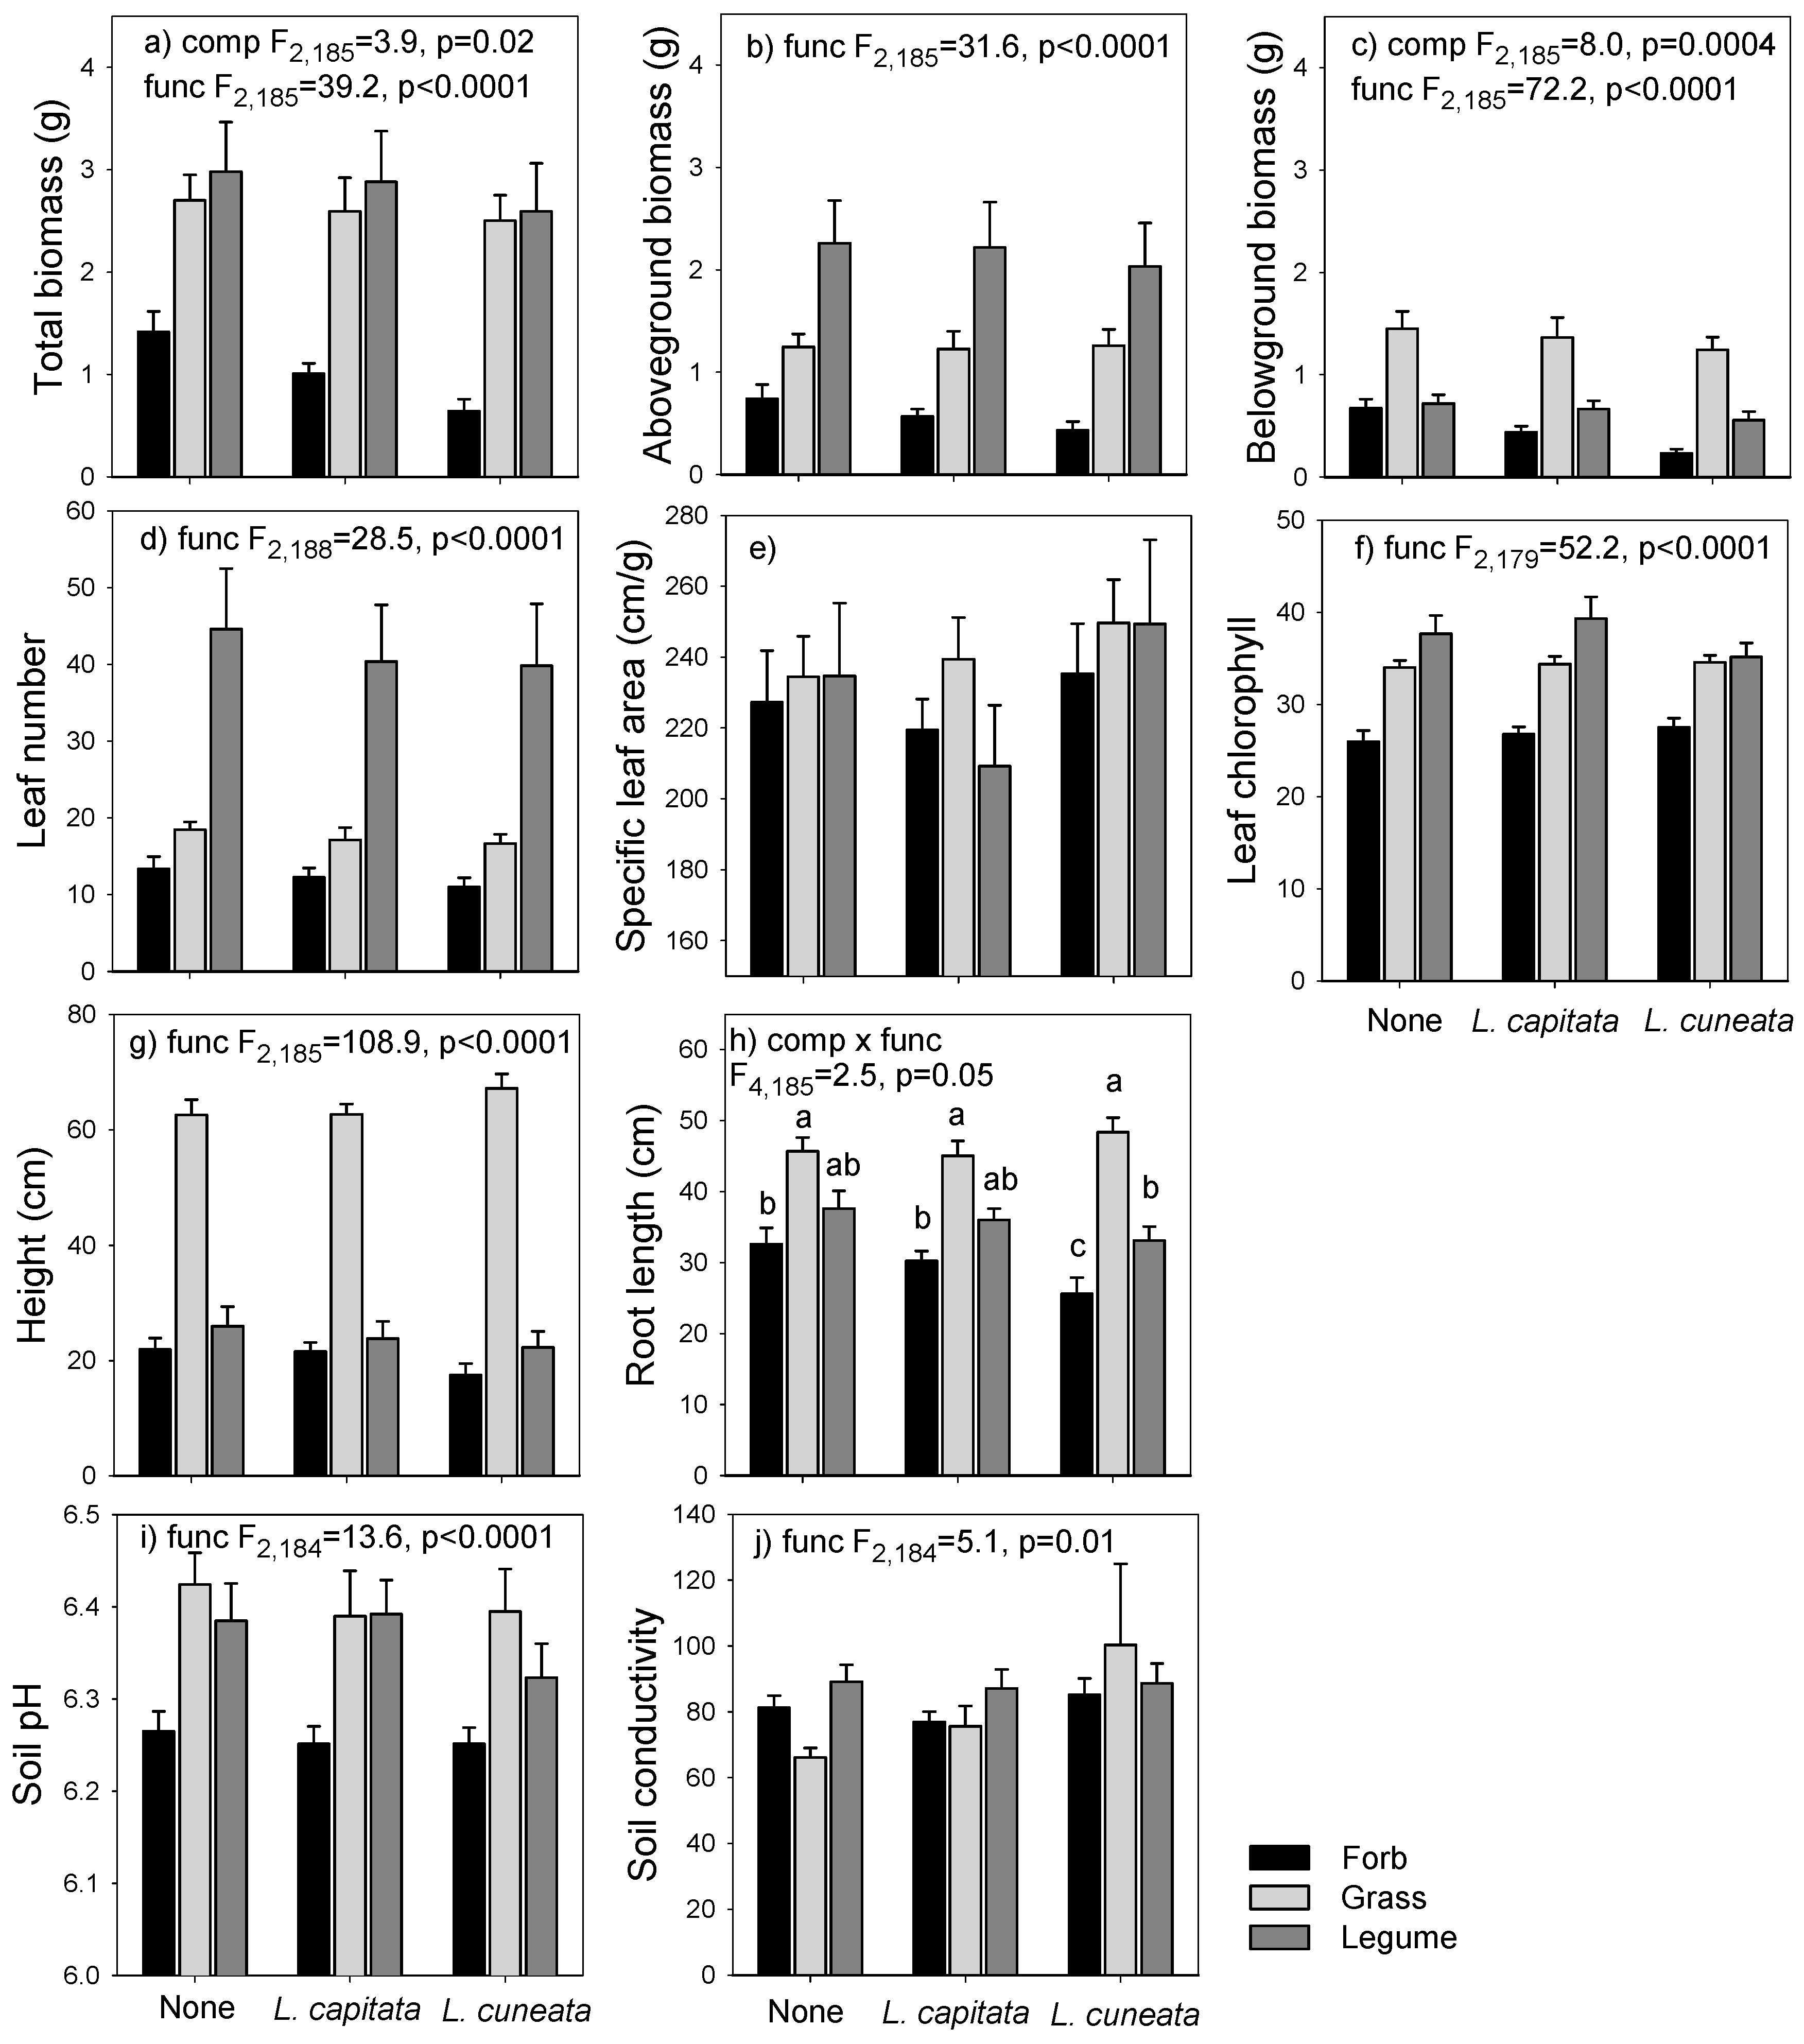
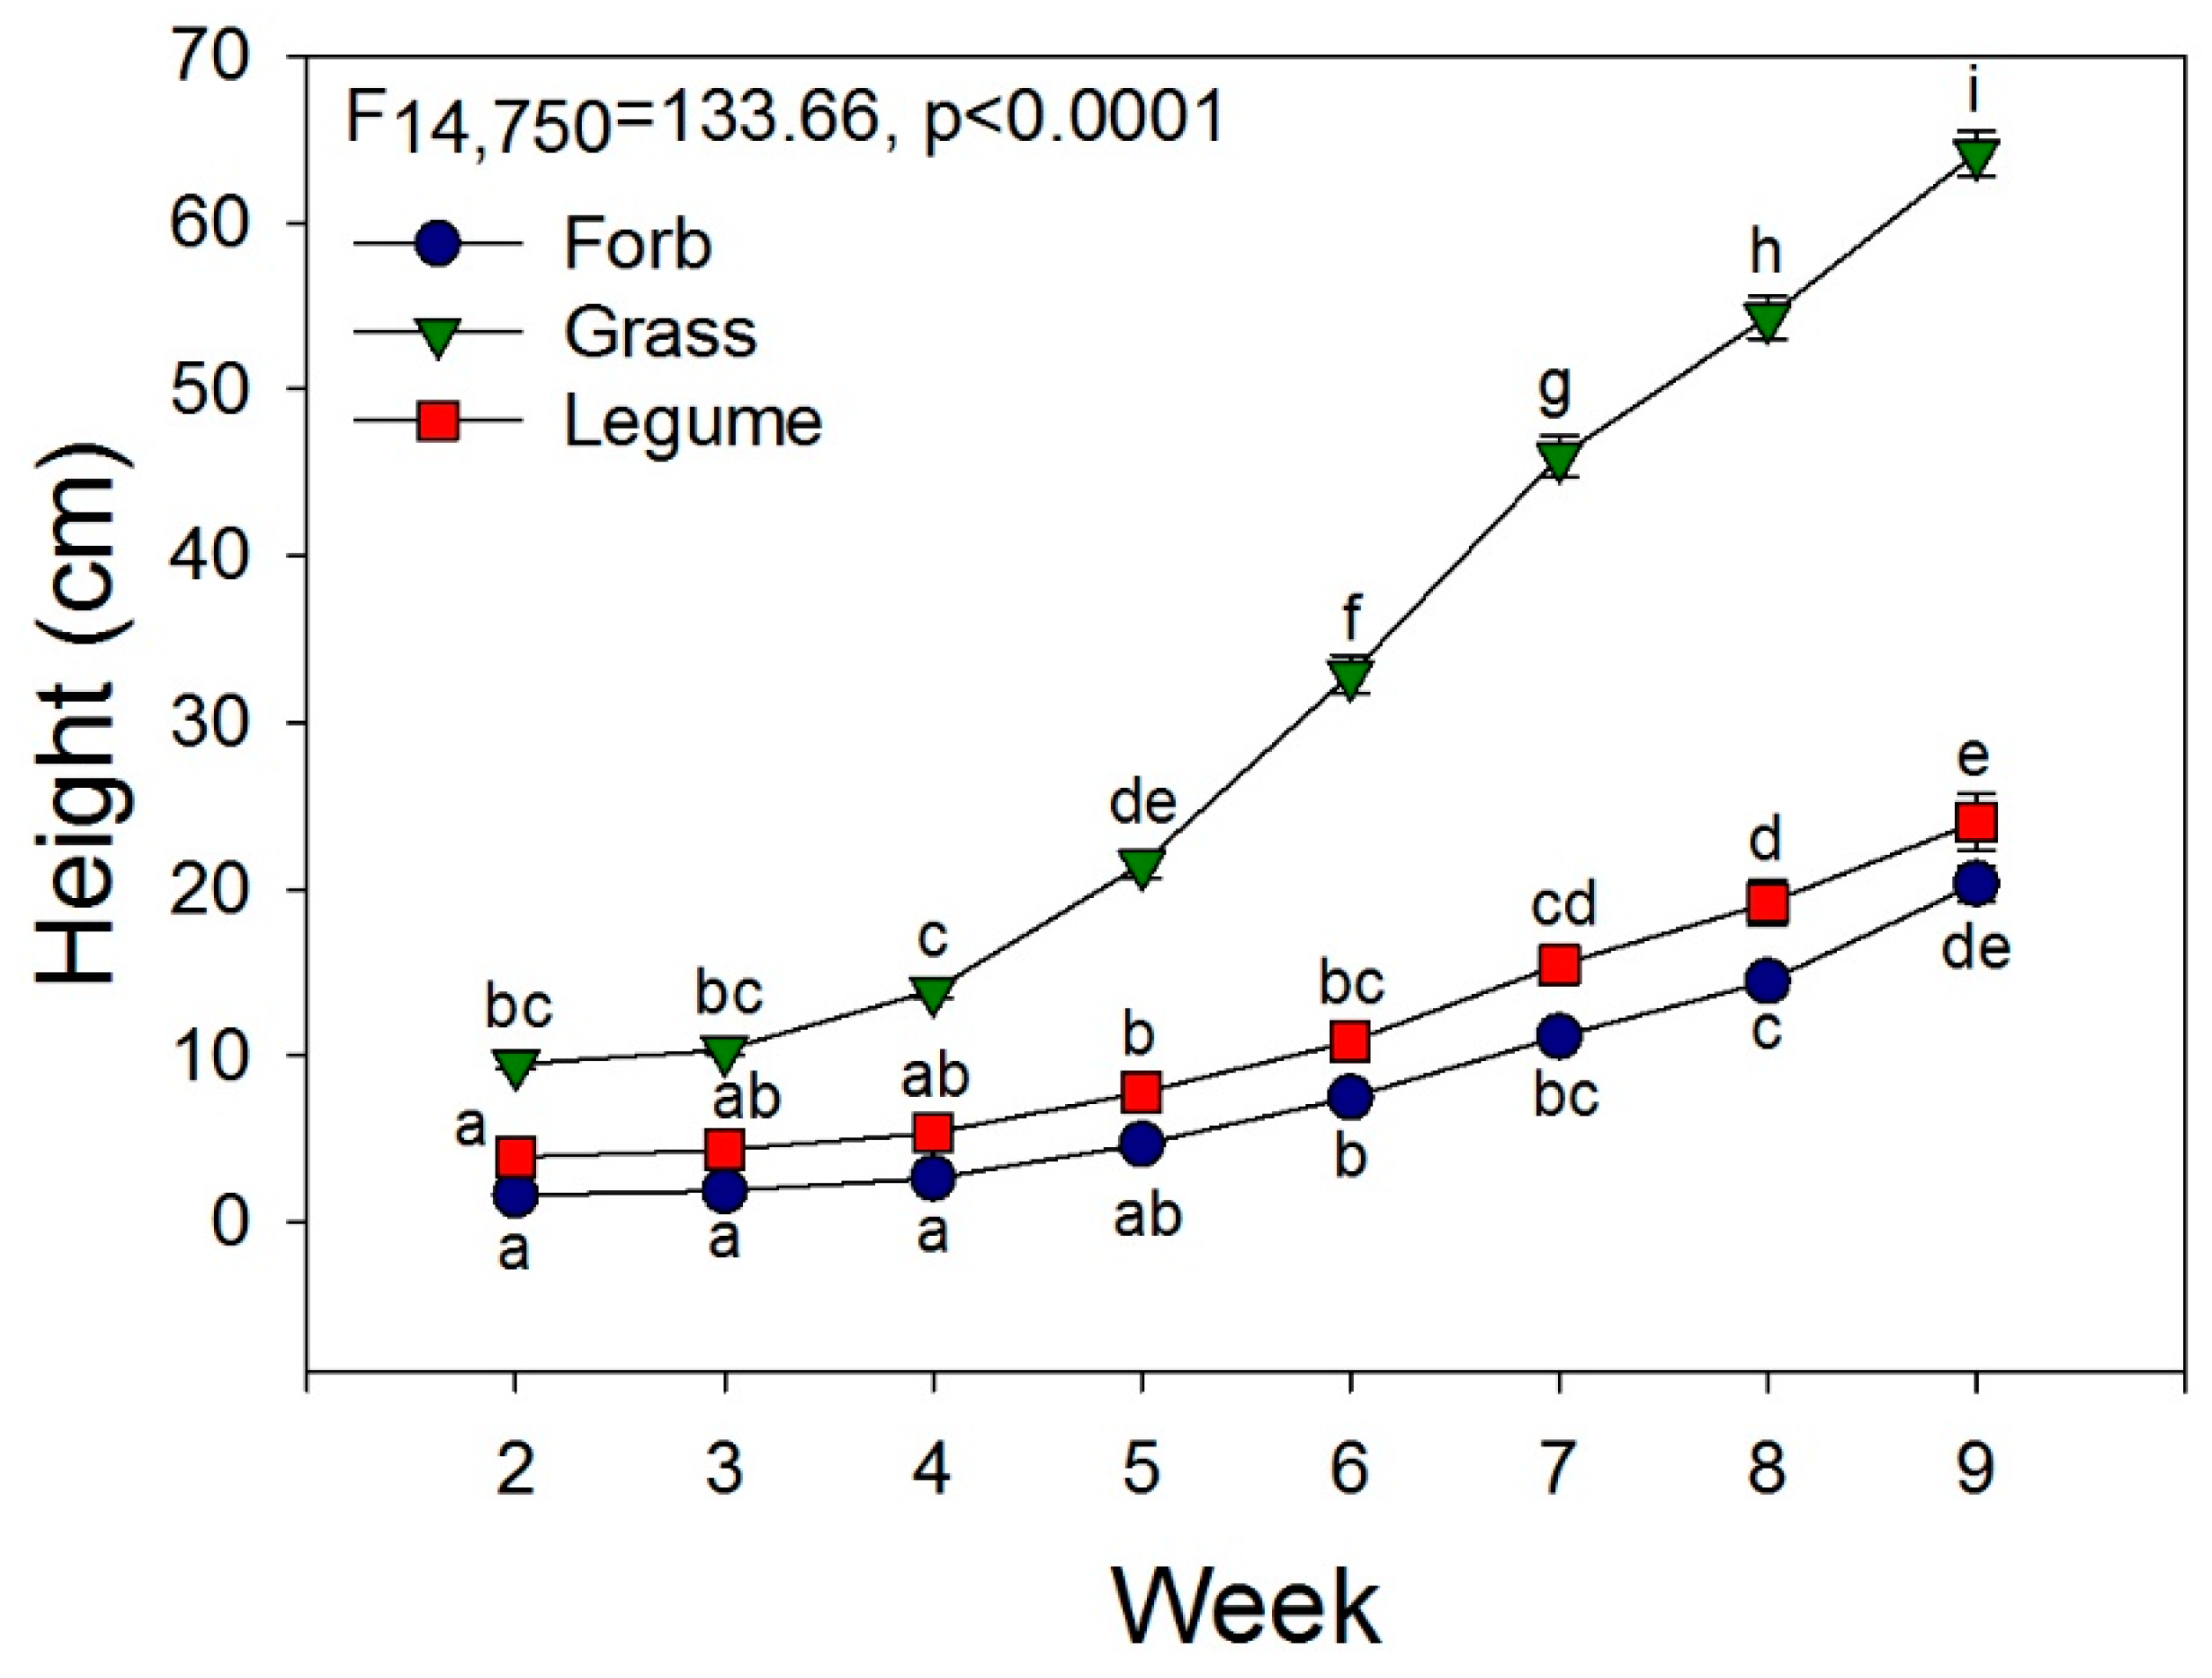
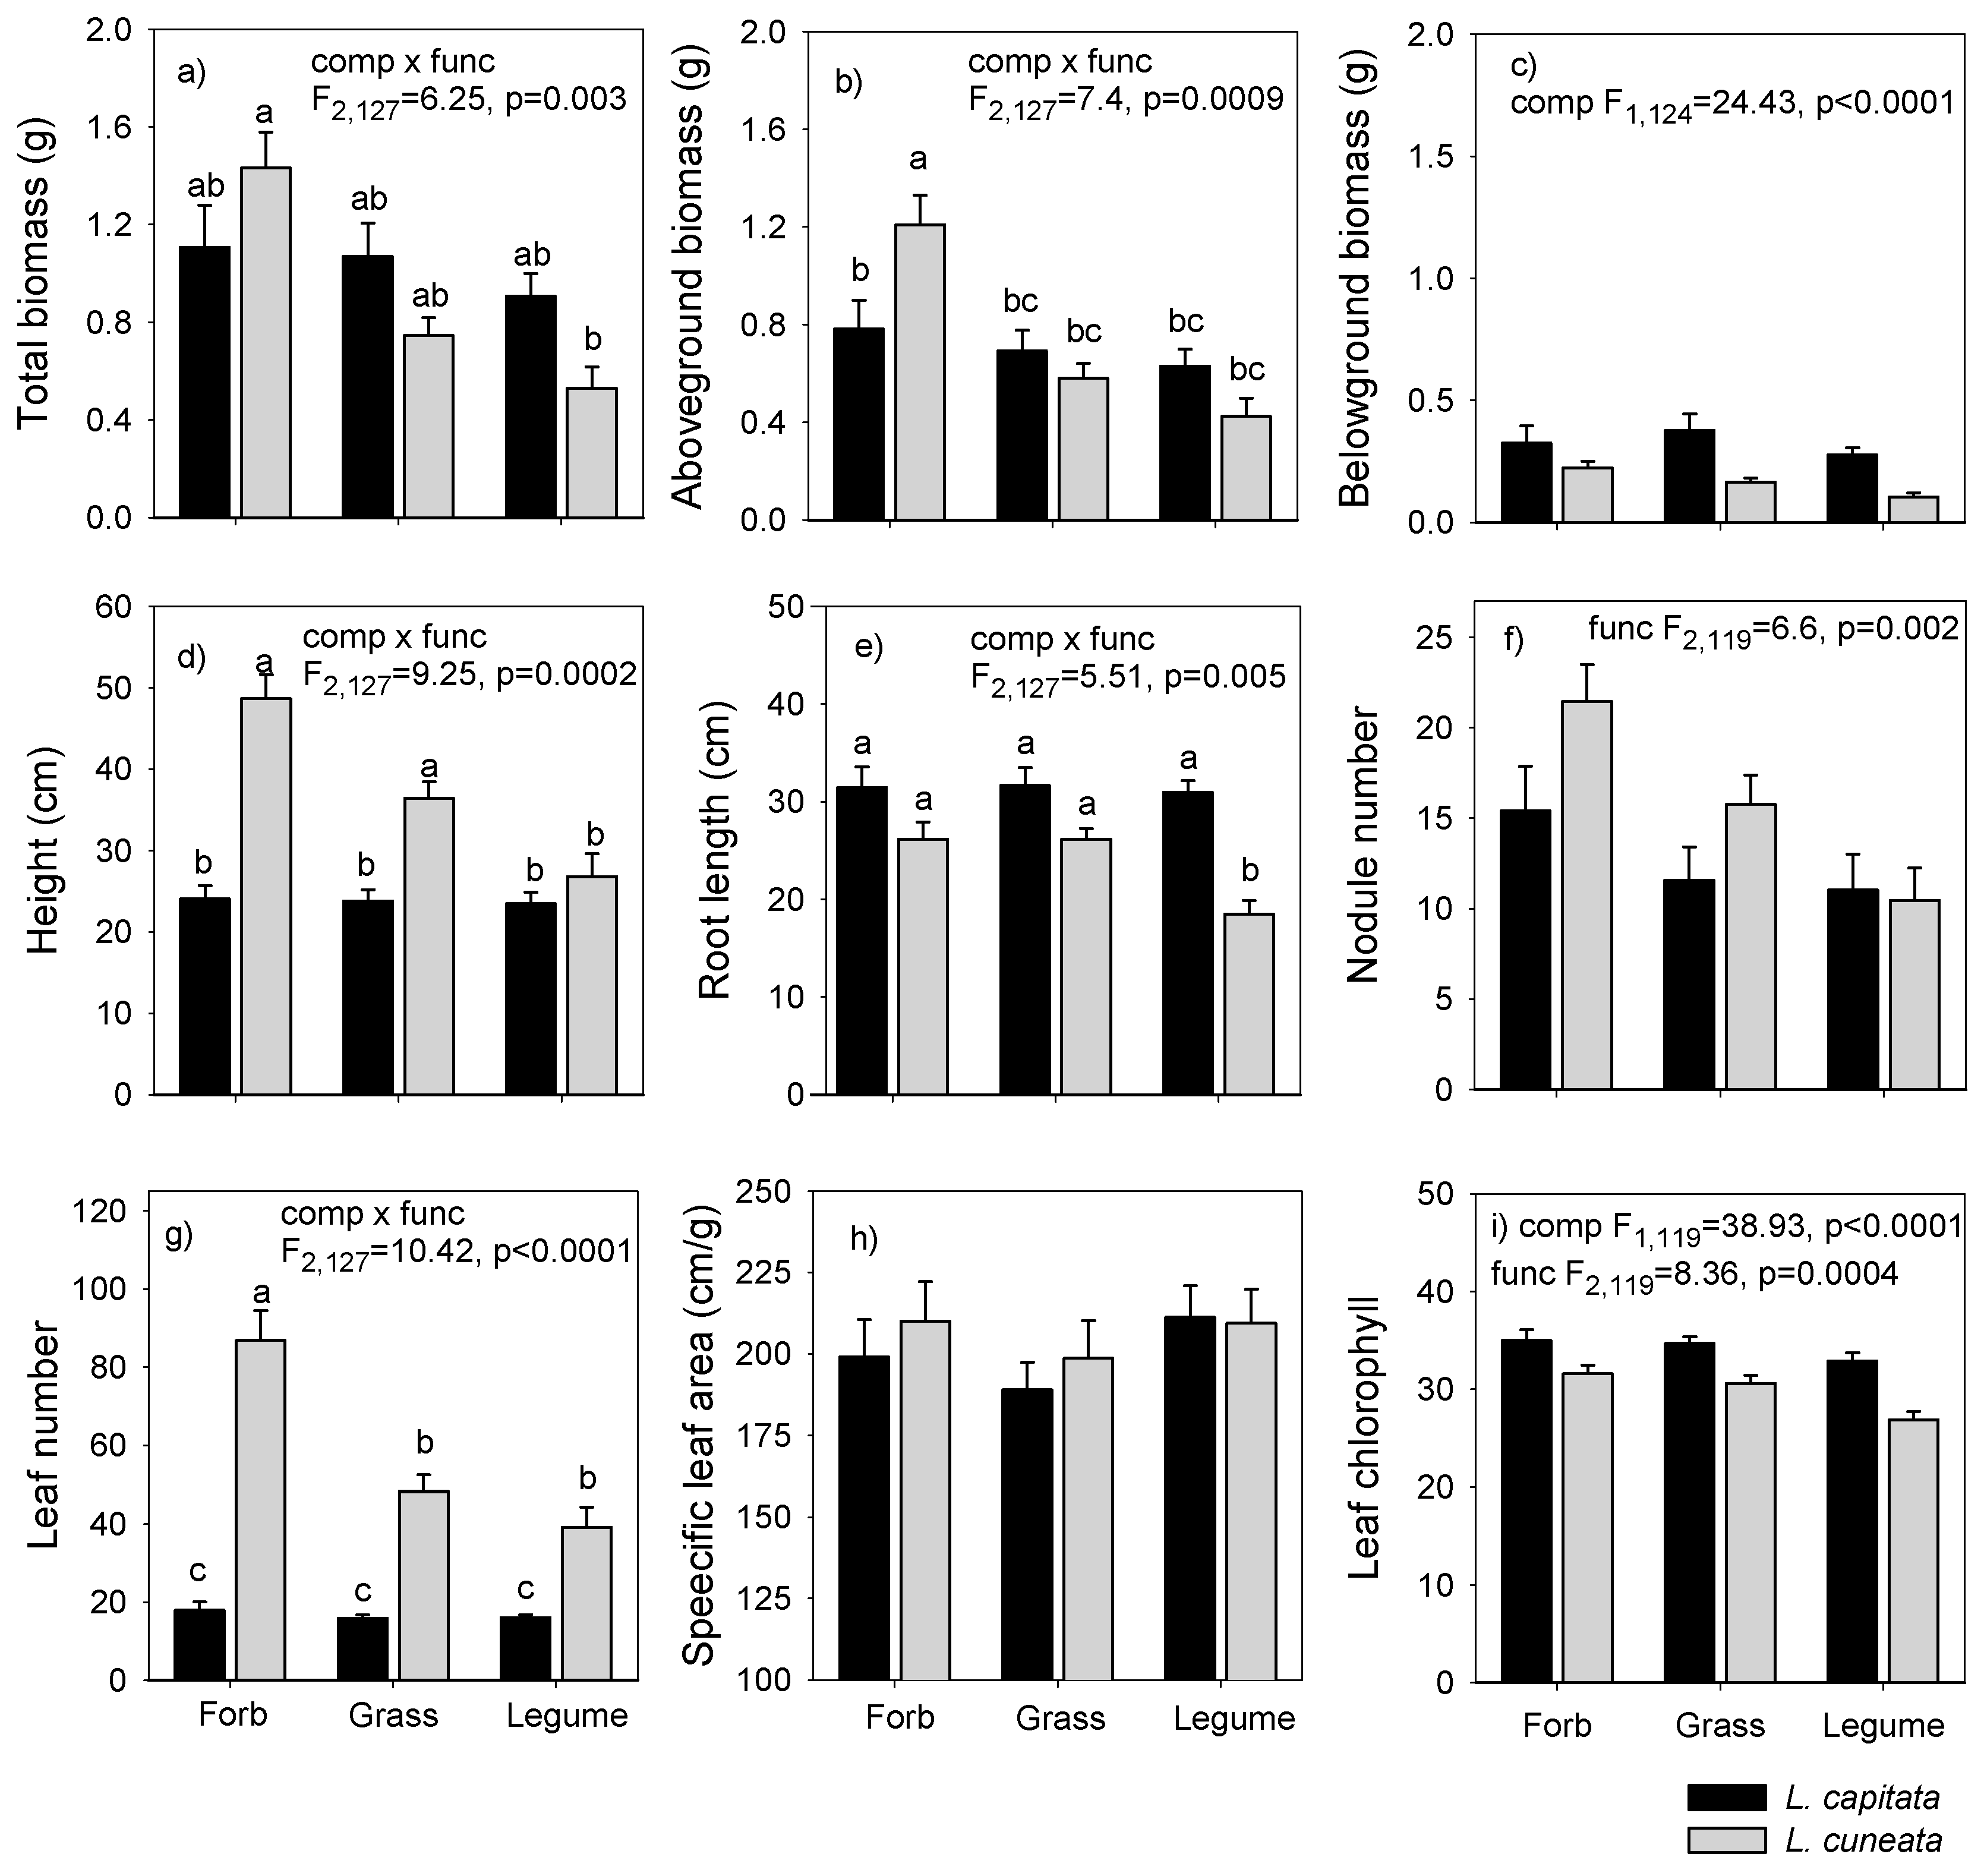
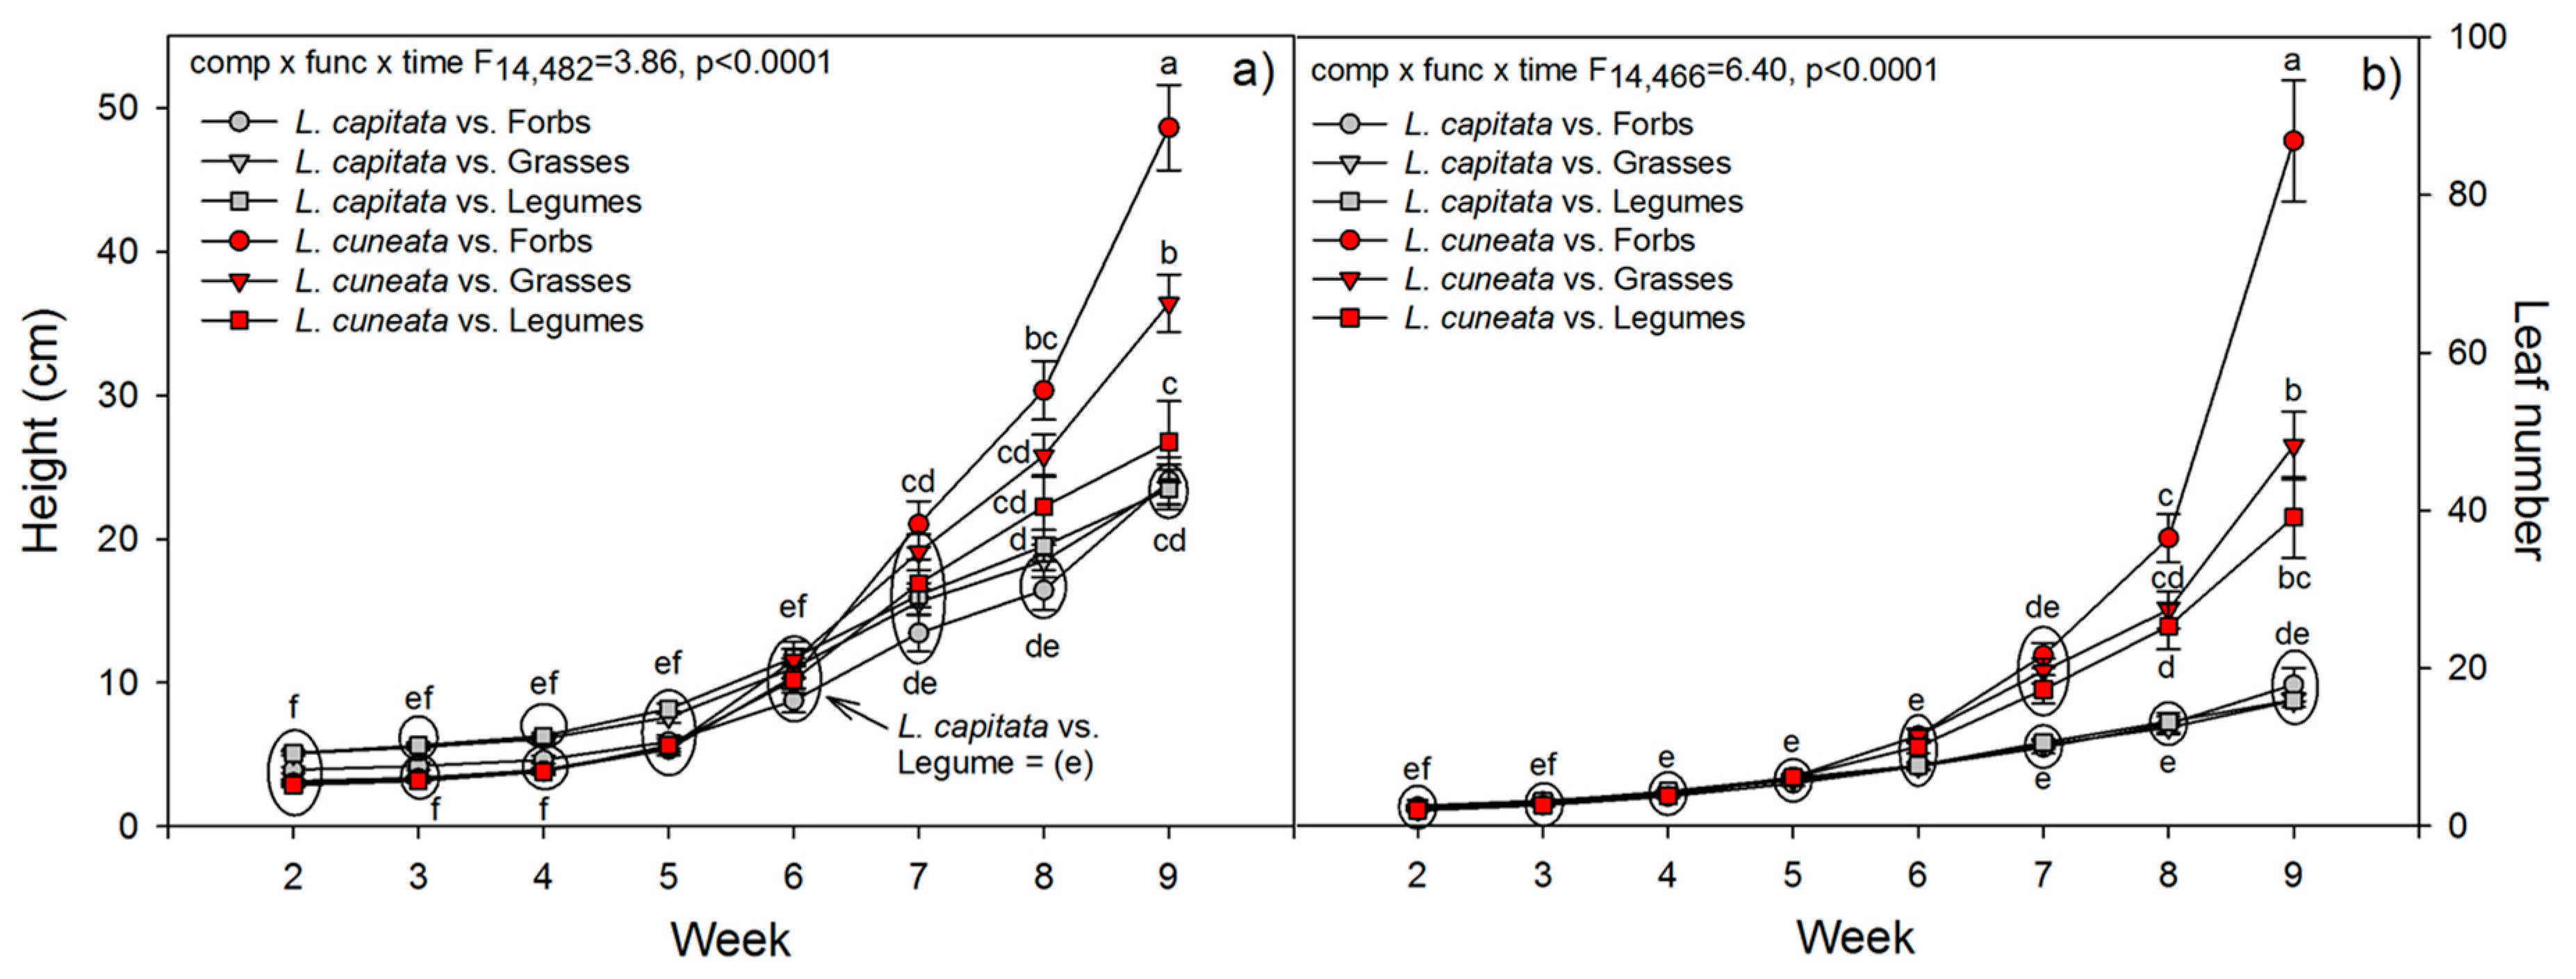
3.2. Greenhouse Experiment
4. Discussion
4.1. Patterns of Invasion: Field Surveys
4.2. Mechanisms of Invasion: Greenhouse Experiment
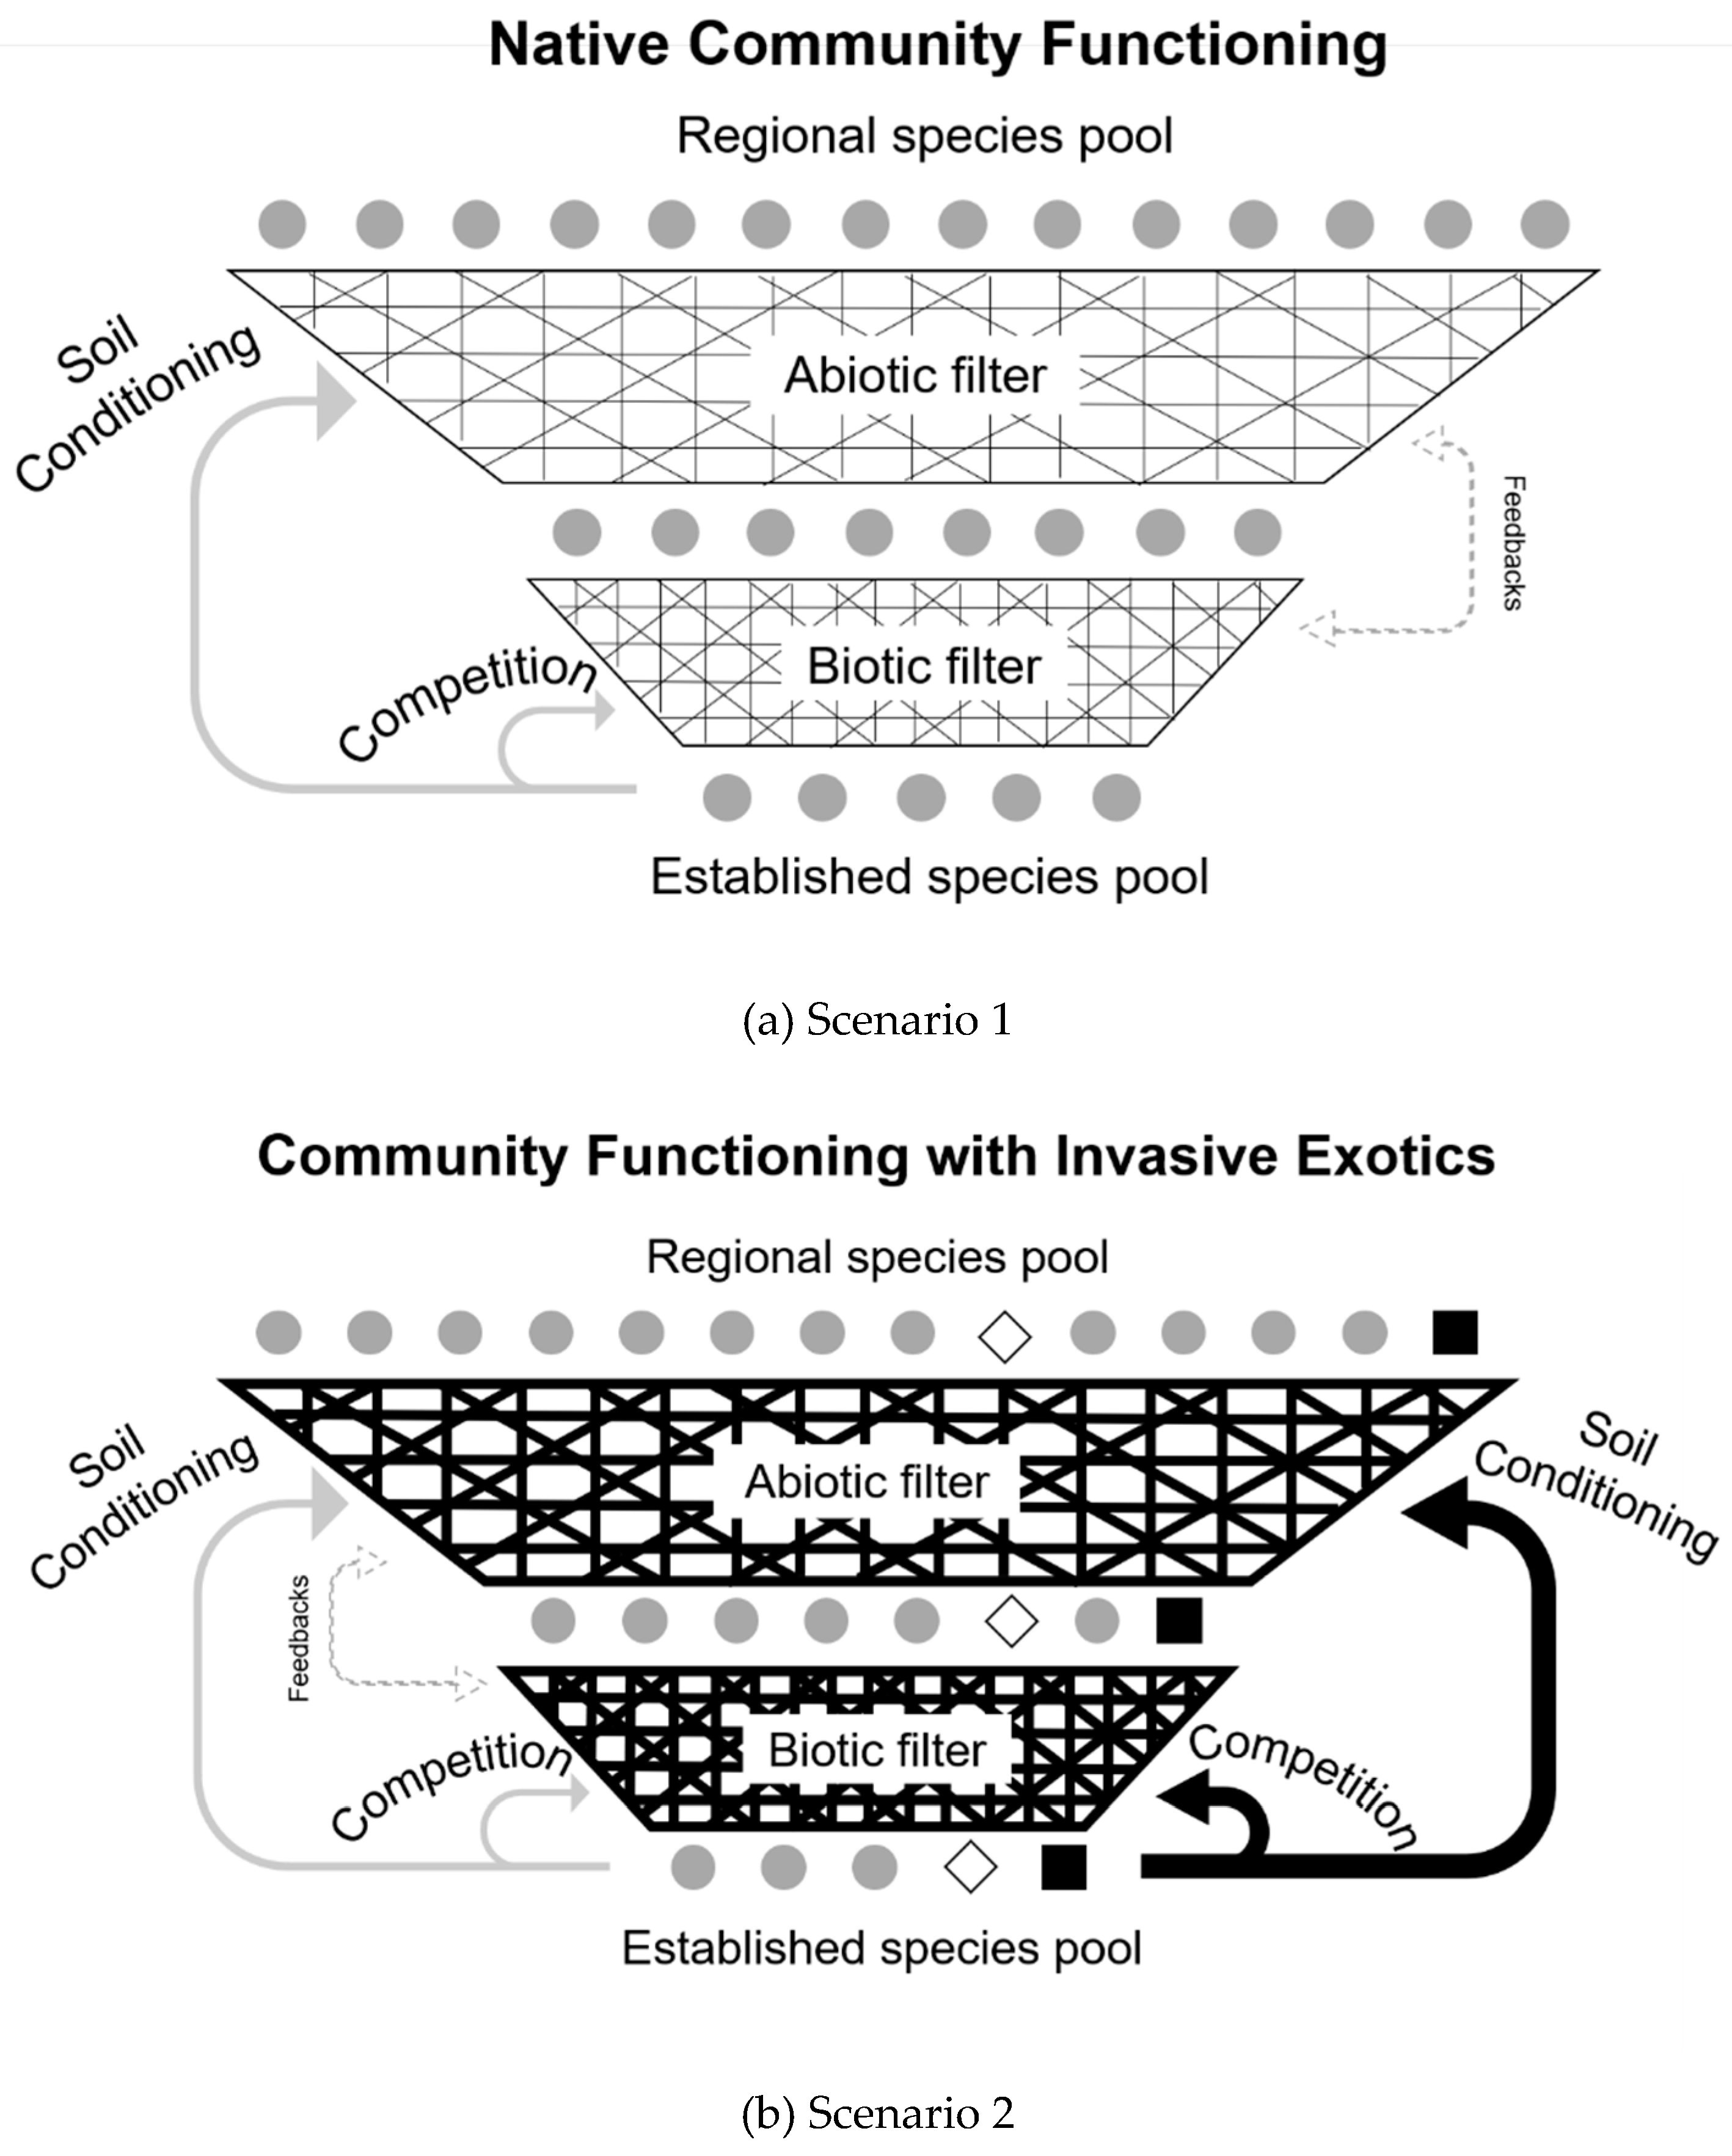
4.3. Role as a Driver and Filter
4.4. Management Implications and Outlook
5. Conclusions
Supplementary Materials
Author Contributions
Funding
Acknowledgments
Conflicts of Interest
References
- Díaz, S.; Cabido, M.; Casanoves, F. Plant functional traits and environmental filters at a regional scale. J. Veg. Sci. 1998, 9, 113–122. [Google Scholar] [CrossRef]
- Gibson, D.J.; Allstadt, A.J.; Baer, S.G.; Geisler, M. Effects of foundation species genotypic diversity on subordinate species richness in an assembling community. Oikos 2012, 121, 496–507. [Google Scholar] [CrossRef]
- Keddy, P.A. Assembly and response rules—2 goals for predictive community ecology. J. Veg. Sci. 1992, 3, 157–164. [Google Scholar] [CrossRef] [Green Version]
- Seastedt, T.R.; Pyšek, P. Mechanisms of plant invasions of North American and European grasslands. Annu. Rev. Ecol. Evol. Syst. 2011, 42, 133–153. [Google Scholar] [CrossRef] [Green Version]
- Temperton, M.V.; Hobbs, R.J. The search for ecological assembly rules and its relevance to restoration ecology. In Assembly Rules and Restoration Ecology: Bridging the Gap between Theory and Practic; Temperton, V.M., Ed.; Island Press: Washington, DC, USA, 2004; pp. 34–54. [Google Scholar]
- Wilson, D.S.; Pinno, B.D. Environmentally-contingent behaviour of invasive plants as drivers or passengers. Oikos 2013, 122, 129–135. [Google Scholar] [CrossRef]
- MacDougall, S.A.; Turkington, R. Are invasive species the drivers or passengers of change in degraded ecosystems? Ecology 2005, 86, 42–55. [Google Scholar] [CrossRef] [Green Version]
- Kulmatiski, A.; Beard, K.H. Decoupling plant-growth from land-use legacies in soil microbial communities. Soil Biol. Biochem. 2008, 40, 1059–1068. [Google Scholar] [CrossRef]
- Ortega, K.Y.; Pearson, D.E. Weak vs. strong invaders of natural plant communities: Assessing invasibility and impact. Ecol. Appl. 2005, 15, 651–661. [Google Scholar] [CrossRef]
- Richardson, D.M.; Richardson, D.M.; Pyšek, P.; Rejmánek, M.; Barbour, M.G.; Panetta, F.D.; West, C.J. Naturalization and invasion of alien plants: Concepts and definitions. Divers. Distrib. 2000, 6, 93–107. [Google Scholar] [CrossRef]
- Didham, R.K.; Tylianakis, J.M.; Hutchison, M.A.; Ewers, R.M.; Gemmell, N. Are invasive species the drivers of ecological change? Trends Ecol. Evol. 2005, 20, 470–474. [Google Scholar] [CrossRef]
- HilleRisLambers, J.; Yelenik, G.S.; Colman, P.B.; Levine, M.J. California annual grass invaders: The drivers or passengers of change? J. Ecol. 2010, 98, 1147–1156. [Google Scholar] [CrossRef] [Green Version]
- Gallien, L.; Carboni, M. The community ecology of invasive species: Where are we and what’s next? Ecography 2017, 40, 335–352. [Google Scholar] [CrossRef] [Green Version]
- Allred, W.B.; Fuhlendorf, D.S.; Monaco, A.T.; Will, E.R. Morphological and physiological traits in the success of the invasive plant Lespedeza cuneata. Biol. Invasions 2010, 12, 739–749. [Google Scholar] [CrossRef]
- Woods, M.T.; Hartnett, D.C.; Ferguson, C.J. High propagule production and reproductive fitness homeostasis contribute to the invasiveness of Lespedeza cuneata (Fabaceae). Biol. Invasions 2009, 11, 1913–1927. [Google Scholar] [CrossRef]
- Gucker, C. Lespedeza cuneata. In Fire Effects Information System [Online]; U.S. Department of Agriculture, Forest Service, Rocky Mountain Research Station, Fire Sciences Laboratory (Producer): Missoula, MT, USA, 2010. Available online: https://www.fs.fed.us/database/feis/plants/forb/lescun/all.html (accessed on 6 July 2020).
- Donnelly, E.D. Some factors that affect palatibility in sericea lespedeza, L. cuneata. Agron. J. 1954, 46, 96–97. [Google Scholar] [CrossRef]
- Farris, L.R.; Murray, D.S. Control of seedling Sericea Lespedeza (Lespedeza cuneata) with herbicides. Invasive Plant Sci. Manag. 2009, 2, 337–344. [Google Scholar] [CrossRef]
- Schutzenhofer, R.M.; Knight, T.M. Population-level effects of augmented herbivory on Lespedeza cuneata: Implications for biological control. Ecol. Appl. 2007, 17, 965–971. [Google Scholar] [CrossRef] [Green Version]
- Wong, B.M.; Houseman, G.R.; Hinman, S.E.; Foster, B.L. Targeting vulnerable life-stages of Sericea Lespedeza (Lespedeza cuneata) with prescribed burns. Invasive Plant Sci. Manag. 2012, 5, 487–493. [Google Scholar] [CrossRef]
- Gibson, J.D.; Shupert, L.A.; Liu, X. Do no harm: Efficacy of herbicide control of an invasive shrub while minimizing collateral damage to native species. Plants 2019, 8, 426. [Google Scholar] [CrossRef] [Green Version]
- Pearson, D.; Ortega, Y.; Columbus, F. Managing invasive plants in natural areas: Moving beyond weed control. In Weeds: Management, Economic Impacts and Biology; Kingely, R.V., Ed.; Nova Science Publishers, Inc.: Hauppauge, NY, USA, 2009; pp. 1–21. [Google Scholar]
- Brandon, L.A.; Gibson, D.J.; Middleton, B.A. Mechanisms for dominance in an early successional old field by the invasive non-native Lespedeza cuneata (Dum. Cours.) G. Don. Biol. Invasions 2004, 6, 483–493. [Google Scholar] [CrossRef]
- Beaton, L.L.; Van Zandt, A.P.; Esselman, J.E.; Knight, M.T. Comparison of the herbivore defense and competitive ability of ancestral and modern genotypes of an invasive plant, Lespedeza cuneata. Oikos 2011, 120, 1413–1419. [Google Scholar] [CrossRef]
- Chiuffo, C.M.; Macdougall, A.S.; Hierro, J.L. Native and non-native ruderals experience similar plant-soil feedbacks and neighbor effects in a system where they coexist. Oecologia 2015, 179, 843–852. [Google Scholar] [CrossRef] [PubMed]
- Coykendall, E.K.; Houseman, G.R. Lespedeza cuneata invasion alters soils facilitating its own growth. Biol. Invasions 2014, 16, 1735–1742. [Google Scholar] [CrossRef]
- Jordan, R.N.; Larson, D.L.; Huerd, S.C. Soil modification by invasive plants: Effects on native and invasive species of mixed-grass prairies. Biol. Invasions 2008, 10, 177–190. [Google Scholar] [CrossRef]
- Dawson, W.; Schrama, M. Identifying the role of soil microbes in plant invasions. J. Ecol. 2016, 104, 1211–1218. [Google Scholar] [CrossRef] [Green Version]
- Hu, L.; Busby, R.R.; Gebhart, L.D.; Yannarell, C.A. Invasive Lespedeza cuneata and native Lespedeza virginica experience asymmetrical benefits from rhizobial symbionts. Plant Soil 2014, 384, 315–325. [Google Scholar] [CrossRef] [Green Version]
- Crawford, M.K.; Knight, T.M. Competition overwhelms the positive plant–soil feedback generated by an invasive plant. Oecologia 2017, 183, 211–220. [Google Scholar] [CrossRef]
- Yannarell, A.C.; Busby, R.R.; Taylor, S.J. Soil bacteria and fungi respond on different spatial scales to invasion by the legume Lespedeza cuneata. Front. Microbiol. 2011, 2, 127. [Google Scholar] [CrossRef] [Green Version]
- Garten, C.T.; Classen, A.T.; Norby, R.J.; Brice, D.J.; Weltzin, J.F.; Souza, L. Role of N-2-fixation in constructed old-field communities under different regimes of CO2, temperature, and water availability. Ecosystems 2008, 11, 125–137. [Google Scholar] [CrossRef]
- Dobrowolski, W.M. The Inhibition of Old-Field Species by Lespedeza cuneata; Ohio University: Athens, Greece, 2001. [Google Scholar]
- Dudley, D.M.; Fick, W.H. Effects of sericea lespedeza residues on selected tallgrass prairie grasses. Trans. Kans. Acad. Sci. 2003, 106, 166–170. [Google Scholar] [CrossRef]
- Kalburtji, K.L.; Mosjidis, J.A. Effects of sericea-lespedeza residues on warm-season grasses. J. Range Manag. 1992, 45, 441–444. [Google Scholar] [CrossRef]
- Kalburtji, K.L.; Mosjidis, J.A. Effects of sericea-lespedeza residues on cool-season grasses. J. Range Manag. 1993, 46, 315–319. [Google Scholar] [CrossRef]
- Kalburtji, K.L.; Mosjidis, J.A. Effects of sericea-lespdeza root exudates on some perennial grasses. J. Range Manag. 1993, 46, 312–315. [Google Scholar] [CrossRef]
- Gibson, D.J. Methods in Comparative Plant Population Ecology, 2nd ed.; Oxford University Press: Oxford, UK, 2015; p. 352. [Google Scholar]
- Eddy, T.A.; Moore, C.M. Effects of sericea lespedeza (Lespedeza cuneata (Dumont) G. Don) invasion on oak savannas in Kansas. Trans. Wis. Acad. Sci. Arts Lett. 1998, 86, 57–62. [Google Scholar]
- Cohen, J. Statistical Power Analysis for the Behavioral Science, 2nd ed.; Lawrence: New York, NY, USA, 1988. [Google Scholar]
- Medvecz, E.M. Resisting Invasion: Grassland Plant Responses to an Invasive Legume, Lespedeza cuneata. Master’s Thesis, Southern Illinois University Carbondale, Carbondale, IL, USA, 2017; p. 223. [Google Scholar]
- Mohlenbrock, R.H. Vascular Flora of Illinois: A Field Guide, 4th ed.; Southern Illinois University Press: Carbondale, IL, USA; Edwardsville, IL, USA, 2014; p. 536. [Google Scholar]
- Abrams, M.D.; Hulbert, L.C. Effect of topographic position and fire on species in tallgrass prairie in northeast Kansas. Am. Midl. Nat. 1987, 117, 442–445. [Google Scholar] [CrossRef]
- Kulmatiski, A.; Beard, K.H.; Stevens, J.R.; Cobbold, S.M. Plant-soil feedbacks: A meta-analytical review. Ecol. Lett. 2008, 11, 980–992. [Google Scholar] [CrossRef]
- Soil Survey Staff. Natural Resources Conservation Service, United States Department of Agriculture. Web Soil Survey. Available online: https://websoilsurvey.sc.egov.usda.gov/ (accessed on 13 February 2017).
- Van de Voorde, T.F.J.; van der Putten, W.H.; Bezemer, T.M. Intra- and interspecific plant-soil interactions, soil legacies and priority effects during old-field succession. J. Ecol. 2011, 99, 945–953. [Google Scholar] [CrossRef]
- Meijer, S.S.; Holmgren, M.; Van der Putten, W.H. Effects of plant–soil feedback on tree seedling growth under arid conditions. J. Plant Ecol. 2011, 4, 193–200. [Google Scholar] [CrossRef]
- Van Grunsven, R.H.A.; Van der Putten, W.H.; Bezemer, T.M.; Veenendaal, E.M. Plant–soil feedback of native and range-expanding plant species is insensitive to temperature. Oecologia 2010, 162, 1059–1069. [Google Scholar] [CrossRef] [Green Version]
- Van Grunsven, R.H.A.; Van der Putten, W.H.; Bezemer, T.M.; Tamis, W.L.; Berendse, F.; Veenendaal, E.M. Reduced plant–soil feedback of plant species expanding their range as compared to natives. J. Ecol. 2007, 95, 1050–1057. [Google Scholar] [CrossRef]
- Bezemer, T.M.; Jing, J.; Bakx-Schotman, J.T.; Bijleveld, E.J. Plant competition alters the temporal dynamics of plant-soil feedbacks. J. Ecol. 2018, 106, 2287–2300. [Google Scholar] [CrossRef]
- Reinhart, K.O.; Rinella, M.J. A common soil handling technique can generate incorrect estimates of soil biota effects on plants. New Phytol. 2016, 210, 786–789. [Google Scholar] [CrossRef] [PubMed] [Green Version]
- Alcántar, G.; Sandoval, M.; Castellanos, J.Z.; Méndez, F.; Sánchez, P.; Nieves Rodríguez, M. Diagnostic methods to evaluate nutrient status of garlic, onion, and broccoli. Commun. Soil Sci. Plant Anal. 2002, 33, 2585–2598. [Google Scholar] [CrossRef]
- Hodgdon, E.A.; Warren, N.D.; Smith, R.G.; Sideman, R.G. In-season and carry-over effects of cover crops on productivity and weed suppression. Agron. J. 2016, 108, 1624–1635. [Google Scholar] [CrossRef]
- Minchin, P.R. DECODA Database for Ecological Communities Data; Australian National University: Canberra, Australia, 2015. [Google Scholar]
- Clarke, K.R.; Gorley, R.N. PRIMER v6: User Manual/Tutorial; PRIMER-E: Plymouth, UK, 2006; p. 192. [Google Scholar]
- SAS Institute. The SAS System for Windows; Release 9.4.; SAS Inst.: Cary, NC, USA, 2013. [Google Scholar]
- Perkins, L.B.; Nowak, R.S. Soil conditioning and plant-soil feedbacks affect competitive relationships between native and invasive grasses. Plant Ecol. 2012, 213, 1337–1344. [Google Scholar] [CrossRef]
- Catford, J.A.; Jones, L.P. Grassland invasion in a changing climate. In Grasslands and Climate Change; Gibson, D.J., Newman, J.A., Eds.; Cambridge University Press: Cambridge, UK, 2019; pp. 148–171. [Google Scholar]
- Perkins, L.B.; Ahlering, M.; Larson, D.L. Looking to the future: Key points for sustainable management of northern Great Plains grasslands. Restor. Ecol. 2019, 27, 1212–1219. [Google Scholar] [CrossRef] [Green Version]
- Lavorel, S. Climate change effects on grassland ecosystem services. In Grasslands and Climate Change; Gibson, D.J., Newman, J.A., Eds.; Cambridge University Press: Cambridge, UK, 2019; pp. 131–146. [Google Scholar]
- Martin, L.M.; Polley, H.W.; Daneshgar, P.P.; Harris, M.A.; Wilsey, B.R. Biodiversity, photosynthetic mode, and ecosystem services differ between native and novel ecosystems. Oecologia 2014, 175, 687–697. [Google Scholar] [CrossRef] [Green Version]
- Krauss, J.; Klein, A.M.; Steffan-Dewenter, I.; Tscharntke, T. Effects of habitat area, isolation, and landscape diversity on plant species richness of calcareous grasslands. Biodivers. Conserv. 2004, 13, 1427–1439. [Google Scholar] [CrossRef]
- Gibson, D.J. Grasses and Grassland Ecology; Oxford University Press: Oxford, UK, 2009; p. 305. [Google Scholar]
- Grman, E.; Bassett, T.; Zirbel, C.R.; Brudvig, L.A. Dispersal and establishment filters influence the assembly of restored prairie plant communities. Restor. Ecol. 2015, 23, 892–899. [Google Scholar] [CrossRef]
- Gornish, E.S.; Ambrozio dos Santos, P. Invasive species cover, soil type, and grazing interact to predict long-term grassland restoration success. Restor. Ecol. 2016, 24, 222–229. [Google Scholar] [CrossRef]
- Hooper, D.U.; Dukes, J.S. Functional composition controls invasion success in a California serpentine grassland. J. Ecol. 2010, 98, 764–777. [Google Scholar] [CrossRef]
- Fargione, J.; Brown, C.S.; Tilman, D. Community assembly and invasion: An experimental test of neutral versus niche procesess. Proc. Natl. Acad. Sci. USA 2003, 15, 8916–8920. [Google Scholar] [CrossRef] [PubMed] [Green Version]
- Leffler, A.J.; Leonard, E.D.; James, J.J.; Monaco, T.A. Invasion is contingent on species assemblage and invasive species identity in experimental rehabilitation plots. Rangel. Ecol. Manag. 2014, 67, 657–666. [Google Scholar] [CrossRef]
- Case, E.J.; Harrison, S.; Cornell, H.V. Do high-impact invaders have the strongest negative effects on abundant and functionally similar resident species? Funct. Ecol. 2016, 30, 1447–1453. [Google Scholar] [CrossRef]
- Bakker, J.D.; Wilson, S.D. Using ecological restoration to constrain biological invasion. J. Appl. Ecol. 2004, 41, 1058–1064. [Google Scholar] [CrossRef]
- Stubbs, W.J.; Bastow Wilson, J. Evidence for limiting similarity in a sand dune community. J. Ecol. 2004, 92, 557–567. [Google Scholar] [CrossRef]
- Wright, D.L.; Blaser, R.E.; Woodruff, J.M. Seedling emergence as related to temperature and moisture tension. Agron. J. 1978, 70, 709–712. [Google Scholar] [CrossRef]
- Turnbull, L.A.; Rahm, S.; Baudois, O.; Eichenberger-Glinz, S.; Wacker, L.; Schmid, B. Experimental invasion by legumes reveals non-random assembly rules in grassland communities. J. Ecol. 2005, 93, 1062–1070. [Google Scholar] [CrossRef] [Green Version]
- Foster, B.L.; Houseman, G.R.; Hall, D.R.; Hinman, S.E. Does tallgrass prairie restoration enhance the invasion resistance of post-agricultural lands? Biol. Invasions 2015, 17, 3579–3590. [Google Scholar] [CrossRef]
- Bever, J.D. Feedback between plants and their soil communities in an old field community. Ecology 1994, 75, 1965–1977. [Google Scholar] [CrossRef] [Green Version]
- Bunn, R.A.; Ramsey, P.W.; Lekberg, Y. Do native and invasive plants differ in their interactions with arbuscular mycorrhizal fungi? A meta-analysis. J. Ecol. 2015, 103, 1547–1556. [Google Scholar] [CrossRef] [Green Version]
- Kim, C.-K.; Choe, D.-M.; Mun, H.-T. Vesicular-mycorrhizae in some plants (IV). Korean J. Mycol. 1989, 17, 214–222. [Google Scholar]
- Hodge, A.; Fitter, A.H. Microbial mediation of plant competition and community structure. Funct. Ecol. 2013, 27, 865–875. [Google Scholar] [CrossRef]
- Brandon, A.L. Effects of Lespedeza cuneata, an Invasive Species, on a Successional Old-Field Plant Community; Southern Illinois University Carbondale: Carbondale, IL, USA, 2000. [Google Scholar]
- Knops, J.M.H.; Bradley, K.L.; Wedin, D.A. Mechanisms of plant species impacts on ecosystem nitrogen cycling. Ecol. Lett. 2002, 5, 454–466. [Google Scholar] [CrossRef] [Green Version]
- Shannon, S.; Flory, S.L.; Reynolds, H. Competitive context alters plant–soil feedback in an experimental woodland community. Oecologia 2012, 169, 235–243. [Google Scholar] [CrossRef] [PubMed]
- Yelenik, S.G.; Levine, J.M. The role of plant–soil feedbacks in driving native-species recovery. Ecology 2011, 92, 66–74. [Google Scholar] [CrossRef] [PubMed]
- Schittko, C.; Runge, C.; Strupp, M.; Wolff, S.; Wurst, S. No evidence that plant–soil feedback effects of native and invasive plant species under glasshouse conditions are reflected in the field. J. Ecol. 2016, 104, 1243–1249. [Google Scholar] [CrossRef] [Green Version]
- Klironomos, J.N. Feedback with soil biota contributes to plant rarity and invasiveness in communities. Nature 2002, 417, 67. [Google Scholar] [CrossRef]
- Busby, R.R.; Rodriguez, G.; Gebhart, D.L.; Yannarell, A.C. Native Lespedeza species harbor greater non-rhizobial bacterial diversity in root nodules compared to the coexisting invader, L. cuneata. Plant Soil 2016, 401, 427–436. [Google Scholar] [CrossRef]
- Craine, J.M.; Dybzinski, R. Mechanisms of plant competition for nutrients, water and light. Funct. Ecol. 2013, 27, 833–840. [Google Scholar] [CrossRef]
- Heard, M.J.; Sax, D.F. Coexistence between native and exotic species is facilitated by asymmetries in competitive ability and susceptibility to herbivores. Ecol. Lett. 2013, 16, 206–213. [Google Scholar] [CrossRef] [PubMed]
- White, S.R.; Tannas, S.; Bao, T.; Bennett, J.A.; Bork, E.W.; Cahill, J.F., Jr. Using structural equation modelling to test the passenger, driver and opportunist concepts in a Poa pratensis invasion. Oikos 2013, 122, 377–384. [Google Scholar] [CrossRef]
- Gaertner, M.; Den Breeyen, A.; Hui, C.; Richardson, D.M. Impacts of alien plant invasions on species richness in Mediterranean-type ecosystems: A meta-analysis. Prog. Phys. Geogr. 2009, 33, 319–338. [Google Scholar] [CrossRef]
- MacDougall, A.S.; Gilbert, B.; Levine, J.M. Plant invasions and the niche. J. Ecol. 2009, 97, 609–615. [Google Scholar] [CrossRef]
- Fill, J.M.; Pearson, E.; Knight, T.M.; Crandall, R.M. An invasive legume increases perennial grass biomass: An indirect pathway for plant community change. PLoS ONE 2019, 14, e0211295. [Google Scholar] [CrossRef]
- Funk, J.L.; Cleland, E.E.; Suding, K.N.; Zavaleta, E.S. Restoration through reassembly: Plant traits and invasion resistance. Trends Ecol. Evol. 2008, 23, 695–703. [Google Scholar] [CrossRef]
- Walder, M.; Armstrong, J.E.; Borowicz, V.A. Limiting similarity, biotic resistance, nutrient supply, or enemies? What accounts for the invasion success of an exotic legume? Biol. Invasions 2019, 21, 435–449. [Google Scholar] [CrossRef]
- Tlusty, B.; Grossman, J.M.; Graham, P.H. Selection of rhizobia for prairie legumes used in restoration and reconstruction programs in Minnesota. Can. J. Microbiol. 2004, 50, 977–983. [Google Scholar] [CrossRef]
- Thorpe, A.S.; Perakis, S.; Catricala, C.; Kaye, T.N. Nutrient limitation of native and invasive N2-fixing plants in northwest prairies. PLoS ONE 2013, 8, e84593. [Google Scholar] [CrossRef]
- Masters, R.A.; Sheley, R.L. Principles and practices for managing rangeland invasive plants. J. Rangel. Manag. 2001, 54, 502–517. [Google Scholar] [CrossRef]
- Sheley, R.; James, J.; Smith, B.; Vasquez, E. Applying ecologically based invasive-plant management. Rangel. Ecol. Manag. 2010, 63, 605–613. [Google Scholar] [CrossRef]


| Functional Groups | Origin Groups | Diversity Measures | Survey Variables | Abiotic/Management |
|---|---|---|---|---|
| Grass (R = 0.36, p = 0.02) | Native (R = 0.84, p < 0.0001) | Shannon diversity (R = 0.44, p = 0.002) | Site (R = 0.26, p = 0.15) | Site age (2–45 years) (R = 0.19, p = 0.34) |
| Forb (R = 0.59, p < 0.0001) | Non-Native (R = 0.43, p = 0.008) | Simpson diversity (R = 0.47, p = 0.001) | Survey round (R = 0.04, p = 0.96) | Site size (0.4-14.16 ha) (R = 0.37, p = 0.018) |
| Legume (R = 0.32, p = 0.05) | Invasive (R = 0.86, p < 0.0001) | Evenness (R = 0.41, p = 0.006) | L. cuneata presence (R = 0.06, p = 0.90) | History of fire (yes, no) (R = 0.74, p < 0.0001) |
| Sedge/rush (R = 0.13, p = 0.60) | Richness (R = 0.43, p = 0.003) | L. cuneata abundance (R = 0.23, p = 0.23) | L. cuneata herbicide treatment (yes, no) (R = 0.51, p = 0.0003) | |
| Vine (R = 0.32, p = 0.04) | Soil type (Alfisols, Inceptisols, Enstisols) (R = 0.53, p < 0.0001) | |||
| Woody (R = 0.13, p = 0.58) | Slope (0–20 degrees) (R = 0.59, p = 0.0002) |
| Site | Max R | p-Value |
|---|---|---|
| Bass Pond East (CONWR) | 0.06 | 0.02 |
| Bass Pond West (CONWR) | 0.03 | 0.09 |
| Cache River | 0.09 | 0.009 |
| Cave Creek Glade | 0.13 | 0.0007 |
| Dixon Springs | 0.07 | 0.04 |
| Faulkner-Franke Prairie | 0.05 | 0.02 |
| Hampton Complex 6 (CONWR) | −0.04 | 0.77 |
| Headquarters Prairie (CONWR) | 0.16 | <0.00001 |
| North Prairie 1 (CONWR) | 0.08 | 0.0005 |
| North Prairie 2 | 0.01 | 0.26 |
| Pennant Bar 1 | 0.05 | 0.06 |
| Pennant Bar 2 | 0.03 | 0.11 |
| Postage Stamp (CONWR) | 0.02 | 0.15 |
| Pyramid State Park Denmark | 0.05 | 0.06 |
| Pyramid State Park Galum | 0.19 | <0.0001 |
© 2020 by the authors. Licensee MDPI, Basel, Switzerland. This article is an open access article distributed under the terms and conditions of the Creative Commons Attribution (CC BY) license (http://creativecommons.org/licenses/by/4.0/).
Share and Cite
Garrett, E.M.; Gibson, D.J. Identifying Sustainable Grassland Management Approaches in Response to the Invasive Legume Lespedeza cuneata: A Functional Group Approach. Sustainability 2020, 12, 5951. https://0-doi-org.brum.beds.ac.uk/10.3390/su12155951
Garrett EM, Gibson DJ. Identifying Sustainable Grassland Management Approaches in Response to the Invasive Legume Lespedeza cuneata: A Functional Group Approach. Sustainability. 2020; 12(15):5951. https://0-doi-org.brum.beds.ac.uk/10.3390/su12155951
Chicago/Turabian StyleGarrett, Erin M., and David J. Gibson. 2020. "Identifying Sustainable Grassland Management Approaches in Response to the Invasive Legume Lespedeza cuneata: A Functional Group Approach" Sustainability 12, no. 15: 5951. https://0-doi-org.brum.beds.ac.uk/10.3390/su12155951