Climatology and Dynamical Evolution of Extreme Rainfall Events in the Sinai Peninsula—Egypt


1
CNR-IBE, 00185 Rome, Italy
2
Water Resources Research Institute (WRRI), National Water Research Center (NWRC), 13621 Cairo, Egypt
3
Technical Office, Headquarter, National Water Research Center (NWRC), 13411, Cairo, Egypt
4
Accademia dei Georgofili, 50122 Firenze, Italy
*
Author to whom correspondence should be addressed.
Sustainability 2020, 12(15), 6186; https://0-doi-org.brum.beds.ac.uk/10.3390/su12156186
Submission received: 7 June 2020
/
Revised: 26 July 2020
/
Accepted: 28 July 2020
/
Published: 31 July 2020
(This article belongs to the Special Issue Risk-Informed Sustainable Development in the Rural Tropics)
Abstract
:The whole Mediterranean is suffering today because of climate changes, with projections of more severe impacts predicted for the coming decades. Egypt, on the southeastern flank of the Mediterranean Sea, is facing many challenges for water and food security, further exacerbated by the arid climate conditions. The Nile River represents the largest freshwater resource for the country, with a minor contribution coming from rainfall and from non-renewable groundwater aquifers. In more recent years, another important source is represented by non-conventional sources, such as treated wastewater reuse and desalination; these water resources are increasingly becoming valuable additional contributors to water availability. Moreover, although rainfall is scarce in Egypt, studies have shown that rainfall and flash floods can become an additional available source of water in the future. While presently rare, heavy rainfalls and flash floods are responsible for huge losses of lives and infrastructure especially in parts of the country, such as in the Sinai Peninsula. Despite the harsh climate, water from these events, when opportunely conveyed and treated, can represent a precious source of freshwater for small communities of Bedouins. In this work, rainfall climatology and flash flood events are presented, together with a discussion about the dynamics of some selected episodes and indications about future climate scenarios. Results can be used to evaluate the water harvesting potential in a region where water is scarce, also providing indications for improving the weather forecast. Basic information needed for identifying possible risks for population and infrastructures, when fed into hydrological models, could help to evaluate the flash flood water volumes at the outlets of the effective watershed(s). This valuable information will help policymakers and local governments to define strategies and measures for water harvesting and/or protection works.
1. Introduction
In recent decades, as in past times, heavy rainfall resulting in flash floods has affected not only the Egyptian coastal areas along the Mediterranean Sea and the Red Sea but also arid and semi-arid areas such as Upper Egypt (e.g., Luxor, Aswan, and Assiut) and the Sinai Peninsula [1,2,3,4,5].
Under changing climate conditions, the frequency of extreme rainfall episodes is also changing. These episodes, although rare, can be catastrophic in regions characterized by very low annual precipitation, with large impacts on lives, infrastructures, properties, and last but not least, to the great cultural heritage of Egypt [6]. Recent heavy rainfall events in the densely populated region of Cairo Governorate have forced authorities to close schools, offices, and highways connecting Cairo to other provinces, producing electricity disruption and floods in large areas of the town. These floods have also trapped people in their cars for several hours, as happened during the recent episodes that occurred in April 2018, October 2019, and March 2020 [7,8,9,10].
Scientific literature [11] has illustrated how the heavy rainfall and subsequent flash floods can be harmful in the Sinai Peninsula and how important the production of risk maps and implementing the flash flood protection works for the main watersheds of the Peninsula is, taking into consideration the complex morphological parameters [12,13]. Concerning the heavy rainfall episodes that have occurred in the Middle East Region and specifically in Egypt, many authors, e.g., [14,15,16,17,18], have focused their analysis on the evolution of extreme rainfall episodes and on the atmospheric pattern precursors of the evolution of these events. Due to the scale of the rare phenomenon, the forecast of a small or, at its largest, mesoscale severe thunderstorm, bringing heavy rainfall and causing flash flood, is not an easy task. Only the use of an appropriate tool like a mesoscale model can help to produce a timely and detailed forecast of the episode, which can be used as the major “ingredient”, together with data-driven weather-runoff forecast models, for an Early Warning System (EWS) to be adopted in order to avoid or, at least, minimize major impacts and save lives [19,20,21]. In addition, if, in this flood-prone region, it is important on one hand to minimize damages and avoid disastrous events deriving from severe thunderstorms, on the other hand, it is also important to favor the use of rainfall as a precious source of fresh water. For this purpose, it is essential that the development and use of EWS [19,20,21] present high performances.
In order to decrease the uncertainties in the EWS, it is necessary to work on the improvement of Weather Prediction Tools (WPT) in parallel with the adoption of a sophisticated data-driven weather-runoff model; however, this improvement can come only through a thorough validation of the WPT. Due to their randomness, low frequency of occurrence, rapidity in evolution, and small mesoscale dimension, observations related to these thunderstorms are scarce in the Region and do not permit a robust validation of WPT and therefore of EWS. In this respect, the aim of the present study is to contribute to an increase of the knowledge about the present and future occurrence of extreme rainfall events in the Sinai Peninsula and on their dynamics.
To this aim, the study starts with a general overview of the climatic trends in the Sinai Peninsula, followed by a discussion on the climatology of extreme rainfall events in Sinai and by the analysis of a selection of heavy rainfall episodes. The second part of the study presents a general overview of future climate scenarios that might affect the frequency and intensity of extreme events in this region. This part of the work not only gives some general information, but also results can represent a necessary basis for more detailed climate scenario studies, and it will possibly encourage the development of specific regional projections at a higher resolution. More detailed scenario analysis can be used for the implementation of more sophisticated risk maps for future decades and can foster the elaboration and adoption of adaptation plans for population, agriculture, and water resources management and, finally, might help the decision-makers to plan the construction of flood water harvesting structures and flash flood protection works.
2. Materials and Methods
2.1. Data and Methods
The climatological analysis of the current climate and its changes in the last decades is based on the National Centers for Environmental Modeling/National Center for Atmospheric Research global analyses of atmospheric fields, NCEP/NCAR reanalysis, provided by National Oceanic and Atmospheric Administration (NOAA) [22] as well as the global atmospheric reanalysis ERA-Interim provided by the European Centre for Medium-Range Weather Forecasts (ECMWF) available at a spatial resolution of approximately 80 km [23]. The annual rainfall trend over Sinai Peninsula is analyzed using the Global Precipitation Climate Center data (GPCC) provided by the NOAA Physical Sciences Laboratory (PSL), Boulder, Colorado, USA (https://psl.noaa.gov/). The study of the spatio-temporal evolution of the selected episodes of heavy rainfall is based on the analysis of meteorological data from ground stations in Sinai and rainfall estimates derived by satellite images from Tropical Rainfall Measuring Mission (TRMM) and the Hydrologic Data and Information System (HyDIS). In addition, NCEP-NCAR reanalysis is used to highlight the atmospheric patterns before, during, and after the selected episodes in order to individuate (i) the main atmospheric patterns contributing to the evolution of the events, (ii) possible driving mechanisms, and (iii) similarities among the events. Finally, climate scenarios at the regional scale were obtained from the outputs available through the Coordinated Regional Downscaling Experiment (CORDEX).
2.2. Study Area
Egypt is located on the northeastern side of Africa, covering nearly 3% of the total area of the continent. This country is bordered to the north by the Mediterranean Sea and to the east by the Red Sea, by the Gulf of Aqaba and Palestine, to the south by the Republic of Sudan, and to the west by the Republic of Libya. A few geographical sub-regions of the country can be identified: the Nile valley and delta, covering about 4% of the total area; the Eastern desert, covering about 22%; the Western desert, covering about 68%; and the Sinai Peninsula, covering about 6%.
Hot and dry conditions characterize the general climate of Egypt with an average annual rainfall over the whole country of about 10 mm. Even along the narrow northern strip of the Mediterranean coastal land, where most of the rainfall occurs, the average annual rainfall is usually less than 200 mm, and this amount very rapidly decreases proceeding further inland. The only regular supply of water is from the Nile. This river, which has its main source in the highlands of East Africa, crosses Egypt from the south to north end with a large delta in the Mediterranean Sea. In Egypt, the Nile water is artificially channeled on both sides. The Nile supports the life along its length, and allowed the growth of a great civilization in peace and stability [24]. The importance of the river was very clear since ancient times; in fact, Herodotus (484–425 BC) stated that “Egypt is the Gift of the Nile”.
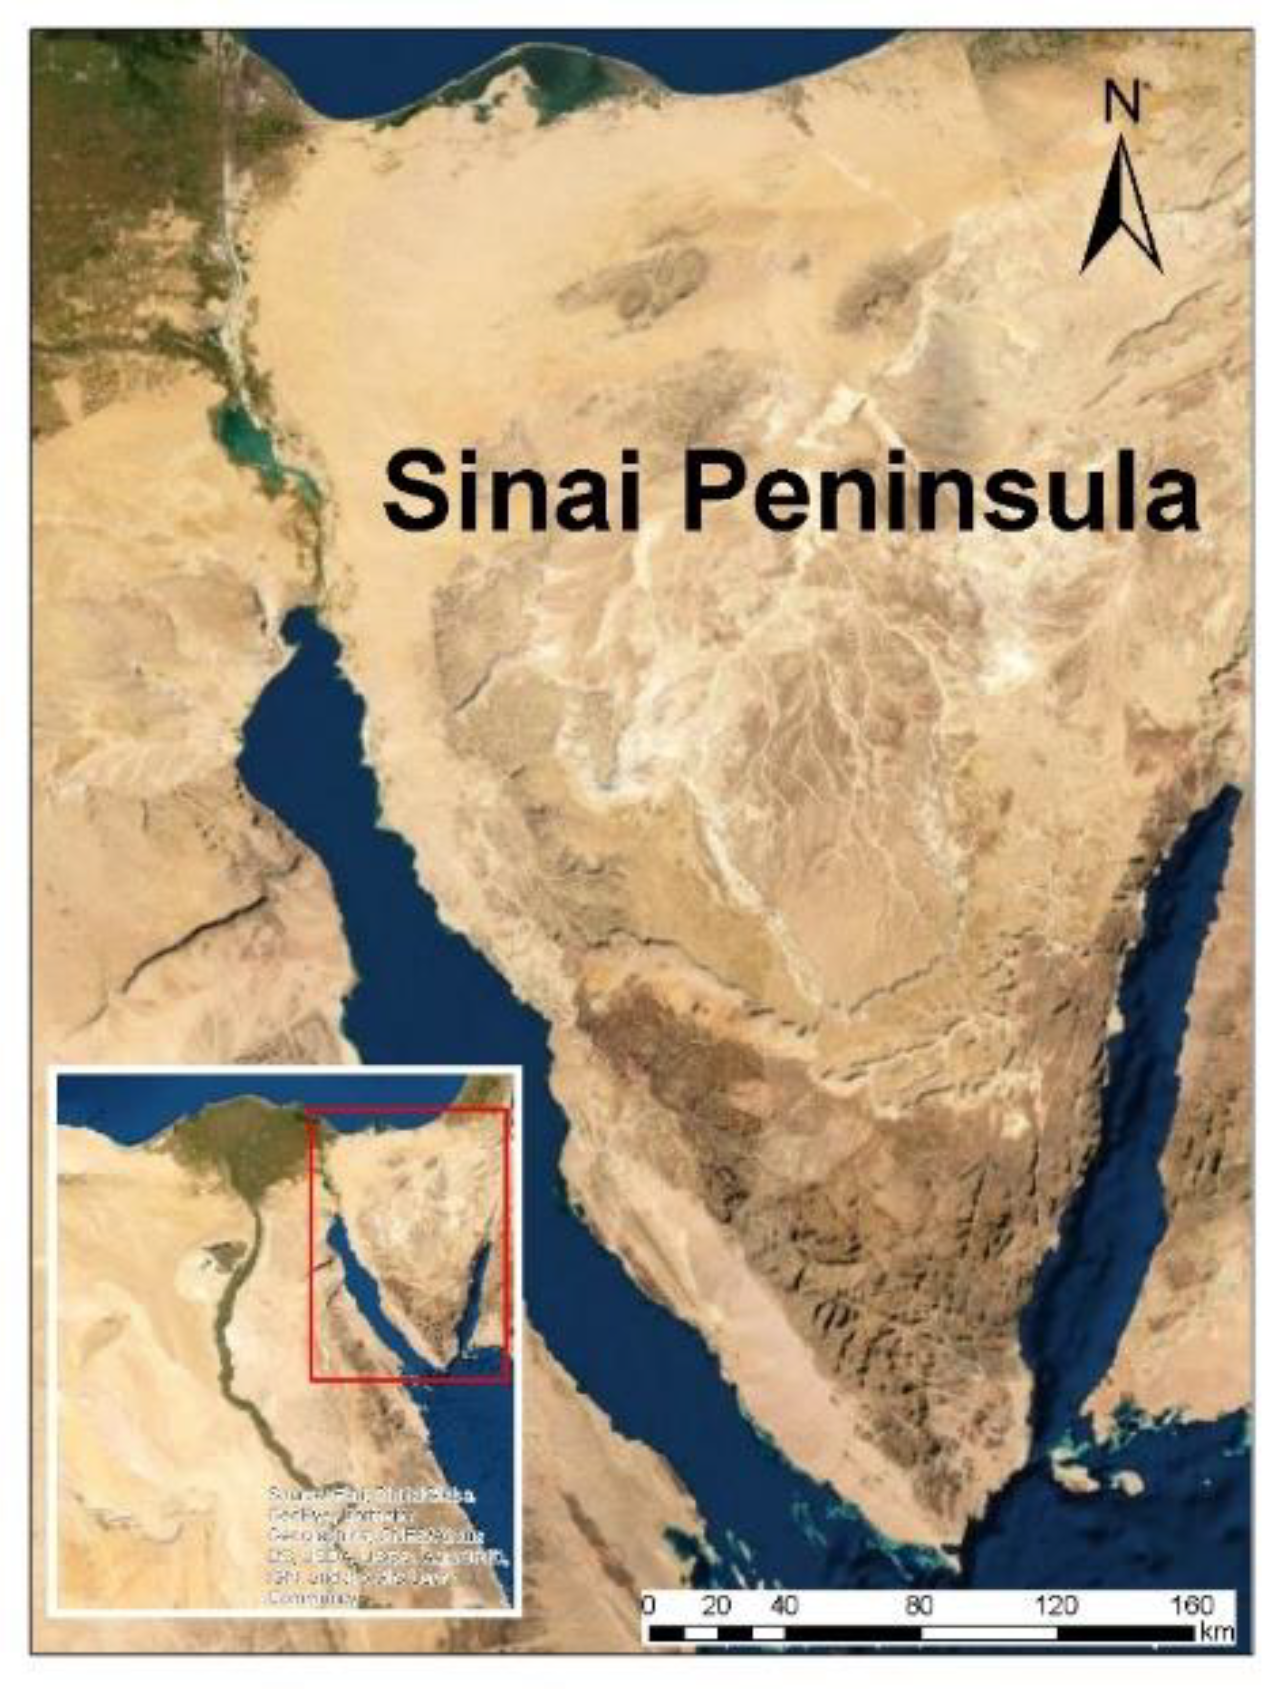
The study area of the present work is Sinai, a triangular-shaped peninsula with an area of about 60,000 km2; this peninsula is bounded by the Mediterranean Sea to the north, the Red Sea to the south, and by the Gulfs of Suez and Aqaba to the west and to the east, respectively (Figure 1). The territory of the region is quite rough with a complex orography and elevated mountains, which reach up to and above 2400 m ASL (above sea level); Mount Catherine, Egypt’s highest mountain, reaches 2642 m ASL. The central area of Sinai consists of two plateaus, Al-Tih and Al-Ajmah, both deeply indented and dipping northward towards Wadi El Arish. Towards the Mediterranean Sea, the region is characterized by a plateau, by a system of a number of dome-shaped hills, and by a belt of parallel dunes, which can be as high as 100 m.
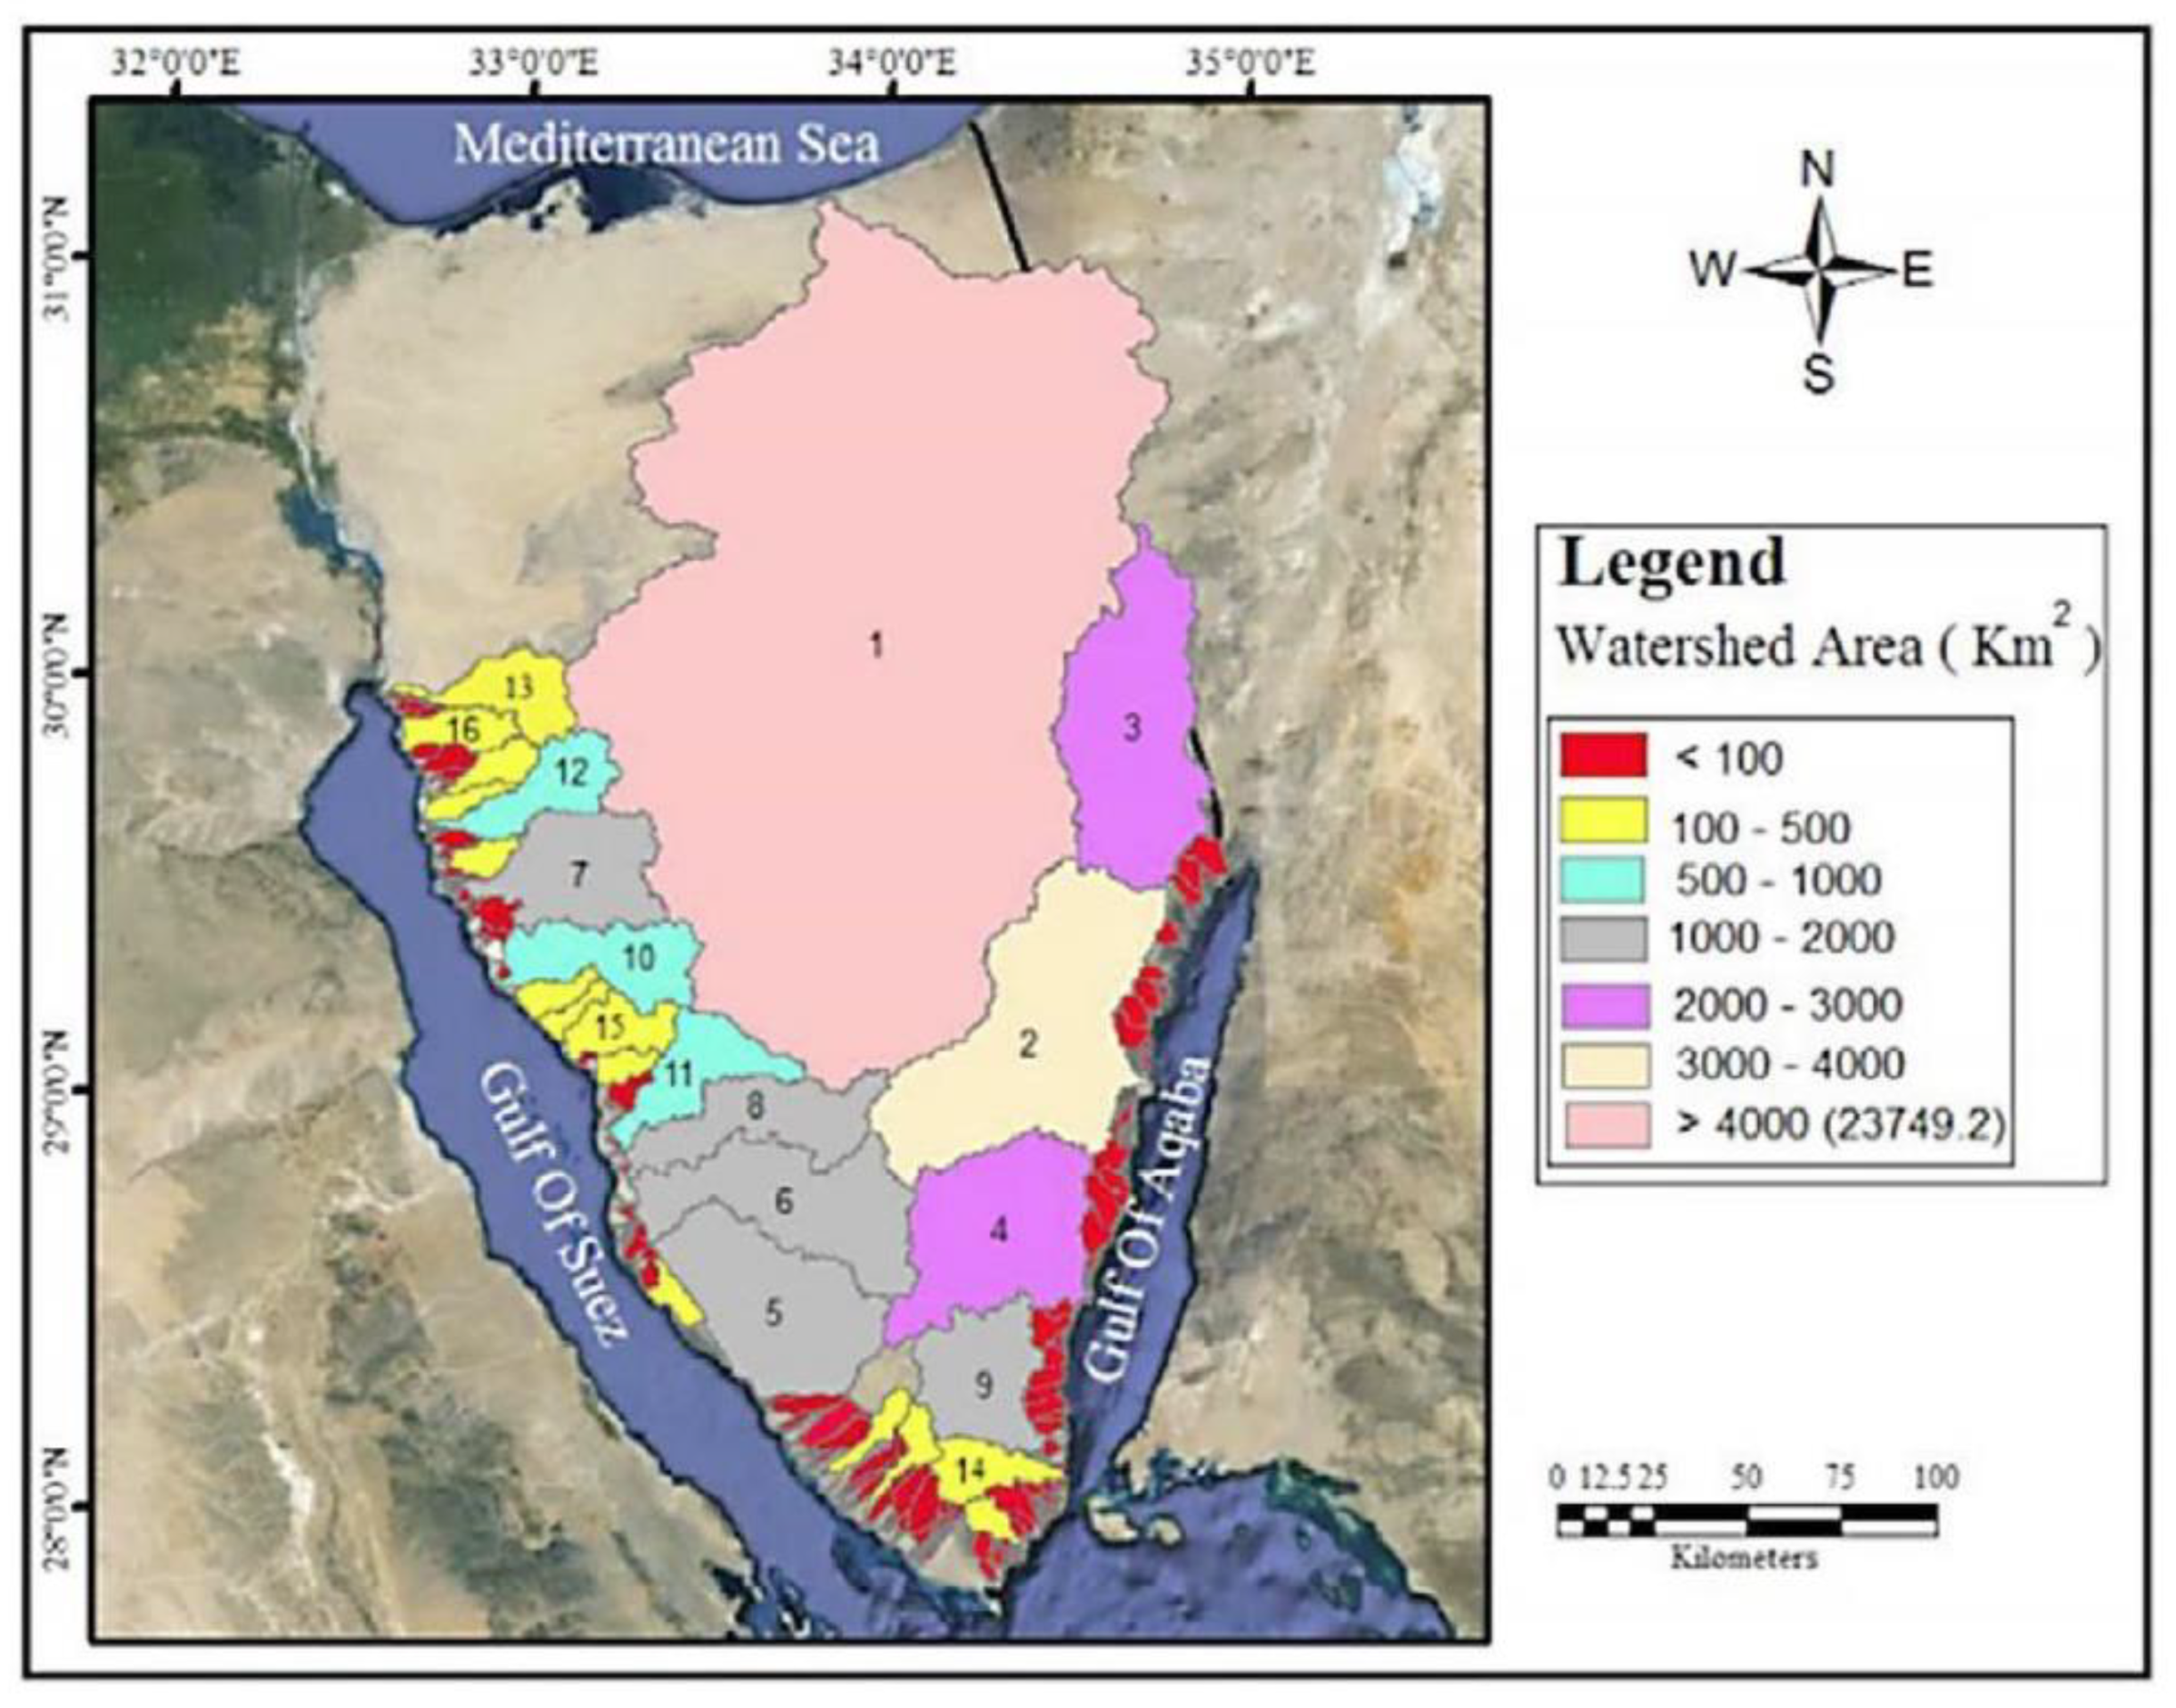
The whole territory of the Peninsula is characterized by the presence of numerous watersheds, which discharge rainwater on three sides: the Mediterranean Sea, the Gulf of Aqaba, and the Gulf of Suez (Figure 2). Rivers in these watersheds are short but fierce because of the combined effect of steep slopes and rare episodes of heavy rainfall. The main characteristics of the watersheds in the Sinai Peninsula are summarized in Table 1, as in [25].
Sinai is economically important for Egypt because it represents one of its largest mining areas. This peninsula has also a great potential for agriculture and industrial development. Although there are some limitation: the region is prone to flash flood events resulting from heavy, sudden, and short duration rainfall events, which represent a risk for the population, infrastructures, properties, and economic sectors like industry and agriculture itself.
On the other hand, flash floods caused by heavy rainfall events in Sinai and southern/southeastern Egypt represent a potential source of non-conventional freshwater resources. In particular, the water, which usually drains into the Gulf of Suez and the Gulf of Aqaba, if wisely harvested, could fulfill a non-negligible amount of water demand and/or recharge the shallow groundwater aquifers, becoming a precious fresh water source for local people of the region and their agriculture.
3. Results
3.1. Climate Variability in the Sinai Peninsula
The temperature and precipitation monthly mean over the country are shown in Figure 3, evaluated using ECMWF ERA-Interim reanalysis for the period 1981–2010. In the northern part, the Sinai Peninsula is characterized by a Mediterranean climate, whilst in the southern part, the climate is semi-desert to desert. Thus, in most of the Peninsula the climate is hot to very hot. However, sub-regions along the Mediterranean coast in the North and over the mountains are more temperate. In winter, the temperatures are surely lower, with temperatures that can drop to 0 °C at night over the mountains (Figure 3). Most of the precipitation occurs during the winter and then in spring and autumn, while during summer rainfall is almost totally absent over the Sinai (Figure 3).
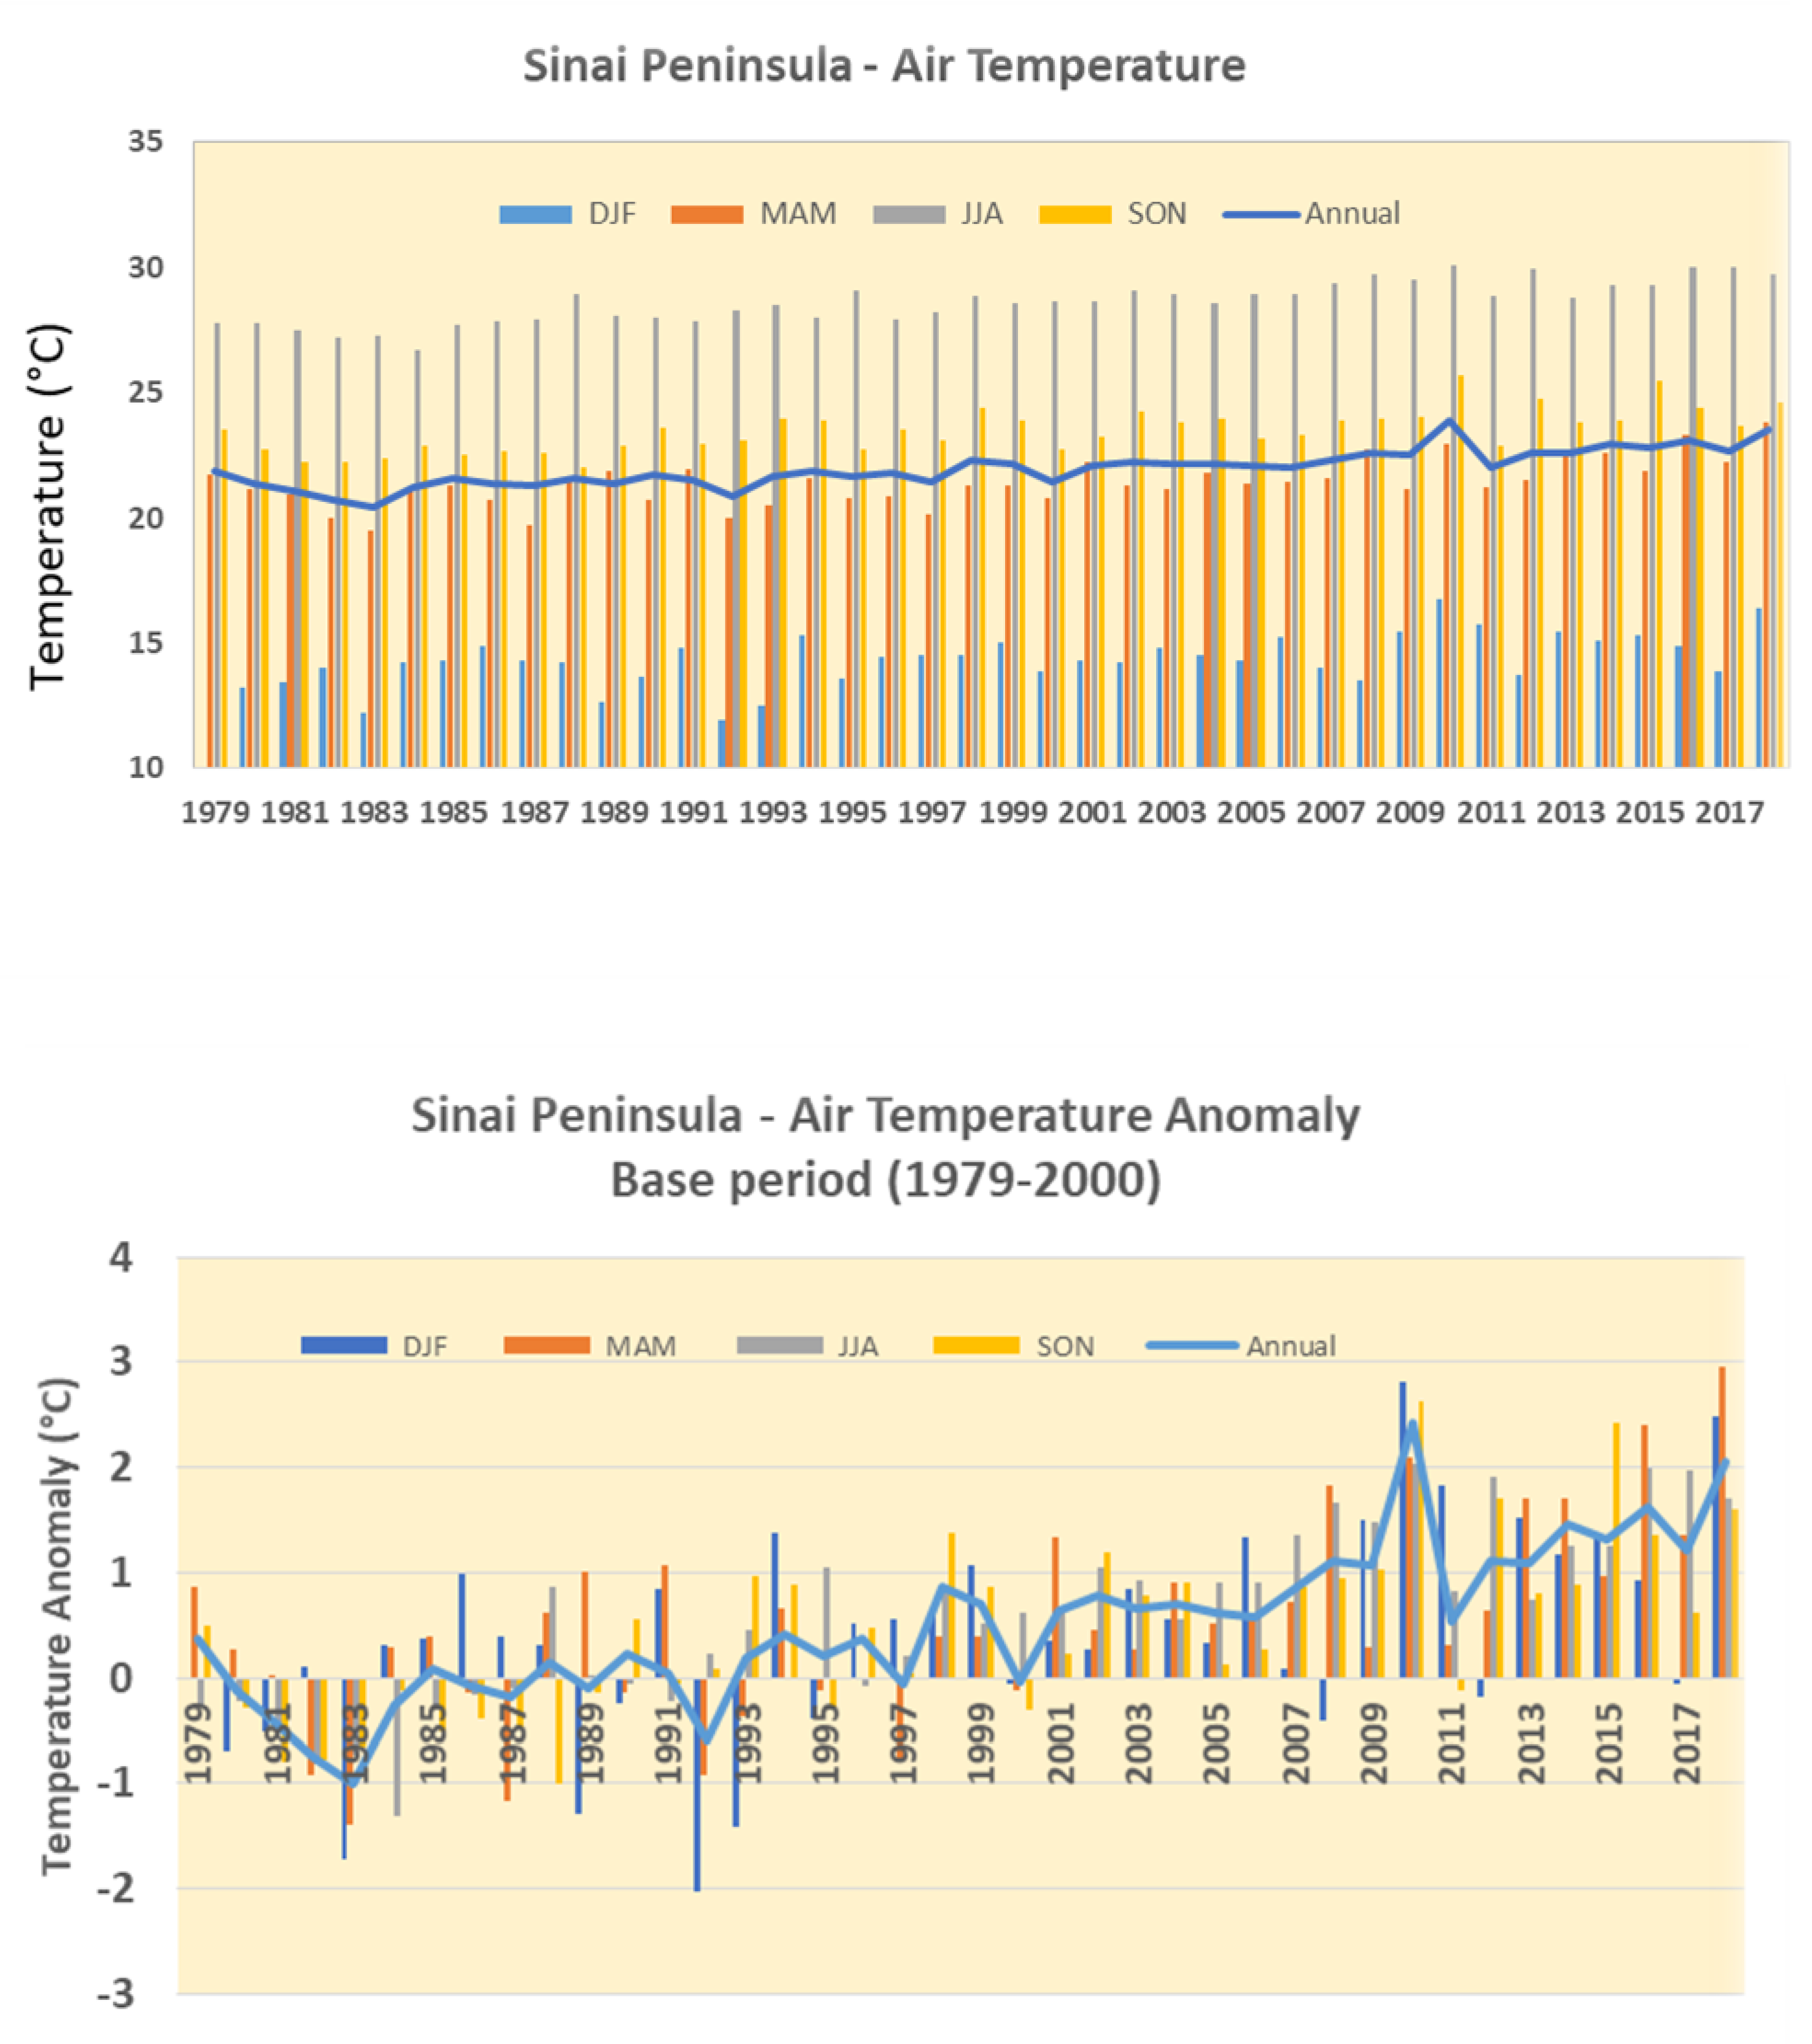
Using ECMWF ERA-Interim reanalysis, an increase of about 1 °C in mean temperature has been evaluated over Sinai, as shown in Figure 4. This figure shows the anomalies of air temperature at 850 hPa during the last decade over the African Continent at large compared to the baseline period (1979–2000). In addition, the analysis performed using ECMWF ERA-Interim reanalysis for the period 1979 to 2018 over the domain (27°–32° N, 32°–35° E) shows a clear tendency towards increasing average temperatures (Figure 5) and decreasing total rainfall (Figure 6).
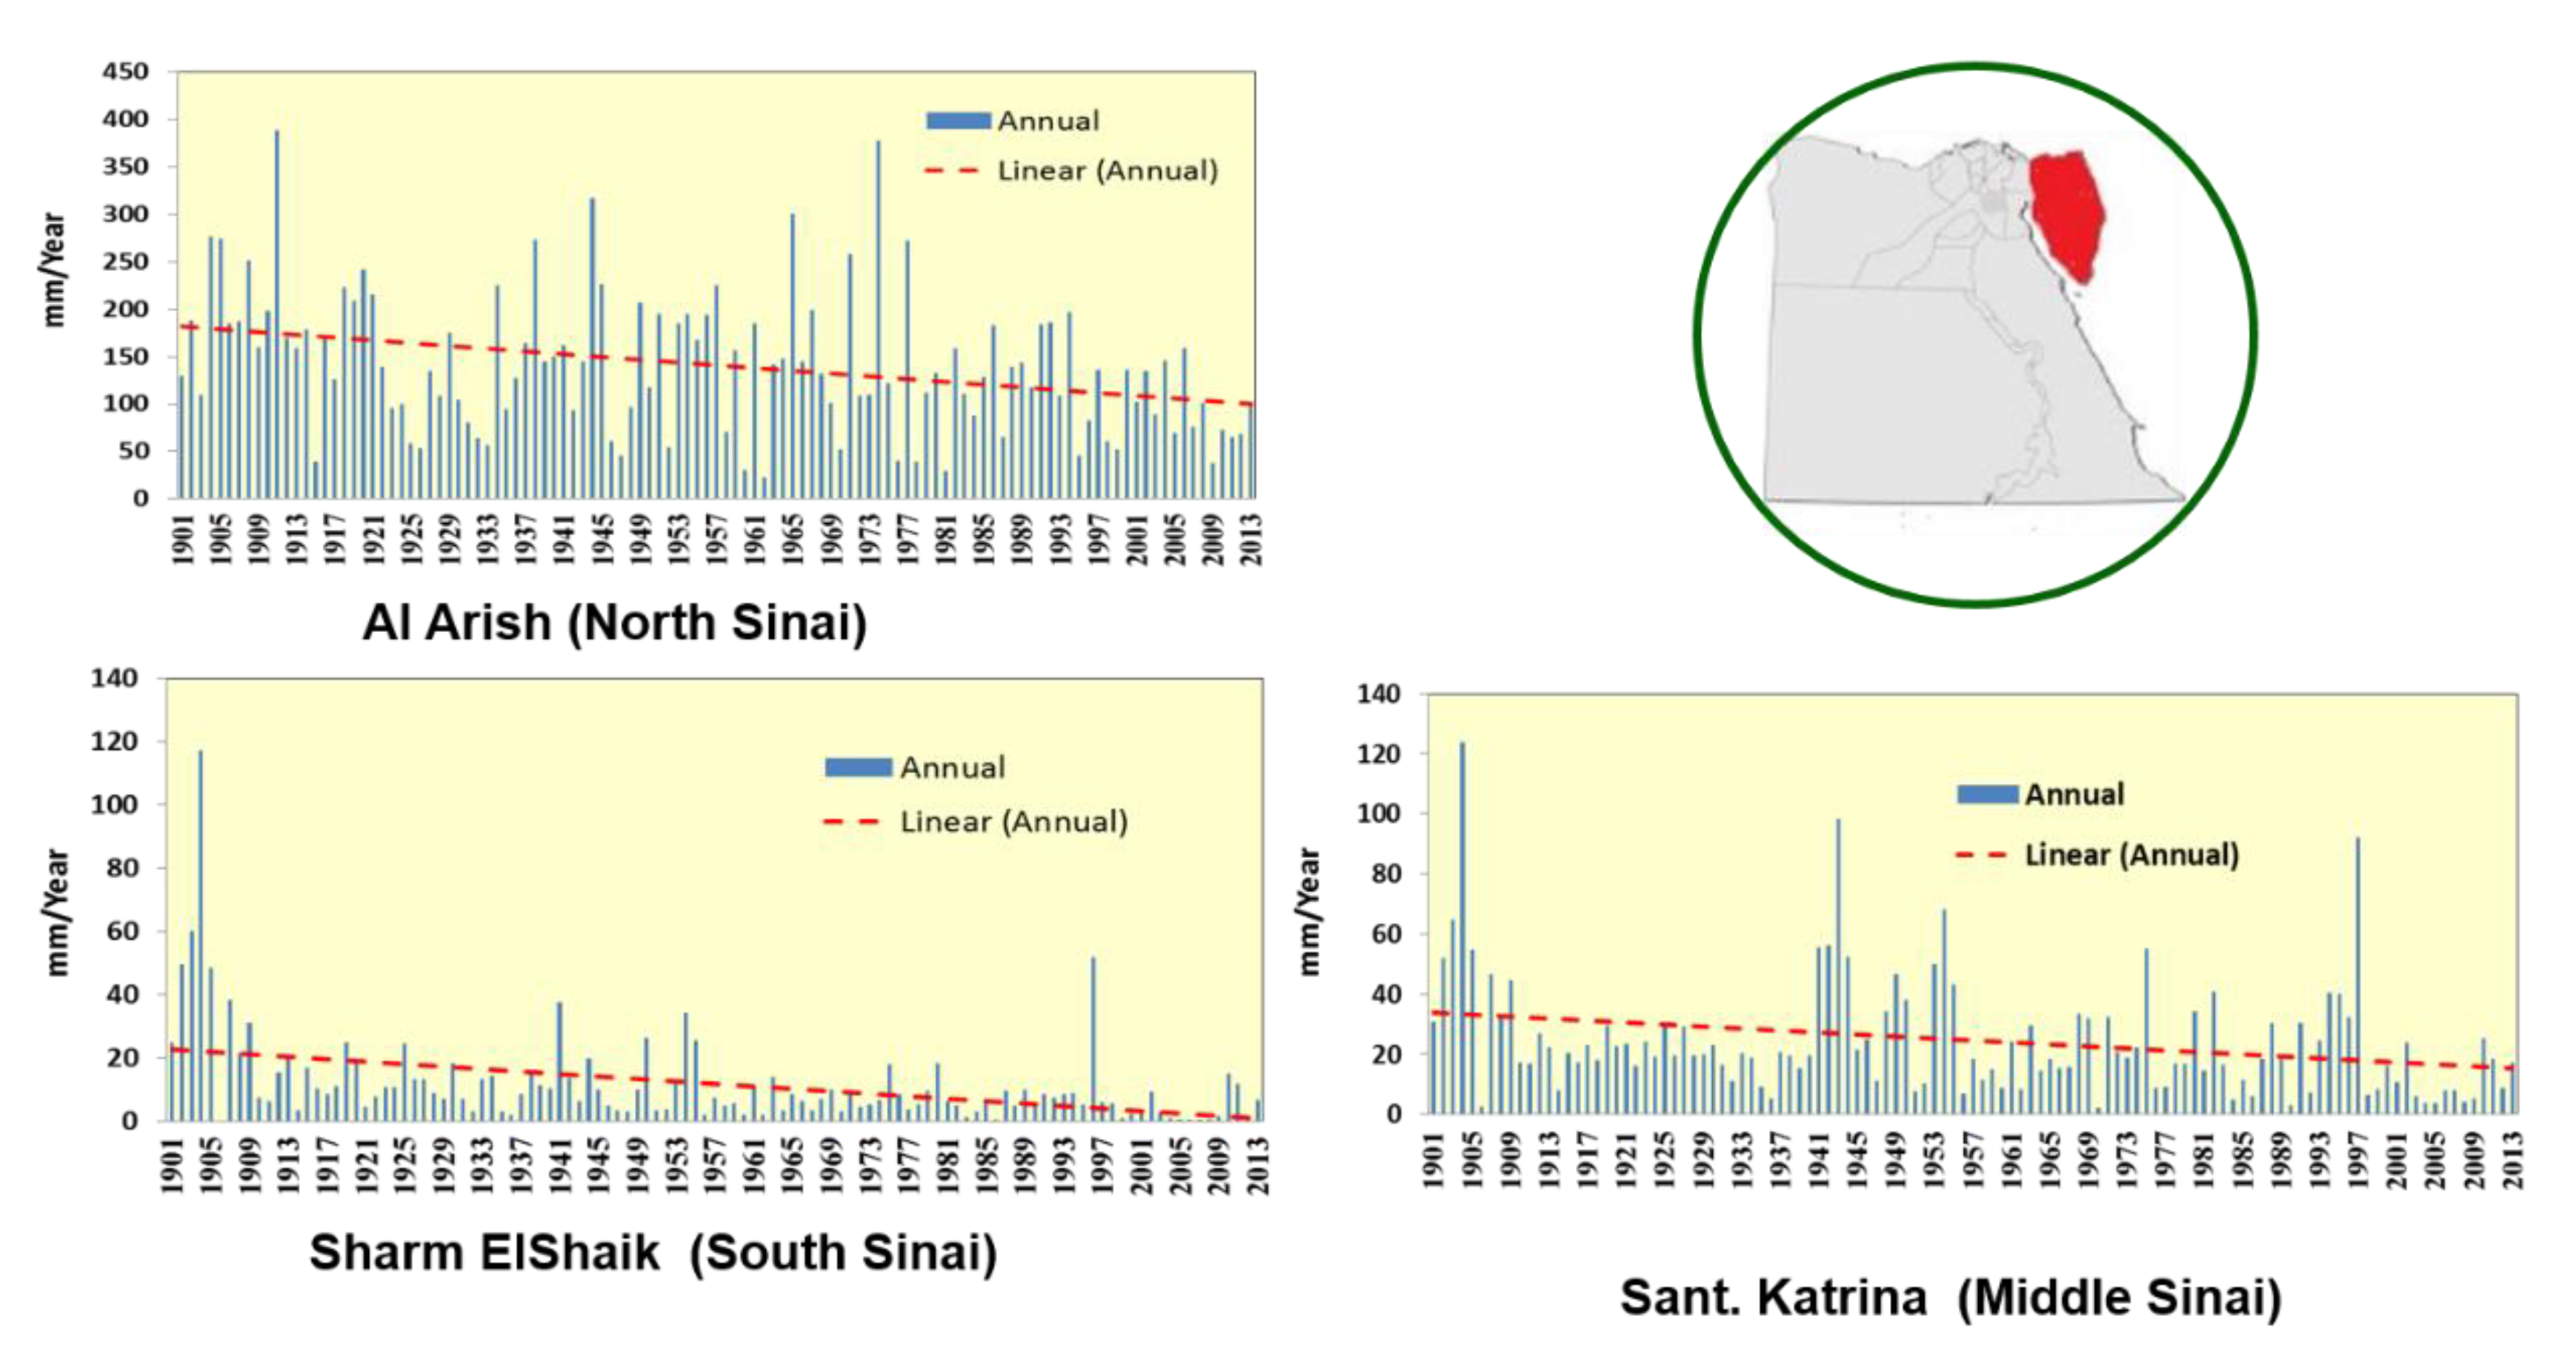
The analysis of the GPCC historical data for the period 1901–2013, shows a tendency to decrease precipitation in different sub-regions of the Sinai Peninsula: in the North, at the border with the Mediterranean Sea, in the Centre, and in the South (Figure 7). In general, the total rainfall distribution is quite different along the Peninsula, and it decreases from the northeast towards the southwest, with a maximum in Rafah. The southern part of the Peninsula is characterized by much lower rainfall totals in coastal areas, along the Gulfs of Suez and Aqaba.
3.2. Extreme Rainfall Events in Sinai
The analysis of rainfall data is the most important element in hydrological studies because it can be used in the EWS development as input to determine the flood discharges. Timing, duration, and extent of rainfall episodes are especially important in Sinai because they represent the major potential source of renewable water. Unfortunately, these flash floods are very difficult to forecast; in addition, their fresh water is difficult to collect because of the steepness of the slopes of the terrain in the peninsula. Moreover, in this semiarid-to-arid region, rainfall is usually characterized by extremely high spatial and temporal variability [26], with intense episodes of very short duration, spatially scattered over the territory. These characteristics make the collection of this water very difficult without the construction of important infrastructures. An additional source of fresh water is the non-renewable groundwater, as in the case of the Nubian Aquifer.
As already mentioned, in recent decades Sinai has been affected by significant changes in the climate, with drier and hottest conditions relative to the baseline period (Figure 4, Figure 5 and Figure 6), and with more intense storms with associated short, but intense rainfall events. This trend caused severe and long dry periods suddenly interrupted by sporadic intense rainfall with increased space-time variability; this has increased the forecast difficulties in recent years. If this tendency continues, the impacts on the natural environment and resources, including renewable water, as well as on population, infrastructure, and properties, will be severe.
The major storms which affected North and South Sinai in the past years are listed in Table 2 for South Sinai and in Table 3 for North Sinai. The lists show how the number of events since the year 2000 is quite significant.
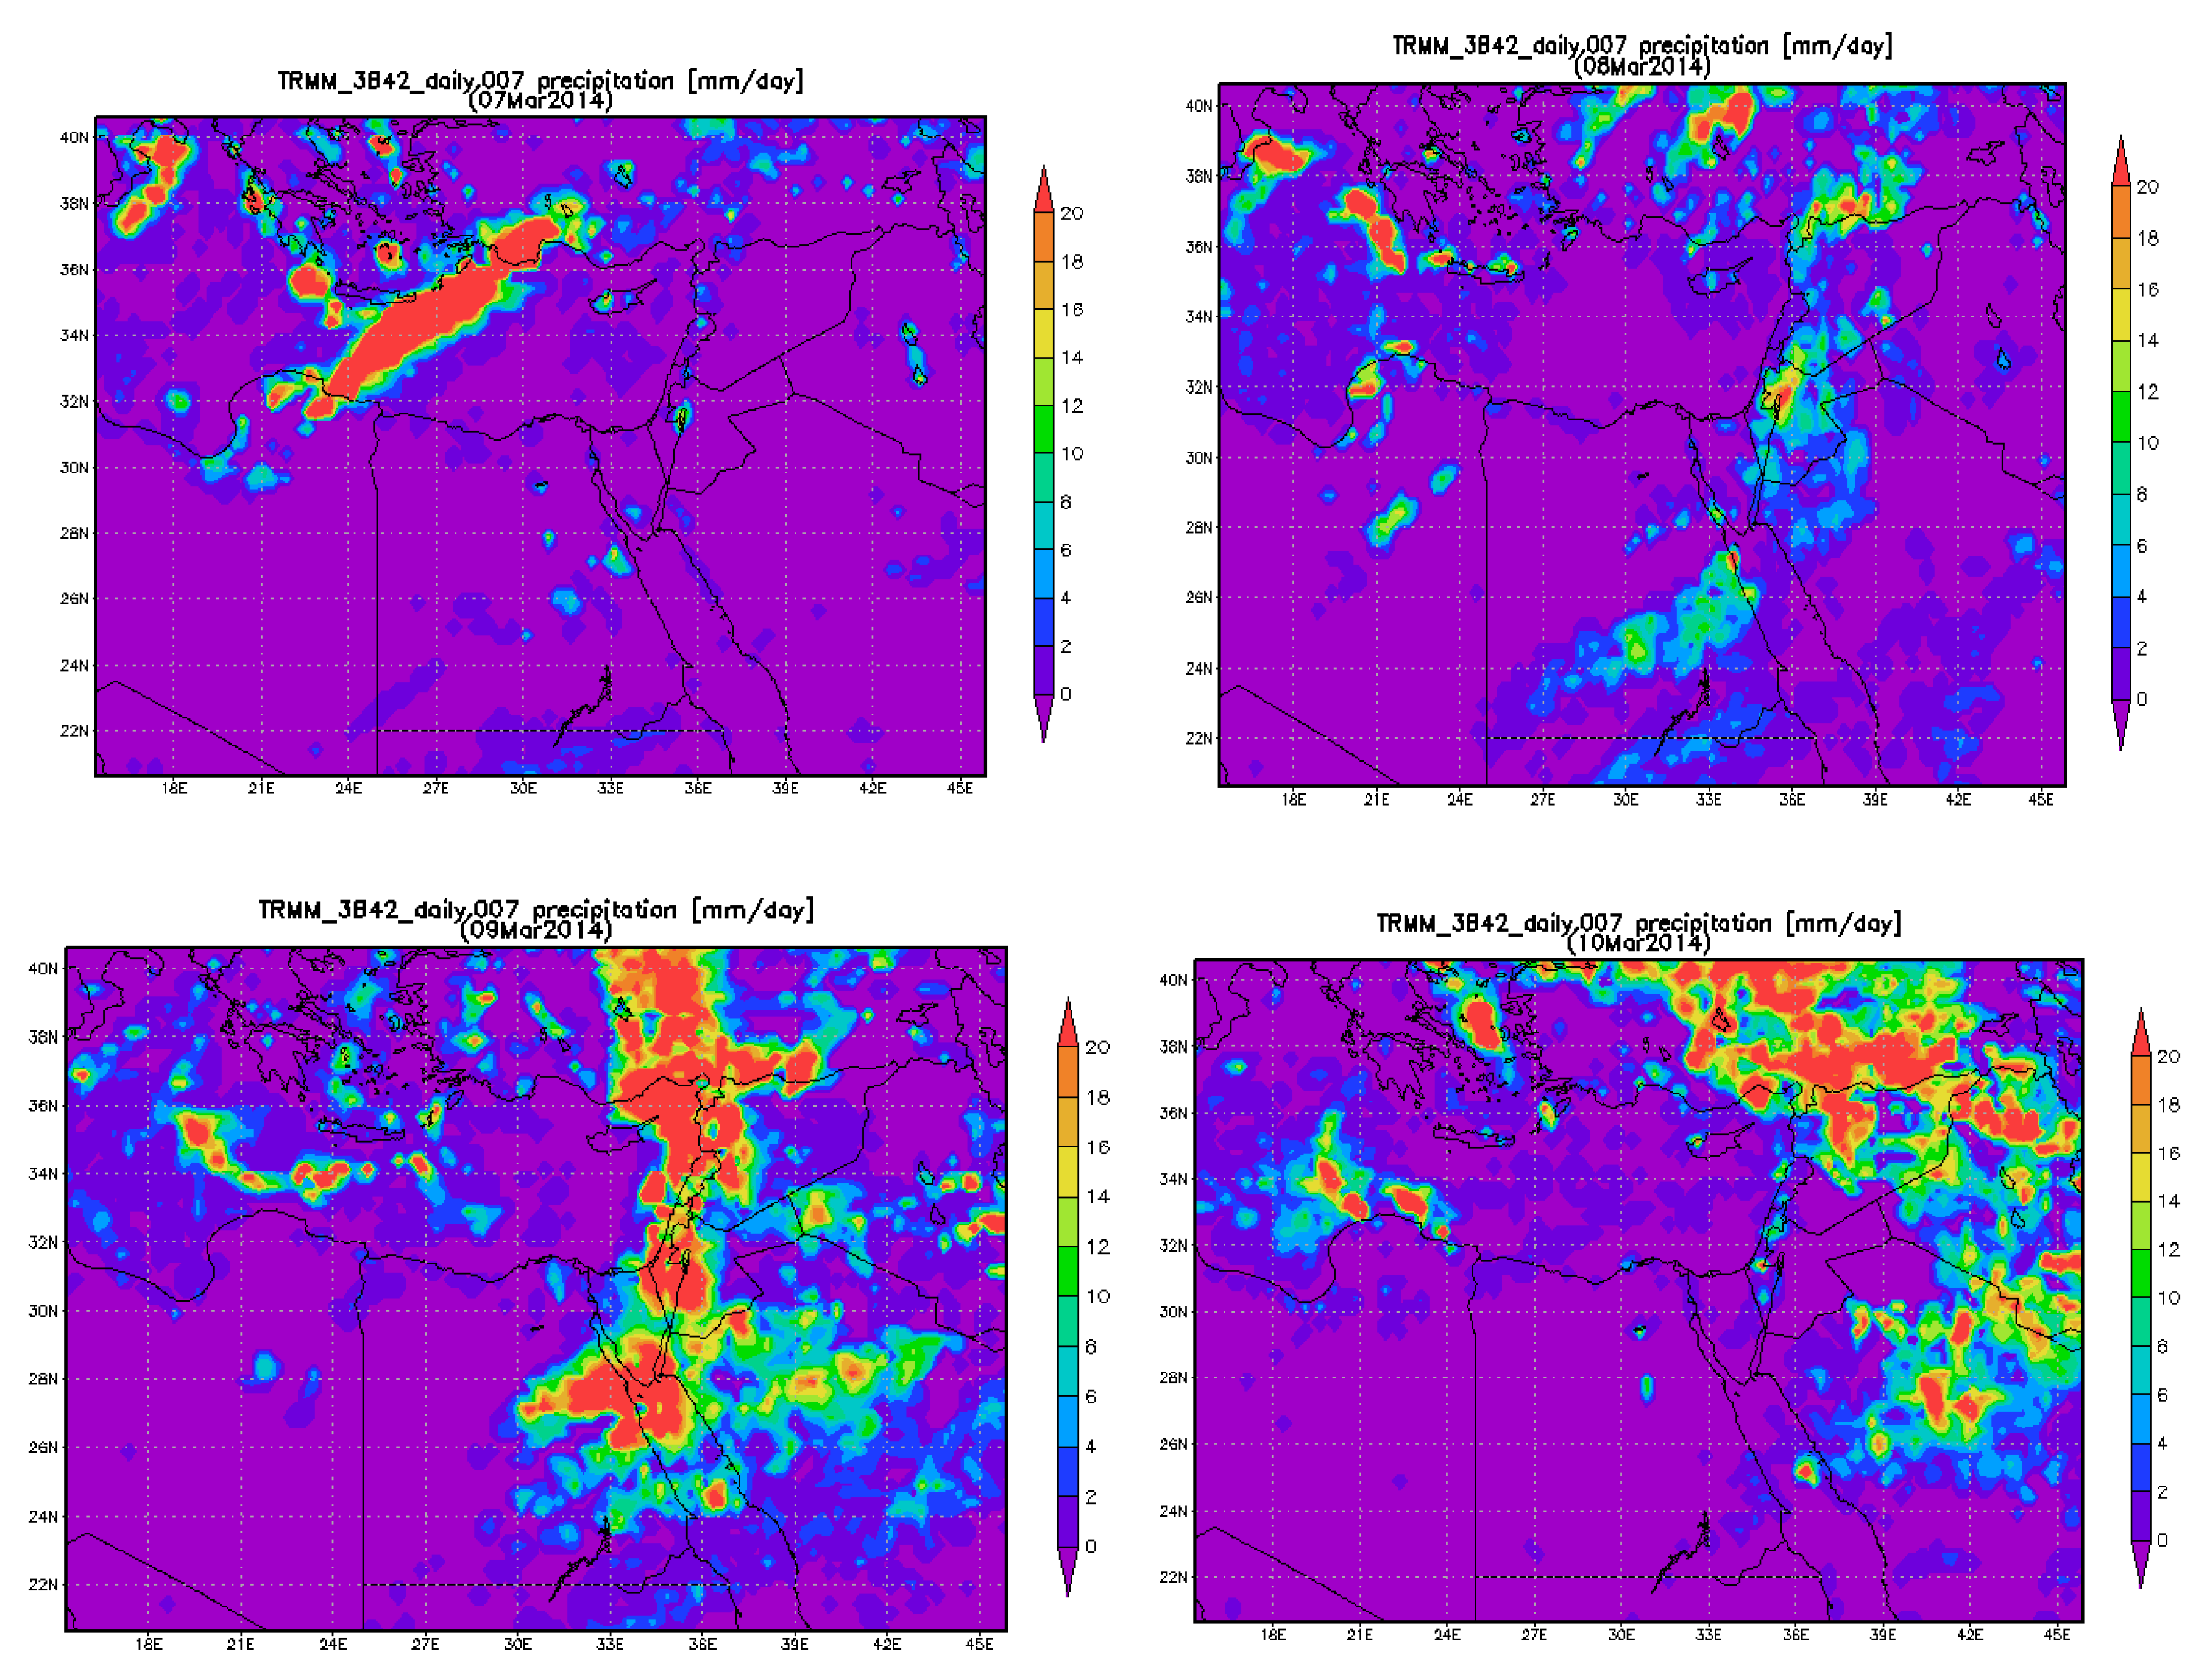
Among all the events that occurred in the period 2000–2015, the following episodes that affected the whole Peninsula, although with different intensity, have been selected and analyzed: 8 January 2013 and 9 March 2014. The 2013 event started on January 6th with light rainfall and reached a peak on January 7th. On January 8th, the storm continued only along the north coast of North Sinai, covering mainly the north Sinai and parts of south Sinai, and the maximum daily rainfall (29.8 mm) was observed at Rafah station. The 2014 event lasted over Egypt for three days from March 7th until March 9th. This event affected all Sinai with a maximum daily rainfall of 30 mm measured at Dahab station. Table 4 summarizes the total amount of precipitation that occurred in Upper Egypt, the Red Sea, and Sinai Peninsula during the storm (7–9 March 2014), while on the 10th it moved rapidly towards East. The evolution of the 2014 storm as captured by TRMM satellite images is shown in Figure 8, where it is clear how the storm, which started to form in Upper Egypt on the 7th, then rapidly moved toward the North-East and strongly affected Sinai Peninsula in the following days (8th and 9th of March).
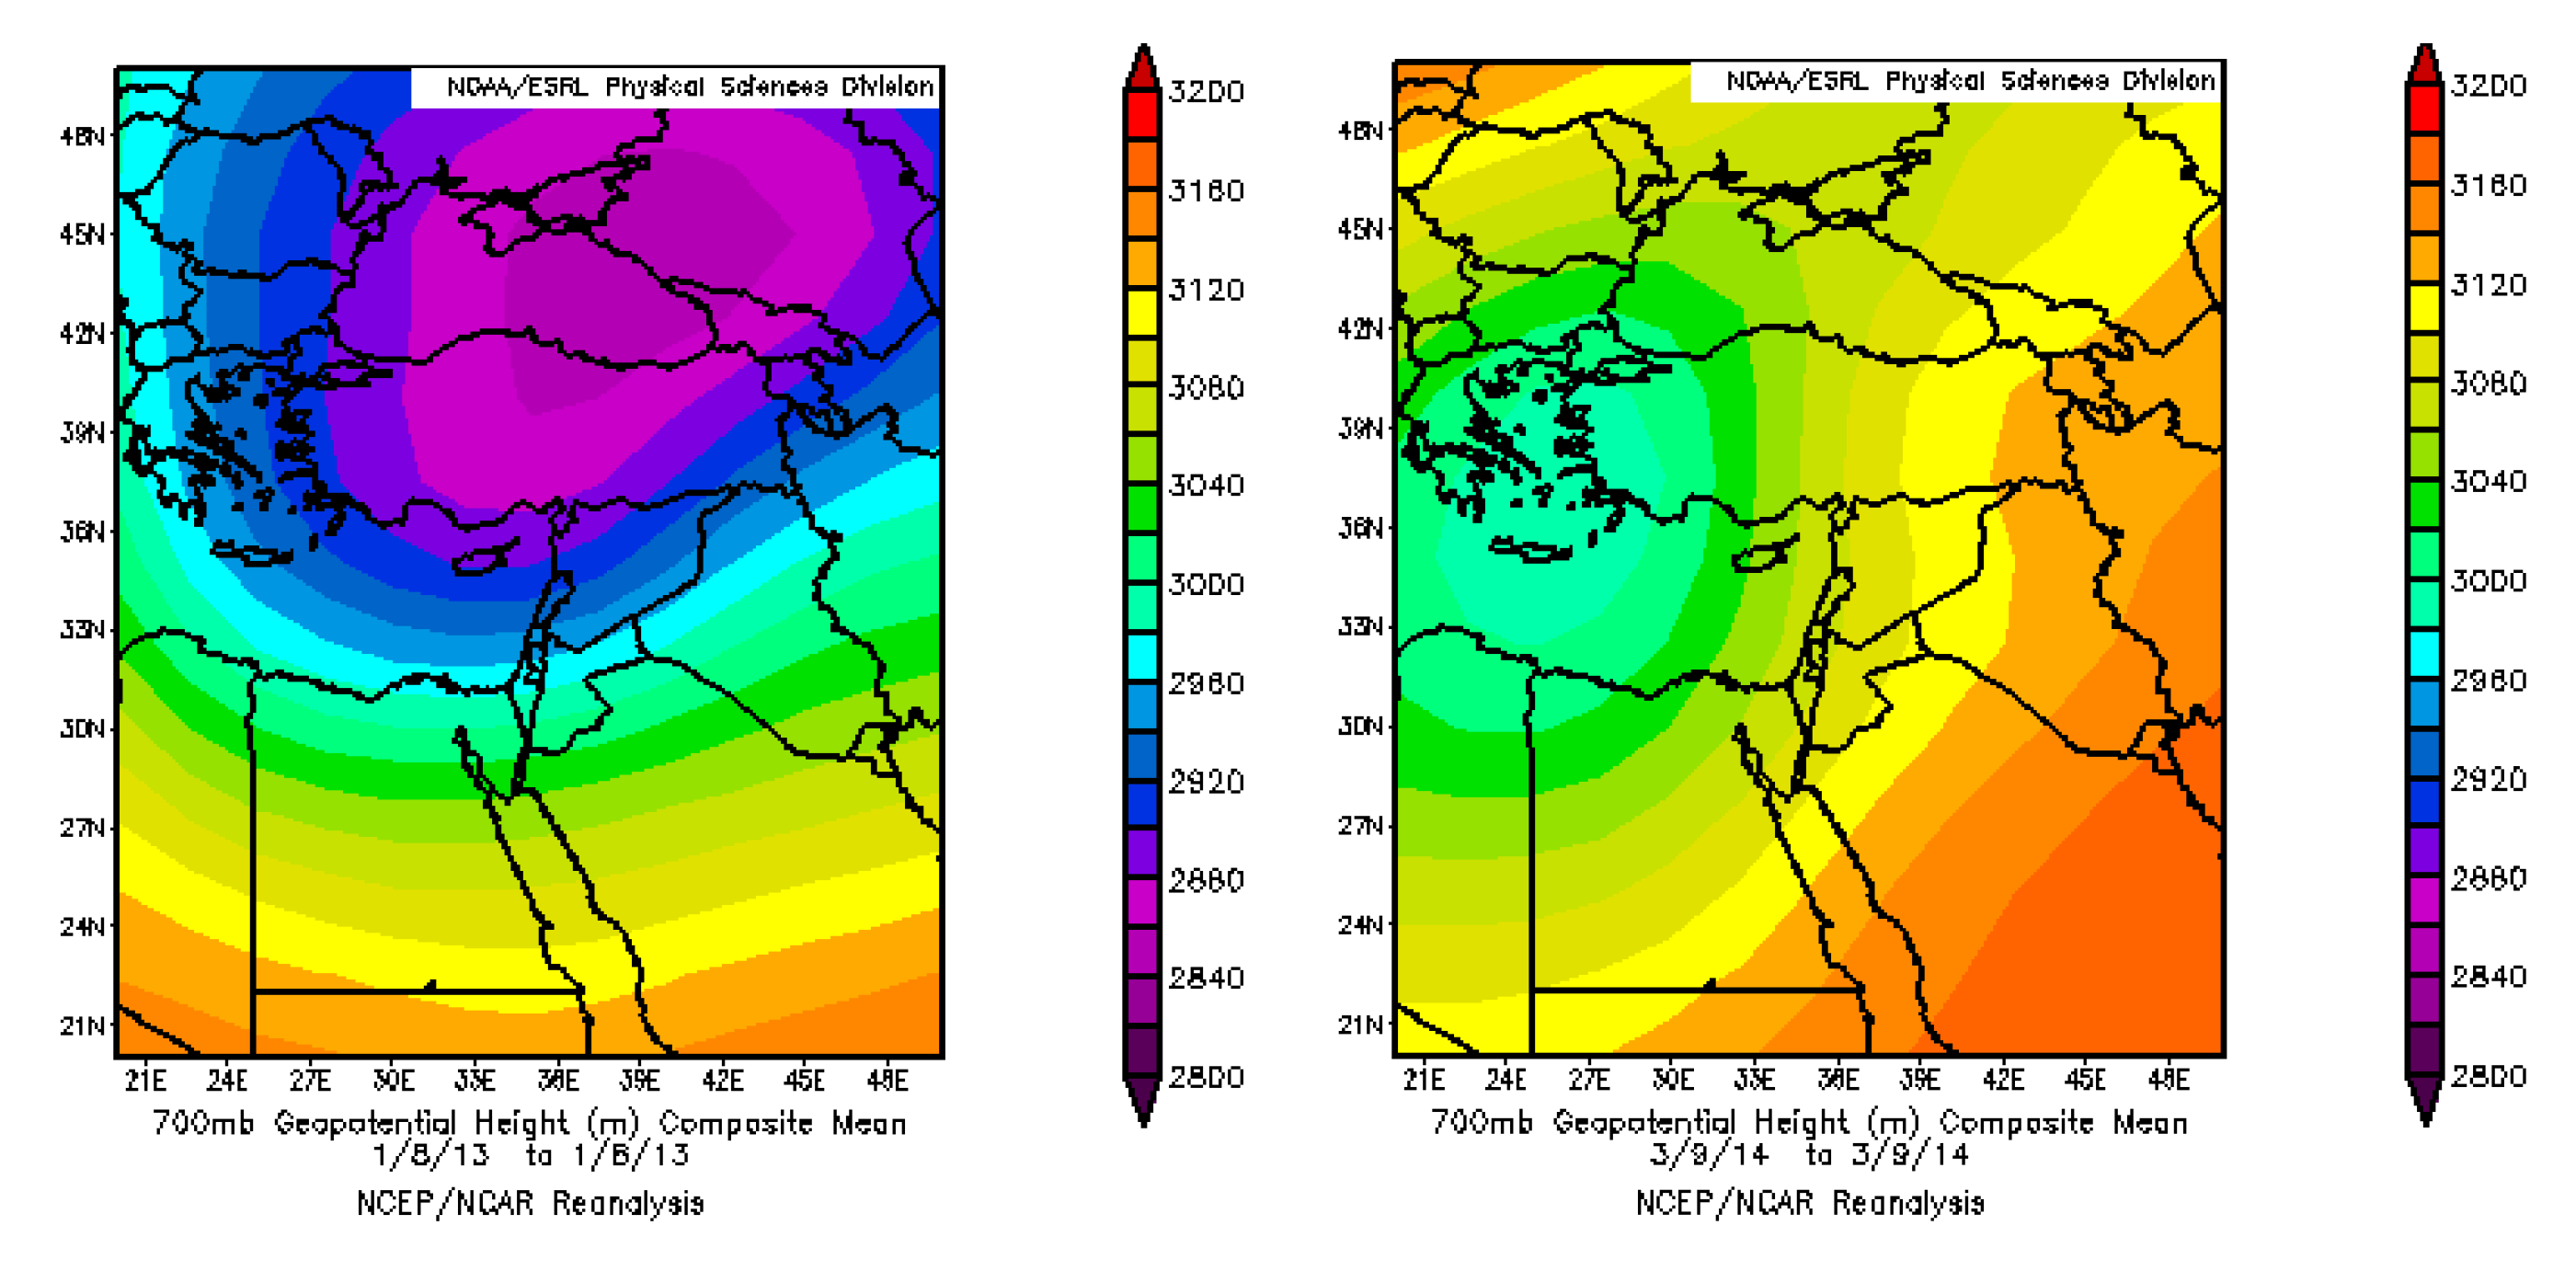
Results of the analysis of the large-scale configuration during these episodes show some similarities, with heavy rainfall usually resulting from mesoscale convective systems embedded in synoptic-scale disturbances interacting with the complex terrain of the Peninsula. The evolution of the storm (not shown) is similar in the selected cases (as an example, Figure 9 shows the spatial distribution of the geopotential at 700 hPa during the selected episodes with a low pressure system over the Eastern Mediterranean bringing a disturbance to the region of interest, which then moves eastward), and a correlation is also noticed with the atmospheric circulation over the Arabic Peninsula and with low-pressure systems over the Eastern Mediterranean. In addition, the distribution of the rainfall between the Northern and Southern parts of the Peninsula is strongly affected by the complexity of the terrain and by the position of the mountain ranges, which is strongly influencing the areas where the majority of rain is observed.
The mechanism leading to storms with torrential rainfall, thunder, and lightning has been studied by some authors [21] and references therein [18,27,28]; in these works, it is emphasized that they are phenomena of very limited spatial and time extent. Although this part of the study is not yet fully completed, some general remarks are outlined here. Climatically the whole Levant is under the influence of the westerly winds, i.e., on average, the winds blow from the west towards the east and their intensity increases with altitude, and the weather is usually characterized by the presence of a Red Sea Through (RST), i.e., a low-level pressure extending from the African Monsoon over Equatorial Africa, northward over the Red Sea region toward the Eastern Mediterranean (EM). The RST, generated and supported by thermal forcing and supported by the presence of the local complex topography, strongly influences the weather in the whole Levant, usually bringing dry and hot conditions.
The size of storms moving in the eastern part of the Mediterranean basin is of the order of a few km, and their lifetime is only few days. Many storms in the East Mediterranean originate in the region around Cyprus; these storms travel eastwards. Therefore, they do not usually hit Egypt. However, if the conditions are favorable in the Red Sea, they are diverted southeastwards, reaching North Egypt; if their lifetime is sufficiently long, they can hit Central Egypt. These storms are usually associated with the presence of an Active Red Sea Trough. While a (non-active) Red Sea Trough (RST) is a low-level trough extending northward from East Africa over the Red Sea region towards the Levant that brings dry, hot weather, an Active Red Sea Trough (ARST) is an RST accompanied by an upper trough which brings severe weather, heavy precipitation, and possible flash floods as in the case studies analyzed.
In a very simplified scheme, several factors can contribute to transform an RST into the active Red Sea storm; the presence of these factors enhances the tropospheric instability and the synoptic-scale forcing and inducing ascending motions with the formation of an ARST. Usually, the ARST configurations are more active in autumn, when there are two coinciding favorable elements: the position of the African Monsoon and Subtropical Jet Stream (STJ). These elements are absent in winter and spring, when the Middle East (ME) can be affected by extreme rainfall resulting from tropical-extratropical interactions. In the beginning, the systems, which started over Egypt, presented characteristics very similar to a Mesoscale Convective System (MCS), with rainfall particularly intense during its first stage when the convection was dominant. After this first phase, the intensity of rain, as well the role of convection, diminished considerably while the storms move eastwards. The kind storms weather affects not only Egypt but also the Middle East.
3.3. Expected Future Climate Changes
Considering the fact that regional climate information is needed for decision-making on societal issues such as vulnerability and adaptation to a changing climate with weather/water extremes, the Coordinated Regional Climate Downscaling Experiment (CORDEX: https://cordex.org/) has been developed. CORDEX is a World Climate Research Project (WCRP) framework to evaluate regional climate model performance through a set of experiments aimed to the production of regional climate projections [29]. The CORDEX vision is to advance and coordinate the science and application of regional climate downscaling through global partnerships, and its main goals can be summarized as follows:
- To better understand relevant regional/local climate phenomena, their variability, and changes, through downscaling.
- To evaluate and improve regional climate downscaling models and techniques.
- To produce coordinated sets of regional downscaled projections worldwide.
- To foster communication and knowledge exchange with users of regional climate information.
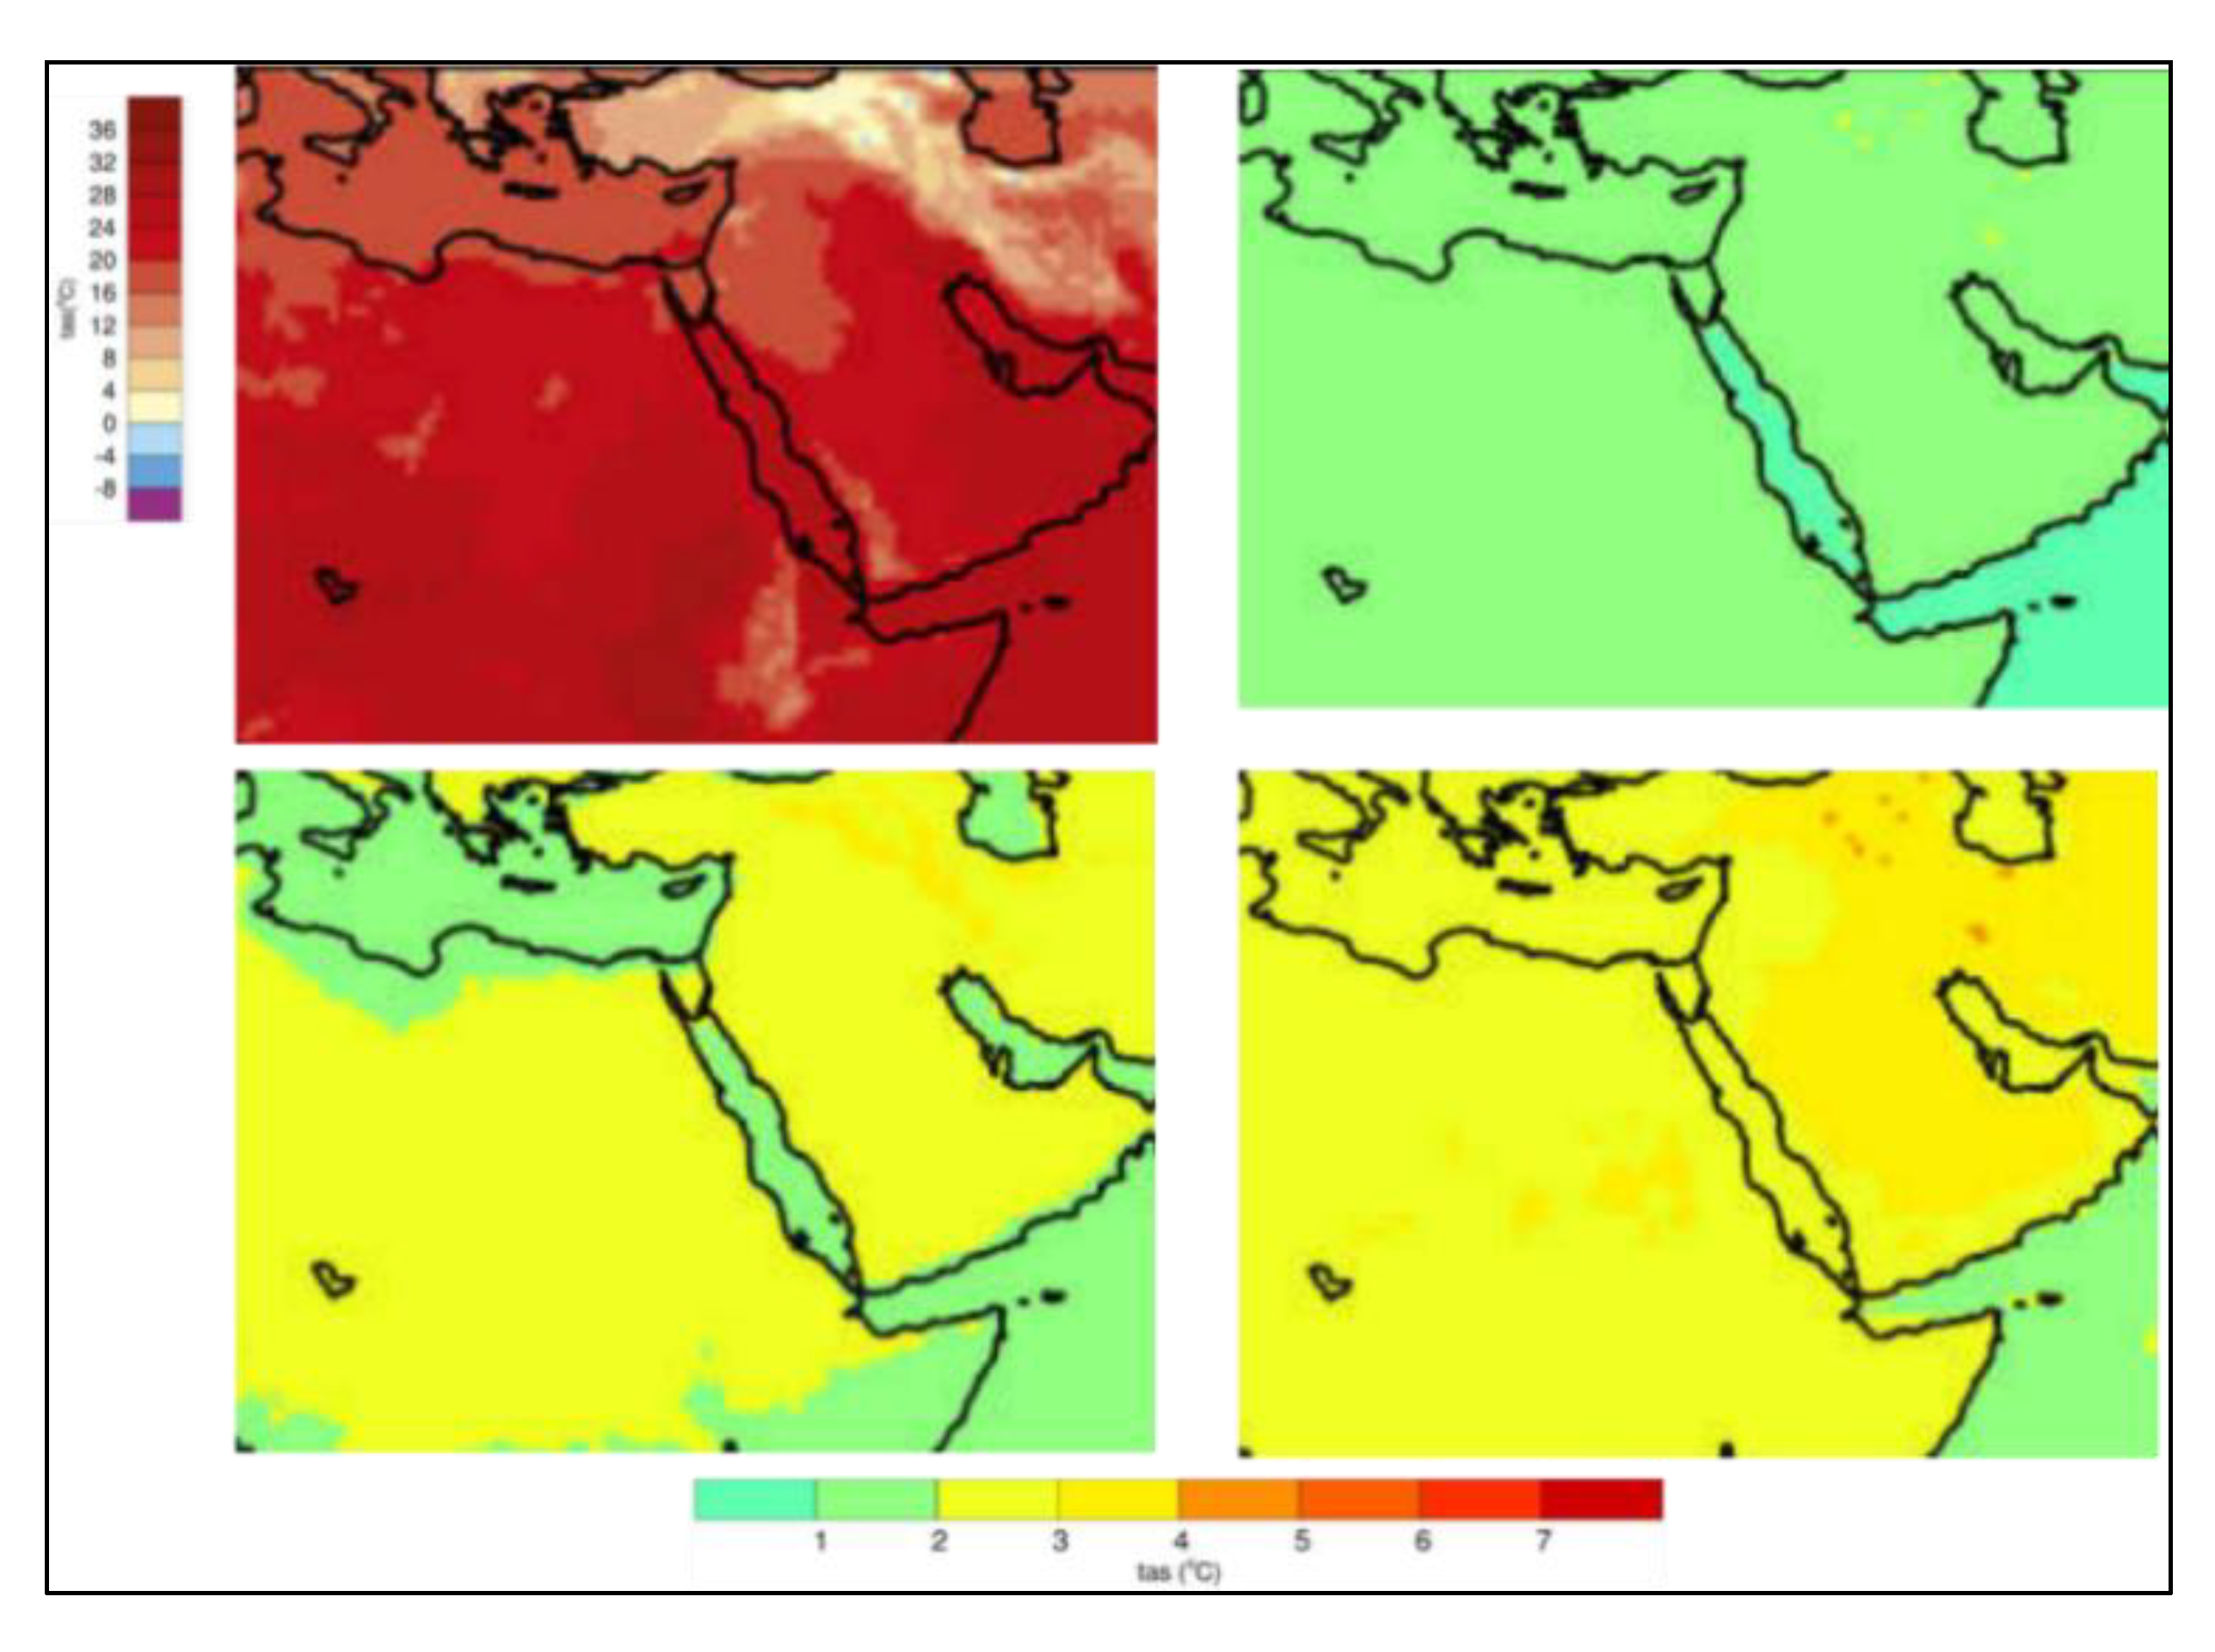
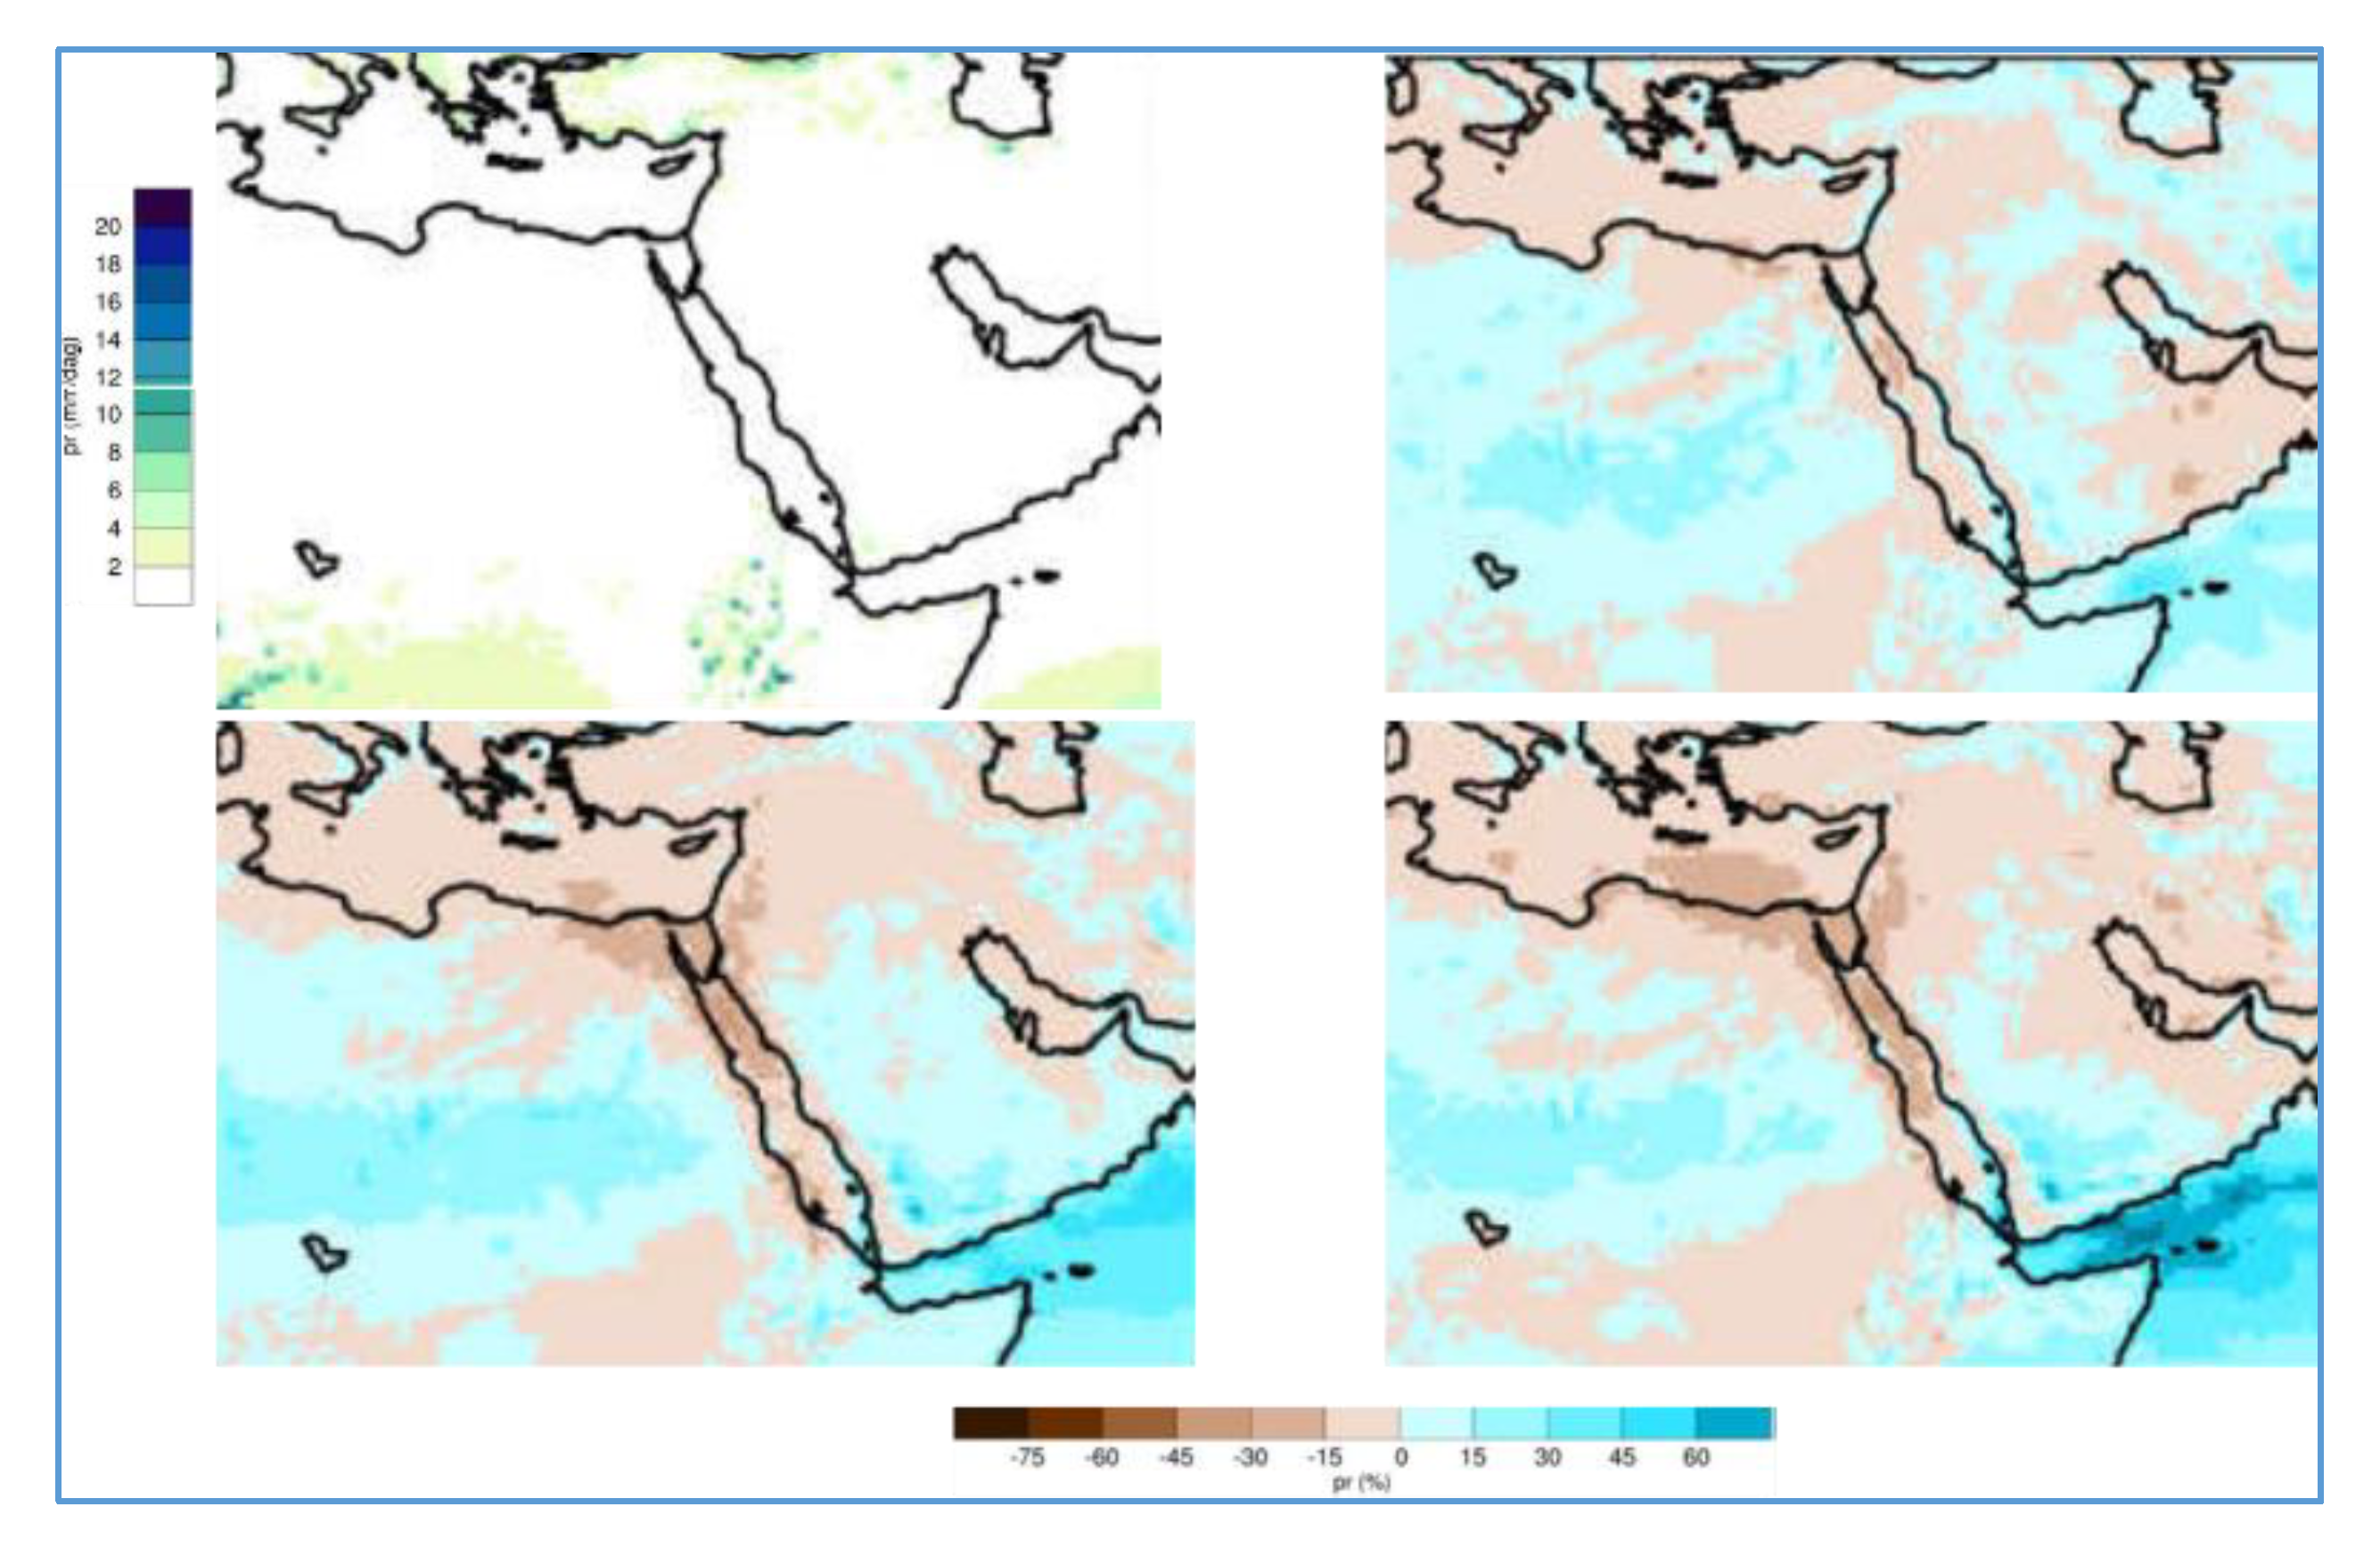
Thanks to CORDEX, a set of experiments are available for different domains, including the Middle East-North Africa (MENA) domain, which contains the region of interest of the present study [30,31], and few selected results are briefly discussed here. Figure 10 and Figure 11 show, respectively, the expected changes in temperature and precipitation over a domain including Egypt and the Arabian Peninsula for the control period 1971–2000 and for three future time periods: 2011–2040, 2041–2070, and 2071–2100 for an intermediate stabilization Representative Concentration Pathway (RCP4.5). These figures show the result of an ensemble of nine different Global Circulation Models (GCMs), in which a general increase in the mean temperature for the mid-to-end of the century is evident. This will occur all over the country except for a narrow region along the Mediterranean Sea, and there will be a decrease in the mean annual precipitation for the same periods; this pattern is more evident in the Eastern Desert and Sinai Peninsula.
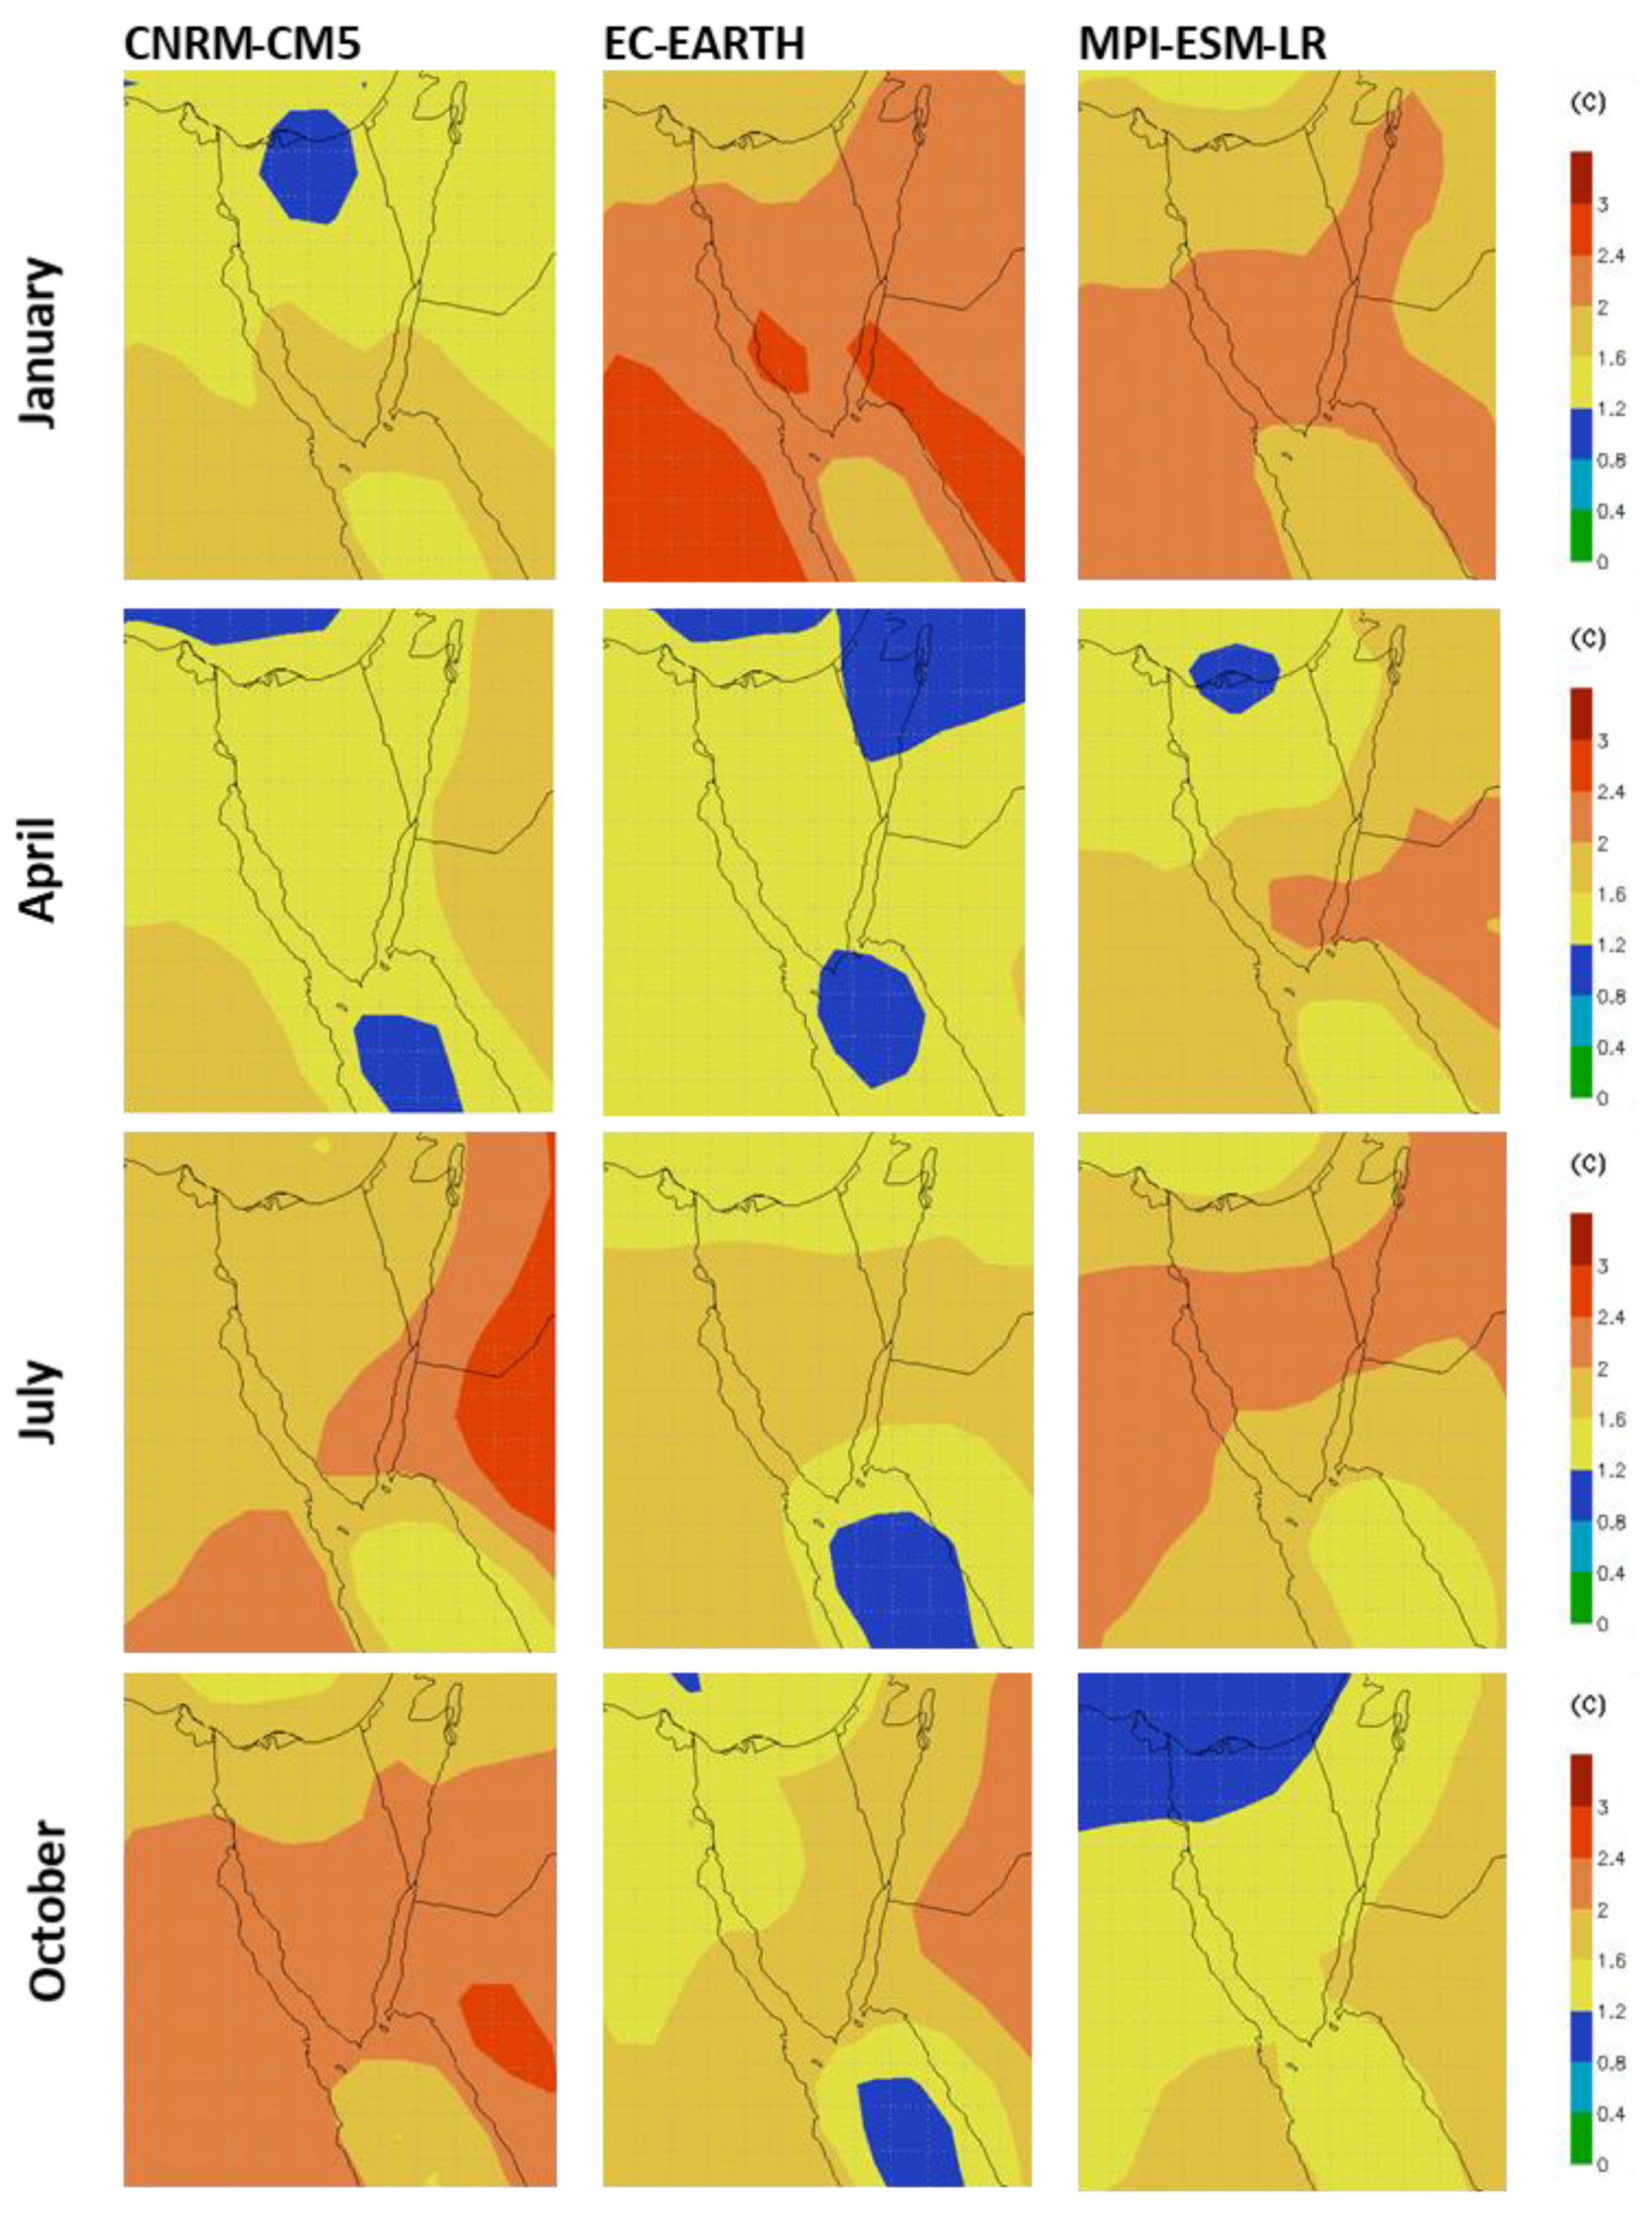
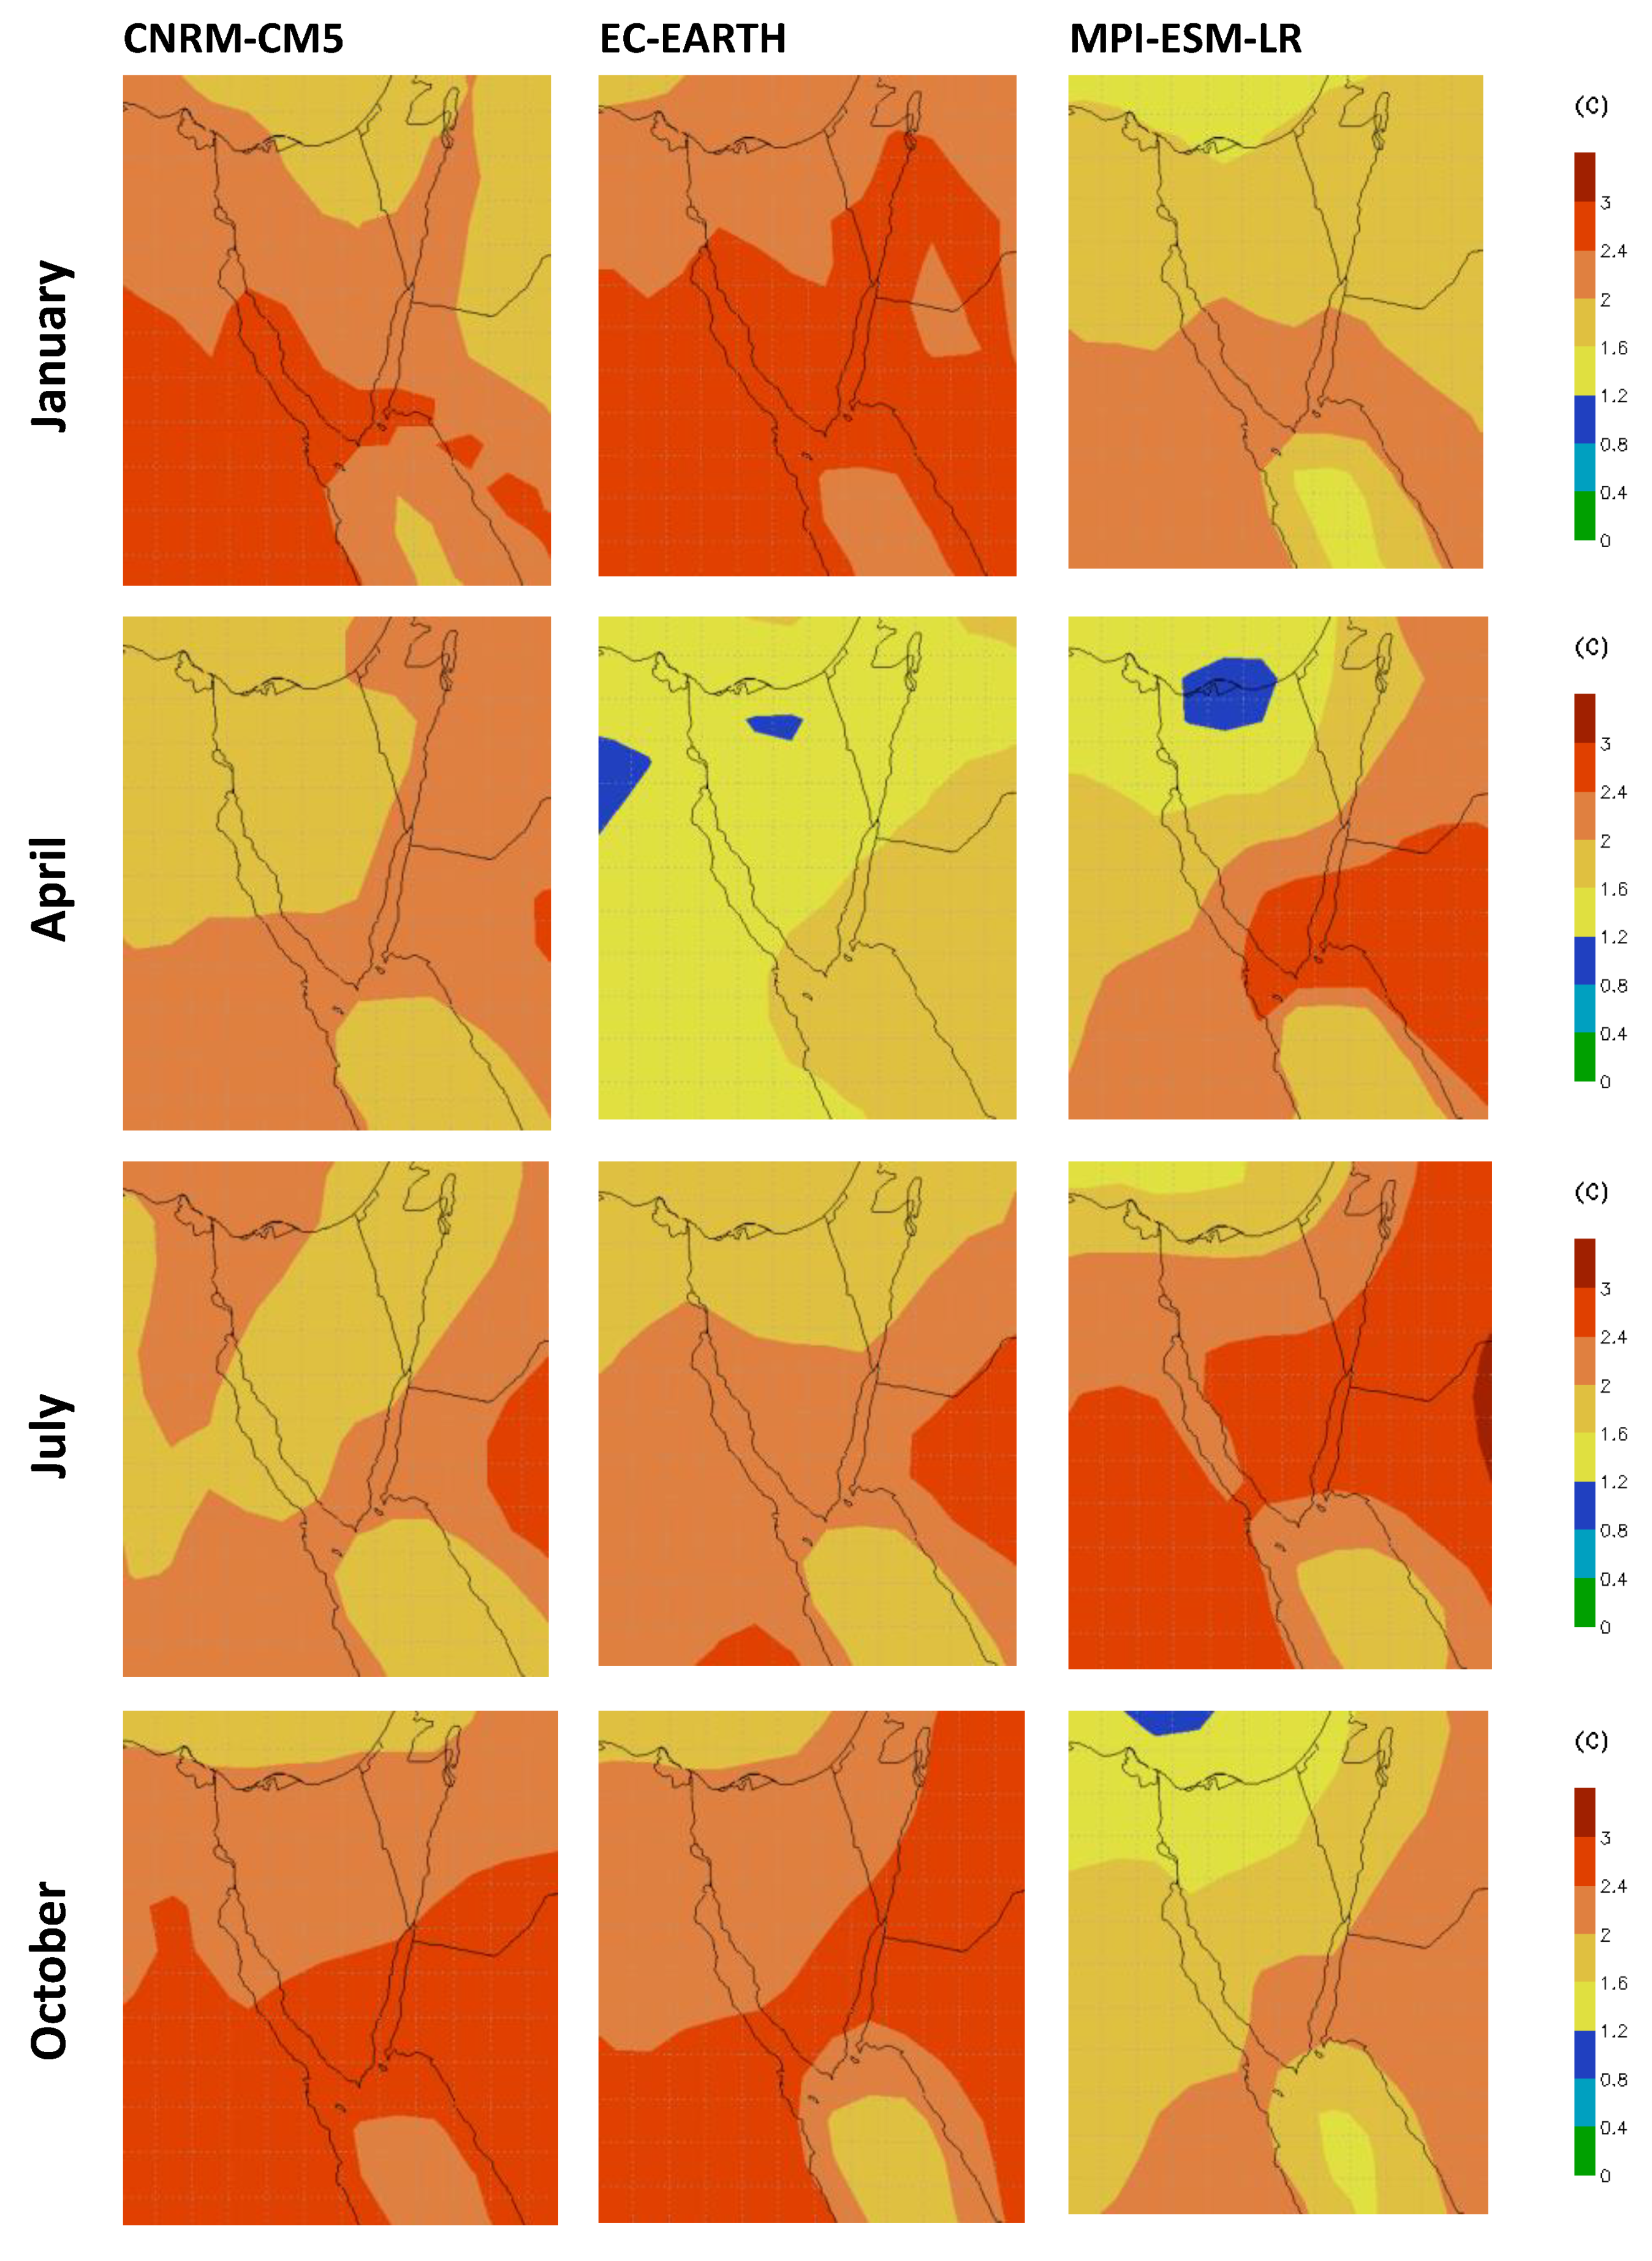
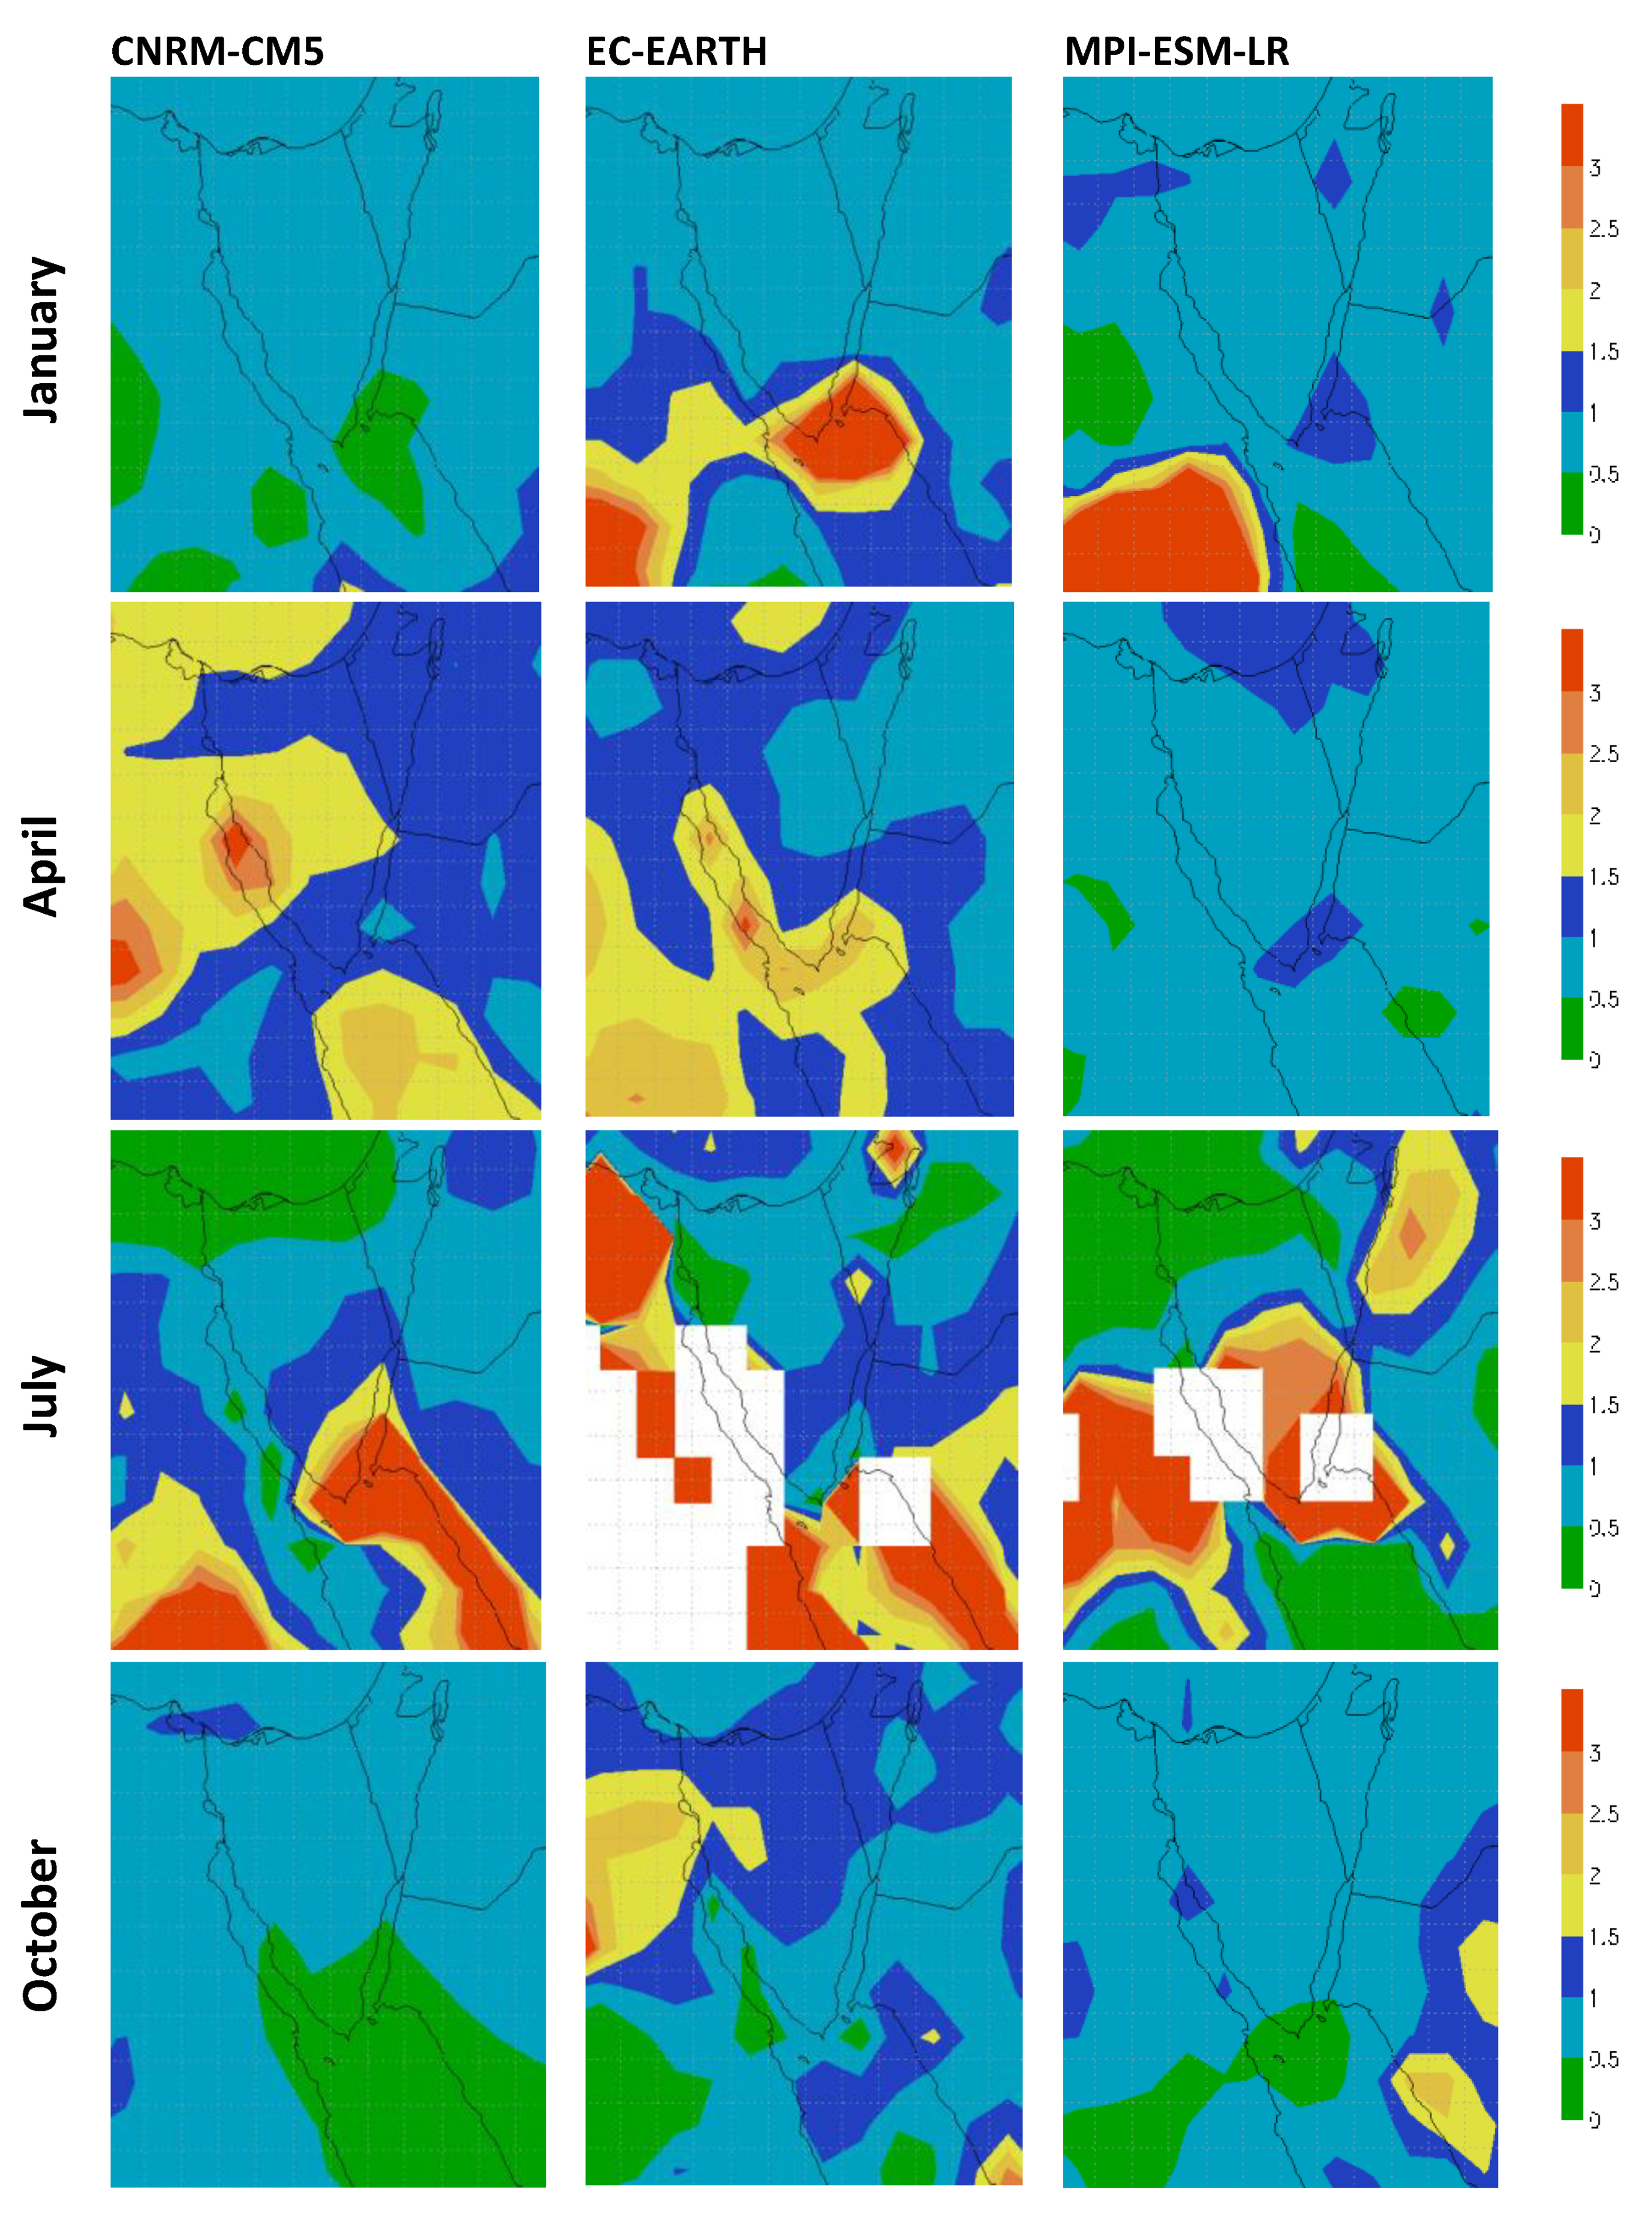
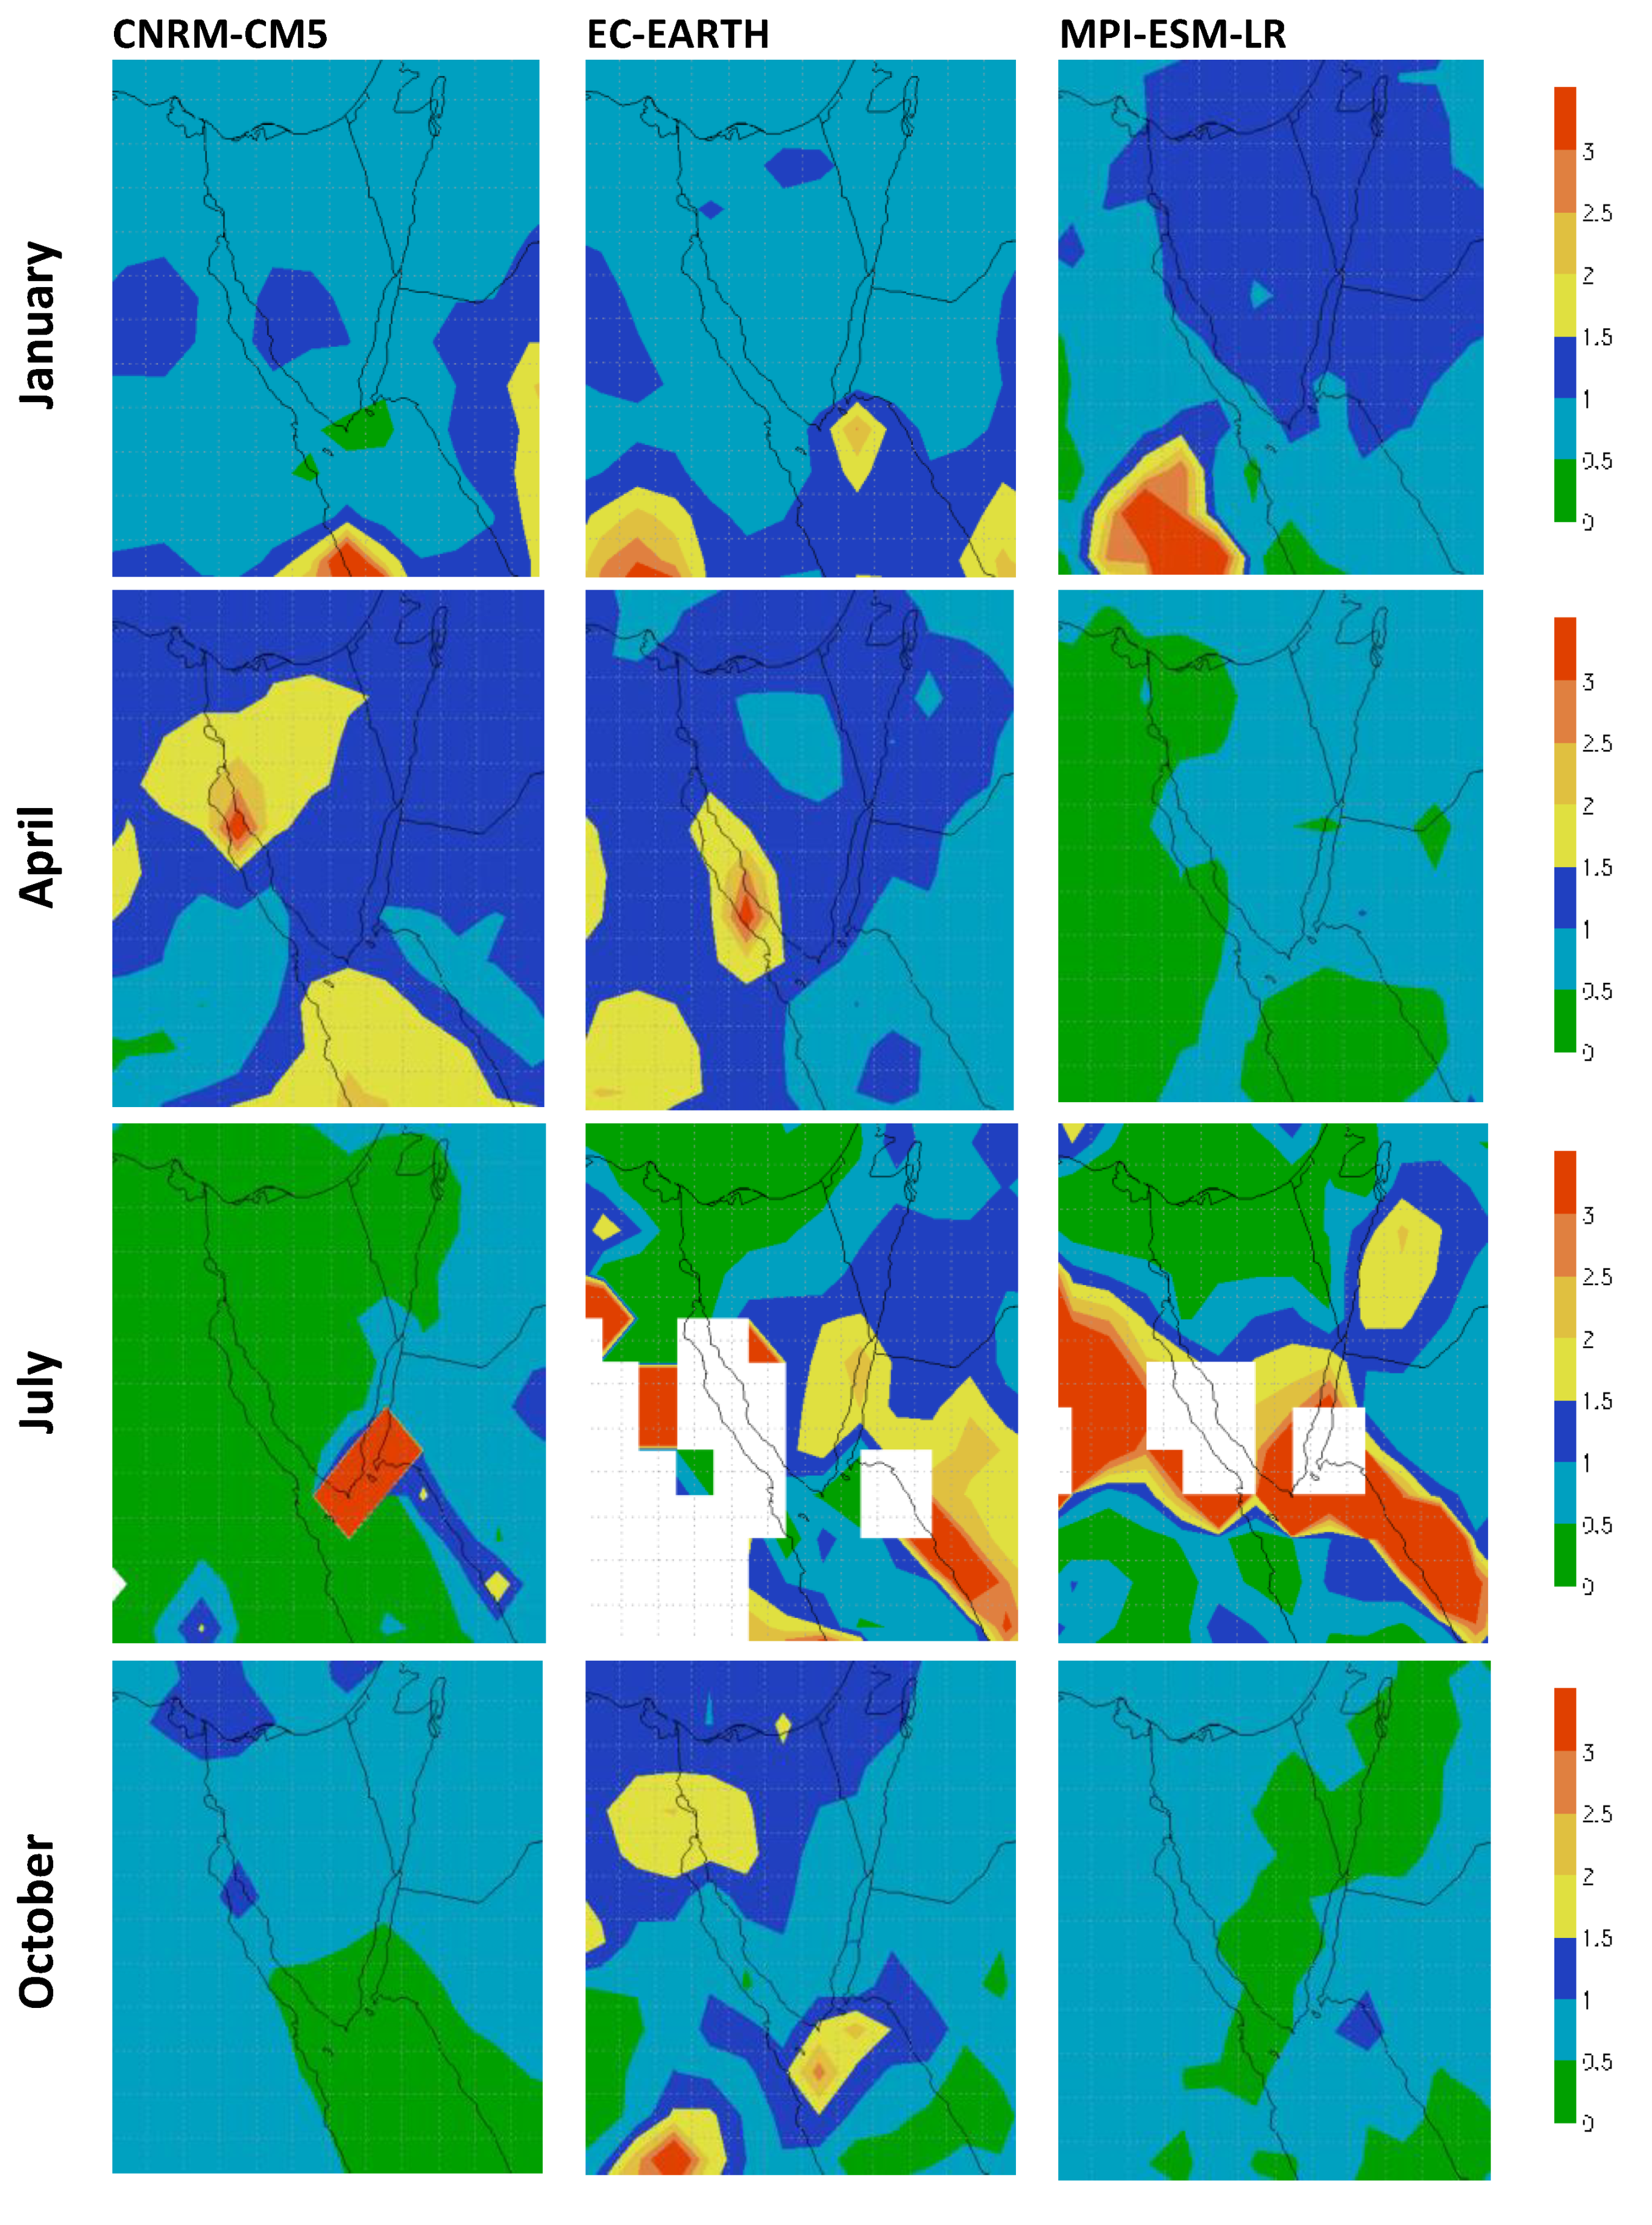
Focusing on the Sinai Peninsula, several studies [32,33,34] showed that several parameters affected the occurrence of the flash floods over the Sinai Peninsula, namely urban expansion and extreme rainfall events. Three ensembles from three Global Circulation Models (GCMs)—CNRM-CM5, EC-EARTH and MPI-ESM-LR—downscaled by the Regional Climate Model (RCM) were used to present the future change in temperature and rainfall over Sinai through the mid (2041–2070) and the end of the century (2071–2100), where both periods are compared with the baseline period (1971–2000). All three ensembles are obtained from CORDEX data, with two ensembles (CNRM-CM5, EC-EARTH) from MENA Domain (created by RICCAR Project: https://riccar.org/) and one ensemble (MPI-ESM-LR) from Africa Domain. The ensembles analyzed are for one emission scenario (RCP4.5) with resolution 50 km × 50 km. Figure 12 and Figure 13 show the future change in temperature over Sinai during the periods of 2050s and 2080s, respectively, while Figure 14 and Figure 15 show the future change in precipitation over Sinai during the same periods. The results show increase in temperature for all three ensembles, while the change of temperature will increase highly during the end of the century (2071–2100). In addition, winter will become warmer, especially in mid and south Sinai, with increases in temperature between (0.2 °C to 3 °C) for both future periods, 2050s and 2080s. It is not clear from the results which model give the worst result, but all of them agree with the increase in temperature. The precipitation will be affected: Where the results show that the rainfall will be shifted to the summer, sudden storms will be expected to occur in summer during the mid and end periods (2041–2100). The results show increases in amount of the precipitation may reach to 300% in some local areas. There is no change expected during winter and autumn; however, south Sinai will suffer by decreasing rainfall during autumn. The expected distribution of the rainfall shows the localization, which indicates increases in damage (see Figure 14 and Figure 15).
4. Conclusions
The Sinai Peninsula is a region characterized by severe data limitations and by the occurrence of thunderstorms very limited in time and space; therefore, the improvement of Weather Prediction Systems feeding Early Warning Systems is difficult. The lack of reliable WPS and appropriate EWS impair not only the design and adoption of adaptation and mitigation measures but also the development of emergency plans to save lives as well as the harvesting of water precious for the local Bedouin Communities, which is otherwise lost.
The scientific problem addressed in the paper is to assemble information about severe thunderstorms leading to flash flood in the two sub-regions, North and South Sinai, and to present a first attempt to describe, for the same region, the expected evolution of climate in the future. The study presented here is a step forward in order to respond to the need of a deeper knowledge of extreme rainfall in Sinai Peninsula that is driving flash floods affecting population and infrastructure with damage and elevated costs.
The results presented are derived from the Academy of Scientific Research and Technology of Egypt (ASRT) and the National Research Council of Italy (CNR) joint project and show, in particular, the intensity of the current climate change in terms of increase in temperature, decrease in precipitation, and increase (in number and intensity) of heavy rainfall episodes in the interested region. Some results were also discussed showing an increase in the severity of the changes in temperature and precipitation under future climate scenario for an intermediate stabilization Representative Concentration Pathway, RCP4.5.
Further analysis of the heavy rainfall episodes generating flash floods in both the North and South part of the Peninsula is not only needed but also particularly useful to increase the knowledge about the generation and evolution of these short-lived and patchy storms, focusing, in particular, on the atmospheric factors driving their formation. A deeper knowledge of the mechanism could also provide some indication for improving the weather forecast systems over the region, while results will contribute to the development of regional climate scenarios at higher resolution to be used for the implementation of more sophisticated risk maps for future decades. Results can also encourage and sustain the elaboration of adaptation plans for population, agriculture, and water resources management and help decision-makers to plan the construction of water harvesting structures [35].
In conclusion, the knowledge of extreme rain events in Sinai is presently scarce; thus, this study intends to give a contribution to the improvement of their understanding. A possible future study to address this could be a comparative analysis of episodes occurring in the Sinai Peninsula and in neighboring countries, because thunderstorms affecting the Peninsula then move eastward and largely impact the whole Levant.
Further specific studies on the Sinai’s present and future climate that can help to understand better if there will be an evolution of heavy rainfall episodes driving flash floods are needed. Sophisticated risk maps for future decades are also needed, together with adoption of adaptation plans for population, agriculture, and water resources management. Finally, results from this and future studies will be largely used by decision-makers in their design and planning of the construction of water harvesting structures in the near future for the good of the Sinai people.
Author Contributions
Individual contributions to the research is as follows: Conceptualization, M.B. and D.A.; methodology, M.B. and D.A.; formal analysis and investigation, M.B., D.A., I.S.A.Z., and G.D.; writing—original draft preparation and review and editing, M.B.; writing—review and editing, D.A., I.S.A.Z., and G.D. All authors have read and agreed to the published version of the manuscript.
Funding
This research was funded by ARST and CNR in the framework of the Agreement on Scientific Cooperation between the Academy of Scientific Research and Technology of Egypt (ASRT) and the National Research Council of Italy (CNR), who provided support for scientists’ mobility.
Acknowledgments
The study has been funded in the framework of the Agreement on Scientific Cooperation between the Academy of Scientific Research and Technology of Egypt (ASRT) and the National Research Council of Italy (CNR). The two Institutes participating to the project were, respectively: the Water Resources Research Institute (WRRI) of the National Water Research Center (NWRC), and the Institute of Biometeorology (CNR-Ibimet, now CNR-IBE). M.B and G.D. are grateful to the research group at the WRRI-NWRC for their kind hospitality and useful discussions and to the Italian Scientific Attaché Office in Cairo for support. D.A. and I.S.A. are also thankful to the research staff of the CNR-IBE for supporting the research stay in Italy that enabled the completion of this work.
Conflicts of Interest
The authors declare no conflict of interest. The funders had no role in the design of the study; in the collection, analyses, or interpretation of data; in the writing of the manuscript, or in the decision to publish the results.
References
- Al Zayed, I.S.; Ribbe, L.; Al Salhi, A. Water harvesting and flashflood mitigation-wadi watier case study (South Sinai, Egypt). Int. J. Water Resour. Arid Environ. 2013, 2, 102–109. [Google Scholar]
- Idowu, O.; Gawusu, S.; Mugo, V.; Bilal, A.; Buumba, M.; Kamga, M.A.; Komassi, A.; Awovi, S.; Al Zayed, I.S.; Khalifa, M.; et al. GEO-6 for Youth Africa: A Wealth of Green Opportunities—Global Environment Outlook; United Nations Environment Programme (UNEP): Nairobi, Kenya, 2019. [Google Scholar]
- Baldi, M.; Amin, D.; Al Zayed, I.S.; Dalu, G.A. Extreme rainfall events in the Sinai Peninsula. In Proceedings of the EGU General Assembly Conference Abstracts 2017, Vienna, Austria, 23–28 April 2017; Volume 19, p. 13971. [Google Scholar]
- Al Zayed, I.S. Observing flash flood in arid and semi-arid regions from space: Wadi Watier of Egypt as a case study. In Proceedings of the Second International Symposium on Flash Floods in Wadi Systems, El Gouna Campus, Hurghada, Egypt, 25–27 October 2016. [Google Scholar]
- Attia, K.; Al Zayed, I.S. Water harvesting in Sinai Peninsula, Egypt. In Proceedings of the International Forum on Water Scarcity and Harvesting in the Arid and Semiarid Areas (IFWSH-ASA-2015), Hurghada, Egypt, 23–26 November 2015. [Google Scholar]
- Baldi, M. Climate Change, Water availability, and Cultural Heritage in Egypt. In Sciences and Technologies Applied to Cultural Heritage—STACH 1; Baldi, M., Vittozzi, G.C., Eds.; Cnr Edizioni: Roma, Italy, 2019; ISBN 978 88 8080 347 8. Available online: https://iiccairo.esteri.it/iic_ilcairo/it/istituto/centro-archeologico/link-utili (accessed on 25 July 2020).
- FloodList. Eastern Mediterranean—Deadly Flash Floods After Heavy Rain. Available online: http://floodlist.com/asia/eastern-mediterranean-egypt-israel-floods-april-2018 (accessed on 25 July 2020).
- FloodList. Egypt—Heavy Rain Causes Flood Chaos in Cairo. Available online: http://floodlist.com/africa/egypt-cairo-floods-october-2019 (accessed on 25 July 2020).
- FloodList. Egypt—5 Dead After Storms Trigger Floods. Available online: http://floodlist.com/africa/egypt-storm-floods-march-2020 (accessed on 25 July 2020).
- BBC New. Egypt Experiences Worst Flooding in 35 Years. 2020. Available online: https://www.bbc.co.uk/programmes/w172wn3b49zcw4h (accessed on 25 July 2020).
- El-Rakaiby, M.L. Drainage Basins and Flash Flood Hazard in Selected Parts of Egypt. Egypt. J. Geol. 1989, 33, 307–323. [Google Scholar]
- Elmoustafa, A.M.; Mohamed, M.M. Flash Flood Risk Assessment Using Morphological Parameters in Sinai Peninsula. Open J. Mod. Hydrol. 2013, 3, 122–129. [Google Scholar] [CrossRef] [Green Version]
- Prama, M.; Omran, A.; Schröder, D.; Abouelmagd, A. Vulnerability assessment of flash floods in Wadi Dahab Basin, Egypt. Environ. Earth Sci. 2020, 79, 1–17. [Google Scholar] [CrossRef] [Green Version]
- Dayan, U.; Ziv, B.; Margalit, A.; Morin, E.; Sharon, D. A severe autumn storm over the Middle-East: Synoptic and mesoscale convection analysis. Theor. Appl. Climatol. 2001, 69, 103–122. [Google Scholar] [CrossRef]
- Dayan, U.; Nissen, K.; Ulbrich, U. Review article: Atmospheric conditions inducing extreme precipitation over the eastern and western Mediterranean. Nat. Hazards Earth Syst. Sci. 2015, 15, 2525–2544. [Google Scholar] [CrossRef] [Green Version]
- De Vries, A.J.; Tyrlis, E.; Edry, D.; Krichak, S.O.; Steil, B.; Lelieveld, J. Extreme precipitation events in the Middle East: Dynamics of the Active Red Sea Trough. J. Geophys. Res. Atmos. 2013, 118, 7087–7108. [Google Scholar] [CrossRef]
- Kahana, R.; Ziv, B.; Dayan, U.; Enzel, Y. Atmospheric predictors for major floods in the Negev Desert, Israel. Int. J. Climatol. 2004, 24, 1137–1147. [Google Scholar] [CrossRef]
- Ziv, B.; Dayan, U.; Sharon, D. A mid-winter, tropical extreme flood producing storm in southern Israel: Synoptic scale analysis. Meteorol. Atmos. Phys. 2005, 88, 53–63. [Google Scholar] [CrossRef]
- Cools, J.; Vanderkimpen, P.; El Afandi, G. An early warning system for flash floods in hyper-arid Egypt. Nat. Hazards Earth Syst. Sci. 2012, 12, 443–457. [Google Scholar] [CrossRef]
- El Afandi, G.; Morsy, M.; El Hussieny, F. Heavy Rainfall Simulation over Sinai Peninsula Using the Weather Research and Forecasting Model. Int. J. Atmos. Sci. 2013, 2013, 11. [Google Scholar] [CrossRef] [Green Version]
- El Afandi, G.; Morsy, M. Developing an Early Warning System for Flash Flood in Egypt: Case Study Sinai Peninsula. In Flash Floods in Egypt; Negm, A.M., Ed.; Springer: Cham, Switzerland, 2020; pp. 45–60. [Google Scholar]
- Kalnay, E.; Kanamitsu, M.; Kistier, R.; Collins, W.; Deaven, D.; Gandin, L.; Iredell, M.; Saha, S.; White, G.; Woollen, J.; et al. The NCEP/NCAR Reanalysis 40-year Project. Bull. Am. Meteor. Soc. 1996, 77, 437–471. [Google Scholar] [CrossRef] [Green Version]
- Dee, D.P.; UPPALA, S.M.; Simmons, A.J.; Berrisford, P.; Poli, P.; Kobayashi, S.; Andrae, U.; Balmaseda, M.A.; Balsamo, G.; Bauer, P. The ERA-Interim reanalysis: Configuration and performance of the data assimilation system. Q. J. R. Meteorol. Soc. 2011, 137, 553–597. [Google Scholar] [CrossRef]
- Zahran, M.A.; Willis, A.J. Egypt: The Gift of the Nile. In The Vegetation of Egypt; Springer: Dordrecht, The Netherlands, 2009; Volume 2, pp. 1–3. [Google Scholar]
- Elsayad, M.A.; Sanad, A.M.; Kotb, G.; Eltahan, A.H. Flood Hazard Mapping in Sinai Region. In Global Climate Change, Biodiversity, and Sustainability Conference; Arab Academy for Science, Technology and Maritime Transport: Cairo, Egypt, 2013; Volume 15. [Google Scholar]
- Sharon, D. The spottiness of rainfall in a desert area. J. Hydrol. 1972, 17, 161–175. [Google Scholar] [CrossRef]
- Baldi, M. Climate of Egypt between dryness and torrential rainfall: Patterns of climate variability. In AHMES-Egyptian Curses Vol. 2—A Research on Ancient Catastrophes; Capriotti Vittozzi, C., Ed.; Cnr Edizioni: Roma, Italy, 2015; pp. 255–264. ISBN 978 88 8080 140 5. [Google Scholar]
- Krichak, S.O.; Breitgand, J.S.; Feldstein, S.B. A conceptual model for the identification of the Active Red Sea Trough Synoptic events over the southeastern Mediterranean. J. App. Meteorol. Climatol. 2012, 51, 962–971. [Google Scholar] [CrossRef] [Green Version]
- Giorgi, F.; Jones, C.; Asrar, G.R. Addressing climate information needs at the regional level: The CORDEX framework. WMO Bull. 2009, 58, 175–183. [Google Scholar]
- Bucchignani, E.; Mercogliano, P.; Panitz, H.-J.; Montesarchio, M. Climate change projections for the Middle East—North Africa domain with COSMO-CLM at different spatial resolutions. Adv. Clim. Chang. Res. 2018, 9. [Google Scholar] [CrossRef]
- Bucchignani, E.; Cattaneo, L.; Panitz, H.-J.; Mercogliano, P. Sensitivity analysis with the regional climate model COSMO-CLM over the CORDEX-MENA domain. Meteorol. Atmos. Phys. 2016, 128, 73–95. [Google Scholar] [CrossRef]
- Abuzied, M.; Mansour, B.M. Geospatial hazard modeling for the delineation of flash flood-prone zones in Wadi Dahab basin, Egypt. J. Hydroinformatics 2019, 21, 180–206. [Google Scholar] [CrossRef] [Green Version]
- Saber, M.; Abdrabo, K.I.; Habiba, O.M.; Kantosh, S.A.; Sumi, T. Impacts of Triple Factors on Flash Flood Vulnerability in Egypt: Urban Growth, Extreme Climate, and Mismanagement. Geosciences 2020, 10, 24. [Google Scholar] [CrossRef] [Green Version]
- El Osta, M.M.; El Sabri, M.S.; Masoud, M.H. Estimation of flash flood using surface water model and GIS technique in Wadi El Azariq, East Sinai, Egypt. Nat. Hazards Earth Syst. Sci. Discuss. 2016, 1–51. [Google Scholar] [CrossRef]
- Al Zayed, I.S.; Keshta, E.; Attia, K. Rainwater Harvesting as an Adaptation Measure to Climate Change: A Case Study of Mamora Beach Area, Egypt. Int. Water Technol. J. 2018, 8, 72–77. [Google Scholar]
Figure 1.
The location of the study area showing the Sinai Peninsula and its orography. Credits: ESRI World Imagery.
Figure 1.
The location of the study area showing the Sinai Peninsula and its orography. Credits: ESRI World Imagery.

Figure 2.
Watersheds of study area (Source: Elsayed et al., 2013).

Figure 3.
Climatology of Egypt, including the Sinai Peninsula, evaluated over the period 1981–2010. Monthly mean precipitation (in mm) and air temperature (in °K) at 2 m. (Data Source: European Centre for Medium-Range Weather Forecasts (ECMWF) ERA-Interim reanalysis).
Figure 3.
Climatology of Egypt, including the Sinai Peninsula, evaluated over the period 1981–2010. Monthly mean precipitation (in mm) and air temperature (in °K) at 2 m. (Data Source: European Centre for Medium-Range Weather Forecasts (ECMWF) ERA-Interim reanalysis).

Figure 4.
Mean air Temperature at 850 hPa: anomaly over the period 2010–2018 relative to the base period 1979–2000 (Data Source: ECMWF ERA-Interim reanalysis, available at: https://climatereanalyzer.org).
Figure 4.
Mean air Temperature at 850 hPa: anomaly over the period 2010–2018 relative to the base period 1979–2000 (Data Source: ECMWF ERA-Interim reanalysis, available at: https://climatereanalyzer.org).

Figure 5.
Annual and seasonal mean (top panel) and anomalies (bottom panel) of air temperature at 2 m over the Sinai Peninsula for the period 1979–2018, evaluated in the domain (27°–32° N, 32°–35° E). Base period for anomalies (1979–2000). (Data Source: ECMWF ERA-Interim reanalysis, available at: https://ClimateReanalyzer.org).

Figure 6.
Annual Total Precipitation over the Sinai Peninsula for the period 1979–2018, evaluated in the domain (27°–32° N, 32°–35° E). (Data Source: ECMWF ERA-Interim reanalysis, available at: https://ClimateReanalyzer.org).
Figure 6.
Annual Total Precipitation over the Sinai Peninsula for the period 1979–2018, evaluated in the domain (27°–32° N, 32°–35° E). (Data Source: ECMWF ERA-Interim reanalysis, available at: https://ClimateReanalyzer.org).

Figure 7.
Annual Total Precipitation in North, Middle, and South Sinai Peninsula with linear decreasing trend superimposed. (Data Source: Global Precipitation Climate Center data (GPCC) —https://www.esrl.noaa.gov/psd/data/gridded/data.gpcc.html).
Figure 7.
Annual Total Precipitation in North, Middle, and South Sinai Peninsula with linear decreasing trend superimposed. (Data Source: Global Precipitation Climate Center data (GPCC) —https://www.esrl.noaa.gov/psd/data/gridded/data.gpcc.html).

Figure 8.
Episode 7–10 March 2014. Storm evolution over Sinai and surrounding region. (Source: TRMM satellite data).
Figure 8.
Episode 7–10 March 2014. Storm evolution over Sinai and surrounding region. (Source: TRMM satellite data).

Figure 9.
Geopotential height at 700 hPa for the selected episodes: 8 January 2013 and 9 March 2014. (Source: NCEP-NCAR reanalysis).
Figure 9.
Geopotential height at 700 hPa for the selected episodes: 8 January 2013 and 9 March 2014. (Source: NCEP-NCAR reanalysis).

Figure 10.
Temperature. Results from an ensemble of nine GCM, for RCP4.5 scenario. Ensemble mean (mm/day) for the control period (1971–2000) (upper left panel-color scale on the upper left). Change in Ensemble mean (%-color scale at the bottom), for 2011–2040 (upper right), 2041–2070 (bottom left) and 2071–2100 (bottom right) compared with 1971–2000. (Source: https://cordex.org/).

Figure 11.
Precipitation. Results from an ensemble of nine Global Circulation Models (GCMs), for RCP4.5 scenario. Ensemble mean (mm/day) for the control period (1971–2000) (upper left panel-color scale on the upper left). Change in Ensemble mean (%-color scale at the bottom), for 2011–2040 (upper right), 2041–2070 (bottom left) and 2071–2100 (bottom right) compared with 1971–2000. (Source: https://cordex.org/).

Figure 12.
Temperature. Results from an ensemble of three GCMs for RCP4.5 scenario. Change in Ensemble mean monthly (C) for the future period 2041–2070 (2050s) compared with 1971–2000. January, April, July, and October are examples presenting winter, spring, summer, and autumn, respectively.
Figure 12.
Temperature. Results from an ensemble of three GCMs for RCP4.5 scenario. Change in Ensemble mean monthly (C) for the future period 2041–2070 (2050s) compared with 1971–2000. January, April, July, and October are examples presenting winter, spring, summer, and autumn, respectively.

Figure 13.
Temperature. Results from an ensemble of three GCMs for RCP4.5 scenario. Change in Ensemble mean monthly (C) for the future period 2071–2100 (2080s) compared with 1971–2000. January, April, July, and October are examples presenting winter, spring, summer, and autumn, respectively.
Figure 13.
Temperature. Results from an ensemble of three GCMs for RCP4.5 scenario. Change in Ensemble mean monthly (C) for the future period 2071–2100 (2080s) compared with 1971–2000. January, April, July, and October are examples presenting winter, spring, summer, and autumn, respectively.

Figure 14.
Precipitation. Results from an ensemble of three GCMs for RCP4.5 scenario. Change in ensemble mean monthly (no sign where the change is produced by dividing future by baseline) for the future period 2041–2070 (2050s) compared with baseline period 1971–2000. January, April, July, and October are examples present winter, spring, summer, and autumn, respectively. (White color indicates that baseline value equals zero).

Figure 15.
Precipitation. Results from an ensemble of three GCMs for RCP4.5 scenario. Change in ensemble mean monthly (no sign where the change is produced by dividing future by baseline) for the future period 2071–2100 (2080s) compared with baseline period 1971–2000. January, April, July, and October are examples present winter, spring, summer, and autumn, respectively. (White color indicates that baseline value equals zero).


Table 1.
The geomorphology characteristics of the watersheds of Sinai (Source: [25]).
Table 1.
The geomorphology characteristics of the watersheds of Sinai (Source: [25]).
| ID | Basin Name | Area (km2) | Basin Length (m) | Basin Slope (m/m) | Perimeter (m) | Max. Stream Length (m) | Max. Stream Slope (m/m) | Mean Basib Elevation (m) |
|---|---|---|---|---|---|---|---|---|
| 1 | Al Arish | 23,784.9 | 238,040 | 0.0469 | 1,213,900 | 354,250 | 0.0037 | 499.23 |
| 2 | Watier | 3521 | 76,110 | 0.1446 | 483,620 | 118,450 | 0.0122 | 912 |
| 3 | Al Grafee | 2610 | 84,713 | 0.0334 | 412,010 | 114,110 | 0.0051 | 640 |
| 4 | Dhab | 2070 | 56,686 | 0.2217 | 353,930 | 93,238 | 0.02 | 1062.9 |
| 5 | Al Awag | 1941 | 55,070 | 0.1967 | 278,530 | 75,529 | 0.0082 | 549.1 |
| 6 | Fieran | 1780 | 80,341 | 0.1949 | 420,050 | 132,660 | 0.0177 | 1015 |
| 7 | Wardan | 1180 | 59,345 | 0.1025 | 273,720 | 86,222 | 0.0113 | 523 |
| 8 | Ghrandal | 1074.1 | 78,119 | 0.1536 | 340,680 | 105,380 | 0.0134 | 801.73 |
| 9 | Kied | 1045.9 | 47,766 | 0.3465 | 258,500 | 679.14 | 0.0206 | 928.8 |
| 10 | Sidry | 868.6 | 56,292 | 0.1438 | 243,580 | 82,224 | 0.0107 | 570.24 |
| 11 | Paapaa | 712.7 | 54,971 | 0.1386 | 232,620 | 71,005 | 0.0154 | 600.24 |
| 12 | Sidr | 623.45 | 54,196 | 0.0862 | 205,660 | 79,078 | 0.0073 | 417 |
| 13 | Al Rahaa | 452 | 42,466 | 0.105 | 181,690 | 51,580 | 0.0134 | 488 |
| 14 | Om Adwy | 367.6 | 35,744 | 0.2589 | 151,320 | 47,503 | 0.0282 | 659.75 |
| 15 | Tieba | 333.9 | 43,354 | 0.303 | 158,240 | 51,471 | 0.0311 | 999.5 |
| 16 | Lehataa | 276.44 | 31,331 | 0.0571 | 114,790 | 43,528 | 0.0142 | 214.64 |
Table 2.
List of heavy rainfall events in the South Sinai Peninsula at different locations.
| Flash Flood Events in South Sinai 1 1990–2015 | |||
|---|---|---|---|
| Ras Sedr (32°43′00″ E, 29°35′00″ N) | Ras Sedr (Elmelha) (32°59′54″ E, 29°44′23″ N) | Saint Katherin (33°56′58″ E, 28°33′43″ N) | Newabaa (34°41′13″ E, 28°58′57″ N) |
| 02/03/1997 | 07/12/2000 | 22/03/1991 | 17/01/2010 |
| 07/02/1999 | 04/12/2001 | 17/10/1993 | 27/01/2013 |
| 07/12/2000 | 06/01/2003 | 20/10/1993 | 09/03/2014 |
| 10/01/2002 | 14/12/2003 | 01/01/1994 | 08/05/2014 |
| 16/12/2003 | 22/01/2004 | 18/01/2010 | 12/09/2015 |
| 14/01/2004 | 05/02/2004 | 08/01/2013 | 26/10/2015 |
| 04/02/2004 | 04/04/2011 | 25/01/2013 | |
| 18/01/2010 | 31/12/2013 | 27/01/2013 | |
| 25/02/2010 | 09/03/2014 | 09/03/2014 | |
| 09/01/2013 | 08/05/2014 | ||
| 01/02/2013 | 12/09/2015 | ||
| 09/03/2014 | 25/10/2015 | ||
| 07/05/2014 | |||
1 Other events occurred in South Sinai more recently, including a 27–29 October 2016 episode when the storm also affected the Red Sea, Ismailia, Beni Suef, Qena, Assiut, and Suhag provinces (https://reliefweb.int/disaster/fl-2016-000114-egy).
Table 3.
List of heavy rainfall events in the North Sinai Peninsula at different locations.
| Flash Flood Events in North Sinai 1990–2015 | |
|---|---|
| Godirat (34°24′35″ E, 30°38′28″ N) | Maghara (34°32′ E, 30°23′ N) |
| 22/03/1991 | 27/10/2005 |
| 05/01/2001 | 21/10/2007 |
| 29/01/2004 | 18/01/2010 |
| 17/04/2006 | 09/01/2013 |
| 10/12/2009 | 09/05/2014 |
| 17/01/2010 | 29/10/2015 |
| 09/03/2014 | |
| 09/05/2014 | |
| 25/10/2015 | |
| 29/10/2015 | |
Table 4.
Total rainfall in Upper Egypt, the Red Sea, and the Sinai Peninsula during the 7–9 March 2014 event.
Table 4.
Total rainfall in Upper Egypt, the Red Sea, and the Sinai Peninsula during the 7–9 March 2014 event.
| Amount of Precipitation Observed in the Upper Egypt, the Red Sea, and Sinai Peninsula during the 7–9 March 2014 Event | ||
|---|---|---|
| Station | Precipitation mm | |
| UPPER EGYPT | Aswan | 29 |
| Luxor | 29 | |
| Asyut | 9 | |
| RED SEA | Hurgada | 21 |
| SINAI | Sharm El-Sheikh | 27 |
| Dahab | 30 | |
| Saint Cathrene | 29 | |
| El Tor | 17 | |
| Nuwaibaa | 8 | |
| Nekhel | 5 | |
© 2020 by the authors. Licensee MDPI, Basel, Switzerland. This article is an open access article distributed under the terms and conditions of the Creative Commons Attribution (CC BY) license (http://creativecommons.org/licenses/by/4.0/).
Share and Cite
MDPI and ACS Style
Baldi, M.; Amin, D.; Al Zayed, I.S.; Dalu, G. Climatology and Dynamical Evolution of Extreme Rainfall Events in the Sinai Peninsula—Egypt. Sustainability 2020, 12, 6186. https://0-doi-org.brum.beds.ac.uk/10.3390/su12156186
AMA Style
Baldi M, Amin D, Al Zayed IS, Dalu G. Climatology and Dynamical Evolution of Extreme Rainfall Events in the Sinai Peninsula—Egypt. Sustainability. 2020; 12(15):6186. https://0-doi-org.brum.beds.ac.uk/10.3390/su12156186
Chicago/Turabian StyleBaldi, Marina, Doaa Amin, Islam Sabry Al Zayed, and Giovannangelo Dalu. 2020. "Climatology and Dynamical Evolution of Extreme Rainfall Events in the Sinai Peninsula—Egypt" Sustainability 12, no. 15: 6186. https://0-doi-org.brum.beds.ac.uk/10.3390/su12156186
Note that from the first issue of 2016, this journal uses article numbers instead of page numbers. See further details here.