Article

Strongly and Loosely Bound Water in Ambient Particulate Matter—Qualitative and Quantitative Determination by Karl Fischer Coulometric Method

by
Kamila Widziewicz-Rzońca
1,*,
Malwina Tytła
1,
Grzegorz Majewski
2,
Patrycja Rogula-Kopiec
1,
Krzysztof Loska
3 and
Wioletta Rogula-Kozłowska
4
1
Institute of Environmental Engineering, Polish Academy of Sciences, 34 M. Skłodowskiej-Curie St., 41-819 Zabrze, Poland
2
Institute of Environmental Engineering, Warsaw University of Life Sciences, 166 Nowoursynowska St., 02-776 Warsaw, Poland
3
Faculty of Energy and Environmental Engineering, Silesian University of Technology, 18A Konarskiego St., 44-100 Gliwice, Poland
4
Faculty of Fire Safety Engineering, The Main School of Fire Service, 52/54 Słowackiego St., 01-629 Warsaw, Poland
*
Author to whom correspondence should be addressed.
Sustainability 2020, 12(15), 6196; https://0-doi-org.brum.beds.ac.uk/10.3390/su12156196
Submission received: 4 June 2020 / Revised: 21 July 2020 / Accepted: 28 July 2020 / Published: 31 July 2020

Abstract

:
Simple physical characterization of water evaporation can provide detailed information regarding its component distribution in particulate matter (PM) samples. The water presence in PM can greatly influence its polarity and subsequent reaction activity, for example, in secondary inorganic and organic matter formation. In this study, the presence of PM-bound water is detected using the Karl Fischer titration method in a temperature gradient with an aim to quantitatively assess different types of water occurrence. The analyses were initiated by testing two reference materials, namely urban particulate matter 1648a and urban dust 1649b (NIST). Four different types of water were found in both NIST materials, which helped to optimize the temperature ramp program and its adjustment for real PM samples. It was found that water contents in total suspended particles (TSP) are similar to those typically occurring in urban background stations—approximately 7.12–45.13% of the TSP mass, differentiated into the following water mass contributions: 48.5% of the total water found was loosely bound water; 23.3% was attributed to the absorption water; while the missing 20% could be probably attributed to crystal water removed only above 180 °C and artifacts connected with the drift correction problem. By comparing water release curves for single PM-compounds like pure SiO2; Al2O3; NH4NO3; (NH4)2SO4 and NH4Cl with water spectra obtained for real PM samples, it was found that water in particulate matter mainly comes from the dehydration of TSP-bound crystalline like Al2O3, SiO2 and to a lesser extent from salts like NH4NO3; (NH4)2SO4 and NH4Cl. A newly used thermal ramp method was able to assess water contents from Teflon–polypropylene baked filters characterized by low melting points and therefore filter degradation even under temperatures oscillating around 200 °C. The advantage of this new work is the separation of different types of TSP-bound water contributions, facilitating and promoting further research on the origin of PM-bound water and its role in atmospheric chemistry, secondary aerosol formation and visibility.

1. Introduction

The presence of PM-bound water (water bound to PM particles, also liquid water in hygroscopic particles) is one of the factors responsible for the discrepancy between its gravimetric mass and the chemically reconstructed mass calculated by summing up its chemical compounds [1,2,3,4,5,6,7]. Water in PM may occur as loosely bound water (also adsorption water) and constitutional water—strongly bound to ambient PM and irreversibly associated with the chemical structure of PM-forming compounds under normal conditions [8,9,10]. The strength of this binding will vary depending on the chemical composition of PM, and also on its origin (source of PM emission). An attempt to quantify the water content related to PM particles supported by qualitative information regarding types (classes) of water present in PM has so far appeared in only a few papers [8,11]. In general, the mass ratio between loosely/strongly PM-bound water can be described by two key parameters. The first one is deliquescence relative humidity (DRH), describing the threshold of relative humidity at which the phase becomes saturated liquid. The second one is crystallization relative humidity (CRH), the humidity at which nucleation occurs and initially the aqueous solution goes into the crystalline phase [12]. Constituents like sulfates and nitrates drive aerosol water uptake, but also hydrophilic organic compounds can promote the uptake of water [13,14], especially under high humidity conditions [15]. Both the amount of adsorbed water as well as the presence of secondary ammonium salts can be responsible for generating positive mass artifacts [16]; for example, gaseous NH3 and HNO3 favors the formation of NH4NO3. Increases in ambient relative humidity can increase aerosol liquid water and thus the composite particle mass and particle volume, thereby being responsible for exceeding the regulatory limit values [11]. The amount of water to PM can vary from a few to several dozens of mass percent [17]. Given the variable chemical composition of PM, the presence of water will also differ depending on its origin (source of emission, sampling point location). According to model estimates made by Tsyro et al. (2005) [18], the share of water associated with PM2.5 at a relative humidity of 50% ranged from 20% to 35%. Under somewhat lower RH—30%, in Sapporo—water comprised 0.4–3.2% of total particulate matter (TPM) [19]. Significantly lower water contents of about 10.6% for the PM10 fraction and 13–23% for PM2.5 were found in Switzerland under 50% relative humidity using mass closure, the most popular method of determining water as the missing element of PM [1]. In the majority of papers, the amount of water is given only as the estimation; this mostly applies to the implementation of the mass closure method, where the missing mass of PM is attributed to the presence of water [1,2,3,4,5,6,20]. Results obtained by Rogula-Kozłowska (2016) [5], when analyzing mass closure for size-segregated PM indicate that the unidentified share of mass was even 37.5 % in the case of PM10–40 and greatest among all shares found in the basic fractions. Apart from water, this mass can be attributed to organic compounds and to nitrates that evaporate during handling of the PM samples and of unidentified organic compounds [12,18,21]. An important conclusion from this work was that PM10–40 is supposed to be most hygroscopic since this fraction is rich in hygroscopic compounds (Al2O3, CaCl2, NaCl, etc.). The built-in water, like water present in the crystal lattice of crystalline solids, can only be removed from PM under higher temperatures or under the influence of dehydrating agents. Information regarding the influence of temperature on the creation of metastable intermediates of PM in relation to the particle dimensions is of much interest since anhydrous PM have a completely different crystal structure and physical–chemical properties compared to its stable hydrates. Wet and dry particles differently control air pollution [5,22], visibility [23] and also health effects due to variations in aerodynamic diameters [8]. The results obtained from cited works suggest that the presence of water in PM is not only an indicator of its physical and chemical properties, but in well-planned experiments, including the characterization of the water contribution due to structurally-bound water may be used as a tracer (marker) of its probable origin [11].
The presented work aims to quantify the presence of PM-related water in real PM samples using the Karl Fischer titration method extended by gradual evaporation of water from the sample in the ramp program. This method allows for the assessment of the content of various types and shares of water associated with total suspended particle (TSP) samples. An increasing interest in understanding the dehydration (water release) pathways of PM particles result from the fact that the chemical properties in the wet state differ from its anhydrous counterparts and therefore differently respond to all chemical processes occurring in the atmosphere.

2. Materials and Methods

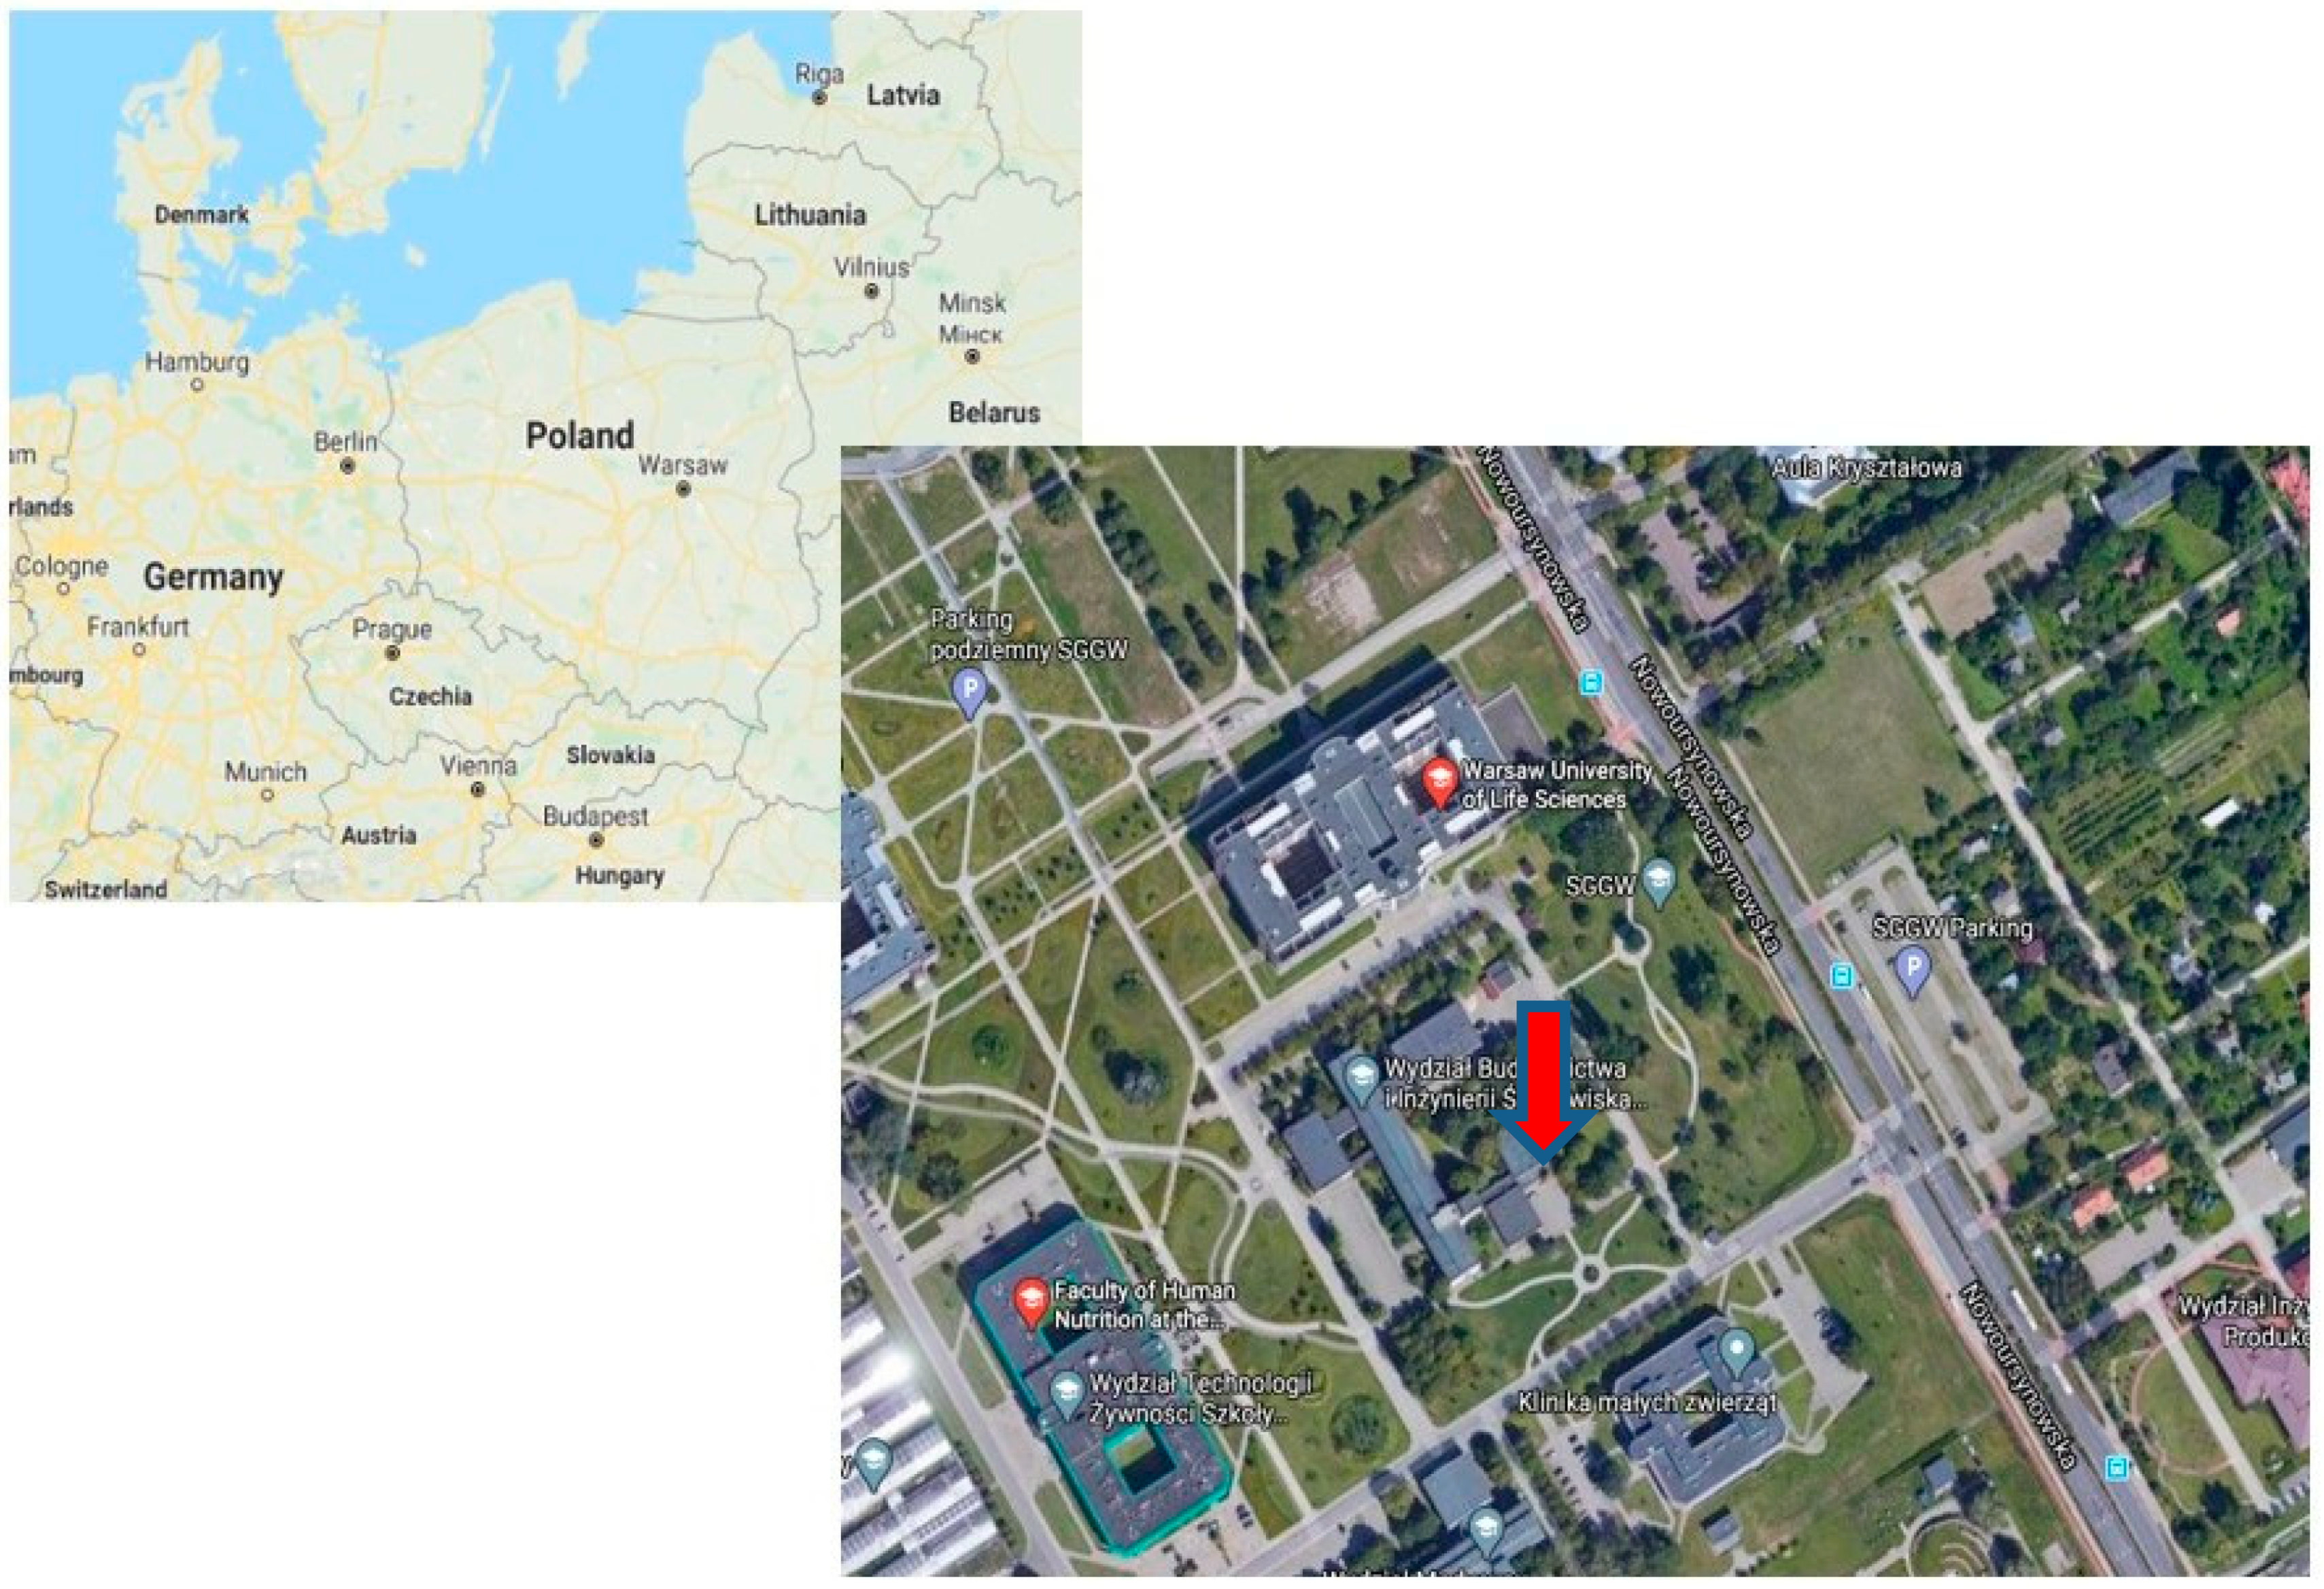
2.1. Sampling Area and PM Samples Collection

TSP samples were collected at an urban background station in Warsaw (central Poland), where the Ursynów meteorological station at the Warsaw University of Life Sciences (WULS) is located (λE 21°02′52″, φN 52°09′38″, 102.5 m a.s.l.) (Figure 1). The sampling site in Warsaw works under the regional air quality monitoring network in Mazowieckie Voivodship. The sampling point is representative for an urban background site. However, as presented in a number of our previous papers [7,24,25], this area is subjected to emissions from traffic, since it is surrounded by a great number of heavily trafficked streets (the nearest ones are located just 500 m to the southeast and 1000 m to the south from the sampling point) and densely built up with low residential buildings either connected to the district heating network or heated with local coal-, gas- or electricity-powered boilers. The distance from the heavily trafficked center of Warsaw is about 7000 m to the north and northeast and about 3800 m in the northeast direction from the largest Polish heat and power generating plant “Siekierki” with a heat capacity of 2 MW and power generation capacity of 622 MW. The 24-h TSP samples were collected in autumn from 4 to 14 October 2018 and were a part of longer measurement campaign within the project “Atmospheric water as a marker of PM origin” coordinated by IEE PAS (contract no 2016/23/D/ST10/02705). Both TSP and PM1 samples were collected onto PTFE (Polytetrafluoroethylene)–polypropylene-backed filters (Whatman, Ø 4.7 cm; 0.5 µm QM-A) using a low-volume (2.3 m3/h) air sampler, (Twin Dust; Zambelli Milan, Italy) equipped with the TSP and PM1 sampling heads (Atmoservice; Poland). TSP and PM1 samples were equilibrated for 48 h and weighed twice under moisture and temperature conditions set in EN 12341:2014 [26], standard gravimetric method (air temperature of 20  ±  1 °C and relative humidity of 50  ±  5%) by means of Mettler Toledo microbalance (range: 0.001 mg–0.1 mg; resolution 2 µg, USA). After the first weight measurement (after 24 h) filters were returned to Petri slides and conditioned for another 24 h in the weighing environment, after which the subsequent mass measurement was performed. Each filter was therefore measured four times (twice after 24 h and twice after next day). The average samples masses were further used to calculate water mass as a wt % percentage. Only TSP samples were subjected to water determinations. Water was measured as PM-bound water without any partitioning for water vapor and particulate water.
Analysis of PM-bound water was made from PTFE–polypropylene baked filters, which choice encountered some analytical problems. To establish the temperature behavior of the PM collected on Teflon media and in single TSP-bound compounds, the conditions of the water release must be identical. Taking into account the inseparability of the particulate sample from the filter media in the case of traditional sampling and the fact that the temperature at which the decomposition begins is around 200 °C [27], followed by a rapid decomposition above 400 °C [28], the maximum temperature of the water release cannot be set above this point. This discloses the possibility to assess the water contribution typical for example for carbon compounds (carbon pyrolysis > 400 °C).

2.2. Meteorological Parameters during Measurement Campaign

In the course of observations, basic meteorological conditions were collected at Ursynów-SGGW (Warsaw University of Life Sciences) meteorological station according to the guidelines and operational schemes developed by the Institute of Meteorology and Water Management. The following meteorological parameters were monitored: average air temperature, Tmax, Tmin, air relative humidity, atmospheric pressure, total precipitation. Hourly gathered meteorological data was averaged for daily 24 h measurements from 12.00 a.m. to 12.00 a.m.

2.3. Apparatus

After weighing, filters were moved into dried vials (250 °C, 24 h; stored in a desiccator) and closed by aluminum septum caps (with silicone membrane). Temperature and humidity conditions in the weighing room were the same as inside the Karl Fischer laboratory room to eliminate the possibility of additional water sorption. Water determinations were performed by means of the Karl Fischer titration method with the usage of Karl-Fischer 831 coulometer equipped with an 874 Oven Sample Processor (fully automated coulometric method; Metrohm AG, Herisau, Switzerland). Hydranal-Coulomat; AG-Oven, SigmaAldrich, MO, USA was used as titration reagent (150 v/v). The parameters of the water extraction were adjusted following data published by Canepari et al. (2013) [11]. A fully regenerable (300 °C for 24 h) Hydranal-molecular sieve 0.3 nm (Metrohm AG, Herisau, Switzerland) was used as a drying agent for the carrier gas (air). The moisture contained in the sample evaporates and is transported by a dry carrier gas into the titration cell.
In this coulometric titration method, the end point is determined by electrochemical means. In other words, water present in a filter sample is consumed by the Karl Fischer reaction until a slight excess of iodine accumulates, which is detected by double Pt electrode and defines the end of the titration (end point, EP). When selecting the temperature to be used for driving off the water, the thermal stability (instability) of the particular sample was taken into account, as well as the fact that water is only released at a sufficiently rapid rate at temperatures above 100 °C. The maximum temperature of water release was adjusted to achieve complete samples drying, while keeping the temperature below the filter melting point (the PTFE filter keeps its stability below 200 °C). Oven temperature should be chosen as high as possible to ensure short determination times but still be 20 to 30 °C below the decomposition temperature. Therefore, 180 °C was used as upper extraction temperature limit.
The analyses were performed in a ramp function, which allows to set heating ramps. To compare water release curves between real PM samples and selected PM compounds, the same ramp program in the range of 50–180 °C was used for each measured sample. The thermal steps used in this work were published previously in a few studies regarding the qualitative detection of water presence in PM samples [11,29]. In this work, the following thermal ramp process was used: 5 min at 50 °C (1st heating block; FP1); from 50 to 120 °C at 14 °C/min (2nd heating block); 5 min at 120 °C (FP2) from 120–140 °C at 12 °C/min (3rd heating block); 2 min at 140 °C from 140–160 °C at 14 °C/min (4th heating block), from 160–180 °C at 14 °C/min (5th heating block), and 20 min at 180 °C (6th heating block; FP3), adjusted to PTFE filters. Normally, titration to dryness in single heating block is communicated by obtaining low drift (usually <10 μg H2O/min). When the original stable drift value is reached, titration stops and the end point value is displayed. Some modifications were made to the default settings regarding identification of the end point value with an aim of further titration in the 2nd–6th heating blocks. When using the thermal ramp function it was necessary to exclude the end point identification, signaled as the return of the drift to its baseline value. Therefore, the minimum value of the difference between the indicator platinum electrodes was set at 30 mV, and the limit value of the drift was set at 1 µg/min. The total extraction time was significantly elongated to 3000 s. Some modifications were also made regarding subtraction of the blank water contents from those found in the measured samples. The software automatically calculates the amount of released water by subtracting the baseline drift value from the final water contents, where the baseline drift is extrapolated by multiplying its initial value to the end of the analysis. As a consequence, an elongation of the analysis (extraction time) to 3000 s increases the drift contribution to the final water contents in measured samples. To achieve the best accuracy of results and reduce the influence of moisture conditions inside laboratory room, the operative blank measurements were carried out after each 4th sample and the final water contents were calculated by subtracting the blank water contents from each point of the water release curve, as presented in Figure 2.
The intra-day (water release curve performed and inter-day (water release curve repeated on two consecutive days) variability in the blank water contents were measured (Figure 2) and the results are presented in the method validation section (Section 2.4).

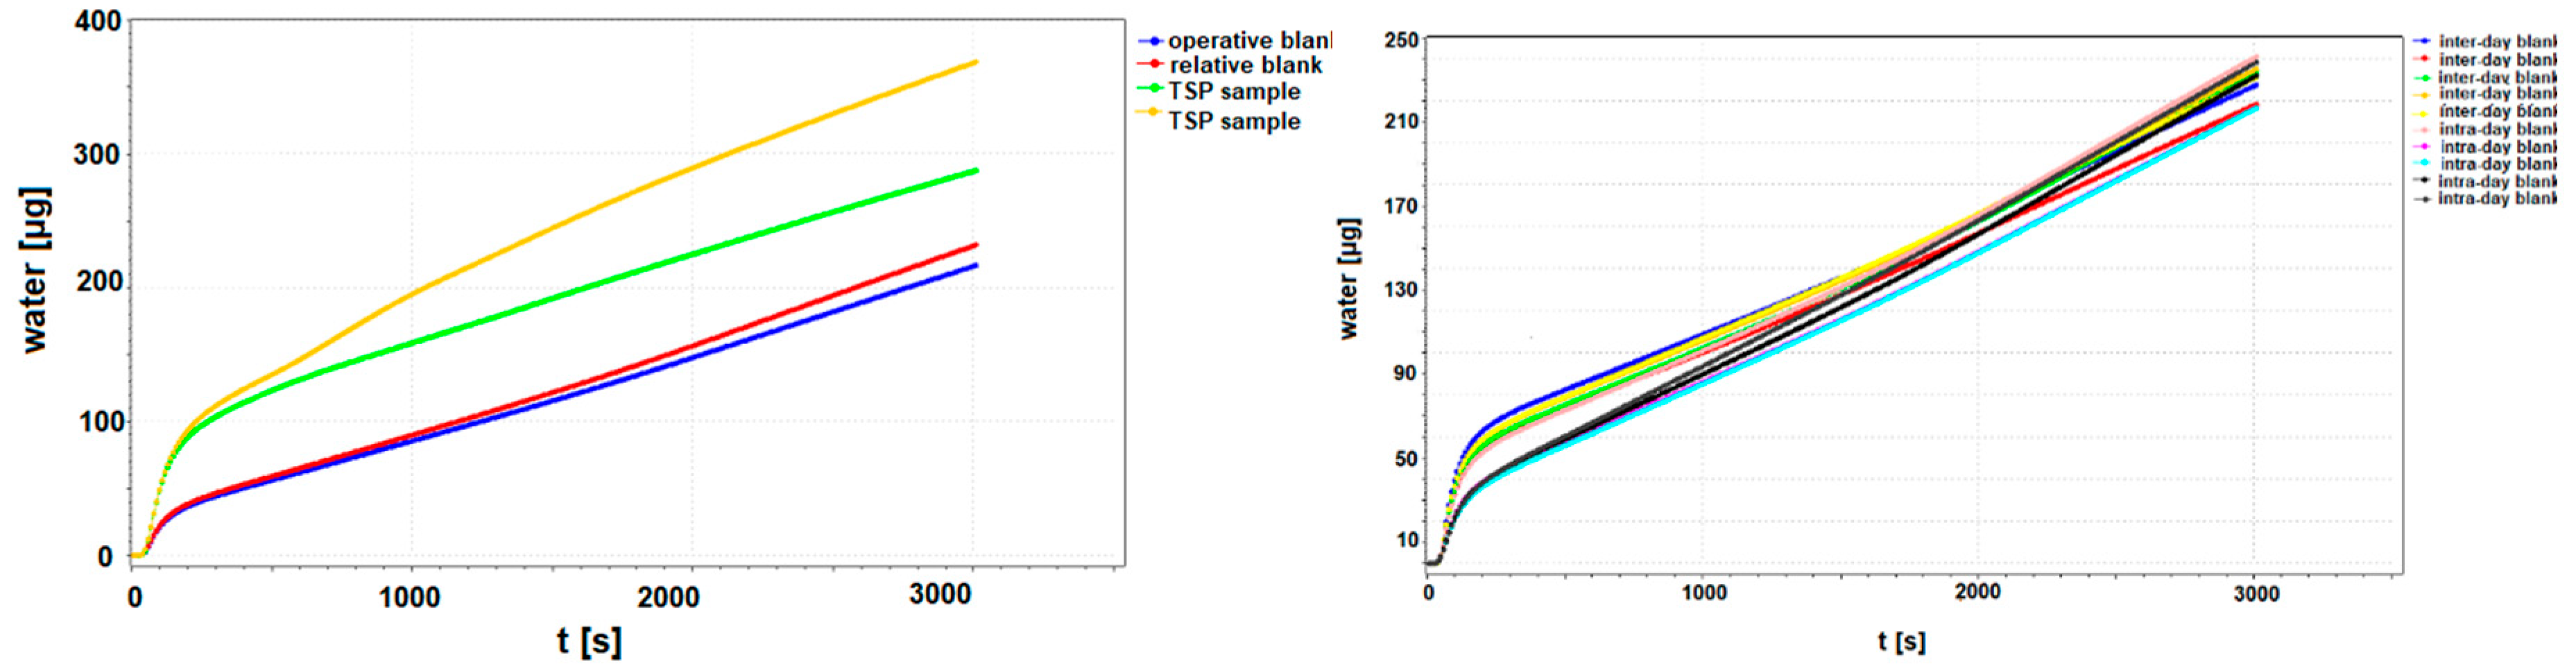
2.4. Method Validation and Quality Control

Additionally, we used a relative blank value (the remaining air volume, i.e., the moisture adhering to the vessel walls, vial cap and septum) when calculating the water content of the samples. This was performed by analyzing ten empty vials at the ramp temperature each day when water analyses were carried out. The results were presented as intra-day and inter-day variability in the relative blank water contents.
The limit of detection (LOD) and limit of quantification (LOQ) were calculated by measuring the water concentration corresponding to the sample blank value plus three standard deviations and plus ten standard deviations, as shown in the following equations:
LOD = Xb1 + 3Sb1
LOQ = Xb1 + 10Sb1
where Xb1 is the mean concentration of the blank, and Sb1 is the standard deviation of the blank (10 replicates).
For blanks prepared in laboratory conditions (dried, empty vials capped in the room, where the KF apparatus is being kept), the following results were obtained for typical intra-day variability in the blank water contents: LOD = 12.6 μg and LOQ = 42.05 μg. In the case of inter-day variability, those values were as follows: LOD = 19.4 μg and LOQ = 64.78 μg. The influence of the drift signal variability increased with the duration of the analysis. In our conditions, those variations were 0.08 µg/min and 0.13 µg/min for intra-day and inter-day variations, respectively (10 replicates of the operative blank).
Hydranal Water Standard KF-Oven 220–230 °C (HYD; Fluka Analytical) and Apura Water Standard Oven 1%, (WSO; ACS Merck KGaA), containing 5.55 ± 0.05% and l.0 ± 0.03% of water, respectively were used for controlling the KF oven. According to information prepared by Fluka (Hydranal Manual) and given in the certificate of analysis of both certified reference materials the optimum sample quantity was 80 mg in the case of WSO and 200 mg in the case of HYD (three replicates). The recoveries of water from WSO and HYD were 0.95 ± 0.004% and 5.55 ± 0.01%, respectively.
Table 1 presents the recovery values for two standard reference materials used popularly in KF oven determinations. The amounts of those materials were weighed according to information presented in Hydranal Manual guidance [30]. In all cases, the recovery value was close to 100%, while the repeatability estimated on the basis of SD values was better for WSO (Apura Oven) material, which can be associated with the better stability of water present in this standard, compared to Hydranal. Good recoveries were also obtained (Table A2) for reduced SRM (Standard Reference Material) mass, much beneath one recommended in the certificate and close to masses typically obtained for 24 h TSP sampling using LVS (Low Volume Sampler, approximately 3000 µg per filter). When analyzing water amount in single TSP compounds, we used as an inorganic carbon imitation a Multiwall Carbon Nanotubes (SRM 2484, raw soot) produced by NIST.

2.5. Statistical Analysis

The obtained results were analyzed using the Statistica package for Windows version 13 (Stat Soft, Cracow, Poland). Summary statistics (mean, standard deviation, minimum and maximum) were determined for TSP samples (µg/m3) and TSP-bound water (µg/m3), and also presented as a percentage of water in TSP mass (%). The water content in the single TSP compounds (SiO2, Al2O3, NH4NO3, (NH4)2SO4, NH4Cl and carbon nano-tubes) was measured as g/kg of measured substance and presented in Table 2.
Descriptive statistics regarding TSP, PM1 concentrations and meteorological conditions, together with the results from TSP-bound water determinations, are presented in Table A1 in the Appendix A.

3. Results and Discussion

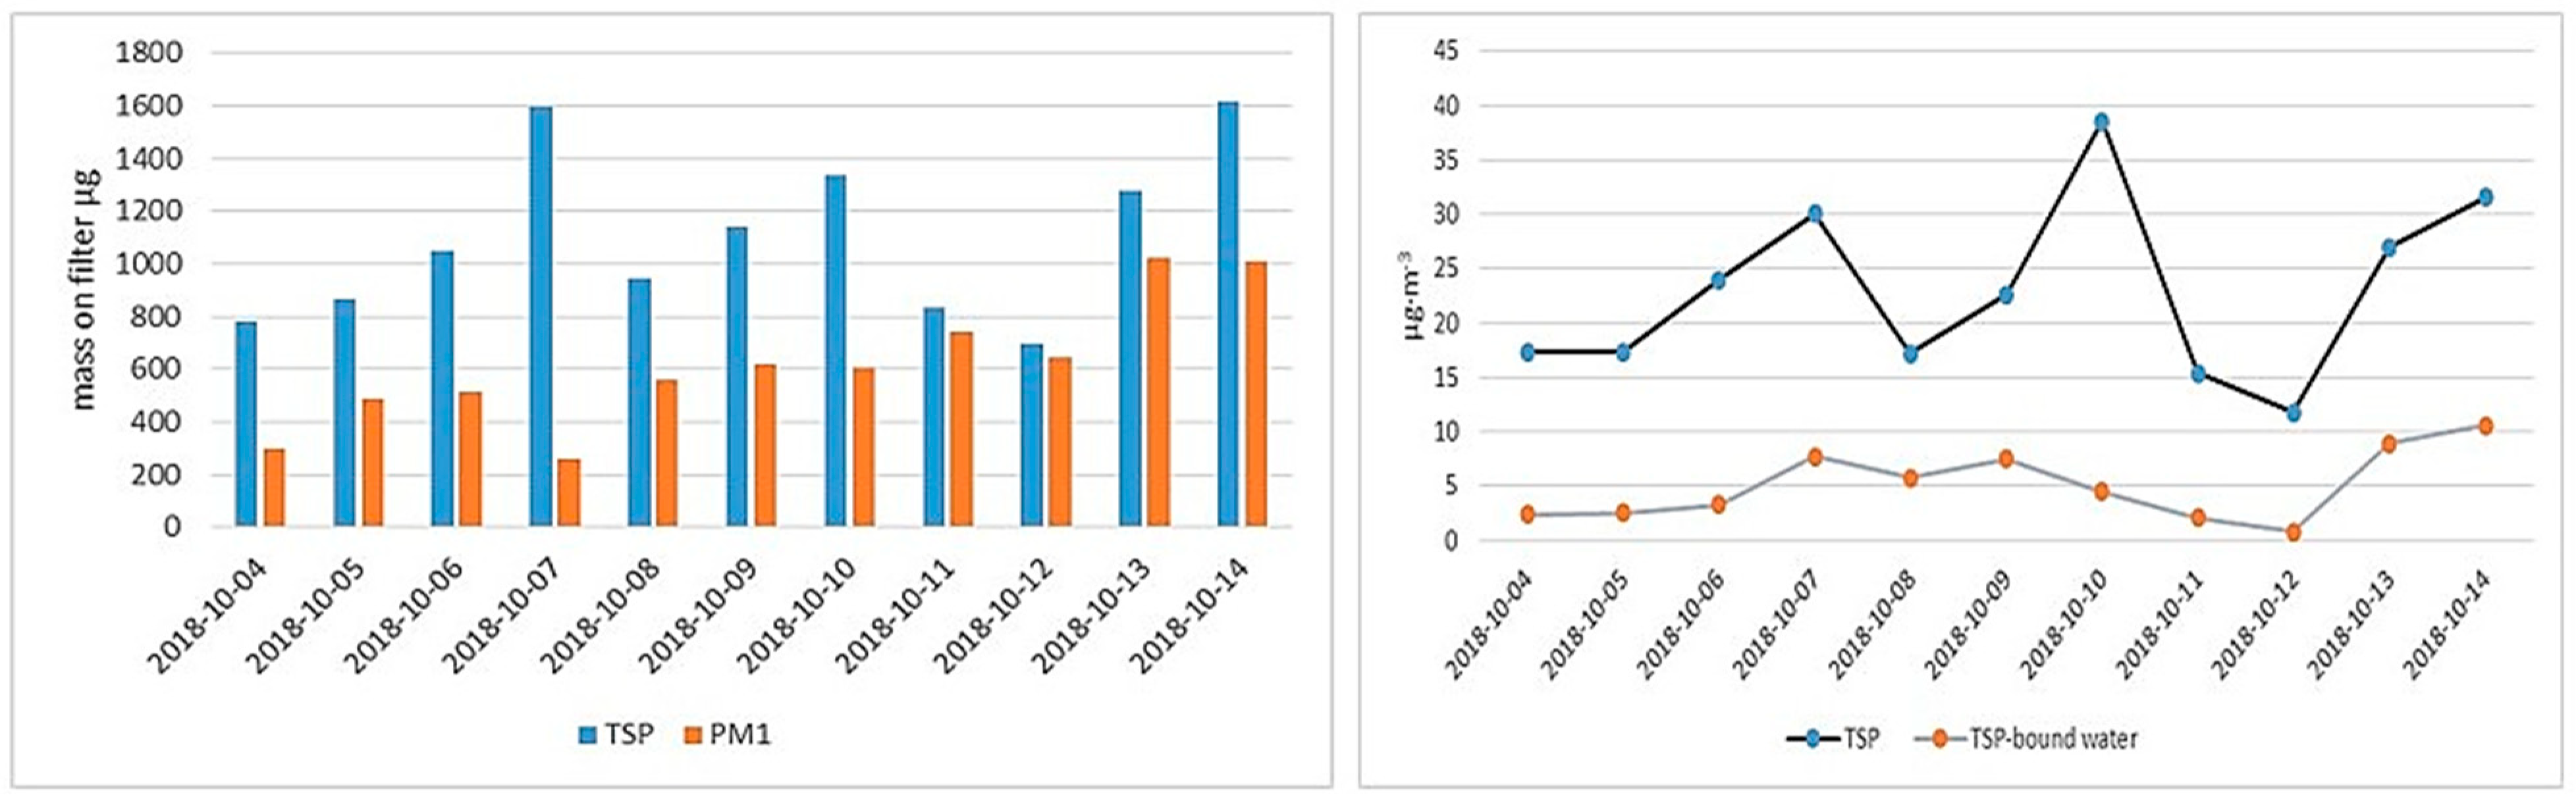
3.1. Relationship between PM (TSP; PM1) Concentrations and Particulate Water Contents, Including Total Water and Different Temperature-Dependent Water Contributions

The PTFE filters have many advantages in water determination, like, most importantly, their hydrophobic (water resistant) character, chemical inertia, and high collection efficiency estimated at 99.99%. However, next to those advantages stands their disability for longer collection, especially during high concentration episodes, since they easily become clogged and the declared air volume capacity cannot be obtained. Therefore, the masses of PM sample possibly collected onto those filters are much smaller compared to quartz or glass filters, negatively affecting the total amounts of PM-bound water available for the detection. Some previous research was carried out in order to characterize the influence of air relative humidity on the amount of water absorbed by filter media [31]. We indicate that blank water values found in quartz fiber filters (2529 µg per filter) are even 30 times higher compared to those typical for PTFE membranes (81.8 µg per filter) under normal conditioning parameters (50% RH). When comparing the water release curve between operative and relative filter blanks, it becomes obvious that water contents in PTFE filters are almost inseparable from ambient air water contents (Figure 2 left). PTFE filters are therefore considered as the most suitable media for assessing water in PM samples. To optimize the analytical method, further analyses were performed in order to determine the inter-day and intra-day water variability in PTFE filter blanks. The performed tests showed a good repeatability in the case of analyzing blanks on the same day (52 ± 4.2) and between subsequent days, with some higher water contents (on average 28 ± 6.4 µg) in the case of inter-day variations (Figure 2 right).
Any deviations in temperature, humidity or pressure conditions in the weighing room modulate water vapor contents but also the hydrophilic or hydrophobic nature of the PM-bound water. To assess the blank contents of PM-bound water, filter blanks were first equilibrated and their water contents were determined in the conditions equal to those met during conditioning step (needed to eliminate any rises/loses of water vapor during weighing and further analysis). In this study, conditions recommended by EN 12341:2014 standard were used [26]. Our previous research [31] indicates that in the case of filters made from PTFE, the absolute difference in filter-bound water mass (calculated for single PTFE filter) conditioned at 40% and 50% RH in the weighing room is only 14 µg, while the variation in filter mass is approximately two times higher and equal to 28.4 µg. The variations of weakly-bound water contents due to differing humidity conditions (typically occurring in our weighing room) is negligible compared to PM-bound water contents. Moreover, the rise of water sorption in the case of the most hydrophobic Teflon filters was rather stable and almost equal between 20–50% RH and 50–90% RH. Under 50% RH, the mass concentration of water [%] was 0.06% of the filter mass, while under 90% RH it was 0.15%. The performed analysis gave us the answer to the question of to what extent conditions in the weighing room modulate filter-bound water contents; however, this does not respond to the question of which part of the filter blanks comes from water vapor and which from constitutional water embedded in filter material. The presented results cannot be strictly transferred to loaded filters, where the chemical composition of PM as well as its physical state affect the amount of water absorbed as both water vapor and particulate water.
After calculating blank water content, the second step was optimization of the thermal ramp program [Figure 3]. As is well known, the curve profile of each measured substance strongly depends on the thermal ramp process used (Section 2.3). As previously described by Canepari et al. (2013) [11], with the usage of linear temperature toward NIST material (1649a), only a single water contribution is captured, relative to the total water content. When optimizing the thermal process by step-rise in temperature, different water contributions could be obtained. In this study, the temperature profile was lowered to 180 °C in the final step, while Canepari et al. (2013) [11] used 250 °C as the maximum upper temperature. Temperature limitations imposed by the usage of polypropylene-backed Teflon filters resulted simultaneously in insufficient separation between first and second peak on the water release graphs in the case of NIST materials. The KF curve in the case of 1649b material is almost identical as in the case of that used by Canepari et al. (2013) [11] for 1649a standard. A significant difference is observed, however, when comparing the profiles of 1648a and 1649b samples [Figure 3]. The first biggest weight loss is observed beneath 120 °C, attributable to loosely bound water, the second peak in both cases occurred in the range 300–600 s which corresponds to the temperature range of 120–130 °C. The third highest water loss occurred in the temperature range below 140 °C, followed by the fourth, with a much smaller peak in the temperature range 150–180 °C and a fifth one, with a large peak in the temperature range above 170 °C. The first peak in the NIST 1648 water release curve occurs in the range of 0–400 s and can be described as weakly adsorbed moisture, with the next well-defined contribution in the range 500–700 s, and the last one above 1300 s. The operational definition of water contributions used in this study (weakly retained water beneath <120 °C, and strongly retained water >120 °C) applies only to PM samples conditioned under 50% RH and 20 °C.
When analyzing real TSP samples collected in Warsaw (Figure 2), it was found that water contents in those samples were on average 250.6 ± 166.1 µg and in the range of 42.5–543.1 µg and reached values typically found in urban background sites. The mean concentrations of TSP-bound water were in the range 5.30 ± 3.07 µg/m3. Such water levels were determined from sample weights typically found at this site, accounting for 0.59–1.62 mg and similar to those previously tested by Canepari et al. (2013) [11] (range 0.5–2.9 mg). The masses of collected samples oscillating around 0.5 mg are therefore sufficiently high enough to obtain analytical signals well above the limit of detection values. In general, water constituted about 7.12–33.53% of the TSP mass collected in Warsaw and correlates well with sample mass (Figure 4). The presented work does not aim to analyze the variations depending on size-, season-, location-, or meteorological conditions in PM-water bound concentrations but is rather a case study regarding the qualitative composition of TSP-bound water. Our previously published papers already provided some explanation regarding the dependencies between the source and the water presence in the receptor [7] as well as a state of knowledge regarding mass relations between coarse PM and fine PM in Warsaw [24]. In this work, we found that the fine PM1 fraction constitutes about 56% of the TSP, which is in agreement with the findings of Rogula-Kozłowska et al. (2019) [7] and gave us some tips to conclude that a significant portion of PM-bound water can be present in this size fraction. During summer periods, the PM1 mass in Warsaw is the main contributor to PM10, averaging about 60% of its mass, while in the winter period this relation moves toward PM10 with a PM1/PM10 mass ratio of approximately 40% [7]. The conclusion is that during the heating season, the TSP at the SGGW (Warsaw University of Life Sciences) sampling point is dominated by fine particles. Simple comparisons of particle mass ratio cannot be directly used for any inference about the distribution of water contents in different size fractions of PM. This aspect is more complicated and needs further research. In winter periods, water will likely come mainly from organic compounds released into the atmosphere from residential heating sources and will be assisted by elevated concentrations of NH4+, SO42−, and Cl ions. In summer, PM-bound water presence will be correlated with nitrate concentrations and dust resuspended from roads [5,32], which is also observed in other urban areas in Poland [33]. In the case of fine PM fractions, those relations will be more prominent compared to TSP and modulated by seasonal activity of emission sources such as residential heating and enhanced combustion from motor vehicles. To provide some overview on the probable classes of water occurrence in TSP, the results from the qualitative analysis are presented (Figure 5, Figure 6, Figure 7, Figure 8 and Figure 9).
In most cases, the only water contribution in the case of real TSP samples was found in the range 0–500 s, and this water contribution can be described as loosely bound water—mostly the moisture present as water vapor. The average amount of water in this step (calculated on the mass basis) was on average 130 ± 102 µg, while under the next temperature steps (120–140 °C) and (140–180 °C), the amount of water release increased for just about 41 and 38 µg, respectively. This strictly suggests that TSP moisture is released to the greatest extent in the first temperature step, followed by the 120–140 °C temperature range.
We see that the amount of TSP-bound water released under the first temperature range constitutes 48.5% of the total water determined (Figure 5). In the case of (120–140 °C) and (140–180 °C) temperature ranges, those amounts comprised 13.7% and 10.7% of the total TSP-bound water, respectively. The missing part of water, approximated to 20%, is probably constitutional water embedded in the crystal lattice of PM compounds. The mass ratio between loosely (50–120 °C) and strongly bound water (120–180 °C) was on average 1.98%, which suggests approximately a two-times higher amount of loosely water compared to strongly bound (Figure 5). In terms of concentration, the average amounts of loosely- and strongly-bound water were 4.73 µg/m3 and 2.39 µg/m3, respectively.
In the left panel of Figure 6, we present examples of the KF titration curves obtained while analyzing real TSP samples collected in Warsaw (before blank sample subtraction). Most of the analyzed samples had very similar profiles with a single peak in the time range 0–500 s. Some of them however (like in the case of the sample featured with red line), show some different thermal profiles including two peaks. Those two water contributions were observed over 0–500 s and 700–1100 s of the extraction time. Such a profile was most almost identical to the one typical for Al2O3 and inorganic carbon water release (Figure 7).

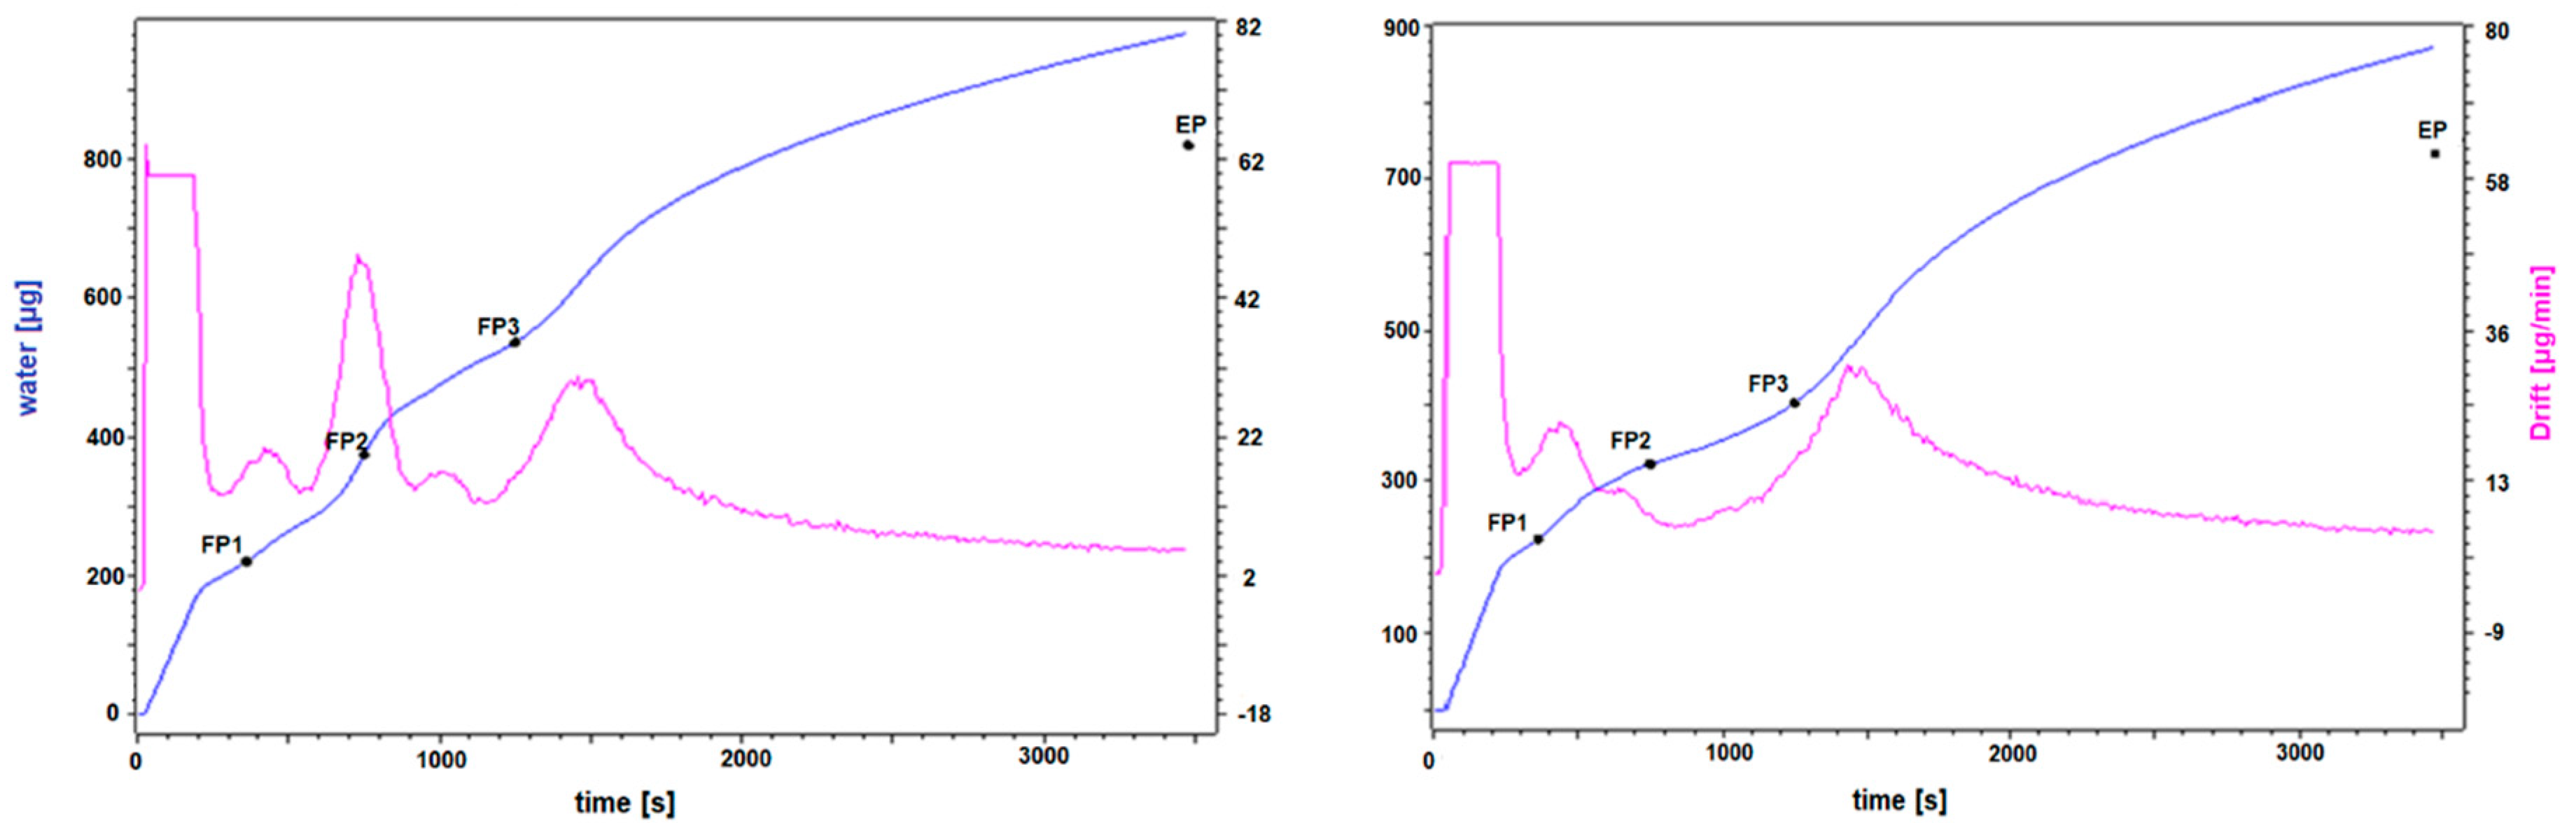
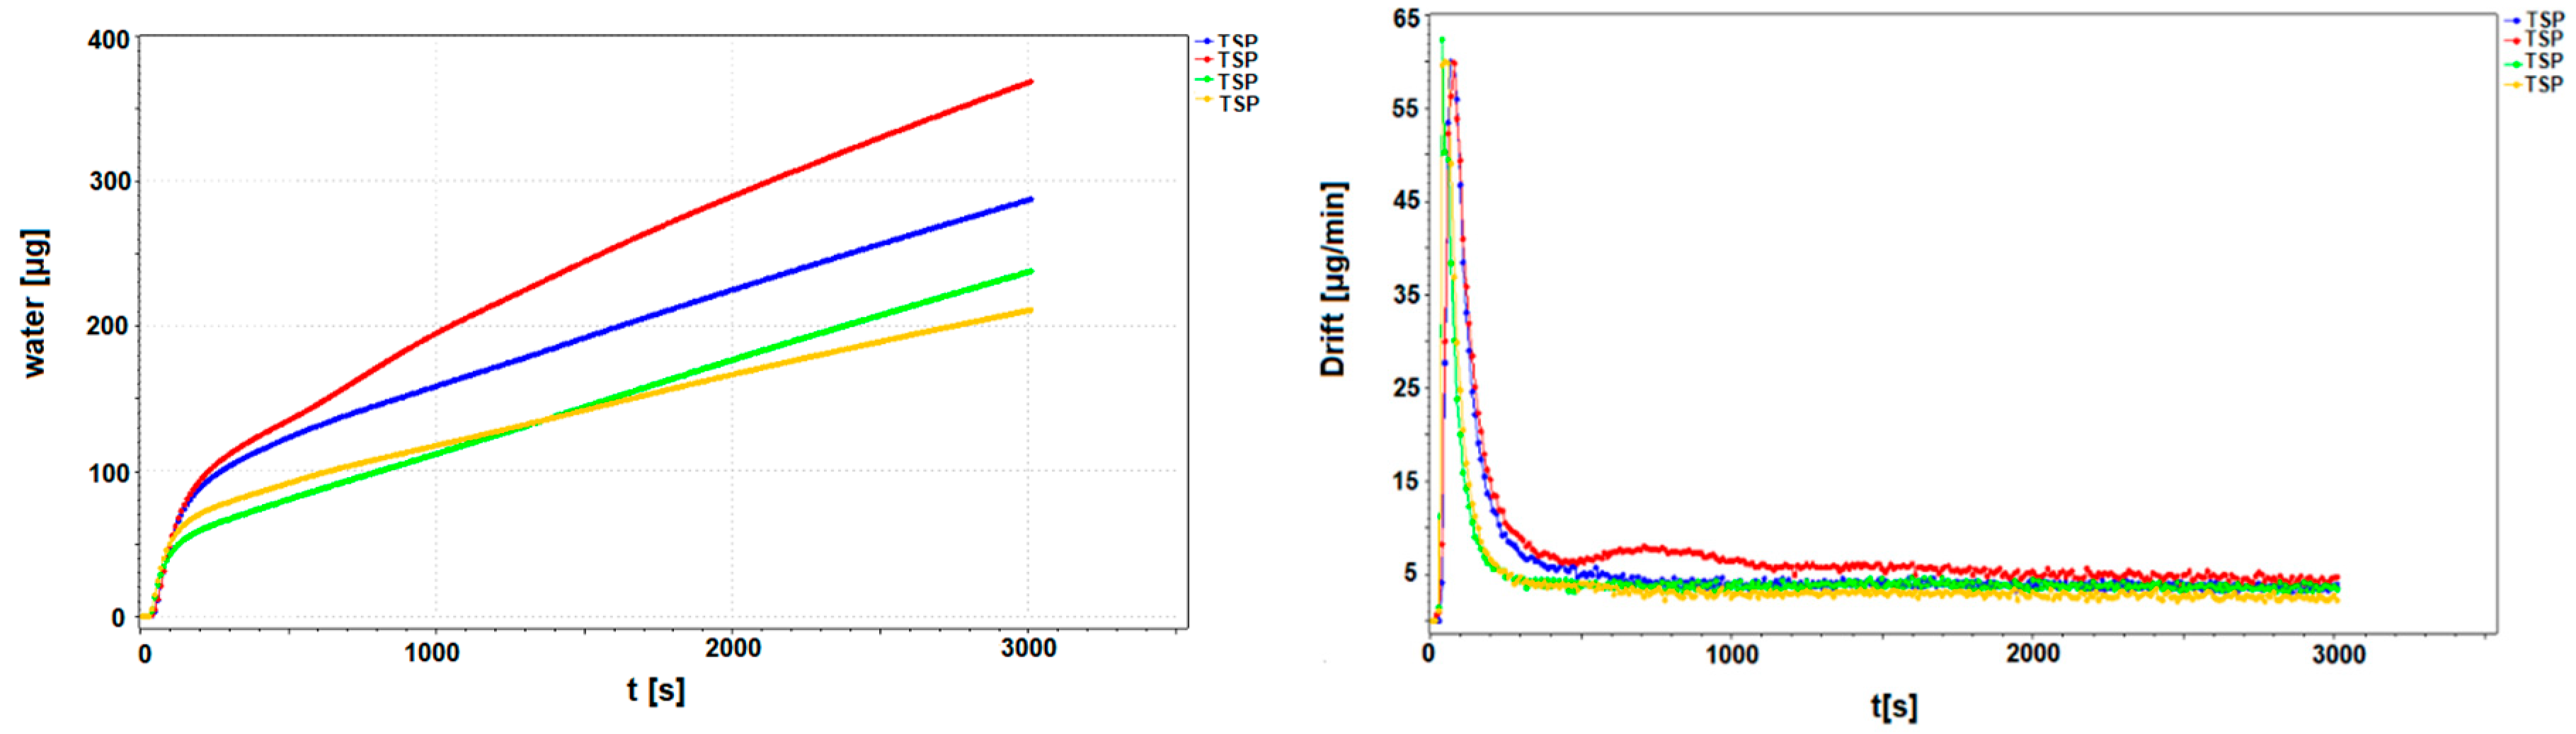
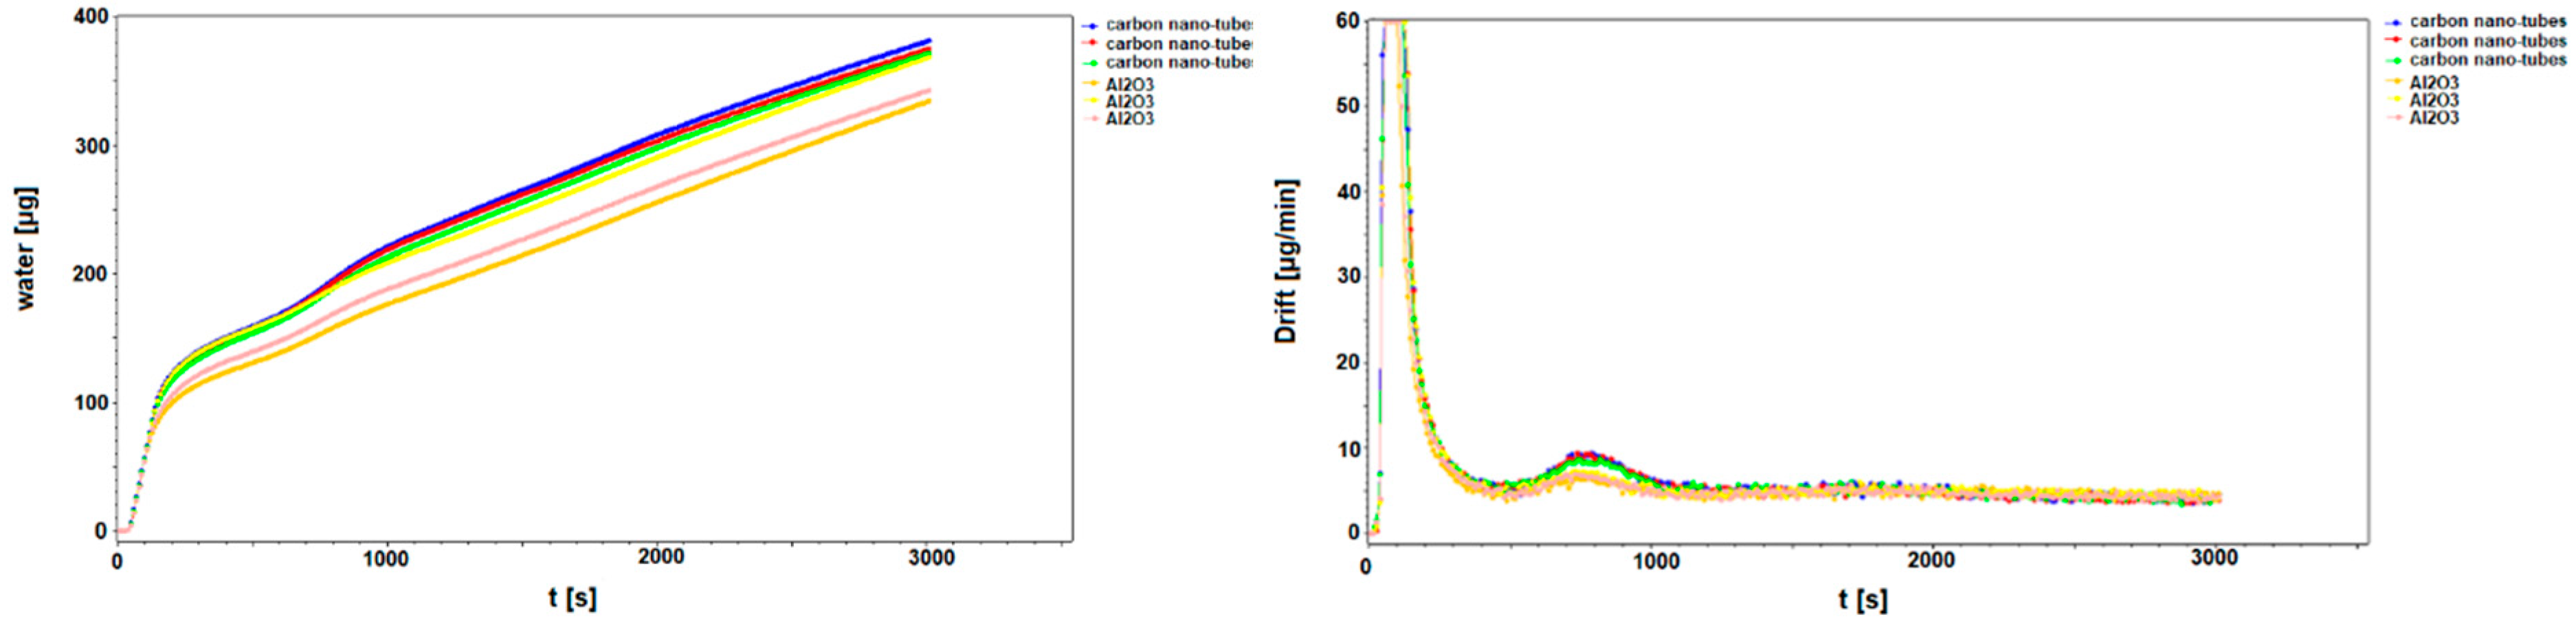
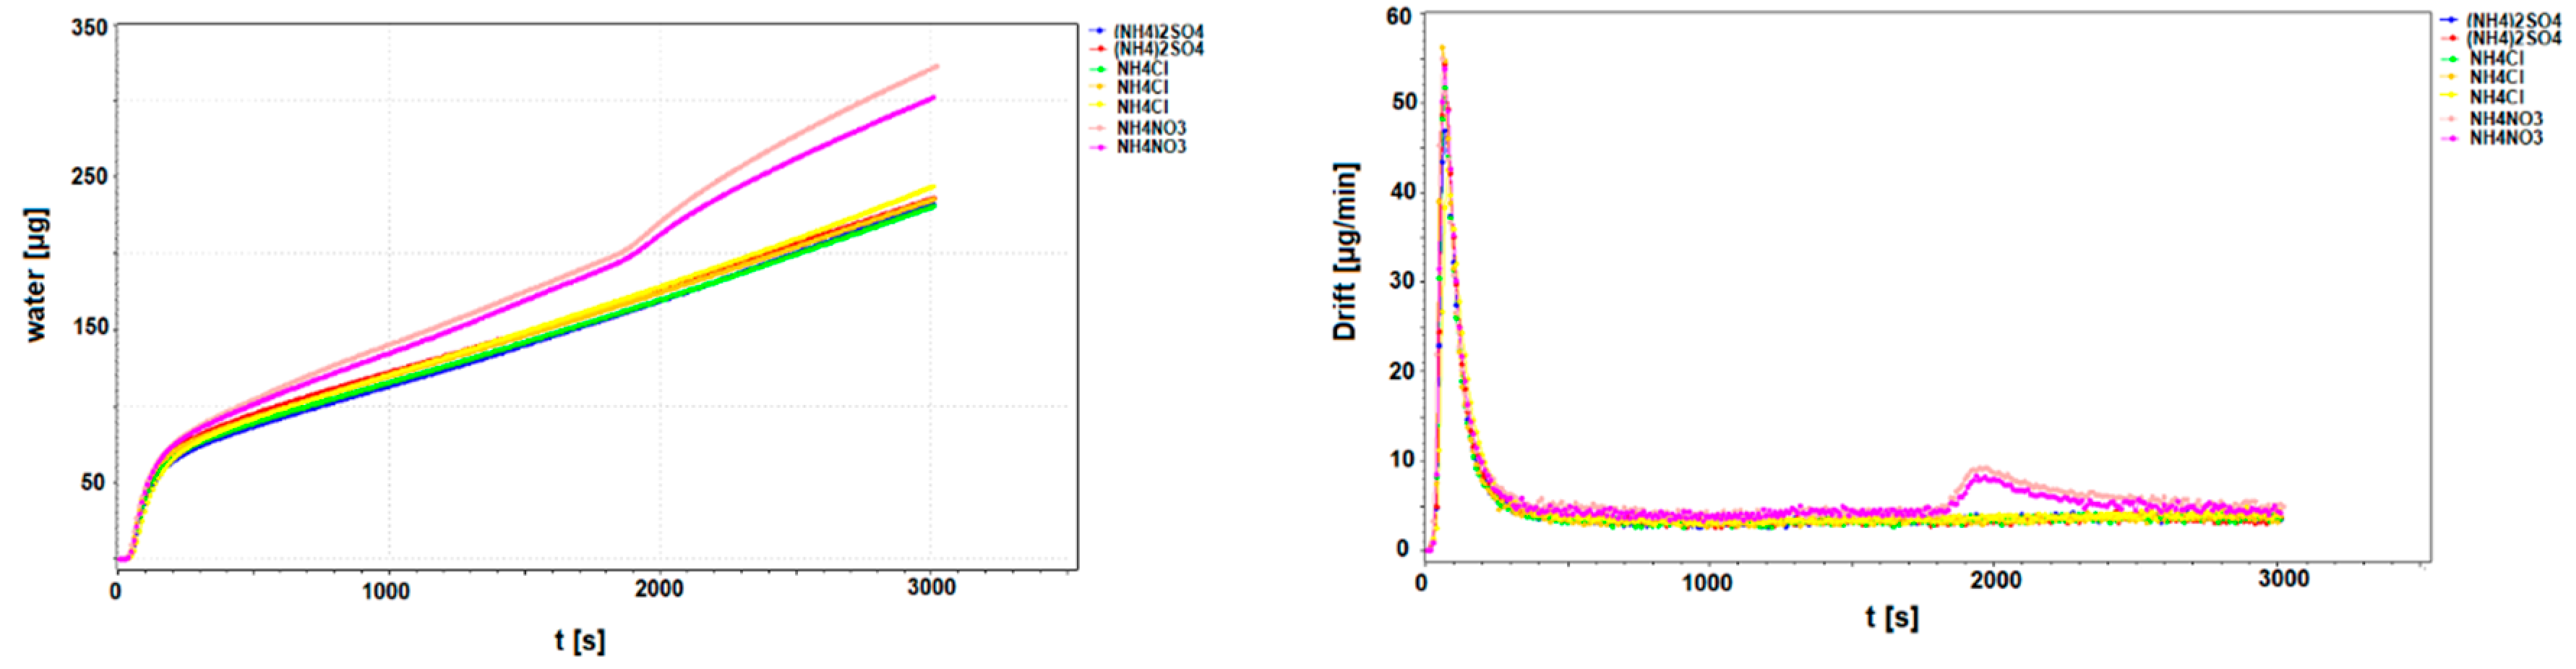
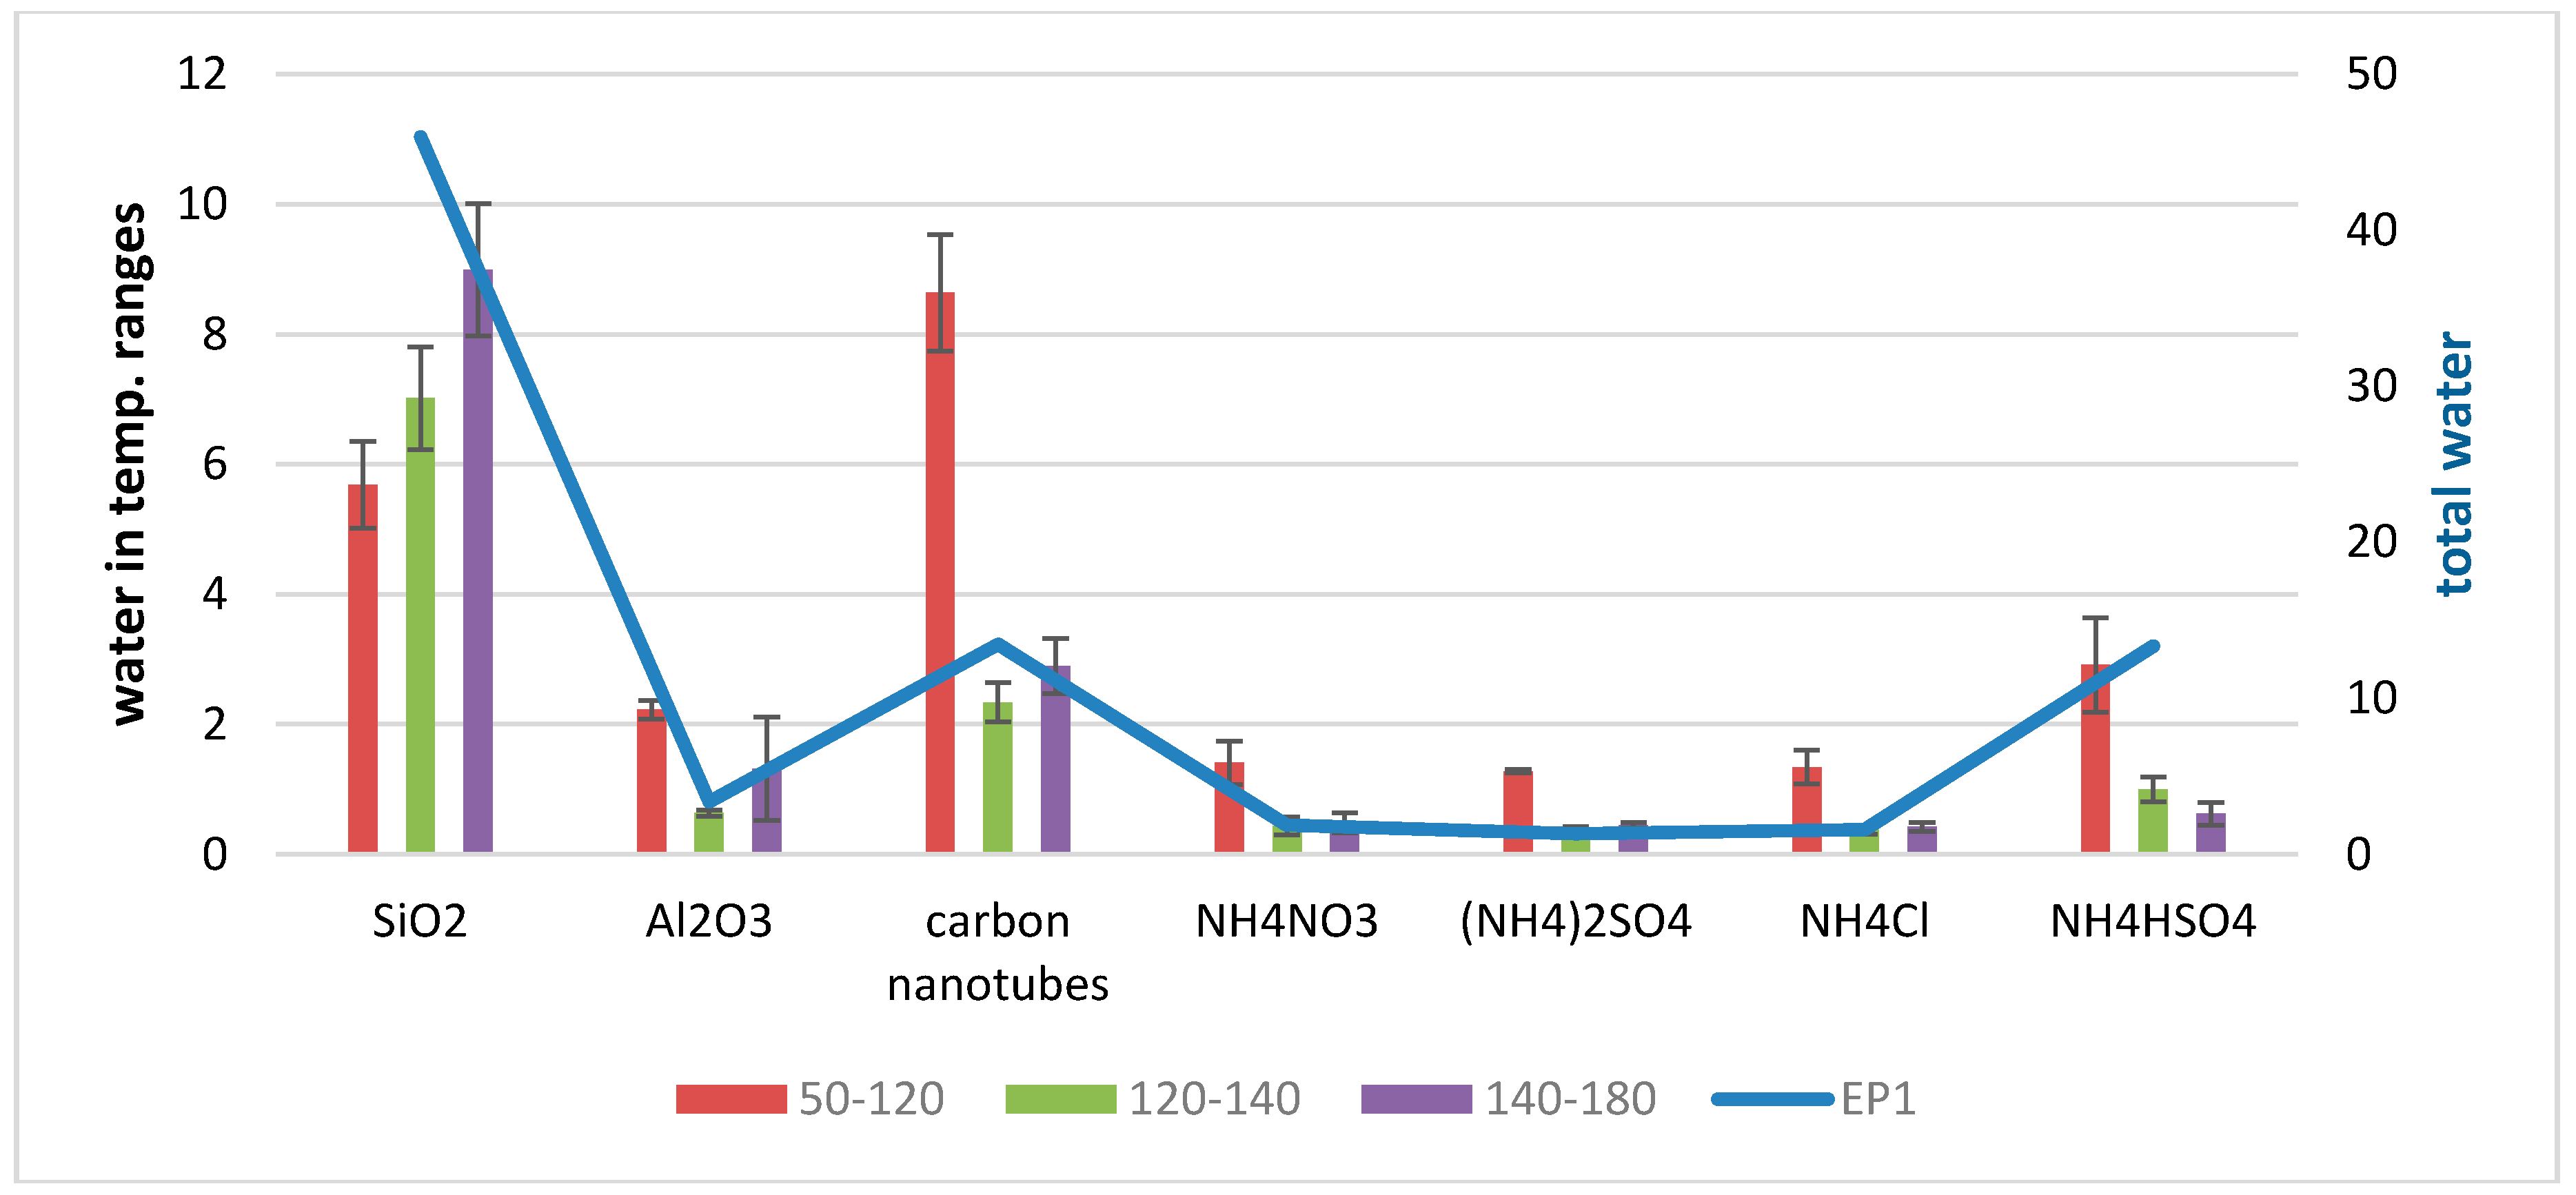
3.2. Qualitative Determination of Water Bound to TSP and to Selected Pure TSP Compounds

We compared the water release curves for real TSP samples (Figure 6) and their single compounds (Figure 7, Figure 8 and Figure 9). This was initiated by comparing water curves between TSP real samples, aluminum oxide and inorganic carbon (multiwall carbon nanotubes) (Figure 7), which are the compounds most often present in TSP samples collected near communication sites [32,34,35]. Especially during summer periods, elemental carbon and crustal matter near communication sites can be present at even equivalent quantities [32,36]. While the occurrence of inorganic carbon is usually connected with exhaust emissions, aluminum oxide together with other crustal elements—Si, K, Ca, Ti, Mn, Fe, Zn and Sr—originate mostly from dust resuspension and vehicle abrasion sources (i.e., tyre wear). Those compounds were tested for their water contents in many papers [37] and are characterized by thermal stability and high chemical purity. PM-bound oxides as well as inorganic carbon contain water in different kinds of bonding states: adherent moisture, enclosed water and crystal water. Since both tested compounds are hydrophilic [11,38], we suspected that water will be present mostly as weakly bound species. It must be remembered, however, that the PM-bound water is a function of both the relative amount of different chemical compounds and the their respective hygroscopicity under a given RH, which means that larger quantity of a specific chemical (e.g., Al- and Si-oxides) does not necessarily translate to larger contributions to PM-bound water. The results presented in Figure 7 (water release curves for Al2O3 and soot inorganic carbon nanotubes) indicate high contribution of adherent moisture in the temperature beneath 120 °C in the time range of 0–500 s; with the tendency to release water also in the range from 700–1100 s, probably due to significant portion of water inside the pores. In Figure 8 and Figure 9, examples of KF curves for silica (SiO2) and salts typically occurring in PM samples are presented: ammonium nitrate (NH4NO3), ammonium sulfate (NH4)2SO4 and ammonium chloride NH4Cl. The second peak in Figure 8 occurring in the range 1900–2300 s (temperature around 180 °C) was characteristic for the NO3 group, while the water release in the case of the NH4+ group occurred in the first temperature step (0–120 °C) and its kinetics for both NH4Cl and NH4NO3 were almost identical. When comparing those profiles with one obtained for real TSP samples (Figure 6), the absence of water associated with NO3 was observed. This is probably due to the fact that the mode of NH4NO3-bound water occurs at the temperature close to 240 °C [11] and therefore was not detected in our study. The water loosely bound to TSP was less than water strongly bound to PM particles. No unique peaks were detectable when separating water from real TSP samples. This supports our previous findings that TSP collected in Warsaw agglomeration consists in the most part of large particles resuspended from roads and communication tracks.
The total amounts of water determined in the case of pure TSP compounds [Figure 10] were: 45.7–46.21 µg/mg (SiO2), 1.08–2.42 µg/mg (NH4NO3), 1.27–1.36 µg/mg ((NH4)2SO4), 1.31–1.73 µg/mg (NH4Cl). The first water contribution in the range of 0–500 s is due to weakly adsorbed water and is contained in all measured samples in the average amounts oscillating around 5.68 µg/mg (SiO2), 1.41 µg/mg (NH4NO3), 1.38 µg/mg ((NH4)2SO4), and 1.34 µg/mg (NH4Cl). In the case of SiO2, the second water contribution occurs in the range 1100–1600 s and amounted to 1.33 µg/mg (Figure 9). The results obtained by Canepari et al. (2013) [11] while measuring pure PM compounds indicate somewhat different moisture contents. In their work, the measured water amounts were 0.9 ± 0.07% for chloride, 1.6 ± 0.1% for nitrate and 8.5 ± 0.4 for sulfate, while in this study, the amounts were 0.15 ± 0.02, 0.18 ± 0.06 and 1.4 ± 0.14, respectively. The most important differences regarding water release curves occur above 180 °C, since water bound to ammonium salts were found in great amount over 1500–3000 s (in Canepari et al. (2013) [11] in the temperature range 180–250°C).
Obtained results were in compliance with the water adsorption ability published previously by Canepari et al. [11] and Zotov et al. [39]. Thermal decomposition points for most inorganic salts used int his work oscillates above 200 °C; while the extraction temperature used in this study was 180 °C (a direct limitation of the usage of polypropylene coated Teflon filters for testing, which decompose above 200 °C). Therefore it is possible that water bound to PM inorganic salts was not fully evaporated and therefore not determined over titration process, artificially suggesting crustal matter as a main PM-bound water contributor.

3.3. Relationship between 24-h Measurements of TSP, TSP-Bound Water and Meteorological Factors

Due to a short period of the PM collection any far-reaching conclusions regarding PM pollution level and its correlation with meteorological parameters cannot be drawn. However, some well documented observations are observed even in this study and can be helpful during discussion. During the October campaign, we found that temperature affected the level of PM pollution. Both the TSP concentrations as well as TSP and PM1 masses were correlated with average daily temperature, with higher coefficient found in the case of smaller fraction—PM1 (r = 0.41)—and lower r in the case of TSP (r = 0.20). The year 2018 was a rather hot year with an average maximum temperature of 17.8 °C. This means that household heating practices do not have as strong an influence on PM pollution as they did a few decades ago (for example, during 1960–2015 the mean annual temperature in Poland was 10.6 °C) [24]. Rather high daily temperatures over the measurement campaign (11.9 °C) resulted in low TSP and PM1 concentrations—23 and 16.7 µg/m3, respectively (Table A1). Apart from temperature, precipitation also affects the concentration of air pollutants, especially of particulate matter [22]. TSP, as well as PM1 and TSP-bound water, was negatively correlated with precipitation, which strictly means that PM pollution decreases under increasing precipitation amount. Correlation coefficients between TSP and precipitation values (r = −0.40) correspond well with correlations between TSP-bound water and precipitation (r = −0.40). Both the TSP mass and TSP-bound water mass were negatively correlated with air relative humidity RH%, which is probably due to the effect of pollutants scavenged by fog or cloud droplets and their gravimetric deposition onto the ground surface, leading to lower ambient concentrations [24]. This effect was not, however, observed in the case of TSP concentration. In almost all cases the correlations between TSP-bound water (both its total contents and thermal-dependent contributions) and meteorological parameters were similar, since subsequent thermal ramps are only the portions of the same water released under some different temperature ranges. The complex character of PM-bound water concentrations and meteorological factors needs a much longer monitoring campaign and more in-depth research.
Accurate and comparable measurements of aerosol water contents, including the influence of meteorological parameters are challenging. Numerous aerosol inorganic equilibrium models have been developed to properly estimate aerosol water content like: ISORROPIA II, SCAPE II, EQSAM or AIM. We recently compared the results from water modelling and chemical mass balance methods with direct water measurements [40]. We, for example, found that in the EMEP model, the fraction unaccounted by chemical analysis (possibly attributable to PM-bound water) can comprise as much as 30–40% of gravimetric PM10 or PM2.5 mass; while in the SCAPE thermodynamic gas/aerosol equilibrium model [41], the 50th percentile values of calculated water content were in range 1.92–25% (winter) and 0.03–10.2% (summer), which is similar to our results (water constituted about 7.12–33.53% of the TSP mass). In the article published by Metzger et al. [42], results from SCAPE II were compared to ISORROPIA II results for a wide variety of aerosol conditions that cover typical urban, remote continental, marine and nonurban continental environments. For aerosol water content and total PM mass, the two models agreed within approximately 13%. ISORROPIA II predictions also agree well with measured water mass fraction and reasonably approximates the aerosol water content [43]. Future research should be directed towards the calibration of equilibrium models using data from aerosol networks like EMEP but also on comparing modelling results with the direct chemical methods for aerosol water determination.

4. Conclusions

The study showed that the TSP-bound water contents collected in the Warsaw urban background location were probably impacted by the emissions from transport together with soot release from both residential heating and vehicle engine combustion. This was marked by a relevant fraction of soot and crustal matter represented by Al2O3 in the chemical structure of released water. The proposed qualitative determination of TSP-bound water shows a good analytical performance and can be applied for routine field studies. The obtained results confirm our previous observations, suggesting that water bound to PM particles reaches even 30% of the TSP mass. It was found that TSP mass accounts for 10.6 µg/m3, even. Such a portion of water constitutes an important fraction of the measured PM pollution and can artificially overestimate PM mass. By using the thermal ramp process, we were able to distinguish TSP-water into one loosely bound to particles and absorption water, whose percentages, regarding the total determined water, were 48% and 24%, respectively. The usage of the thermal ramp process should be further developed for higher resolution studies able to separate water contributions released even under similar temperature conditions, but they should also include higher temperature ranges under which pyrolysis of carbon matter will be possible. This suggests providing similar analysis with the KF apparatus coupled to an oven characterized by an operative temperature above 250 °C. The results presented in this study are not sufficient for inference about TSP origin, since they are based on exclusive information regarding PM-bound water contents and water types found in PM. More in-depth research, including, for example, chemical mass balance integrated with water determination, will be more helpful in concluding about probable sources of PM-bound water.

Author Contributions

Conceptualization, K.W.-R.; methodology, K.W.-R.; software, K.W.-R.; validation, K.W.-R. and K.L.; formal analysis, K.W.-R., M.T., P.R.-K., G.M.; investigation, K.W.-R. and G.M.; resources, K.W.-R., M.T. and P.R.-K.; data curation, K.W.-R., P.R.-K. and G.M.; writing—original draft preparation, K.W.-R.; writing—review and editing, K.W.-R. and W.R.-K.; visualization, K.W.-R. and M.T.; supervision, K.W.-R., W.R.-K. and K.L.; project administration, K.W.-R. and M.T.; funding acquisition, K.W.-R. All authors have read and agreed to the published version of the manuscript.

Funding

This research was funded by National Science Centre Poland, grant number 2016/23/D/ST10/02705” (“Atmospheric water as a marker of particulate matter origin”).

Acknowledgments

The authors gratefully acknowledge the Artur Wadas from Metrohm for his support and collaboration during implementation of ramp oven method used in this study.

Conflicts of Interest

The authors declare no conflict of interest.

Appendix A

Table A1. Descriptive statistics regarding TSP and PM1 concentrations, masses, amount of released water and meteorological conditions during measurement campaign at Warsaw urban background station.
VariablenMeanMinimumMaximumSD
Temperature [°C]1111.97.915.32.2
Humidity [%]1174.165.481.56.0
Pressure [hPa]111012.01000.41017.14.9
Tmin [°C]116.22.311.12.4
Tmax [°C]1118.913.221.83.2
Precipitation [mm]110.00.00.10.0
TSP [µg/m3]1123.011.838.68.1
PM1 [µg/m3]1116.76.825.66.4
EP1 total water [µg]11250.842.5543.1166.9
FP1 water at 50–120 °C [µg]11130.625.4265.3102.6
FP2 water at 120–140 °C [µg]11171.29.1345.3143.6
FP3 water at 140–180 °C [µg]11190.3bdl379.2153.5
TSP mass [µg]111094.3597.01620.0333.5
PM1 mass [µg]11615.3262.01020.0243.0
TSP/PM1 mass ratio111.60.54.41.0
Table A2. Water recovery testing from WSO standard reference material under its reduced mass (close to TSP mass typically collected on filters in summer season).
WSOSRM Mass µgWater Content µgRecovery %
WSO1252021.584
WSO2279225.390
WSO3320129.692

References

  1. Hueglin, C.; Gehrig, R.; Baltensperger, U.; Gysel, M.; Monn, C.; Vonmont, H. Chemical characterization of PM2.5, PM10 and coarse particles at urban, near-city and rural sites in Switzerland. Atmos. Environ. 2005, 39, 637–651. [Google Scholar] [CrossRef]
  2. Ho, K.F.; Lee, S.C.; Cao, J.J.; Chow, J.C.; Watson, J.G.; Chan, C.C. Seasonal variations and mass closure analysis of particulate matter in Hong Kong. Sci. Total Environ. 2006, 355, 276–287. [Google Scholar] [CrossRef] [PubMed]
  3. Perrino, C.; Canaperi, S.; Catrambone, M. Comparing the performance of teflon and quartz membrane filters collecting atmospheric PM: Influence of atmospheric water. Aerosol Air Qual. Res. 2013, 13, 137–147. [Google Scholar] [CrossRef] [Green Version]
  4. Perrino, C.; Catrambone, M.; Torre, S.D.; Rantica, E.; Sargolini, T.; Canaperi, S. Seasonal variations in the chemical composition of particulate matter: A case study in the Po Valley. Part I: Macro-components and mass closure. Environ. Sci. Pollut. Res. 2014, 21, 3999–4009. [Google Scholar] [CrossRef] [PubMed]
  5. Rogula-Kozlowska, W. Size-segregated urban particulate matter: Mass closure, chemical composition, and primary and secondary matter content. Air Qual. Atmos. Health 2016, 9, 533–550. [Google Scholar] [CrossRef] [PubMed] [Green Version]
  6. Taiwo, A.M. Source apportionment of urban background particulate matter in Birmingham, United Kingdom using a mass closure model. Aerosol Air Qual. Res. 2016, 16, 1244–1252. [Google Scholar] [CrossRef] [Green Version]
  7. Rogula-Kozłowska, W.; Majewski, G.; Widziewicz, K.; Rogula-Kopiec, P.; Tytła, M.; Mathews, B.; Ciuka-Witrylak, M. Seasonal variations of PM1-bound water concentration in urban areas in Poland. Atmos. Pollut. Res. 2019, 10, 267–273. [Google Scholar] [CrossRef]
  8. Canepari, S.; Simonetti, G.; Perrino, C. Mass size distribution of particle-bound water. Atmos. Environ. 2017, 165, 46–56. [Google Scholar] [CrossRef]
  9. Rogula-Kozłowska, W.; Widziewicz, K.; Majewski, G. A simple method for determination of total water in PM1 collected on quartz fiber filters. Microchem. J. 2017, 132, 327–332. [Google Scholar] [CrossRef]
  10. Su, J.; Zhao, P.; Dong, Q. Chemical compositions and liquid water content of size-resolved aerosol in Beijing. Aerosol Air Qual. Res. 2017, 18, 680–692. [Google Scholar] [CrossRef]
  11. Canepari, S.; Farao, C.; Marconi, E.; Giovannelli, C.; Perrino, C. Qualitative and quantitative determination of water in airborne particulate matter. Atmos. Chem. Phys. 2013, 13, 1193–1202. [Google Scholar] [CrossRef] [Green Version]
  12. Seinfeld, J.H.; Pandis, S.N. Atmospheric Chemistry and Physics from Air Pollution to Climate Change; Wiley: New York, NY, USA, 1998. [Google Scholar]
  13. Saxena, P.; Hildemann, L.M.; McMurry, P.H.; Seinfeld, J.H. Organics alter hygroscopic behavior of atmospheric particles. J. Geophys. Res. 1995, 100, 18755–18770. [Google Scholar] [CrossRef]
  14. Pye, H.O.T.; Murphy, B.N.; Xu, L.; Ng, N.L.; Carlton, A.G.; Guo, H.; Weber, R.; Vasilakos, P.; Appel, K.W.; Budisulistiorini, S.H.; et al. On the implications of aerosol liquid water and phase separation for organic aerosol mass. Atmos. Chem. Phys. 2017, 17, 343–369. [Google Scholar] [CrossRef] [PubMed] [Green Version]
  15. You, Y.; Renbaum-Wolff, L.; Bertram, A.K. Liquid-liquid phase separation in particles containing organics mixed with ammonium sulfate, ammonium bisulfate, ammonium nitrate or sodium chloride. Atmos. Chem. Phys. 2013, 13, 11723–11734. [Google Scholar] [CrossRef] [Green Version]
  16. Veschi, R.; Valli, G.; Fermo, P.; D'Alessandro, A.; Piazzalunga, A.; Bernardoni, V. Organic and inorganic sampling artefacts assessment. Atmos. Environ. 2009, 43, 1713–1720. [Google Scholar] [CrossRef]
  17. Tang, I.N. Deliquescence Properties and Particle-Size Change of Hygroscopic Aerosols; BNL-27094; Brookhaven National Lab: Upton, NY, USA, 1979. [Google Scholar]
  18. Tsyro, S.G. To what extent can aerosol water explain the discrepancy between model calculated and gravimetric PM10 and PM2.5? Atmos. Chem. Phys. 2005, 5, 515–532. [Google Scholar] [CrossRef] [Green Version]
  19. Ohta, S.; Horial, M.; Yamagata, S.; Murao, N. Chemical characterization of atmospheric fine particles in Sapporo with determination of water content. Atmos. Environ. 1998, 32, 1021–1025. [Google Scholar] [CrossRef]
  20. Putaud, J.P.; Putaud, J.-P.; Van Dingenen, R.; Alastuey, A.; Bauer, H.; Birmili, W.; Cyrys, J.; Flentje, H.; Fuzzi, S.; Gehrig, R.; et al. A European aerosol phenomenology—3: Physical and chemical characteristics of particulate matter from 60 rural, urban, and kerbside sites across Europe. Atmos. Environ. 2010, 44, 1308–1320. [Google Scholar] [CrossRef]
  21. Chow, J.C. methods to determine compliance with ambient air quality standards for suspended particles. J. Air Waste Manag. Assoc. 1995, 45, 320–382. [Google Scholar] [CrossRef] [Green Version]
  22. Widziewicz, K.; Rogula-Kozłowska, W.; Rogula-Kopiec, P.; Majewski, G.; Loska, K. PM1 and PM1 -bound metals during dry and wet periods: Ambient concentration and health effects. Environ. Eng. Sci. 2016, 34, 312–320. [Google Scholar] [CrossRef]
  23. Majewski, G.; Rogula-Kozłowska, W.; Czechowski, P.O.; Badyda, A.J.; Brandyk, A. The impact of selected parameters on visibility: First results from a long-term campaign in Warsaw, Poland. Atmosphere 2015, 6, 1154–1174. [Google Scholar] [CrossRef] [Green Version]
  24. Majewski, G.; Rogula-Kozłowska, W.; Rozbicka, K.; Rogula-Kopiec, P.; Mathews, B.; Brandyk, A. concentration, chemical composition and origin of PM1: Results from the first long-term measurement campaign in Warsaw (Poland). Aerosol Air Qual. Res. 2018, 18, 636–654. [Google Scholar] [CrossRef]
  25. Rogula-Kozłowska, W.; Majewski, G.; Rogula-Kopiec, P.; Mathews, B. Mass concentration and chemical composition of submicron particulate matter (PM1) in the Polish urban areas. IOP Conf. Ser. Earth Environ. Sci. 2019, 214, 12092. [Google Scholar] [CrossRef]
  26. European Committee for Standardization (CEN). EN 12341:2014 Ambient Air. Standard Gravimetric Measurement Method for the Determination of the PM10 or PM2.5 Mass Concentration of Suspended Particulate Matter; European Committee for Standardization: Brussels, Belgium, 2014. [Google Scholar]
  27. Zapp, J.A.; Limperos, G.; Brinker, K.C. Toxicity of pyrolysis products of “Teflon” tetrafluoroethylene resin. In Proceedings of the American Industrial Hygiene Association Annual Meeting, New York, NY, USA, 3–9 September 1955. [Google Scholar]
  28. Conesa, J.A.; Font, R. Polytetrafluoroethylene decomposition in air and nitrogen. Polym. Eng. Sci. 2001, 41, 2137–2147. [Google Scholar] [CrossRef]
  29. Perrino, C.; Marconi, E.; Tofful, L.; Farao, C.; Materazzi, S.; Canaperi, S. Thermal stability of inorganic and organic compounds in atmospheric particulate matter. Atmos. Environ. 2012, 54, 36–43. [Google Scholar] [CrossRef]
  30. HYDRANAL®-Technical Center. Eugen Scholz Reagents for Karl Fischer Titration. In Hydranal Manual; Honeywell: Charlotte, NC, USA, 2017. [Google Scholar]
  31. Widziewicz-Rzońca, K.; Tytła, M. Studies on water sorption by different types of filter media used for PM collection under varying temperature and humidity conditions. Int. J. Environ. Res. Public Health 2020, 17, 5180. [Google Scholar]
  32. Rogula-Kozlowska, W.; Klejnowsi, K.; Rogila-Kopiec, P.; Ośródka, L.; Krajny, E.; Błaszczak, B.; Mathews, B. Spatial and seasonal variability of the mass concentration and chemical composition of PM2.5 in Poland. Air Qual. Atmos. Health 2014, 7, 41–58. [Google Scholar] [CrossRef] [Green Version]
  33. Rogula-Kozlowska, W.; Klejnowski, K.; Rogula-Kopiec, P.; Mathews, B.; Szopa, S. A study on the seasonal mass closure of ambient fine and coarse dusts in Zabrze, Poland. Bull. Environ. Contamin. Toxicol. 2012, 88, 722–729. [Google Scholar] [CrossRef]
  34. Rogula-Kozłowska, W.; Rogula-Kopiec, P.; Klejnowski, K.; Błaszczak, B. Wpływ emisji komunikacyjnej na stężenie dwóch form węgla i rozkład ich masy względem wielkości cząstek w aerozolu atmosferycznym obszaru miejskiego. Rocz. Ochr. Śr. 2013, 15, 1623–1644. [Google Scholar]
  35. Rogula-Kozłowska, W. Chemical composition and mass closure of ambient particulate matter at a crossroads and a highway in Katowice, Poland. Environ. Prot. Eng. 2015, 41, 15–29. [Google Scholar] [CrossRef]
  36. Sówka, I.; Chlebowska-Styś, A.; Pachurka, Ł.; Rogula-Kozłowska, W.; Mathews, B. Analysis of particulate matter concentration variability and origin in selected urban areas in Poland. Sustainability 2019, 11, 5725. [Google Scholar] [CrossRef] [Green Version]
  37. Coker, E.N. The Oxidation of Aluminum at High Temperature Studied by Thermogravimetric Analysis and Differential Scanning Calorimetry; SAND2013-8424; Sandia National Laboratories: Albuquerque, NM, USA, 2013. [Google Scholar] [CrossRef] [Green Version]
  38. Popovicheva, O.; Persiantseva, N.M.; Shonija, N.K.; DeMott, P.; Koehler, K.; Petters, M.; Kreidenweis, S.; Tishkova, V.; Demirdjian, B.; Suzanne, J. Water interaction with hydrophobic and hydrophilic soot particles. Phys. Chem. Chem. Phys. 2008, 10, 2332–2344. [Google Scholar] [CrossRef] [PubMed]
  39. Zotov, R.; Meshcheryakov, E.; Livanova, A.; Minakova, T.; Megaev, O.; Isupova, L.; Kurzina, I. Influence of the composition, structure, and physical and chemical properties of aluminium-oxide-based sorbents on water adsorption ability. Materials 2018, 11, 132. [Google Scholar] [CrossRef] [PubMed] [Green Version]
  40. Widziewicz-Rzońca, K.; Tytła, M. First systematic review on PM-bound water: Exploring the existing knowledge domain using the CiteSpace software. Scientometrics 2020. [Google Scholar] [CrossRef]
  41. Meng, Z.; Seinfeld, J.H.; Saxena, P.; Kim, Y.P. Contribution of Water to Particulate Mass in the South Coast Air Basin. Aerosol Sci. Technol. 1995, 22, 111–123. [Google Scholar] [CrossRef] [Green Version]
  42. Metzger, S.; Abdelkader, M.; Steil, B.; Klingmüller, K. Aerosol water parameterization: Long-term evaluation and importance for climate studies, Atmos. Chem. Phys. 2018, 18, 16747–16774. [Google Scholar] [CrossRef] [Green Version]
  43. Choi, M.Y.; Chan, C.K. The Effects of Organic Species on the Hygroscopic Behaviors of Inorganic Aerosols. Environ. Sci. Technol. 2002, 36, 2422–2428. [Google Scholar] [CrossRef]
Figure 1. The map of Poland with marked Warsaw city (left) and Warsaw University of Life Sciences (right), with exact location of the sampling site 52°9’39.14’’ N; 21°2’47.72’’ E (red arrow).
Sustainability 12 06196 g001
Figure 2. (Left): Original signal from two examples of the real total suspended particles (TSP) sample: orange and green line (before blank subtraction) and two blank samples—the red line represents the relative Teflon filter blank inside the empty dried vial, while the blue one is for the operative blank (empty vial dried in oven and kept in dessicator). (Right): Karl Fischer analysis of 10 blank samples (five intra-day blanks and five inter-day blanks).
Sustainability 12 06196 g002
Figure 3. Water release curves for certified reference materials (urban dust): NIST 1648a (6.122 mg) (left) and 1649b (5.822 mg) (right).
Sustainability 12 06196 g003
Figure 4. (Left) diurnal mass of TSP and particulate matter (PM)1 collected on filter media. (Right) concentrations of TSP and TSP-bound water µg/m3 at Warsaw urban background station.
Sustainability 12 06196 g004
Figure 5. The average for the sampling period amount of TSP-bound water release from polypropylene-baked Teflon filters in different temperature ranges: total released water (50–180 °C); water loosely bound to TSP (50–120 °C); water strongly bound to TSP (120–140 °C and 140–180 °C).
Sustainability 12 06196 g005
Figure 6. Water release curves (water µg) for real TSP samples and their drift profiles (µg·s−1) over water extraction time (s).
Sustainability 12 06196 g006
Figure 7. Water release curves for Al2O3 (59–69 mg) and carbon nano-tubes (12–17 mg) samples.
Sustainability 12 06196 g007
Figure 8. Water release curves for SiO2 (50–63 mg).
Sustainability 12 06196 g008
Figure 9. Water release curves for NH4NO3 (55–83 mg); (NH4)2SO4 (57–63 mg) and NH4Cl (52–70 mg) samples.
Sustainability 12 06196 g009
Figure 10. Water contents in the single TSP compounds (SiO2, Al2O3, NH4NO3, (NH4)2SO4 and NH4Cl, carbon nano-tubes) measured as µg/mg of measured substance (n = 3).
Sustainability 12 06196 g010
Table 1. Recovery of water from Hydranal Water Standard KF-Oven (HYD) and Water Standard Oven (WSO) standard reference materials (n = 3).
WSOSRM Mass µgWater Content µgRecovery %
WSO192110879.695
WSO28484480494
WSO397286922.594
HYD120526011419101
HYD220895411603100
HYD31700049419.799
Table 2. Spearman rank correlation coefficients between 24-h concentrations of TSP, PM1, TSP-bound water and meteorological factors in Warsaw (p < 0.05).
VariableTemerature [°C]Humidity [%]Pressure [hPa]Tmin * [°C]Tmax ** [°C]Precipitation [mm]
TSP [µg/m3]0.05−0.06−0.240.00−0.04−0.10
EP1 total water [µg]−0.08−0.05−0.23−0.230.05−0.40
FP1 water at 50–120 °C [µg]−0.070.02−0.05−0.230.15−0.40
FP2 water at 120–140 °C [µg]−0.070.02−0.05−0.230.15−0.40
FP3 water at 140–180 °C [µg]−0.01−0.05−0.06−0.150.18−0.40
TSP [µg]0.20−0.07−0.29−0.170.07−0.40
PM1 [µg]0.410.050.700.450.54−0.40
TSP/PM1 [µg]−0.330.01−0.54−0.29−0.530.40
* minimum Temperature, ** maximum Temperature.

