Article

A Framework for Risk Assessment in Collaborative Networks to Promote Sustainable Systems in Innovation Ecosystems

1
Instituto Superior de Engenharia de Lisboa (ISEL), Instituto Politécnico de Lisboa, 1959-007 Lisboa, Portugal
2
GOVCOPP-Universidade de Aveiro, 3810-193 Aveiro, Portugal
3
CTS Uninova, Faculdade de Ciências e Tecnologia, Universidade Nova de Lisboa, 2829-516 Lisboa, Portugal
4
UNIDEMI, Department of Mechanical and Industrial Engineering, NOVA School of Science and Technology, Universidade NOVA de Lisboa, 2829-516 Caparica, Portugal
5
IDMEC-IST, Universidade de Lisboa, 1049-001 Lisboa, Portugal
6
ADVANCE-Instituto Superior de Economia e Gestão (ISEG), Universidade de Lisboa, 1200-109 Lisboa, Portugal
*
Author to whom correspondence should be addressed.
Sustainability 2020, 12(15), 6218; https://0-doi-org.brum.beds.ac.uk/10.3390/su12156218
Submission received: 16 July 2020 / Revised: 30 July 2020 / Accepted: 31 July 2020 / Published: 2 August 2020
(This article belongs to the Special Issue Innovation Ecosystems: A Sustainability Perspective)

Abstract

:
Nowadays—and due to an increasingly competitive world—organizations need to collaborate in an open innovation context to be efficient and effective by achieving high levels of innovation with their products and services. However, the existing resources—as well as the innovation achieved from the diversity of partners involved—brings challenges to the management; in particularly with risk management. To fulfill such needs, risk management frameworks have been created to support managers, on preventing threats with systems development, although without properly account the influence of each system component, on the entire system, as well as the subjectivity within human perception. To account for these issues, a framework supported by fuzzy logic is presented in this work, to evaluate the risk level on system development in open innovation environment. The approach robustness is assessed by using a case study, where the challenges and benefits found are discussed.

Graphical Abstract

1. Introduction

Nowadays, small and medium-sized enterprises (SMEs) plays a crucial role on most economies in the world, by creating jobs that reduces the unemployment, besides the contribution for the gross domestic product (GDP) of each country. In most countries, its presence, is expressed by more than 87 percent of all existed enterprises [1].
Furthermore, the unpredictability around the economic context and the highly competitiveness of the actual marketplace, have forced organizations into a position where its crucial to find forms of survivance in such context. From the literature, there is a consensus that innovation should being part on new product/system development to organizations, reach competitive advantage in highly competitive markets or even in new markets to be explored [2,3,4].
In this context, the innovation ecosystems, and in particular, virtual enterprises (VEs) allows to share the necessary competencies and resources, to develop products/systems to better respond to the market opportunities, by operating in a collaborative network context [5].
Furthermore—and based on the existed studies from the literature—one-way to promote sustainability on innovation ecosystems (IE), is by identifying and assessing the risks involved in such environments, namely on the VE, created, with the purpose of having a collaborative environment, where knowledge, competences and risk are shared between the partners involved.
However, the development and the innovation on new systems, it is not easy to be managed especially for VEs [6,7], since that the system or the product to be developed, is normally associated with several risks, regarding the different system components involved. Which are developed by the different partners of the collaborative network.
Furthermore, there is a certain subjectivity degree on risk assessment, related with human perception, which increases with the number of risk managers, as well as with the number of partners involved [8]. This becomes even more difficult, by knowing that the responsibility on each system component, is shared by more than one partner/actor of the same network [9].
Thus, the selection of the right partner, in order to minimize the risk on each system component and then, to minimize the global risk of the system development, assumes one of the main reasons to develop models that allows the risk management in such context.
Additionally, companies are relatively vulnerable to external events, such as political, economic, technical and financial, among others.
In this sense, risk management, could help VEs to mitigate unwanted risks that could avoid the success with its system development. Without managing the risks properly, VEs could face severe consequences, such as losing clients, negative environmental impact—and even financial bankruptcy [4].
To do this, risk management (RM), act as a process to identify, assess, monitor and report the risks involved, in terms of their impacts and probabilities of occurrence [5]. The identification and evaluation allow of such risks, allows the elaboration of a set of actions to minimize any negative effects that may occur [6].
There are several methods that can be found on literature (e.g., decision trees, Delphi analysis, failure modes and effects analysis (FMEA), risk matrix, among others), which can be used to identify and analyze the risks involved. However, there is a lack of approaches to manage risk on VEs that simultaneously analyses the influence between each system component and the final system or product to be developed, as well as to include human perception on classifying each risk according to its impact and probability of occurrence [7].
Furthermore, the subjectivity around risk assessment, referred before, it is not included in most existent models found on literature, which brings the necessity to be included into an integrated approach, in order to deal with the human perception on risk assessment.
Therefore, we have considered a set of risks adopted here, on behalf of VE, by considering the design of each system component as an innovative project itself, with a set of risks involved.
The innovation, reached on system component, contributes to the innovation of the final product or system, developed on behalf of the VE created for that purpose.
The VE as well as the system/product to be developed, can have multiple risks categories related to each system domain (SD), whose relationship with each risk from each system component, should be accounted.
Thus, in this study, it will be presented an approach to incorporate the issues referred above, namely, the inclusion of a possible influence from each system component risk on the system/product domains, as well as the subjectivity around human perception on risk assessment, by using fuzzy systems.
The model developed here, will also be tested, by using a case study based on a developed system to produce “green” energy, in order to identify the challenges to be accounted on future research, as well as the benefits achieved, such as the prioritization of each risk, regarding each system component, in order to define the actions to mitigate such risks in an open innovation context.
Therefore, Section 2 describes a literature review, followed by Section 3, in which the research method is described, while Section 4 describes the case study used to validate the proposed approach through the achieved results. Section 5 ends this study, with some concluding remarks and future work.

2. Literature Review

2.1. Open Innovation Ecosystems

The open innovation (OI) and its impacts on economic, social and even political markets, are widely valued among several stakeholders (which naturally includes the policymakers), since it is an important key factor to achieve competitiveness. Several authors have recently increased the literature production, regarding the importance of innovation into our societies [7]. The innovation concept has become an important issue to be considered in the political and public discourse, with bringing therefore, an important impact on several scientific fields. Several definitions of this concept can be found on literature. An important definition, refers innovation, has a phenomenon that occurs when an invention is introduced in the market [8,9], although a formally definition, can be found by Chesbrough [10], broking therefore, with the classical linear approach, related with the closed innovation paradigm and by introducing new challenges within the innovation process.
The same author [10] claims that the closed innovation model type is no longer sustainable, from the economic point of view and organizations should engage into an open innovation approaches to be more competitive, by being a new way to create value to a company or other organization [10]. In essence, these OI models, can be defined by having two different types of knowledge flow and resources [10]. The first one, regards to the outside-in knowledge flow, i.e., it occurs when a company brings knowledge from the exterior, as well as resources from its partners, customers, scientific centers, universities, among other stakeholders involved, in order to improve its performance in terms of innovation, which allows to reduce costs and even time through the acquisition or borrow of the resources that they need to achieve its goals.
The second one, regards, the inside-out knowledge flow, where the companies search for solutions to share knowledge, already available from each partner, and/or other resources within the exterior environment in order to add value to the organization. An example of this, is the transfers of rights and the out-licensing.
With regards to OI, there are on literature, some approaches that can be found, namely the works of [11,12], with two of them, being very used among the managers of OI projects.
An OI model, is the InnoCentive [12], which was created in 2001. This model, runs in a software platform, available on web and it is based on six steps, which starts to identify the ideas and problems, followed by the challenge formulation, the intellectual property agreement specification, the challenge publication, the solution assessment and finishing with a price regarding the intellectual property transfer. The other model, widely used by organizations, is the one designed by Procter & Gamble (P&G), named “Connect + Develop”, which allows to work in an inwards and outwards approach, by including issues such as the marketing for engineering, as well as the commercial services for product design.
Although an open innovation approach could release positive achievements, it also brings risk to the organizations, which leads them, to design a proper strategy to protect innovation, in order to produce boundaries and to turn the same outcomes measurable [13,14]. Furthermore and in an OI context, organizations should also consider the risks involved, to be aware of the greater ones involved, to maintain their competitive performance.
Based on the OI concept, an OI ecosystem, can be referred as an innovation ecosystem (IE) with a number of supported activities, being classified as an open innovation actions [15].
Regarding the IE, some works has explored the types of stakeholders involved in OI ecosystems, as well as the relation between the focal firms and the partners involved, with their influences on innovation, by recurring to different IE perspectives.
An example of such perspective is the one from [15], which has stated that a IE, is an aligned framework, formed by a set of multilateral partners, with the aim of interacting with each other, to achieve a certain (and focal) value. Another perspective can be given by [16], where they consider IE, as a business ecosystem with a high level of interaction among the different key partners, namely customers, universities, suppliers and competitors and suppliers.
Additionally—and based on works from [17]—it seems to exist the evidence that the product/system innovation of nowadays, has increasingly depended on the interaction between the organizations that participates in the IE.
Other studies seem to reinforce this interdependence in terms of collaboration, between the innovation actors involved (e.g., [18,19]), although there is a lack of research that explores the interdependences between the actors with regards to a particular innovation ecosystem ([17]).
Usually, most of the literature, only focus on situations with a single mode of interaction, such as the cooperation between the university and industry (e.g., [16,17,18,19]), while other works claims for more integration of IE modes to accelerate firm innovation, which brings the need to explore more the OI ecosystem modes in order to provide a more comprehensive analytical framework for understanding OI ecosystems. Authors such as [18] have done this work, by determining that an IE is formed by a multilateral set of partners, which needs to interact to get a focal value.
Other authors, such as [19], referred the fact that IEs are more than just a typical OI with an outside-in flow—or even an inside-out flow—between the partners of the network, being more an interrelated actors to achieve and sustain an IE, to create multidisciplinary knowledge and achieve high levels of innovation with a product/system.

2.2. Risk Assessment

Apart from the development of innovation management approaches, organizations also tries to predict the changes (and also responding to them) that may occur with the development of a systems/product before and after its launch in the market, in order to be more competitive, effective and efficient. Such attempts have been performed, despite the lack of practical approaches, to support their risk management attempts [20].
The uncertainty, related with the innovative processes, is bonded not only to the inherent failure risk, but also to inherent success possibility, which brings the need to adequately manage the risk management within an innovative process/activity [20].
Therefore, and since that the aim of a risk management model is to facilitate process innovation, instead of stifle the same innovation—organizations require a strategy that allows to perform early risk diagnosis and also the management [20] of the risks involved.
From the literature, we can identify several risk assessment approaches, widely used by organizations, such as the balanced scorecard (BSC) [21], the failure mode effects analysis (FMEA), analytic hierarchy process (AHP) [22], Fault Tree analysis (FTA) [23] and the risk diagnosing methodology (RDM) [24].
The analytic hierarchy process (AHP) could be considered as a multivariate analysis method with the purpose to reduce the randomness, related to the subjective evaluations, by taking into consideration several and different objectives, based on different criteria [23]. This method is mostly used on selection of scenarios [24]. Another risk evaluation approach referred here, is RDM approach, which has the main purpose of providing strategies to support (and even improve) the possibility of a given project to be succeeded, through the identification and management of their (potential) risks [23,24]. The RDM approach, is also implemented to assist the systematic diagnosis of organizations, by accounting issues like the consumer acceptance, the commercial viability, the organization competitive answers, the external responses, the product and manufacturing technology process, in which the evaluation of the project risk is defined not only by the risk probability of occurrence and its correspondent effects, but also defined by the organizations’ capability to influence the destiny of the actions, regarding each risk.

3. Research Methodology

3.1. Proposed Approach

Based on what was stated before, a virtual enterprise (VE), commonly arises to develop specific products/systems, by joining different competences and resources from a set of partners, to achieve high levels of innovation at a low-cost level, when compared to a “traditional enterprise” that must acquire from the market, the same resources and competencies.
Therefore, and based on the importance of VE on having a framework to assess the risk in such context—in this work it will be presented an approach to evaluate the existence of a possible relationship between the individual risk from a given system component n (Scn) (which will be assessed according to a set of different domains or risk categories) and the risk, regarding each domain of the virtual enterprise, represented here by the product/system to be developed.
Thus—and based on [25,26]—the different risks involved can be categorized based on the taxonomy adopted in this work, which is organized according to the 2 hierarchical risk levels considered here, namely; the system risk (SR) and the system component risk (Scn) (Figure 1 and Figure 2).
By bearing in mind that a system component (Sc), can be considered (and managed) as a project, the completion of such project, even with or without success, could bring an impact on the various VE domains through its system to be developed, given the expected changes that may be occur with the development of each Sc itself.
Instead of VE domains, we have system domains (SD).
Therefore, each system component n (Scn) of the system to be develop, has a development project involved, which have a risk associated with it that can be managed on behalf of project risk management (PRM) techniques. Each risk, associated with the Scn, can be considered, as part of the systems’ risk management (SRM), managed by the VE management board, which is responsible for the entire system to be developed (Figure 2).
Furthermore, the risk regarding to a given system component n (ScRScn), can be achieved by accounting the risk, obtained in several domains or risk categories, namely; performance (P), quality (Q), cost (C), time (T), among others [25,26].
Apart from the risk, associated with the system component (ScRScn), there is the risk associated with the system to be developed (SR), where and according to the risk taxonomy presented on Figure 1, it can be assessed on behalf of the following risk categories strategy (S), operations (O), finance (F), marketing (M), information systems (IS), environment (E), among others.
The possible existence of a relationship between the two risks referred before, namely ScRScn and SR, as well as its domains or risk categories involved, are described on Figure 2.
Thus, the risk regarding each system component (ScRScn), can influence the risk value of the system risk (SR), on its different domains, which in this study we have considered the following system domains (SD), namely; strategy (S), operations (O) and marketing (M).
The need to define and quantify such influence, allows to predict the effect that a risk, regarding to a given system component n (ScRScn) can originate in the overall system risk (SR), with the transition from a current stage into another (and future) one, reached through its deployment ([2]).
The system component risk (ScR), regarding its domains, namely “time”, “performance” and “cost”, are presented and discussed on [26,27,28], as a set of risk categories considered on behalf of project risk management, according to some studies found on literature.
Therefore, and based on [25,26,27,28,29,30,31]—the ScR was categorized, as it follows:
  • Time–accomplishment degree of the timeframe to complete the project within the planned;
  • Cost—accomplishment degree of the allocated budget constrain, regarding the project completion;
  • Performance–accomplishment degree of business and technical goals of the project, through the process outputs.
Regarding the system risk domains, it was considered the following ones:
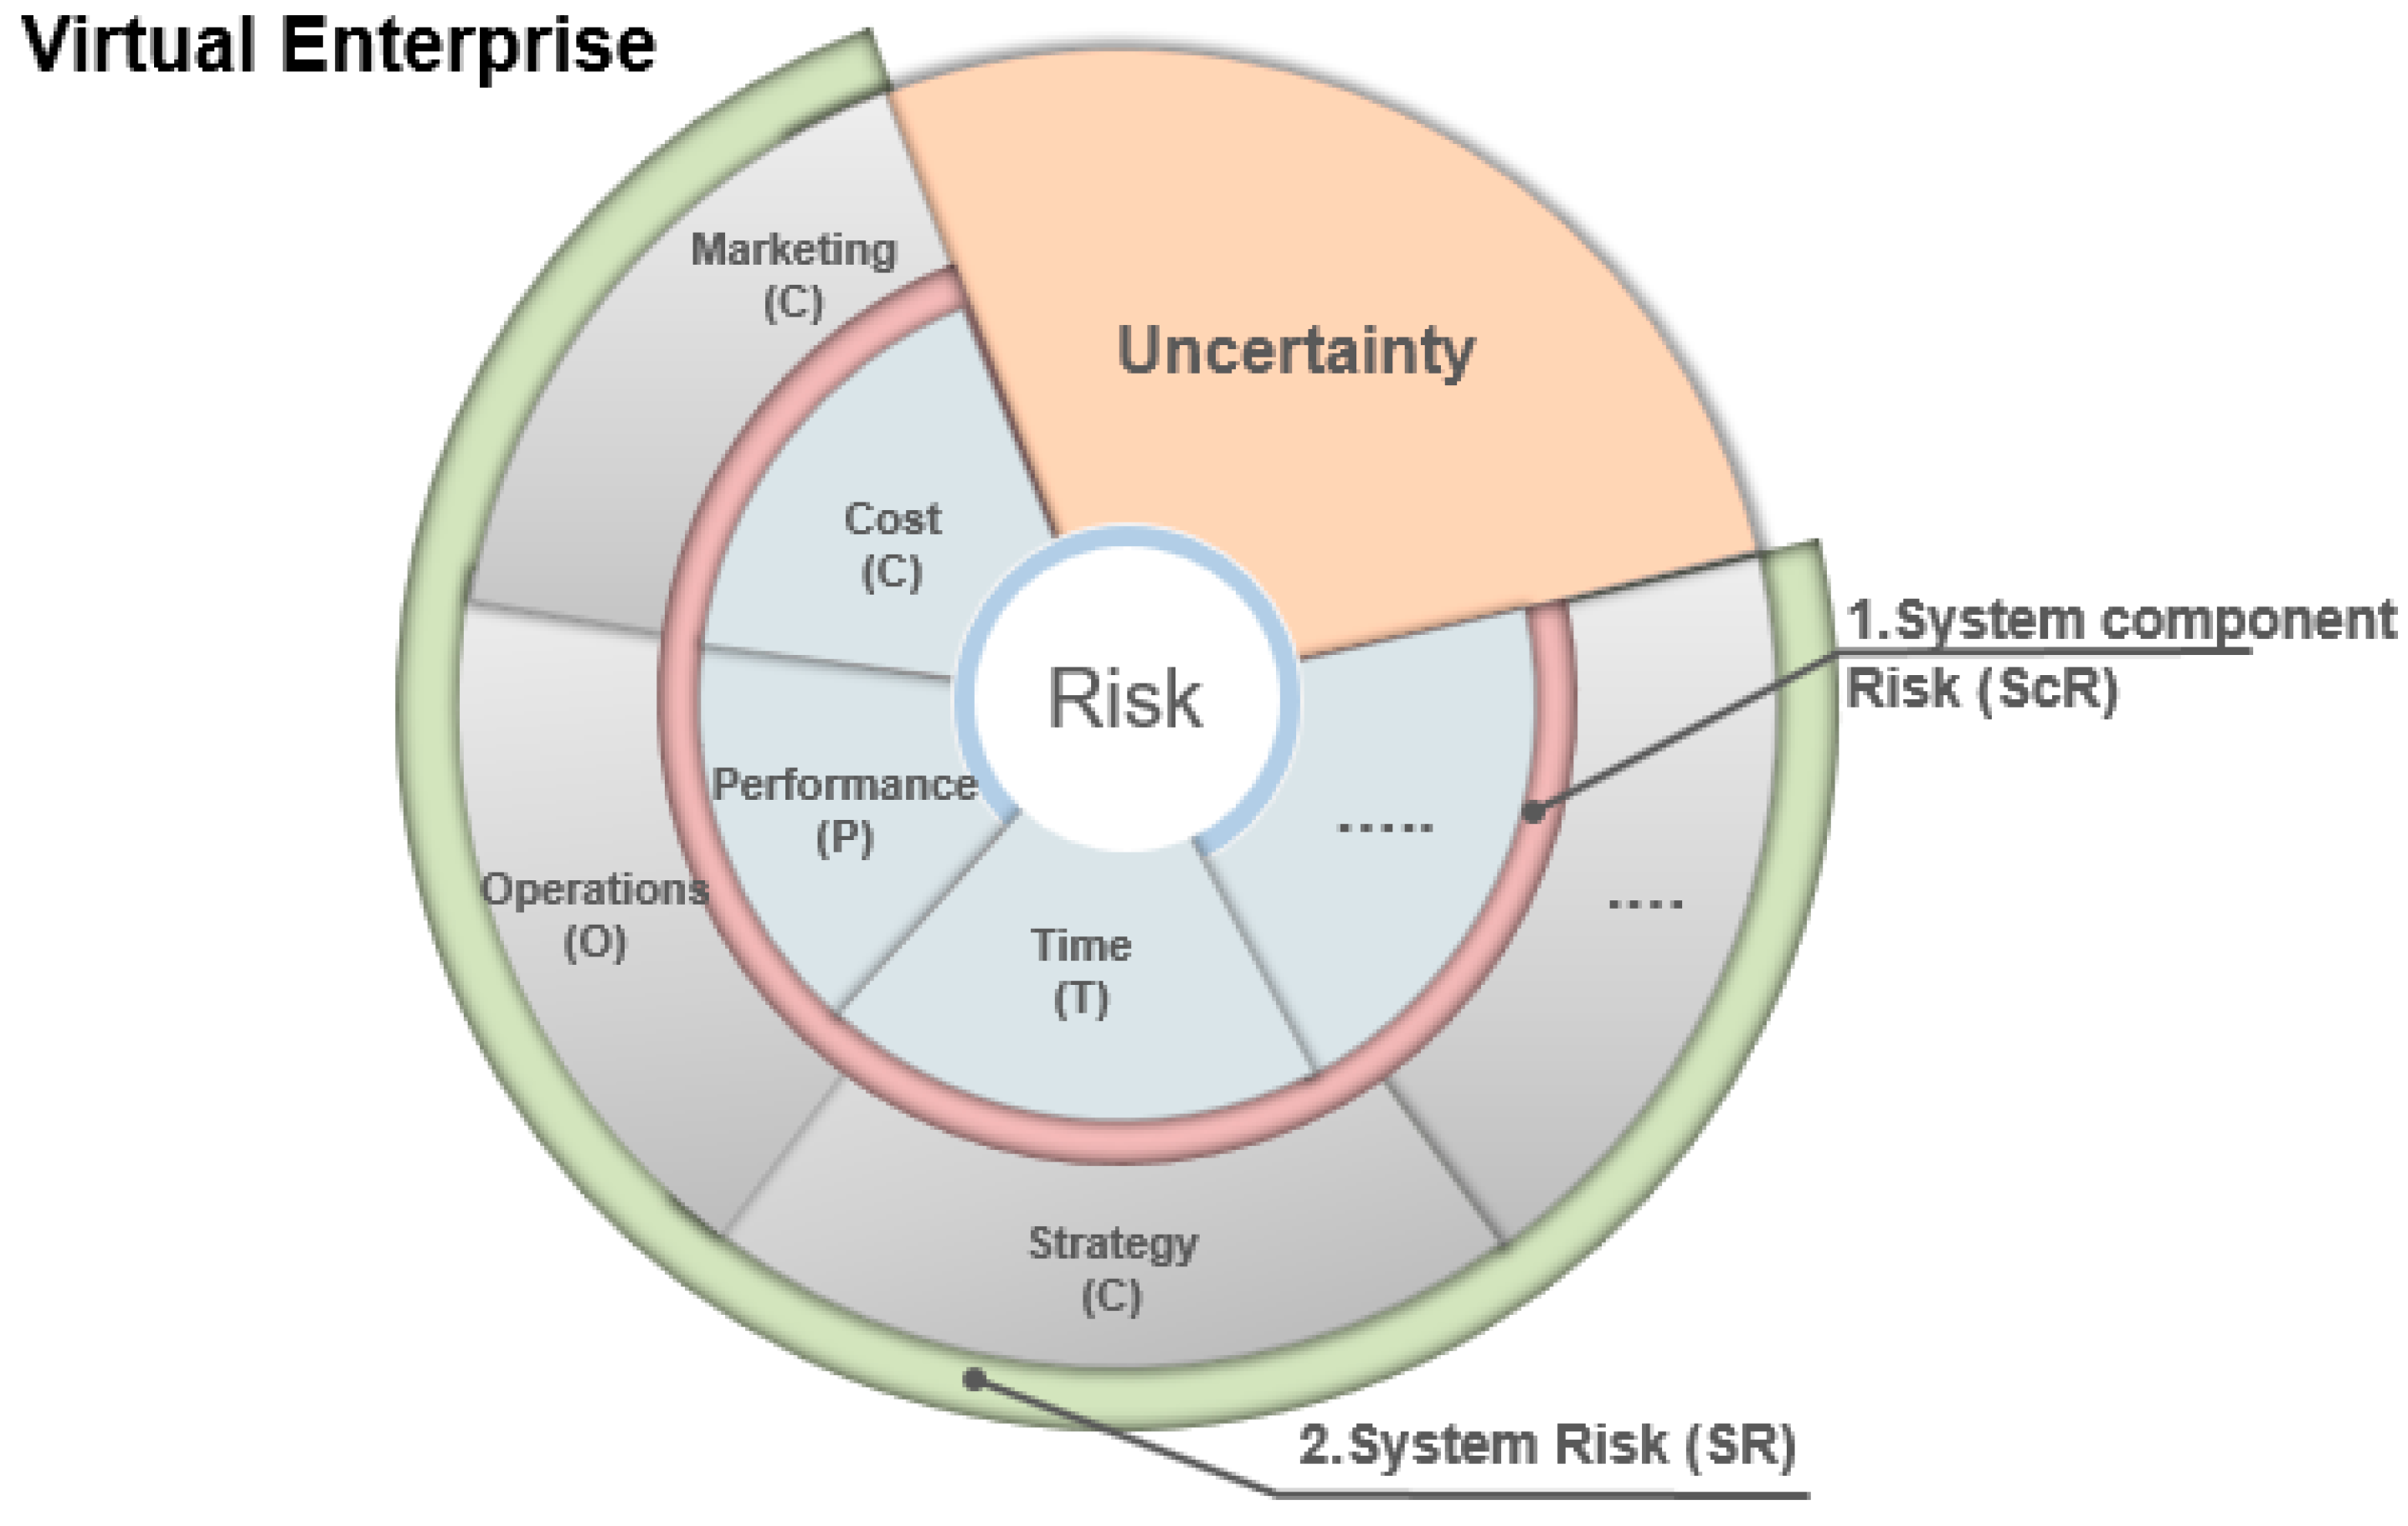
  • Strategy (S)—resulting from the errors in strategy (e.g., by developing a technology regarding a component that cannot work with other technologies from other product components or even a product technology that cannot meet the consumer needs) [27];
  • Operational (O)—resulted from the risks regarding the production process implementation, the existence of problems around the procurement and distribution or even the delay (due to the production) with the product to be lunched [27];
  • Marketing (M)—resulted from the value perceived by the costumers, which is related to the effectiveness of marketing actions (e.g., failure to generate demand for a product lunch and other risks related to demand, customer feels uncertain that the product do not meet the needs or expectation) [28,29].
Even the SR domains, as well as the ScR domains, could be expanded into additional and other risk categories apart from the ones presented before.

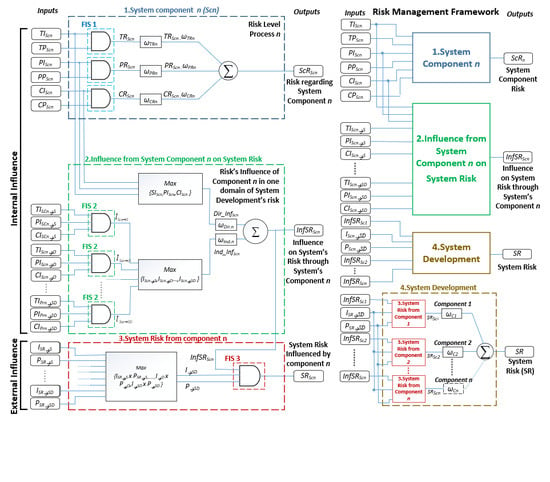
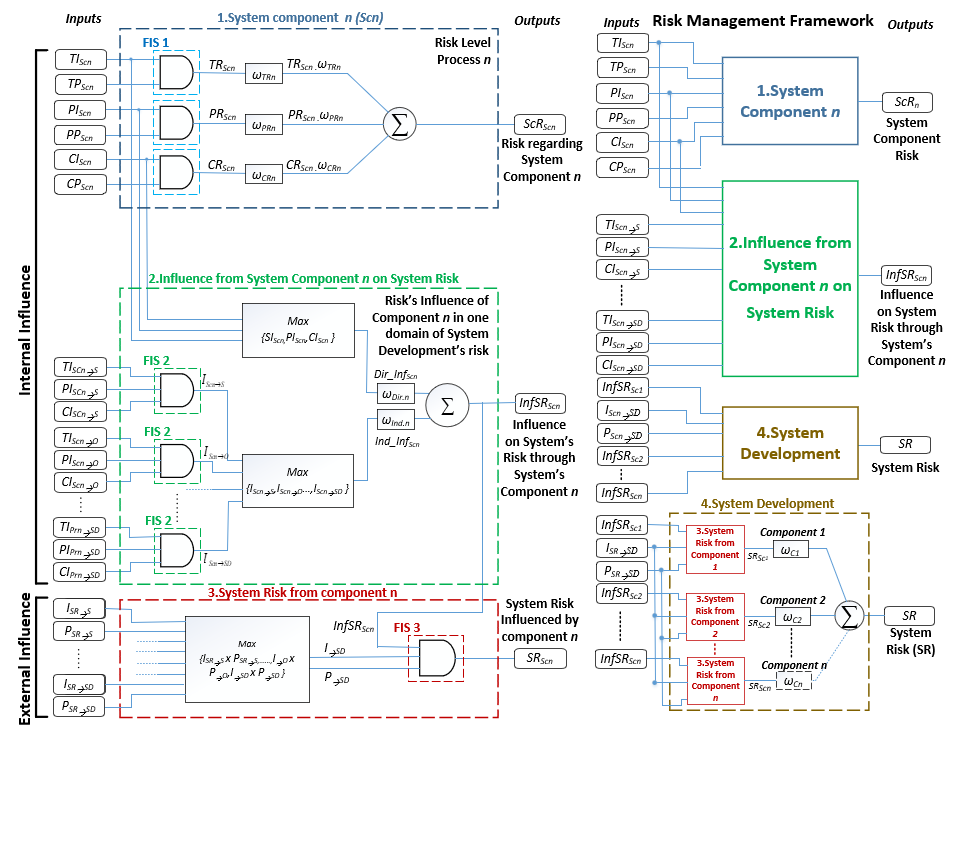
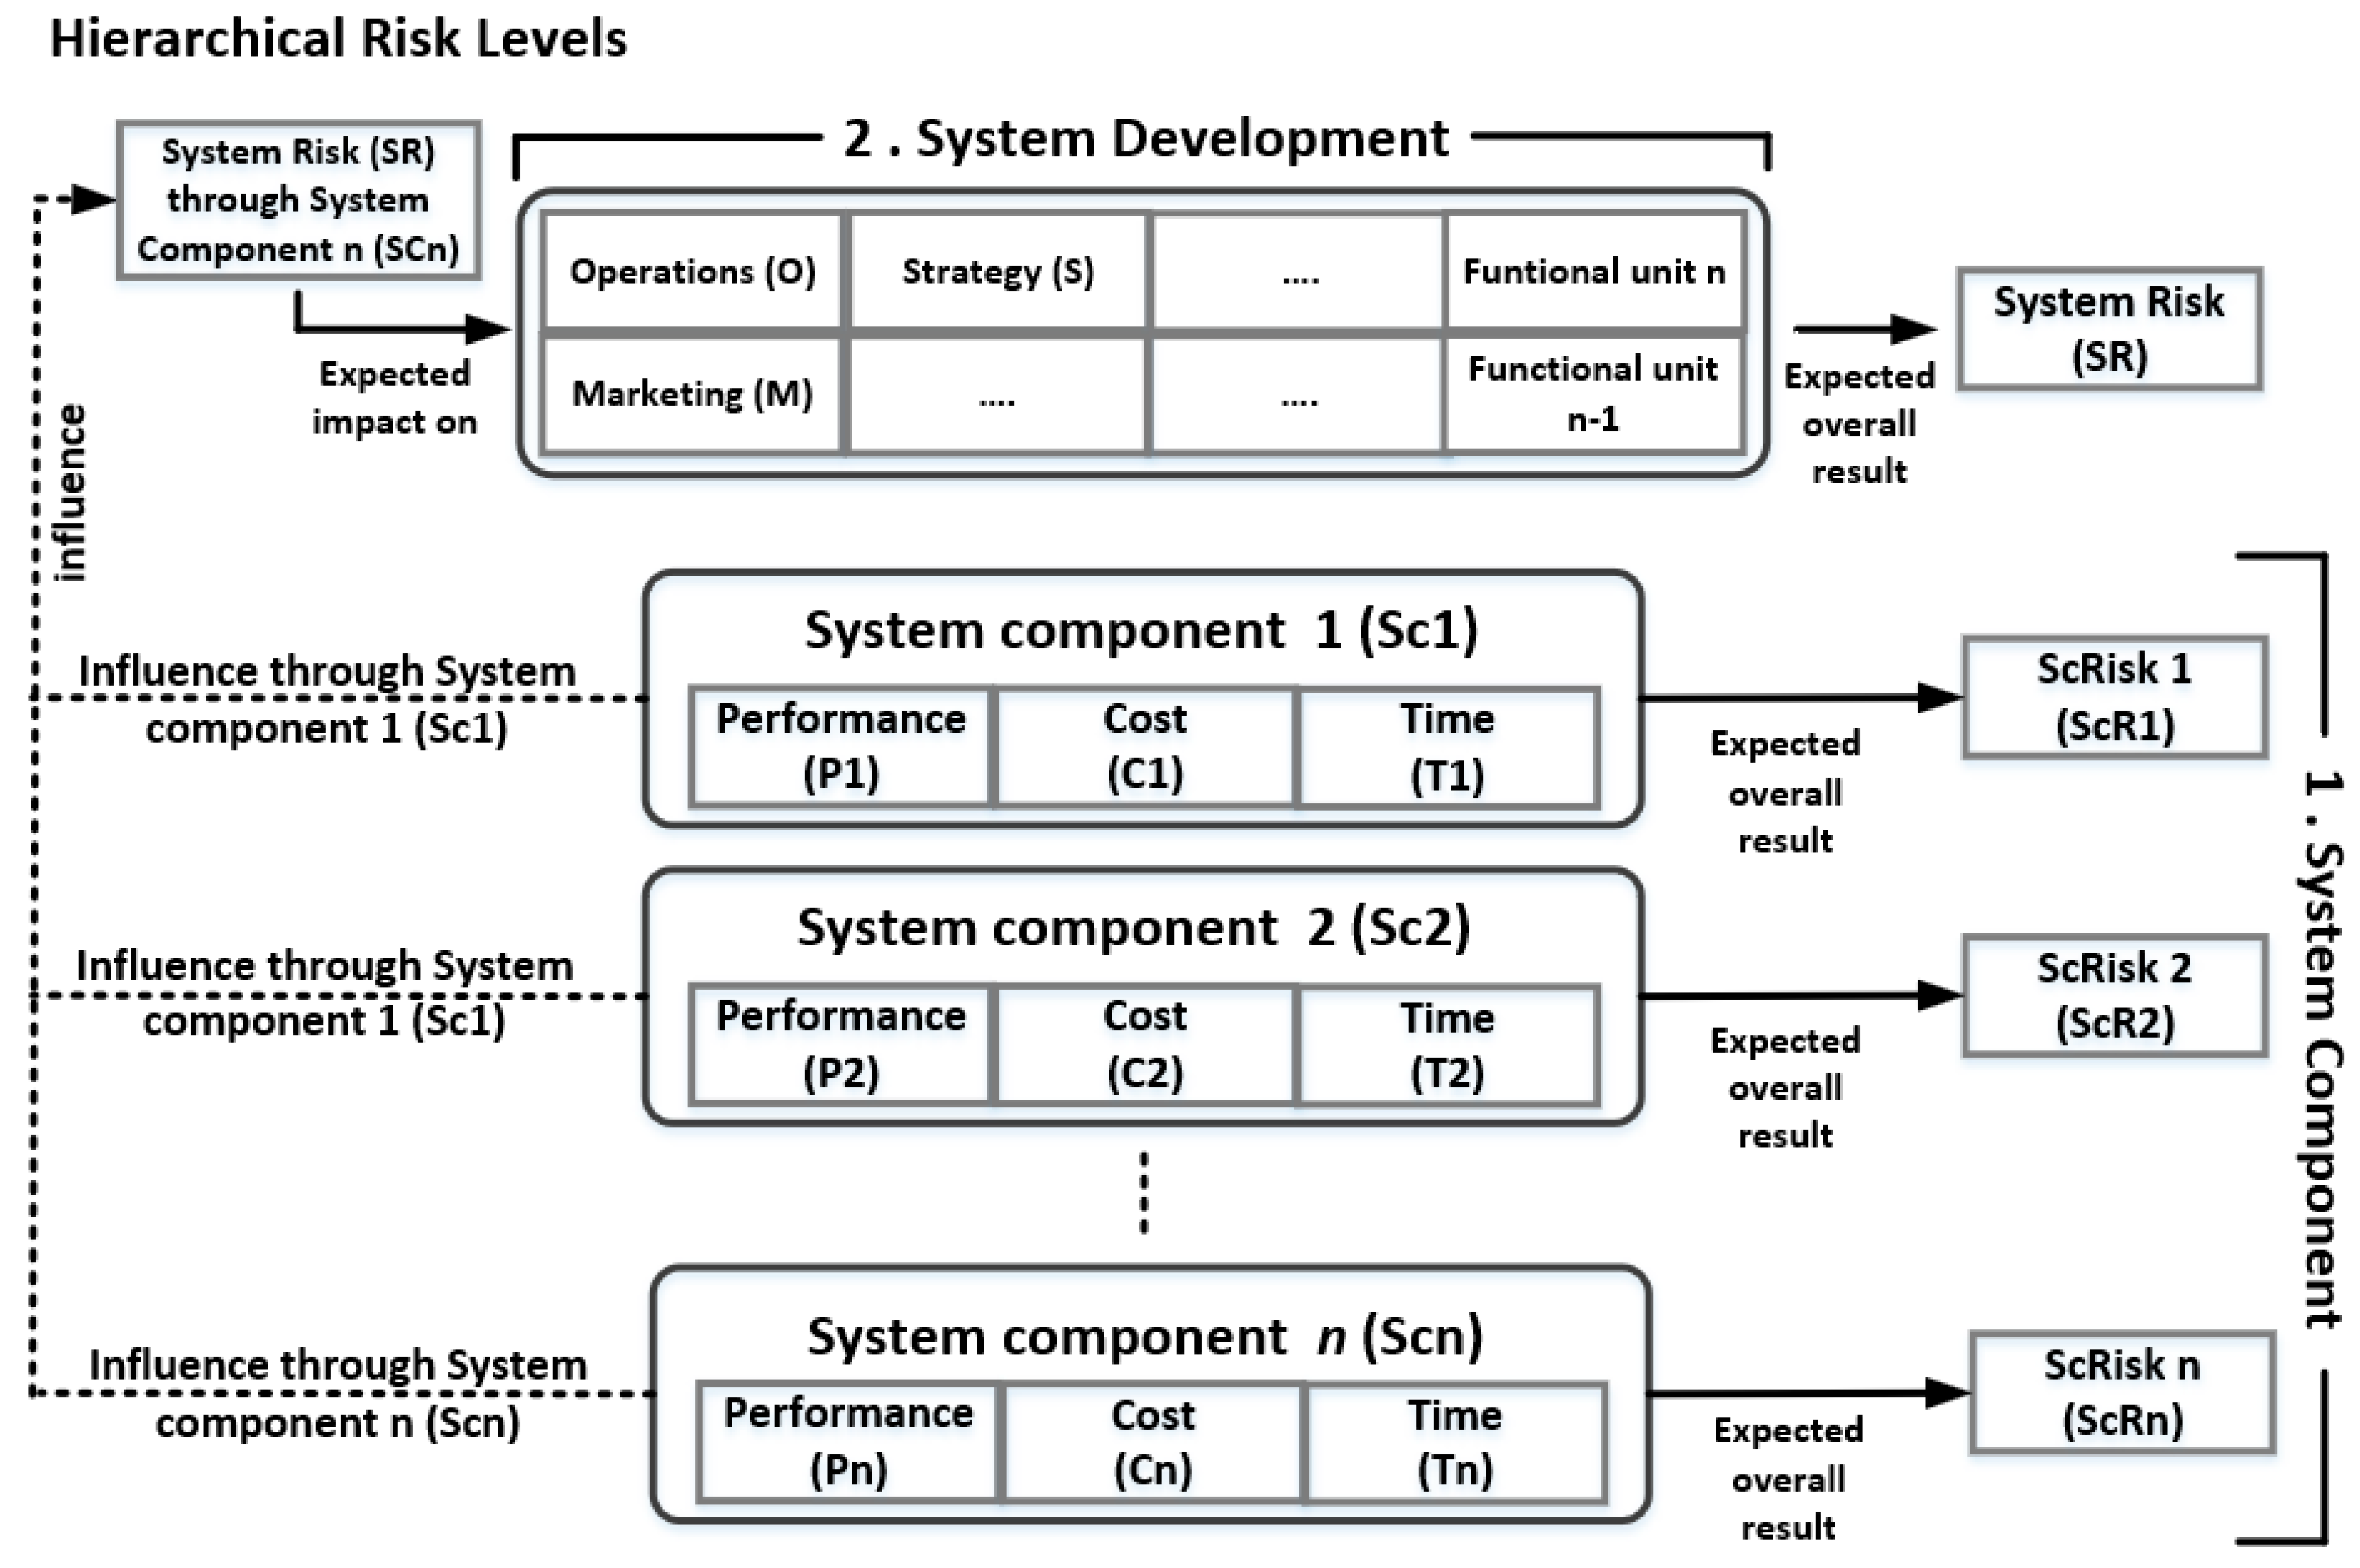
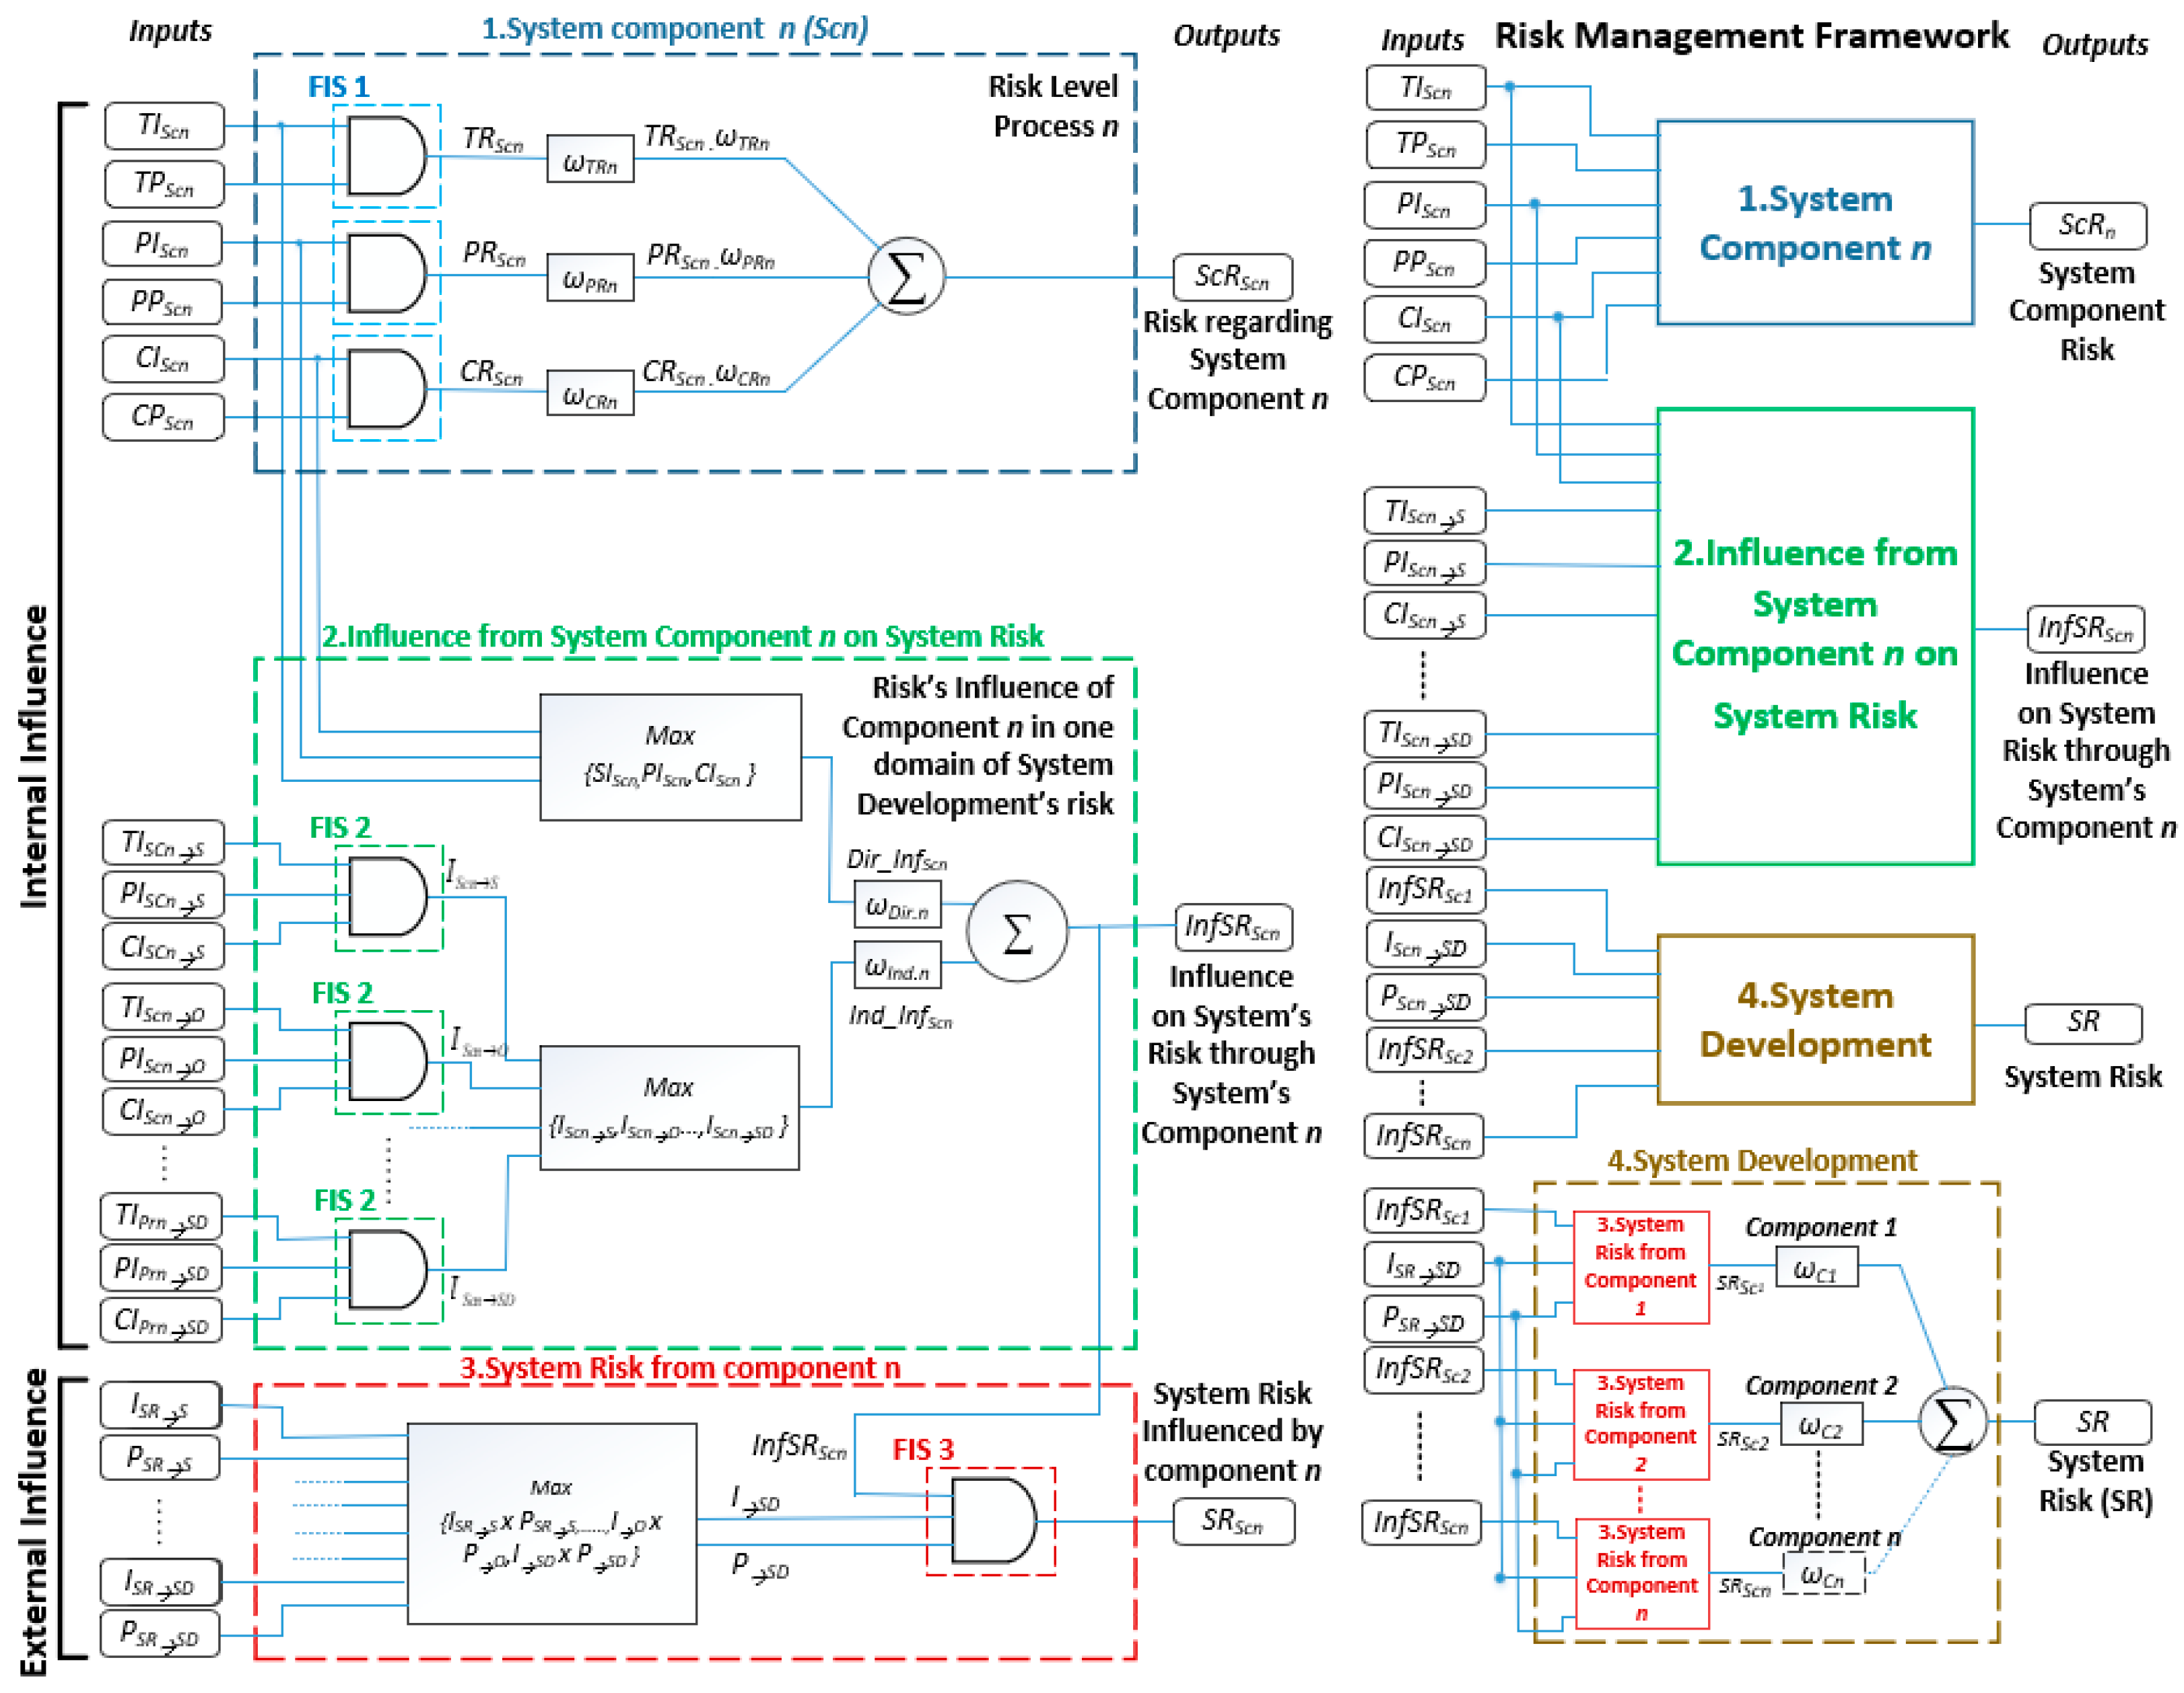
3.2. Model Architecture

The approach presented in this work, is based on the concept of system development (Figure 2) and it consists into an integrated approach that includes fuzzy logic to incorporate the uncertainty and ambiguity, regarding the human perception on risk evaluation with regards to system development.
Therefore, and based on the relationship shown on Figure 2—the approach presented in this work, resorts to fuzzy logic to make a qualitative and quantitative analysis of product risk evaluation in an open innovation context, by integrating two hierarchical risk levels, namely; system component and system development as a whole.
The approach, it is presented on Figure 3.
The system component level, has the aim of evaluating the system component risk (ScRScn), by taking into consideration a given system component (Sc) n. On the other hand, the second one, evaluates the system risk level (SR), by including the existence of a possible influence (InfSRScn), regarding each system component n (Scn) on the entire system risk (SR) (Figure 3).
For each risk category, regarding each system component (Figure 1), namely performance (P), cost (C) and time (T), there is an individual risk (RScn), which results from the combination of each (expected) impact (IScn) and the correspondent probability of occurrence (PScn) considered here (Figure 3), i.e.,:
T R S c n = T P S c n . T I S c n
P R S c n = P P S c n . P I S c n
C R S c n = C P S c n . C I S c n
Based on Figure 2 and Figure 3, the risk category, regarding each system component n (ScRScn), can be achieved by combining all the individual risk category considered, i.e.,:
S c R S c n = T R S c n . ω T R n + P R S c n . ω P R n + C R S c n . ω C R n
With the weights ( ω R n ) , corresponding each one, to a risk category, regarding a system component n, namely cost (C), time (T) and performance (P). These weights, should satisfy the following condition:
1 = ω T R n + ω P R n + ω C R n
The existence of a (possible) influence, regarding the risk with a given System component n (ScRScn), over each system development domain (SD) considered here, is also included in this approach, by taking the correspondent (and expected) impact variable (IScn → SD), which will affect one (or even more) domains of the system development (SD).
In this work, it was considered three domains, regarding to the system, developed on behalf of the VE created, namely, marketing (M), operations (O) and strategy (S).
Through the risk categories time (T), performance (P) and cost (C), related to a system component n (Scn), it was achieved a set of expected impact values (IScn → SD), regarding to each system development domain considered. Then and for each system domain (SD) considered here, only one value of IScn → SD is selected (Figure 3), between the different values. Such a process is preformed based on the risk manager perception.
Furthermore and based on each SD considered here, fuzzy logic is then deployed, by using a set of linguistic variables and inference rules, to obtain the correspondent impact value of IScn → SD.
Regarding the indirect influence, resulted from the system component n (Ind_InfScn) on each SD, it is achieved, by accounting the maximum value of the three corresponding (and expected) impact values (IScn SD) related to each system domain, achieved before, i.e.,:
I n d _ I n f S c n = max { S I S c n S , P I S c n S , C I S c n S , , S I S c n O , P I S c n O , C I S c n O }
The existence of a (possible) direct influence, from each system component and through its different domains, is also considered here, since that the resources used on each system component, can affect resource availability in terms of the system development context.
Thus, the Sc domain with more impact, allows to estimate the direct influence (Dir_InfScn) of a given Scn, which is obtained, by achieving the maximum value of the three IScn → SD values, mentioned before, i.e.,:
D i r _ I n f S c n = max { P I S c n , T I S c n , C I S c n }
Therefore, the total influence ( I n f S R S c n ) from a given Scn on system development, will be resulted by adding the D i r _ I n f S c n with I n d _ I n f S c n , i.e.,:
I n f P R S c n = I n d _ I n f S c n . ϖ I n d . n + D i r _ I n f S c n . ϖ D i r . n
The existence of the weights ωDir.n and ωInd.n, intends to define the relative importance, given by the risk manager to the direct and indirect influences achieved before, with both parameters, satisfying the following condition, i.e.,:
1 = ω I n d . n + ω D i r . n
Therefore, the system development risk (SRScn), resulted from each Scn, is achieved by combining the probability of occurrence of the event (PSR → SD), the external impact on each system domain (SD) (ISR → SD) and the influence from each Scn on system risk ( I n f S R S c n ) , i.e.,:
S R S c n = P S R S D . I S R S D . I n f S R S c n
The values of ISR → SD and PSR → SD, are achieved, by selecting the maximum value of product, between ISR → SD and PSR → SD, both considered for each system domain (SD), namely marketing (M), operations (O) and strategy (S), i.e.,:
I S R S D , P S R S D = max { I S R M × P S R M , I S R O × P S R O , I S R S × P S R S }
The system risk (SR) is therefore resulted from the contribution of each SRScn, related to the correspondent Scn considered and based on its relative importance (ωScn), i.e.,:
S R = ω S c 1 . S R S c 1 + ω S c 2 . S R S c 2 + ω S c n . S R S c n
where ωSc1, ωSc2 and ωScn, are the weights, respectively regarded to the relative importance given to each system component n (Scn).

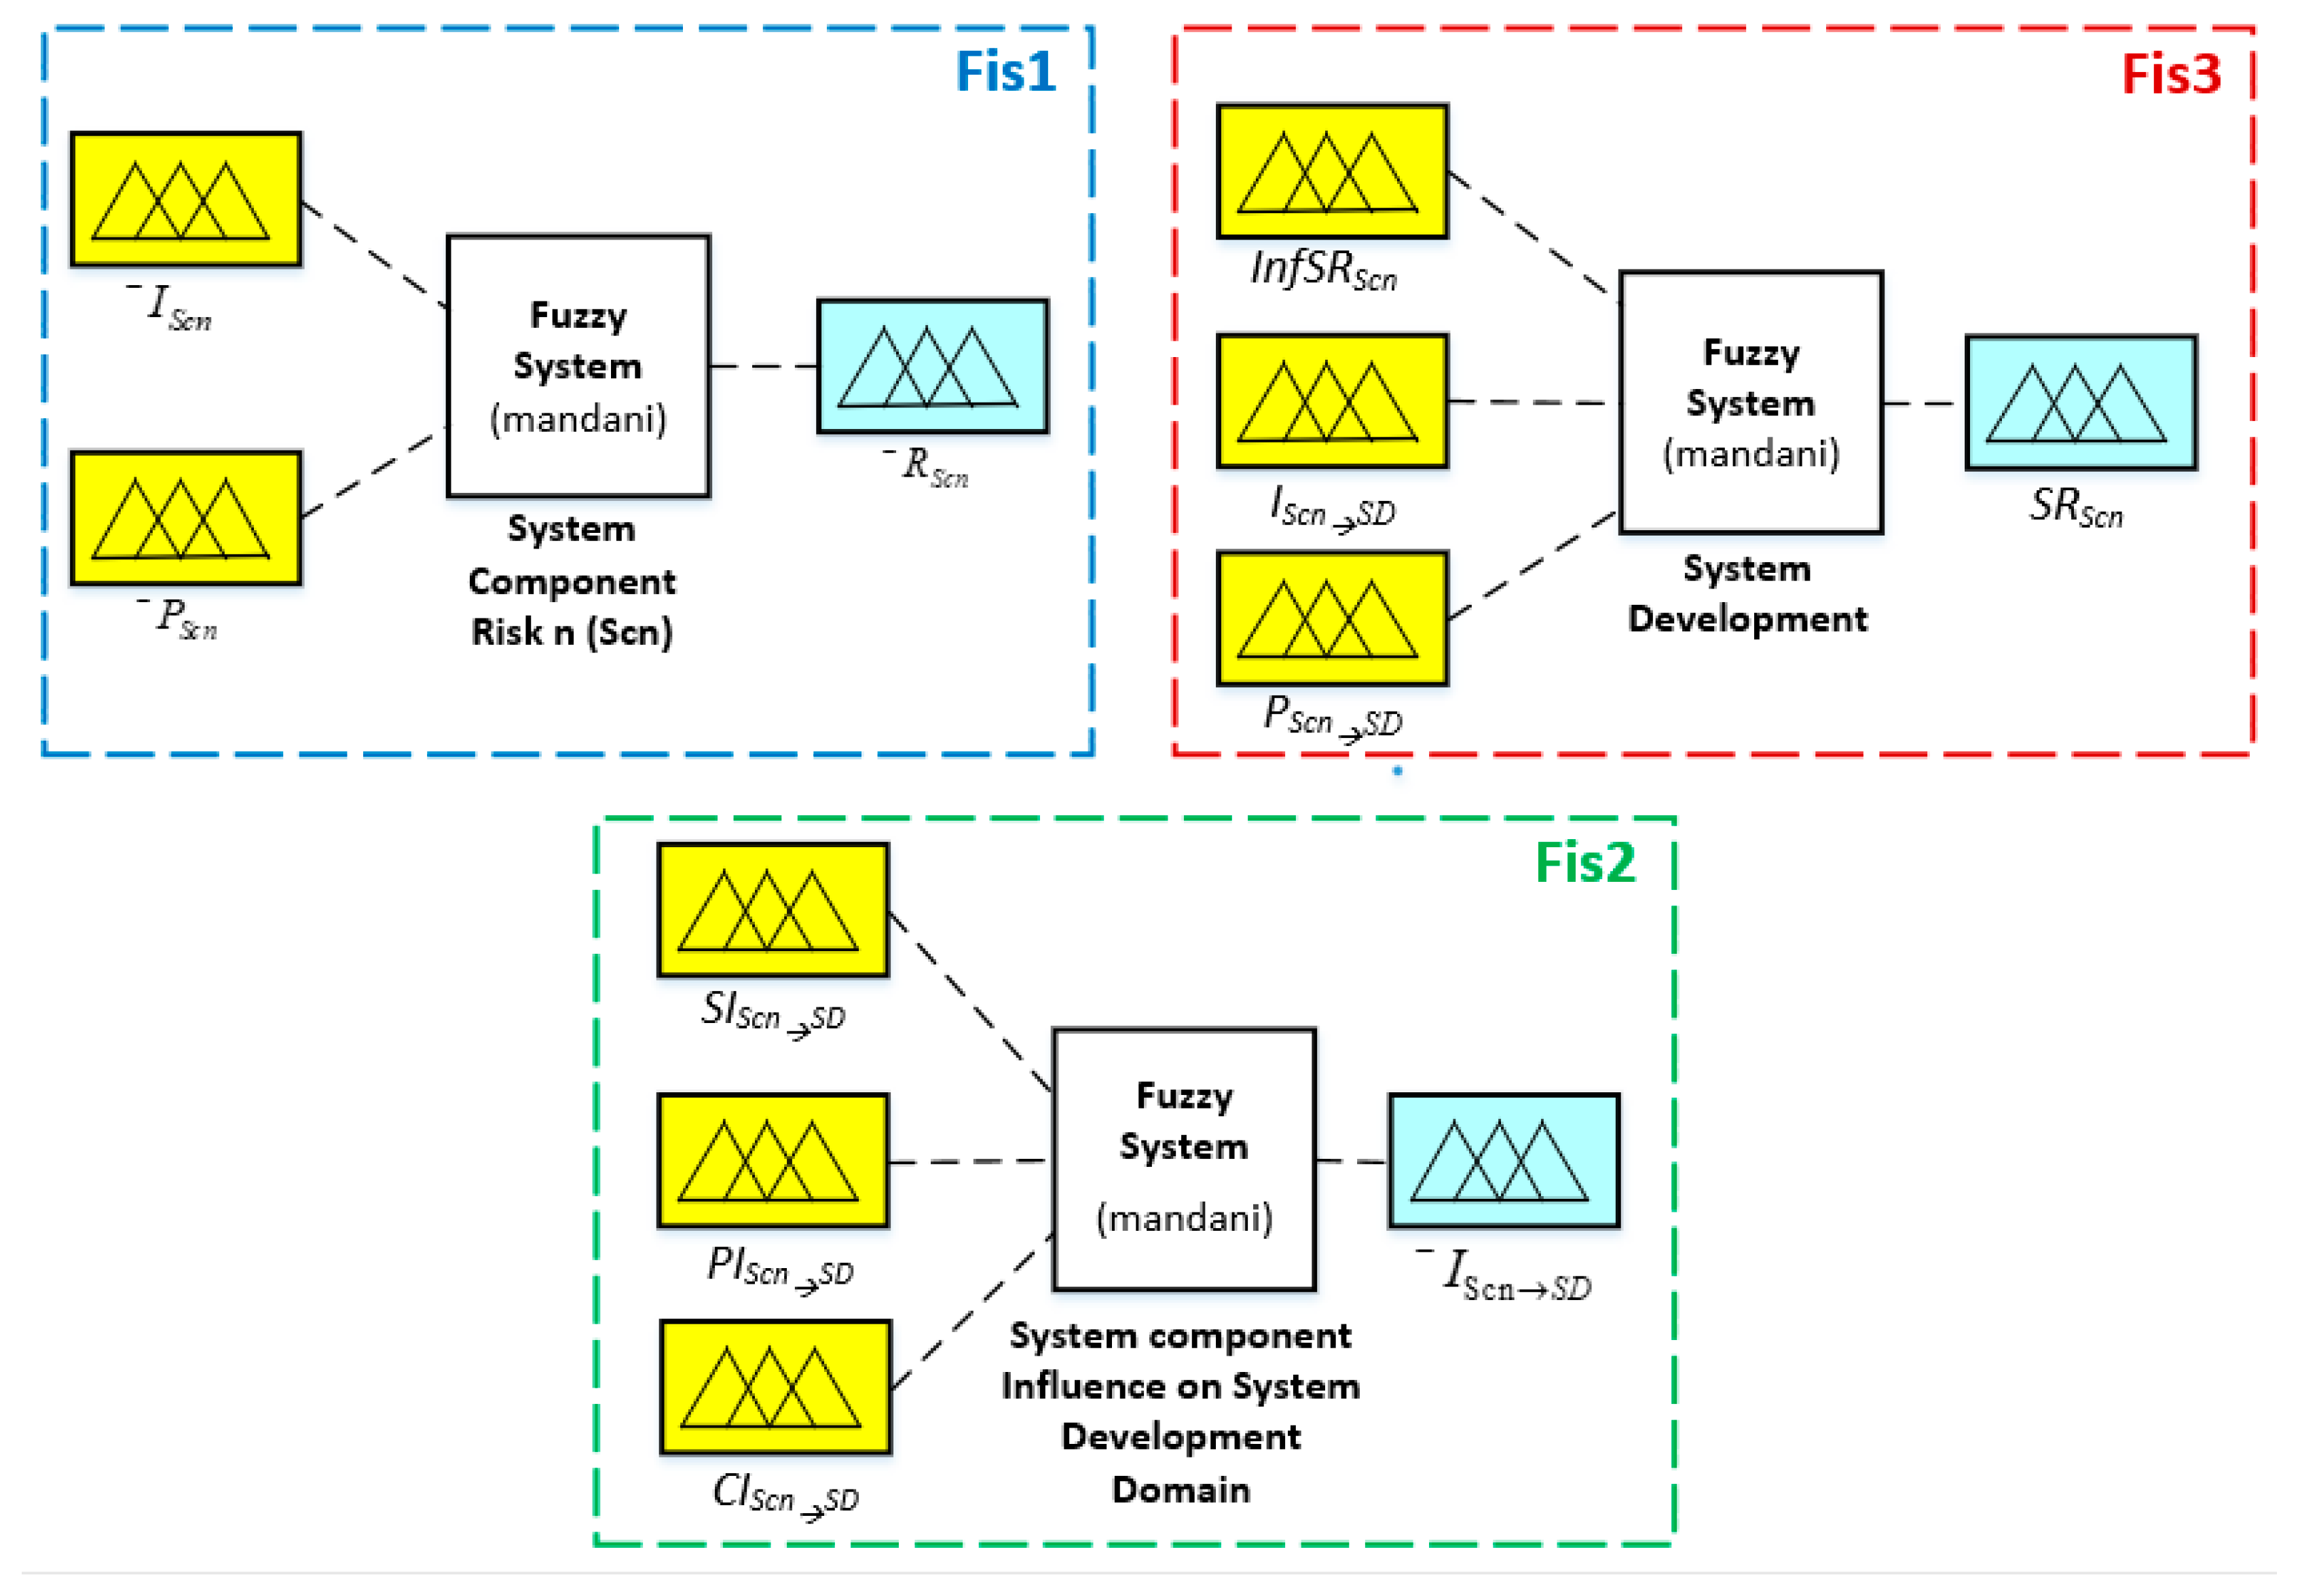
3.3. Fuzzy Implementation

The levels of risk, related to ScRScn and SR values, were obtained from each correspondent fuzzy inference system (FIS) (Figure 3) and they were based on a set of inference rules from the type of “If-And-Then” and according to the risk category.
According to Figure 3 and regarding the system component level, the FIS “F1”, is based on the expressions (1–3), regarding the inputs (PScn) and (IScn), i.e.,:
R S c n = P S c n I S c n
Thus, the inference rules, regarding F1 system (Figure 3 and Figure 4), can be formulated as: “IF probability (-PPrn) is P AND impact (-IPrn) is I, THEN the process risk is R.
The same approach can be achieved for the impact IScn → SD, which allows to obtain the indirect influence Ind_InfScn, defined on (6). Therefore, and based on 13, the impact IScn → SD, is achieved through the following expressions:
I S c n S = T I S c n S P I S c n S C I S c n S
I S c n M = T I S c n M P I S c n M C I S c n M
I S c n O = T I S c n O P I S c n O C I S c n O
The possible influence of the risk, regarding the system component n, related to each system domain (SD), can also be considered by using the FIS F2 (Figure 3 and Figure 4), which is based on a set of linguistic rules and variables, which can be formulated as “If impact (TIScn → SD) is it and the impact (TIScn → SD) is Ip and the impact (TIScn → SD) is Ic, Then the average impact of the system component n, on each SD is IScn → SD.
Similar approach can be proposed, regarding the system risk level (SRScn), where, based on (10)—and by considering the influence from Scn on system risk development ( I n f S R S c n ) SRScn is obtained by using the following expression:
S R S c n = P S R S D I S R S D I n f S R S c n
Thus, the inference rules regarding the FIS F3 (Figure 3 and Figure 4), is defined as “If probability (PScn → SD) is P, impact (ISR → SD) is I and Scn influence on system risk (InfSRScn) is Inf. Then the system risk level (SRScn) is SR.

3.4. Definition of Linguistic Variables: Values and Pertinence Functions

Regarding the linguistic variables—and according to some works existing on the literature ([25,26])—it is normally recommended that the number of levels shouldn’t be more than nine levels, since that a bigger value, surpass human perception limits, when it concerns to value discrimination.
Therefore, and based on these recommendations—five levels were adopted for each of the linguistic variables considered in this work. The definition of the five levels, as well as the correspondent pertinence functions, are described on Table 1, Table 2 and Table 3. Regarding each pertinence function, it was used the triangular type function, whose parameters a, b and c, were also described on the same tables.
Thus—and with regards to all off the domains of the Sc probability of occurrence (PScn), i.e., cost (C), time (T) and performance (P)—it was defined the pertinence functions and linguistic variables, which are presented on Table 1.
Same approach, was also deployed to define the probability of occurrence, regarding the system risk (PSR→SD), by also using Table 1, with SD, being the system domain considered here, i.e., strategy (S), operations (O) and marketing (M).
Regarding the linguistic variables, related to the expected impact, considered for each Scn (−IScn) and on behalf of the three Sc domains considered here (cost (C), time (T) and performance (P)), on Table 2 are described the correspondent linguistic values, as well as the pertinence functions, used to define the same variables.
Similar approach was conducted for the variable—IScn → SD, regarding the correspondent expected impact value of each Sc domain on each system domain (SD) considered here, namely, marketing (M), operations (O) and strategy (S), with Table 2, also being applied in this case, given the same criteria, established for -IScn variable.
With regards to the Sc risk (RScn)—and on behalf of its Sc domains (cost (C), time (T) and performance (P))—the correspondent linguistic variable, is defined on Table 3, through its pertinence functions and correspondent triangular parameters (a, b, c). A similar approach was also deployed to define the linguistic variable regarding the system risk, related to the SRScn variable.
In addition to the parameters, presented on Table 1, Table 2 and Table 3, it is possible to correspond the linguistic values into numeric ones, based on a set of intervals (Table 4), which will help to analyze the final results obtained, regarding the risks with system components, as well as the overall system development risk.

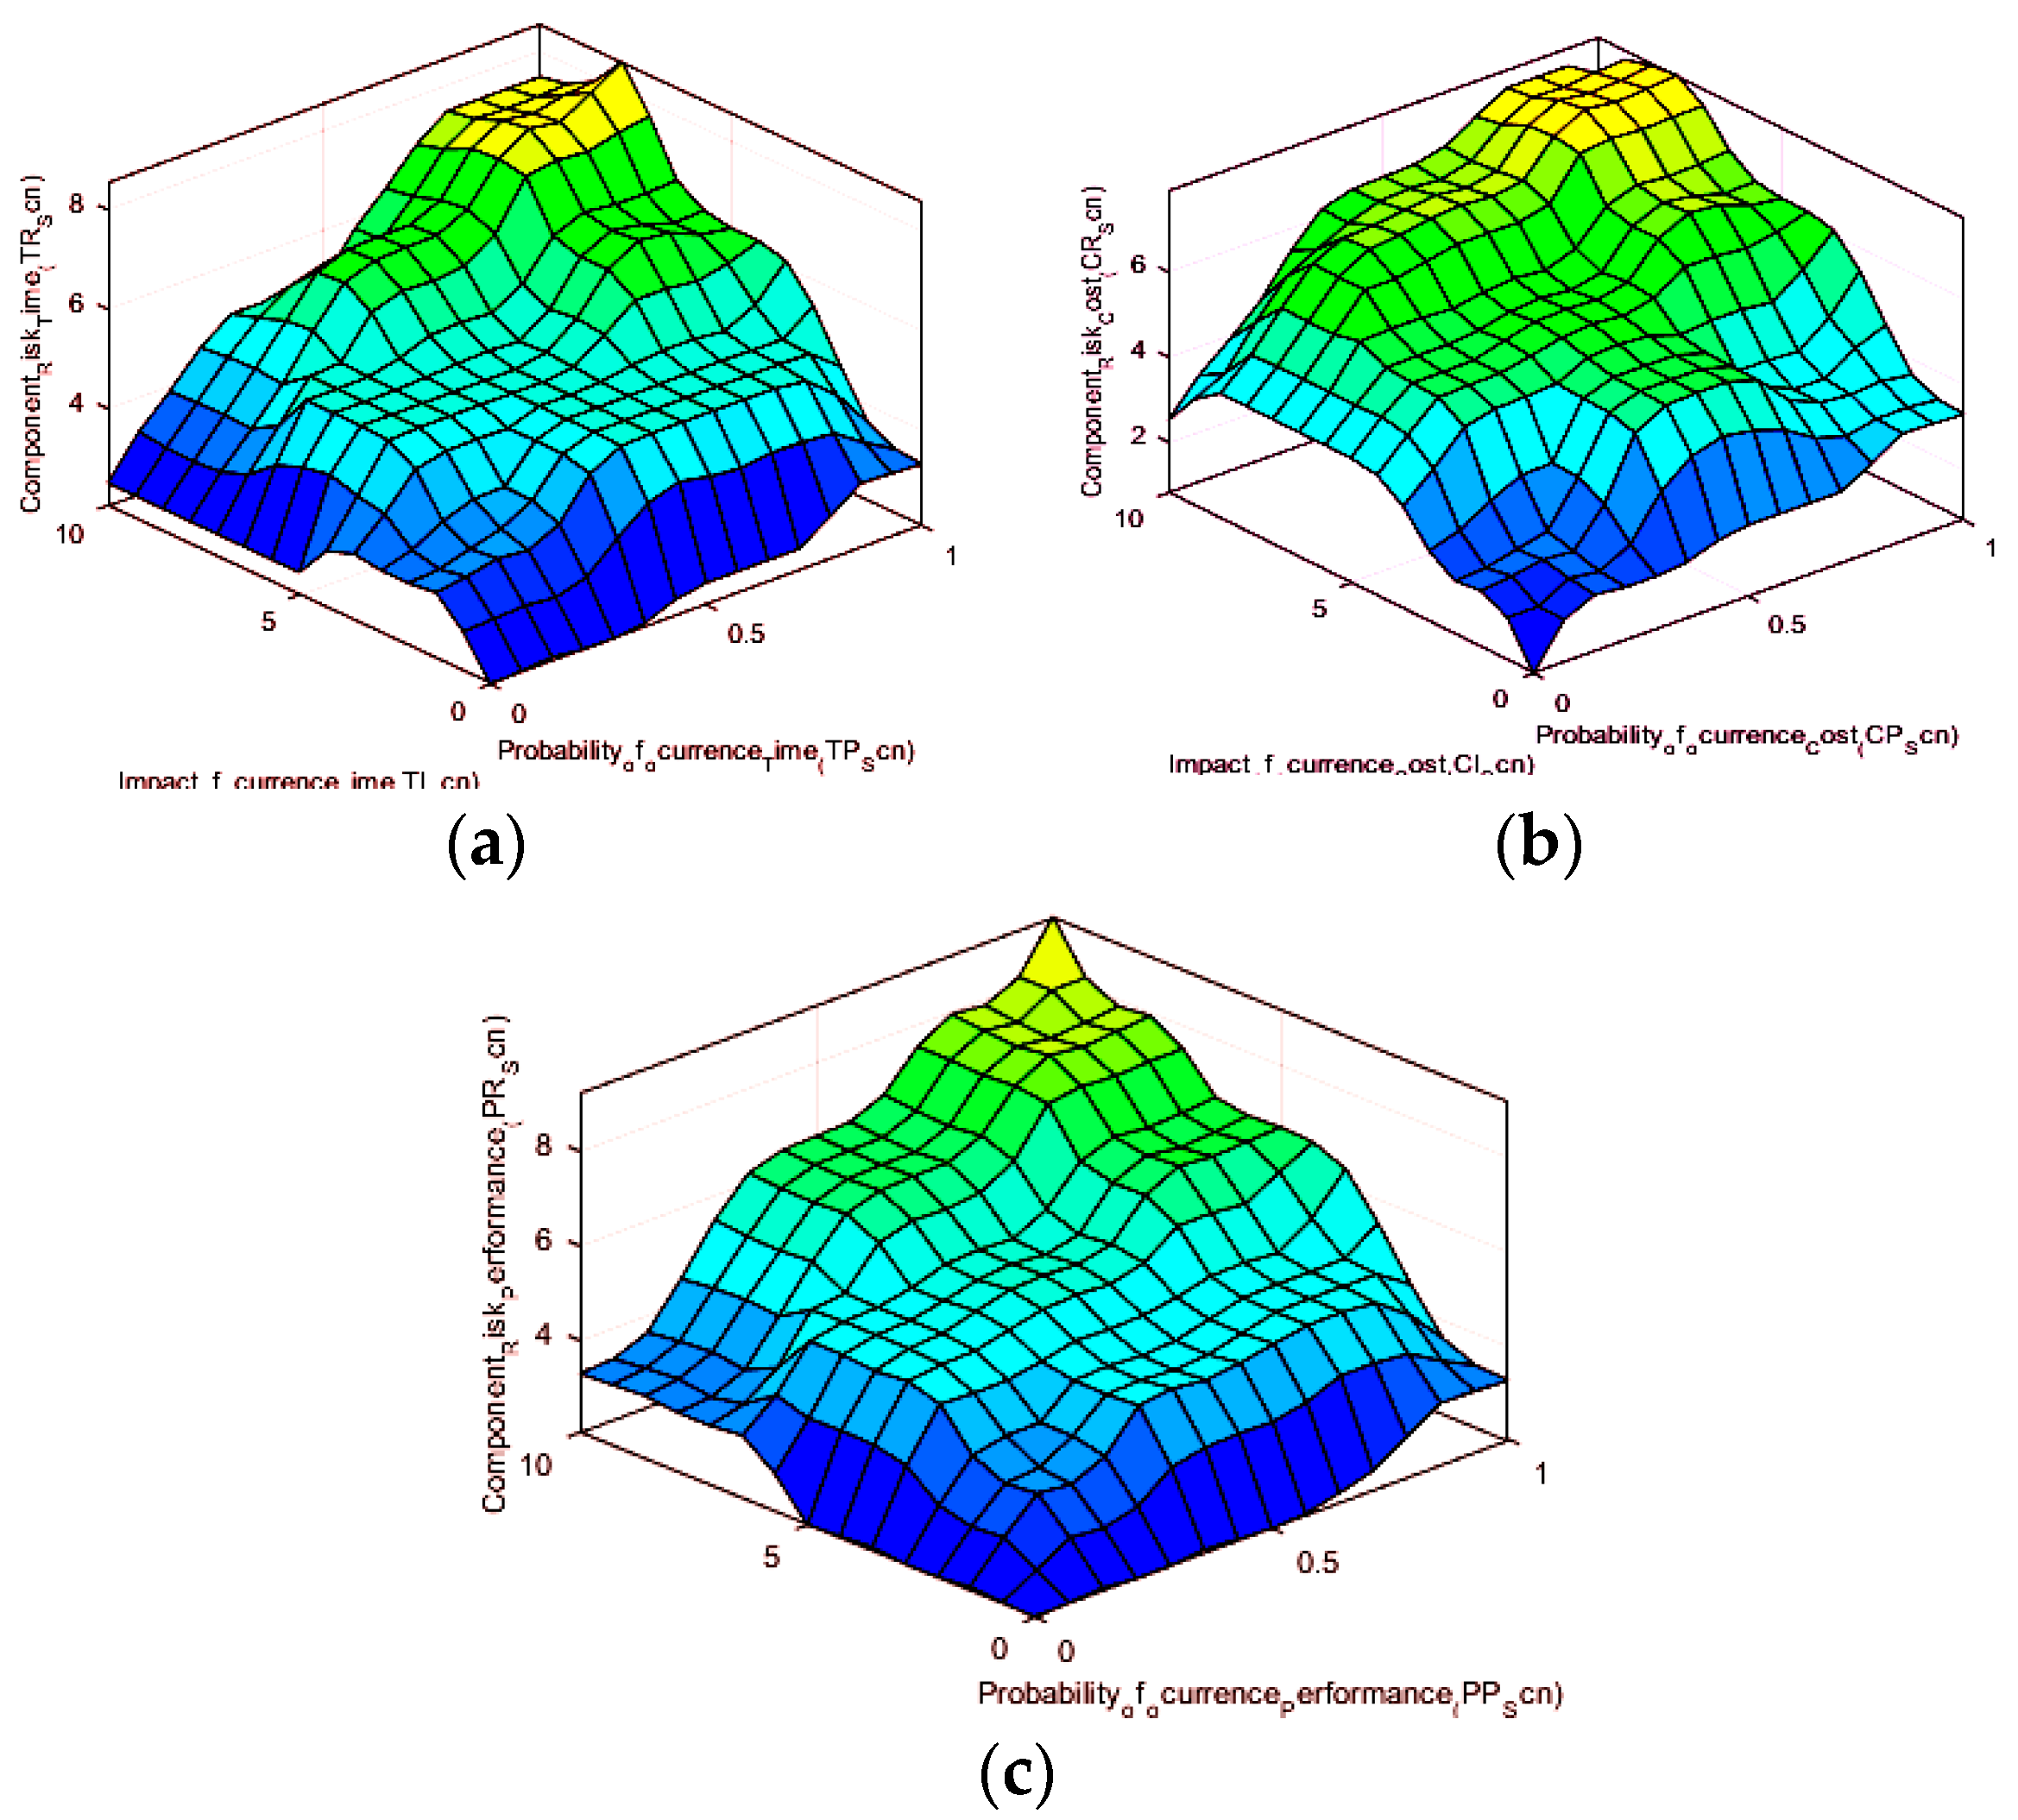
3.5. Fuzzy Deployment

Based on the model, presented on Figure 3, each one of the fuzzy inference system (FIS), was implemented by recurring to Matlab fuzzy Logic ToolboxTM (version R2017a) (Figure 4), which is integrated on MATLAB® software platform. Thus, the definition of the membership functions, as well as the inference rules, was based on Table 1, Table 2 and Table 3—and also made by recurring to the same toolbox—which was also used to analyze the behavior of each FIS considered.
As it referred before, in all of the FIS considered here, it was used triangular functions, whose parameters were taken from Table 1, Table 2 and Table 3, as well as the membership functions, whose inference rules were implemented by using Mamdani inference mechanism (Figure 4), due to its intuitive approach, well-suited to human input and widespread acceptance on literature [32,33].
With regards to the system component (Sc) level, the FIS F1, has on its inputs the linguistic variables “Probability of occurrence (PScn)”, as well as the correspondent expected Impact value (IScn), while the respective output, is the Sc risk level (RScn), which is related to each one of the Sc domains considered in this work.
The implementation of FIS F2 (influence of a given Scn on each system domain), has on its inputs, the linguistic variables, TIScn → SD, PIScn → SD and CIScn → SD, with the output variable of F2 having the Scn average impact, on each system domain (SD), i.e., IScn → SD.
The FIS F3, has on its inputs the linguistic variables PScn → SD, IScn → SD and InfSRScn, while the output is consistent with the linguistic variable SRScn.
With regards to the defuzzification method used in all FIS deployment, it was used the centroid approach, given its widely use in works from the literature ([26]).
In Figure 5, it is presented the surfaces, resulted from several simulations to assess the behavior of FIS 1, with concerns to each risk category (domain) considered here, regarding the Sc risk level.
Based on the three obtained surfaces, presented on Figure 5, it can be noticed some differences, regarding the three graphics, which are mainly associated with the difference regarding the inference rules adopted for each one of the Sc domains considered in this work, allowing therefore, to obtain different combinations of the output, for the same pair of inputs.

4. Case Study, Results & Discussion

The model robustness was evaluated by recurring to a case study, which was based on a virtual enterprise (VE). This VE, was established to develop an integrated and sustainable approach, to supply an industry, by producing its own energy through the integration of hydrogen with photovoltaic system.
The purpose of this system is to become a typical integrated product, to be further sold (and deployed) to the small industries, with a nominal electric power, ranging between 40–60 kW.
On these conditions, the system is designed so that the load to be fed, does not depend on the public electricity network, which makes the installation, self-sufficient in terms of electric energy.
The diagram presented on Figure 6, shows the developed system, with all of its components.
In order to ensure the total independence of the industry from the electric grid, the system produces electric energy during the day, by the photovoltaic and fuel cell systems, with the remained energy, being stored by using hydrogen as an energy carrier. This is preformed, by converting the same energy into the correspondent amount of hydrogen to be stored. The hydrogen stored, is then converted into electric energy by the fuel cell, during the night.
Based on Figure 6b, the system developed here, is composed by a series of components, which includes the photovoltaic system (PV panels and the converter), the electrolyzer to convert electric energy into hydrogen, the fuel cell to convert hydrogen into electric energy, the fuel tanks, the control system of the flow of air/oxygen (to control the purity of the O2 consumed by the fuel cell), the remain power converters, the management system, as well as other auxiliar systems (e.g., electric valves, tubes, cables, electric bombs, among other components).
Each system component is developed/manufactured by a set of partners (with indirect/direct involvement), through the open innovation network (OIN), created on behalf of the virtual enterprise (VE), established to develop the system presented on Figure 6.
This virtual enterprise, is formed by 13 partners (Figure 7), originated from different industries and sectors, including two Research & Development (R & D) centers from two universities.
In order to model the resources and the different competences involved here, shared among OIN partners, it was adopted the open innovation model, developed from the work of [10], which allows to manage the innovation (and the partner contribution) on behalf of the system/product do be developed (Figure 7).
The VE, shares different competences and resources between the partners involved, resulting therefore, into a set of innovations around the product development.
The interaction between the different partners from different areas (and therefore with different skills), allows to achieve innovations within this system, such as the reduction of available time to provide full power to specific loads/industries, where the load diagram suffers rapid changes in terms of power demand.
Based on the model, presented on Figure 7, it can even be mapped, the information changed between the different partners, as well as their contribution for each process, related to each system component to be developed—and also the interdependency relationship between each system component.
On Table 5, it can be seen some of the system components developed at the time, as well as the partners involved.
Each process/task is related to a specific component of the system, with the responsibility, being shared (in some cases) by more than one partner of the OIN.
Therefore, and to validate the approach developed here—it was considered a portfolio of 12 processes/system components, which are presented on Table 5.
For each process, there is a set of possible events, related to the schedule/time risk category (e.g., failure to accomplish the deadline on design the General System Monitoring and Control), cost (e.g., unexpectable additional costs during the execution of the electrolyzer) and performance (e.g., failure to meet the expected technical requirements of the developed fuel cell).
Thus, and, in order to apply the approach developed in this work, on behalf of the 17 inputs referred before (Figure 3 and Figure 4), a group of risk managers, have used the model inputs, based on the three identified risks, which is presented on Table 6, namely: SIScn, SPScn, PIScn, PPScn, CIScn, CPScn (system component level), SIScn → S, PIScn → S, CIScn → S, SIScn → O, PIScn → O, CIScn → O, SIScn → F, PIScn → F, CIScn → F (process influence) and I→SD, P→SD, InfSRScn (System level) related to each one of the 12 system components considered here. The inputs from the model presented on Figure 3, are shown on Table 6, regarding the different weights and related for each fuzzy inference system (FIS) considered here, namely FIS 1, FIS 2 and FIS 3.
The outputs from the model presented on Figure 3, are shown on Table 7, considering the different weights and related for each fuzzy inference system (FIS) considered here, namely FIS 1, FIS 2 and FIS 3.
Regarding the model outputs presented on Table 7, it is possible to correspond the linguistic values into numeric ones, based on a set of intervals (Table 4), in order to support the risk manager, through the analyze of the final results obtained, with regards to the 12 Sc considered here, leading to the Sc overall risk (ScR), as well as the system development risk (SR) (Table 8 and Table 9, respectively).
Therefore, on Table 8, it is presented the final values regarding the ScR level, as well as the values of the weights, namely ωTRn, ωPRn and ωCRn, related to the system component (Sc) risk level (ScR).
Through Table 8, the Sc with more risk, is Sc4 (Human Machine Interface (HMI)), followed by Sc10 (Electrolyzer) and Sc5 (Systems tests on lab). However—and by applying the same relative importance (i.e., the same weights) used on Sc10, into Sc8 risk assessment, for instance—we have verified that Sc8 has more risk than Sc10, which illustrates the importance given by the risk manager to each one of the Sc risk component (i.e., TRScn, PRScn and CRScn) when preforming the risk assessment.
Furthermore and based on the results from Table 8, we verify that the Sc 10 (Electrolyzer), has more potential to surpass the initial planned budget constraint, bringing therefore more risk to the overall system project. However, and despite the risk values obtained, it has small influence into the final product/system, since that the value of the overall system risk from Sc10 (SRScn) is smaller, practically neglectable, due to the relative importance ωPRn, given by the system risk manager.
On Table 9, are presented the values of the weights regarding the direct and indirect influence of each Scn (i.e., ωDir.n and ωInd.n), into the overall system risk (SRScn). The values of the weights (ωCn), regarding each ScR contribution to the SR (SRScn), are also presented here, as well as the different outputs from FIS 2 (see Figure 3), obtained based on Table 4 and Table 7.
On the other hand—and according to Table 9—the Sc which will inspire more concerns to the risk manager is the Sc 5 (Systems tests on lab), given the high value of risk, achieved not only with the process itself (SRSc5), but also with its influence on system risk, expressed through ScR5.
This previous detection, have allowed to identify the Sc with more risk, the risk source and also the partners involved, in order to study new ways to reduce such risk, even before the Sc risk Systems tests on lab (Sc5) took place.
From the results presented on Table 9, we can also prioritize the 12 Scs, according to its risks (srscn). Thus, the Sc with the highest risk is the process number 4 (human machine interface (hmi)), followed by the Sc number 9 (preliminary studies (solar irradiation on site, load diagram, other measures)), Sc number 5 (systems tests on lab), Sc number 8 (fuel cell) and Sc number 11 (sensors & actuators (valves, electric valves, tubes, temperature, pressure), Sc number 3 (electrolyzer system deployment (tests on site)), Sc number 10 (electrolyzer), Sc number 2 (pv system design), Sc number 6 (general system monitoring and control), Sc number 12 (power converters), Sc number 7 (fuel tanks design) and Sc number 1 (consumer requirements). by considering all of the systems components risks and according to the correspondent relative importance (ωScn) it is also possible to assess the overall risk regarding the system to developed, which in this case is 5.40, being therefore a system/product with a moderated risk, according to the model risk classification and given the conditions, associated with the case study, used in this work.

5. Conclusions

In this study, it was developed a methodology to assess the risk, regarding the development of a system (or a product), in an innovation ecosystem context, by considering a virtual enterprise (VE).
For this purpose, it was included the risks regarding each system component, from the partners involved on that component, as well as the risks regarding the VE system domain to be developed.
Apart from the identification and assessment of the risks involved, it was also considered the influence regarding the risk from each system component on each final system domain, related to the final system/product to be development by the VE.
The problem with subjectivity regarding the risk assessment, was also considered in this work, by integrated fuzzy logic on this approach, in order to try to avoid the possible biases, associated with human perception on risk assessment.
Therefore, the possible influence of each system component in the system risk domain, was also accounted and evaluated, allowing not only to act on system component level context and thus to estimate the correspondent risk, but also to assess its contribution for system-level risk, by considering each domain involved.
The method presented here, also allows to evaluate and prioritize each system component considered and according to its risk, by identifying at the same time, the sources of the risk (i.e., risk category) with more severity and therefore to act, in order to reduce or even mitigate such risk.
By reducing the risks involved with the correspondent system component, it is possible to reduce the system (or product) overall risk, contributing therefore to sustain the innovative ecosystem created to develop such system or product.
Additionally, the use of fuzzy logic to evaluate the different risks involved, have contributed to reduce the uncertainty and ambiguity with such analysis, which characterizes the risk evaluation, strongly dependent on the risk manager perception.
As a future work, the framework developed here, could also consider the individual risk with each activity, belonged to each system component involved on product/system development, by considering not only the risks associated with threats, but also the opportunities involved.

Author Contributions

Conceptualization, R.S. and A.A.; methodology, V.A., J.M.F.C. and A.A.; validation, R.S. and A.D.; formal analysis, A.D. and J.S.; investigation, J.S., A.A., and R.S.; resources, J.M.F.C. and A.A.; data curation, J.S. and A.A.; writing—original draft preparation, A.D. and V.A.; writing—review and editing, J.S. and R.S.; visualization, V.A. and J.S.; supervision, J.M.F.C. and A.A.; project administration, A.A. and R.S. All authors have read and agreed to the published version of the manuscript.

Funding

This research received no external funding.

Conflicts of Interest

The authors declare no conflict of interest.

References

  1. Xie, X.; Wang, H. How can open innovation ecosystem modes push product innovation forward? An fsQCA analysis. J. Bus. Res. 2020, 108, 29–41. [Google Scholar] [CrossRef]
  2. Urze, P.; Abreu, A. System Thinking to Understand Networked Innovation; Springer: Berlin/Heidelberg, Germany, 2014; Volume 434, pp. 327–335. [Google Scholar]
  3. Januška, M. Communication as a key factor in Virtual Enterprise paradigm support. In Innovation and Knowledge Management: A Global Competitive Advantage; Int. Bus. Inf. Manag. Assoc. (IBIMA): Kuala Lumpur, Malaysia, 2011; pp. 1–9. ISBN 978-0-9821489-5-2. [Google Scholar]
  4. Abreu, A.; Camarinha Matos, L.M. An Approach to Measure Social Capital in Collaborative Networks. In IFIP International Federation for Information Processing; Adaptation and Value Creating Collaborative Networks; Camarinha-Matos, L.M., Pereira-Klen, A., Afsarmanesh, H., Eds.; Springer: Berlin/Heidelberg, Germany, 2011; pp. 29–40. [Google Scholar]
  5. Enkel, E.; Gassmann, D.O.; Chesbrough, H. Open R&D and open innovation: Exploring the phenomenon. Rd Manag. 2009, 39, 311–316. [Google Scholar] [CrossRef]
  6. Granstrand, O.; Holgersson, M. Innovation ecosystems: A conceptual review and a new definition. Technovation 2020. [Google Scholar] [CrossRef]
  7. Arenal, A.; Armuña, C.; Feijoo, C.; Ramos, S.; Xu, Z.; Moreno, A. Innovation ecosystems theory revisited: The case of artificial intelligence in China. Telecommun. Policy 2020, 44, 101960. [Google Scholar] [CrossRef]
  8. Pereira, L.; Tenera, A.; Wemans, J. Insights on Individual’s Risk Perception for Risk Assessment in Web-based Risk Management Tools. Procedia Technol. 2013, 9, 886–892. [Google Scholar] [CrossRef] [Green Version]
  9. Yin, D.; Ming, X.; Zhang, X. Sustainable and Smart Product Innovation Ecosystem: An integrative status review and future perspectives. J. Clean. Prod. 2020, 274, 123005. [Google Scholar] [CrossRef]
  10. Santos, R.; Abreu, A.; Anes, V. Developing a Green Product-Based in an Open Innovation Environment. Case Study: Electrical Vehicle. In Security Education and Critical Infrastructures; Springer Science and Business Media LLC: Berlin/Heidelberg, Germany, 2019; Volume 568, pp. 115–127. [Google Scholar]
  11. Innocentive. Available online: https://www.innocentive.com/ (accessed on 1 January 2019).
  12. Rauter, R.; Globocnik, D.; Perl-Vorbach, E.; Baumgartner, R.J. Open innovation and its effects on economic and sustainability innovation performance. J. Innov. Knowl. 2019, 4, 226–233. [Google Scholar] [CrossRef]
  13. Adner, R. Ecosystem as structure: An actionable construct for strategy. J. Manag. 2017, 43, 39–58. [Google Scholar] [CrossRef]
  14. Reynolds, E.B.; Uygun, Y. Strengthening advanced manufacturing innovation ecosystems: The case of Massachusetts. Technol. Forecast. Soc. Chang. 2017, 136, 178–191. [Google Scholar] [CrossRef]
  15. Gordon, T.J.; Greenspan, D. Chaos and fractals: New tools for technological and social forecasting. Technol. Forecast. Soc. Chang. 1988, 34, 178–191. [Google Scholar]
  16. Wei, F.; Feng, N.; Yang, S.; Zhao, Q. A conceptual framework of two-stage partner selection in platform-based innovation ecosystems for servitization. J. Clean. Prod. 2020, 262, 121431. [Google Scholar] [CrossRef]
  17. Robaczewska, J.; Vanhaverbeke, W.; Lorenz, A. Applying open innovation strategies in the context of a regional innovation ecosystem: The case of Janssen Pharmaceuticals. Glob. Transit. 2019, 1, 120–131. [Google Scholar] [CrossRef]
  18. Xu, G.; Wu, Y.; Minshall, T.; Zhou, Y. Exploring innovation ecosystems across science, technology, and business: A case of 3D printing in China. Technol. Forecast. Soc. Chang. 2017, 136, 208–221. [Google Scholar] [CrossRef]
  19. Sun, S.L.; Zhang, Y.; Cao, Y.; Dong, J.; Cantwell, J. Enriching innovation ecosystems: The role of government in a university science park. Glob. Transit. 2019, 1, 104–119. [Google Scholar] [CrossRef]
  20. Madsen, H.L. Business model innovation and the global ecosystem for sustainable development. J. Clean. Prod. 2020, 247, 119102. [Google Scholar] [CrossRef]
  21. Keizer, J.; Halman, J.; Song, M. From experience: Applying the Risk Diagnosing methodology. J. Prod. Innov. Manag. 2002, 19, 213–232. [Google Scholar] [CrossRef]
  22. West, J.; Salter, A.; Vanhaverbeke, W.; Chesbrough, H. Open innovation: The next decade. Res. Policy 2014, 43, 805–811. [Google Scholar] [CrossRef]
  23. Henschel, T. Risk Management Practices of SMEs: Evaluating and Implementing Effective Risk Management Systems. ESV—Erich Schmidt Verlag. (Edwards & Bowen, 2005). 2008. Available online: https://www.researchgate.net/publication/259812085_Risk_Management_Practices_of_SMEs_Evaluating_and_Implementing_Effective_Risk_Management_Systems (accessed on 4 April 2020).
  24. Hülle, J.; Kaspar, R.; Möller, K. Analytic network process—An overview of applications in research and practice. Int. J. Oper. Res. 2013, 16, 172. [Google Scholar] [CrossRef]
  25. Piet, G.J.; Culhane, F.E.; Jongbloed, R.; Robinson, L.; Rumes, B.; Tamis, J. An integrated risk-based assessment of the North Sea to guide ecosystem-based management. Sci. Total. Environ. 2019, 654, 694–704. [Google Scholar] [CrossRef]
  26. Pereira, L.; Tenera, A.; Bispo, J.; Wemans, J. A Risk Diagnosing Methodology Web-Based Platform for Micro, Small and Medium Businesses: Remarks and Enhancements. In Biomedical Engineering Systems and Technologies; Springer Science and Business Media LLC: Berlin/Heidelberg, Germany, 2015; Volume 454, pp. 340–356. [Google Scholar]
  27. PMBOK Guide. A Guide to the Project Management Body of Knowledge: PMBOK Guide. Int. J. Prod. Res. 2017, 53, 13–14. [Google Scholar]
  28. Abreu, A.; Martins, J.D.M.; Calado, J.M. Fuzzy Logic Model to Support Risk Assessment in Innovation Ecosystems. In Proceedings of the 2018 13th APCA International Conference on Control and Soft Computing (CONTROLO), Azores, Portugal, 17 July 2018; Institute of Electrical and Electronics Engineers (IEEE): Piscataway, NJ, USA, 2018; pp. 104–109. [Google Scholar]
  29. Meyer, W.G. Quantifying risk: Measuring the invisible. In Proceedings of the PMI® Global Congress 2015 EMEA, London, UK, 11–13 May 2015; PMI: Newtown Square, PA, USA, 2015. [Google Scholar]
  30. Grace, M.F.; Leverty, J.T.; Phillips, R.D.; Shimpi, P. The Value of Investing in Enterprise Risk Management. J. Risk Insur. 2014, 82, 289–316. [Google Scholar] [CrossRef]
  31. Mansor, N. Risk factors affecting new product development (NPD) Performance in small Medium Enterprises (SMES). Int. J. Rev. Appl. Soc. Sci. 2016, 27, 18–25. [Google Scholar]
  32. Ricardo Ricardo Santos ISEL- Instituto Superior de Engenharia de Lisboa, Instituto Politécnico de Lisboa, University of Aveiro, Portugal GOVCOPP, University of Aveiro; Antonio Antonio Abreu ISEL- Instituto Superior de Engenharia de Lisboa, Instituto Politécnico de Lisboa, CTS Uninova, FCT, Universidade Nova de Lisboa, Portugal; Calado, J.M.; Anes, V. An Approach Based on Fuzzy Logic, to Improve Quality Management on Research and Development Centres. In Proceedings of the 3rd International Conference on Vision, Image and Signal Processing 2019, Vancouver, BC, Canada, 26–28 August 2019; Volume 36, pp. 1–6. [Google Scholar] [CrossRef]
  33. Abreu, A.; Santos, R.; Calado, J.M.; Requeijo, J. A Fuzzy Logic Model to Enhance Quality Management on R&D Units. Kne Eng. 2020, 5, 285–298. [Google Scholar] [CrossRef]
Figure 1. Risk taxonomy adopted (adapted from [21]).
Sustainability 12 06218 g001
Figure 2. Relationship between the ScRScn and system risk (SR).
Sustainability 12 06218 g002
Figure 3. Proposed model.
Sustainability 12 06218 g003
Figure 4. MATLAB implementation, regarding each fuzzy inference system (FIS) considered.
Sustainability 12 06218 g004
Figure 5. FIS surfaces, regarding FIS F1 and related to (a) time (T), (b) performance (P) and (c) cost (C).
Sustainability 12 06218 g005
Figure 6. System developed (views). (a) Conceptual; (b) schematic.
Sustainability 12 06218 g006
Figure 7. Virtual enterprise and diversity of processes involved [10].
Sustainability 12 06218 g007
Table 1. Values regarding the linguistic variable type “probability of occurrence (P)” and pertinence functions.
Pertinence Levels.DescriptionFrequencyFuzzy Parameters
[a, b, c]
RareIt is accounted that the event will happen only in certain circumstances.Event has occurred or is expected to occur once in the next 48 months(0, 0,0.25)
UnlikelyThe event is not likely, although it can occur.Event has occurred or is expected to occur once in the next 24 months(0, 0.25,0.50)
LikelyProbable occurrence eventEvent has occurred or is expected to occur once in the next 18 months(0.25,0.50,0.75)
Very LikelyThe event will likely occurEvent has occurred or is expected to occur once in the next 12 months(0.5,0.75,1.0)
ExpectedThe event is expected to occurEvent has occurred or is expected to occur once in the next 6 months(0.75, 1, 1)
Table 2. Values regarding the linguistic variable type “expected impact (I)” and pertinence functions.
Pertinence LevelsProcess DomainFuzzy
Parameters
(a, b, c)
Time (T)Performance (P)Cost (C)
NeglectableInsignificant impact on the processes required to obtain deliverables. No changes in established activitiesInsignificant impact on the initial project budget (<2%)Timing delay is easily recoverable.(0,0,2.5)
LowPrevents the fulfillment of one or more activities established for each project task. No task changes.Low impact on project budget
(2–5%)
Low schedule delay is not recoverable.(0,2.5, 5.0)
ModeratePrevents the fulfillment of one or more tasks. No requirement changes.Moderate impact on the initial project budget (5–10%) Moderate delay in the completion of the project. Without compromising the project requirements.(2.5,5.0,7.5)
HighPrevents the fulfillment of one or more project requirements. Scope change required.High impact on the initial project budget (10–30%)Acceleration in the fulfillment of tasks with anticipation of the project calendar.(5.0,7.5,10.0)
SevereIt prevents the fulfillment of the project objective(s) and it is not possible to achieve it even with changes in scope.Impact on the initial heavy budget making the project unfeasible (>30%)Project deadline exceeded making it impossible to complete the project since the project is no longer adequate to the organizational reality.(7.5,10.0,10.0)
Table 3. Values regarding the linguistic variable type “risk level (R)” and pertinence functions.
Pertinence LevelsDescriptionFuzzy
Parameters
(a, b, c)
Very lowRisk can be accepted as it does not pose a threat to the project/organization, it must be monitored to ensure that its level does not change.(0, 0, 0.25)
LowRisk can be accepted. Risk control must be carried out based on a cost–benefit analysis(0, 0.25, 0.50)
ModerateRisk must be mitigated; the effectiveness of controls must be monitored.(0.25, 0.50, 0.75)
HighEfforts should be made to mitigate risk as soon as possible.(0.50, 0.75,1.0)
Very HighImmediate action must be taken to mitigate the risk.(0.75, 1.0, 1.0)
Table 4. Variable types used: linguistic values and the correspondent numeric ones.
Variable Type
Impact of OccurrenceProbability of OccurrenceRisk of Occurrence
Linguistic LevelsNumeric CorrespondenceLinguistic LevelsNumeric CorrespondenceLinguistic LevelsNumeric Correspondence
Insignificant[0,2]Very Low[0,0.2]Very low[0,2]
Low[2,4]Low[0.2,0.4]Low[2,4]
Moderate[4,6]Moderate[0.4,0.6]Moderate[4,6]
High[6,8]High[0.6,0.8]High[6,8]
Severe[8,10]Very High[0.8,1.0]Very high[8,10]
Table 5. Process description and partners involved (based on [10]).
Pr.Ref.DescriptionPartners Involved
1K01Pr1Consumer requirementsP8, P7
2K02Pr3PV system designP3, P12
3K87Pr4System deployment (tests on site)P3
4K01Pr6Human machine interface (HMI)P6 e P7
5K02Pr5Systems tests on labP2, P6 e P12
6K01Pr6General system monitoring and controlP2, P8
7K01Pr6Fuel tanks designP9, P10
8K01Pr6Fuel cellP4, P9
9K01Pr6Preliminary studies (solar irradiation on site, load diagram, other measures)P12
10K01Pr6electrolyzerP2
11K01Pr6Sensors & actuators (valves, electric valves, tubes, temperature, pressureP9, P10
12K01Pr6power convertersP8, P11
Table 6. Fuzzy inference system (FIS) inputs used; FIS F1, FIS F2 and FIS F3.
FIS F1
N.Sc.TIScnTPScnPIScnPPScnCIScnCPScn
Inputs1InsignificantLowLowRareLowUnlikely
2LowModerateLowUnlikelyModerateUnlikely
3InsignificantLowModerateLikelyLowLikely
4InsignificantHighSevereVery LikelyHighUnlikely
5LowModerateModerateExpectedModerateExpected
6ModerateExpectedInsignificantRareInsignificantVery Likely
7ModerateUnlikelySevereUnlikelyModerateVery Likely
8HighLikelyModerateVery LikelyModerateRare
9SevereVery LikelyLowUnlikelyLowUnlikely
10LowLikelySevereLikelySevereRare
11LowRareLowExpectedSevereUnlikely
FIS F2
Sc.TIScn→SPIScn→SCIScn→STIScn→OPIScn→OCIScn→OTIScn→MPIScn→MCIScn→M
Inputs1InsignificantInsignificantHighInsignificantInsignificantInsignificantLowInsignificantHigh
2LowModerateLowSevereModerateLowInsignificantSevereLow
3ModerateModerateModerateModerateInsignificantModerateModerateModerateModerate
4SevereModerateHighHighModerateHighLowHighHigh
5ModerateSevereLowModerateLowSevereLowSevereLow
6InsignificantModerateModerateModerateLowInsignificantLowInsignificantModerate
7SevereModerateModerateSevereSevereHighModerateLowInsignificant
8ModerateInsignificantSevereModerateInsignificantModerateModerateHighModerate
9LowLowModerateInsignificantHighLowInsignificantLowModerate
10ModerateModerateHighModerateLowLowInsignificantModerateHigh
11SevereModerateLowInsignificantInsignificantModerateHighModerateLow
12ModerateInsignificantModerateHighHighModerateLowLowModerate
FIS F3
Sc.I → SP → SI → OP → OI → MP → MI → SDP → SDInfSRScn
Inputs1InsignificantRareHighRareInsignificantRareModerateRareInsignificant
2ModerateUnlikelyLowUnlikelyModerateUnlikelySevereUnlikelyLow
3InsignificantUnlikelyModerateUnlikelyModerateLikelyModerateUnlikelyModerate
4ModerateVery LikelyHighVery LikelyModerateVery LikelyHighVery LikelyHigh
5LowVery LikelyLowVery LikelySevereExpectedSevereVery LikelySevere
6LowRareModerateRareModerateRareSevereRareInsignificant
7SevereUnlikelyInsignificantUnlikelyModerateUnlikelyInsignificantUnlikelyLow
8InsignificantVery LikelyModerateVery LikelyInsignificantVery LikelyLowVery LikelyLow
9HighUnlikelyModerateUnlikelyLowUnlikelySevereUnlikelyModerate
10LowLikelyHighLikelyModerateLikelyModerateLikelySevere
11InsignificantExpectedLowExpectedModerateExpectedModerateExpectedModerate
12HighLikelyModerateLikelyInsignificantExpectedInsignificantLikelyInsignificant
Table 7. Fuzzy inference system (FIS) outputs used.
FIS F1FIS F2FIS F3
Sc.TRScnPRScnCRScnIScn→SIScn→OIScn→MSRScn
Outputs1Very LowLowLowLowVery LowLowVery Low
2ModerateLowLowModerateHighModerateLow
3Very LowModerateLowModerateModerateModerateModerate
4ModerateSevereHighHighModerateHighHigh
5HighLowModerateHighModerateLowHigh
6LowModerateVery LowModerateLowLowModerate
7ModerateModerateModerateModerateSevereLowLow
8HighHighModerateHighModerateModerateLow
9HighLowLowLowModerateLowHigh
10ModerateModerateHighModerateLowModerateModerate
11LowModerateHighModerateVery LowModerateModerate
12LowModerateModerateModerateHighLowVery Low
Table 8. Outputs, regarding the system component risk (ScR) level.
Sc.TRScnPRScnCRScnωTRnωPRnωCRnSystem Component Risk (ScRScn)
11.92.13.70.320.260.422.7
24.32.53.10.260.230.513.3
32.05.62.50.290.210.503.0
45.48.76.90.410.190.406.6
57.33.45.90.360.140.506.1
62.14.81.70.270.210.522.5
74.45.54.10.310.210.484.5
87.57.14.90.180.260.565.9
96.23.12.70.420.180.404.2
105.15.87.80.380.130.496.5
112.84.27.20.380.140.485.1
123.94.95.60.360.140.504.9
Table 9. Outputs regarding the system risk (SR) level.
Sc.IScn → SIScn → OIScn → MMax
{IScn → SD}
Max
{SIScn,
PIScn,CIScn}
ωInd.nωDir.nInfSRScnMax
{ISR → SD x PSR → SD}
SRScnωScnSRScn x ωScn
PRScnTRScn
12.81.82.62.83.70.610.393.151.51.91.50.070.11
24.17.84.77.84.30.280.725.283.84.34.70.080.38
34.74.75.15.15.60.460.545.375.825.80.010.06
46.75.97.17.18.70.510.497.887.85.47.80.070.55
57.15.72.17.17.30.460.547.216.77.36.70.080.54
64.72.32.84.74.80.620.384.744.62.14.60.090.41
75.29.23.79.25.50.110.895.912.94.43.80.080.30
86.44.25.26.47.50.460.546.993.27.56.30.090.57
92.44.83.14.86.20.560.445.427.46.27.40.090.67
104.33.15.85.87.80.570.436.665.95.15.70.090.51
114.91.15.45.47.20.660.446.736.22.86.30.130.82
125.86.53.86.55.60.640.366.180.83.94.10.120.49
system risk (SR)5.40

