1. Introduction
Transportation has a crucial role in shaping cities’ development and raising people’s quality of life in modern times. The improvement of transportation conditions continues to enhance regional economic efficiency and competitiveness, which contributes to the rise in living standards [
1]. Rapid urbanization in China has strengthened the connection and cooperation among cities, and has also led urban residents to be more vulnerable to adverse environmental conditions [
2]. Public safety is necessary to achieve sustainable development, which is considered to be a significant indicator in urban sustainability evaluation. Transportation safety is an indispensable section of public safety [
3]. It is therefore necessary to strengthen the research on traffic safety to promote the sustainable development of cities.
Historically, most research has emphasized the micro level of traffic safety, focusing on traffic accidents from the perspective of influencing factors and behaviors [
4,
5,
6]. However, a more comprehensive view of traffic safety in light of the whole transportation network has been gaining importance in the recent years, including a number of studies assessing the impact of extreme weather events [
7,
8,
9,
10,
11,
12] and intentional attacks [
13,
14,
15] on transportation networks. The concept of vulnerability, which originated from social economics, was first defined in the transportation network in 2002 as a susceptibility to incidents that can lead to insufficient service provision [
16]. The term has thereafter increasingly been used in the field of transportation. To assess the vulnerability of various transportation systems at the topological level, most studies use the complex network theory [
17,
18,
19,
20,
21,
22], in which the system is analyzed through a graph of nodes and links. In response to the heightened demand for transportation sustainability, scholars have focused on identifying ways to mitigate the impact of disruptions in the network, in order to ensure the continuous functionality of the system. The extensive impact that the vulnerability conditions of critical links or key nodes can have on the entire network has led to a recent proliferation of studies focusing on the significant links and nodes via complex network theory [
23,
24,
25].
However, whilst scholars have studied the actual road, air and rail transit network based on the complex network theory [
24,
26,
27,
28,
29,
30,
31], there were few empirical investigations into the layout of transportation hubs before O’Kelly’s pioneering work [
32,
33]. His landmark publications triggered a surge in research on transportation hub locations, centered on cost saving and the optimal routing of freight and passengers [
34,
35]. However, the complicated formulations and the solution techniques from these researches are not applicable to real-world layouts, especially in large-scale and long-term plans. There are few studies that take into account the geopolitical influence and socioeconomic aspects of hub location problems, which are essential factors in a national plan. The national plan also calls for the evaluation of vulnerability in order to attain security and sustainable development in the raw events of unforeseen disasters and possible disruptions on hubs and corridors.
In view of all that has been mentioned so far, few studies have investigated the national layout of transportation hubs in the context of their socioeconomic conditions and vulnerability. The aim of this study is to address these gaps and provide planners, policy makers and the general public with insights about the vulnerability of transportation network. In this context, we explored the characteristics of the China Comprehensive Transportation Corridors and Hubs (CCTCH) and studied the traffic sustainability based on its vulnerability. Such research will foster transportation hubs and networks’ development, advancing the sustainability of the whole national transportation system.
The remainder of this paper is organized as follows.
Section 2 introduces the data of CCTCH, the network model, and the evaluation method for multimode transportation networks. In
Section 3, the application of the proposed method to the CCTCH network is analyzed and discussed. Finally, the conclusions are presented in
Section 4.
2. Materials and Methods
2.1. Data
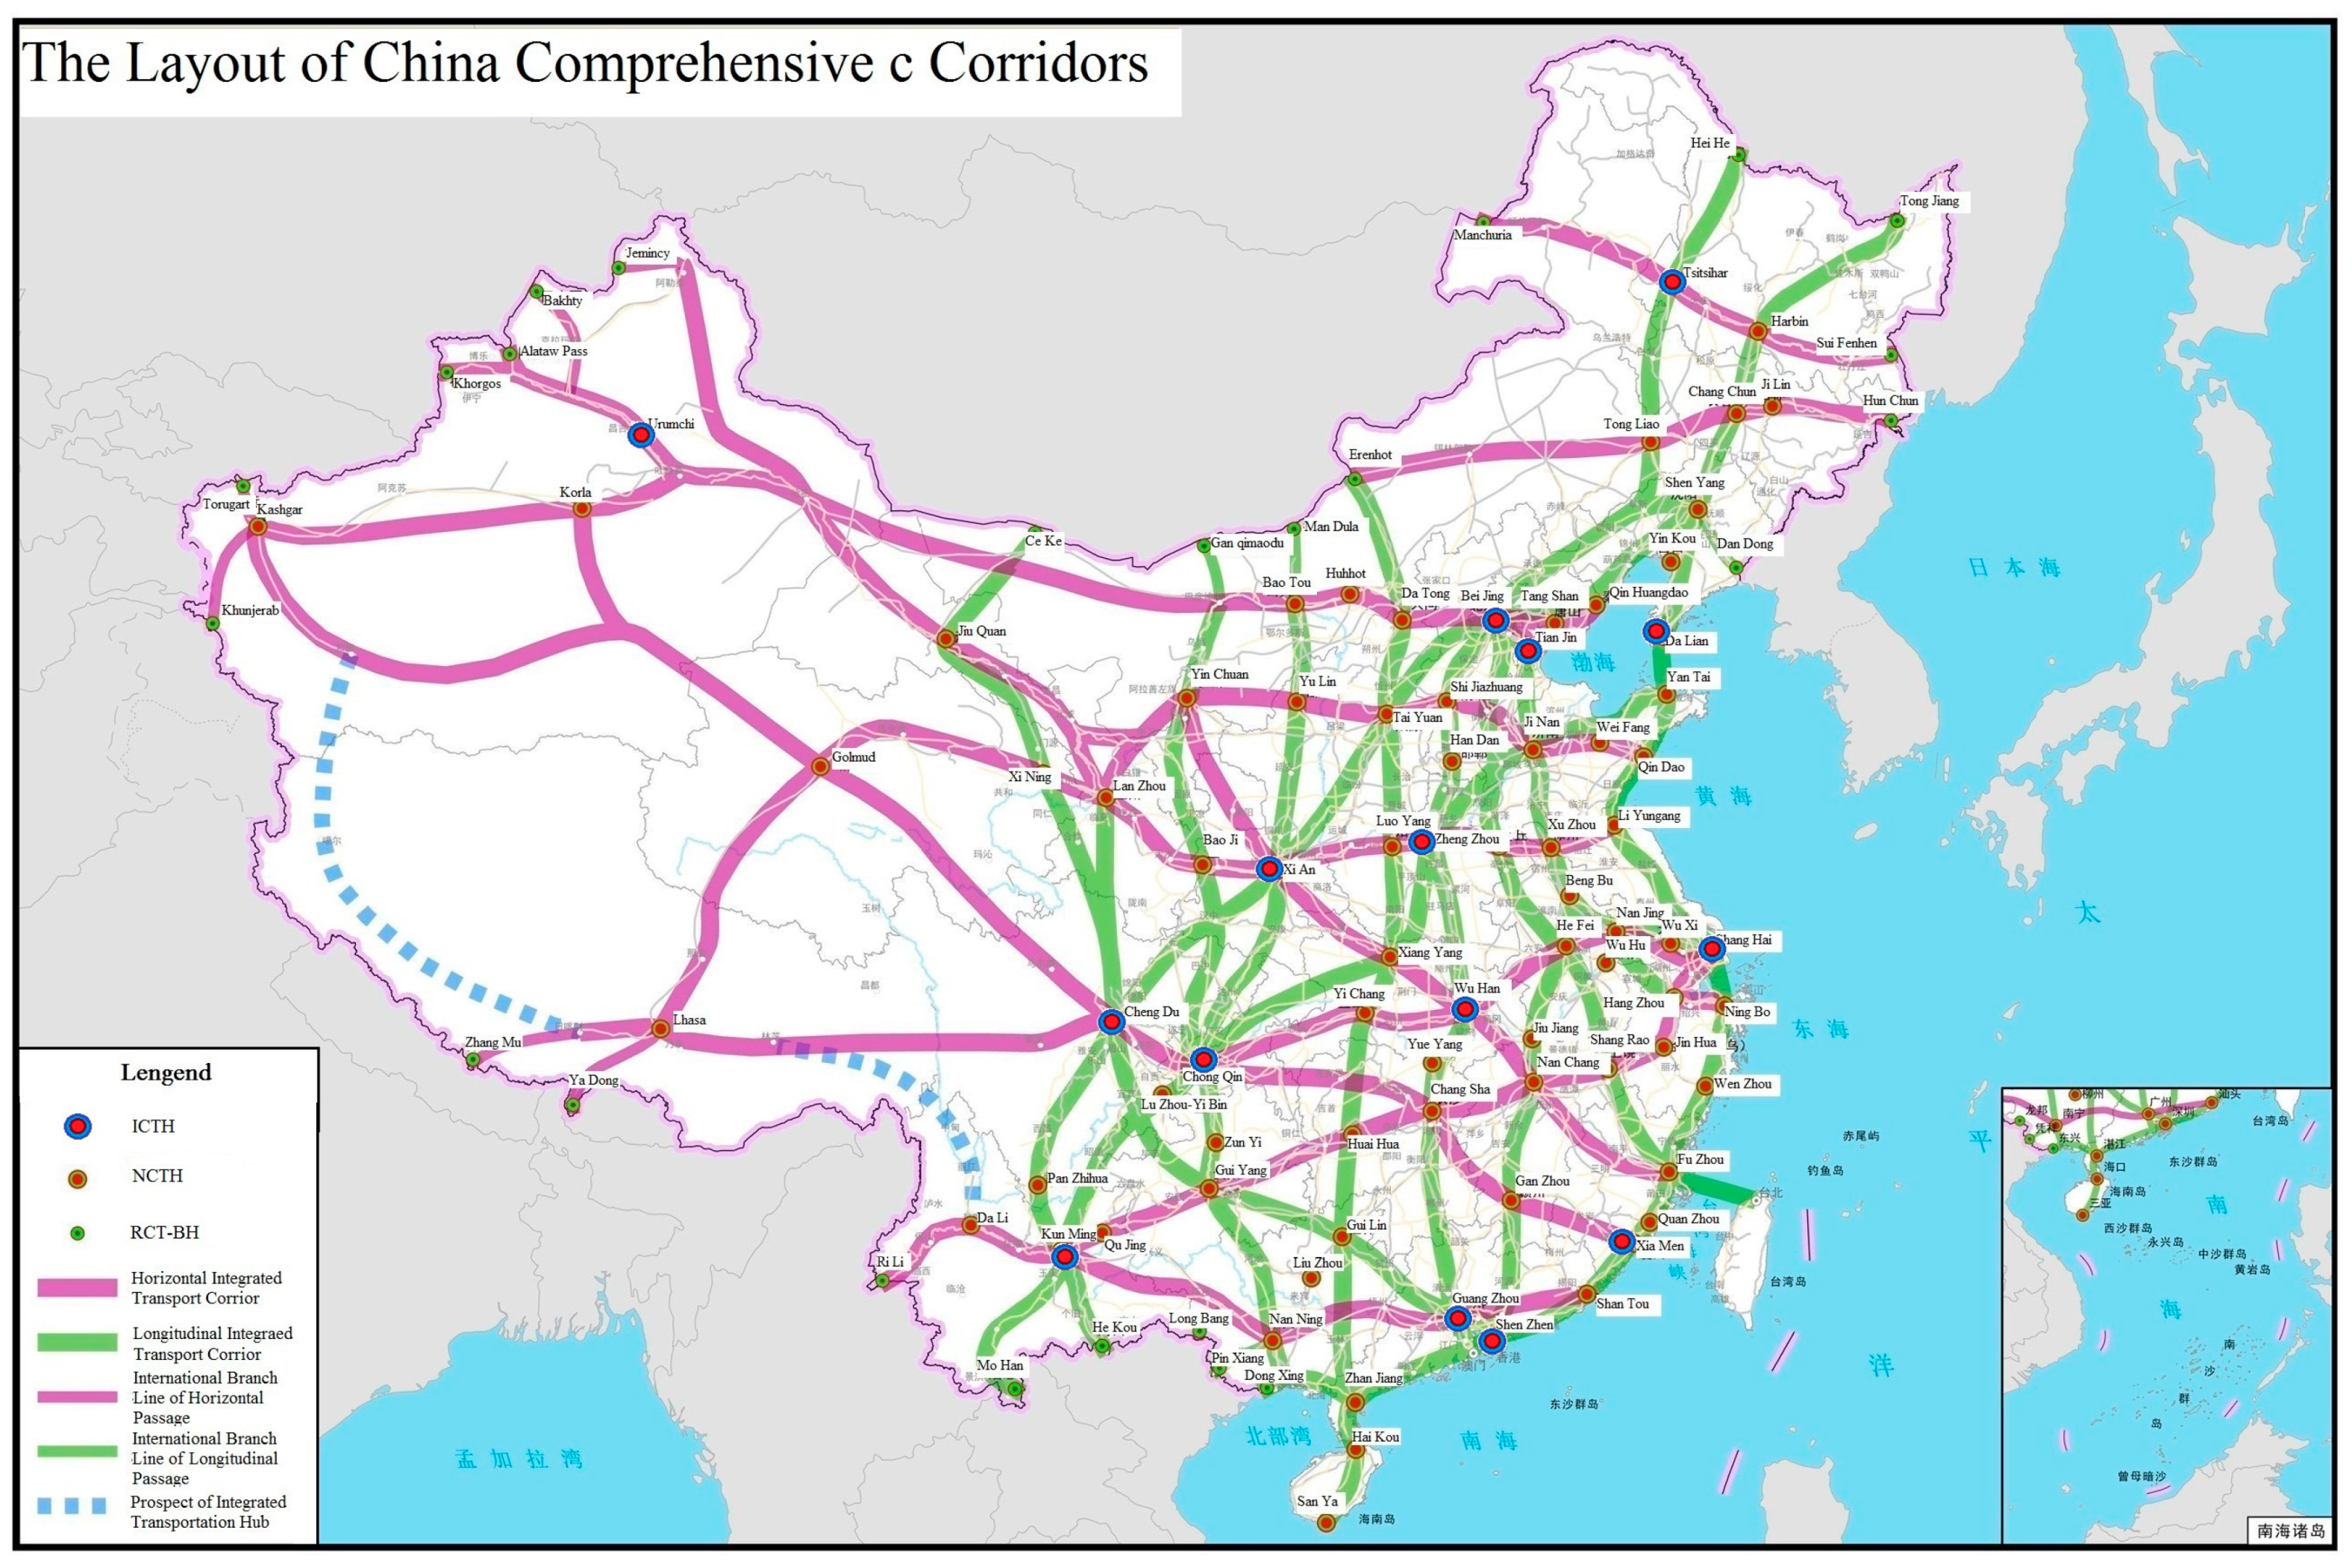
2.1.1. The Layout of the China Comprehensive Transportation Corridors
Transportation networks are essential constituent elements that play critical roles in maintaining national security and socio-economic prosperity. Hence, China’s 13th Five-Year Plan for Transportation outlined ambitious targets—by 2020, China will have built a comprehensive modern transportation system that is safe, convenient, efficient and green. According to the plan, “ten verticals and ten horizontals” will be constructed [
36]. A summary of the corridors of the CCTCH is listed in
Table 1.
2.1.2. The Layout of the China Comprehensive Transportation Hubs
Prior to undertaking the investigation, the hubs listed in the plan were divided into regional, national, and international comprehensive transportation hubs and border hubs, as shown in
Table 2. The classification and layout plan of the hubs came from the 13th Five Year Plan of Transportation [
36], which was intended to build three types of comprehensive transportation hub; namely, international, national, and regional comprehensive transportation hubs and border hubs. The goal of the international comprehensive transportation hub is to strengthen the comprehensive service of international personnel exchange, logistics distribution and transfer, so as to create transportation centers with global connectivity, high efficiency and perfect functions; the national comprehensive transportation hub is positioned to optimize the transfer facilities and collection and distribution network, promote the coordination and efficiency of various transportation modes, and expand the radiation range. The regional comprehensive transportation hubs and border hubs aim to be an impetus to the surrounding areas, and to support the corridors and national comprehensive transportation hubs. The specific planning and layout scheme is shown in
Figure 1.
Then, a value was assigned to each type for data analysis.
2.2. Network Model
In the last few years, considerable attention has been paid to the complex network theory for analyzing traffic network. According to the corresponding relationship with real traffic networks, both the primal method and dual method are the basic types of network abstraction by means of the complex network theory. Traditionally, due to its simple and intuitive attributes, scholars have always chosen the primal method, which can also retain the geographical correlation [
24]. In the same vein, the primal method was adopted to abstract the network in this paper.
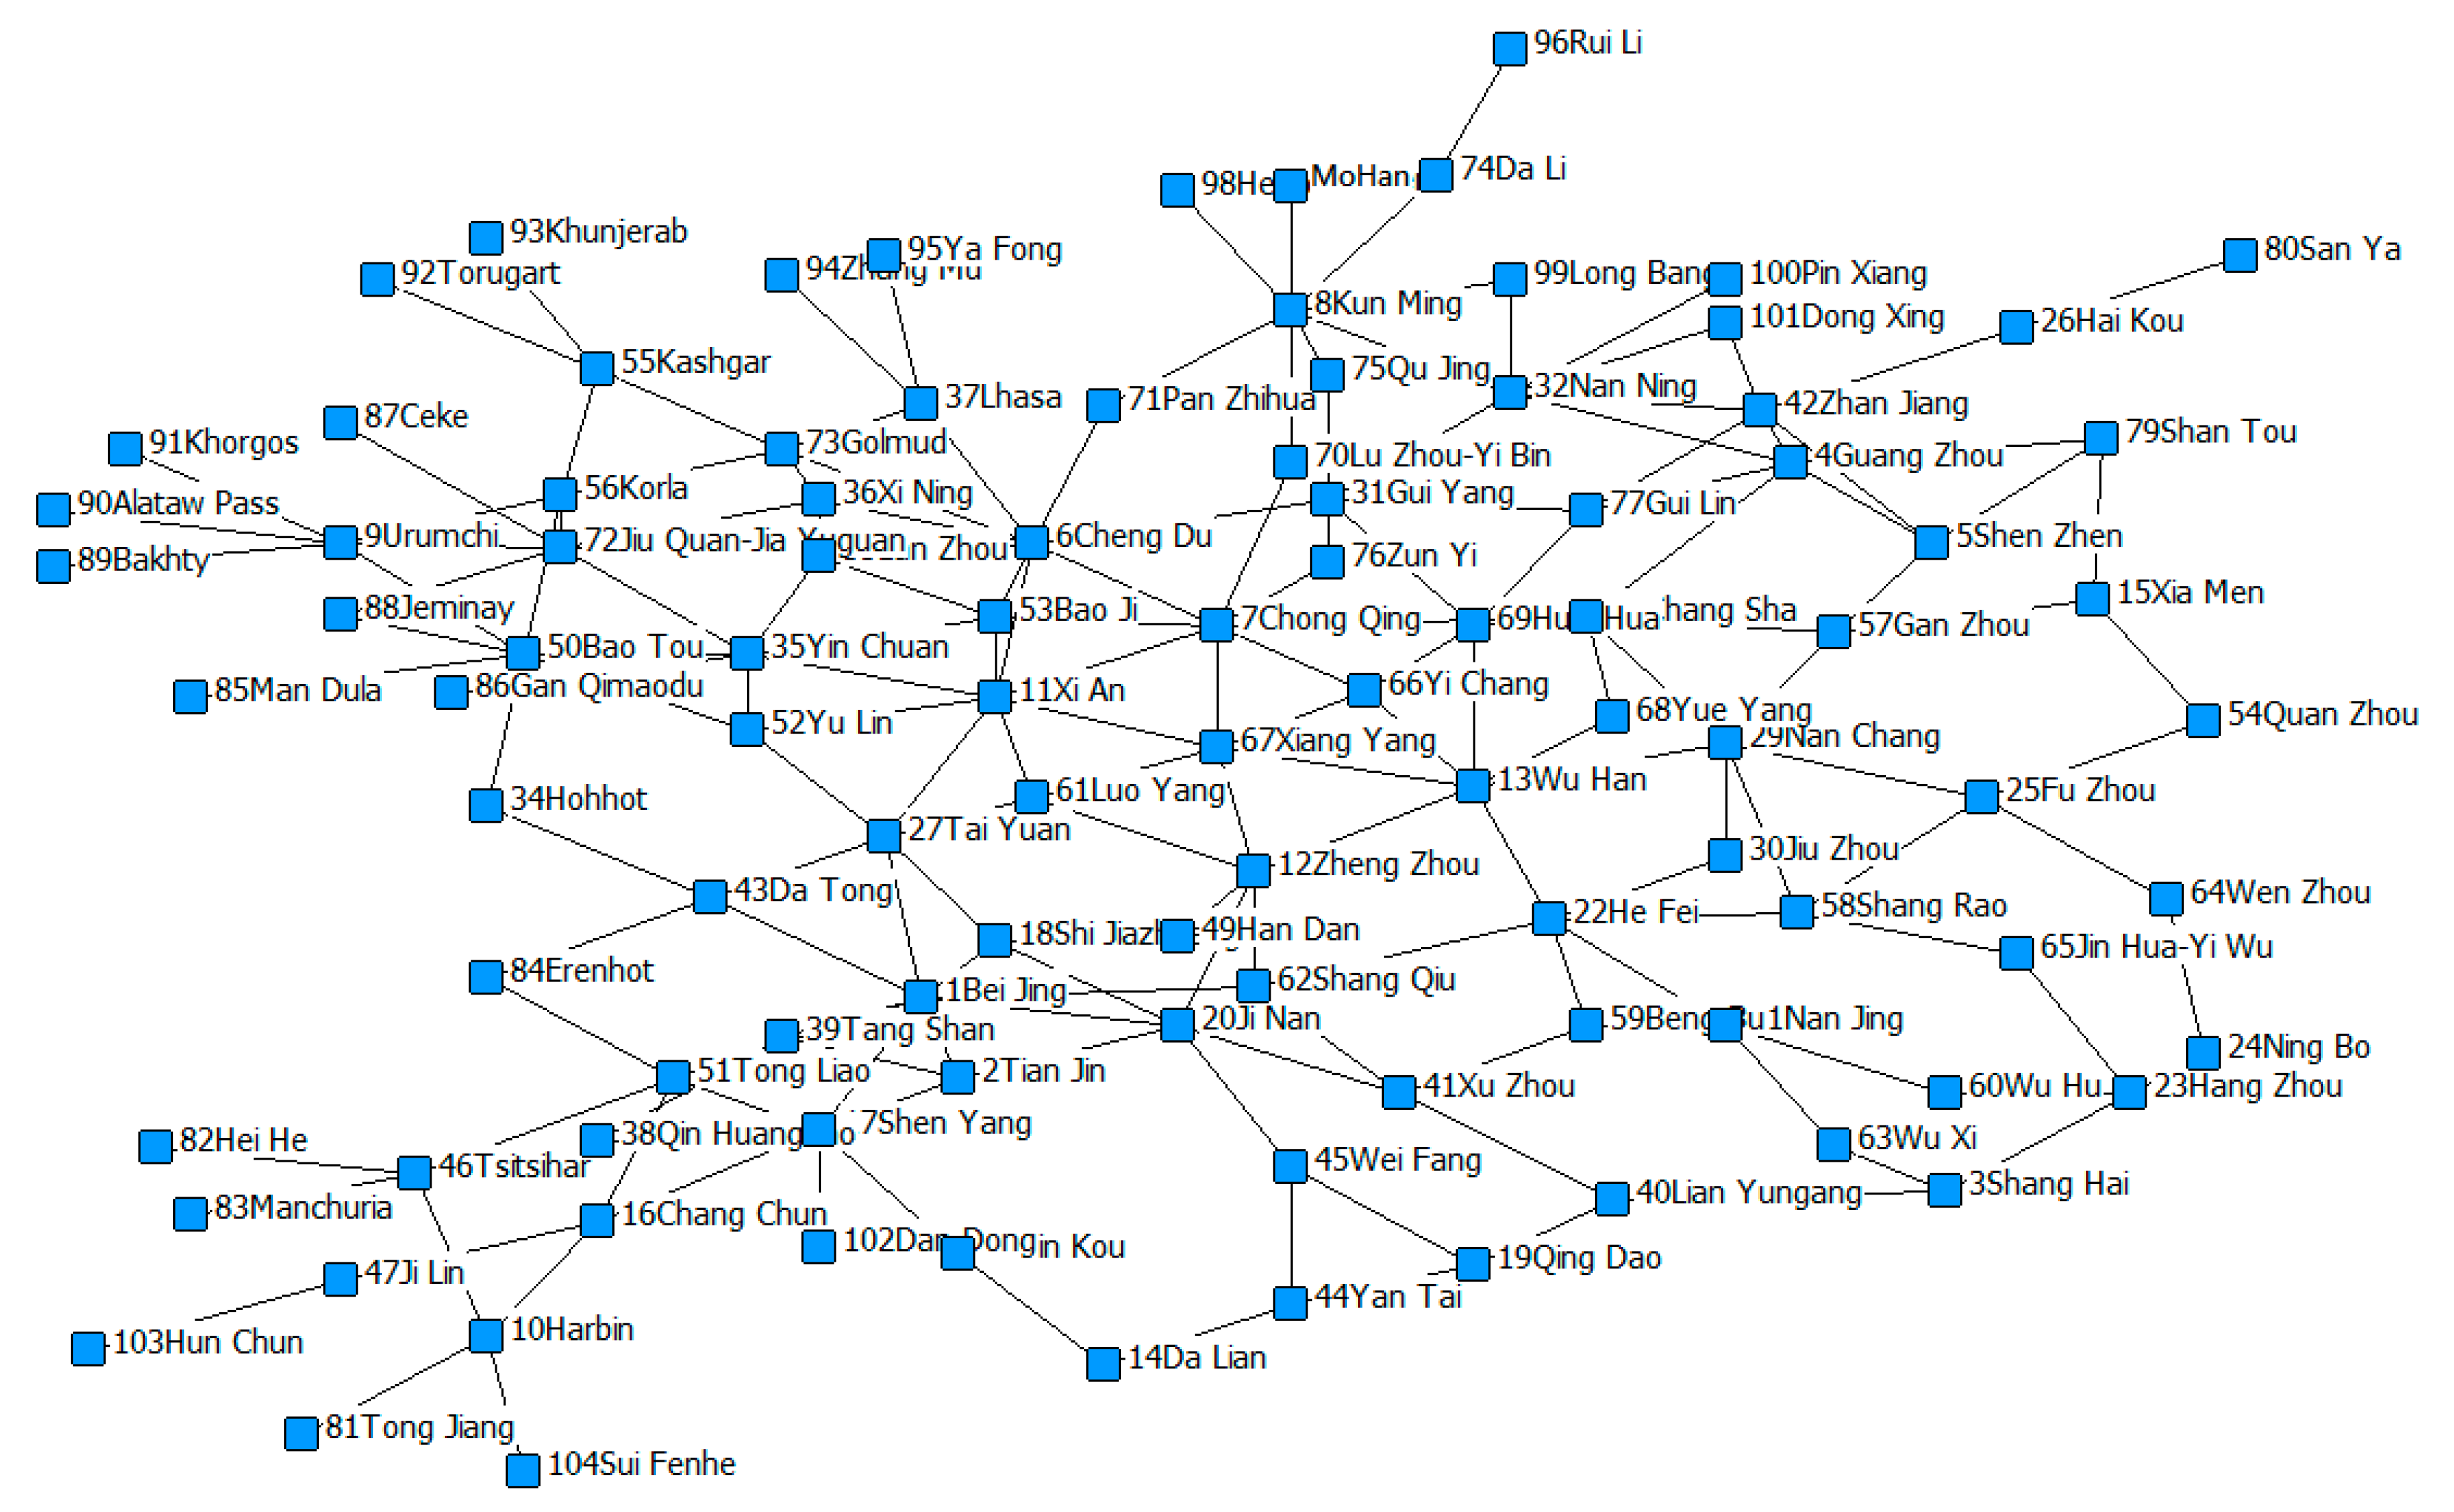
The topology structure of the CCTCH was extracted, and is given in
Figure 2, including node numbers and hub city names. The network is described by an undirected graph G (N, E), where node set N indicates comprehensive transportation hubs N(1,2,3,…,n), and the link set
indicates corridor segments between the hubs. The value
in the adjacency matrix A is assigned to nodes i and j, which represent the topological relationship i.e. 1 denotes adjacency, and 0 otherwise.
2.3. General Properties
The notations used in this section are explained in
Table 3, and the general network properties are summarized in
Table 4. The degree is the number of edges connected with the node, and betweenness is defined as the number of the shortest paths that pass through the node. These two indicators are common measures of node centrality. As for the whole network, the degree centrality obeys Equation (1), by normalizing the differences between the largest degree and the given node [
37]. Similarly, the betweenness centrality is defined by Equation (2). As shown in
Table 4, the relatively low density indicates low correlation among comprehensive transportation hubs, which means that the network is generally fragile.
As for the path distance,
Table 5 presents the shortest path distances between the network nodes, and the corresponding frequency of each distance. It is apparent that the highest frequency of path distance is 5, with 1791 times, and the average path distance is 5.007. The results show that the path distance between most nodes in the network lies in the range of 3 to 7. Most nodes can be connected by 2 to 6 intermediate nodes, with an average of 4 nodes.
2.4. Correlation Analysis
Correlation analysis is a standard statistical method that can reveal the correlation between two or more variables. Linear correlation coefficient r is calculated as follows:
where
and
represent the mean values of variable x and y, respectively. The magnitude of r determines the strength of the correlation, as shown in
Table 6.
In order to explore whether the hub type in the planning is related to the two different identifications from the centrality of the complex network (degree and betweenness), and whether there is a correlation between the important nodes obtained by the two measurements, three groups of experiments were designed, respectively, for the correlation analysis, as shown in
Table 7 (Experiments 1–3). From the perspective of the economy and society, it is necessary to make better use of the CCTCH for the cities with developed economies and large populations, in order to meet the strong travel and freight demand. The transportation hubs which provide services for participants to travel or transport goods should be closely related to the GDP, number of permanent residents or GDP per capita from the perspective of population and economy. Therefore, we arranged the correlation analysis of GDP, population, GDP per capita and hub type, as shown in
Table 7 (Experiments 4–6).
2.5. Vulnerability Assessment
In the case of terrorist attacks, the cascading failure of some important nodes will affect the transportation efficiency of the network. Some cities are even completely isolated from the whole network, resulting in inefficient transportation before the services’ restoration. How much impact on the overall performance of the network will there be after partial damage? What are the differences among the consequences of various disruptions? We used vulnerability to quantify the impact on the overall performance of the network. A reasonable network design has high robustness, low vulnerability and shows little impact of node connectivity failure. However, there is no absolutely invulnerable network. Therefore, the weakness of the planning network can be found by vulnerability analysis, in order to improve the robustness of the network by modification. Especially for the transportation network between some specific origins and destinations, vulnerability analysis could provide a decision reference for targeted enhancement.
2.5.1. Main Measures of Network Performance
To assess vulnerability, two indicators were selected, considering the whole network and specific issues [
24,
25].
- 1.
Efficiency E (k)
The efficiency between two nodes (i, j) is defined by Equation (4). k denotes the value of the networks at phase k,. denotes the shortest path between node i and node j. The efficiency is defined as the normalized average value of the inverse of the shortest path distance between any two nodes, which reflects the connectivity and the invulnerability of the whole network.
- 2.
Origin–destination considered efficiency ODE(k)
The
only considers the shortest path between the origin nodes and the destination nodes. It can be calculated using Equation (5).
where
and
represent the set of origin nodes and destination nodes of the planning network, respectively.
2.5.2. Node Failure Simulation
In this paper, from the perspective of the vulnerability of the comprehensive transportation network, the safety and reliability characteristics of the macro transportation network were investigated. Natural disasters such as floods and earthquakes will lead to the random failure of nodes; however, what is the impact on the connectivity and network efficiency due to terrorist attacks on important nodes? Three types of node failure sequences were adopted to simulate the deliberate destruction scenarios aimed at cities with high network centrality and advanced economies. The system simulation encountered three types of node failure scenarios, i.e., destroying hubs in a descending sequence of degree (DD), betweenness (DB) and average GDP (DGDP). The top 36 cities of three rankings are shown in
Table 8.
2.5.3. Vulnerability Assessment Model
Similar to the measures of the network performance, both the whole network and the situation of specific issues are concerned.
- 1.
The influence of node disruption on network efficiency
is defined as follows:
where
represents the efficiency of the network at phase
k,
k is the number of attack nodes, and
denotes the initial state.
, when the network efficiency is not affected, ; when the network efficiency is greatly affected, it will be directly reduced to 0, . At the same k/n, a higher stands for a network with greater invulnerability.
- 2.
The influence of node disruption on origin–destination considered efficiency
has the same range and features as
, and obeys:
where
represents the origin–destination considered efficiency at phase
k,
k is the number of attack nodes, and
denotes the initial state.
3. Results
3.1. Topological Characteristics of the CCTCH
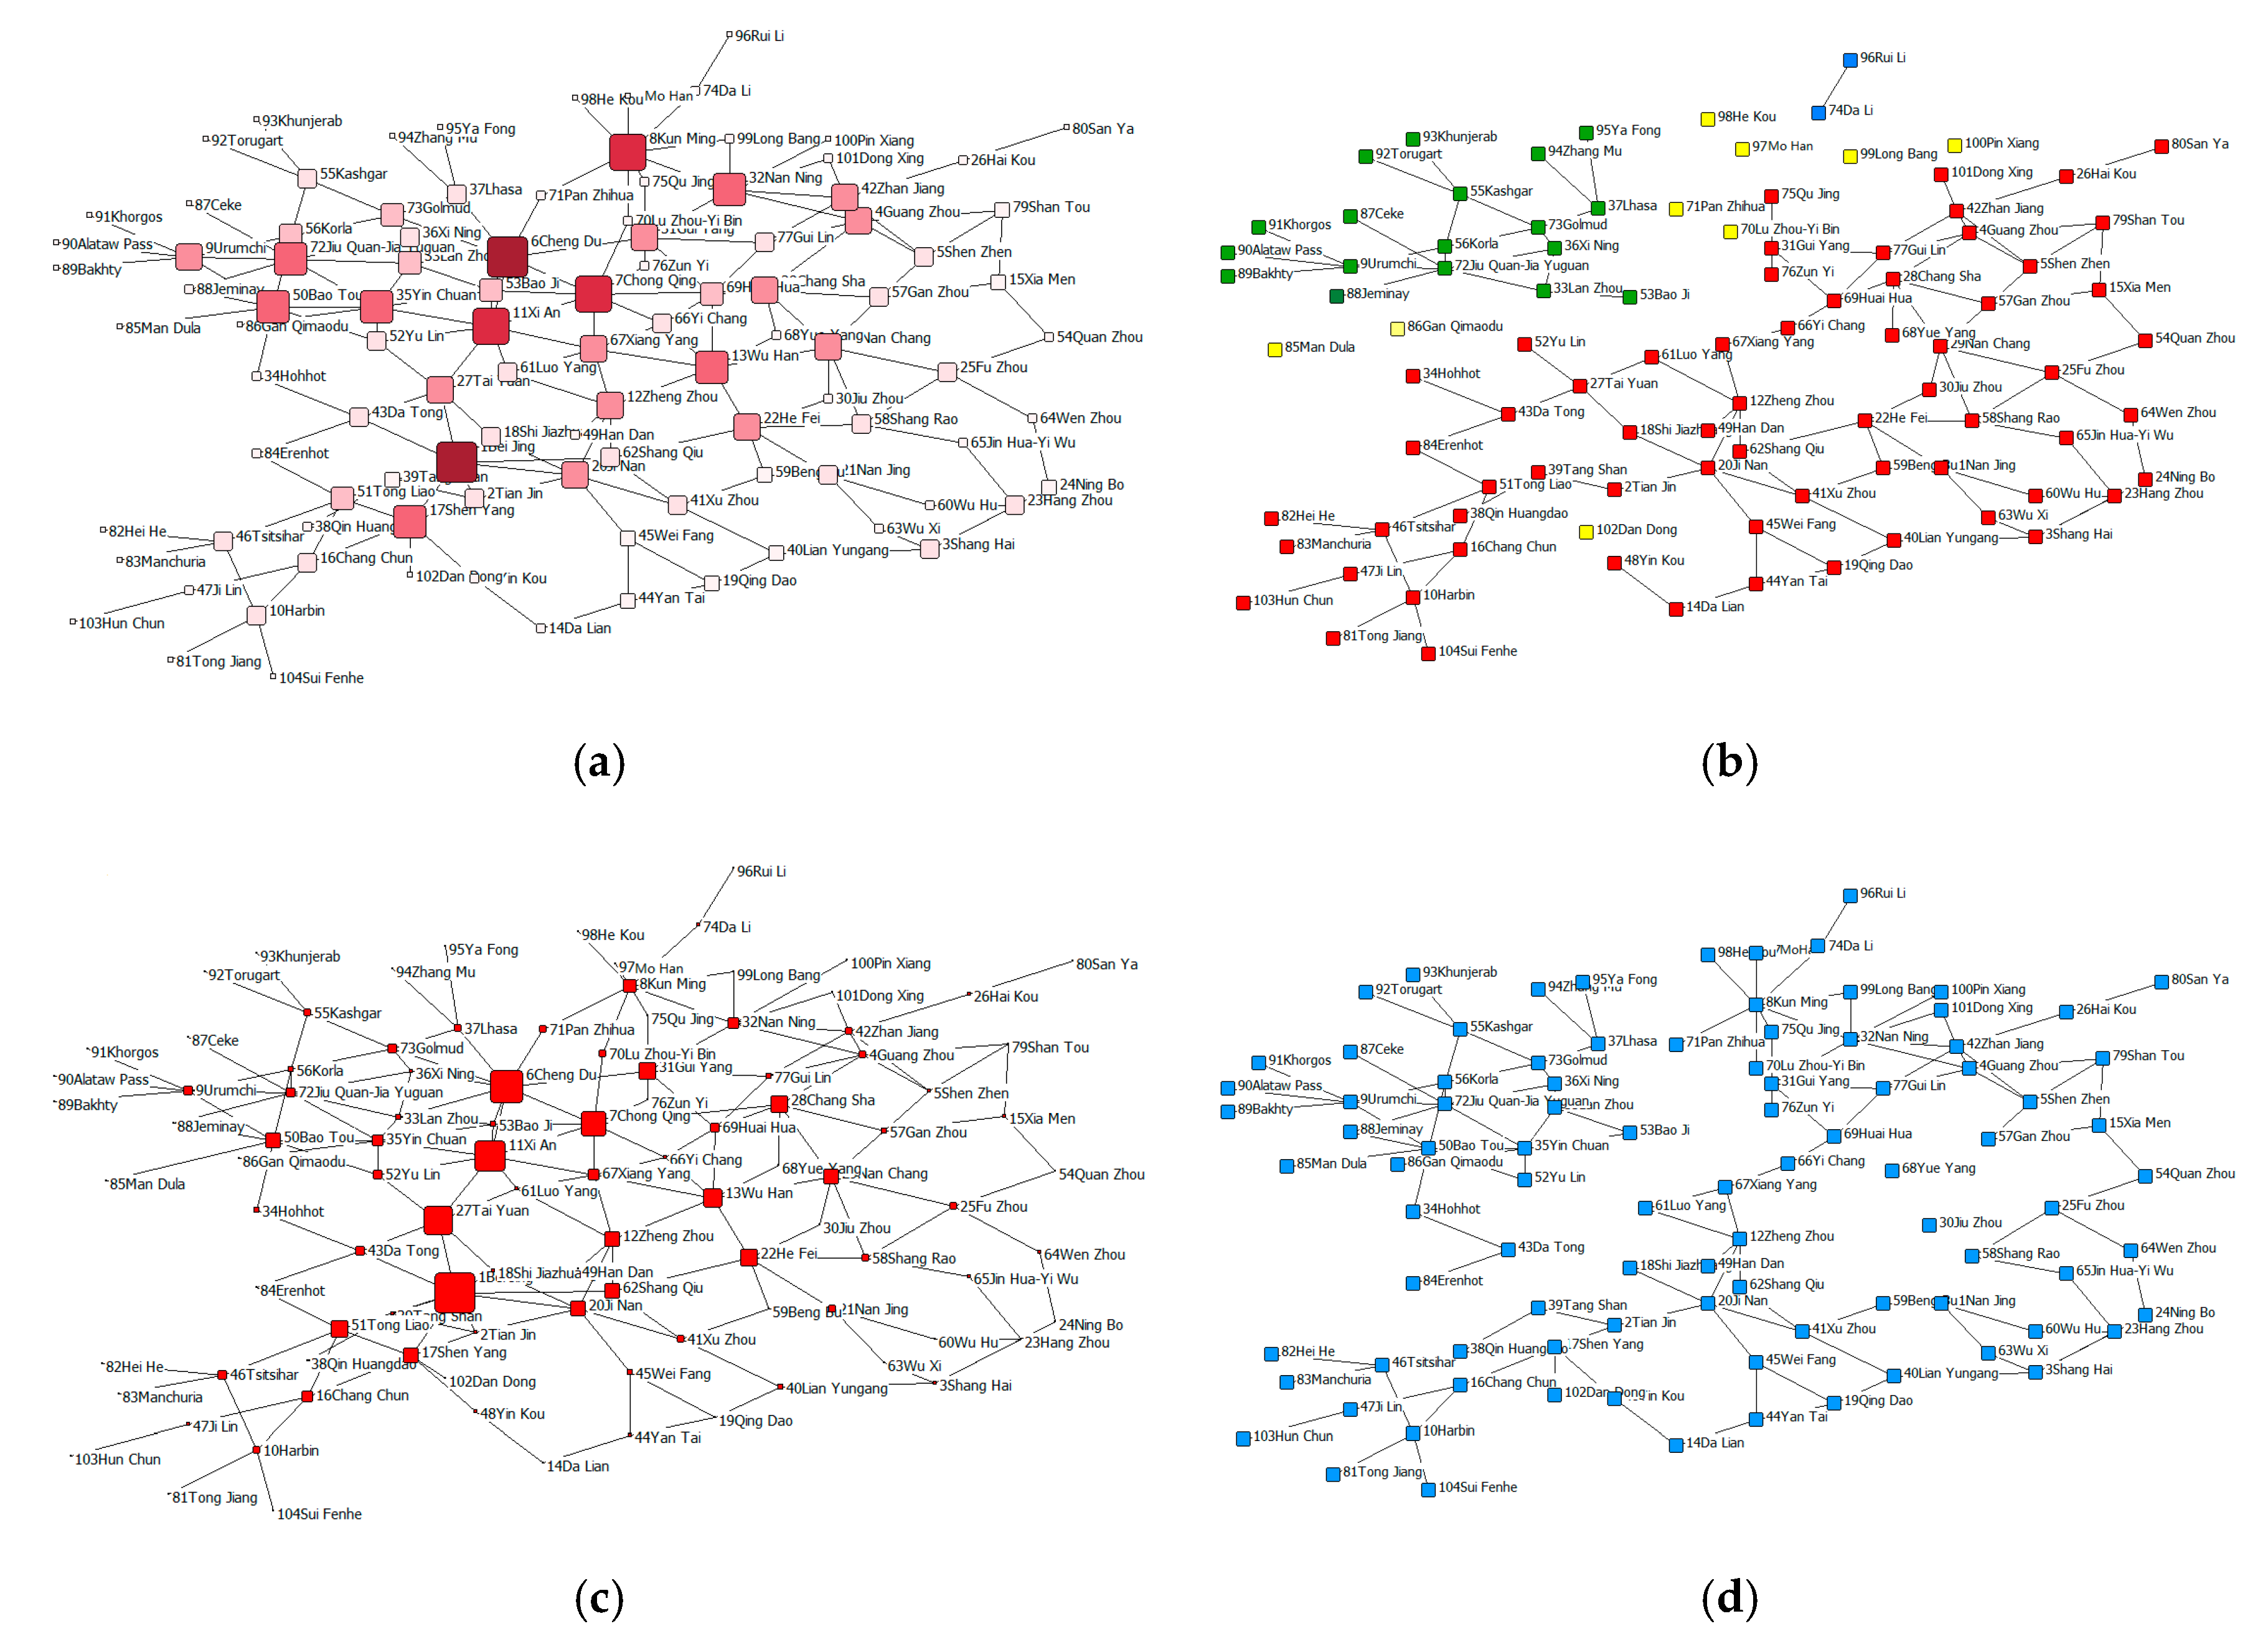
Figure 3a,c show the importance of nodes based on their degree and betweenness. In
Figure 3a, a node a darker color and larger size means a greater degree. When the top ten nodes by degree and betweenness are out of service, the topology reconfigurations of the networks are presented in
Figure 3b,d, respectively.
It can be seen that the whole network is divided into three parts (nodes in red, green and blue) without the connections of corridors in the case of high-degree nodes’ deletion, mainly cutting off the transportation connection between the western region and others. The red indicates the remaining central and eastern parts of the network, the green represents the rest of the nodes lying to the west of Baoji, and the blue nodes mean two cities, Ri Li and Da Li, connected in the southwest. In addition, nine nodes in yellow (Luzhou-Yibin, Panzhihua, Mandala, Ganqimaodu, Ceke, Jimunai, Mohan, Hekou and Dandong) cannot be interconnected with others through the comprehensive transportation corridors. Among them, seven nodes are the border hubs connecting the international transportation corridors, mainly including the hubs of Outer Mongolia, North Korea and Hanoi.
However, this presents weak influence on the overall connectivity of the network for betweenness nodes’ deletion. The western region and others are separated. Besides this, two isolated nodes (Yueyang and Jiujiang) have emerged, which indicate that hubs adjacent to Yueyang and Jiujiang are nodes with high frequencies of passing by.
3.2. Correlation Analysis of Different Factors and Type of Hub
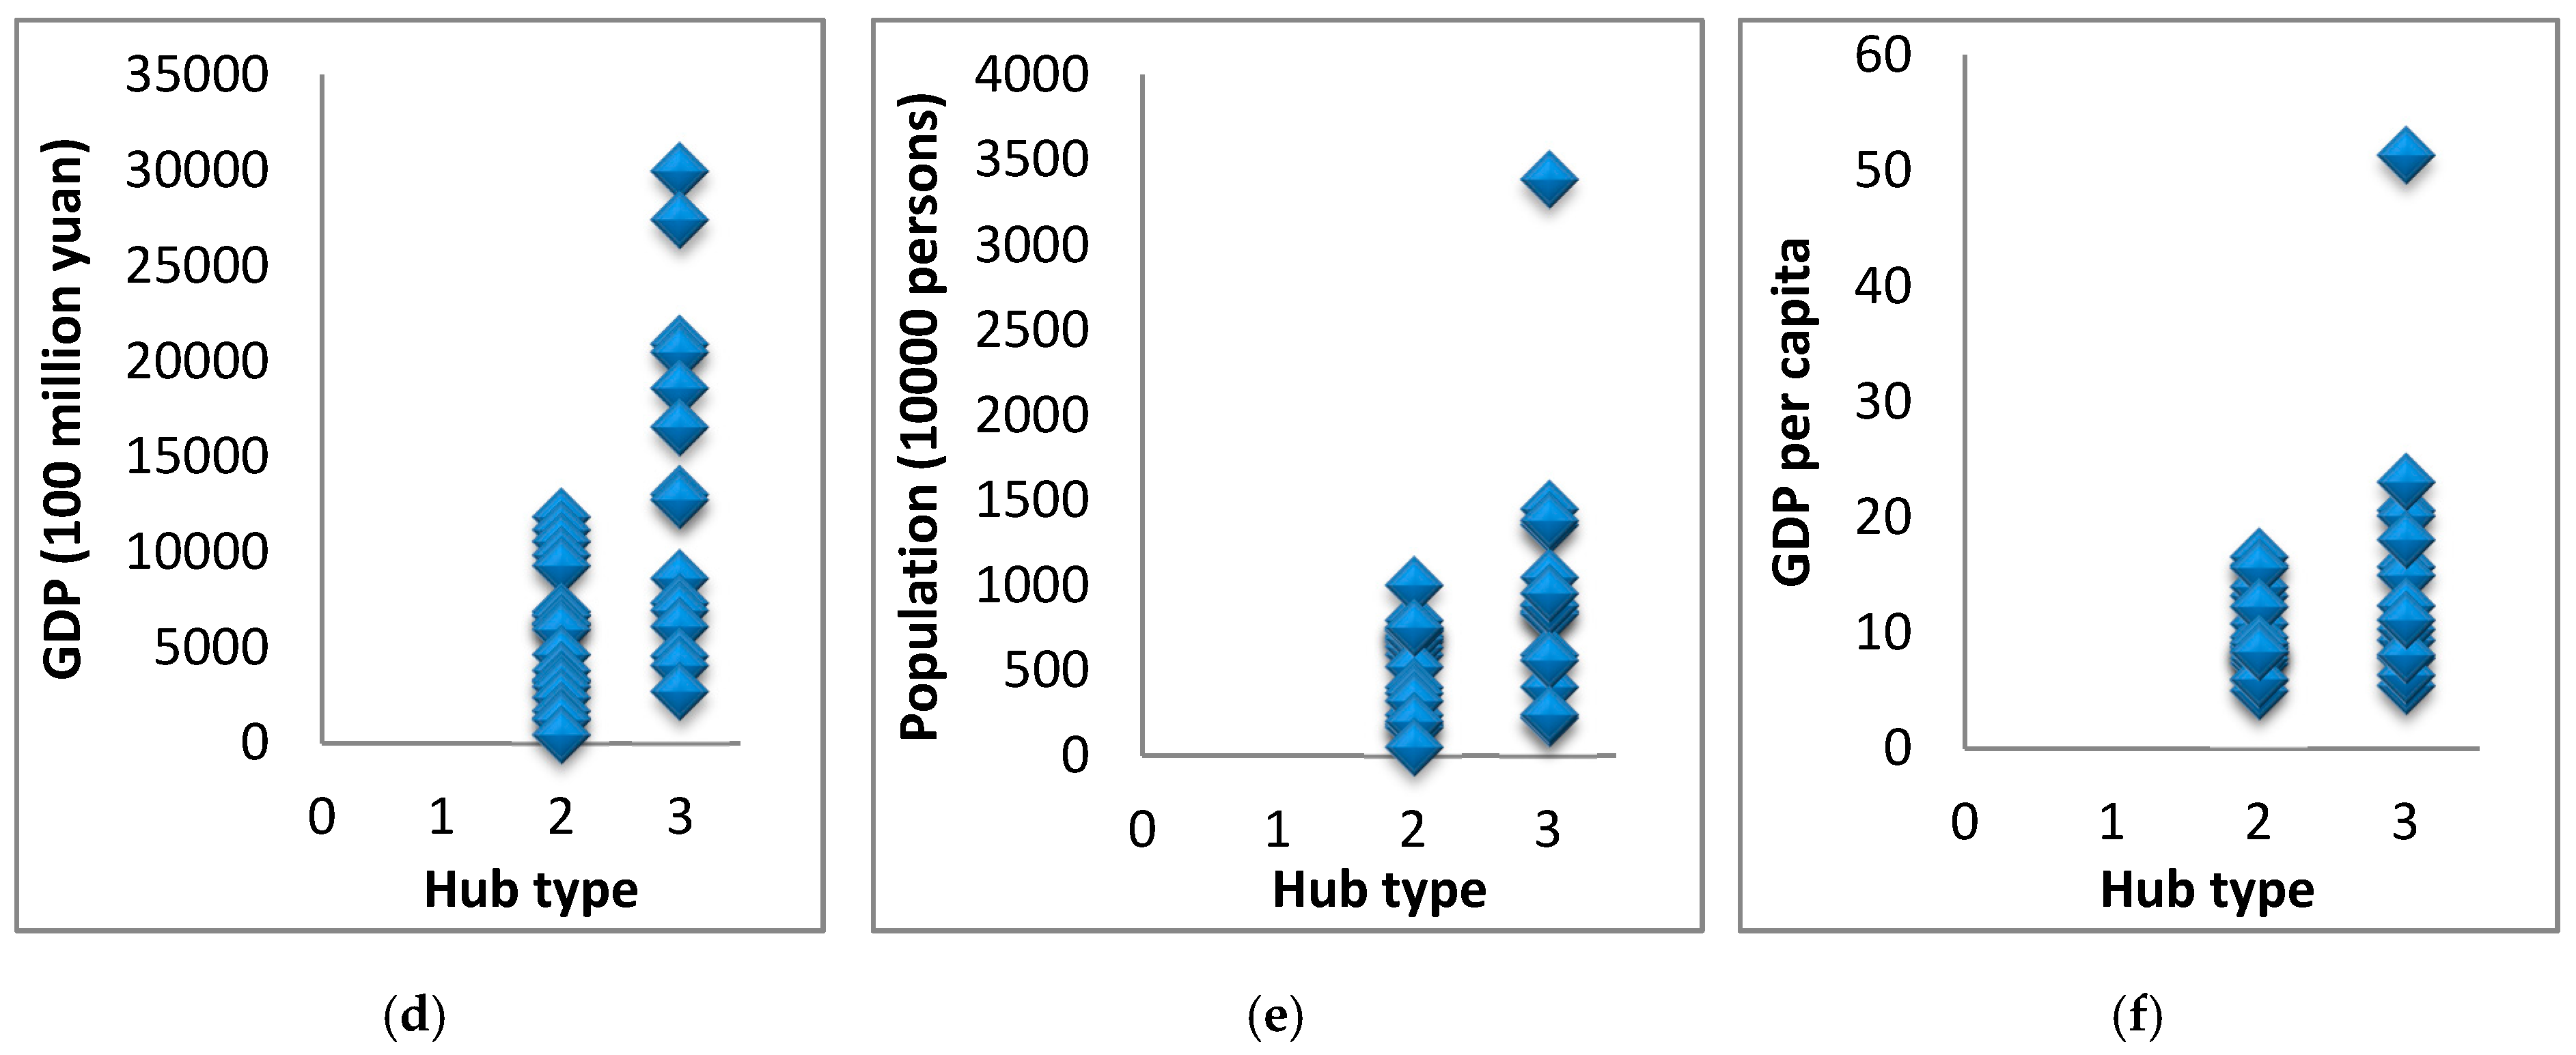
The relationships between structural characteristics, socioeconomic factors and hub types are reflected in
Figure 4, including degree (
Figure 4a), betweenness (
Figure 4b), GDP (
Figure 4d), population(
Figure 4e) and GDP per capita(
Figure 4f). At the same time,
Figure 4c presents the correlation between degree and betweenness. Through a correlation analysis of the degree, betweenness and hub types, as shown in
Figure 4 and
Table 9, the following conclusions can be drawn. The degree and the betweenness are strongly correlated, and the linear relationship between the degree or betweenness and the type of hub is a moderate correlation.
According to the data of the National Bureau of Statistics [
38], we conducted a correlation analysis of the annual average GDP, average population at the end of the year, average GDP per capita and planning hub types of 36 major cities from 2015 to 2018. As shown in
Table 10, the type of hub has a moderate linear correlation with GDP, and a weak linear correlation with the population and GDP per capita.
Overall, it can be seen that among the several factors that may be related to the hub type proposed in this paper, the hub type has the closest relationship with the degree. That is to say, the hubs with a high degree have large scale and comparatively complete function, and exert substantial impact on the traffic flow and traffic efficiency indirectly. The nodes with a high degree should therefore be planned as more comprehensive, advanced and important transportation hubs.
In this paper, the differentiations of the transportation hubs in the plan were confirmed. Generally speaking, the transportation hubs which provide services for participants to travel or transport goods should be closely related to GDP, the number of permanent residents, or GDP per capita, from the perspective of population and economy. However, this does not completely comply with the assumption in this paper. A possible explanation may be that the development mode is conceived of as transportation infrastructure leading, as supported by previous observations that the improvement of the transportation infrastructure conditions contributes to the regional investment environment, which is a pivotal engine of economic growth in China [
39,
40,
41,
42].
3.3. Vulnerability Assessment
Nodes in the CCTCH were iteratively destroyed in order to analyze the variations in efficiency E(k) and origin–destination considered efficiency ODE(k) of the CTCC under DD, DB and DGDP. The network performance varies greatly when adopting different attack scenarios, which is consistent with previous studies of rail transit networks that found different variation tendencies of effectiveness depending on the sorting criteria used in the attack scenarios [
24,
27].
3.3.1. Vulnerability of the Whole Network
The results in
Figure 5 reveal the variations of the network efficiency under different attacks. When the nodes were destroyed under DD, the value of the network efficiency decreased dramatically. In the correlation analysis above, the results indicate that the comprehensive transportation hub has the most relevant relationship with the degree value, and a point with a high degree value is more likely to be the international hub. Therefore, the destruction of advanced and functional transportation hubs will considerably influence the network. The same results can be obtained by examining the evolution of the whole network’s performance in
Section 3.1.
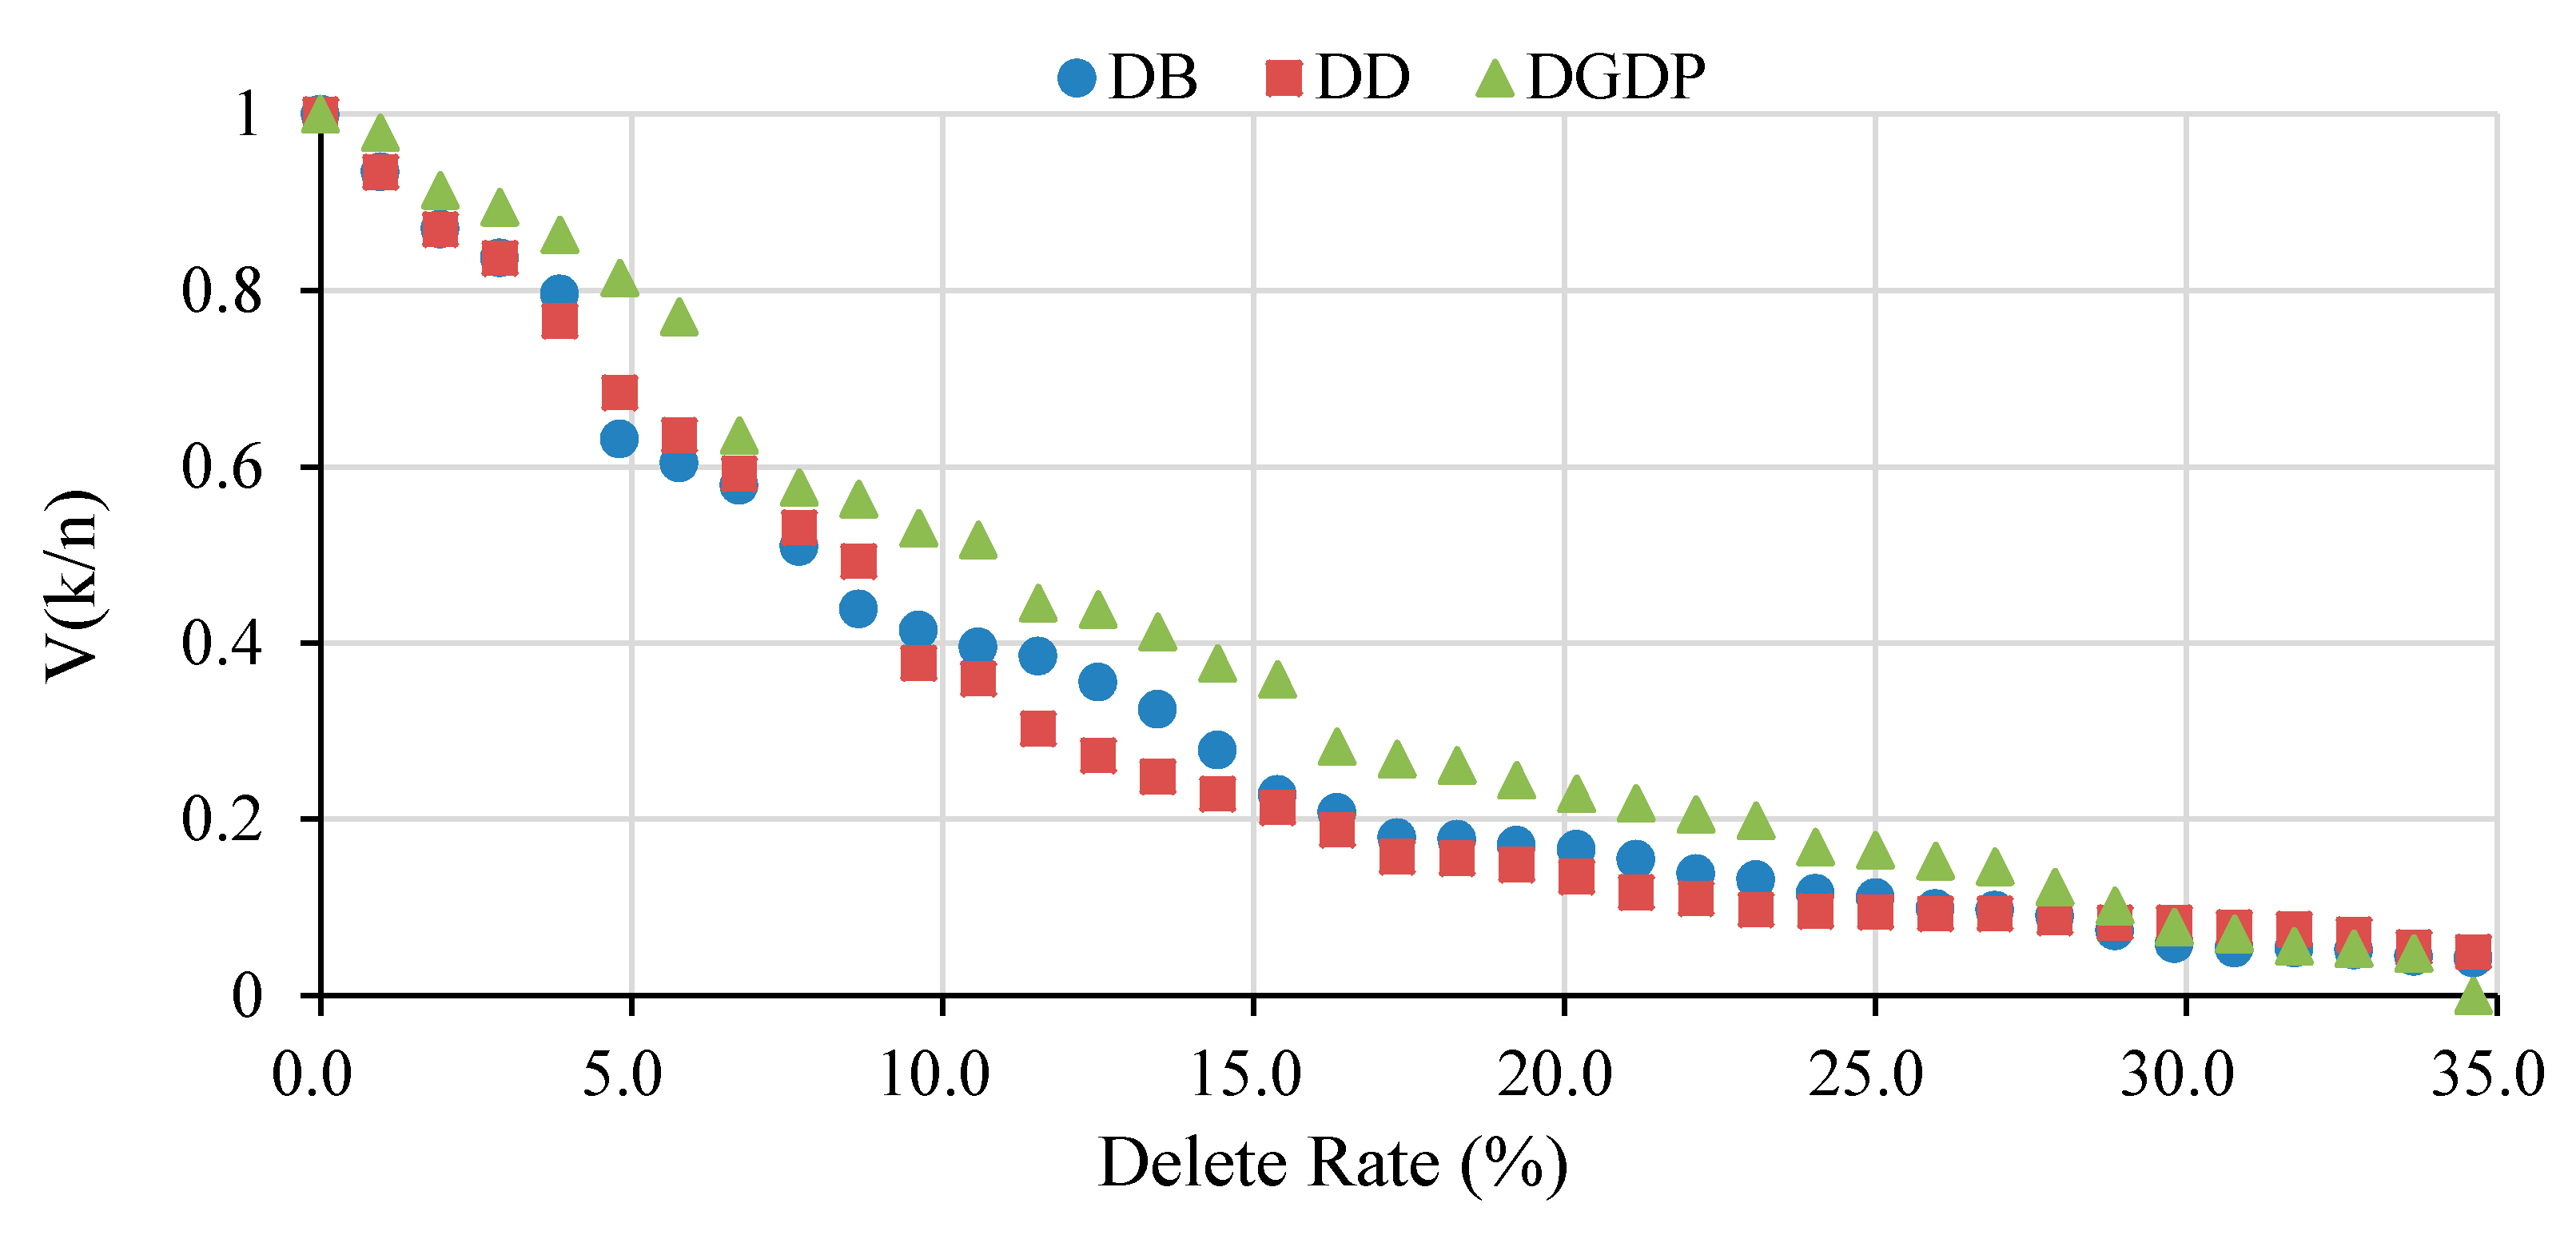
Figure 6 shows that the DB had the greatest impact on the network when 5% of the nodes were removed (equivalent to six hubs being unable to provide services), with the network efficiency dropping to nearly 60% of the initial value. In contrast, under DGDP, the
V value decreased only to 0.8, maintaining relative stability. With continual destructions, DD had the greatest impact on the network when 10% of the nodes were destroyed, with the V value decreasing to less than 0.4. The network efficiency dropped by almost a staggering 80% when more than 15% of the nodes failed.
in different attack scenarios are shown in
Table 11.
3.3.2. Vulnerability of the Main Origin and Destination of International Freight Corridors
Considering that international freight mainly serves the national economy, the destination of international freight should be the economically developed areas, so the top ten cities of GDP and several major border hubs in China were selected as the destination of international freight as shown in
Table 12. Similarly, considering the export transportation, the origin of international freight transportation should be the economically developed areas. If both internal and external transportation are considered, the network link is bidirectional; the network model can be considered as an undirected network. For an undirected network, the path is the same in both directions, i.e., the network links are all reciprocal links. Therefore, when we use the network efficiency a measure to investigate the vulnerability of the network, the situation is the same, with the origin and the destination nodes interchanged. In this paper, we only consider the import transportation scenario in order to analyze the vulnerability of international freight corridors.
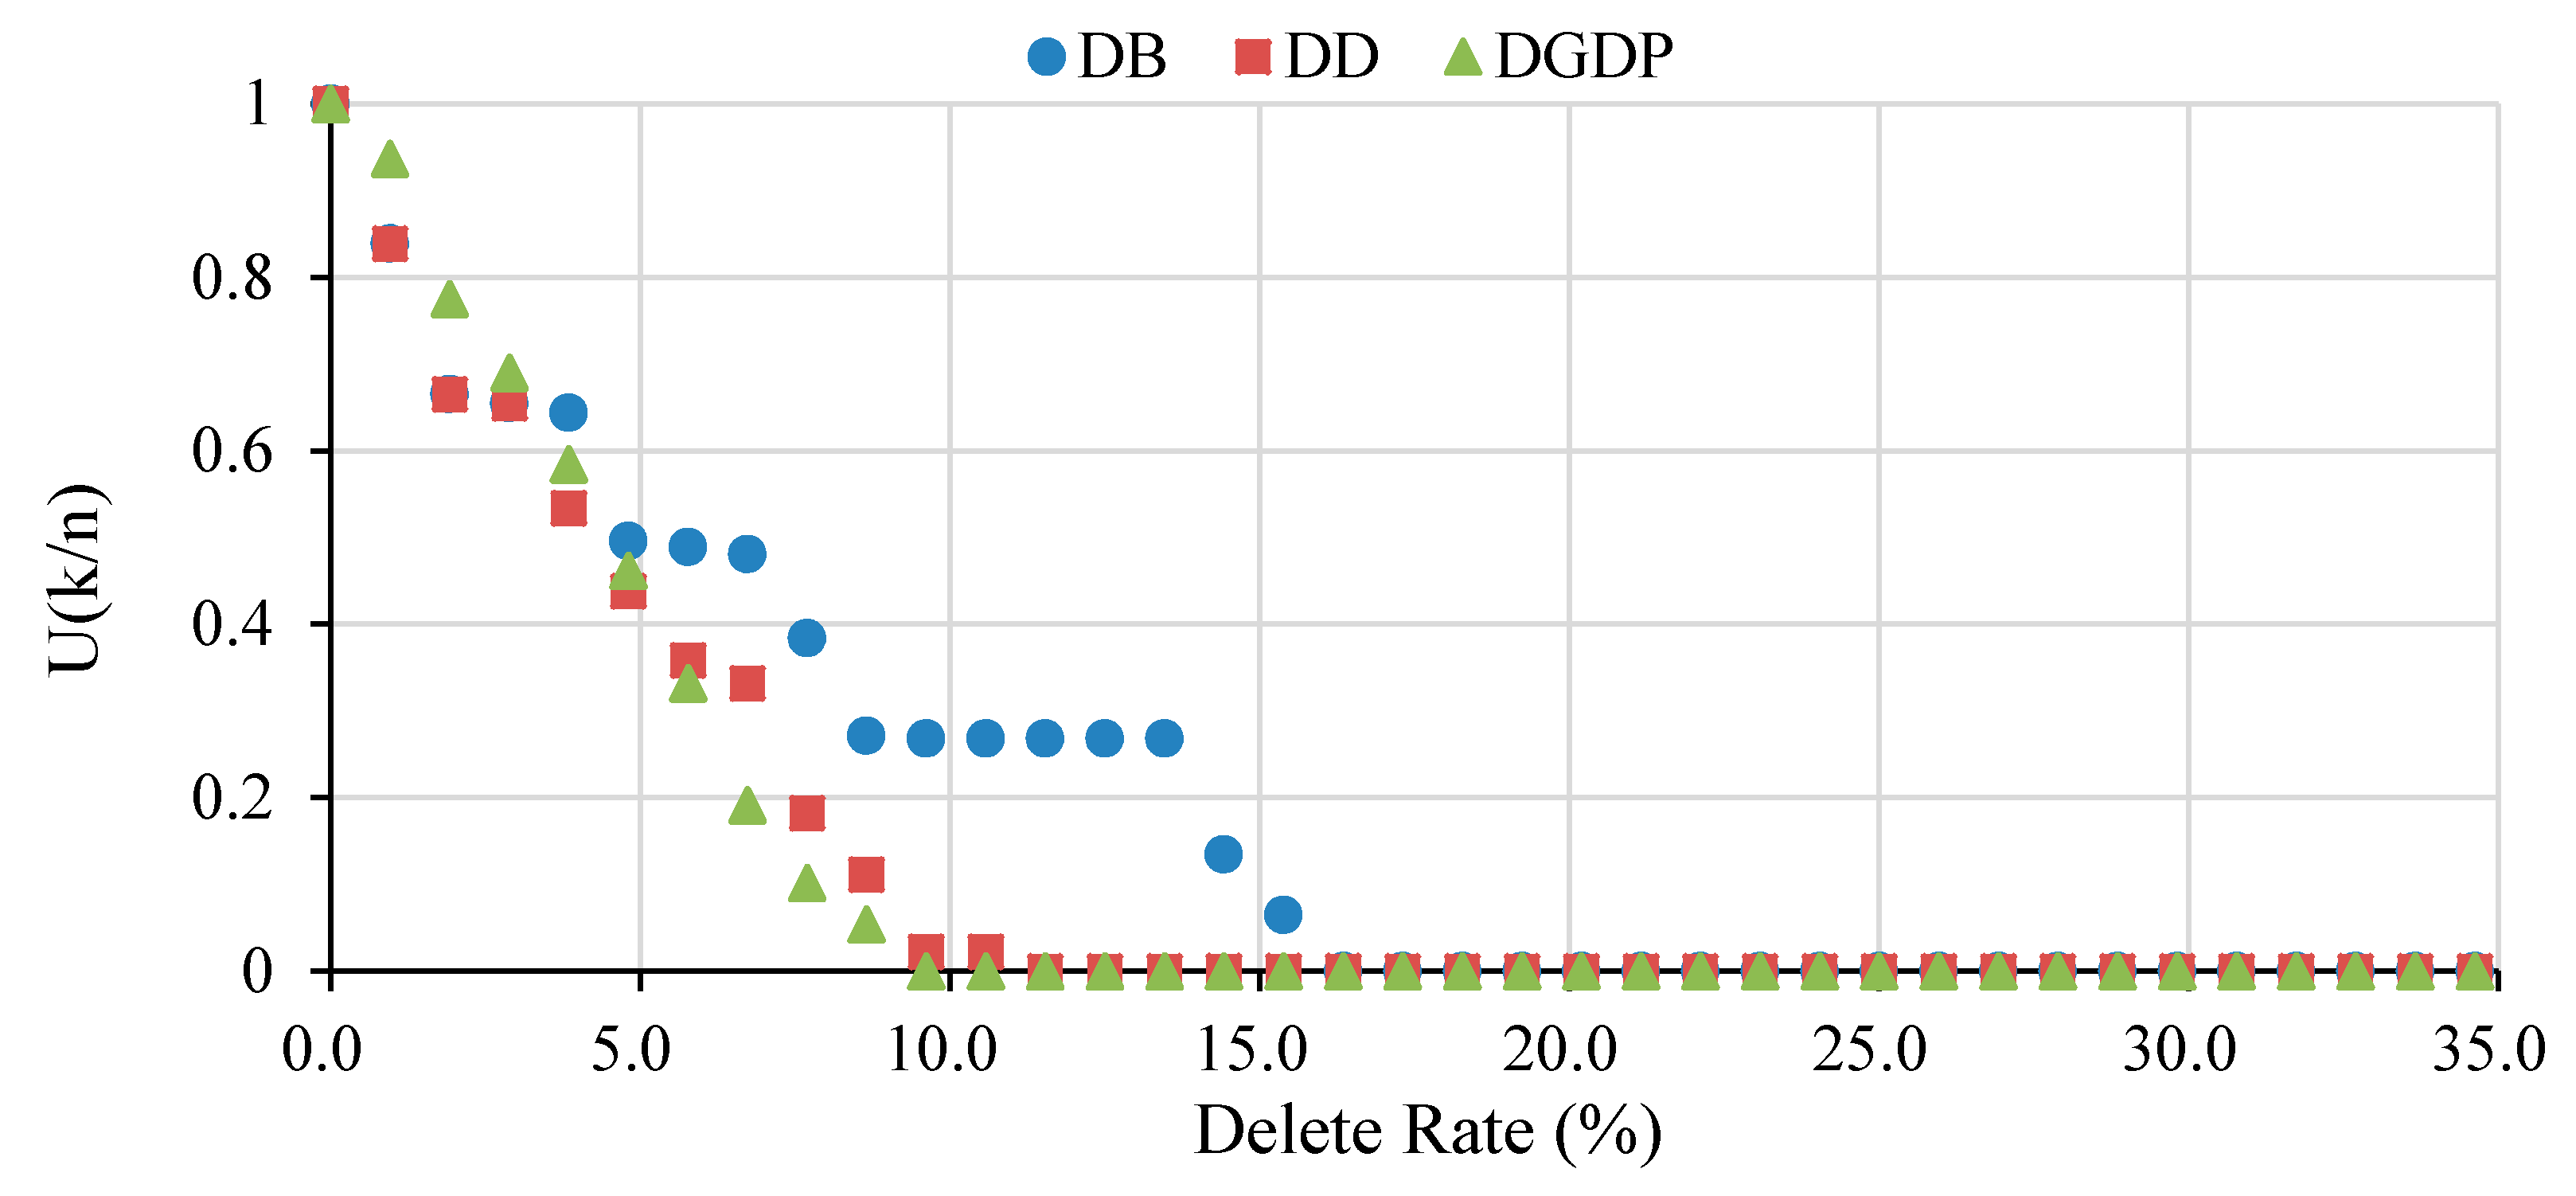
As for the vulnerability of the CCTCH in the context of international transportation, 29 hubs above in the CCTCH were selected to investigate the variations of origin–destination considered efficiency ODE(k). Unlike the situation where the whole network’s efficiency was measured, the ODE(k) changed sharply under DGDP as shown in
Figure 7.
As shown in
Table 13 and
Figure 8, the ODE(k) reduced instantly to less than a half after 5% of the nodes had failed. Under DGDP or DD, the ODE(k) decreased to 0 even if only less than 10% of the nodes were destroyed; that is, after the failure of 10 nodes, resulting the network between 19 port nodes and 10 economically developed cities being completely interrupted. Similarly, the east–west network would split after the failure of the top ten nodes of the degree, as shown by the results obtained from the preliminary analysis in
Figure 3b.
4. Discussion
In order to measure and improve the sustainability of the national comprehensive transportation system, this paper studied the vulnerability of the CCTCH and the correlation between the hub layout and various factors from the perspective of network characteristics and socioeconomic relationship. The results of this study show that the CCTCH network is vulnerable to strategic disruption.
4.1. Vulnerability of the CCTCH
Through the vulnerability assessment, it can be seen that the structure security issues of the CCTCH network mainly focus on the connectivity between the east-central, southwest and northwest regions. From the analysis of network invulnerability , the attack strategy based on degree had the greatest impact on the network’s performance. After the failure of the top ten high-degree nodes, we found that the network was divided into three parts. The central and eastern regions maintained the connection well. However, the southwest region was seriously influenced. Panzhihua, the border city of Sichuan and Yunnan in southwest China, and the four border hubs leading to Southeast Asia were not connected with the comprehensive transportation corridors, which indicated that the transportation of goods and people between Southeast Asia and inland China would be impeded. As for the northwest border hubs, the links were not devastated, but the connection between the northwest and east-central regions cannot be realized through CCTCH, which would hinder the trade development and personnel exchanges in the northwest region. In Northeast China, the Dandong border hub was isolated from the CCTCH, which would decrease the transportation efficiency from China to the Korean Peninsula.
4.2. Correlation Analysis between Node Centrality and Hub Type
Few studies have dealt with the relationship between node centrality and whether there is correlation between degree and betweenness. Is a node that is connected directly to more cities also passed by more frequently? Although some previous researchers have denied this point, the correlation between them is still worth exploring. In this paper, we found that the degree of the CCTCH was closely related to the betweenness. High-degree nodes could directly radiate to the neighbor nodes conveniently and efficiently through the comprehensive transportation system, so as to realize the connection in a region. High-betweenness nodes that most frequently lie on shortest paths could control the connectivity of the whole network. The results of this study showed that the high-degree nodes often had high betweenness. Therefore, these nodes play a critical role in the connectivity, whether in a region or in the whole network.
In the planning of the CCTCH, the hubs were divided into three levels: international, national, and regional comprehensive transportation hubs and border hubs. From the perspective of network structure, since node centrality has an essential impact on the network system, does a node with higher node centrality (degree and betweenness) indicate a comprehensive hub with a higher level? Through the correlation analysis of degree, betweenness and hub type, we found that the centrality of nodes in the CCTCH was moderately correlated with the hub type. The rationality of the hub layout was confirmed from the viewpoint of the network structure.
4.3. Economic and Demographic Factors, and Hub Type
The original intention of this experiment was to consider the attraction between nodes. In cities with high economic levels and large populations, the travel demands—such as business, tourism and visiting relatives, or freight—must be at a high level. Therefore, a large number of travelers and goods should be supported by comprehensive hubs with superior conditions. From this point of view, should hub type be moderately (or more) related to economic and demographic factors, such as GDP, population and GDP per capita? Surprisingly, through the analysis in 3.2, the results were contrary to expectations. The correlation between the hub type and GDP was 0.54, which is located at the critical point of weak and moderate correlation, while the correlation with population was 0.41, which is considered a weak relationship. As for GDP per capita, it was close to the edge of uncorrelation. Possible explanations for this might be that: (1) limited by the data, only the GDP and population of 36 major cities were obtained. Through statistics, it was found that, among these 36 cities, there was no Type 1 hub; namely, a regional comprehensive hub and border hub. Therefore, the integrity and representativeness of the sample were affected, resulting in inaccurate analysis results. (2) From the planner view, despite the fact that economically developed and high-population cities should become high-level comprehensive transportation hubs in terms of the amount of attraction, some economically backward and sparsely populated areas may need to improve traffic conditions out of fairness.
4.4. Vulnerability of International Freight Network
One of the objectives of CCTCH planning is to adapt to the new international development environment, improve the guarantee of international corridors and effectively support all-round opening up. Therefore, it is necessary to study the vulnerability of international freight network. In
Section 3.3.2, it was studied and measured by
. The results showed obvious vulnerability. Under three scenarios of intentional attack strategies, the network performance dropped to less than a half after the failure of 5% of the nodes, which indicated that more than half of the international freight transportation would be affected in this situation. Beijing, Chengdu and Xi’an are the top three nodes based on the ranking of degree and betweenness. Under the deletion of these three nodes, the performance of the international freight network could still maintain more than 65%. However, after the failure of the fourth node, a significant difference between DD and DB was observed. The results indicated that Taiyuan, the city with the fourth largest degree, made a more significant contribution to the international freight network than Chongqing, which ranked fourth in the betweenness sequence. Furthermore, after the fourth nodes, degree-based nodes played a more crucial role than betweenness-based nodes with the same ranking. According to the almost linear decrease of
, DGDP had a serious influence on the network. Moreover, the linearity indicated that the number of routes from 19 origins to 10 destinations was relatively average. Coincidentally, the ODE(k) was also 0 after the failure of 10 nodes under DD. At this time, there were only four destinations among the 10 high-degree nodes, which revealed that the remaining six nodes contributed substantially in supporting the international freight network.
5. Conclusions
From a macro perspective, we revealed the impact on transportation network and traffic safety from the destruction of some hubs using network characteristics, vulnerability and a correlation analysis of the CCTCH, and the following conclusions can be drawn:
(1) The CCTCH is relatively fragile. The density of the CCTCH is 0.0337, which indicates that the network is relatively fragile due to the low connectivity between its nodes. The network efficiency decreased to 60% of the initial value after the destruction of 5% of the nodes, and dropped by nearly 80% when 15% of the nodes were removed.
(2) It requires an average of four nodes to reach each other among the network hubs. When the top ten nodes by degree or betweenness fail, the overall connectivity of the network is greatly affected, mainly resulting in disruptions in the West and Southwest. However, the impact in the Middle East is not obvious. These findings suggest that the links or hubs connecting the central, the east and west, and the south regions can be added, so as to enhance the safety and sustainability of the CCTCH.
(3) A comprehensive transportation hub is a key part of the CCTCH, and the rationality of the hub layout is of great significance to the sustainability of the network. Therefore, this paper has discussed them by the correlation of node attributes and economic and demographic factors. The hub type of the CCTCH has a stronger correlation with the node degree than the economic and demographic factors, which indicates that the development mode is conceived of as transportation infrastructure leading. From another point of view, the correlation analysis between the hub type and factors related to socioeconomic status can be used as a method to judge the development mode. The research has also shown that the hub layout of the CCTCH is relatively reasonable. From the perspective of node attributes, the centrality of the nodes is moderately correlated with the hub type. From the perspective of economic and demographic factors, it is not desirable simply to position hubs in order to meet the travel demand, but rather to plan hubs out of fairness and supply-side reform, which will be beneficial to the development of economically underdeveloped areas. This paper presents a novel study to prove the above judgment with a quantitative method.
(4) Considering the international transportation from the domestic border hubs to the economically developed cities, the importance of cities with a high DD is highlighted. Under the attack scenario of the DD and average GDP, the transportation was greatly interrupted after the failure of 10 nodes. Xi’an, Taiyuan, Changsha, Hefei, Tongliao and Nanchang are not destination nodes, which play an important role in the connectivity of the international transportation corridors. Hence, these results provide further support for the preparation of emergency rescue facilities and equipment.
Moreover, our view, methodology and findings provide a reference for traffic planners and policy makers, who can adjust and optimize the planning network in order to improve the vulnerability and the service level, and strengthen the sustainability of the transportation system.
Author Contributions
Conceptualization, J.L. and H.L.; methodology, J.L.; software, J.L.; validation, J.L. and M.C.; formal analysis, M.C. and J.W.; investigation, J.L.; resources, H.L.; data curation, J.L. and Y.Z.; writing—original draft preparation, M.C. and J.L.; writing—review and editing, J.L.; visualization, J.L.; supervision, H.L.; project administration, H.L.; funding acquisition, H.L. All authors have read and agreed to the published version of the manuscript.
Funding
This research is supported by the major consulting project of the Chinese Academy of Engineering: Research of Transportation Strategy for a Powerful Nation (2017-ZD-07).
Acknowledgments
The authors are grateful to the editor and anonymous reviewers for their valuable suggestions.
Conflicts of Interest
The authors declare no conflict of interest.
References
- Shi, Y. Building modern integrated transport system and reconstructing regional development pattern. China Transp. Rev. 2017, 39, 4–7. [Google Scholar]
- Ge, Y.; Dou, W.; Zhang, H. A new framework for understanding urban social vulnerability from a network perspective. Sustainability 2017, 9, 1723. [Google Scholar] [CrossRef] [Green Version]
- Xu, H.; Jiao, L.; Chen, S.; Deng, M.; Shen, N. An Innovative Approach to Determining High-Risk Nodes in a Complex Urban Rail Transit Station: A Perspective of Promoting Urban Sustainability. Sustainability 2018, 10, 2456. [Google Scholar] [CrossRef] [Green Version]
- Erenler, A.; Burak, G. Analysis of road traffic accidents in Turkey between 2013 and 2017. Medicina 2019, 55, 679. [Google Scholar] [CrossRef] [PubMed] [Green Version]
- Van der Vlegel, M.; Haagsma, J.A.; de Munter, L.; de Jongh, M.A.C.; Polinder, S. Health Care and Productivity Costs of Non-Fatal Traffic Injuries: A comparison of road user types. Int. J. Environ. Res. Public Health 2020, 17, 2217. [Google Scholar] [CrossRef] [PubMed] [Green Version]
- Alonso, B.; Astarita, V.; Dell’Olio, L.; Giofrè, V.P.; Guido, G.; Marino, M.; Sommario, W.; Vitale, A. Validation of simulated safety indicators with traffic crash data. Sustainability 2020, 12, 925. [Google Scholar] [CrossRef] [Green Version]
- Koetse, M.; Rietveld, P. The impact of climate change and weather on transport: An overview of empirical findings. Transp. Res. 2009, 14, 205–221. [Google Scholar] [CrossRef]
- Suarez, P.; Anderson, W.; Mahal, V.; Lakshmanan, T. Impacts of flooding and climate change on urban transportation: A systemwide performance assessment of the Boston Metro Area. Transp. Res. D Trans. Environ. 2005, 10, 231–244. [Google Scholar] [CrossRef]
- Chang, H.; Lafrenz, M.; Jung, I.; Figliozzi, M.; Platman, D.; Pederson, C. Potential Impacts of Climate Change on Flood-Induced Travel Disruptions: A Case Study of Portland, Oregon, USA. Ann. Assoc. Amer. Geogr. 2010, 100, 938–952. [Google Scholar] [CrossRef]
- Rattanachot, W.; Wang, Y.; Chong, D.; Suwansawas, S. Adaptation strategies of transport infrastructures to global climate change. Trans. Policy 2015, 41, 159–166. [Google Scholar] [CrossRef]
- Picketts, I.; Andrey, J.; Matthews, L.; Dery, S.; Tighe, S. Climate change adaptation strategies for transportation infrastructure in Prince George, Canada. Reg. Environ. Chang. 2016, 16, 1109–1120. [Google Scholar] [CrossRef]
- Juan, E.; Muriel, V.; Karla, C.; Rodraguez, P.; Carmen, E.; Juan, G. Analysis of transportation networks subject to natural hazards–Insights from a Colombian case. Reliab. Eng. Sys. Saf. 2016, 152, 151–165. [Google Scholar]
- Murray-Tuite, P.; Fei, X. A Methodology for Assessing Transportation Network Terrorism Risk with Attacker and Defender Interactions. Comput. Aided Civ. Infras. Eng. 2010, 25, 396–410. [Google Scholar] [CrossRef]
- Ouyang, M.; Fang, Y. A Mathematical Framework to Optimize Critical Infrastructure Resilience against Intentional Attacks. Comput. Aided Civ. Infras. Eng. 2017, 32, 909–929. [Google Scholar] [CrossRef]
- Shi, J.; Wen, S.; Zhao, X.; Wu, G. Sustainable Development of Urban Rail Transit Networks: A Vulnerability Perspective. Sustainability 2019, 11, 1335. [Google Scholar] [CrossRef] [Green Version]
- Berdica, K. An introduction to road vulnerability: What has been done, is done and should be done. Trans. Policy 2002, 9, 117–127. [Google Scholar] [CrossRef]
- Watts, D.; Strogatz, S. Collective dynamics of ‘small-world’ networks. Nature 1998, 393, 440–442. [Google Scholar] [CrossRef]
- Barabá, S. Emergence of Scaling in Random Networks. Science 1999, 286, 509–512. [Google Scholar] [CrossRef] [Green Version]
- Wang, J.; Rong, L.; Zhang, L.; Zhang, Z. Attack vulnerability of scale-free networks due to cascading failures. Phys. A 2008, 387, 6671–6678. [Google Scholar] [CrossRef]
- Holme, P.; Kim, B.; Yoon, C.; Han, S. Attack vulnerability of complex networks. Phys. Rev. E 2002, 65, 56109. [Google Scholar] [CrossRef] [Green Version]
- Xia, Y.; Fan, J.; Hill, D. Cascading failure in Watts–Strogatz small-world networks. Phys. A 2010, 389, 1281–1285. [Google Scholar] [CrossRef]
- Paul, G.; Sreenivasan, S.; Stanley, H. Resilience of Complex Networks to Random Breakdown. Phys. Rev. E 2005, 72 Pt 2, 56130. [Google Scholar] [CrossRef] [Green Version]
- Du, Y.X.; Gao, C.; Hu, Y.; Mahadevan, S.; Deng, Y. A new method of identifying influential nodes in complex networks based on TOPSIS. Phys. A 2014, 399, 57–69. [Google Scholar] [CrossRef]
- Liu, J.; Lu, H.; Ma, H.; Liu, W. Network Vulnerability Analysis of Rail Transit Plans in Beijing-Tianjin-Hebei Region Considering Connectivity Reliability. Sustainability 2017, 9, 1479. [Google Scholar] [CrossRef] [Green Version]
- Fan, B.; Zheng, C.X.; Tang, L.R.; Wu, R.Z. Critical nodes identification for vulnerability analysis of power communication networks. IET Commun. 2020, 14, 703–713. [Google Scholar] [CrossRef]
- Demsar, U.; Olga, S.; Virrantaus, K. Identifying Critical Locations in a Spatial Network with Graph Theory. Transac. GIS 2008, 12, 61–82. [Google Scholar] [CrossRef]
- Klophaus, R.; Lordan, O. Codesharing network vulnerability of global airline alliances. Transp. Res. Part. A. 2018, 111, 1–10. [Google Scholar] [CrossRef] [Green Version]
- Xing, Y.; Lu, J.; Chen, S.; Dissanayake, S. Vulnerability analysis of urban rail transit based on complex network theory: A case study of Shanghai Metro. Public Trans. 2017, 9, 501–525. [Google Scholar] [CrossRef]
- Kim, S.; Yoon, Y. On node critical of the Northeast Asian air route network. J. Air Transp. Manag. 2019, 80, 101693. [Google Scholar] [CrossRef]
- Wei, D.J.; Zhang, X.G.; Mahadevan, S. Measuring the vulnerability of community structure in complex networks. Reliab. Eng. Sys. Saf. 2018, 174, 41–52. [Google Scholar] [CrossRef]
- Zhang, D.M.; Du, F.; Huang, H.W.; Zhang, F.; Ayyub, B.M.; Beer, D.M. Resiliency assessment of urban rail transit networks: Shanghai metro as an example. Saf. Sci 2018, 106, 230–243. [Google Scholar] [CrossRef]
- Kelly, M. Activity levels at hub facilities in interacting networks. Geogr. Anal. 1986, 18, 4. [Google Scholar]
- Kelly, M. The location of interacting hub facilities. Transp. Sci. 1986, 20, 2. [Google Scholar] [CrossRef]
- Alumur, S.; Kara, B. Network hub location problems: The state of the art. Eur. J. Oper. Res. 2008, 190, 1–21. [Google Scholar] [CrossRef] [Green Version]
- Farahani, R.; Hekmatfar, M.; Arabani, B.; Nikbakhsh, E. Hub location problems: A review of models, classification, solution techniques, and applications. Comput. Ind. Eng. 2013, 64, 1096–1109. [Google Scholar] [CrossRef]
- China, S.C.O. The 13th Five-Year Plan of Transportation Development in China. Available online: http://www.gov.cn/zhengce/content/2017-02/28/content_5171345.htm (accessed on 20 May 2020).
- Metcalf, L.; William, C. Cybersecurity and Applied Mathematics; Syngress: New York, NY, USA, 2016; pp. 67–94. [Google Scholar]
- Statistics, N.B.O. Annual Data of Major Cities. Available online: http://data.stats.gov.cn/easyquery.htm?cn=E0105 (accessed on 20 May 2020).
- Hong, J.; Chu, Z.; Wang, Q. Transport infrastructure and regional economic growth: Evidence from China. Transportation 2011, 38, 737–752. [Google Scholar] [CrossRef]
- Zhang, X. Transport infrastructure, spatial spillover and economic growth: Evidence from China. Front. Econ. China 2008, 3, 585–597. [Google Scholar] [CrossRef]
- Banister, D.; Berechman, J. Transport. Investment and Economic Development; E&FN Spon: London, UK, 2001. [Google Scholar]
- Hong, J. Transport and the location of foreign logistics firms: The Chinese experience. Transp. Res. Part A 2007, 41, 597–609. [Google Scholar] [CrossRef]
Figure 1.
The Layout of the China Comprehensive Transportation Corridors.
Figure 1.
The Layout of the China Comprehensive Transportation Corridors.
Figure 2.
The topology networks of the CCTCH.
Figure 2.
The topology networks of the CCTCH.
Figure 3.
(a) Description of the degree of comprehensive transportation corridor plan nodes; (b) the topology reconfiguration of the network after deleting the top ten nodes by degree; (c) a description of the betweenness of comprehensive transportation corridor plan nodes; (d) the topology reconfiguration of the network after deleting the top ten nodes by betweenness.
Figure 4.
(a) Description of node degree K and hub type; (b) description of node betweenness B and hub type; (c) description of node degree K and node betweenness B; (d) description of GDP and hub type; (e) description of population and hub type; (f) description of GDP per capita and hub type.
Figure 4.
(a) Description of node degree K and hub type; (b) description of node betweenness B and hub type; (c) description of node degree K and node betweenness B; (d) description of GDP and hub type; (e) description of population and hub type; (f) description of GDP per capita and hub type.
Figure 5.
Network efficiency variations in three scenarios: deleting the kth node in a descending sequence of degree (DD), betweenness (DB) and average GDP (DGDP).
Figure 5.
Network efficiency variations in three scenarios: deleting the kth node in a descending sequence of degree (DD), betweenness (DB) and average GDP (DGDP).
Figure 6.
Invulnerability of the network based on efficiency variations in three scenarios: deleting the kth node in a descending sequence of degree (DD), betweenness (DB) and average GDP (DGDP).
Figure 6.
Invulnerability of the network based on efficiency variations in three scenarios: deleting the kth node in a descending sequence of degree (DD), betweenness (DB) and average GDP (DGDP).
Figure 7.
Origin–destination considered efficiency variations in three scenarios: deleting the kth node in a descending sequence of degree(DD), betweenness (DB) and average GDP (DGDP).
Figure 7.
Origin–destination considered efficiency variations in three scenarios: deleting the kth node in a descending sequence of degree(DD), betweenness (DB) and average GDP (DGDP).
Figure 8.
Invulnerability of the network based on origin–destination considered efficiency variations in three scenarios: deleting the kth node in a descending sequence of degree (DD), betweenness (DB) and average GDP (DGDP).
Figure 8.
Invulnerability of the network based on origin–destination considered efficiency variations in three scenarios: deleting the kth node in a descending sequence of degree (DD), betweenness (DB) and average GDP (DGDP).
Table 1.
Summary of the corridors of the CCTCH.
Table 1.
Summary of the corridors of the CCTCH.
| No. | Name | No. | Name |
|---|
| V1 | Coastal Corridor | H1 | Suifenhe–Manzhouli Corridor |
| V2 | Beijing–Shanghai Corridor | H2 | Hunchun–Erlianhot Corridor |
| V3 | Beijing–Hong Kong, Macao and Taiwan Corridor | H3 | Northwest Corridor |
| V4 | Heihe–Hong Kong and Macao Corridor | H4 | Qingdao–Lhasa Corridor |
| V5 | Erenhot–Zhanjiang Corridor | H5 | Land bridge Corridor |
| V6 | Baotou–Fangchenggang Corridor | H6 | Riverside Corridor |
| V7 | Linhe–Mohan Corridor | H7 | Shanghai–Ruili Corridor |
| V8 | Beijing–Kunming Corridor | H8 | Shantou–Kunming Corridor |
| V9 | Ejina–Guangzhou Corridor | H9 | Fuzhou–Yinchuan Corridor |
| V10 | Yantai–Chongqing Corridor | H10 | Xiamen–Kashi Corridor |
Table 2.
Corresponding values of different types of hubs and the number of hub cities.
Table 2.
Corresponding values of different types of hubs and the number of hub cities.
| Type | International Comprehensive Transportation Hub (ICTH) | National Comprehensive Transportation Hub (NCTH) | Regional Comprehensive Transportation Hub and Border Hub (RCT-BH) |
|---|
| Assignment | 3 | 2 | 1 |
| Number of hub cities | 12 | 63 | 29 |
Table 3.
Notation glossary in 2.3.1.
Table 3.
Notation glossary in 2.3.1.
| Symbol | Description |
|---|
| N | The number of nodes |
| E | The number of links |
| Ki | The degree of node i |
| Bi | The betweenness of node i |
| K | The average degree value |
| B | The average betweenness value |
| Network density |
| CK | Degree centrality |
| CB | Betweenness centrality |
Table 4.
General properties of the CCTCH.
Table 4.
General properties of the CCTCH.
| Network | N | E | | | | CK | CB |
|---|
| Value | 104 | 361 | 3.48 | 404.65 | 0.0337 | 5.46% | 24.32% |
Table 5.
Frequency of the shortest inter-node distance in the CCTCH.
Table 5.
Frequency of the shortest inter-node distance in the CCTCH.
| Distance | 1 | 2 | 3 | 4 | 5 | 6 | 7 | 8 | 9 | 10 | 11 | 12 |
|---|
| Frequency | 360 | 909 | 1430 | 1735 | 1791 | 1623 | 1272 | 816 | 371 | 120 | 20 | 6 |
| Proportion | 0.034 | 0.087 | 0.137 | 0.166 | 0.171 | 0.155 | 0.122 | 0.078 | 0.035 | 0.011 | 0.002 | 0.001 |
Table 6.
Interpretation of the correlation coefficient.
Table 6.
Interpretation of the correlation coefficient.
| Value of r | |r| < 0.3 | 0.3 ≤ |r| < 0.5 | 0.5 ≤ |r| < 0.8 | 0.8 < |r| ≤ 1 |
|---|
| Strength of relationship | Very weak | Weak | Moderate | Strong |
Table 7.
Parameters and objectives of the correlation analysis.
Table 7.
Parameters and objectives of the correlation analysis.
| Experiment | Variable x | Variable y | Objective |
|---|
| 1 | Hub type | Degree K | To investigate the relationship between the three types of hubs and the node degree, and whether the higher-level comprehensive hub is directly connected with more nodes. |
| 2 | Hub type | Betweenness B | To explore the relationship between the three types of hubs and the frequency of the shortest path passing through the nodes, and whether the higher-level comprehensive hub means higher frequency of passing by. |
| 3 | Degree K | Betweenness B | To examine the relationship between the important nodes that are identified by two measures, and whether the node connected directly to more cities is also passed by more frequently. |
| 4 | Hub type | GDP | To determine the relationship between the type of planned hub and the GDP of node cities, and whether a higher-level comprehensive hub indicates a more advanced economy. |
| 5 | Hub type | Population | To assess the relationship between the type of planned hub and the number of permanent residents in node cities, and whether a higher-level comprehensive hub owns more population. |
| 6 | Hub type | GDP per capita | To evaluate the relationship between the type of planned hub and the GDP per capita of node cities, and whether a higher level comprehensive hub shows a higher GDP per capita. |
Table 8.
The top 36 cities of different failure scenarios.
Table 8.
The top 36 cities of different failure scenarios.
| No. | City under DGDP | City under
DB | City under DD | No. | City under DGDP | City under DB | City under
DD |
|---|
| 1 | Shanghai | Beijing | Beijing | 19 | Fuzhou | Xiangyang | Xiangyang |
| 2 | Beijing | Chengdu | Chengdu | 20 | Changchun | Guangzhou | Changchun |
| 3 | Shenzhen | Xi’an | Xi’an | 21 | Shenyang | Urumchi | Yulin |
| 4 | Guangzhou | Chongqing | Taiyuan | 22 | Harbin | Zhanjiang | Yinchuan |
| 5 | Chongqing | Kunming | Chongqing | 23 | Shijiazhuang | Tongliao | Golmud |
| 6 | Tianjin | Wuhan | Changsha | 24 | Nanchang | Golmud | Guangzhou |
| 7 | Chengdu | Baotou | Hefei | 25 | Kunming | Korla | Urumchi |
| 8 | Wuhan | Shenyang | Wuhan | 26 | Xiamen | Huaihua | Tsitsihar |
| 9 | Hangzhou | Nanning | Tongliao | 27 | Nanning | Lanzhou | Jiuquan-Jiayuguan |
| 10 | Nanjing | Yinchuan | Nanchang | 28 | Guiyang | Baoji | Datong |
| 11 | Qingdao | Jiuquan-Jiayuguan | Guiyang | 29 | Taiyuan | Shangqiu | Shangrao |
| 12 | Changsha | Taiyuan | Shangqiu | 30 | Hohhot | Changchun | Zhanjiang |
| 13 | Ningbo | Changsha | Baotou | 31 | Urumchi | Yulin | Fuzhou |
| 14 | Zhengzhou | Hefei | Zhengzhou | 32 | Lanzhou | Tsitsihar | Yuzhou |
| 15 | Dalian | Nanchang | Shenyang | 33 | Yinchuan | Datong | Luzhou-Yibin |
| 16 | Xi’an | Guiyang | Kunming | 34 | Haikou | Shangrao | Harbin |
| 17 | Ji’nan | Zhengzhou | Nanning | 35 | Xi’ning | Fuzhou | Nanjing |
| 18 | Hefei | Ji’nan | Jinan | 36 | Lhasa | Yuzhou | Lhasa |
Table 9.
Correlation of degree, betweenness and hub types.
Table 9.
Correlation of degree, betweenness and hub types.
| Correlation Coefficient r | Degree | Betweenness | Hub Type |
|---|
| Degree | 1 | 0.821 | 0.663 |
| Betweenness | 0.821 | 1 | 0.508 |
| Hub type | 0.663 | 0.508 | 1 |
Table 10.
Correlation of economic and demographic factors, and hub types.
Table 10.
Correlation of economic and demographic factors, and hub types.
| Correlation Coefficient r | GDP | Population | GDP per capita |
|---|
| Hub type | 0.540022 | 0.408739 | 0.35175 |
Table 11.
in different attack scenarios.
Table 11.
in different attack scenarios.
| k/n | 4.81% | 10.58% | 15.39% | 20.19% | 25.00% | 30.77% |
| k | 5 | 11 | 16 | 21 | 26 | 32 |
| DD | 0.685 | 0.360 | 0.213 | 0.135 | 0.095 | 0.077 |
| DB | 0.631 | 0.395 | 0.228 | 0.166 | 0.111 | 0.054 |
| DGDP | 0.814 | 0.517 | 0.359 | 0.229 | 0.165 | 0.070 |
Table 12.
Main origin and destination of international freight in China.
Table 12.
Main origin and destination of international freight in China.
| Origin | No. | Origin | No. | Destination | No. |
|---|
| Hongqilap | 93 | Yadong | 95 | Shanghai | 3 |
| Jimunai | 88 | Ceke | 87 | Beijing | 1 |
| Turgat | 92 | Mandula | 85 | Shenzhen | 5 |
| Ruili | 96 | Erlianhot | 84 | Guangzhou | 4 |
| Mohan | 97 | Manzhouli | 83 | Chongqing | 7 |
| Hekou | 98 | Heihe | 82 | Tianjin | 2 |
| Longbang | 99 | Tongjiang | 81 | Chengdu | 6 |
| Pingxiang | 100 | Hunchun | 103 | Wuhan | 13 |
| Dongxing | 102 | Dandong | 102 | Hangzhou | 23 |
| Zhangmu | 94 | | | Nanjing | 21 |
Table 13.
in different attack scenarios.
Table 13.
in different attack scenarios.
| k/n% | | 4.81 | 9.62 | 15.39 | 20.19 | 25.00 | 30.77 |
| k | | 5 | 10 | 16 | 21 | 26 | 32 |
| DD | 0.438 | 0.023 | 0.000 | 0.000 | 0.000 | 0.000 |
| DB | 0.496 | 0.268 | 0.065 | 0.000 | 0.000 | 0.000 |
| DGDP | 0.462 | 0.000 | 0.000 | 0.000 | 0.000 | 0.000 |
© 2020 by the authors. Licensee MDPI, Basel, Switzerland. This article is an open access article distributed under the terms and conditions of the Creative Commons Attribution (CC BY) license (http://creativecommons.org/licenses/by/4.0/).


