Predictive Insights for Improving the Resilience of Global Food Security Using Artificial Intelligence


1
National Institute of Education, Nanyang Technological University, 1 Nanyang Walk, Singapore 637616, Singapore
2
Faculty of Education, Monash University, Australia, 29 Ancora Imparo Way, Clayton VIC 3800, Australia
3
Centre for Management Practice, Singapore Management University, 81 Victoria Street, Singapore 188065, Singapore
*
Authors to whom correspondence should be addressed.
Sustainability 2020, 12(15), 6272; https://0-doi-org.brum.beds.ac.uk/10.3390/su12156272
Submission received: 16 July 2020
/
Revised: 31 July 2020
/
Accepted: 31 July 2020
/
Published: 4 August 2020
(This article belongs to the Collection Designing More Diverse and Resilient Food Systems for the Future)
Abstract
:Unabated pressures on food systems affect food security on a global scale. A human-centric artificial intelligence-based probabilistic approach is used in this paper to perform a unified analysis of data from the Global Food Security Index (GFSI). The significance of this intuitive probabilistic reasoning approach for predictive forecasting lies in its simplicity and user-friendliness to people who may not be trained in classical computer science or in software programming. In this approach, predictive modeling using a counterfactual probabilistic reasoning analysis of the GFSI dataset can be utilized to reveal the interplay and tensions between the variables that underlie food affordability, food availability, food quality and safety, and the resilience of natural resources. Exemplars are provided in this paper to illustrate how computational simulations can be used to produce forecasts of good and bad conditions in food security using multi-variant optimizations. The forecast of these future scenarios is useful for informing policy makers and stakeholders across domain verticals, so they can make decisions that are favorable to global food security.
1. Introduction
1.1. Global Food Security
One of the key sustainability issues is how food security is to be accomplished in the face of a projected population of over 9 billion by 2050 and to reduce more ecological degradation [1]. In addition, the patterns of food consumption are changing rapidly with a rise in the average wealth (particularly in the developing middle class in much of the world) [2]. The idea of natural resource scarcity, unpredictable agricultural economies, significant technical and socio-cultural shifts such as “westernization” of diets or climate change needs to be understood. Most of the world’s food systems are fragile and can collapse. As reported by the Food and Agriculture Organization of the United Nations (FAO), almost a billion people lack adequate calories and more than two billion lack adequate nutrients [3]. Even though two billion more are overweight or obese, many of them still suffer from inadequate or an imbalance of nutrients [4]. The rising global population is just part of the problem. Changes in food preferences, particularly an increased appetite for animal products, could also affect environmental health [5].
In addition to health issues, industrialized food systems could also lead to climate change through greenhouse gas emissions, threaten biodiversity, and undermine food security [6,7]. Climate change affects crop production [8,9]. Freshwater reserves have also hit their limits in some regions of the world, mostly due to over-exploitation for irrigation [10]. Expected increases in the frequency and intensity of extreme weather events, especially floods and droughts, will not only affect production but also disrupt the storage, distribution, and safety of food [11,12]. These factors will also affect food prices.
In view of the diverse stresses on food systems, the current and even the potential issues of the global food system must be addressed. The question is how to properly provide sufficient diets while reducing environmental degradation without destroying the ecosystems that maintain the livelihoods of many farmers and their profitability.
The climate and other environmental parameters of current food systems can be substantially influential, significantly weakening the natural resources upon which our food security depends. While positive advances in many fields have helped tackle food security worldwide with improved yields by hector, increased feed production for livestock, increased aquaculture production, and increased labor productivity, they could negatively impact the environment. New policy strategies must be implemented to reduce the environmental effects while enhancing health outcomes and preserving the companies and their livelihoods for the many people employed in the food systems. Dialog and new partnerships between all stakeholders in the food system, including policy-makers, farmers, processors, retailers, and consumers, are required to transform food systems.
With insufficient resources and in view of environmental changes, resolving potential threats to food security would first entail a paradigm shift in thinking. Instead of thinking of countries as individual “food producers”, we need to consider dynamics that affect the security of the global food system. At the local, national, and global level, actions through dialog and collaborations with all members of the food system, including producers, manufacturers, distributors, and others, will have to be taken. Although productive collaboration with industry and individuals is important, potential approaches should concentrate on seeking synergies between climate change and environmental priorities; albeit with unavoidable trade-offs that require careful management. Holistic strategies can be employed to build incentives to ease the transition from business-as-usual to achieve better food security.
One of the greatest challenges of the 21st century is the risk of climate change, among several other factors, to food security. The effects of climate change on food security are now evident in scientific studies [9]. Crop effect experiments are prevalent in nature, without a less significant influence on fish and livestock production [13,14]. Although incremental changes such as rising temperatures and sea levels will only have significant consequences over the coming decades, farmers must deal with evolving weather conditions and the increasing frequency and severity of extreme weather incidents [15]. The more profound problem of climate change is instability and uncertainty. It is almost impossible to understand the precise nature of future weather for even the next season [16].
1.2. Gaining Insights from Unified Analysis of the GFSI
Artificial intelligence (AI) [17] has been used to enable farmers to grow higher-quality crops and to achieve higher food production per acre. The world’s rising food demands are being met with leading technological developments. The growth of digital agriculture and its associated technology have opened up a number of new data analytics-related opportunities [18,19,20]. AI-enhanced agriculture requires automated data collection, decision-making, and corrective action by robotics to enable the early identification of crop diseases, to provide livestock with timely nutrition and to maximize agricultural inputs and returns based on supply and demand. For example, high-tech approaches, such as precision agriculture, measure the exact quantity of fertilizer needed by the soil on a farm and avoid the excessive greenhouse gas release while simultaneously increasing yields. Other activities include integrated pest management systems and pesticide information systems to improve farmers’ training at all levels, and new funding and technologies to help smallholder farmers build more sustainable food systems.
The present paper demonstrates a simplistic approach to show how AI is useful for aiding humans via probabilistic reasoning for the analysis of the results provided by predictive modeling of the GFSI. This paper also utilizes an exploratory approach in predictive modeling to illustrate how food security can benefit from AI-assisted probabilistic reasoning to interpret theoretically useful scenarios to inform policy making. Rather than always being led by AI, people should take the lead by using AI to augment human cognitive capabilities [21,22].
2. Research Problem and Research Questions
2.1. Research Problem
In the use of AI-based analytics, is there an approach that can be easily used by beginners to make data analysis and the interpretation of results possible for people not acquainted with programming? In addition, is there a feasible way for beginners to play with specific variables in various computer simulation scenarios using user-friendly AI software? How can the insights from the analyzed data be conveyed in intuitive non-technical terms that other people, e.g., policy makers, who are more concerned about the “overall bigger picture”, can clearly understand?
We suggest that there is a solution that can be used to resolve these above-mentioned issues. The user-friendly AI-enabled approach that will be utilized in this paper is based on Bayesian Network (BN) probabilistic reasoning [23,24,25]. It can be applied using a software package that is suitable for beginners, as it does not require any software programming skills. Using this approach, humans can take the lead and ponder over the predictive models generated by AI. Probabilistic reasoning using BN models is more intuitive for communicating with multiple stakeholders across multidisciplinary domain verticals, as thinking in terms of probability is closer to natural human thought, compared to using classical frequentist correlations or p-values [26]. The examples in the current paper will also facilitate opportunities for experimenting with, e.g., how the adjustment of environmental variables could predict different outcomes of food security.
2.2. Research Questions
The characteristics of the dynamic global food security system were analyzed using these research questions:
- RQ1:
- What are the factors that contribute to the current conditions that characterize the global food security?
- RQ2:
- What are the predictive impacts of the worst-case scenario in the resilience of the natural resources on the outcome of food availability, so that policy makers can be informed and strive to avoid them?
3. Methods
3.1. The Reasons for Selecting BN to Analyze Global Food Security
The probabilistic reasoning theory that underlies BN allows one to intuitively understand how global food security data can be analyzed and interpreted. Consequently, predictive reasoning becomes possible, because questions may be posed in the BN to assess the likelihood of the food security outcomes, after the observation of evidence is provided. The BN can be used to measure how direct and/or integrative resilience factors from natural resources can affect the probability of occurrence of food security outcomes. Using BN modeling is suitable in this context, because its effectiveness is well established in predictive applications of real-world scenarios [27,28].
BN is computationally intense. In recent years, however, with the advancement of faster processors, BN can now even be run on notebook computers. As a result, BN is gaining widespread use by researchers [29]. Moreover, BN is ideal for processing non-parametric data since it does not have to presume normal parametric distribution across the model’s underlying parameters [30,31,32]. The Bayesian approach makes simulations possible by integrating prior knowledge into data analyses, before producing predictive inferences. It is not based on classical frequentist approaches. As a result, when analysts use Bayesian data-analytical techniques, numerous null hypothesis tests [33,34,35] are not needed.
BN also helps to calculate mutual information (MI), as delineated in Shannon’s Information Theory [36]. MI is the probability of commonality between two data distributions, even if they are not parametric. As BN is not based on classical frequentist approaches but is based upon probabilistic inference, it can be used to predict unusual or unlikely worst case situations [37] and for analyses of system collapse or failures [38]. BN is particularly superb for predictive simulations amid uncertainty [39]. In the later segment of this paper, BN was used to predict how much the worst-case scenario in natural resources could potentially impact (or not impact) food availability. This form of dynamic predictive analysis is particularly useful for supporting food security agencies while they are experiencing uncertainties.
3.2. The Research Model
It was the intent of this paper to inspire researchers who may not be computer scientists to consider using AI to address food security issues together with stakeholders. In effect, discussing concerns and troubleshooting possibilities is much more relevant than attempting to find a singular so-called right solution.
BN was selected because it is a methodology that can be used to model system performance using two proven techniques in engineering: the Markov Blanket [40] and Response Surface Methodology (RSM) [41,42,43,44]. Using these two techniques in BN, the interactions between abstract variables in the GFSI can be examined.
The BN models concerning global food security will be presented in the subsequent sections. A supervised BN model was employed to show the reader a user-friendly form of AI. The following segments will be used to achieve this:
3.2.1. Descriptive Analytics of the Current Conditions of Global Food Security
Purpose: through machine-learning, to use BN to obtain the informational motifs [45] in the GFSI dataset in order to understand the current conditions that may affect global food security.
3.2.2. Predictive Analytics to Model the Worst-Case Scenario Impacts of Natural Resources on Food Availability
Purpose: for the prediction of counterfactual GFSI outcomes. In order to better inform policymakers, the BN probabilistic reasoning approach was utilized to depict scenarios related to food security. For predictive analytics, counterfactual simulations were used to analyze the dynamics of the informational motif [46,47].
3.3. Data Source
The current paper provides an approach which facilitates discussions about global food security with descriptive analytics, in conjunction with predictive simulations via BN using the indicators and data from the GFSI [48] (see Appendix A). The GFSI examined the core challenges of affordability, availability, and quality in 113 countries. All the countries were invited by the Economist Intelligence Unit (EIU). The 113 countries were the respondents to the EIU which participated and contributed data to the GFSI. It is a dynamic model built from 34 unique indicators of food security drivers across developing and developed countries. However, the GFSI examines factors affecting food insecurity beyond hunger. It also includes a factor concerning natural resources and resilience. It assesses the exposure of global food security to climate change impacts, its impacts by natural resource risk, and its adaptation to these risks.
3.4. AI-based BN Software Used and Pre-Processing of the Data
Bayesialab was the software which we used [49]. The dataset from the GFSI was opened in Bayesialab. The initial step was to detect any missing values in the data, but there were no missing data in the 2019 version of the GSFI. Next, the Bayesialab software was used to discretize the continuous data into categories. The R2-GenOpt algorithm was selected by the researchers in Bayesialab to perform the data discretization process [50].
4. Results
4.1. The Current Conditions of Global Food Security
BN can be used to examine the nodes (variables), their relationships, and the ways in which initial conditions of various natural resource input variables will affect potential food availability outcomes. On the other hand, BN can also be used for predictive inference in the initial conditions, if the final (either good or bad) outcomes are provided. In the current paper, examples of how simulations can be used via BN will be provided in the section about predictive analysis. For example, we can use BN to calculate the initial levels of natural resources that would result in a high likelihood of low food availability.
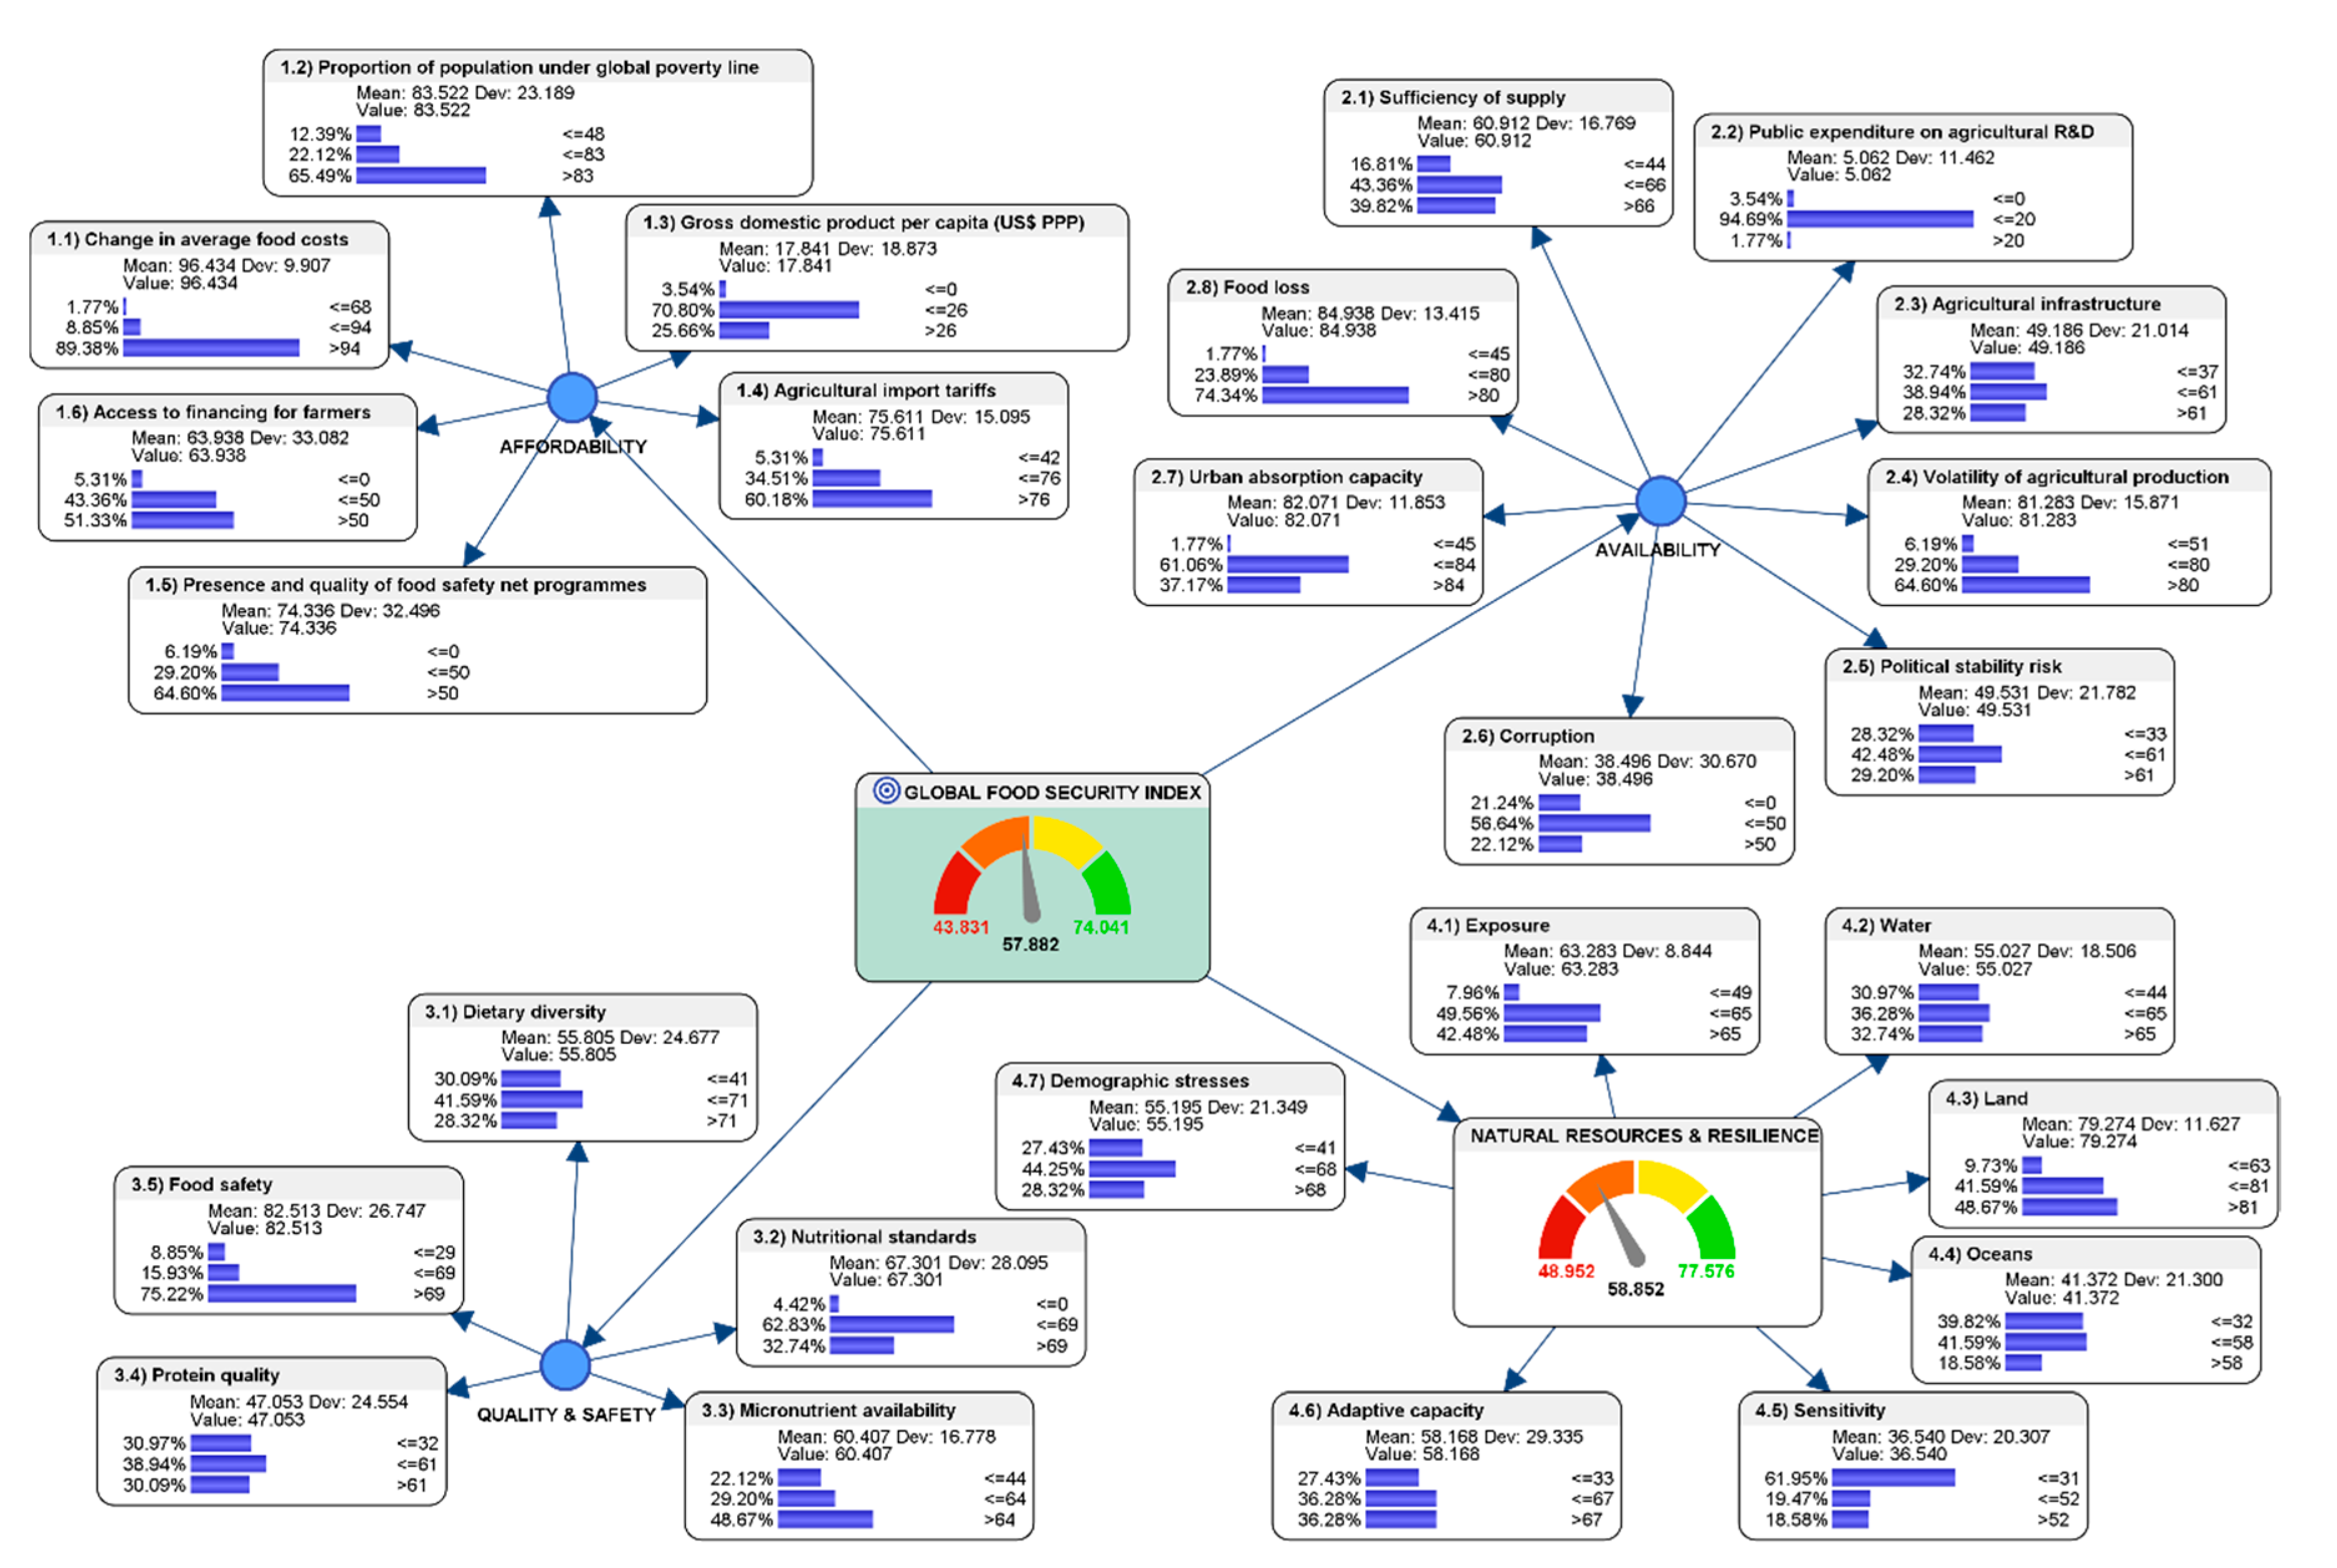
A naïve Bayes model, which is the easiest form of BN that can be understood by beginner AI practitioners, was used to analyze how input variables in food availability, affordability, quality and safety, and the resilience of natural resources can all contribute to influence global food security. Descriptive analysis was performed on the GFSI dataset in order to extract the characteristics of the informational motif. Subsequently, predictive analysis can make use of that information motif to produce scenario simulations to predict, for example, the counterfactual initial conditions in natural resources and resilience, given the final outcome of food availability. These predictions can inform agencies or individuals that are concerned with global food security about the scenarios which they may like to avert or achieve. The visualization of the results produced by descriptive analysis of the GFSI dataset is shown in Figure 1.
The results that answer RQ1 were thus interpreted. In the current state of food affordability, the variables that underlie it are as follows. There was a high probability (89.38%) in the change in average food costs, a high probability (65.49%) in the proportion of population living under the global poverty line, a relatively low probability (25.66%) in the high-level gross domestic product purchasing power parity (PPP) per capita (USD 26 PPP/capita), a high probability (60.18%) in high-level agricultural import tariffs, a high probability (64.60%) in the high-level of presence and quality of food safety net programs, and a high probability (51.33%) in the high-level of access to financing for farmers.
The variables that contribute to the current state of food availability are as follows. There was a moderately low probability (39.82%) of sufficiency of food supply at the high-level, a very high probability (94.69%) of mid-level public expenditure in agricultural R&D, a moderately low probability (28.32%) in the high-level of availability in agricultural infrastructure, a moderately high probability (64.60%) in the high-level of volatility of agricultural production, a moderately low probability (29.20%) in the high-level of political stability risk, a moderately low probability (22.12%) in the high-level of corruption, a moderately low probability (37.17%) in the high-level of urban absorption capacity, and a high probability (74.34%) in the high-level of food loss.
The variables that contribute to the current state of food quality and safety are as follows. There was a moderately low probability (28.32%) in the high-level of dietary diversity, a moderately low probability (32.74%) in the high-level nutrition standards, a moderate probability (48.67%) in the high-level of micronutrient availability, a moderately low probability (30.09%) in the high-level of protein quality, and a high probability (75.22%) in having high-level food safety.
The variables that contribute to the current state of natural resources and resilience are as follows. There were moderate probabilities of food security’s exposure to the mid-level of climate change (49.56%) and high-level of climate change (42.48%), respectively. However, this implies that the combined overall exposure of food security to climate change can become very high (92.04%) if left unchecked. There was a moderately-low probability (32.74%) in the high-level of agricultural water risk. There were moderate probabilities of land degradation, grassland, and forest change (41.59%) and a high-level of climate change (48.67%), respectively. However, this implies that the combined overall land degradation, grassland, and forest change can become very high (90.18%) if left unchecked. There was a relatively low probability (18.58%) in the high-level aggregation of ocean eutrophication risk, marine biodiversity risk, and marine protected areas risk. There was a relatively low probability (18.58%) in the high-level of food security sensitivity that was an aggregated combination of food import dependency, dependence on natural capital, and disaster risk management. There was a moderately low probability (36.28%) in adaptive capacity that was an aggregated combination of early warning measures/climate smart agriculture, and national agricultural risk management system. There was a moderately low probability (28.32%) in demographic stresses that were an aggregated combination of population growth and urbanization.
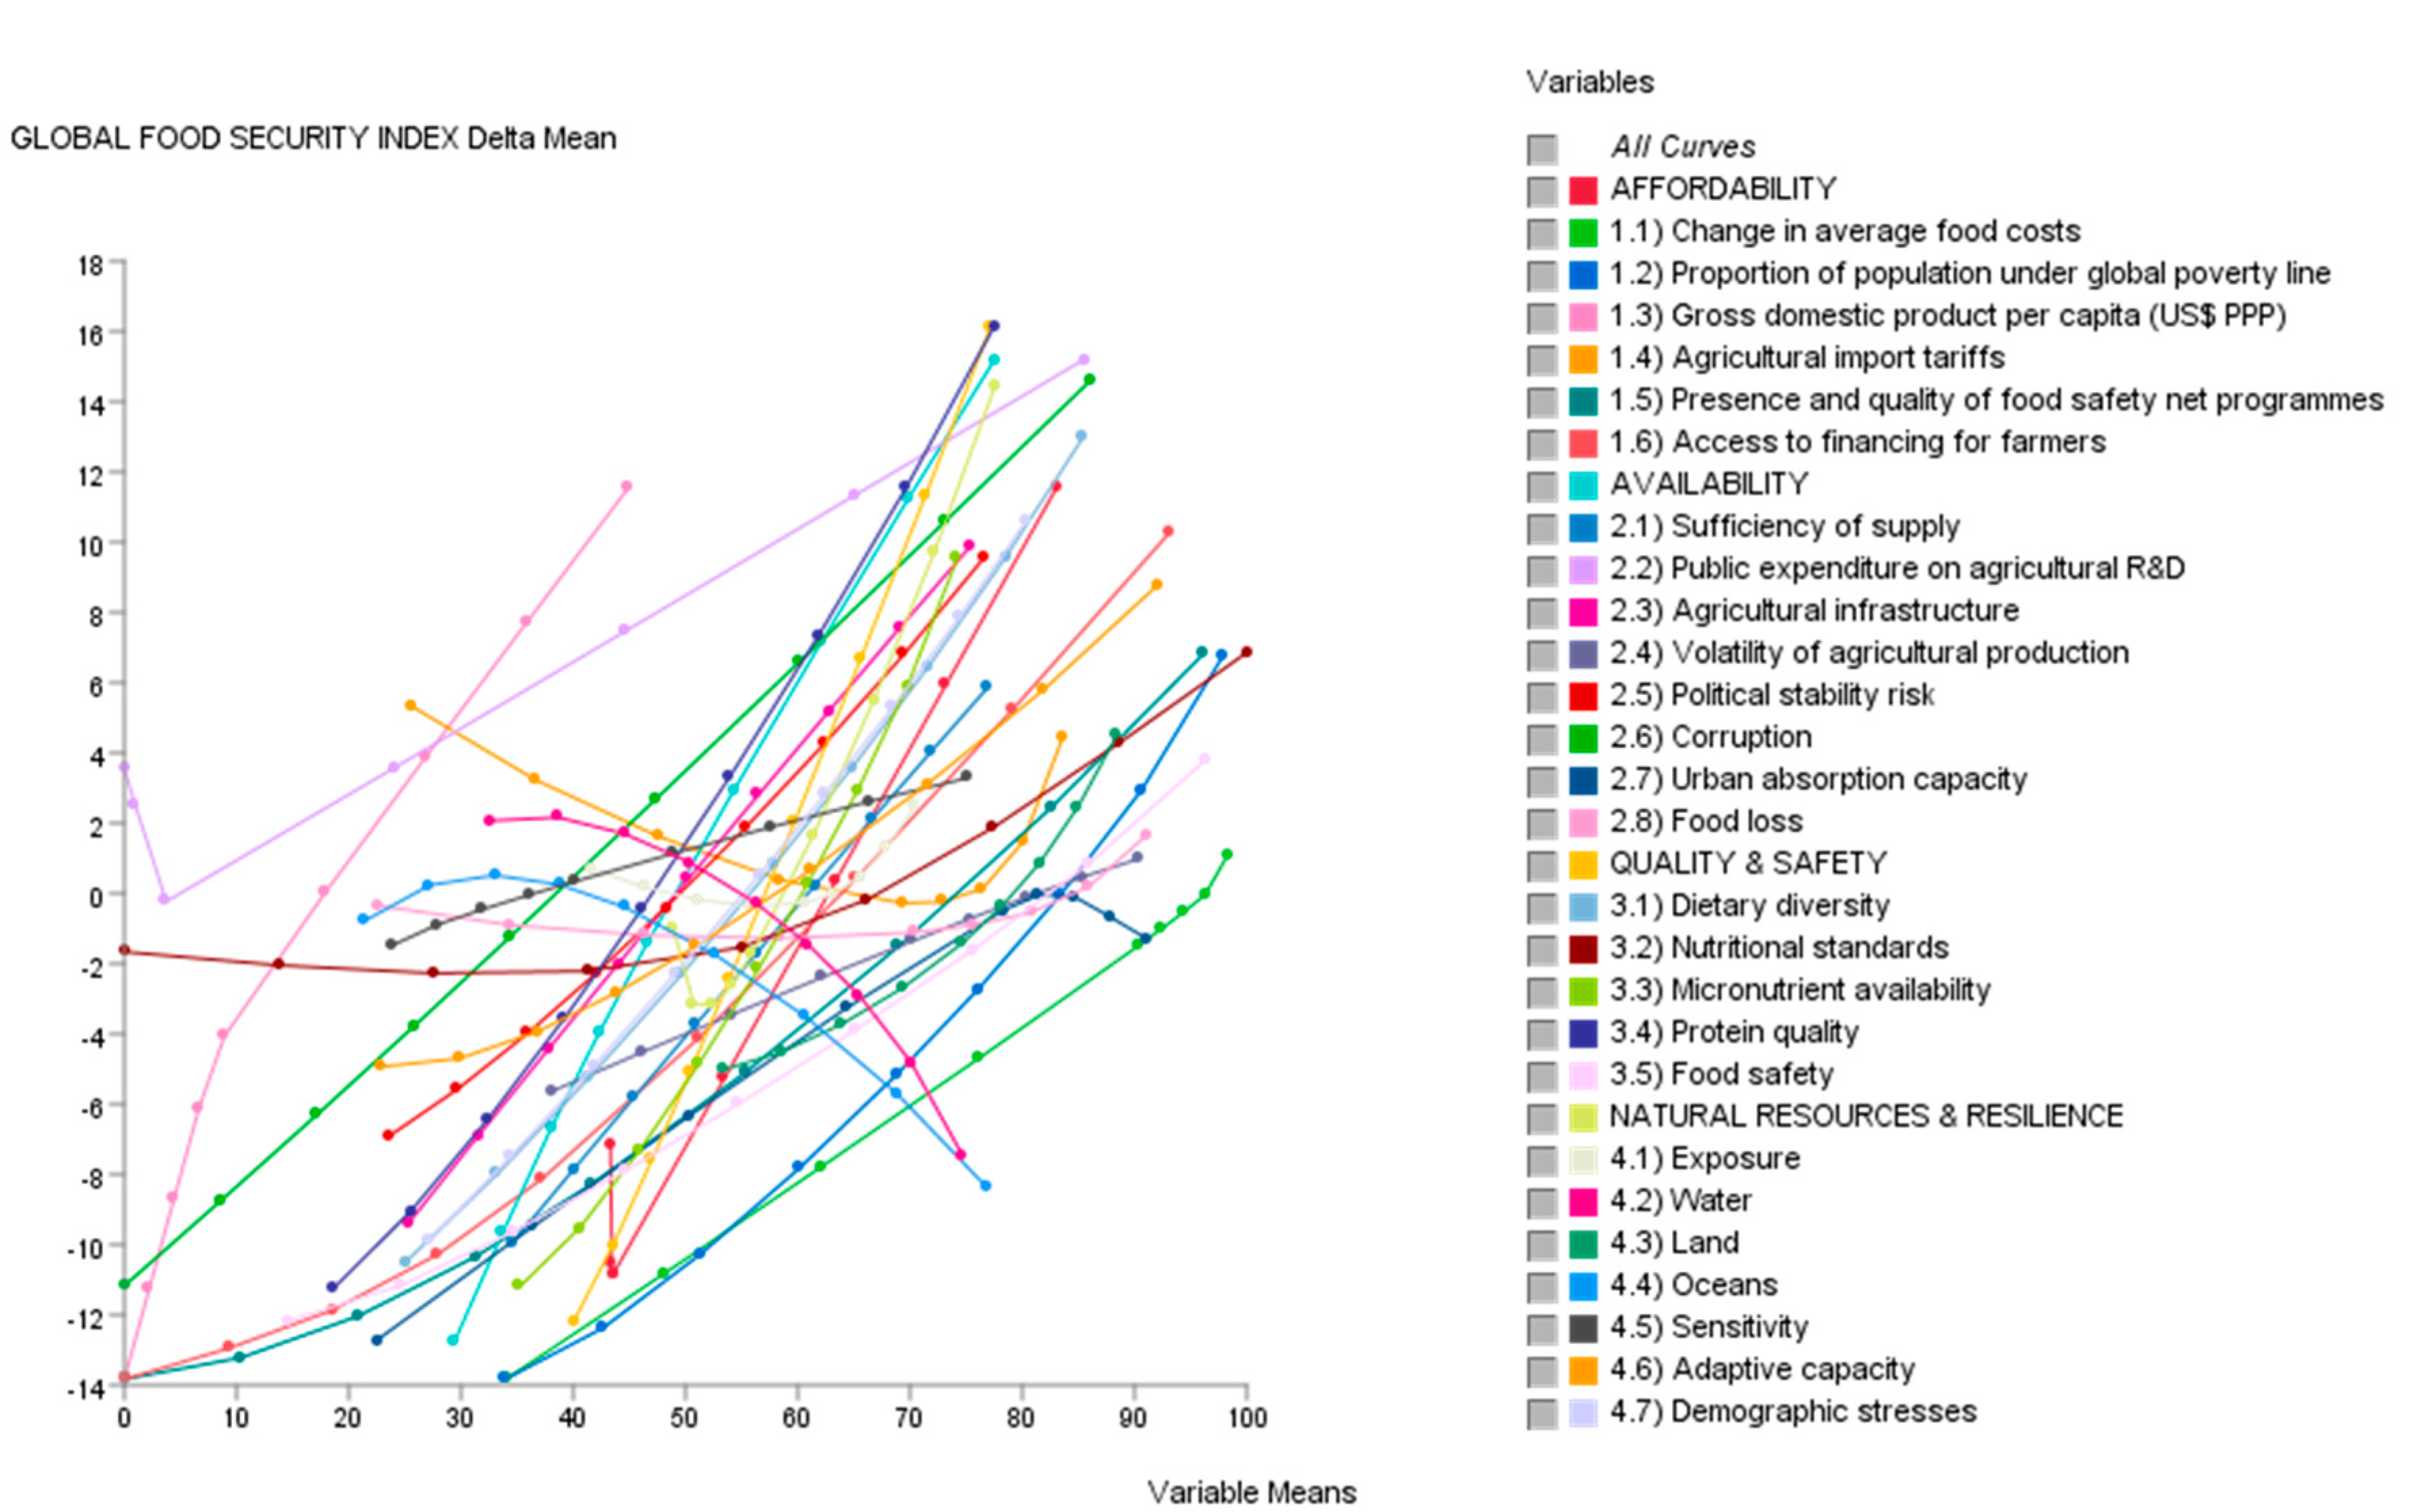
4.2. Mean-target Total Effects Analysis
To investigate the effects of the myriad variables on global food security, the Bayesialab Total Effects calculator was activated. As shown in Figure 2, the total impact on the target node of the variables (the result of the GFSI level) implied that its relations with the variables were never perfectly linear. Most of them were almost always curvilinear. However, it remains challenging to use only this graph to make predictive inferences about food security. Hence, we needed to proceed to the predictive modeling techniques using BN, which will be presented in the subsequent section.
4.3. Predictive Inference Using BN: What is the Worst-Case Scenario that Policy Makers Should Avoid?
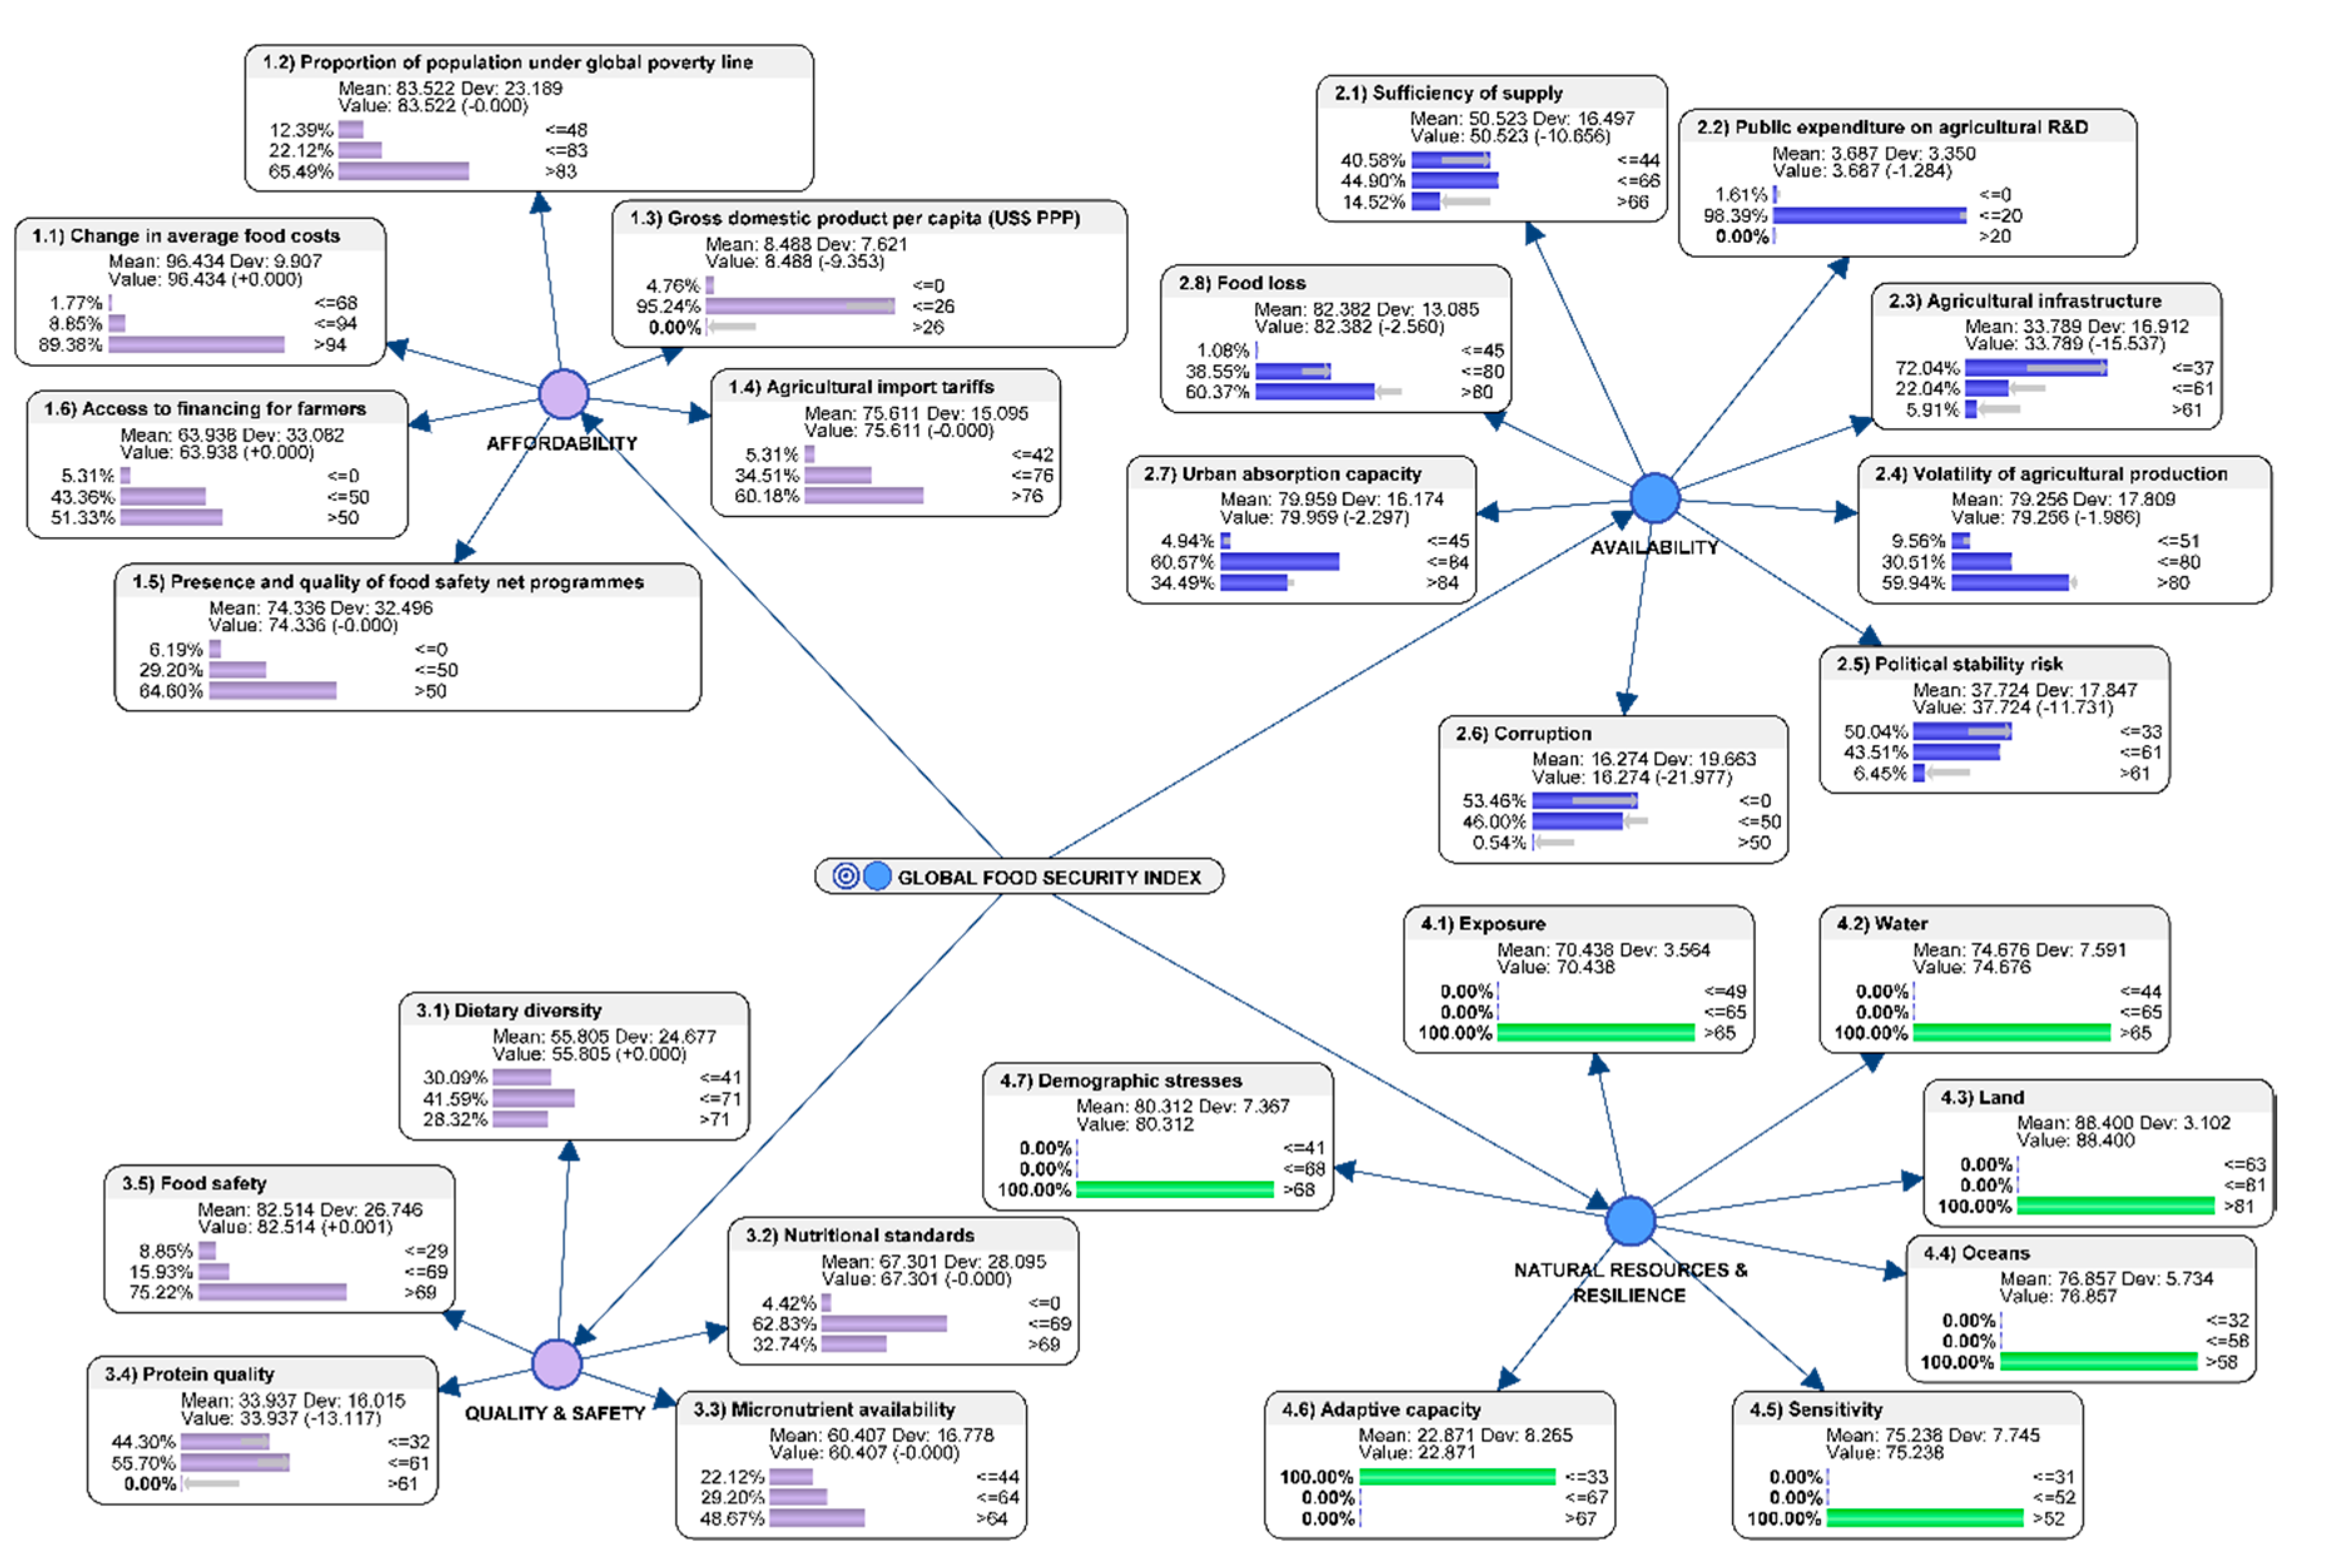
Hard evidence was applied to the parameters of the node “natural resources & resilience” so they would be performing at their respective worst-levels (see Figure 3). In agricultural infrastructure, the model studies the possibilities regarding how natural disasters may impact infrastructure; disasters may destroy parts of the infrastructure and disrupt access to food sources. The variables that could contribute to the worst state of natural resources and resilience are reported as follows. There would be 100% probability in food security’s exposures to the high-level of climate change. There would be 100% probability in the high-level of agricultural water risk. There would be 100% probability in the high-level of positive land degradation, grassland, and forest change. There would be 100% probability in the high-level aggregation of ocean eutrophication risk, marine biodiversity risk, and marine protected areas risk. There would be 100% probability in the high-level of food security sensitivity that is an aggregated combination of food import dependency, dependence on natural capital, and disaster risk management. There would be 0% probability in the high-level of adaptive capacity that is an aggregated combination of early warning measures/climate smart agriculture, and national agricultural risk management system. There would be 100% probability in high-level demographic stresses that are an aggregated combination of population growth and urbanization.
To answer RQ2, the counterfactual predictions of the worst-case scenario for food availability were simulated as follows. The variables that underlie the “availability” node in the BN are as follows. There would be a lower probability (a predicted 14.52% lower compared to the original baseline of 39.82%) of sufficiency of food supply at the high-level. This would have negative impacts on global food availability. There would be a slightly higher probability (a predicted 98.39% higher compared to the original baseline of 94.69%) in the mid-level, but 0% probability in the high-level of public expenditure on agricultural R&D. There would be a lower probability (a predicted 5.91% lower compared to the original baseline of 28.32%) in the high-level of accessibility to agricultural infrastructure. There would be a lower probability (a predicted 59.94% lower compared to the original baseline of 64.60%) in the high-level of volatility of agricultural production. There would be a lower probability (a predicted 6.45% lower compared to the original baseline of 29.20%) in the high-level of political stability risk. There would be a lower probability (a predicted 0.54% lower compared to the original baseline of 22.12%) in the high-level of corruption. However, this counterfactual result of lower probability in corruption is inconclusive, as there may be other unknown confounding factors that have not been considered in the current paper. There would be a slightly lower probability (a predicted 34.49%, which would be lower compared to the original baseline of 37.17%) in the high-level of urban absorption capacity. There would be a lower probability (a predicted 60.37% lower compared to the original baseline of 74.34%) in the high-level of food loss. No model is perfect. However, some are useful. The counterfactual results generated by the BN are absolutely not definitive. They present the preliminary cognitive scaffolding for opportunities to engage in further discussions between the analysts and other stakeholders from multi-disciplinary domains.
4.4. Efficacy of the Predictive BN Model
4.4.1. Evaluation of the Predictive Efficacy Using Cross-validation by K-folds
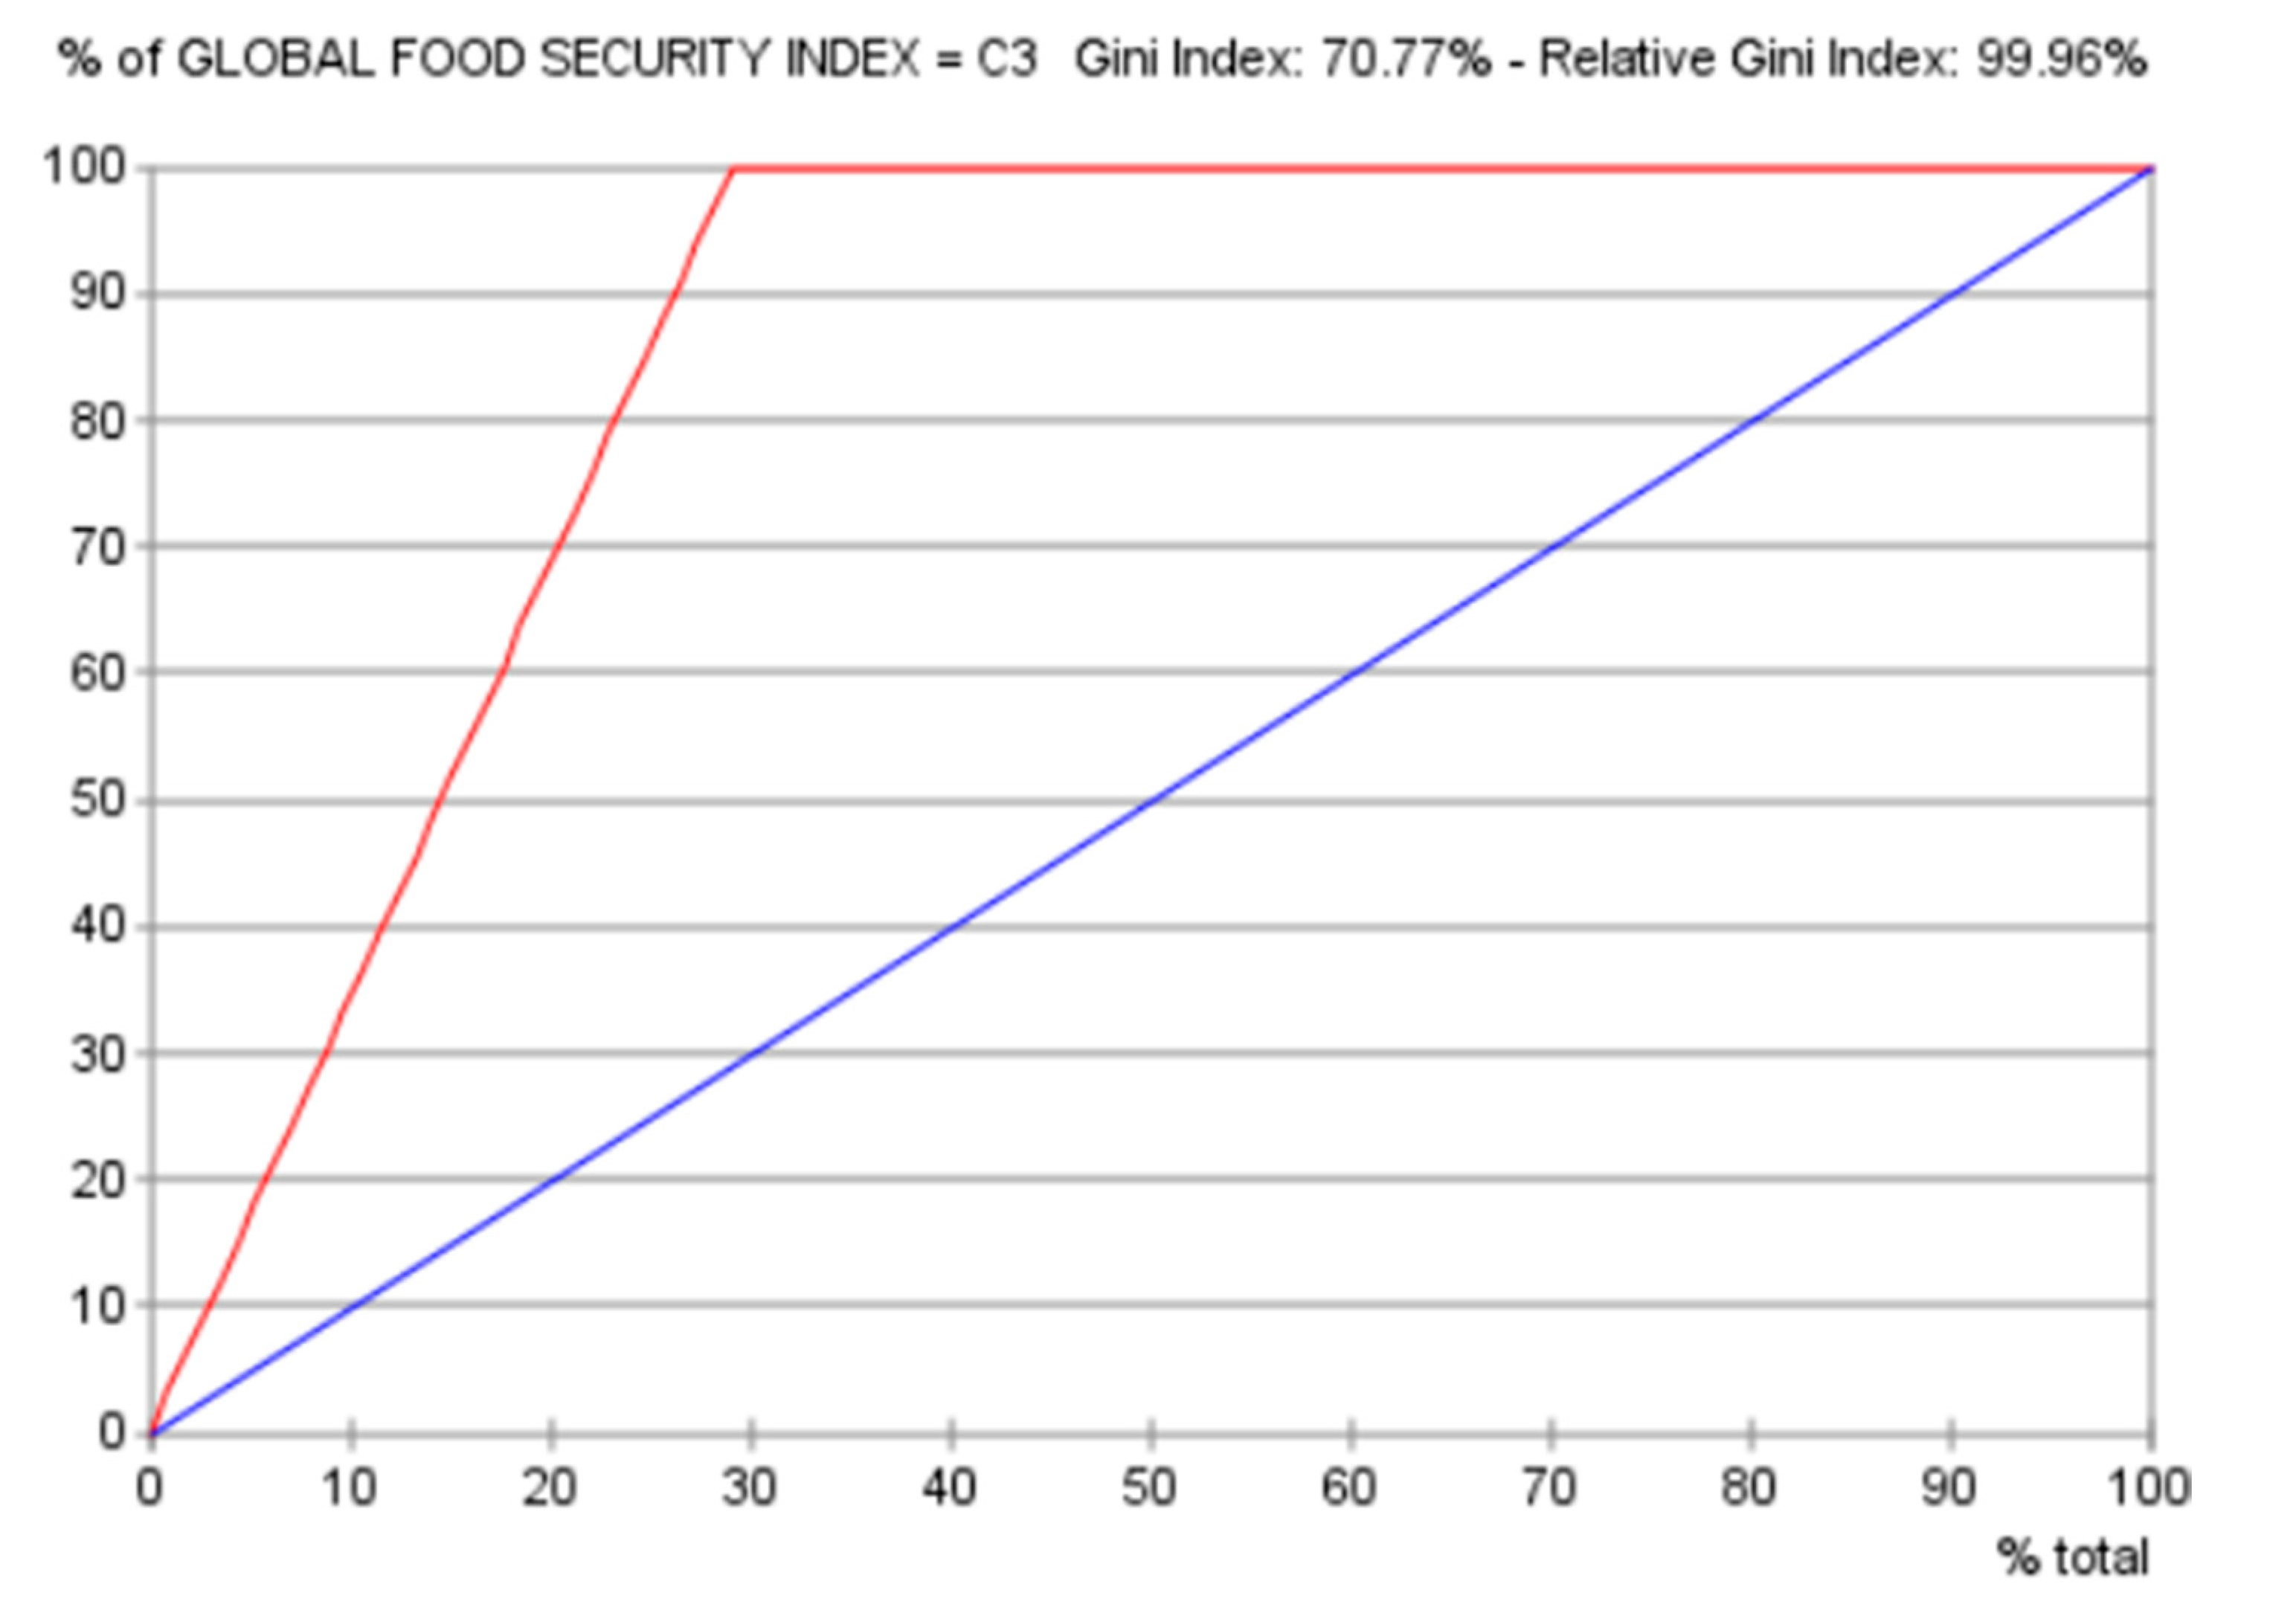
The efficacy of a predictive model can be evaluated via cross-validation by K-Fold on the data distribution in each node in the BN. The results from the cross-validation by K-Fold analysis tool in Bayesialab are presented as follows. The Overall Precision was 100%; the Mean Precision was 100%; the Overall Reliability was 100%; the Mean Reliability was 100%; the Gini Index was 70.7696%; the Relative Gini Index was 99.9621%; the Lift Index was 2.2202; the Relative Lift Index was 100%; the Receiver Operating Characteristic (ROC) Index was 100%; the Calibration Index was 50.3303%; the Binary Log-Loss was 0.0145; the Correlation Coefficient R was 0.9968; the Coefficient of Determination R2 was 0.9937; the Root Mean Square Error (RMSE) was 1.0722; and the Normalized Root Mean Square Error (NRSME) was 3.5492%.
4.4.2. Evaluation of the Predictive Efficacy Using the Gains Curve and the Lift Curve
In the gains curve (see Figure 4), around 24% of the attributes were predictively concluded to be the most impactful toward the target node GFSI. The diagonal blue line represents the gain curve without using this predictive model. The red line represents the gain curve that utilized the predictive BN model. The Gini index of 70.77% and relative Gini index of 99.96% imply that the gains of using this predictive model were acceptably good.
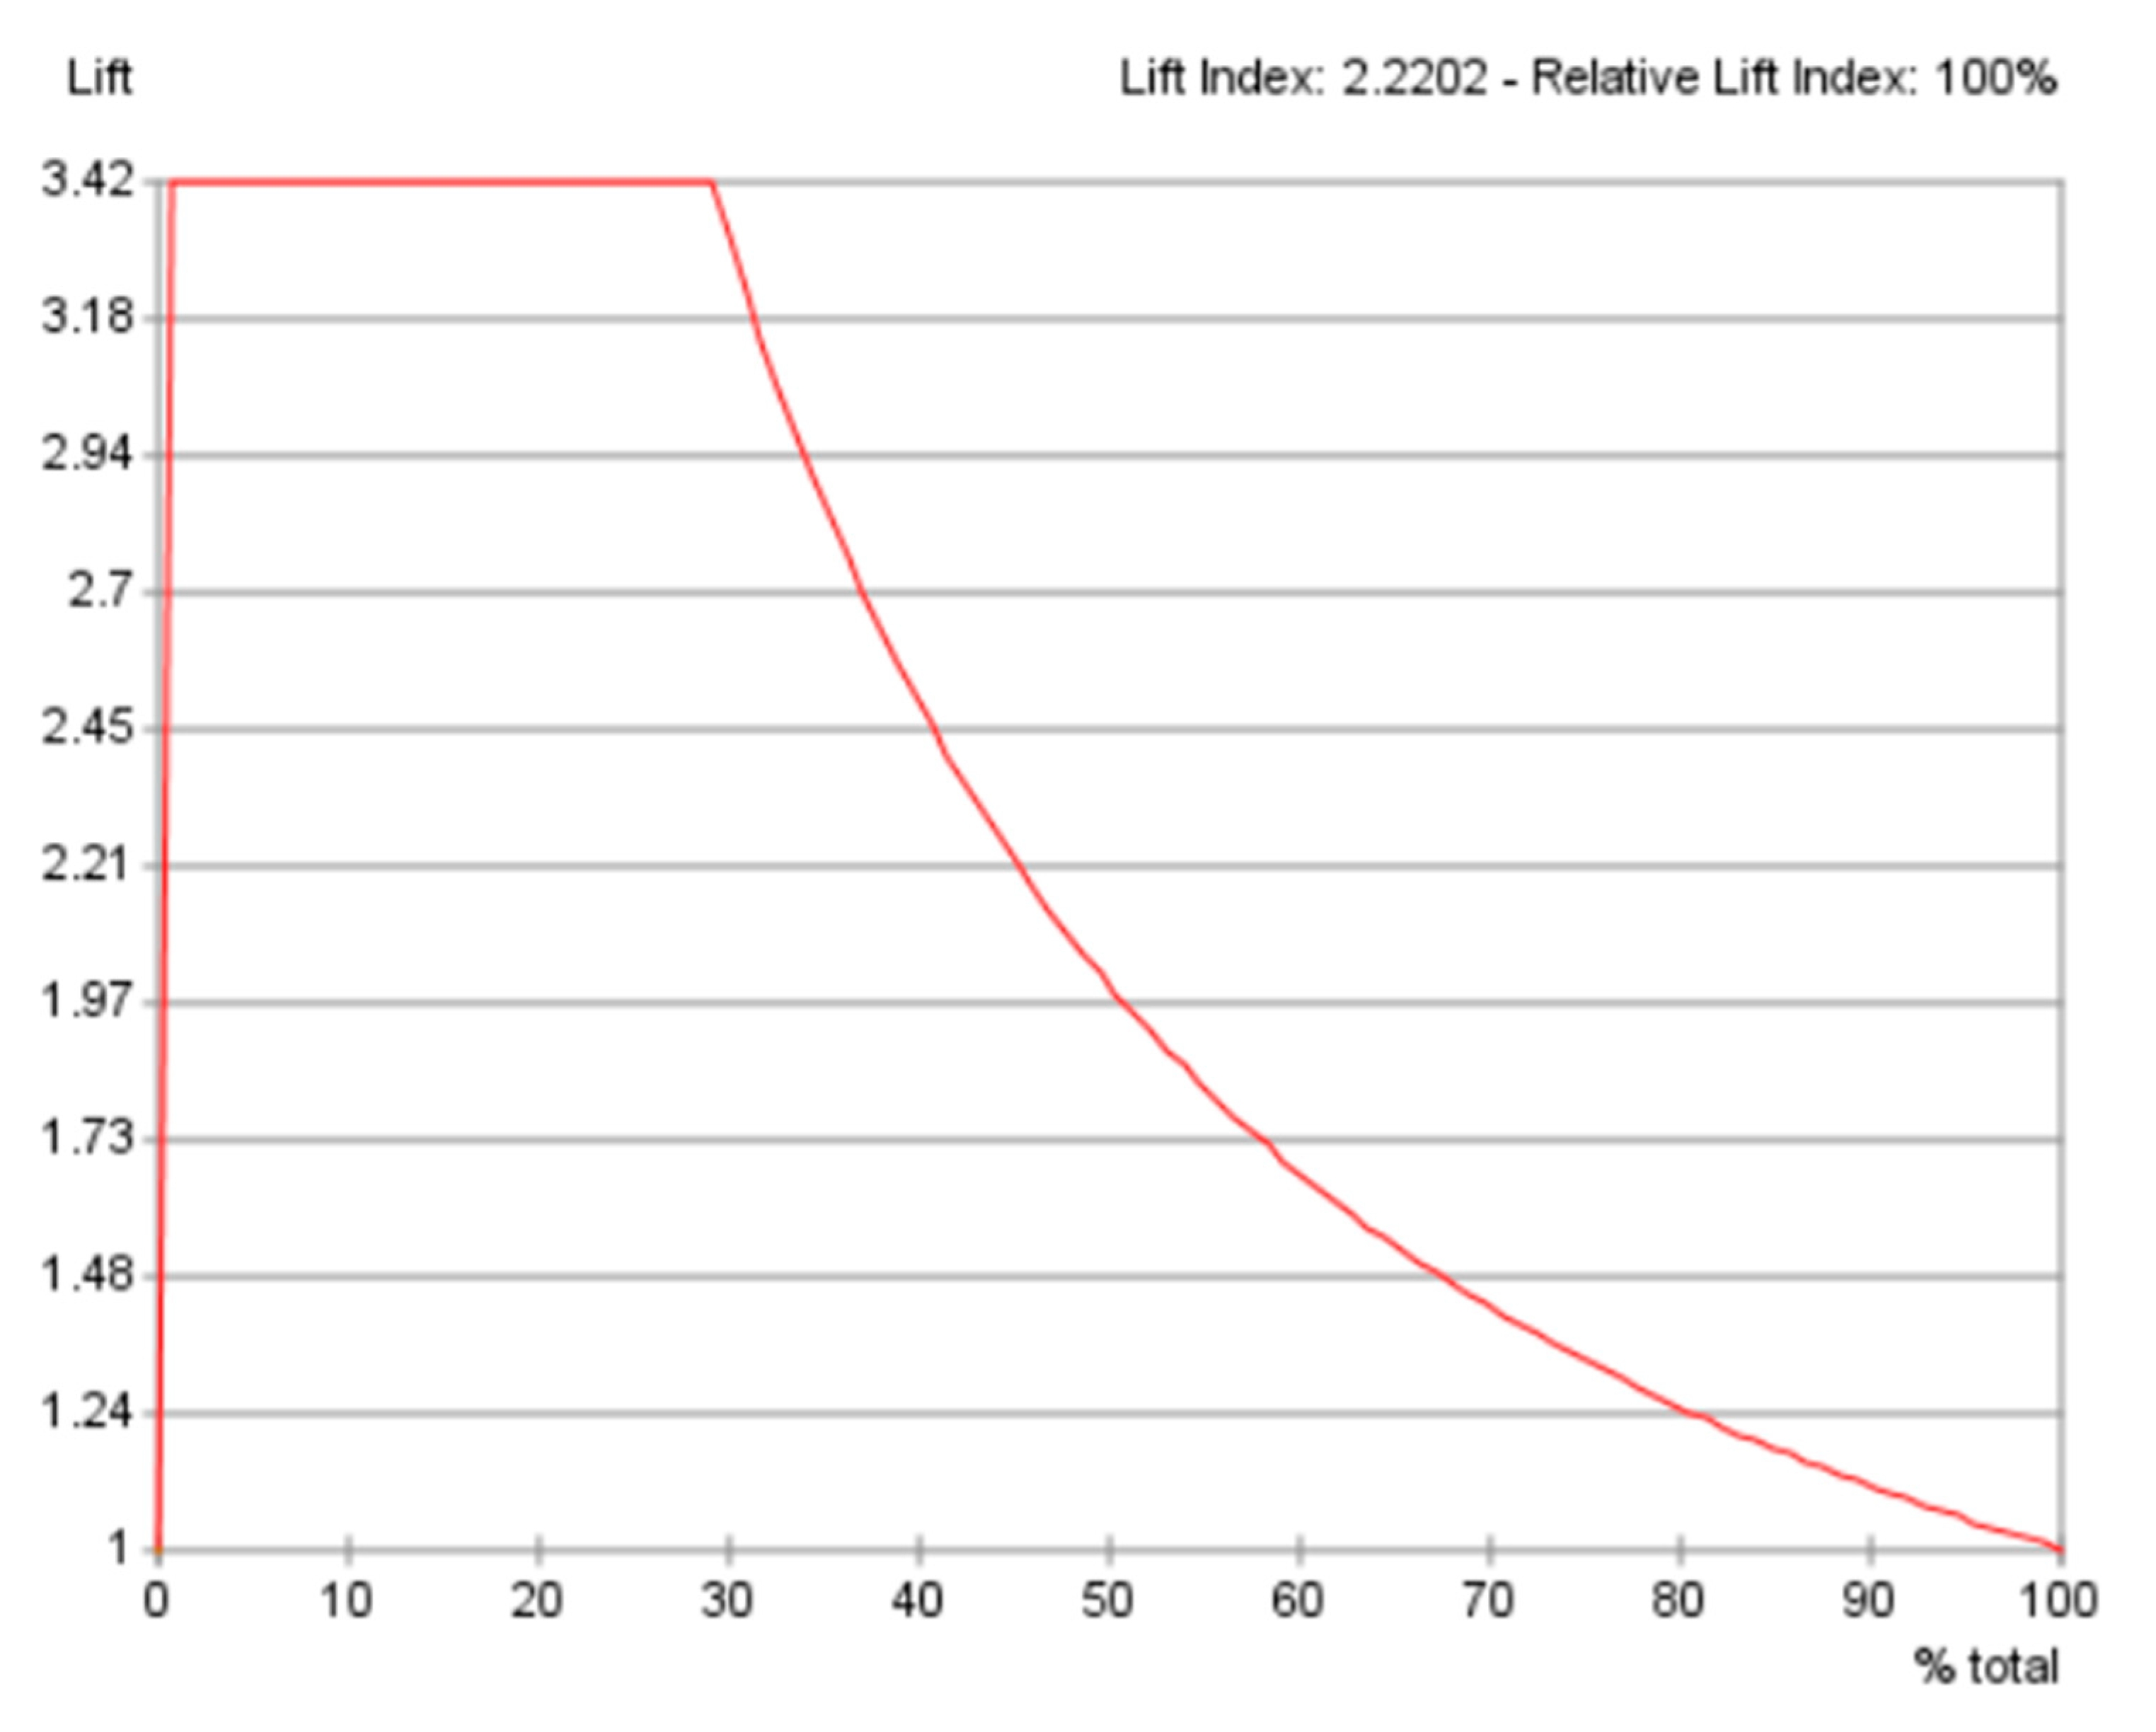
The lift curve (see Figure 5) was built upon the results of the gains curve. The best lift was around 3.42. It can be interpreted as the ratio between 100% and 30%. The lift index was 2.2202 and the relative lift index was 100%. Together, they show that the efficacy of this predictive BN model was good. Altogether, the gains curve as well as the lift curve show that the predictive efficacy of the BN model was good.
4.4.3. Limitations of the Study
The Bayesian network model used in the current study was based on the naïve Bayes algorithm, as it is ideal for exploratory studies that do not presume causal node relationships. The exploratory nature of BN predictive analytics in this work makes the theoretical results realistic for discussions and education, but it is not definitive. Food security analysts should be able to explore different models that may better represent the dataset. As in any simulation analysis, the results depend on the computational model’s dataset. The current paper used only one semi-supervised machine learning method for illustrative purposes. It applied only to the BN model generated from the current 2019 version of the GFSI dataset. Therefore, caution must be exercised when evaluating possible relationships between variables (nodes) in the BN model. Methods used to evaluate the predictive capacity of the BN and analytical limitations were mentioned in the previous sections. The discussion and the conclusion will be presented next.
5. Discussion and Conclusions
The current forecast for rising global food security reflects a large unpredictable supply of new crops and animal diseases in conjunction with unforeseen economic, political, climatological, and biological shifts. For developed nations, this implies an increased need for the development of agricultural production. The paper demonstrates the realistic applicability of agricultural production, particularly with regard to the environment, economic sustainability, market engagement, and social consciousness. In addition, the results obtained are also of interest to the industrial sector, and in particular, the agri-food industry in developed countries. Theoretically, the study results are likely to stimulate specialists’ curiosity in areas such as customer behavior, traditional food use, economics, sustainable agricultural production, and agricultural productivity.
Agricultural and rural computerization is the cornerstone for the development of agriculture; in agricultural information systems, there are already various methods of designing models. At the European Union (EU) level, the European Commission is calling on Member States to take advantage of the promise of emerging technology and digitization in agriculture, to boost the sector’s productivity and profitability, while simplifying farmers’ everyday jobs.
Using the user-friendly AI-based BN method in this paper, various scenarios can be simulated to measure the predictive conditions at the global system-level for food safety outcomes. Silapachote and Srisuphab [51] have shown that using AI can challenge and even improve the individual’s cognitive ability by extending and improving logical complexity in problem solving. Through easy-to-use applications, for example, Bayesialab [52] or other BN software such as GeNie by BayesFusion [53], or Netica by Norsys [54], or Bayes Server [55], food security analysts could adapt the exemplars to analyze their own datasets. Different farm modeling is important, in these cases, for the evaluation of agricultural capacity, for example, in sensitive areas such as the Black Sea, in Sub-Saharan Africa, as well as in other regions of the world [56,57].
Global food security remains a problem worldwide. Crop yields have declined in many areas due to decreasing investment in research and water scarcity. Climate change is detrimental to food security in many areas. While agroecological approaches give some promise to improve yields, increased investment and policy reforms could significantly improve food security in developing countries [58]. Climate change could impact global food security. The effects of climate change on crop production that could have ramifications for food supply. The stability of entire food systems can be threatened by short-term supply variability. Climate instability and transition are likely to exacerbate food insecurity. Therefore, it is imperative to make significant mitigation steps in favor of a “climate intelligent food system” [59].
To build safer, future-proof food protection technologies, food researchers and policymakers who are not computer scientists can leverage AI to support decision-making to design better food security systems that are future-ready. The current paper contributes significantly to the extant literature by providing a user-friendly approach so that AI usage is democratized [60,61]. This allows novice AI users to perform research analysis using probabilistic reasoning using BN. Controlled studies may be performed using this method in computational models. Some variables can be held constant, and other variables can be modified to simulate a myriad of different scenarios. Hence, simulations of “what if” scenarios are possible. This enables predictive inferences of the conditions for optimizing favorable outcomes and for forecasting the conditions that can be used to prevent adverse outcomes from ever occurring in global food security.
Author Contributions
Conceptualization, M.-L.H., S.-M.C., Y.J.C.; methodology, M.-L.H., S.-M.C.; software, M.-L.H.; validation, M.-L.H., S.-M.C., Y.J.C.; formal analysis, M.-L.H., S.-M.C., Y.J.C.; investigation, M.-L.H., S.-M.C., Y.J.C.; resources, M.-L.H., S.-M.C., Y.J.C.; data curation, M.-L.H., S.-M.C.; writing—original draft preparation, M.-L.H., S.-M.C., Y.J.C.; writing—review and editing, M.-L.H., S.-M.C., Y.J.C.; visualization, M.-L.H., S.-M.C., Y.J.C.; funding acquisition, M.-L.H. All authors have read and agreed to the published version of the manuscript.
Funding
The research is supported by the Office of Education Research of the National Institute of Education in Nanyang Technological University Singapore.
Acknowledgments
The authors would like to sincerely thank the editors, the staff of the journal, the anonymous reviewers, and friends who have contributed in one way or another to this study.
Conflicts of Interest
The authors of this manuscript declare that there are no conflicts of interest.
Appendix A

Table A1.
Global Food Security Index variables, as published by the EIU [48].
Table A1.
Global Food Security Index variables, as published by the EIU [48].
| (1) AFFORDABILITY | Affordability measures the ability of consumers to purchase food, their vulnerability to price shocks, and the presence of programs and policies to support the people when shocks occur. |
| (1.1) Change in average food costs | Consumer Prices, Food Indices (2010 = 100) |
| (1.2) Proportion of population under global poverty line | % of population living under USD 3.20/day 2011 PPP |
| (1.3) Gross domestic product per capita (USD PPP) | USD at PPP/capita |
| (1.4) Agricultural import tariffs | % |
| (1.5) Presence and quality of food safety net programs | Qualitative assessment (0–4)Presence, funding, coverage, and operation of food safety-net programs |
| (1.6) Access to financing for farmers | Qualitative assessment (0–4) |
| (2) AVAILABILITY | Availability measures the sufficiency of the national food supply, the risk of supply disruption, the national capacity to disseminate food, and the research efforts to expand agricultural output. |
| (2.1) Sufficiency of supply | Sufficiency of supply, average food supply, change in dependency on chronic food aid |
| (2.2) Public expenditure on agricultural R&D | Ratio: Agriculture share of Government Expenditure, divided by the Agriculture value added share of GDP |
| (2.3) Agricultural infrastructure | Existence of adequate crop storage facilities, road infrastructure, port infrastructure, air transport infrastructure, rail infrastructure, and irrigation infrastructure |
| (2.4) Volatility of agricultural production | Standard deviations |
| (2.5) Political stability risk | Rating 0–100; 100 = highest risk |
| (2.6) Corruption | Rating 0–4; 4 = highest risk |
| (2.7) Urban absorption capacity | GDP (% of real change) minus the urban growth rate |
| (2.8) Food loss | Total waste/total domestic supply quantity (tons) |
| (3) QUALITY AND SAFETY | Quality and safety measure the variety and nutritional quality of average diets, as well as the safety of food. |
| (3.1) Dietary diversity | % |
| (3.2) Nutritional standards | Dietary diversity, nutritional standards, national dietary guidelines, national nutrition plan or strategy, and nutrition monitoring and surveillance |
| (3.3) Micronutrient availability | Dietary availability of vitamin A, dietary availability of iron, dietary availability of zinc |
| (3.4) Protein quality | Grams |
| (3.5) Food safety | Agency to ensure the safety and health of food, percentage of population with access to potable water, ability to store food safely |
| (4) NATURAL RESOURCES and RESILIENCE | The “natural resources and resilience” category assesses a country’s exposure to the impacts of climate change, its susceptibility to the risks related to natural resources, and how the country is adapting to these risks. |
| (4.1) Exposure | Temperature rise, drought, flooding, storm severity (annual average loss), sea level rise, and commitment to managing exposure |
| (4.2) Water | Agricultural water risk-quantity, and agricultural water risk-quality |
| (4.3) Land | Land degradation, grassland, and forest change |
| (4.4) Oceans | Ocean eutrophication, marine biodiversity, and marine protected areas |
| (4.5) Sensitivity | Food import dependency, dependence on natural capital, and disaster risk management |
| (4.6) Adaptive capacity | Early warning measures/climate smart agriculture and national agricultural risk management system |
| (4.7) Demographic stresses | Population growth and urbanization |
References
- UN-DESA. World Population Prospects. The 2015 Revision, Key Findings and Advance Tables. Available online: http://esa.un.org/unpd/wpp/publications/files/key_findings_wpp_2015.pdf (accessed on 4 July 2020).
- Vranken, L.; Avermaete, T.; Petalios, D.; Mathijs, E. Curbing global meat consumption: Emerging evidence of a second nutrition transition. Environ. Sci. Policy 2014, 39, 95–106. [Google Scholar] [CrossRef]
- Food and Agriculture Organization of the United States. International Fund for Agricultural Development; World Food Programme. The State of Food Insecurity in the World 2014. Strengthening the Enabling Environment for Food Security and Nutrition. 2014. Available online: http://www.fao.org/publications/sofi/2014/en/ (accessed on 4 July 2020).
- World Health Organization. Countries Vow to Combat Malnutrition through Firm Policies and Actions. Available online: http://www.who.int/mediacentre/news/releases/2014/icn2-nutrition/en/ (accessed on 4 July 2020).
- Kharas, H. The Emerging Middle Class in Developing Countries; OECD Report, No. 1815–1949; OECD iLibrary: Paris, France, 2010. [Google Scholar]
- Ingram, J. A food systems approach to researching food security and its interactions with global environmental change. Food Sec. 2011, 3, 417–431. [Google Scholar] [CrossRef]
- Tilman, D.; Clark, M. Global diets link environmental sustainability and human health. Nature 2014, 515, 518–522. [Google Scholar] [CrossRef]
- Porter, J.R.; Xie, L.; Challinor, A.J.; Cochrane, K.; Howden, S.M.; Iqbal, M.M.; Lobell, D.B.; Travasso, M.I. Food security and food production systems. In Climate Change 2014: Impacts, Adaptation, and Vulnerability. Part A: Global and Sectoral Aspects. Contribution of Working Group II to the Fifth Assessment Report of the Intergovernmental Panel on Climate Change; Cambridge University Press: Cambridge, UK; New York, NY, USA, 2014; pp. 485–533. [Google Scholar]
- Lobell, D.B.; Schlenker, W.; Costa-Roberts, J. Climate Trends and Global Crop Production Since 1980. Science 2011, 333, 616–620. [Google Scholar] [CrossRef] [Green Version]
- Elliott, J.M.; Elliott, J.A. Temperature requirements of Atlantic salmon Salmo salar, brown trout Salmo trutta and Arctic charr Salvelinus alpinus: Predicting the effects of climate change. J. Fish. Biol. 2010, 77, 1793–1817. [Google Scholar] [CrossRef] [PubMed]
- Miraglia, M.; Marvin, H.J.P.; Kleter, G.A.; Battilani, P.; Brera, C.; Coni, E.; Cubadda, F.; Croci, L.; De Santis, B.; Dekkers, S.; et al. Climate change and food safety: An emerging issue with special focus on Europe. Food Chem. Toxicol. 2009, 47, 1009–1021. [Google Scholar] [CrossRef] [PubMed]
- Rivington, M.; Bailey, R.; Benton, T.; Challinor, A.; Elliott, J.; Gustafson, D.; Hiller, B.; Jones, A.; Jahn, M.; Kent, C.; et al. Extreme Weather and Resilience of the Global Food System; Synthesis Report; UK Government Science and Innovation Network: London, UK, 2015. [Google Scholar]
- Creighton, C.; Hobday, A.J.; Lockwood, M.; Pecl, G.T. Adapting Management of Marine Environments to a Changing Climate: A Checklist to Guide Reform and Assess Progress. Ecosystems 2016, 19, 187–219. [Google Scholar] [CrossRef]
- Herrero, M.; Wirsenius, S.; Henderson, B.; Rigolot, C.; Thornton, P.; Havlík, P.; de Boer, I.; Gerber, P.J. Livestock and the Environment: What Have We Learned in the Past Decade? Annu. Rev. Env. Resour. 2015, 40, 177–202. [Google Scholar] [CrossRef]
- IPCC. Managing the Risks of Extreme Events and Disasters to Advance Climate Change Adaptation. In A Special Report of Working Groups I and II of the Intergovernmental Panel on Climate Change; Cambridge University Press: Cambridge, UK, 2012; p. 582. [Google Scholar]
- Heal, G.; Millner, A. Reflections: Uncertainty and Decision Making in Climate Change Economics. Rev. Environ. Econ. Policy 2014, 8, 120–137. [Google Scholar] [CrossRef]
- Association of Computing Machinery A.M. Turing Award Laureate Dr. McCarthy’s lecture “The Present State of Research on Artificial Intelligence”. Available online: https://0-amturing-acm-org.brum.beds.ac.uk/award_winners/mccarthy_1118322.cfm (accessed on 10 July 2019).
- Kleineidam, J. Fields of Action for Designing Measures to Avoid Food Losses in Logistics Networks. Sustainability 2020, 12, 6093. [Google Scholar] [CrossRef]
- Onyeneke, R.; Nwajiuba, C.; Igberi, C.; Umunna Amadi, M.; Anosike, F.; Oko-Isu, A.; Munonye, J.; Uwadoka, C.; Adeolu, A. Impacts of Caregivers’ Nutrition Knowledge and Food Market Accessibility on Preschool Children’s Dietary Diversity in Remote Communities in Southeast Nigeria. Sustainability 2019, 11, 1688. [Google Scholar] [CrossRef] [Green Version]
- Darijani, F.; Veisi, H.; Liaghati, H.; Nazari, M.; Khoshbakht, K. Assessment of Resilience of Pistachio Agroecosystems in Rafsanjan Plain in Iran. Sustainability 2019, 11, 1656. [Google Scholar] [CrossRef] [Green Version]
- How, M.-L. Future-Ready Strategic Oversight of Multiple Artificial Superintelligence-Enabled Adaptive Learning Systems via Human-Centric Explainable AI-Empowered Predictive Optimizations of Educational Outcomes. BDCC 2019, 3, 46. [Google Scholar] [CrossRef] [Green Version]
- How, M.-L.; Hung, W.L.D. Educing AI-Thinking in Science, Technology, Engineering, Arts, and Mathematics (STEAM) Education. Education Sciences 2019, 9, 184. [Google Scholar] [CrossRef] [Green Version]
- Pearl, J. Causality: Models, Reasoning, and Inference, 2nd ed.; Cambridge University Press: Cambridge, UK, 2010; ISBN 978-0-521-89560-6. [Google Scholar]
- Pearl, J. Causes of Effects and Effects of Causes. Sociol. Methods Res. 2015, 44, 149–164. [Google Scholar] [CrossRef] [Green Version]
- Pearl, J. Fusion, propagation, and structuring in belief networks. Artif. Intell. 1986, 29, 241–288. [Google Scholar] [CrossRef] [Green Version]
- Rad, P.; Roopaei, M.; Beebe, N. AI Thinking for Cloud Education Platform with Personalized Learning. In Proceedings of the 51st Hawaii International Conference on System Sciences, Hawaii, HI, USA, 2–6 January 2018; pp. 3–12. [Google Scholar]
- Domingos, P.; Pazzani, M. On the optimality of the simple Bayesian classifier under zero–one loss. Mach. Learn. 1997, 29, 103–130. [Google Scholar] [CrossRef]
- Hand, D.; You, K. Idiot’s Bayes—Not so stupid after all? Int. Stat. Rev. 2001, 69, 385–398. [Google Scholar]
- Van de Schoot, R.; Kaplan, D.; Denissen, J.; Asendorpf, J.B.; Neyer, F.J.; van Aken, M.A.G. A Gentle Introduction to Bayesian Analysis: Applications to Developmental Research. Child. Dev. 2014, 85, 842–860. [Google Scholar] [CrossRef]
- Hox, J.; van de Schoot, R.; Matthijsse, S. How few countries will do? Comparative survey analysis from a Bayesian perspective. Surv. Res. Methods 2012, 6, 87–93. [Google Scholar] [CrossRef]
- Lee, S.-Y.; Song, X.-Y. Evaluation of the Bayesian and maximum likelihood approaches in analyzing structural equation models with small sample sizes. Multivar. Behav. Res. 2004, 39, 653–686. [Google Scholar] [CrossRef] [PubMed]
- Button, K.S.; Ioannidis, J.P.; Mokrysz, C.; Nosek, B.A.; Flint, J.; Robinson, E.S.; Munafao, M.R. Power failure: Why small sample size undermines the reliability of neuroscience. Nat. Rev. Neurosci. 2013, 14, 365–376. [Google Scholar] [CrossRef] [PubMed] [Green Version]
- Kaplan, D.; Depaoli, S. Bayesian structural equation modeling. In Handbook of Structural Equation Modeling; Hoyle, R., Ed.; Guilford Press: New York, NY, USA, 2012; pp. 650–673. [Google Scholar]
- Walker, L.J.; Gustafson, P.; Frimer, J.A. The application of Bayesian analysis to issues in developmental research. Int. J. Behav. Dev. 2007, 31, 366–373. [Google Scholar] [CrossRef]
- Zhang, Z.; Hamagami, F.; Wang, L.; Grimm, K.J.; Nesselroade, J.R. Bayesian analysis of longitudinal data using growth curve models. Int. J. Behav. Dev. 2007, 31, 374–383. [Google Scholar] [CrossRef] [Green Version]
- Shannon, C.E. The lattice theory of information. IRE Prof. Group Inf. Theory 1953, 1, 105–107. [Google Scholar] [CrossRef]
- Lleo, S.; Ziemba, W. The Swiss Black Swan Bad Scenario: Is Switzerland Another Casualty of the Eurozone Crisis? IJFS Iran. J. Fuzzy Syst. 2015, 3, 351–380. [Google Scholar] [CrossRef] [Green Version]
- Chang, W.; Xu, Z.; You, M.; Zhou, S.; Xiao, Y.; Cheng, Y. A Bayesian Failure Prediction Network Based on Text Sequence Mining and Clustering. Entropy 2018, 20, 923. [Google Scholar] [CrossRef] [Green Version]
- Sperotto, A.; Molina, J.L.; Torresan, S.; Critto, A.; Pulido-Velazquez, M.; Marcomini, A. Water Quality Sustainability Evaluation under Uncertainty: A Multi-Scenario Analysis Based on Bayesian Networks. Sustainability 2019, 11, 4764. [Google Scholar] [CrossRef] [Green Version]
- Tsamardinos, I.; Aliferis, C.F.; Statnikov, A. Time and sample efficient discovery of Markov blankets and direct causal relations. In Proceedings of the Ninth ACM SIGKDD International Conference on Knowledge Discovery and Data Mining—KDD ’03, Washington, DC, USA, 24–27 August 2003; p. 673. [Google Scholar]
- Guoyi, C.; Hu, S.; Yang, Y.; Chen, T. Response surface methodology with prediction uncertainty: A multi-objective optimisation approach. Chem. Eng. Res. Des. 2012, 90, 1235–1244. [Google Scholar] [CrossRef]
- Fox, R.J.; Elgart, D.; Christopher Davis, S. Bayesian credible intervals for response surface optima. J. Stat. Plan. Inference 2009, 139, 2498–2501. [Google Scholar] [CrossRef]
- Miró-Quesada, G.; Del Castillo, E.; Peterson, J.J. A Bayesian approach for multiple response surface optimization in the presence of noise variables. J. Appl. Stat. 2004, 31, 251–270. [Google Scholar] [CrossRef]
- Myers, R.H.; Montgomery, D.C.; Anderson-Cook, C.M. Response Surface Methodology: Process. and Product Optimization Using Designed Experiments, 3rd ed.; Wiley and Sons, Inc.: Somerset, NJ, USA, 2009; ISBN 978-0-470-17446-3. [Google Scholar]
- How, M.-L.; Hung, W.L.D. Educational Stakeholders’ Independent Evaluation of an Artificial Intelligence-Enabled Adaptive Learning System Using Bayesian Network Predictive Simulations. Education Sciences 2019, 9, 110. [Google Scholar] [CrossRef] [Green Version]
- How, M.-L.; Cheah, S.-M.; Chan, Y.-J.; Khor, A.C.; Say, E.M.P. Artificial Intelligence-Enhanced Decision Support for Informing Global Sustainable Development: A Human-Centric AI-Thinking Approach. Information 2020, 11, 39. [Google Scholar] [CrossRef] [Green Version]
- How, M.-L.; Hung, W.L.D. Harnessing Entropy via Predictive Analytics to Optimize Outcomes in the Pedagogical System: An Artificial Intelligence-Based Bayesian Networks Approach. Education Sciences 2019, 9, 158. [Google Scholar] [CrossRef] [Green Version]
- The Economist Intelligence. Unit Global Food Security Index. Available online: https://foodsecurityindex.eiu.com/Resources (accessed on 13 July 2020).
- Conrady, S.; Jouffe, L. Bayesian Networks & BayesiaLab: A Practical Introduction for Researchers; Bayesia: Franklin, TN, USA, 2015; ISBN 0-9965333-0-3. [Google Scholar]
- Bayesia, S.A.S. R2-GenOpt* Algorithm. Available online: https://library.bayesia.com/pages/viewpage.action?pageId=35652439#6c939073de75493e8379c0fff83e1384 (accessed on 19 March 2019).
- Silapachote, P.; Srisuphab, A. Teaching and learning computational thinking through solving problems in Artificial Intelligence: On designing introductory engineering and computing courses. In Proceedings of the IEEE International Conference on Teaching, Assessment, and Learning for Engineering (TALE), IEEE Xplore, Bangkok, Thailand, 7–9 December 2016. [Google Scholar]
- Bayesia, S.A.S. Bayesialab. Available online: https://www.bayesialab.com/ (accessed on 18 March 2019).
- Bayes Fusion LLC. GeNie. Available online: https://www.bayesfusion.com/genie/ (accessed on 18 March 2019).
- Norsys Software Corp. Netica. Available online: https://www.norsys.com/netica.html (accessed on 18 March 2019).
- Bayes Server LLC. Bayes Server. Available online: https://www.bayesserver.com/ (accessed on 18 March 2019).
- Bondoc, I. European regulation in the veterinary sanitary and food safety Area, a Component of the European policies on the safety of food products and the protection of consumer interests: A 2007 retrospective. Part. One: The role of European institutions in laying down and passing laws specific to the veterinary sanitary and food safety area. Universul Juridic. 2016, Supliment, 16–19. [Google Scholar]
- Bondoc, I. European Regulation in the Veterinary Sanitary and Food Safety Area, a Component of the European Policies on the Safety of Food Products and the Protection of Consumer Interests: A 2007 Retrospective. Part Two: Regulations. Universul Juridic. 2016, Supliment, 16–19. [Google Scholar]
- Rosegrant, M.W. Global Food Security: Challenges and Policies. Science 2003, 302, 1917–1919. [Google Scholar] [CrossRef] [Green Version]
- Wheeler, T.; von Braun, J. Climate Change Impacts on Global Food Security. Science 2013, 341, 508–513. [Google Scholar] [CrossRef]
- How, M.-L.; Cheah, S.-M.; Khor, A.C.; Chan, Y.J. Artificial Intelligence-Enhanced Predictive Insights for Advancing Financial Inclusion: A Human-Centric AI-Thinking Approach. BDCC 2020, 4, 8. [Google Scholar] [CrossRef]
- How, M.-L.; Chan, Y.J. Artificial Intelligence-Enabled Predictive Insights for Ameliorating Global Malnutrition: A Human-Centric AI-Thinking Approach. AI 2020, 1, 4. [Google Scholar] [CrossRef] [Green Version]
Figure 1.
The current state of global food security in 2019.

Figure 2.
Target-mean analysis of the relations between each variable and global food security.

Figure 3.
Predictive analytics of the worst-case scenario: how simulated changes in the multiple parameters in Natural Resources and Resilience could influence Global Food Security.
Figure 3.
Predictive analytics of the worst-case scenario: how simulated changes in the multiple parameters in Natural Resources and Resilience could influence Global Food Security.

Figure 4.
Evaluation of the predictive efficacy using the gains curve.

Figure 5.
Evaluation of the predictive efficacy using the lift curve.

© 2020 by the authors. Licensee MDPI, Basel, Switzerland. This article is an open access article distributed under the terms and conditions of the Creative Commons Attribution (CC BY) license (http://creativecommons.org/licenses/by/4.0/).
Share and Cite
MDPI and ACS Style
How, M.-L.; Chan, Y.J.; Cheah, S.-M. Predictive Insights for Improving the Resilience of Global Food Security Using Artificial Intelligence. Sustainability 2020, 12, 6272. https://0-doi-org.brum.beds.ac.uk/10.3390/su12156272
AMA Style
How M-L, Chan YJ, Cheah S-M. Predictive Insights for Improving the Resilience of Global Food Security Using Artificial Intelligence. Sustainability. 2020; 12(15):6272. https://0-doi-org.brum.beds.ac.uk/10.3390/su12156272
Chicago/Turabian StyleHow, Meng-Leong, Yong Jiet Chan, and Sin-Mei Cheah. 2020. "Predictive Insights for Improving the Resilience of Global Food Security Using Artificial Intelligence" Sustainability 12, no. 15: 6272. https://0-doi-org.brum.beds.ac.uk/10.3390/su12156272
Note that from the first issue of 2016, this journal uses article numbers instead of page numbers. See further details here.