Article

State-of-the-Art Review of Microbial-Induced Calcite Precipitation and Its Sustainability in Engineering Applications

Geotechnical Engineering, University of South Australia, UniSA STEM, Mawson Lakes, SA 5095, Australia
*
Author to whom correspondence should be addressed.
Sustainability 2020, 12(15), 6281; https://0-doi-org.brum.beds.ac.uk/10.3390/su12156281
Submission received: 29 June 2020 / Revised: 27 July 2020 / Accepted: 28 July 2020 / Published: 4 August 2020
(This article belongs to the Special Issue Urban Sustainability: Pavement Design, Construction and Environment)

Abstract

:
Microbial-induced calcite precipitation (MICP) is a promising new technology in the area of Civil Engineering with potential to become a cost-effective, environmentally friendly and sustainable solution to many problems such as ground improvement, liquefaction remediation, enhancing properties of concrete and so forth. This paper reviews the research and developments over the past 25 years since the first reported application of MICP in 1995. Historical developments in the area, the biological processes involved, the behaviour of improved soils, developments in modelling the behaviour of treated soil and the challenges associated are discussed with a focus on the geotechnical aspects of the problem. The paper also presents an assessment of cost and environmental benefits tied with three application scenarios in pavement construction. It is understood for some applications that at this stage, MICP may not be a cost-effective or even environmentally friendly solution; however, following the latest developments, MICP has the potential to become one.

1. Introduction

With increasing population and civil infrastructure demands worldwide, the availability of suitable soil sites for construction continues to decrease and ground improvement is now an integral part of modern development. The most common methods to strengthen soils use either one or a combination of several mechanisms such as compaction, preloading, vibration and chemical grouting. These techniques have been proven to have different degrees of effectiveness in improving soil strength and other properties. However, they come at a cost of consumption of a substantial amount of energy either in their application or production of the grouting materials or both.
Microbial-induced calcite precipitation (MICP) uses naturally occurring bacteria to bind soil particles together through calcium carbonate (CaCO3) precipitation as shown in Figure 1, thereby increasing the strength. The expected life of MICP-treated soil is more than 50 years, which is compatible with the expected service life of many geotechnical structures [1]. Therefore, biogeochemical processes in MICP offer the potential for solving many engineering issues related to ground improvement. MICP also offers advantages over other common approaches as it uses natural processes and it has the potential of being a comparatively inexpensive technique. The effectiveness of MICP in cementing soil depends on the types of bacteria used, the methods of growing these to the required concentration, the pH and temperature during urea hydrolysis, the concentration and flow rate of cementation solution (e.g., calcium concentration and input flow rate), the soil properties (e.g., the availability of nucleation sites, degree of saturation, soil gradation, particle size, pore throat size) and so forth [2,3,4,5,6]. It is noteworthy to report that there are a number of review articles published in the past focusing on a particular aspect of MICP, e.g., optimizing protocols [7], mitigating liquefaction [8,9], stabilization [7,9,10,11], construction [12] and other aspects [13,14,15,16,17,18,19,20]. A comprehensive review of the current state of knowledge on overall MICP processes, application and sustainability has not yet been undertaken. Therefore, this article presents a comprehensive review of overall MICP processes including the historical development of the technique, reactions and biological sources involved, optimization of the process, the behaviour of MICP-treated soils, modelling of improved soil (including empirical, constitutive and discrete element method models) for geotechnical engineering applications, various application areas, together with a quantitative assessment of associated costs as well as energy and CO2 footprints (for three hypothetical construction scenarios).

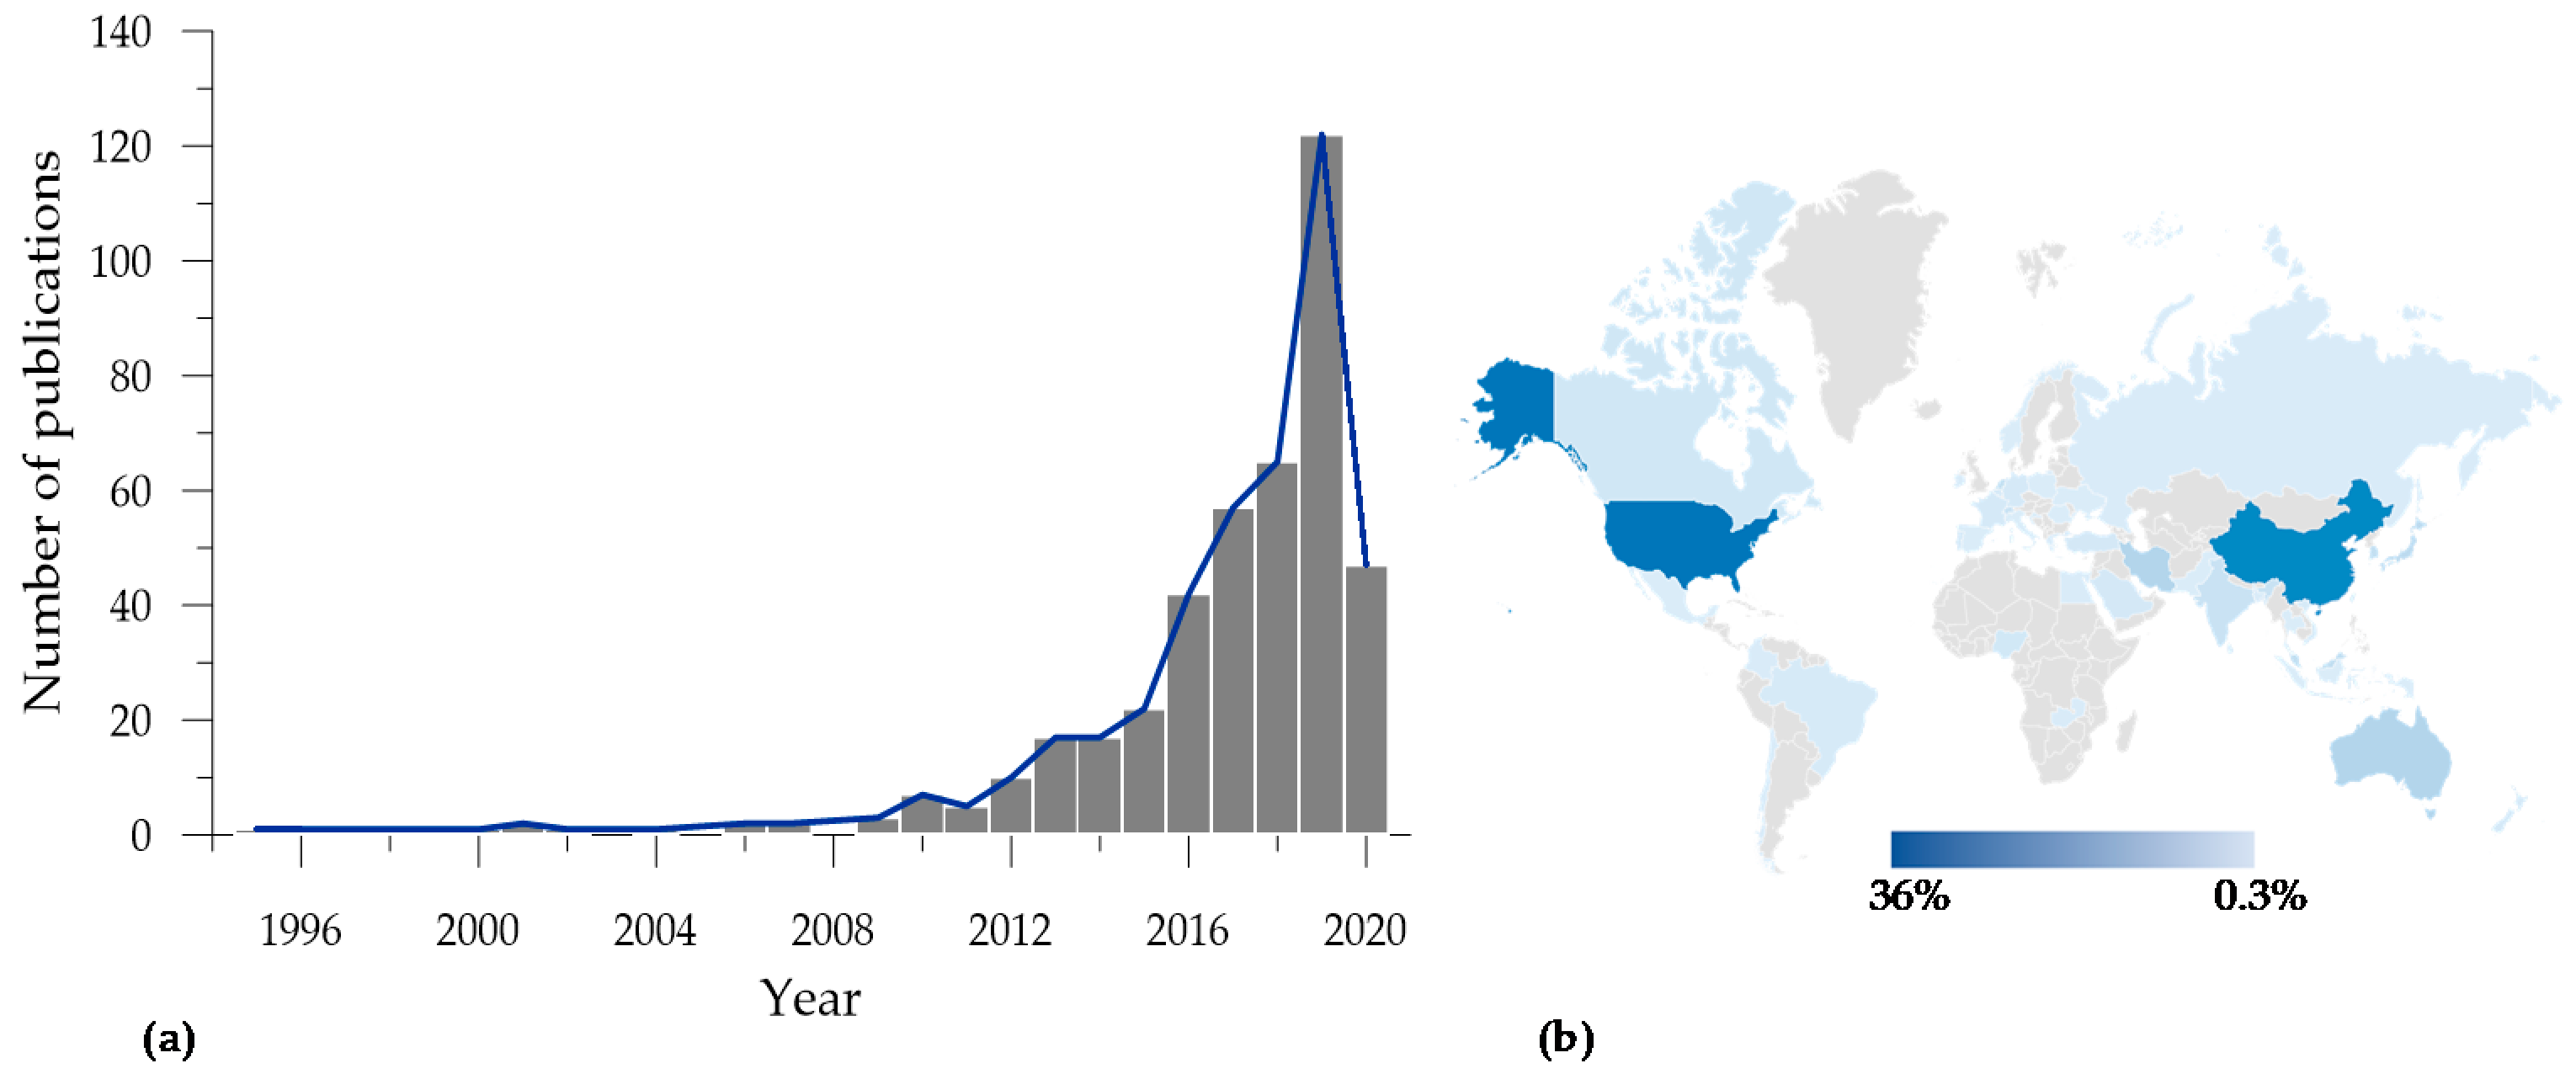
2. Historical Development of MICP

The significant contributions towards the development of MICP techniques are presented in Figure 2 in chronological order. Arguably, MICP was first applied for geotechnical applications in 1995 by Gollapudi et al. [21] for controlling leaching of groundwater contaminants in highly permeable channels by packing a mixture of bacteria (Bacillus pasteurii) with sand. Note Bacillus pasteurii is an outmoded taxonomic name for Sporosarcina pasteurii, which is a gram positive bacterium with the ability to precipitate calcite. Gollapudi et al. [21] observed a maximum of 75% reduction in permeability, which was achieved after 95 h. Stocks-Fischer et al. [22] further investigated the physical and biochemical properties of CaCO3 precipitation via MICP using B. pasteurii. They observed that the microorganisms used in the MICP process create an alkaline environment and provide nucleation sites favourable for CaCO3 precipitation. They hypothesized that, at high biomass concentrations, the rate of CaCO3 precipitation decreases possibly due to accumulation of calcium ions (Ca2+) over the surface of the bacteria cells. Later, Fujita et al. [23], while studying the application of MICP as a remediation technique for divalent radionuclides and other contaminants, e.g., strontium90 (90Sr2+) in groundwater, suggested that the rate of CaCO3 precipitation is directly related to the rate of urea hydrolysis in an alkaline environment. MICP was also used by Hammes et al. [2] to facilitate the removal of soluble calcium (Ca2+) from industrial wastewater as an alternative to the use of Na2CO3. Their results showed that about 85–90% of Ca2+ was removed by using 8.3 mM of urea.
The application of MICP in the improvement of strength and stiffness for soils was first studied in 2002 by Ismail et al. [24]. They found an increase in the unconfined compressive strength (UCS) of MICP-treated soil after 5 h of treatment. Several factors were identified that influenced the UCS including the strength of individual grains, soil grain size and shape, density of soil and the presence of pre-existing calcite crystals.
Despite earlier applications in soil improvement, little was known about the performance of urease produced by bacterial cells during the MICP process. Whiffin [25] was the first to develop a model called the “Whiffin’s conductivity method” to predict the changes in urea hydrolysis during CaCO3 precipitation by measuring the electrical conductivity of the MICP solution. The shear strength and stiffness of MICP-treated soil were later evaluated by DeJong et al. [3] using a series of consolidated isotropically undrained compression (CIUC) triaxial tests. Their results showed that MICP-treated soil specimens exhibited a non-collapse/strain-softening behaviour with a higher initial shear stiffness and ultimate shear capacity compared to untreated loose specimens.
In MICP, biocementation (generation of particle bonding) and bio-clogging (production of pore-filling materials) have notably been explored [26]. Over the last decade, the MICP technique has been applied to enhance the engineering properties (strength and stiffness) of different soils [27,28], reduce the liquefaction potential of loose sand [29,30], heal cracks [31,32,33,34], control erosion [35,36] and reduce soil permeability via bio-clogging [37].
Other studies have attempted to investigate the different factors affecting the MICP treatment process [29,38,39,40]. Despite numerous laboratory-scale studies, there have been a lot of uncertainties regarding the overall effectiveness of the technique in large scale applications. Van Paassen et al. [41] reported a large-scale MICP experiment with a 100 m3 sand specimen. Their results showed that MICP treatment significantly improved the strength and stiffness of granular soils in large-scale applications. However, the uniform distribution of cementation, especially in large-scale experiments, still proves to be a significant challenge [42,43,44,45].
Constitutive models are being developed and implemented for the prediction of the soil-cement and stress-strain behaviour of MICP-treated soils [29,38,39,40,46]. Discrete element method (DEM) simulations of MICP-cemented sand have been used to evaluate the micro-scale behaviour of the sand-CaCO3 bond [47,48,49,50].
In recent years, research efforts have grown significantly in terms of investigating various aspects of the MICP process. Figure 3a presents a snapshot of the number of publications starting from 1995 to date and shows exponential growth in the number of publications reflecting the growing interest and increased research intensity in the field. While the majority of the research (about 70%) has been conducted in the US and China (Figure 3b), researchers from Iran, Australia, Canada, Brazil, India, middle eastern countries, Russia, Europe, south-east Asia and Africa have also stepped in to contribute to the knowledge base.

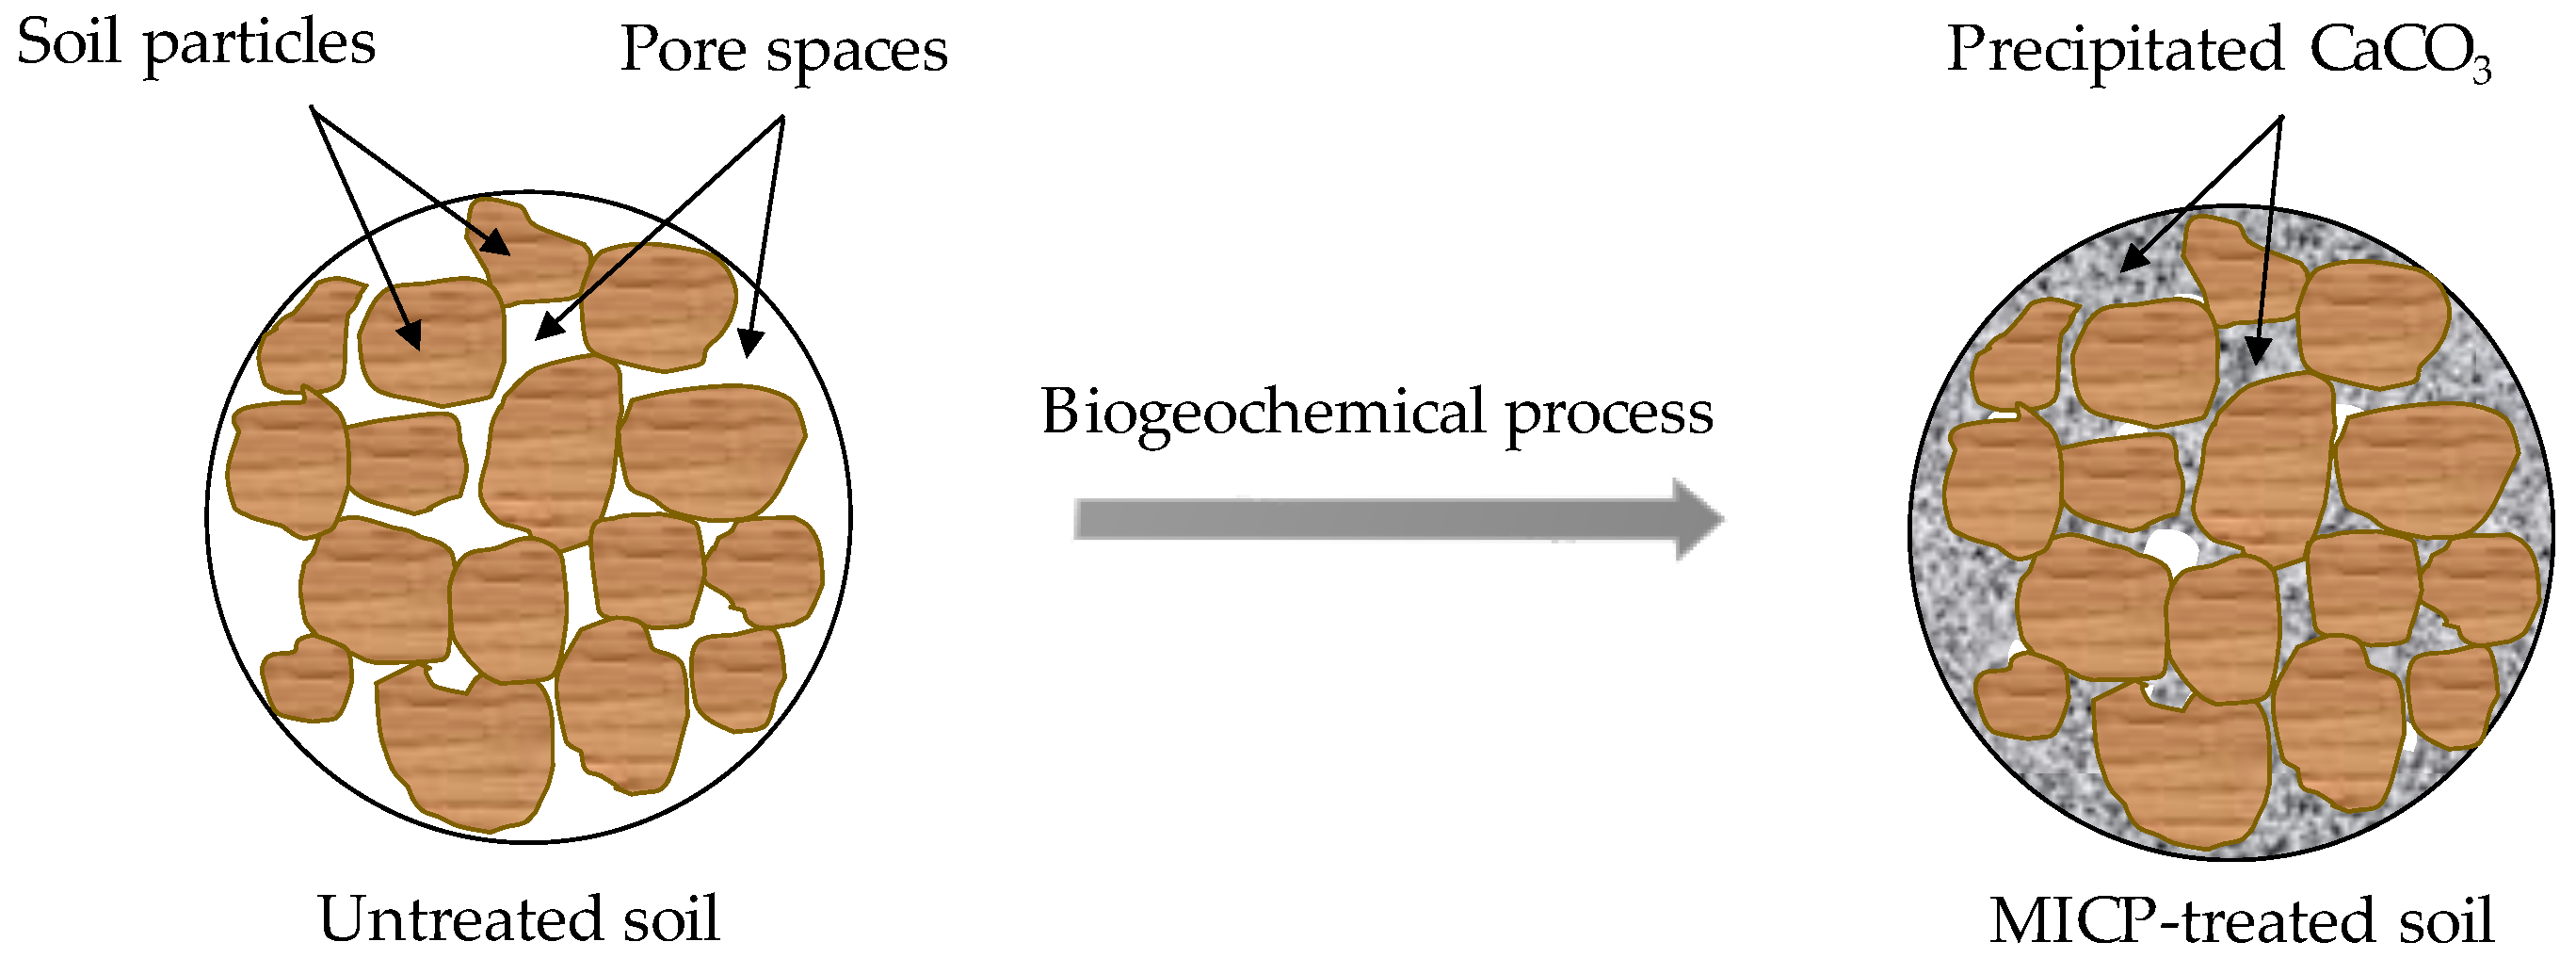
3. Biogeochemical Processes

The effectiveness of the MICP process depends on several physical and biogeochemical factors such as the bacterial genus used, the reaction environment and the approaches used. These factors are carefully reviewed and discussed in the subsequent sections below.

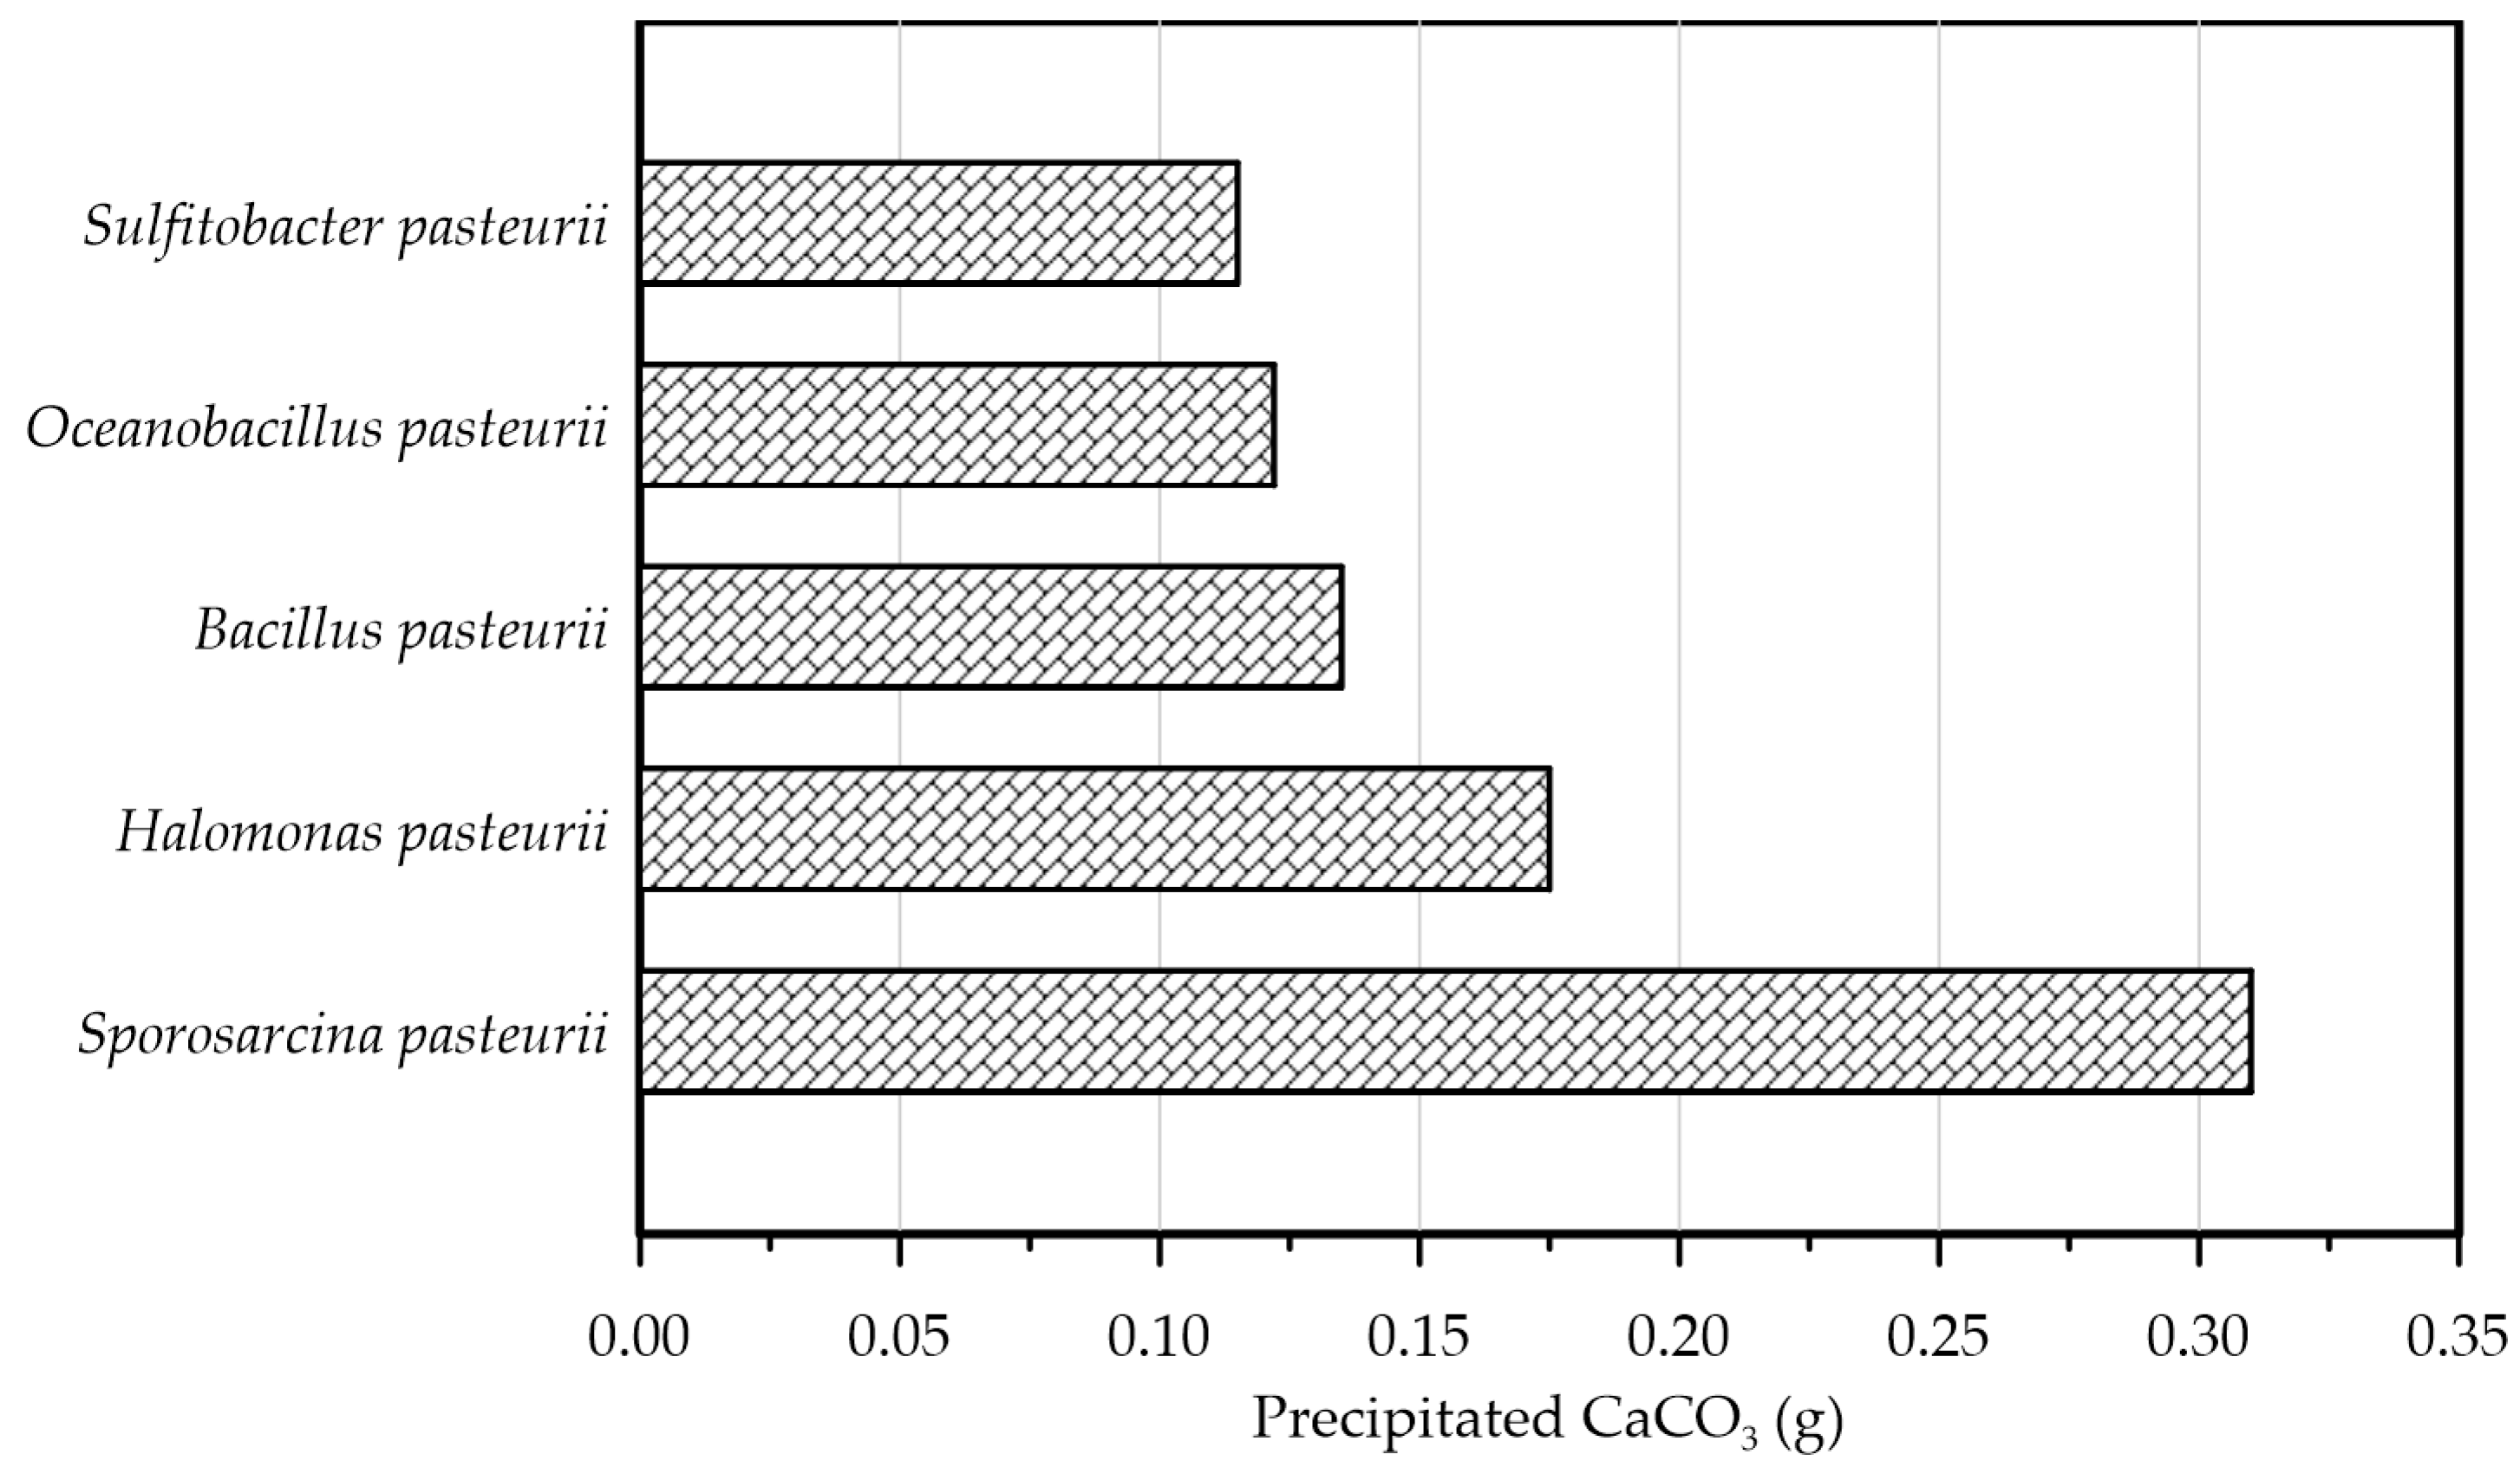
3.1. Sources of Bacteria Used in MICP

The most commonly used urease bacteria in past studies are S. pasteurii, Spoloactobacilus, Clostridium and Desulfotomaculum. Of these, S. pasteurii, an alkalophilic non-pathogenic bacterium with highly active urease enzymes, has been found to be one of the most effective and efficient and has been widely used [5,28,41,42,43] even though contradictory evidence can be found in the literature [52,53].
Venda Oliveira et al. [54] assessed the performances of two types of bacteria (S. pasteurii and I. insulisalsae) on the strength and stiffness of sandy soil using UCS and splitting tensile strength (STS) tests. The results from their study show that the bacterium I. insulisalsae was more efficient than S. pasteurii in strengthening the soil. However, the optimum environmental conditions for the growth of each bacterium was not considered in their study, which could possibly have affected their findings.
Screening of bacteria for self-healing of concrete cracks was investigated by Zhang et al. [55]. In their study, the calcium precipitation activity (CPA) of bacterial strains was evaluated using genomic 16S rDNA sequencing and phylogenetic tree analysis. The results from their study show that the Bacillus species (which was designated as the H4 strain) showed the highest CPA of 94.8%. By assessing the influence of other factors on the performance of the H4 strain, they observed that lactate and nitrate were the best carbon and nitrogen sources for the H4 bacterial strain, with optimal concentrations of approximately 25 and 18 mM, respectively, at an optimum pH range of 9.5–11.0.
Liu et al. [56] assessed the interaction between S. pasteurii and an indigenous bacterium during MICP soil treatment. In their study, two soil samples, i.e., natural soil extract (with indigenous bacteria present) and artificial soil extract (with no microorganisms) were treated with an MICP treatment solution containing S. pasteurii. The results from their study show that S. pasteurii exhibited a significantly higher growth rate with maximum CaCO3 precipitation in the artificial soil extract compared to the natural soil extract. They postulated that the deceleration of the MICP process in the natural soil could be due to the competition for nutrients between S. pasteurii and indigenous bacteria.
Nayanthara et al. [57] assessed the performances of isolated local ureolytic bacterium for the MICP process and observed that among other sources of bacteria such as Bacillus, Halomonas, Oceanobacillus and Sulfitobacter pasteurii, S. pasteurii had the maximum growth, urease activity and performance at 25 °C under moderately alkaline conditions. Figure 4 summarises their observations.

3.2. Biogeochemical Mechanisms in MICP

Biological processes involved in MICP can be broadly categorised in two groups, i.e., biostimulation and bioaugmentation. In biostimulation, indigenous microbes of the soil are stimulated with external nutrient medium, thereby inducing growth. Bioaugmentation occurs when external microbes are either injected or percolated into the soil along with nutrient medium to help their growth.
Gomez et al. [44] assessed the performance of biostimulated treatment solutions to stimulate native ureolytic bacteria in a variety of soils using soil columns (10.2 cm height × 5.1 cm diameter). The results from their study showed strength improvement and a significant reduction in the permeability of the treated soils. A maximum UCS of 5.3 MPa with an average calcite content of 13.2% was achieved in their study. A large-scale biostimulation experiment was conducted by Gomez et al. [58] using two identical 1.7 m diameter and 0.3 m thick soil layers in a tank. Cone penetration tests were conducted after treatment and they observed that biostimulation may provide good cementation improvement at that scale. Chen and Achal [59] demonstrated that a biostimulation process can be used to precipitate calcite inside a soil matrix and at the same time can effectively remediate Cu contamination by precipitating carbonates of Cu. Feng and Achal [60] used a small quantity of cement and biostimulation to improve the strength of rammed earth materials.
Despite the success of implementing the biostimulation approach in some studies, this approach has its drawbacks, such as homogeneity of treatment and a longer time requirement for the stimulation and growth of microbes.
Even though biostimulation is considered to be more suitable than bioaugmentation due to many reasons such as the external addition of microbes, increased cost, non-uniform distribution over depth and the probability of a decrease in microbe numbers if the conditions are not conducive, MICP techniques using bioaugmentation approaches have been studied extensively at the laboratory scale [29,61,62,63].
The MICP process can be achieved through many processes including urea hydrolysis, denitrification, iron reduction, sulphate reduction and other pathways [43,52,53]. Among these, urea hydrolysis has been most widely used due to its high CaCO3 precipitation efficiency. On the other hand, denitrification, iron reduction and sulphate reduction have been paid less attention due to the low solubility of oxidizing substrates and as a result, require a large amount of substrate solution to obtain sufficient precipitation [64]. These processes are discussed below and are also summarised in Table 1.

3.2.1. Urea Hydrolysis

In urea hydrolysis, the major ingredients involved are urease enzyme, urea ( CO ( NH 2 ) 2 ) and calcium chloride ( CaCl 2 ) . In general, CaCO 3 precipitation via urea hydrolysis can be divided into three main stages: (1) hydrolysis of urea into NH 4 + and carbonate ions ( CO 3 2 ) ; (2) dissociation of CaCl 2 into calcium ions ( Ca 2 + ) ; and (3) CaCO 3 precipitation. The chemical reactions involved are presented in Equations (1) to (3).
CO ( NH 2 ) 2   + 2 H 2 O u r e a   h y d r o l y s i s 2 NH 4   + + CO 3 2
CaCl 2   H 2 O Ca 2 + + 2 Cl
Ca 2 + + CO 3   2 p r e c i p i t a t i o n CaCO 3
Compared to other microbial pathways, CaCO 3 precipitation via urea hydrolysis provides many advantages including a high chemical conversion efficiency up to 90% [65] and ease of control of the process [66]. A disadvantage of this process can be the release of undesirable NH 4 + , which is a major cause of water pollution and potent oxygen demand [53].

3.2.2. Denitrification

Many studies have investigated the potential of soil improvement using the denitrification process [53,67,68]. In addition to improving soil strength via CaCO3 precipitation, denitrification processes have often been used to desaturate soils (i.e., through the release of insoluble N2) for liquefaction mitigation [69,70]. MICP by denitrification refers to the dissimilatory reduction of nitrate ( NO 3 ) to generate nitrogen gas (N2), inorganic carbon (CO2), and alkalinity ( OH ) using denitrifying bacteria (e.g., Pseudomonas denitrificans) under anaerobic conditions. The generation of CO2 raises the carbonate content of the solution, while the consumption of NO 3 increases the pH. The production of alkalinity favours precipitation of CaCO3 in the presence of Ca 2 + . The chemical reactions are presented in Equations (4) and (5).
NO 3 + 1.25 CH 2 O d e n i t r i f i c a t i o n 0.5 N 2 + 1.25 CO 2 + 0.75 H 2 O + OH
Ca 2 + + CO 2 + 2 OH p r e c i p i t a t i o n CaCO 3 +   H 2 O
Compared to urea hydrolysis, denitrification requires a lower concentration of the substrate to induce CaCO3 precipitation; however, the rate of CaCO3 precipitation is considerably lower, possibly due to the accumulation of intermediate NO 3 . A high initial NO 3 concentration may inhibit bacterial growth by altering the pH across the cell membrane [53,67,68].

3.2.3. Sulphate Reduction

In MICP by sulphate reduction (similar to iron reduction), sulphate-reducing bacteria (e.g., Desulfovibrio and Desulfotomaculum) oxidize sulphates under anaerobic conditions to produce hydrogen sulphide (H2S), CO2 and increased alkalinity. pH due to increased alkalinity favours CaCO3 precipitation. The sulphate reduction process is presented in Equation (6).
SO 4 2 + 2 CH 2 O s u l p h a t e   r e d u c t i o n H 2 S + 2 CO 2 + 2 OH
The release of CO2 in the presence of Ca 2 + fosters CaCO3 precipitation (see Equation (5)). Anaerobic oxidation via sulphate reduction requires a large substrate quantity due to low solubility. The mechanism also results in the production of H2S, which is an odorous and highly toxic gas even at low concentrations. Table 1 shows a summary of the relative advantages and limitations of these biochemical mechanisms.

4. Engineering Properties of Treated Soil

The calcite precipitation modifies or enhances the strength of the sample and different studies have investigated this influence through various laboratory tests namely, UCS tests [43,76,77,78,79,80,81], STS tests [54,79,80,82,83,84,85], direct simple shear tests [30], triaxial tests [28,79,86,87,88,89,90,91], cyclic triaxial tests [92] and cone penetration tests [62]. Some of the observations are summarised below.

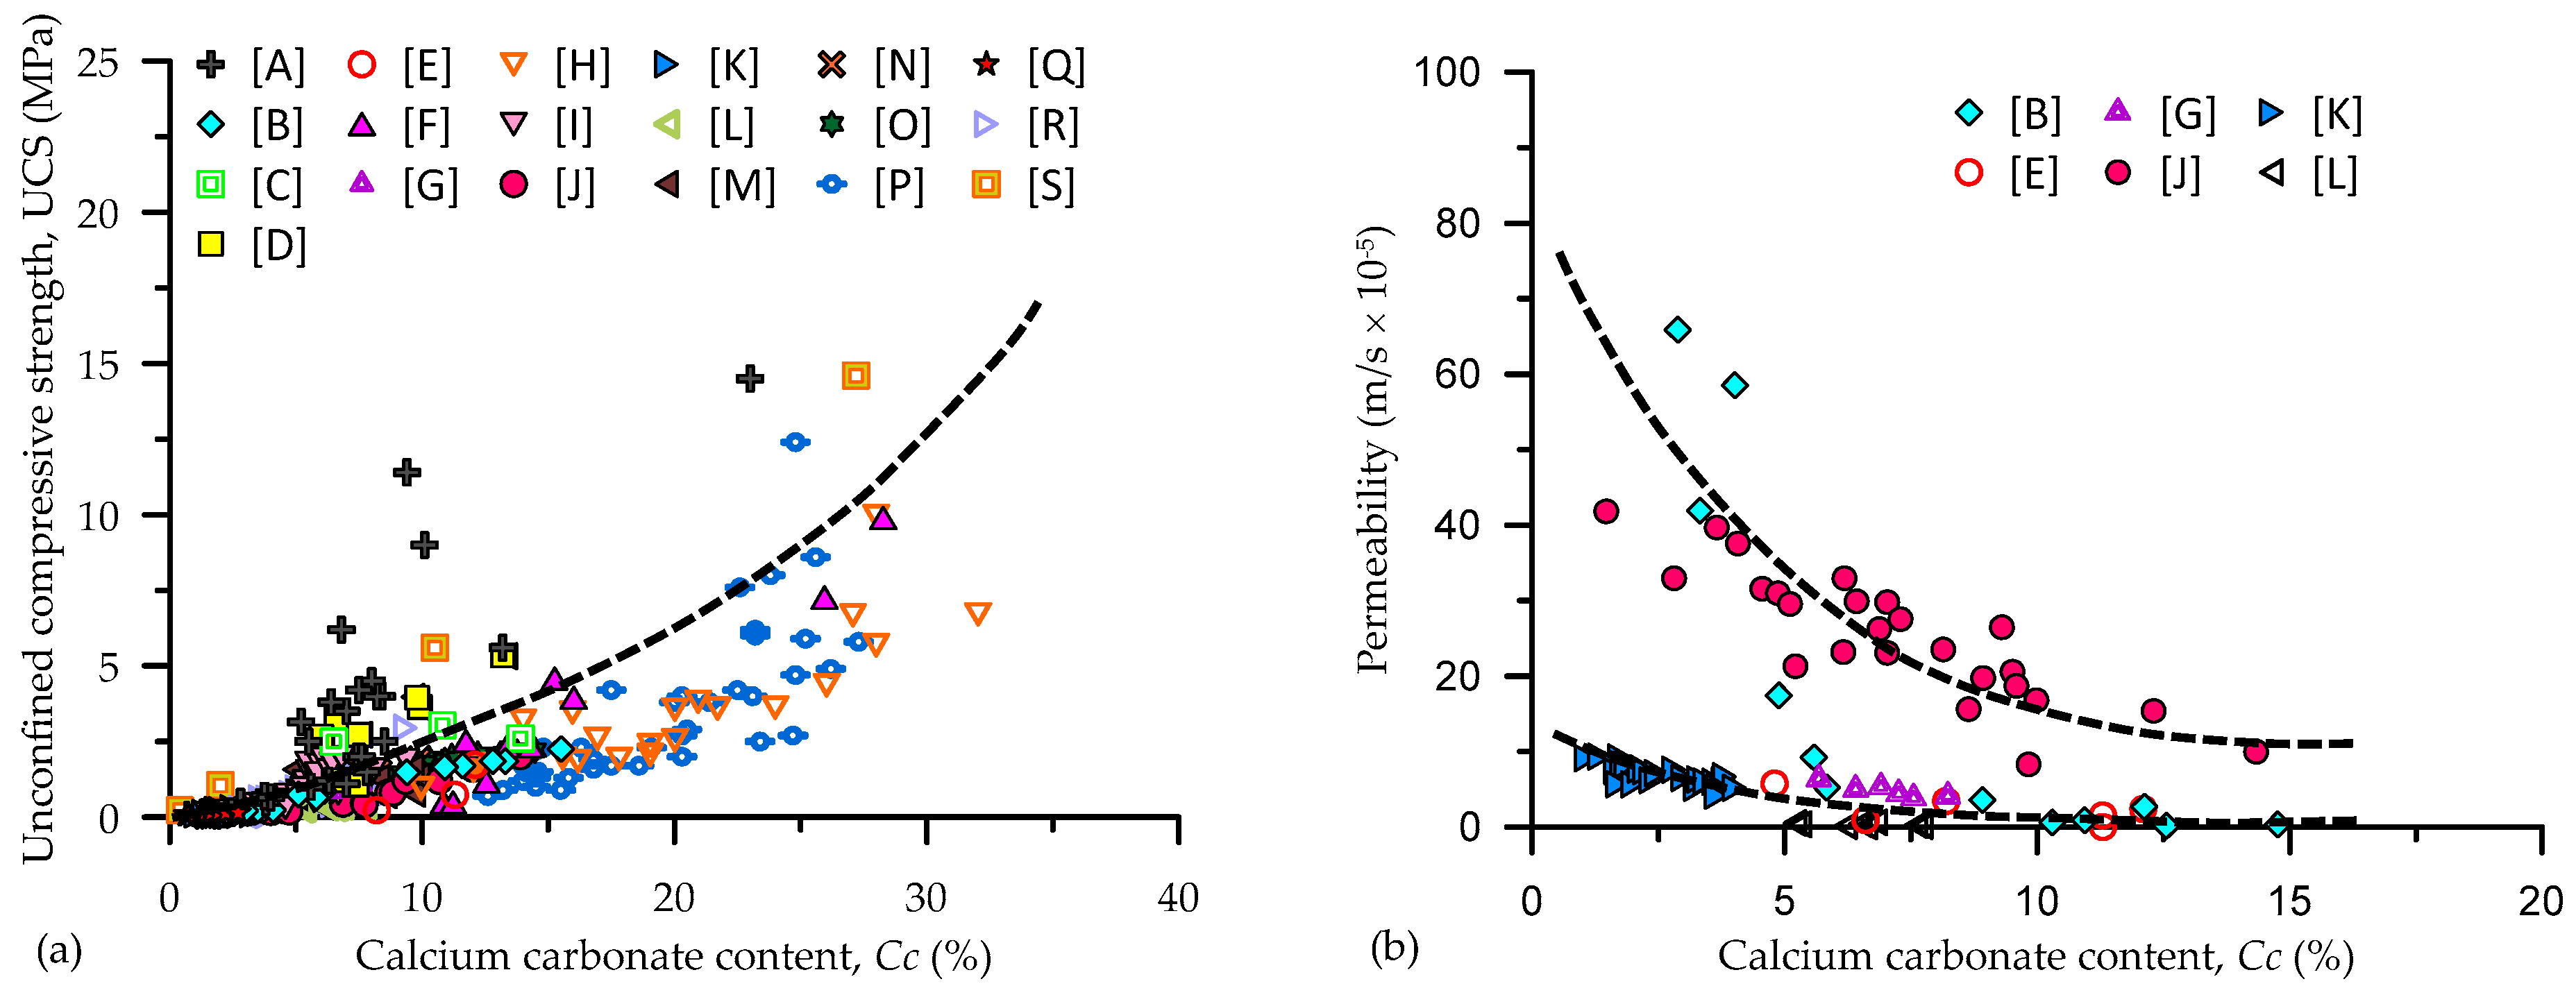
4.1. Unconfined Compressive Strength

Several studies conducted UCS tests on many different types of MICP-treated soil to quantify the improvement of strength. A summary of the studies is presented in Table 2. A brief overview of the literature is presented below.
Al-Thawadi [77] applied MICP on a 1 m long column to investigate strength enhancement and achieved strengths of up to 30 MPa. Cheng and Cord-Ruwisch [43] applied MICP through surface percolation for in-situ placement of bacteria and a cementation solution to improve the mechanical properties of soil.
Gomez et al. [44] applied MICP to a variety of soils and found significant improvement in engineering properties. Other studies have also investigated the UCS of different types of soil and also analysed the CaCO3 content [38,41,76,78,81,84,93,95,96,97,98,99,100,101,102,103,104]. In some studies, the influence of CaCO3 precipitation via MICP treatment on soil permeability has been assessed [38,78,80,84,95,97,100,101].
Here, experimental data from the literature on geotechnical properties such as UCS and permeability are compiled and critically analysed to determine any possible correlations. Figure 5a plots UCS against Cc for the compiled data, where Cc is the calcium carbonate content as a percentage (%). It is worth noting that the UCS of MICP-treated soils ranges from 0.03 to 14.5 MPa, while Cc ranges from 0.6 to 32.0%. It can be seen that UCS exponentially increases with the increase of Cc (Figure 5a), which is consistent with previous results reported by van Paassen et al. [41] and Cheng et al. [78]. However, the trend in Figure 5a shows high variability at Cc > 5%, possibly due to the variation in soil particle size and shape. Other factors such as the concentration of chemical constituents (urea, CaCl2, etc.), urease activity of bacteria and treatment method directly influence the amount of precipitated CaCO3, which is considered in this study in terms of Cc.
Figure 5b shows a plot of permeability against Cc for data compiled from the literature. The permeability of MICP-treated soils ranges from 0.01 to 66 (m/s × 10−5) with Cc ranging from 0.002 to 14.8%. The permeability of MICP-treated soil decreases exponentially with the increase of Cc (Figure 5b), possibly due to the reduction in void spaces by the precipitated CaCO3. Again, the trend of the data as shown in Figure 5b displays some degree of variation (less than that observed for UCS), possibly due to the influential factors discussed earlier.

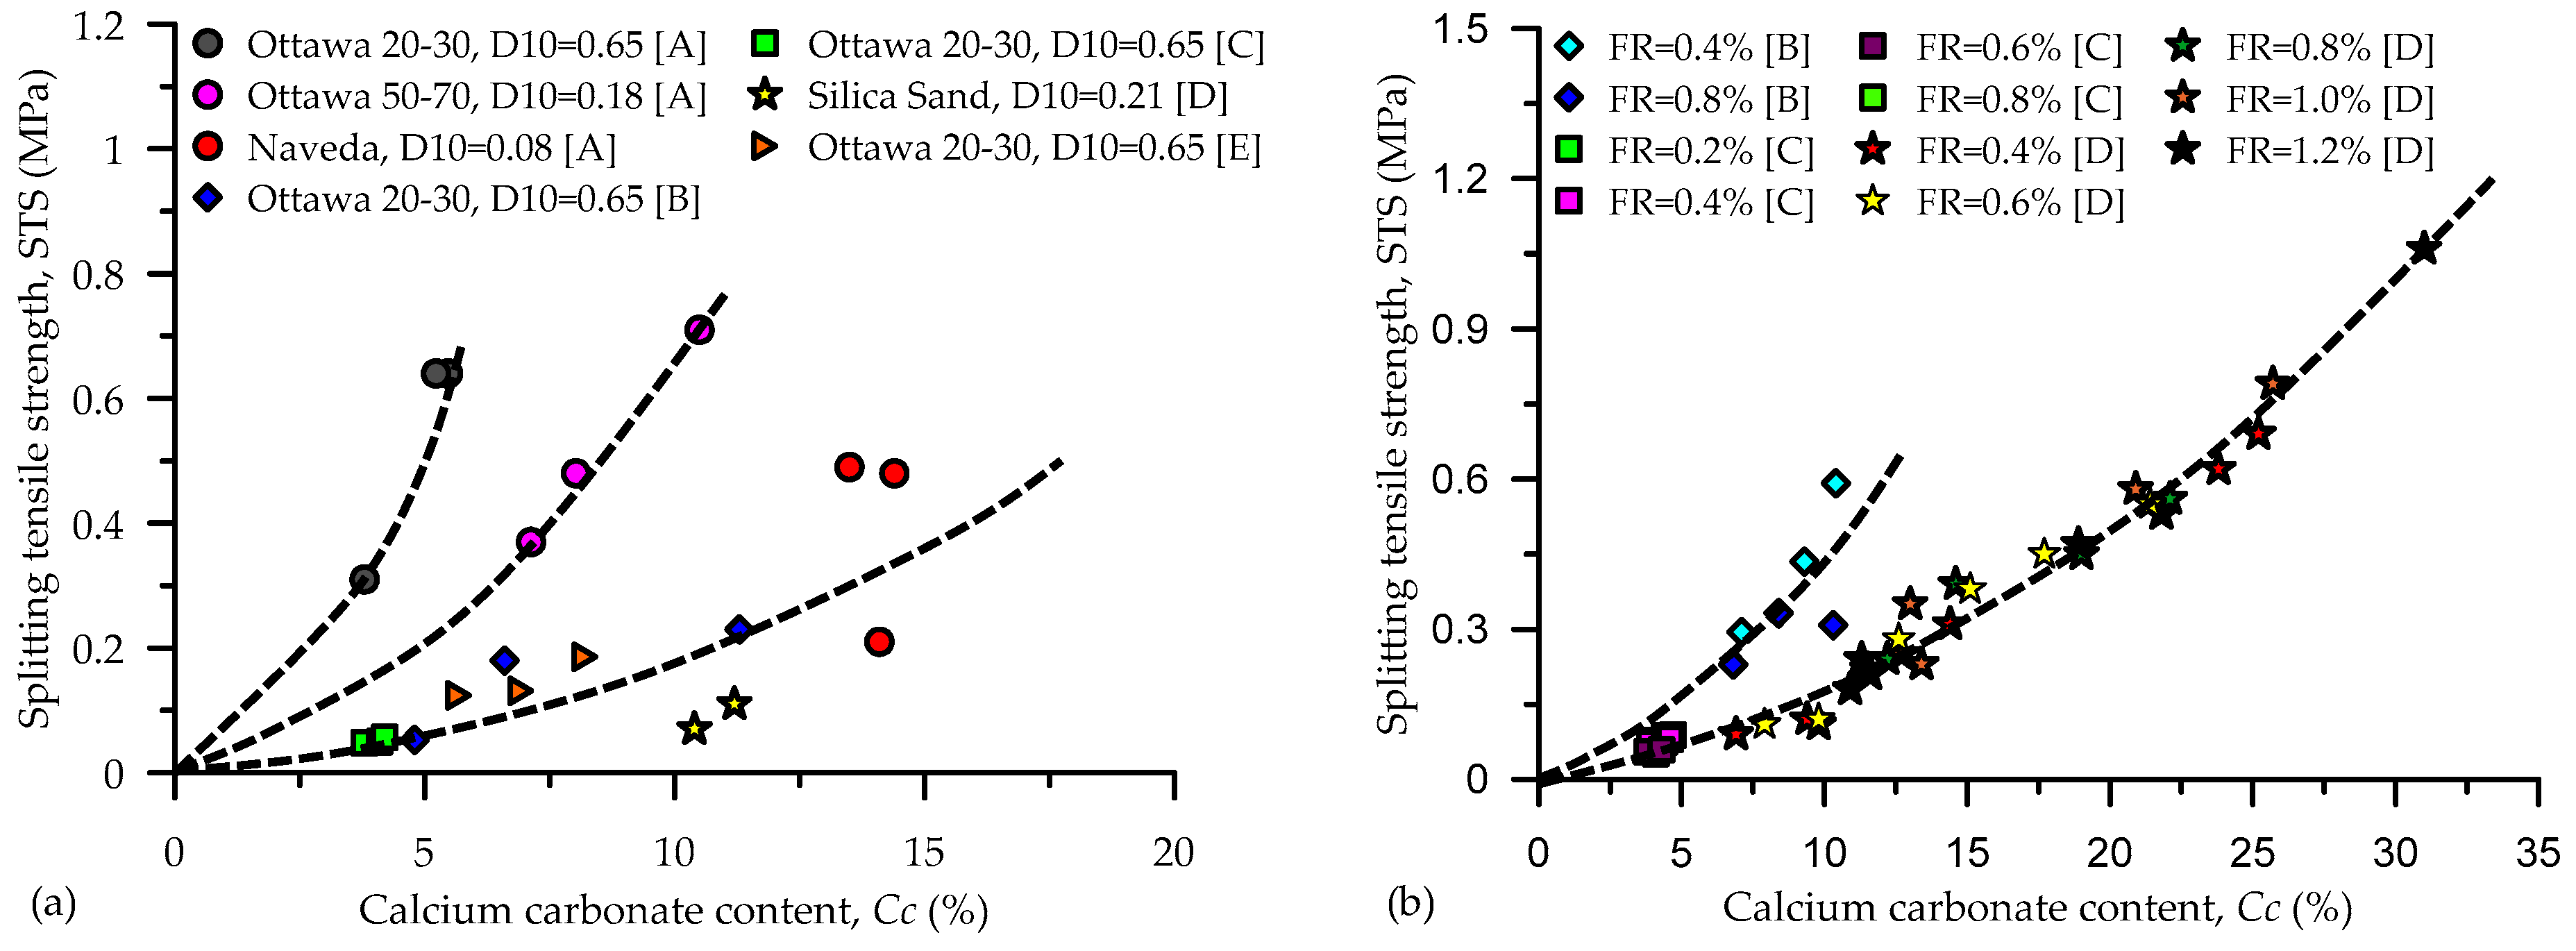
4.2. Indirect (Splitting) Tensile Strength
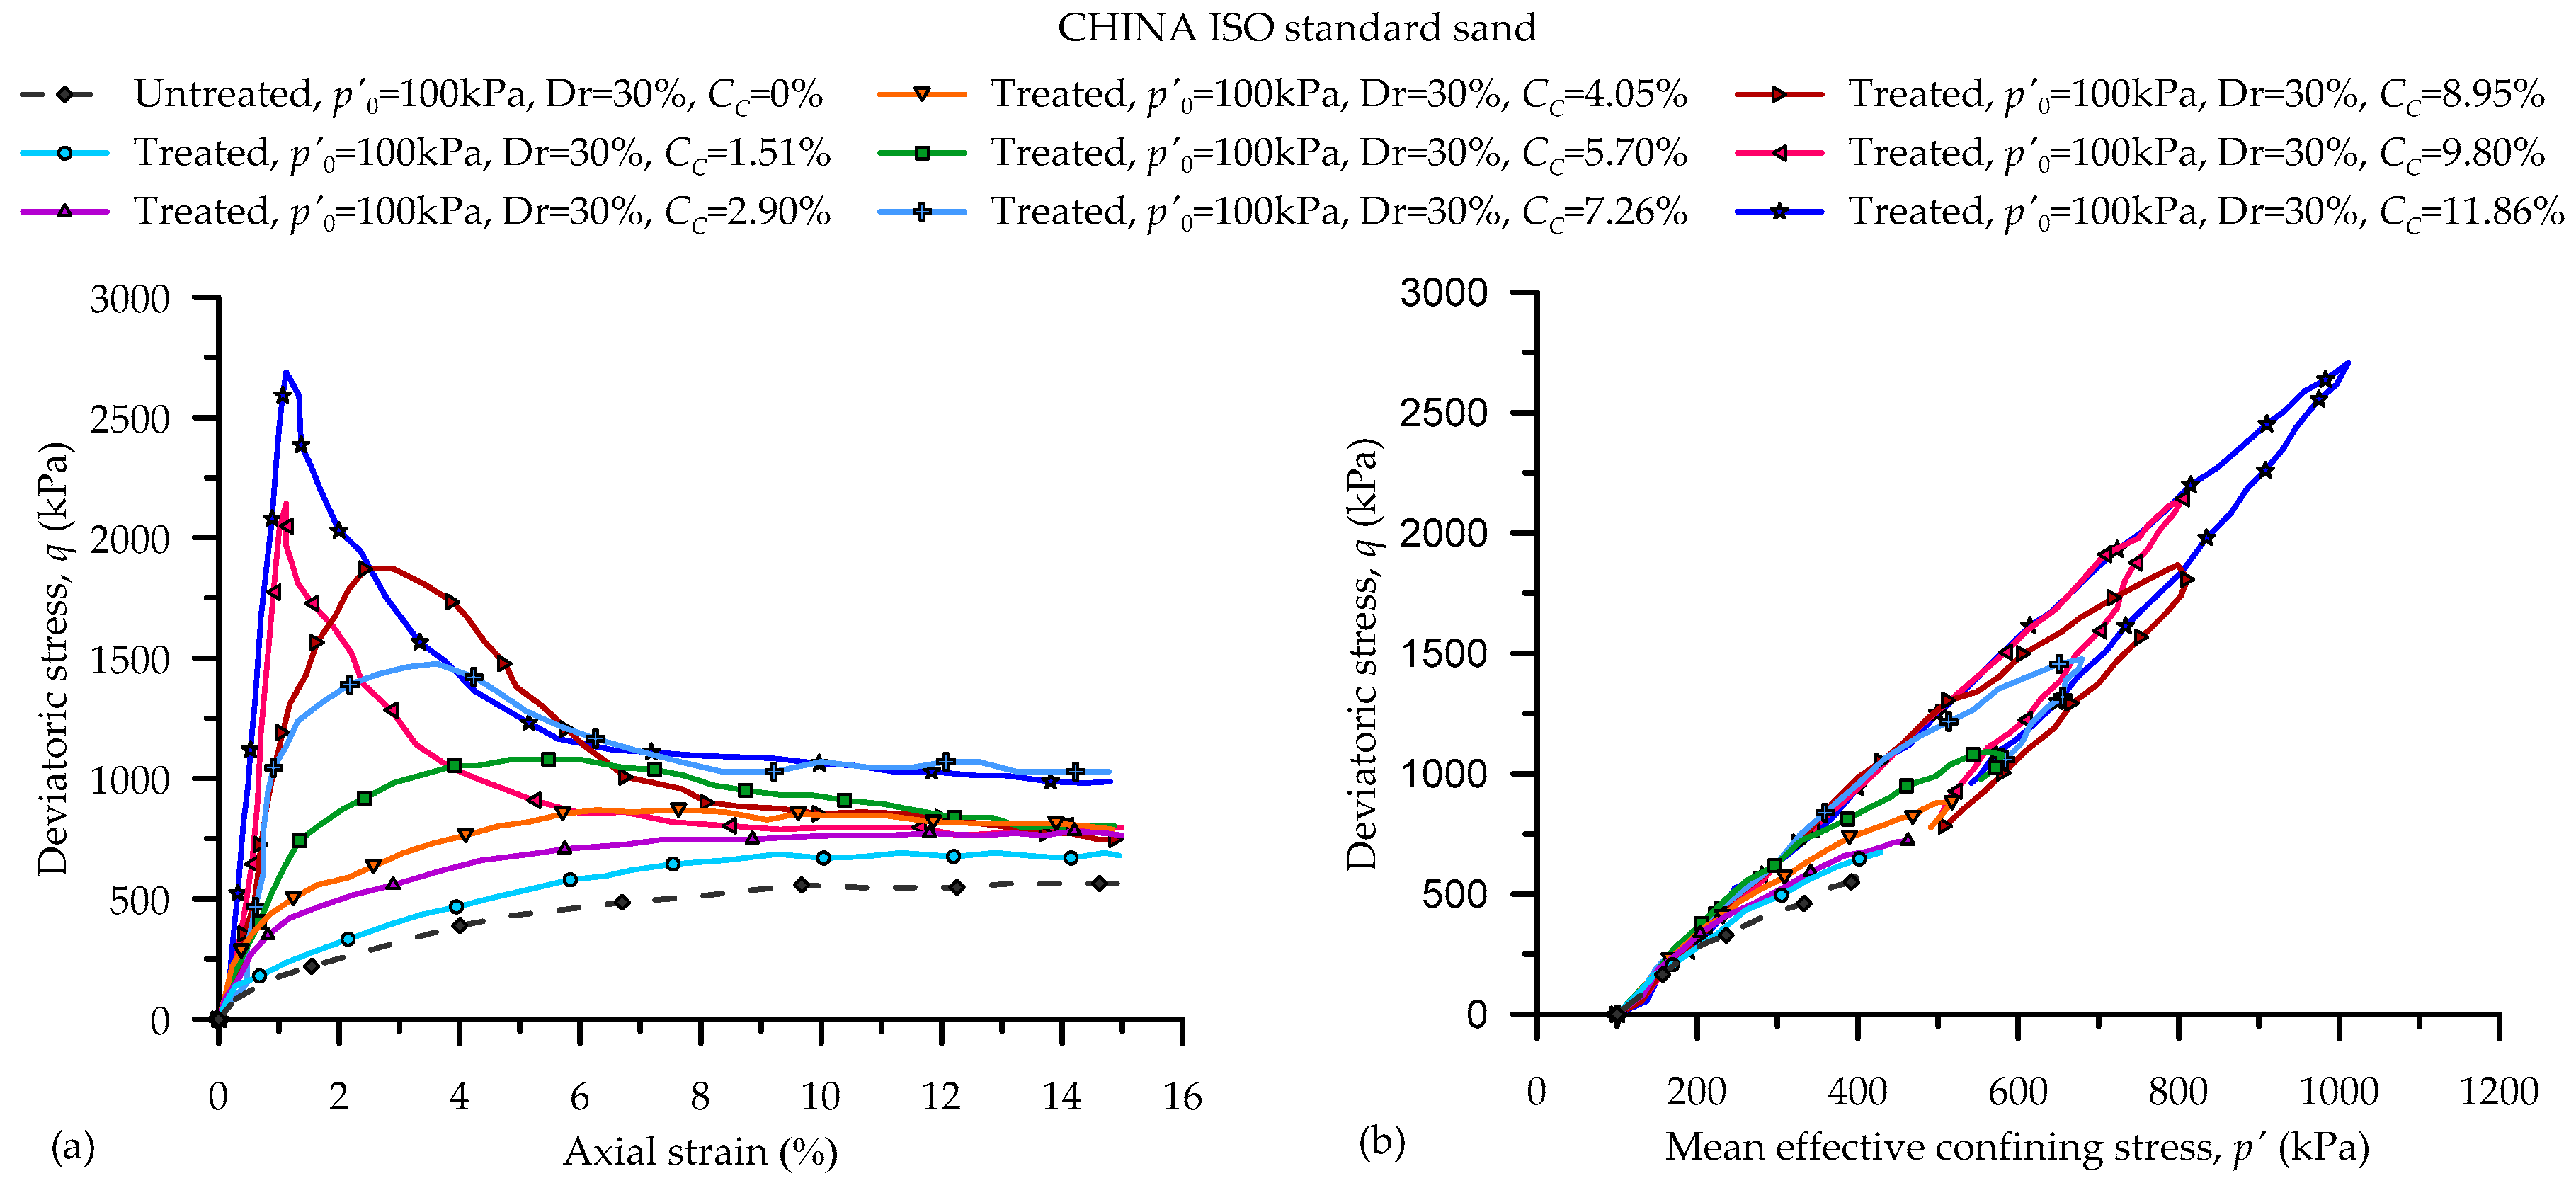
Similar to UCS, a series of STS tests on MICP-treated soils have been reported in recent literature [54,79,80,82,83,84,85]. In these studies, STS values have been assessed and compared with other parameters such as the CaCO3 content [79,80,82], different soil types [54,82], and reinforced fibre content [83,84,85]. A summary of the studies can be found in Table 3.
To evaluate the influence of different factors such as soil type, Cc and fibre content on the STS of MICP-treated soils, data from previous studies were compiled and critically analysed. Figure 6a shows a plot of STS versus Cc for different soil types (represented by D10). The STS of MICP-treated soils ranges from 0.04 to 1.06 MPa, CC ranges from 3.8 to 31.0%, while the fibre content ranges from 0 to 1.2%. As shown in Figure 6a, STS increases exponentially with increasing CC; however, three distinct trends were observed possibly due to the effect of the particle size distribution not being properly captured by D10 as well as the grain shape.
In Figure 6b, STS was plotted against CC for different fibre contents. A good correlation was observed between STS and CC, with two distinct trends. This is an indication that both Cc and the fibre content have a combined effect on the STS of MICP-treated soils. For example, considering similar soil types (same D10) and fibre content, a slight variation in STS was observed possibly due to differences in CC.

4.3. Triaxial Tests

Many researchers have conducted triaxial testing on bio-cemented soils under drained and undrained conditions [3,28,42,105,106,107]. Ismail et al. [106] studied the mechanical behaviour of cemented soil under CIUC triaxial testing. Their study showed that soil samples treated with Portland cement exhibited ductile yield whereas samples treated with gypsum or MICP showed brittle behaviour. Similar observations were reported by DeJong et al. (2006) where MICP- and gypsum-cemented samples exhibited brittle behaviour compared to uncemented samples.
Lin et al. [107] conducted a series of tests on MICP-treated soil under consolidated isotropically drained compression (CIDC) triaxial testing. In their study, the effect of different substrate (specifically CaCl2) concentrations on the mechanical behaviour of MICP-treated soils was evaluated. Their observations showed that MICP-cemented sand specimens exhibited an increase in peak deviatoric stress with an increase in the CaCl2 concentration. Cui et al. [105] studied the effect of different cementation levels on the mechanical behaviour of MICP-treated sand through a series of CIDC triaxial tests. Their study showed that a higher degree of cementation resulted in increased strength. A summary of the studies can be found in Table 4.

4.3.1. Undrained Behaviour

In general, the behaviour of MICP-treated soils is affected by the initial relative density (Dr), confinement ( p 0 ) and cementation levels in term of CC. Figure 7 compares typical undrained shearing responses of MICP-treated and untreated sandy soils. At a constant p 0 = 100 kPa and Dr, the MICP-treated soils under undrained shearing show breakage of bonds (brittleness) at different axial strains (Figure 7a). The MICP-treated soils also exhibit higher peak and residual strengths and increased initial shear stiffness compared to the untreated state when plotted in q p space (Figure 7b).
It is worth noting that the undrained triaxial behaviour of both MICP-treated and untreated soils, as shown in Figure 7, were for the same initial p 0 and Dr. Therefore, the difference in behaviour was due to the difference in their CC. MICP-treated soils with high CC exhibited higher strength (peak deviatoric stress, q p e a k ). For example, the MICP-treated specimen (with CC = 11.86%) exhibited approximately five times higher strength compared to the untreated soil (Figure 7a). Also, the specimen with CC exhibited higher brittleness compared to the ductile nature of low cemented MICP-treated soils [3,28,105]. Therefore, a further detailed analysis was performed to correlate CC with other index properties such as the brittleness index (BI), peak deviatoric stress ( q p e a k ) and residual stress ratio ( η R e s = q / p ) at the end of the tests.
The ductile or brittle failure was also evaluated using the brittleness index (BI) proposed by Consoli et al. [110], and later, many adopted a similar approach to evaluate soil behaviour [111,112,113]. The BI can be expressed as:
B I = ( q p e a k / q R e s ) 1
where q R e s is the peak residual strength. The results of the variation of CC with q p e a k , BI and η R e s are plotted in Figure 8. As shown in Figure 8a, q p e a k increases exponentially with CC. A good correlation was obtained for q p e a k versus CC with a coefficient of determination (R2) of 0.99. A plot of BI versus CC is shown in Figure 8b; here, the BI of MICP-treated soil increased exponentially with CC (with R2 of 0.75). However, it is worth noting that the rate of increase of BI was significantly higher only after CC > 3%, i.e., there may be a threshold CC of approximately 3% for these tests. Figure 8c shows a plot of η R e s versus CC. It is evident that η R e s ranges from 1.4 to 1.8, with no observed relation with CC, i.e., η R e s did not change significantly for both untreated and MICP-treated soils.

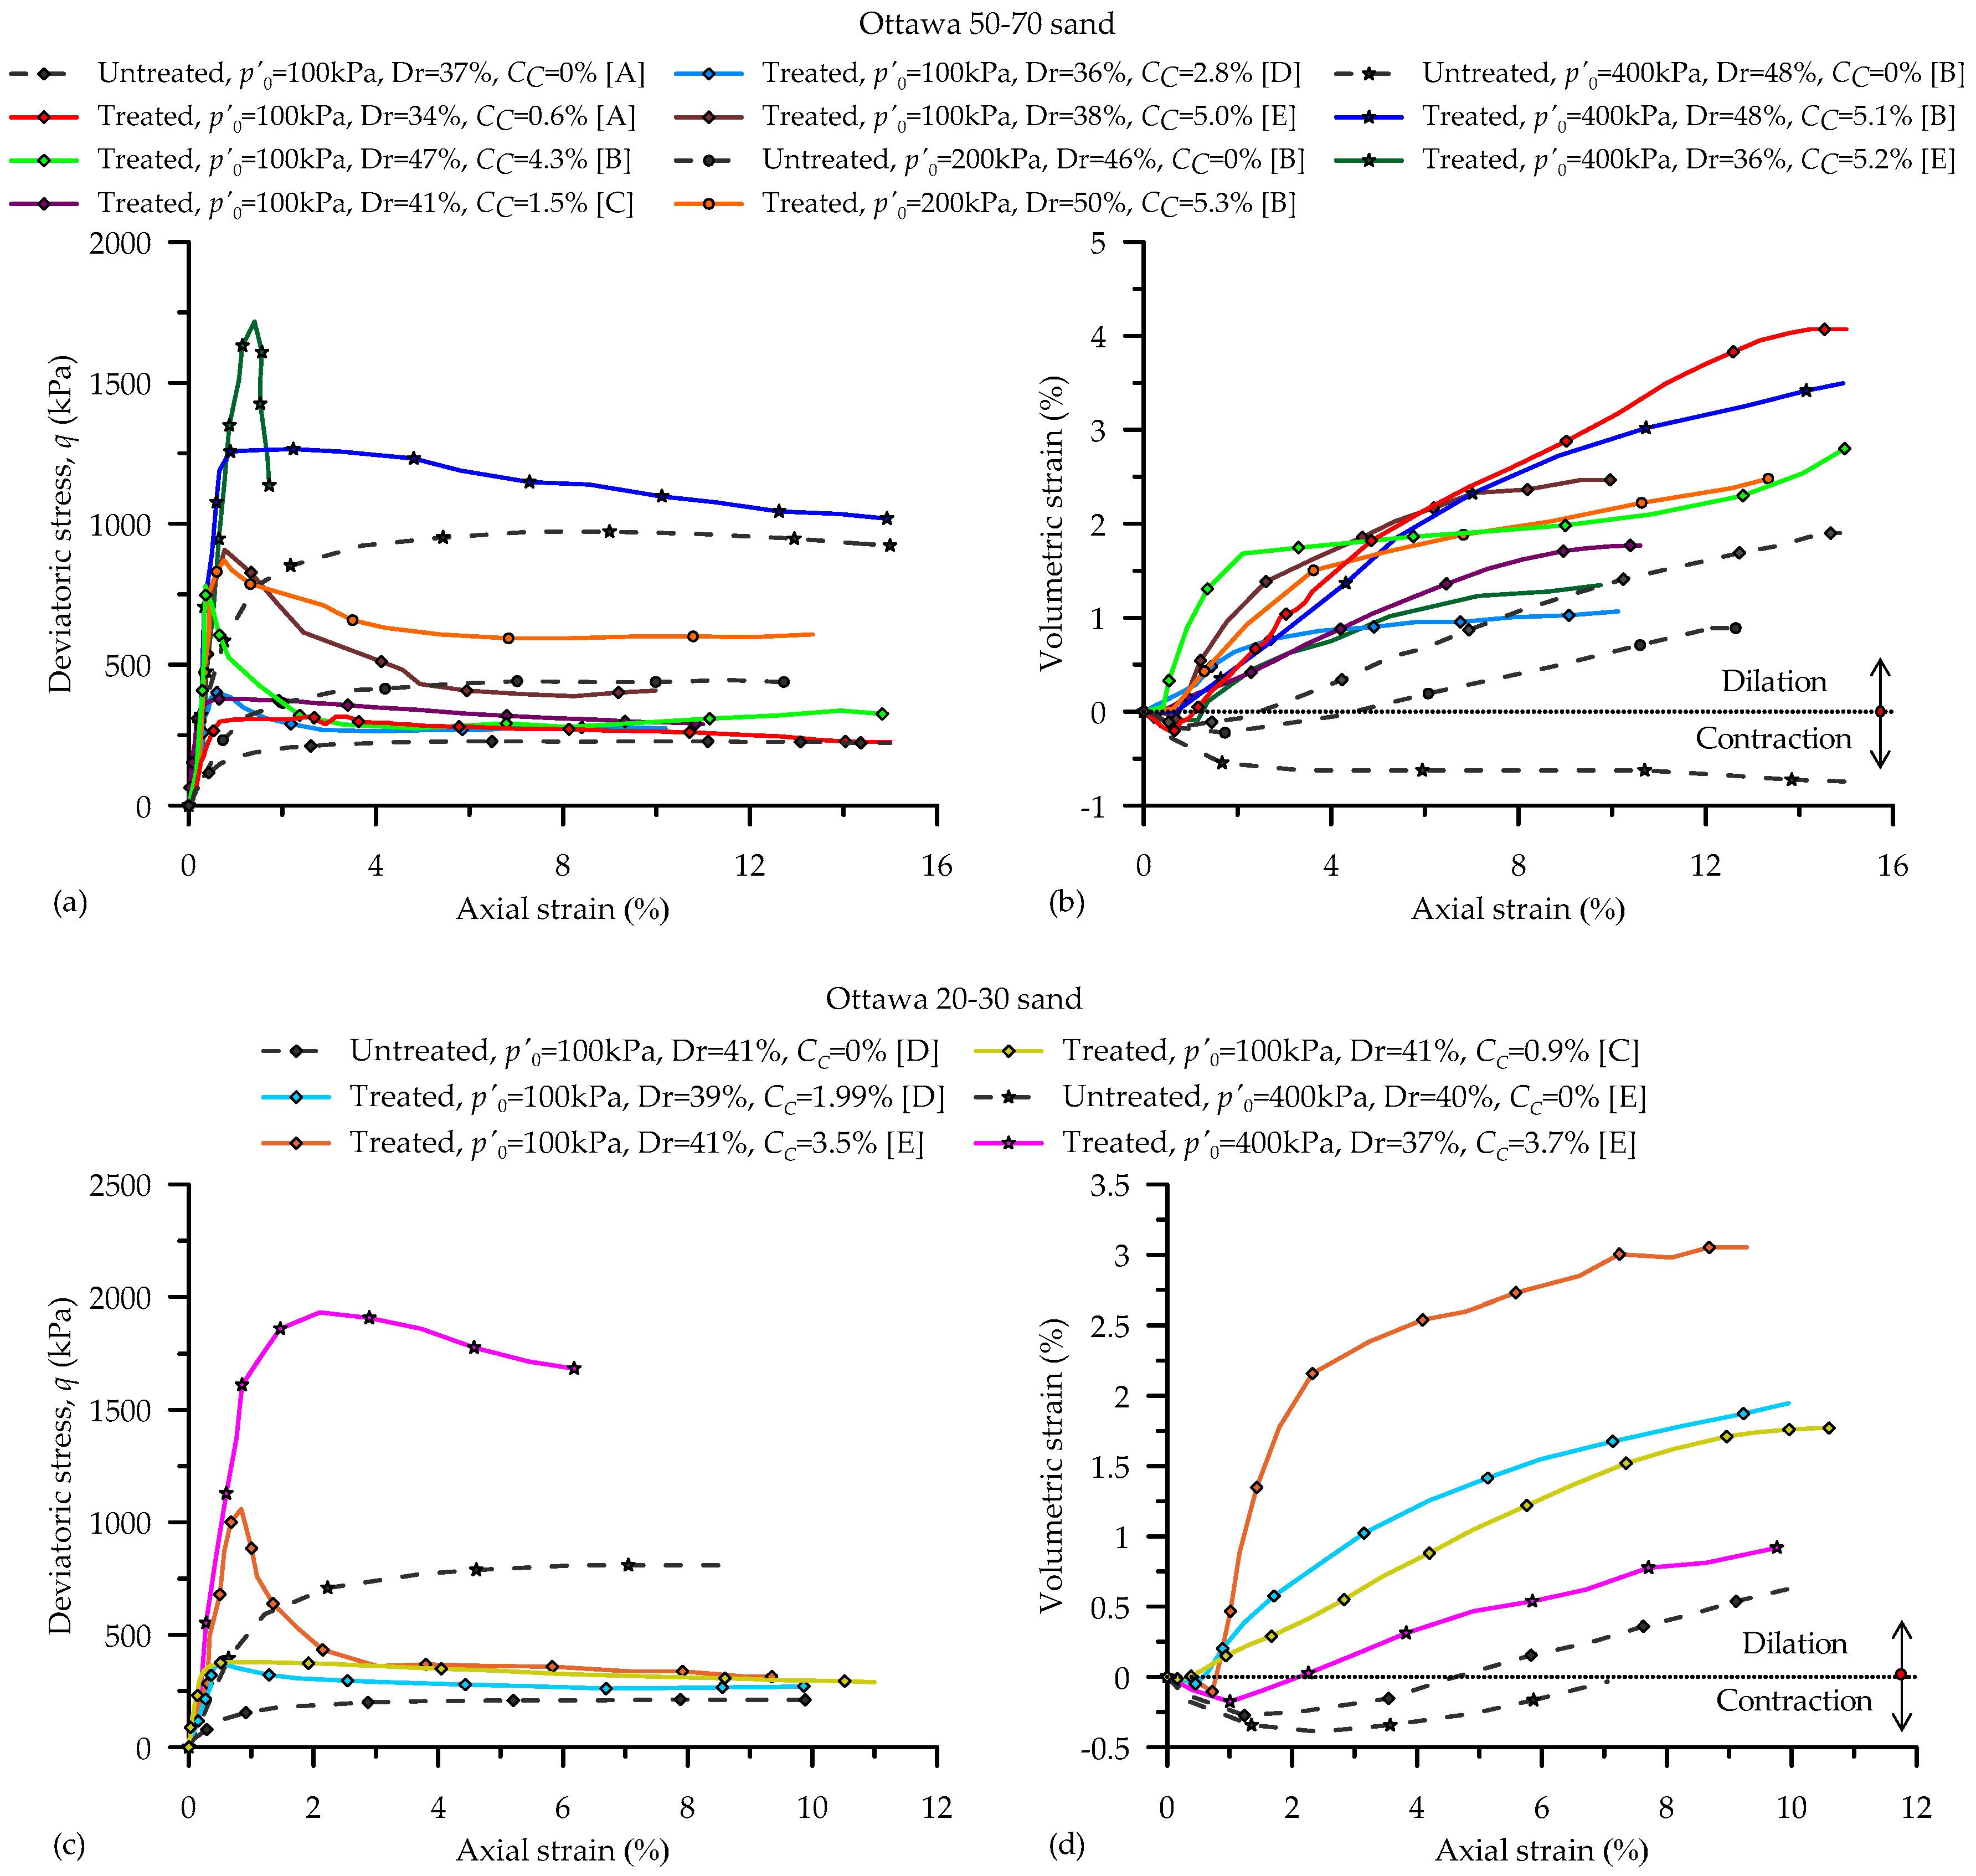
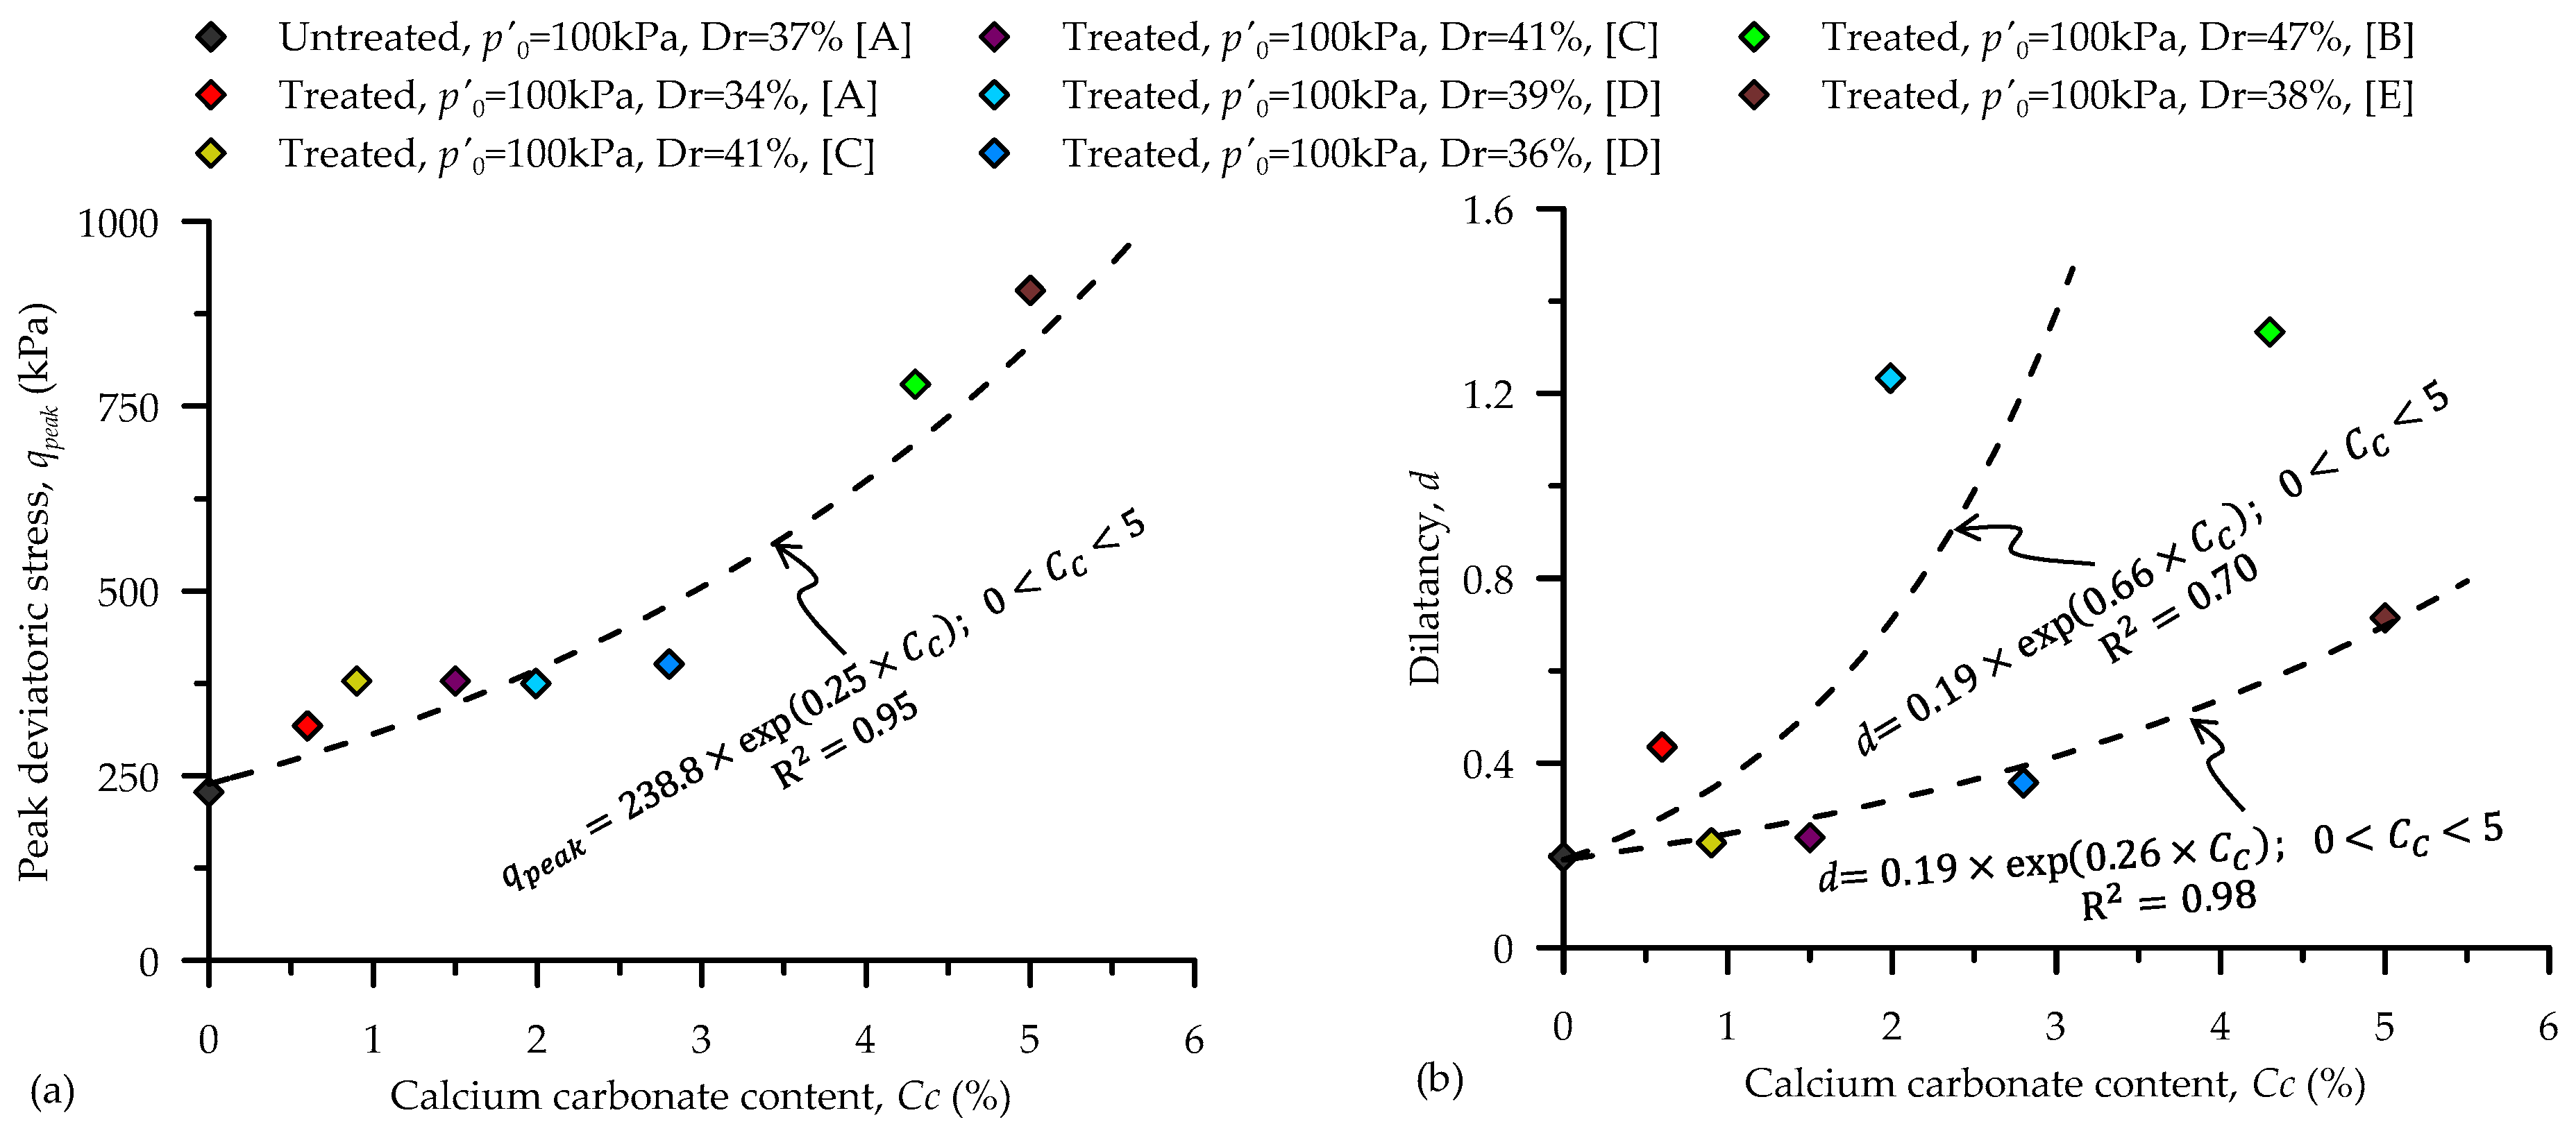
4.3.2. Drained Behaviour

In this study, data from drained triaxial tests are compiled from the literature [28,88,91,107,109,114]. To reduce the effect of soil particle size and geometry, two distinct soil types (Ottawa 50–70 in Figure 9a,b and Ottawa 20–30 in Figure 9c,d) were considered. Figure 9 shows the typical drained behaviour of MICP-treated and untreated sand at p 0 = 100–400 kPa. Plots of deviatoric stress ( q ) versus axial strain for Ottawa 50–70 and 20–30 are shown in Figure 9a,c, respectively. A comparison of untreated and MICP-treated soils shows that for the same p 0 and and similar Dr (40 ± 10%), the MICP-treated specimens exhibit approximately three times higher strength compared to the untreated soils. For example, at p 0 = 100, the MICP-treated soils show peak q = 318 kPa at CC = 0.6% [28], q = 375 kPa at CC = 2.8% [91], q = 378 kPa at CC = 1.5% [107], q = 780 kPa at CC = 4.3% [109] and q = 1059 kPa at CC = 5.0% [88] compared with the untreated Ottawa 50–70 sand which shows peak q = 228 kPa [28] (Figure 9a). This also indicates that the peak strength and the residual strength both increased with an increasing cementation level of the MICP-treated soil.
Plots of volumetric and axial strain for Ottawa 50–70 and 20–30 are presented in Figure 9b,d, respectively. For the same p 0 , the volumetric strain response was found to be more dilative for MICP-treated soils compared to the untreated sand. For example, the MICP-treated soils exhibit less contraction (with no contraction observed in some cases) at small axial strains (less than 3%) followed by more dilation at large axial strains compared to the untreated sand specimen. Similar to the observed behaviour in the stress-strain plot, the dilative behaviour of the MICP-treated soils increased with increasing CC.
To quantitatively assess the influence of CC on the drained shear strength behaviour of MICP-treated Ottawa sand, q p e a k was obtained from Figure 9 and plotted with CC in Figure 10a. Similar to the results for undrained behaviour, q p e a k increases exponentially with CC as shown in Figure 10a with an R2 value of 0.99. The dilatancy (d), which is defined as the rate of plastic volume change ( d ε v p ) with the plastic deviatoric strain ( d ε q p ), is an important characteristic behaviour of drained soil [114,115,116] and has been used in prediction/constitutive modelling of soil behaviour [117,118]. The dilatancy (d) can be calculated using Equation (8). Soil and slightly cemented/treated soil exhibit negligible elastic behaviour under large strain; therefore, the total volumetric and deviatoric strains were assumed to be plastic [117,119].
d = ( d ε v p / d ε q p ) ( d ε v / d ε q )
As in Figure 10b, d also varies exponentially with CC with two different trends for the two soils. Although limited datasets were used for this analysis, it is envisaged that this behaviour may provide a pathway for future studies on the drained triaxial response of MICP-treated soils and a unified constitutive model.

4.4. Modelling of MICP-Cemented Soils

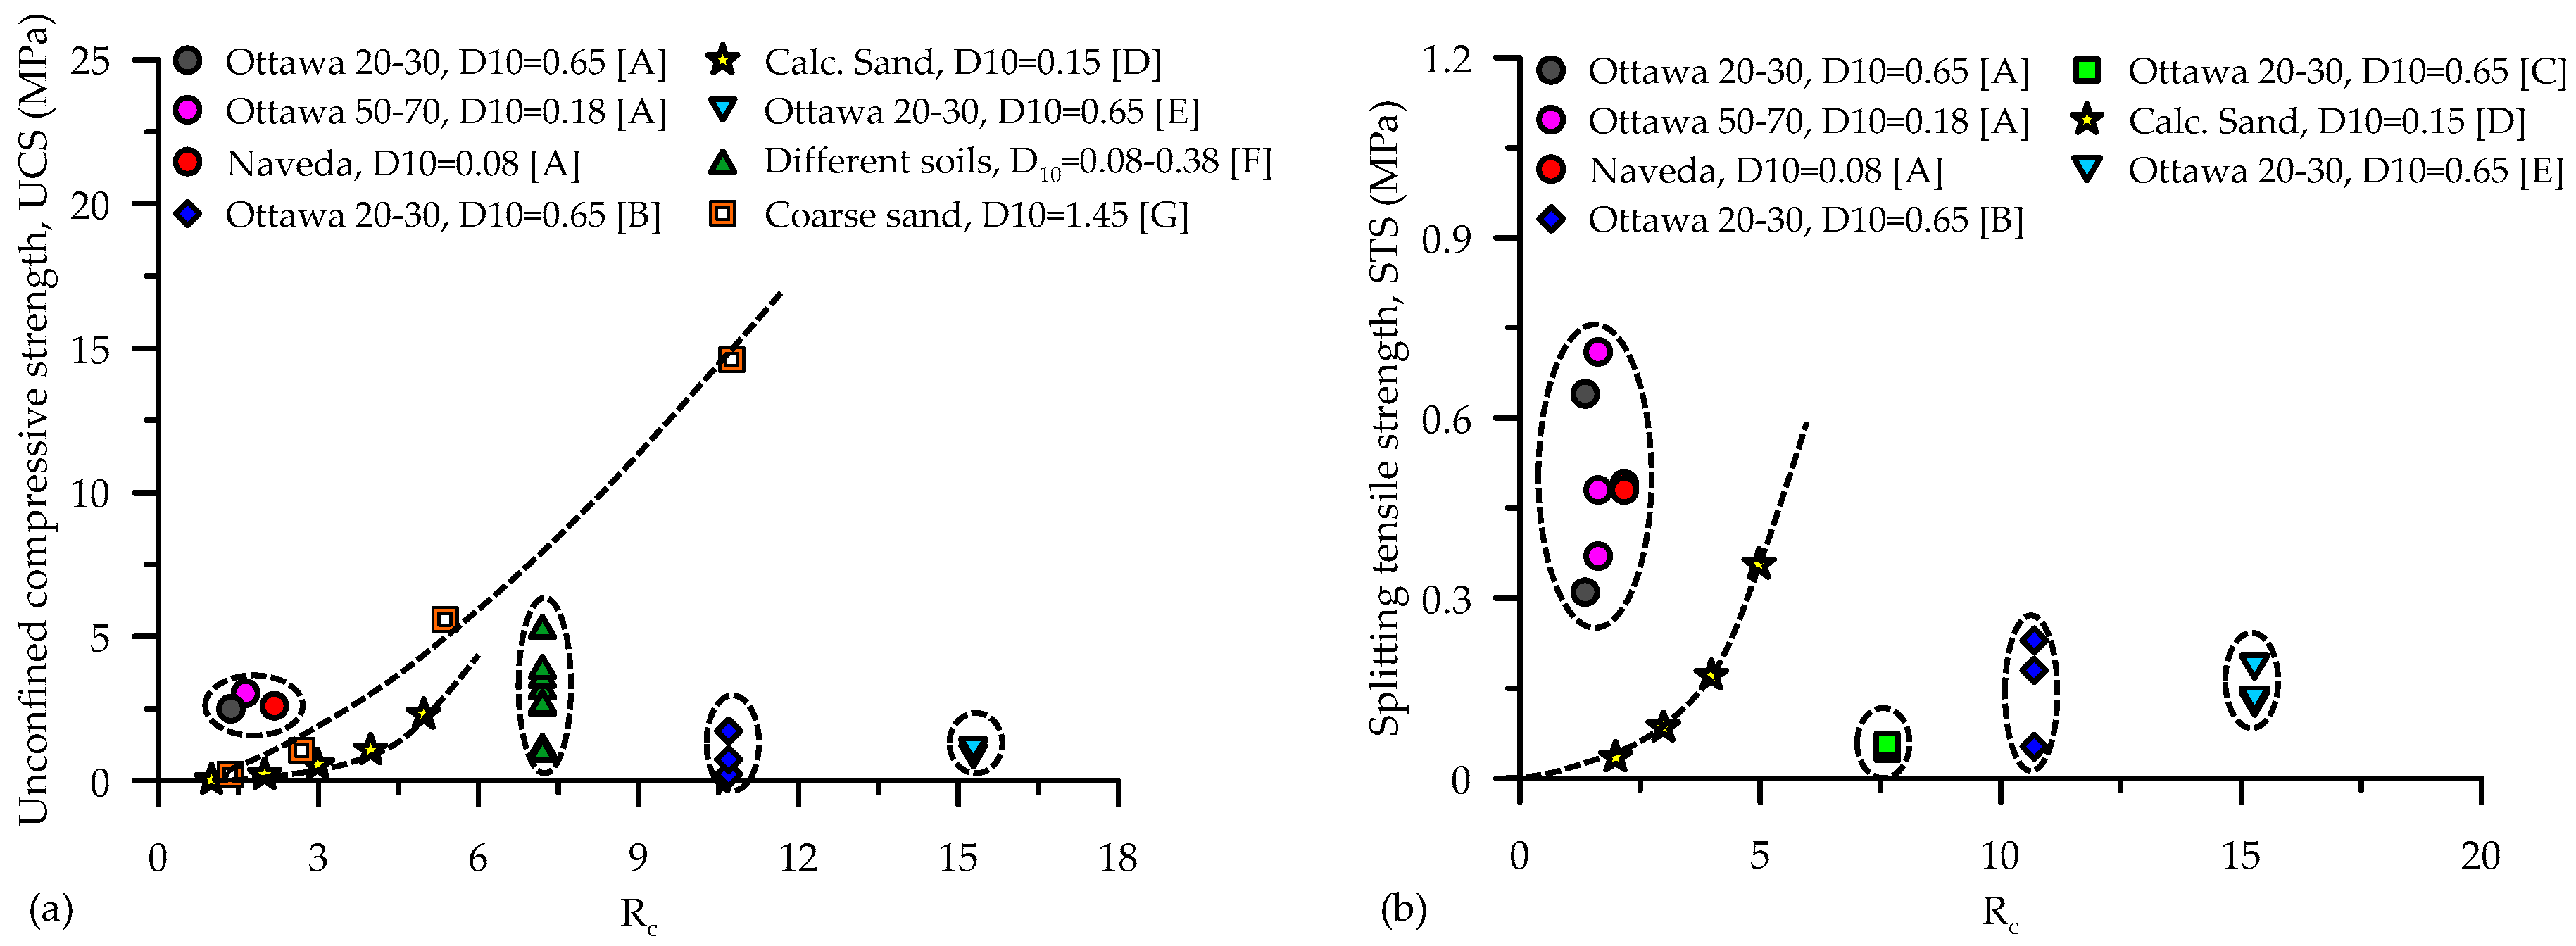
4.4.1. Empirical Correlations

The strength and stiffness of MICP-treated soils have been correlated with parameters such as the CaCO3 content [76,103,120], shear wave velocity (Vs) [121], frictional angle (ϕ) [27], curing time [76] and soil types [39,122]. There have many attempts to empirically model the strength and stiffness of MICP-treated soils. These attempts can be broadly classified into three groups, namely, as a function of Cc, as a function of porosity, the volume of cementation solution and Cc and as a function of soil particle size and Cc.

UCS as a Function of CC

Several empirical relationships or equations have been proposed to correlate UCS with CC. For example, Harkes et al. [120] developed the following relationship (Equation (9)) for MICP-treated Itterbeck fine sand (D50 = 0.17) to correlate UCS with CC (R2 = 0.91). However, there were inconsistencies with the physical meaning of the equation terms. For example, at 0% CC, the equation gives a UCS value of 128.11kPa, which is not true for coarse-grained soils such as sands.
U C S = 128.11 × e 0.0112 × C C
Li et al. [103] proposed a parabolic function to correlate UCS and CC for a sand (D50 = 0.42). They imposed a limiting condition of UCS = 0 when CC is less than the intercept to avoid inconsistencies for UCS at Cc = 0.
U C S = ( a × C C + b ) 2 c 0 ; I n t e r c e p t = c b a
where a, b and c are constant parameters that can be obtained via regression analysis.
Another non-linear empirical function was proposed by Choi et al. [19] to correlate the UCS and CC of MICP-treated soils based on compiled data from the literature for a range of soil types. Their function was expressed as:
U C S = α U C S × ( C C / 1 % ) β U C S ,   f o r   C C < 30 %
where α U C S and β U C S are fitting parameters.

Vs as a Function of CC

Qabany et al. [121] proposed an empirical correlation (Equation (11)) between shear wave velocity (Vs) from bender element testing and the CC of MICP-treated Ottawa 50–70 sand (D50 = 0.22) and proposed that this could be used as an indirect indicator or measure of CC.
V s = 9.7 ( C c ) + 147

UCS or STS as a Function of Porosity, Volume of Cementation Solution and CC

Xiao et al. [85] adopted the empirical relationship proposed by Consoli et al. [123] to predict the UCS or STS of BFR-MICP cemented sand. They observed in their study that the UCS and STS were primarily affected by the specimen porosity (n) and cementing-agent volumetric content (Civ). Their equation is presented below.
U C S   o r   S T S = A ( I c f ) α = A [ n / ( C i v ) β ] α
where I c f = cementing factor, and A, β and α are fitting parameters.
Liu et al. [79] proposed a sample volume ratio (RC) parameter, which was expressed as the volume of the injected cementation solution (VC) divided by the total volume of the sample (V). Here, the molarity of the cementation solution (C) was normalized by the standard concentration (Ca). RC is defined by the following equation:
R C = V c ( C / C a ) V
The RC parameter gave a reasonably accurate and convenient determination of CC, and this avoided the determination of the CaCO3 content by the conventional acid-washing technique. Their study also suggested that a good correlation could be achieved between UCS or STS and RC using the following empirical equation:
U C S   o r   S T S = m × e x p ( n × R C )
where m and n are fitting parameters.
In order to evaluate the performance of the parameter RC, a detailed assessment was undertaken in the current study by correlating UCS or STS and RC for data compiled from previous studies (Figure 11). Figure 11a shows a plot of UCS versus RC for different soil types (specifically D10). It is worth noting that RC shows an exponential relationship with UCS for a few datasets especially data from the authors [79], who proposed the RC parameter. However, for other sets of data from different authors, RC did not have a good correlation with UCS. A similar behaviour (trend) was observed for STS versus RC as shown in Figure 11b.
It is evident that the RC parameter can only capture the volume of the injected cementation solution per sample volume for a given chemical constituent concentration, which may not have a direct relationship with the strength of MICP-treated soils. For a given MICP treatment, the strength (UCS or STS) may be influenced by several factors including the treatment method, urease activity of bacteria, the molar ratio of chemical constituents, curing time, soil type and geometry. It is generally known that most of these factors control the amount of precipitated CaCO3 within the soil. Therefore, further research is warranted to develop a model that can correlate the strength of MICP-treated soils with CC and soil type.

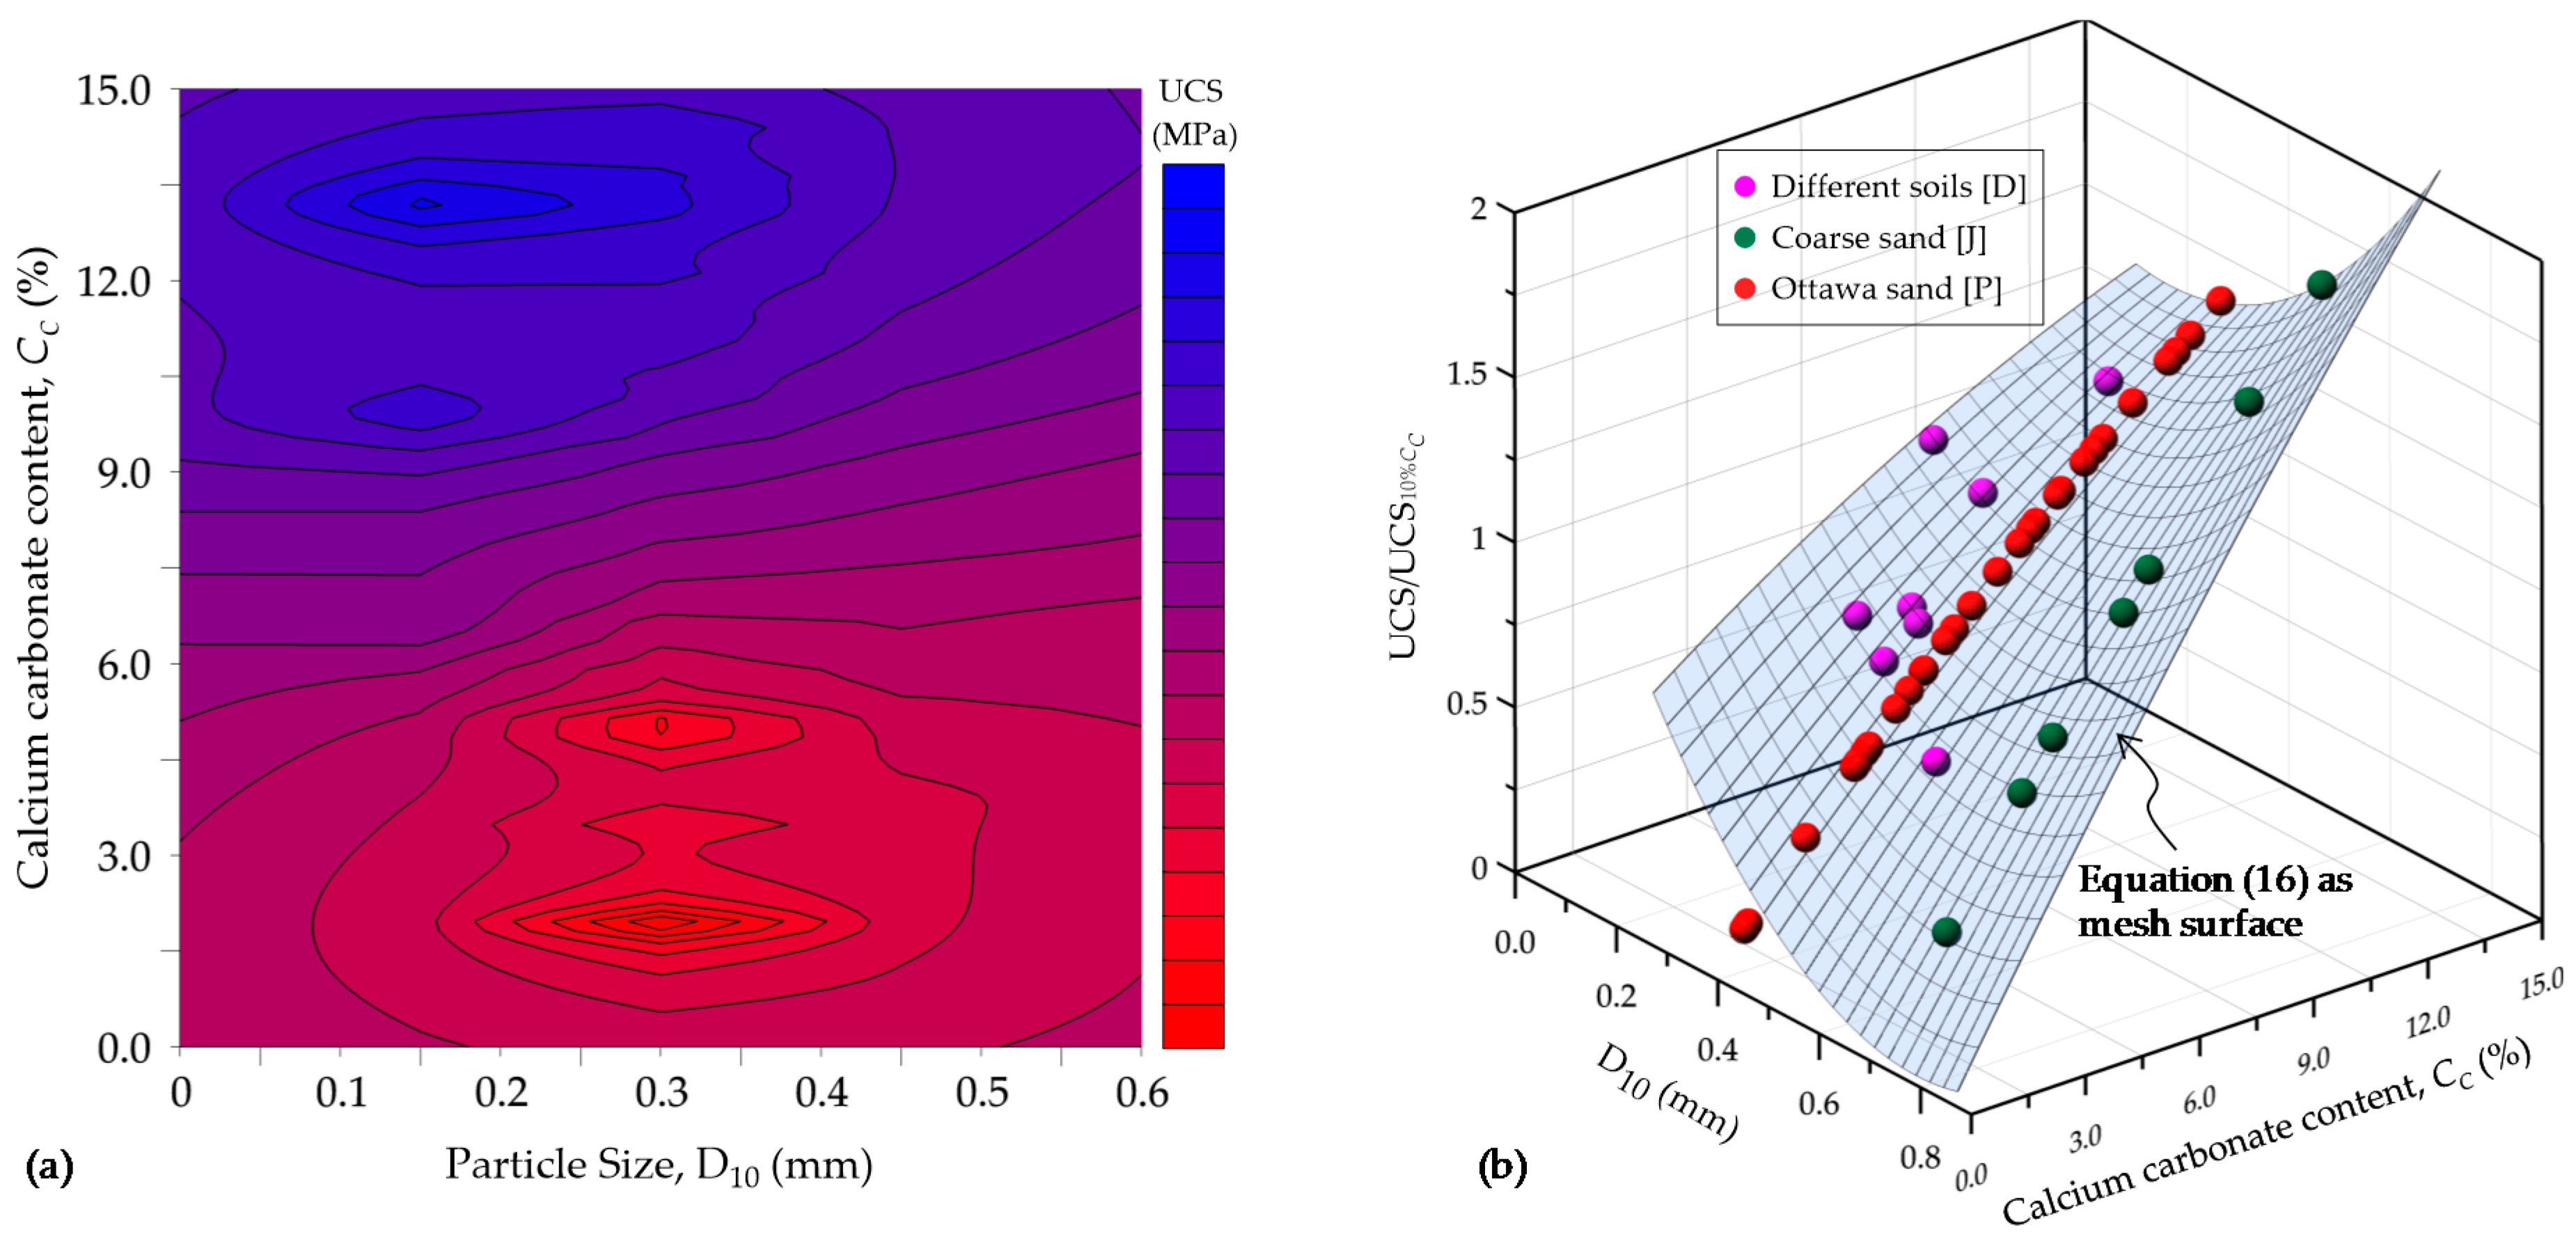
UCS or STS as a Function of Soil Particle Size and Cc

A study by Rahman and Hora [124] correlated soil grading (mainly D10) and CC with the UCS of MICP-treated soils. The study used data from previous studies and selected tests with soil specimens of diameter 50 mm and height 100 mm under saturated conditions. A statistical analysis tool was used to analyse these data points to understand the variation of UCS with D10 and CC. A 3D contour plot, as shown in Figure 12a, was generated with this method, which shows a significant influence of D10 on the UCS strength gains. The study also performed a regression analysis on the same data points and presented a best-fit equation between these three parameters as:
U C S U C S 10 % C C = 0.689 3.85 D 10 + 0.073 C C + 2.75 D 10 2 + 0.196 D 10 C C 0.0017 ( C C ) 2
The UCS values were normalized by the UCS values at 10% CaCO3 of corresponding soils, and Figure 12b presents the 3D plot with the above equation as a mesh surface.
The analysis reported by Rahman and Hora [124] indicates a significant influence of D10 on UCS, but the analysis was performed on limited data sets through some screening criteria. Therefore, this is a preliminary study that can provide a pathway for developing better models in the future.

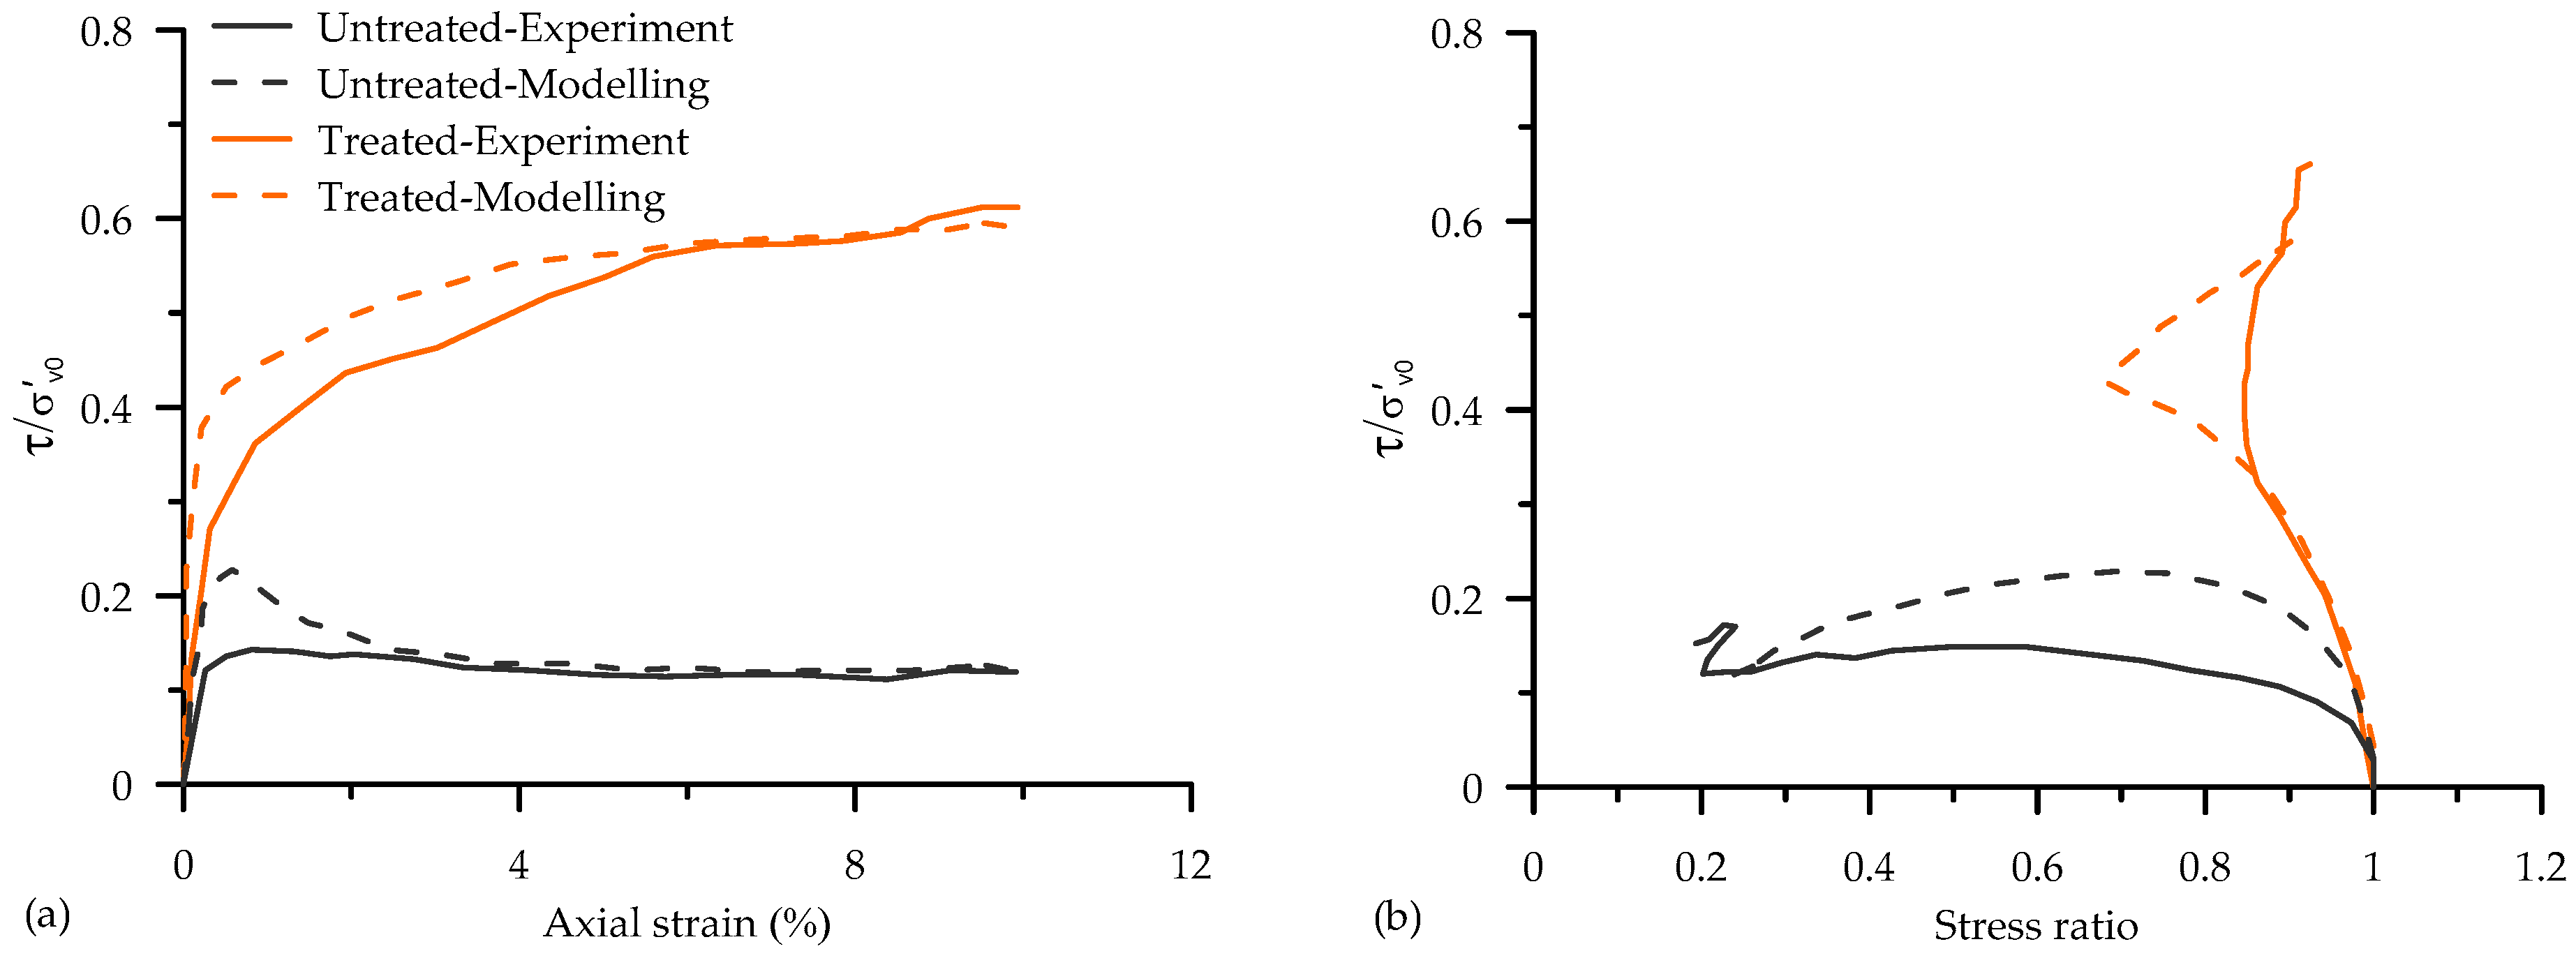
4.4.2. Constitutive Modelling

Despite numerous studies conducted, limited attention has been paid to the constitutive behaviour of MICP-treated soils. Several constitutive models can be found in the literature that have been developed for cemented soils [46,125,126,127,128,129,130,131,132,133,134]. However, only in a very limited number of cases have the models been either developed or validated specifically for MICP-treated soils. El Kortbawi et al. [135] evaluated the capability of a bounding surface plasticity model developed for granular materials [136] to capture different behavioural aspects of an MICP-treated soil (see Figure 13 for a comparison of experimental data and model prediction). They concluded that accounting for degradation of cementation, differences in the location of CSL (because of broken cementation in the final material) may improve the model capability.
Nweke and Pestana [134] proposed modification to an existing constitutive model developed for cemented soils [137] to better capture the behaviour of MICP-treated soils. Their model allowed the degradation of strength and stiffness with the degradation of CaCO3 bonds. The following equation was proposed to achieve a stable friction angle at lower stresses which degraded towards a critical state value at larger confining pressures.
ϕ p e a k ϕ c s = α ( ϕ c s 2 ) D r exp [ ( 0.24 β D r ) ( P f P a t m + P t ) m ]
where ϕ c s is the friction angle at a critical state, D r is the initial relative density, P f is the mean effective stress at failure, P t represents the effect of cementation, P a t m is the atmospheric pressure, α and β represent the effect of grain shape and size and m is a constant.
The maximum shear modulus ( G m a x ) of treated soils was estimated by incorporating the degradation cementation using a “damage” model as expressed in the following equations:
G m a x P a t m = G b e 0 1.3 ( P f P a t m + P t ) 0.5
with
P t = P t o 1 + a γ b
where G b is a constant depending on the soil type, e is the initial void ratio, P t o is the initial P t , γ is the shear strain and a and b are the degradation model parameters.
Despite the capability of the above model in predicting the behaviour of lightly cemented soils (see Figure 14), it, however, does not incorporate the effect of cementation on the void ratio of soils after MICP treatment. Therefore, the model may not be able to predict the behaviour of heavily cemented (MICP) soils under high confining stresses.
Nweke and Pestana [138] proposed a modified form of the above model by introducing a cementation parameter to capture the degree of cementation. The modified equations are presented as:
ϕ p e a k ϕ c s = α ( ϕ c s 2 ) ( 1 + P t P a t m ) m D R exp [ ( 0.24 β D R ) ( P f P a t m ) m ]
P t = Z ( exp ( r C C ) 1 )
Here, CC is the cement content (%), Z and r are parameters that control the scale and rate of degradation.
An elastoplastic constitutive model for MICP-cemented soils was recently developed by Gai and Sánchez [46]. The mechanism for MICP soil enhancement was captured using a critical state yield surface and sub-loading concepts, while the bonding degradation effects under shear were captured using an evolution law. A detailed discussion of the main components of their model is discussed here.
Yield surface: Based on the hierarchical single surface (HISS) framework [139], three yield surfaces (YS), i.e., (1) the critical state soil mechanics (CSSM) YS, (2) the MICP-enhanced YS and (3) the sub-loading YS were considered. The CSSM YS was used to describes the mechanical response of the untreated soil and is represented by the equation below:
F C S S M = α 3 M 2 q 2 9 γ p 2 + 9 γ p n p c 2 n
Here, p and q are the mean effective and deviatoric stresses, respectively; M is the slope of the critical state line in the q p space; p c is the effective pre-consolidation pressure; n controls the transition from compressive to dilative volume change behaviours; a and c are constants that define the shape of the yield surface.
The MICP-enhanced yield surface considers the mechanical influence of CaCO3 precipitation and is represented by the equation below:
F M I C P = q 2 M 2 p 2 p ( p c + p b )
To account for the effect of bonding effect via CaCO3 precipitation, a linear relationship was assumed to relate the CaCO3 content and the mechanical hardening parameter ( p b ) as described in the equation below:
p b = a ( X m c )
Here, m c represents the CaCO3 content and a and X are the scaling constant and the damage factor, respectively, which account for the degradation of the cementation during loading.
The sub-loading YS as part of the CSSM framework was also resented by the equation below:
F S U B = q 2 M 2 p 2 R p ( p c + p b )
where R is the sub-loading ratio (0 < R < 1).
Elastic moduli: The elastic bulk modulus (K) and shear modulus (G) were presented as a function of volumetric state, confinement and Poisson’s ratio as shown below,
G = 3 ( 1 2 v ) 2 ( 1 + v ) K
where v is the Poisson’s ratio and K is a constant parameter expressed as:
K = 1 + e k p
Here, e represents the void ratio and k is the slope of the unloading/reloading line in the e–log(p’) space.
Hardening law and flow rule: The proposed model incorporated three different strain hardening parameters: p c , R and p b . In the elastoplastic model, the hardening/softening behaviour of soils depends on the plastic volumetric strains. However, here the (hardening) pre-consolidated pressure depended on both d ε v p and d ε q p , as expressed as:
d p c p c = 1 + e λ K   d ε v p + D s 1 + e λ K   d ε q p
where λ represents the slope of the normal compression line in e–log(p’) space, and D s is an exponential parameter associated with soil dilation at failure.
Stress-strain relationship: The stress-strain relationship used in their proposed elastoplastic model can be expressed as:
d σ = D e ( d ε d ε p ) = D d ε + D m c d m c
where d ε is the total strain increament, D is the elastoplastic stiffness matrix and D m c is associated with changes in the CaCO3 content.
The experimental data (from Cui et al. [105]) and model prediction (from Gai and Sánchez [46]) of the stress-strain and volumetric responses for the MICP-treated and untreated specimens are presented in Figure 15a,b respectively. The overall response of both untreated and treated soils shows a dominant dilative volume change behaviour, which becomes more pronounced with an increase in CC. By comparing both experimental and modelling results, it is evident that the constitutive model developed by Gai and Sánchez [46] was able to capture the main features of both untreated and treated soil behaviours, as follows: (1) increase in strength and stiffness with an increasing CC (Figure 15a) and (2) post-peak stress trends for different CC values. However, the overall dilative volumetric behaviour for different CC values was not accurately captured (Figure 15b).

4.4.3. DEM Modelling

In general, DEM modelling of chemically cemented soils (e.g., Portland cement) has been investigated by several researchers [140,141,142,143,144,145,146]. Some studies have attempted to also model the micro-scale behaviour of MICP-cemented soils using DEM [47,48,49,50]. A summary of these studies is presented in Table 5. In DEM, a contact bond model represents the cementing material binding adjacent soil particles that is considered to behave as a glue [147]. Different contact bond models have been proposed in an attempt to simulate the behaviour of the bond that exists between the cemented material and the soil particles. Examples of contact bond models used to simulate the behaviour of MICP-cemented soils include the parallel bond model (PBM) [49,50,142,143,144,148,149], the beam model (BM) [146], the cement ring bond model (CRBM) [47,48,142,143,150], the cohesive bond model (CBM) [151,152] and the serial bond model (SBM) [145].
Parallel bond model: A parallel bond is a cylindrical material that can be used to represent the force-displacement behaviour of cemented material between two particles in contact, as shown in Figure 16. This arrangement is similar to the bond between sand and CaCO3 in MICP, as shown by the scanning electron microscopy (SEM) image in Figure 16a.
A parallel bond can be envisaged as a set of elastic springs with normal and shear stiffness acting in parallel (Figure 16b). The force and moment acting on the bonded particles can be linked to the maximum shear and normal stresses acting around the bond (Figure 16c). In DEM simulation, the parallel bond is defined by the following parameters: normal stiffness ( K ¯ n ), shear stiffness ( K ¯ s ), normal strength ( σ ¯ c ), shear strength ( τ ¯ c ) and parallel bond radius ( R ¯ ). Similar to a cemented physical specimen, the parallel bond breaks when the shear or normal forces exceed their shear or normal strengths. The total force ( F ¯ i ) in a parallel bond can be resolved into normal ( F ¯ i n ) and shear ( F ¯ i s ) components and can be expressed as:
F ¯ i = F ¯ i n + F ¯ i s
In general, the parallel bond model has been widely used in DEM to simulate the behaviour of cemented soils. However, the model has the following limitations:
  • Parallel bonds in a DEM simulation usually underestimate the residual strength of cemented soils since the bond shows progressive breakage during loading when the shear or normal forces exceed their shear or normal strengths.
  • Simulation using parallel bonds cannot capture both cohesive failure (bond breakage within the calcite phase) and adhesive failure (bond breakage between the calcite minerals and sand grains).
  • The model assumes uniformity for the size and distribution of the cementation material, which is usually unrealistic compared to a physical experiment.
Cement ring bond model: Evans et al. [47] proposed a biocementation model in which progressive failure of a bond at the contact point between two particles can be modelled. In this model, two sand particles are joined by a ring that consists of several smaller cement particles (Figure 17a). This model was used to capture the progressive failure (ductile behaviour) of bio-cemented sand since sand-cement bonds do not necessarily fail at the same time. The overall bond in this model prevents sliding or separation and can also transmit moments. Figure 17b shows the geometry of two overlapping particles (a and b) with radii of r 1 and r 2 connected through a cement chain. Here, the cement particles have a radius of r 3 , while the cement chain has a radius of ρ . The centre to centre distance of the sand particles is R.
Despite the ability of this model to capture the residual strength, nonlinearity and softening of cemented soils in DEM, the model utilises large amounts of particles, which can be computationally demanding and may increase the simulation time.
Beam bond model: Obermayr et al. (2013) performed a numerical simulation of cemented sand using DEM. The study approximated the soil grains as a spherical particle bonded together by a beam of cementitious material as shown in Figure 18a. The bond element obeys a linear elastic material law with finite values for displacements and rotations. In this bond model, two particles (1 and 2) are assumed to be in contact and bonded by a beam element that connects the centres of the spheres (Figure 18b). The bond element is represented by a beam with circular cross-section of radius r b which can be expressed by the following equation:
r b = r ¯ b ( r 1 + r 2 ) / 2
where r ¯ b is the relative radius of the bonded element, and r 1 and r 2 are the radii of the bonded particles.

5. Key Engineering Applications of MICP

5.1. MICP as Binders

Le Metayer-Levrel et al. [153] suggested using the bacterial ability of MICP for producing superficial protective coatings for limestones buildings, monuments and statuary. Another study by Webster and May [154] also suggested bioremediation as an additional technology for restoring stone surfaces in heritage buildings.
MICP being a non-toxic and eco-friendly process has advantages over commonly used methods for binding soil particles, such as chemical grouting. Ivanov and Chu [26] evaluated the cost of raw materials for chemical grouting to be in the range of $2–$72 per m3 of soil whereas for microbial grouting was in the range of $0.5–$9 per m3 of soil when waste materials are used as a carbon source for microbial growth.
Ramachandran et al. [155] concluded through microscopy investigation that MICP is an effective method for crack remediation in concrete. Jonkers et al. [156] established that MICP is effective as a self-healing agent to activate the process of autonomous repair of freshly formed cracks. Achal et al. [157] suggested MICP as an alternative high-quality concrete sealant and crack remediation method which demonstrated a 36% increase in compressive strength of cement mortar as well as six times lower water absorption in the treated samples. Amidi and Wang [158] proposed a new surface treatment method for treating concrete and similar absorbent materials to enhance their resilience and mechanical properties and achieved a 36% increase in compressive strength due to MICP.

5.2. Soil Strengthening and Stabilisation

Multiple studies have applied MICP to different types of soil and tested these under various conditions for strength enhancement and soil stability. DeJong et al. [3] applied MICP to improve the engineering properties of sands such as shear strength and stiffness. The results showed that the ultimate shear capacity and initial shear stiffness were both higher for treated samples compared to untreated loose specimens. Whiffin et al. [4] applied MICP successfully using a 5 m long sand column for ground improvement which was achieved with relatively low flow rates. This study also mentioned that balancing the rate of urea hydrolysis with the delivery of reactants aided in the uniform distribution of CaCO3.
A study by Harkes et al. [5] evaluated MICP as in situ soil strengthening technique in fine-grained sand. The study reported that for a homogenous distribution of bacteria in large sand bodies, a low ionic strength solution promoted bacterial transport over longer distances. Many researchers have evaluated the strength of biotreated sands and have demonstrated improved strength, increased stiffness, liquefaction resistance and enhanced dynamic properties of the treated specimens [30,31,87,100].

5.3. MICP in Bricks

Bricks constitute a significant part of construction materials and are known for their durability and sustainability. However, bricks are also prone to deterioration over time due to the presence of voids and pores resulting in cracking. MICP has proved to be a novel method of treating these cracks or strengthening bricks [159]. Raut et al. [160] demonstrated MICP in bricks and studied the effect of the method on compressive strength and water absorption capacity. Bricks treated with MICP showed 83.9% improvement in compressive strength and 48.9% lower water absorption capacity after 28 days as compared to the control specimen. Lambert and Randall [161] evaluated the process of MICP to produce bio-bricks using the urea from stabilized human urine. Results demonstrated higher compressive strength with an increase in the number of treatments with the highest compressive strength of 2.7 MPa.

5.4. Remediation of Contaminants from the Environment

Rapid industrial development poses a major threat in the form of heavy metals and other contaminants as a by-product of these industries which impacts our environment. In the past, conventional treatments were used to remove heavy metals from contaminated environments. However, these methods are ineffective, expensive and consume high amounts of chemicals and energy [162]. Therefore, alternative methods such as MICP are needed to effectively remove heavy metals without having much impact on the environment. Several researchers [2,23,163] have reported the capability of MICP for heavy metal remediation in the environment.

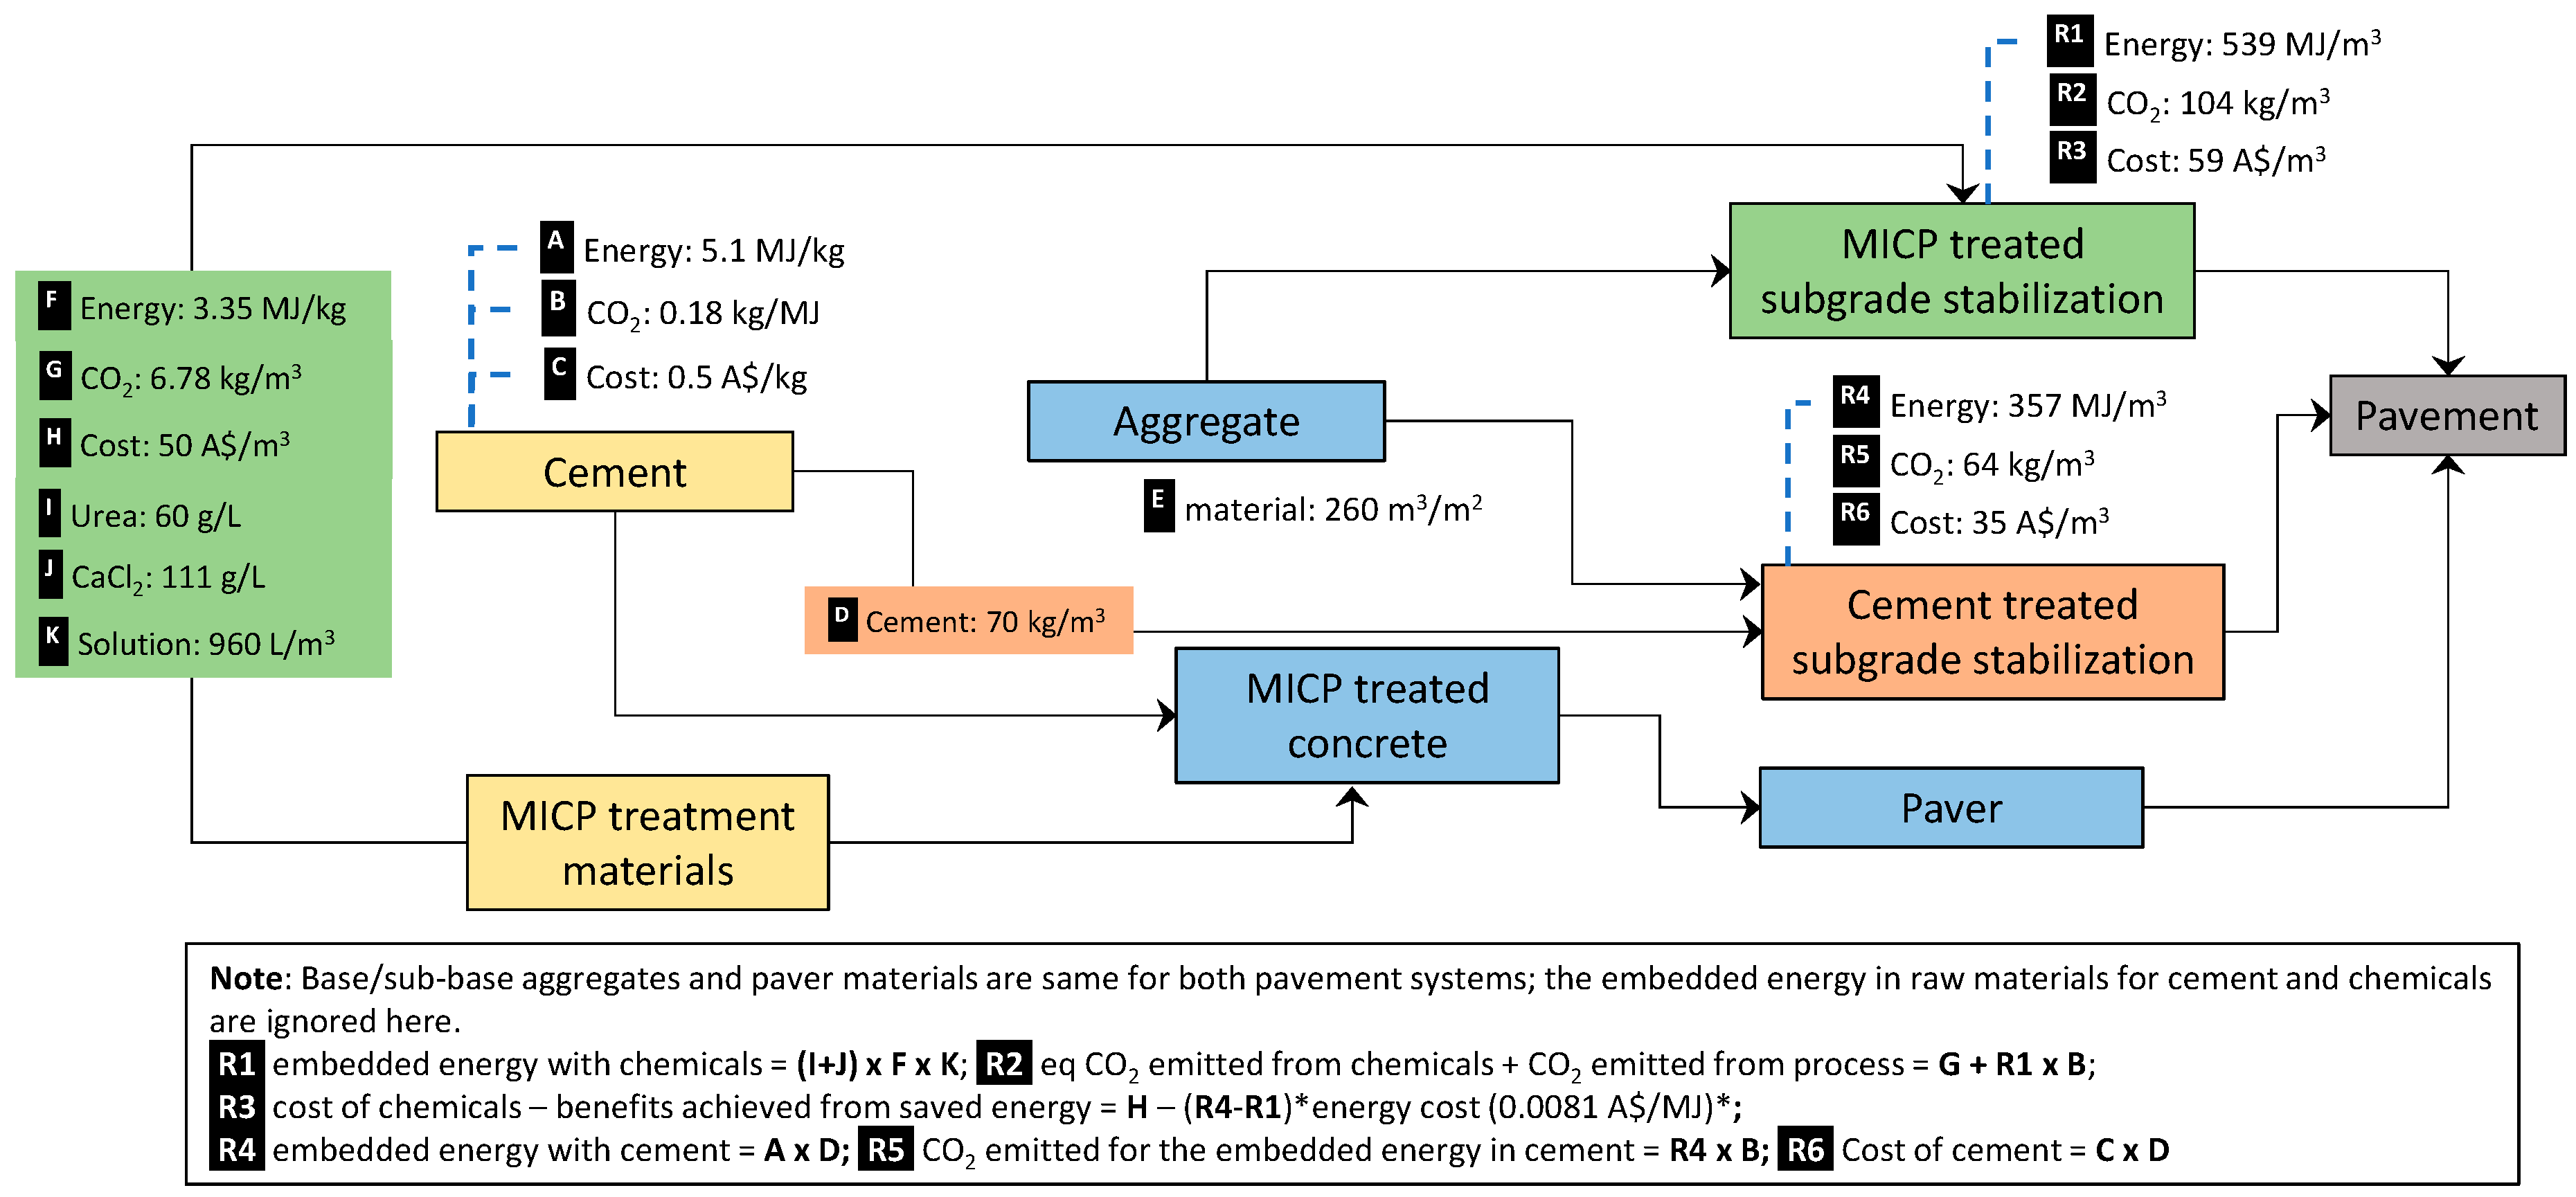
6. Sustainability Analysis

The cost of MICP treatment depends on the specific processes and ingredients used. Also, with MICP being a relatively new technology with very few reports of large-scale engineering implementation [41,58,164,165,166,167], the actual cost of treatment can be difficult to estimate. A wide range of costs has been reported in the literature. For example, Ivanov and Chu [26] estimated the material cost for MICP to be as low as $5/m3 of treated soil; while Esnault-Filet et al. [168] estimated the cost of materials, labour and equipment to be as high as $500/m3 of treated soil. In this section, a quantitative sustainability assessment has been conducted for a simplified hypothetical engineering construction scenario. The cost of treatment, together with its environmental benefits in terms of reducing the CO2 and energy footprints, has been estimated and compared with conventional construction methods and materials.
The engineering application chosen here is concrete block pavement (CBP). In general, CBP consists of a layer of rigid blocks laid on top of a sand or gravel bedding course underlain by granular or other materials depending on traffic conditions and the mechanical properties of the subgrade. CBPs are often treated as flexible pavement and are commonly used in road or industrial applications [169]. Common configurations of CBPs are presented in Figure 19. This particular application is chosen for two reasons. Firstly, CBP, similar to any other pavement structure, comprises several different material layers and there is a potential for using MICP treatment in more than one layer of a CBP structure. Secondly, the construction of roads/pavements consumes a large volume of materials and thus could magnify the costs or benefits in terms of CO2 and energy footprints.
Three alternative design scenarios have been considered for the cost and environmental benefit analysis. In the first case, only the concrete pavers are treated with MICP. In the second case, both the concrete paver and the sub-base layer are improved with MICP. The third case involves MICP treatment of paver and the subgrade soil. In all three scenarios, comparisons have been made with conventional construction methods. The CBP design for each case has been conducted with a traffic load of 10 × 106 expressed in terms of equivalent standard axle (ESA) repetition together with a subgrade soil elastic modulus of 35 MPa. Other related properties are discussed in the following sections. The calculations are presented for a 1 km long and 7 m wide road section.

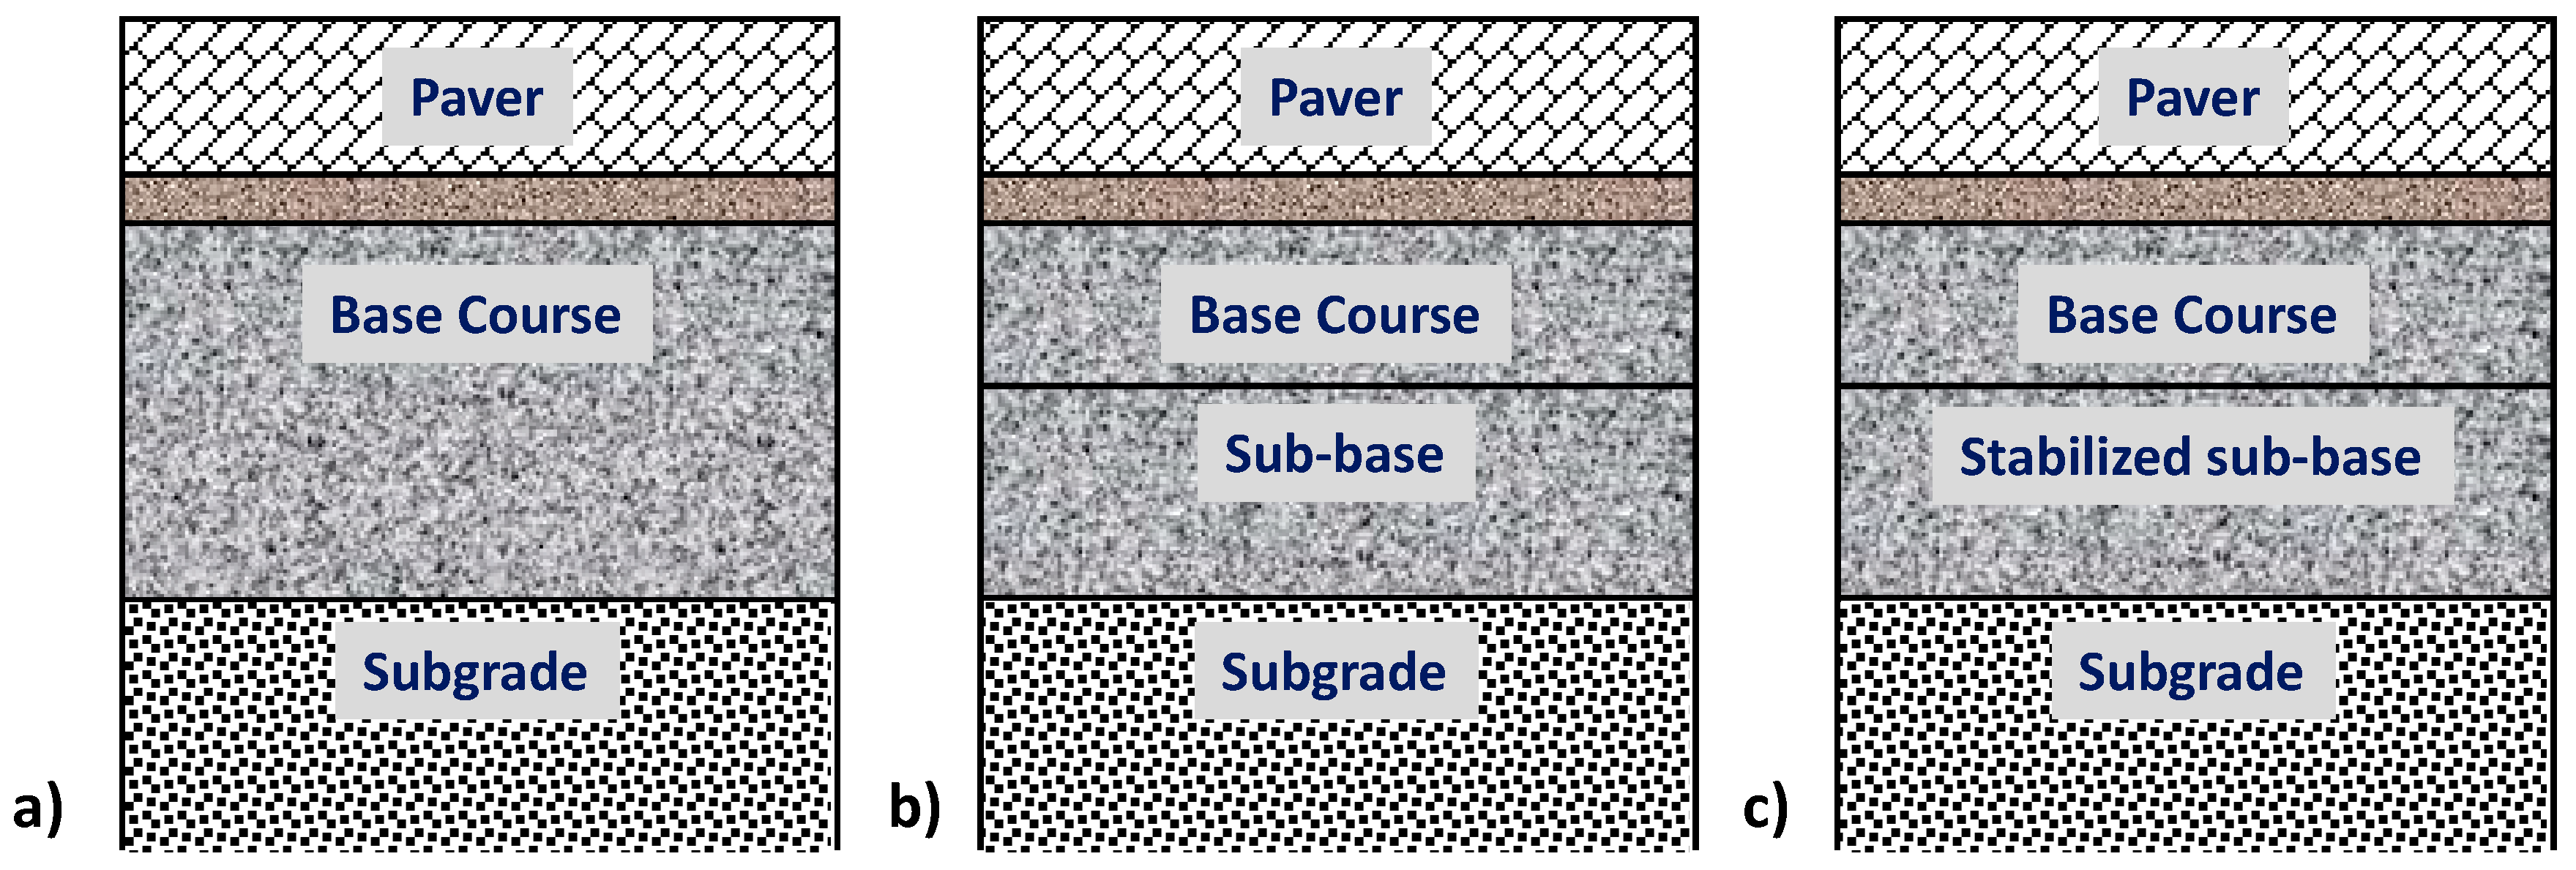
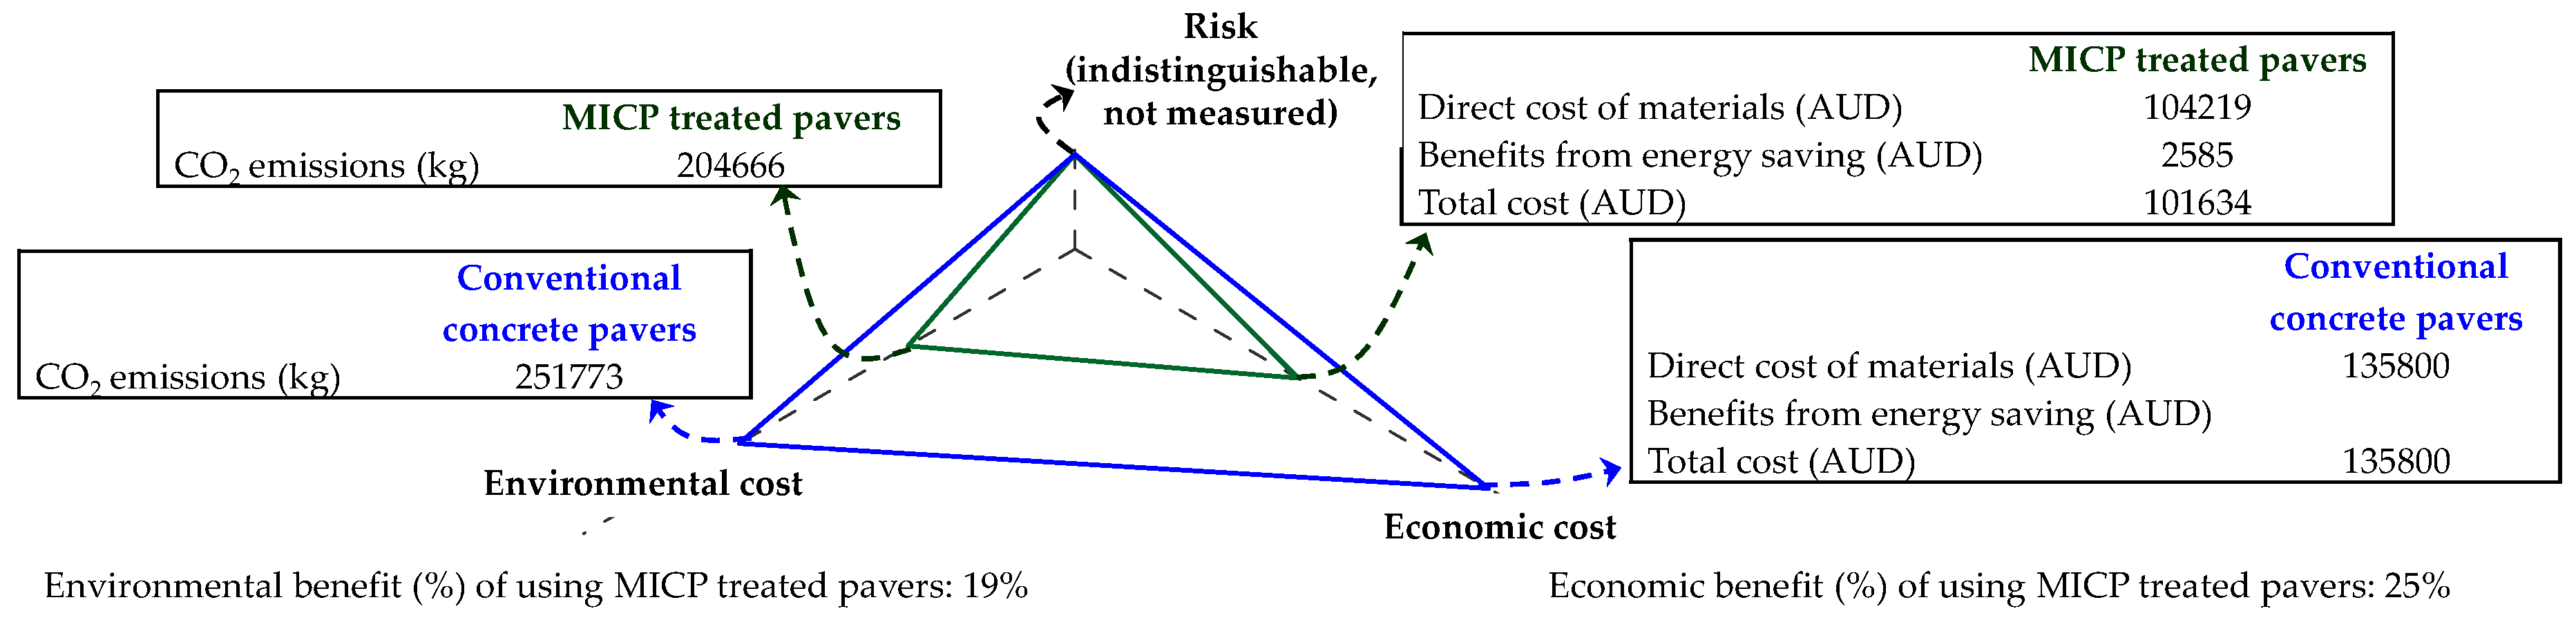
6.1. Scenario 1—Only Paver Blocks Treated with MICP

A layer configuration similar to Figure 19b has been chosen. The properties of the different materials used are listed in Table 6 and these are typical values used in current design/construction practice. With MICP being a new technology, its field implementation needs to be progressed in a phased manner, and Porter et al. [170] advised that partial replacement of cement in concrete or other stabilized material would be a logical first step. Multiple studies [157,171,172] have reported an increase of compressive strength in the range of 17 to 36% in cementitious materials as a result of microbial treatment. Following from Achal et al. [157], in this study it is assumed that MICP using the treatment solution presented in Table 7 inoculated with microbes will improve the compressive strength of the paver brick by 25% and thus allow 25% replacement of cement in paver concrete (approximated based on the relationship between the water-cement ratio and the compressive strength [173,174]).
The required compressive strength of the concrete to meet the elastic modulus requirements of the paver blocks in Table 6 can be estimated using correlations [180] and in this case, it is found to be 40 MPa. A concrete mix design calculation [174] indicates that to produce concrete of 40 MPa strength with a nominal aggregate size of 12.5 mm and a target slump of 50 mm (assumed based on current industry practice), approximately 485 kg/m3 of cement will be required. Thus, MICP treatment will allow replacement of approximately 121 kg of cement per m3 of concrete.
Table 7 shows the estimated quantity and cost (in Australian $) of chemicals to produce 1 L of treatment solution per the mix design and Achal et al. [157]. Approximately 600 L (200 L in mix design + 400 L for curing) of treatment solution will be required to treat 1 m3 of concrete, leading to a treatment cost of approximately $4.5/m3. It should be noted that the calculated cost is only approximate. Prices for industrial-grade chemicals have been used even though most reported work used laboratory grade chemicals. However, it is expected that with the progression of research, especially in the area of using recycled wastes in biocementation [179,181,182] and other developments, the cost will come down to that level. Also, to be noted here is that the labour costs have been assumed to be equal to the conventional method of the production of concrete (with or without MICP treatment).
The thickness of the different layers has been calculated using the traffic data and subgrade properties mentioned earlier with the aid of a computer program DesignPave [183], and these are shown in Table 6.
Figure 20 shows a comparison of the CO2 footprint and energy consumption for treated and untreated scenarios. The process life cycles of conventional and MICP-treated concrete pavers considering the materials and processes involved, the differences in energy consumption and CO2 emissions, and costs were estimated for the pavement system. As the same aggregate would be applied in both the cases, its contribution towards cost and energy is neutral. The energy consumption for manufacturing and transport is also assumed to be the same. For simplicity, rather than considering the total embedded energy, including the embedded energy in raw materials, for the cement and chemicals, only the energy intensity of the manufacturing processes was considered in this research.
As can be seen from Figure 21, MICP treatment of pavers yields potentially significant economic and environmental benefits over using conventional concrete pavers. The total economic and environmental costs (in the form of CO2 and assuming the estimated unit prices are representative) for a 1 km road using both categories of bricks are provided in Figure 20, which shows MICP treatment contributes to a 19% environmental benefit (about 47,000 kg of CO2) and 25% economic benefit. As both processes ensure the quality of the system, the risk factor is neutralized.

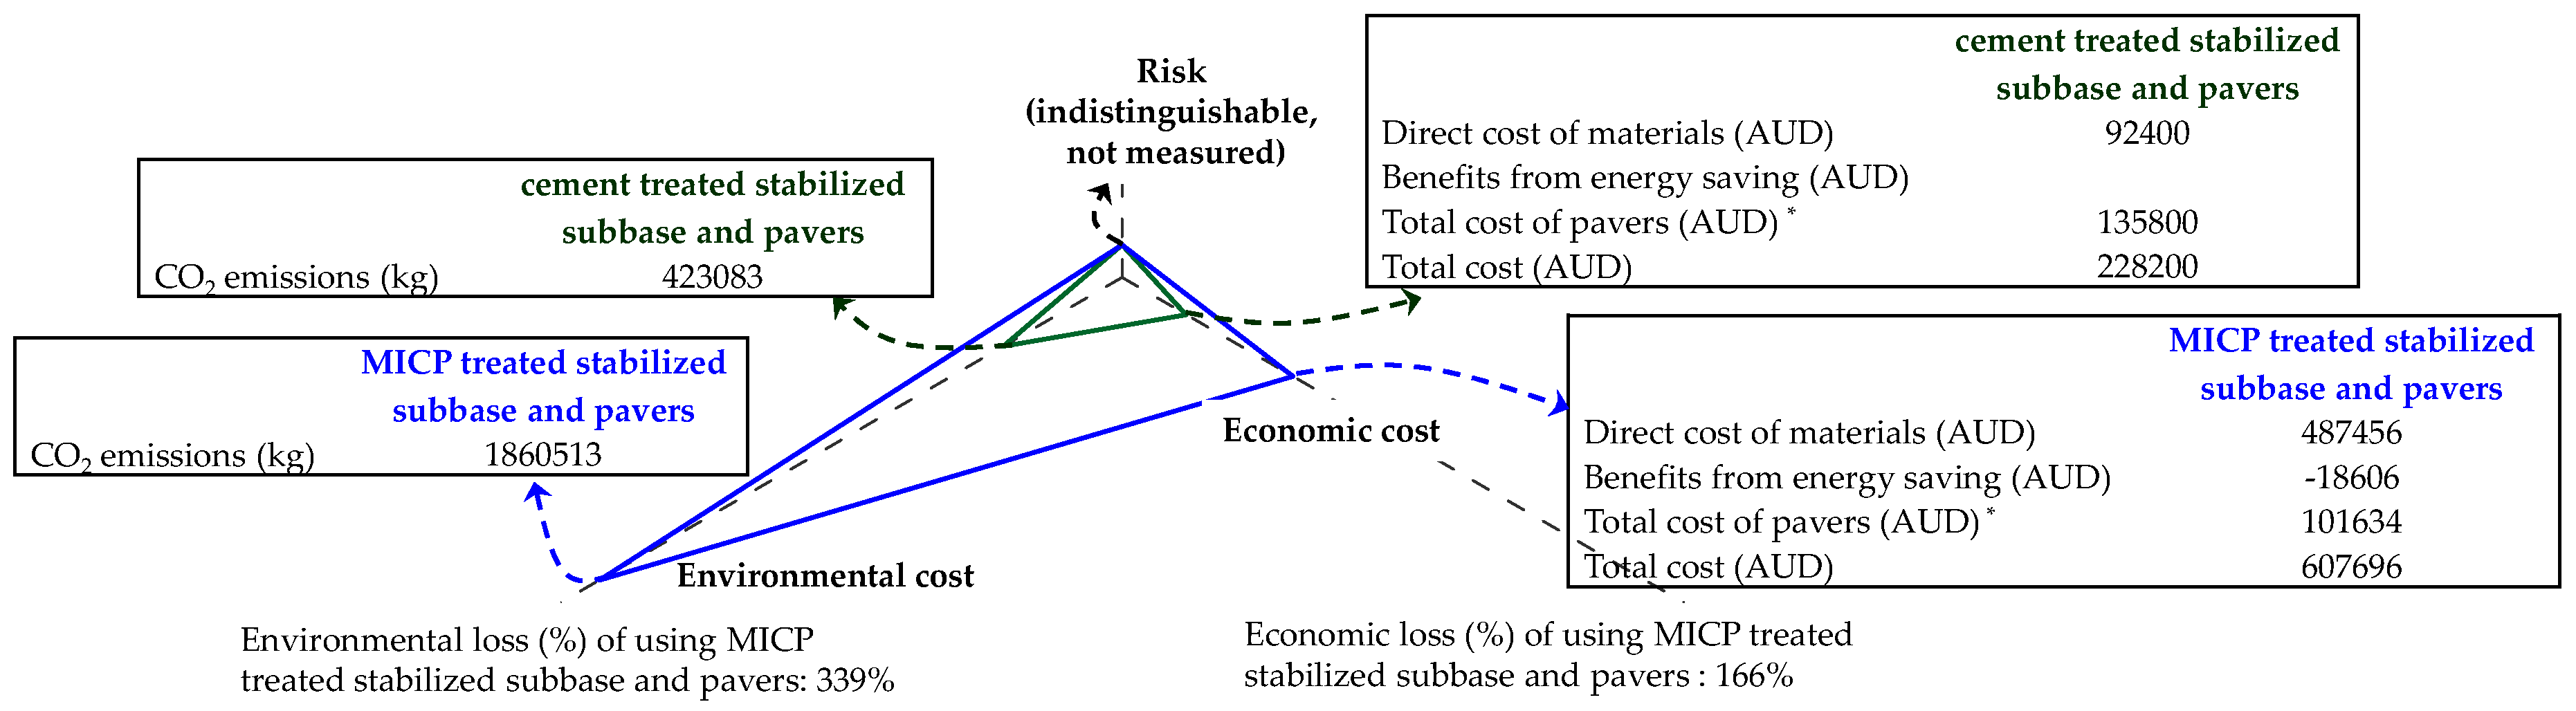
6.2. Scenario 2—Pavers and Sub-Base Layer Treated with MICP

Porter et al. [170] indicated that the treatment of granular pavement materials with MICP can lead to a significant improvement of the unconfined compressive strength (close to 1 MPa). The composition of the growth media and treatment solution per Porter et al. [170] is presented in Table 8. The MICP treatment included the use of 11% by mass of bacterial solution (one-off) followed by 20 treatments of cementation solution (1 pore volume = approximately 250 L each time) leading to an approximate treatment cost of $215 per m3 of stabilized materials. The costs (in Australian $) in Table 8 indicate that replacing yeast extract with a cheaper alternative such as recycled waste [179] and recycling a portion of the treatment solution together with the partial replacement with waste materials [179,182] can significantly reduce the cost of treatment, possibly to a market competitive level.
In this scenario, it is assumed that the sub-base layer has been treated with MICP and now acts as a stabilized sub-base with a UCS of 0.9 MPa. The elastic modulus of this layer can be estimated to be 3500 MPa [174]. For the same traffic and subgrade conditions as for Scenario 1, Table 9 presents the calculated design thicknesses of the stabilized sub-base layer. Assuming that the same level of performance (elastic modulus of 3500 MPa) can be achieved by treating the sub-base layer with 3–4% (by mass) cement [191], a cost and environmental benefit analysis is conducted as described below. The thickness of the stabilized sub-base layer has been calculated using the computer program DesignPave [183] by considering the traffic data and subgrade properties mentioned earlier.
Figure 22 shows a comparison of the CO2 footprint and energy consumption for MICP-treated and conventionally (cement) treated scenarios for a stabilized sub-base. The aggregate quantity and characteristics for both cases as well as other components of the pavement are considered the same and thus are neutralized.
As can be seen from Figure 23, MICP treatment for stabilizing sub-bases requires significant economic and environmental costs compared to the conventional concrete cement stabilization. The difference occurs mainly due to the high volume of chemical solution requirements (about 5000 L/m3 of concrete) and the associated embedded energy (about 994 MJ additional energy required in MICP treatment per m3 of concrete compared to the treatment with cement). The total economic and environmental costs (in the form of CO2) for a 1 km road using both categories of stabilization are provided in Figure 23, which shows that MICP treatment leads to a 3.4 times environmental impact and about 1.6 times the cost in materials compared to conventional cement treatment.

6.3. Scenario 3—Pavers and Subgrade Treated with MICP

Van Paassen et al. [41] treated a material volume of approximately 100 m3 and demonstrated the applicability of MICP to treat large volumes of soil. The quantities of various chemicals used in their study are presented in Table 10. In total, 5 m3 of nutrient broth was inoculated with bacteria and after incubating, this broth was injected into the soil followed by 5 m3 of 0.05M CaCl2 solution. This was followed by an injection of approximately 96 m3 of reagent solution in 10 batches (9.6 m3/batch). In their experiment, large variability in the treated strength of the soil was observed with a maximum achieved UCS value of 12.4 MPa. A volume of 0.05 m3 of nutrient broth along with 0.05 m3 of 0.05M CaCl2 solution and 0.96 m3 of reagent solutions would be required to treat 1 m3 of subgrade soil. The cost of this treatment would be approximately $60/m3 as estimated in Table 10. Similar to the case stated in Scenario 2, it is possible to significantly reduce the cost of the chemical constituents to a level that can be competitive in the market.
With the UCS values in the reported range, it is possible to use a subgrade elastic modulus of 150 MPa [191]. For the same traffic condition but improved subgrade condition, the thickness of the sub-base layer can be estimated. The results are presented in Table 11.
For this scenario, it is assumed that cement treatment of the top 500 mm of the soil layer can achieve the same level of performance. Usual cement treatments in such scenarios are undertaken with approximately 3–4% of cement (by mass). Assuming a typical unit weight of the soil of 17 kN/m3, approximately 70 kg of cement would be required to treat 1 m3 of subgrade.
The process life cycles of cement-treated and MICP-treated subgrade stabilization are assessed for a pavement system and the differences in energy consumption, CO2 emissions and costs are shown in Figure 24. Similar to the previous two scenarios, the aggregate quantity and characteristics for both cases are considered to be the same, and the costs for pavers also remain the same.
While the MICP treatment for sub-base stabilization is relatively costly, Figure 25 shows that MICP treatment for stabilizing subgrade yields relatively lower economic and environmental costs compared to conventional concrete cement stabilization. Again, the amount of chemicals inoculated into the system (about 1060 L of chemicals per m3 of concrete) contributes mainly to the cost. The calculation shows that MICP treatment leads to a 9% economic loss and about a 19% environmental loss (in the form of CO2) when MICP treatment is applied to both subgrade stabilization and the pavers (Figure 25). The total estimated economic and environmental costs for a 1 km road using both types of stabilization and pavers are also provided in Figure 25.

7. Conclusions

This paper has reviewed developments over the last 25 years in microbial-induced calcite precipitation (MICP), which has significant potential to become an economic and environmentally sustainable solution to engineering problems such as soil and concrete strengthening, liquefaction and remediation. The findings of detailed studies on the biogeochemical mechanisms of MICP, such as urea hydrolysis, denitrification and sulphate reduction, have been summarised. The engineering properties of MICP-treated soils have also been described in terms of both unconfined compressive strength and indirect tensile strength. Methods of modelling MICP-cemented soils have also been reviewed, including empirical correlations, constitutive modelling and modelling using the Discrete Element Method. Based on these findings, a sustainability analysis was undertaken using three hypothetical scenarios of application of MICP in pavement construction. The major conclusions from the study are summarised below.
  • Among different MICP processes, urea hydrolysis showed the maximum chemical conversion efficiency (up to 90%) and CaCO3 precipitation. Sporosarcina pasturii was found to be one of the most effective, efficient and widely used bacteria in urea hydrolysis.
  • Application of MICP treatment has so far been focused on different types of sand, and unconfined compressive strengths of up to 19.6 MPa have been reported. This strength increases with the CaCO3 content but has also been found to depend on the morphology of the CaCO3, the location of precipitation, soil particle size and its distribution.
  • The increases in the CaCO3 content observed in a wide range of soils have generally resulted in reductions in soil permeability.
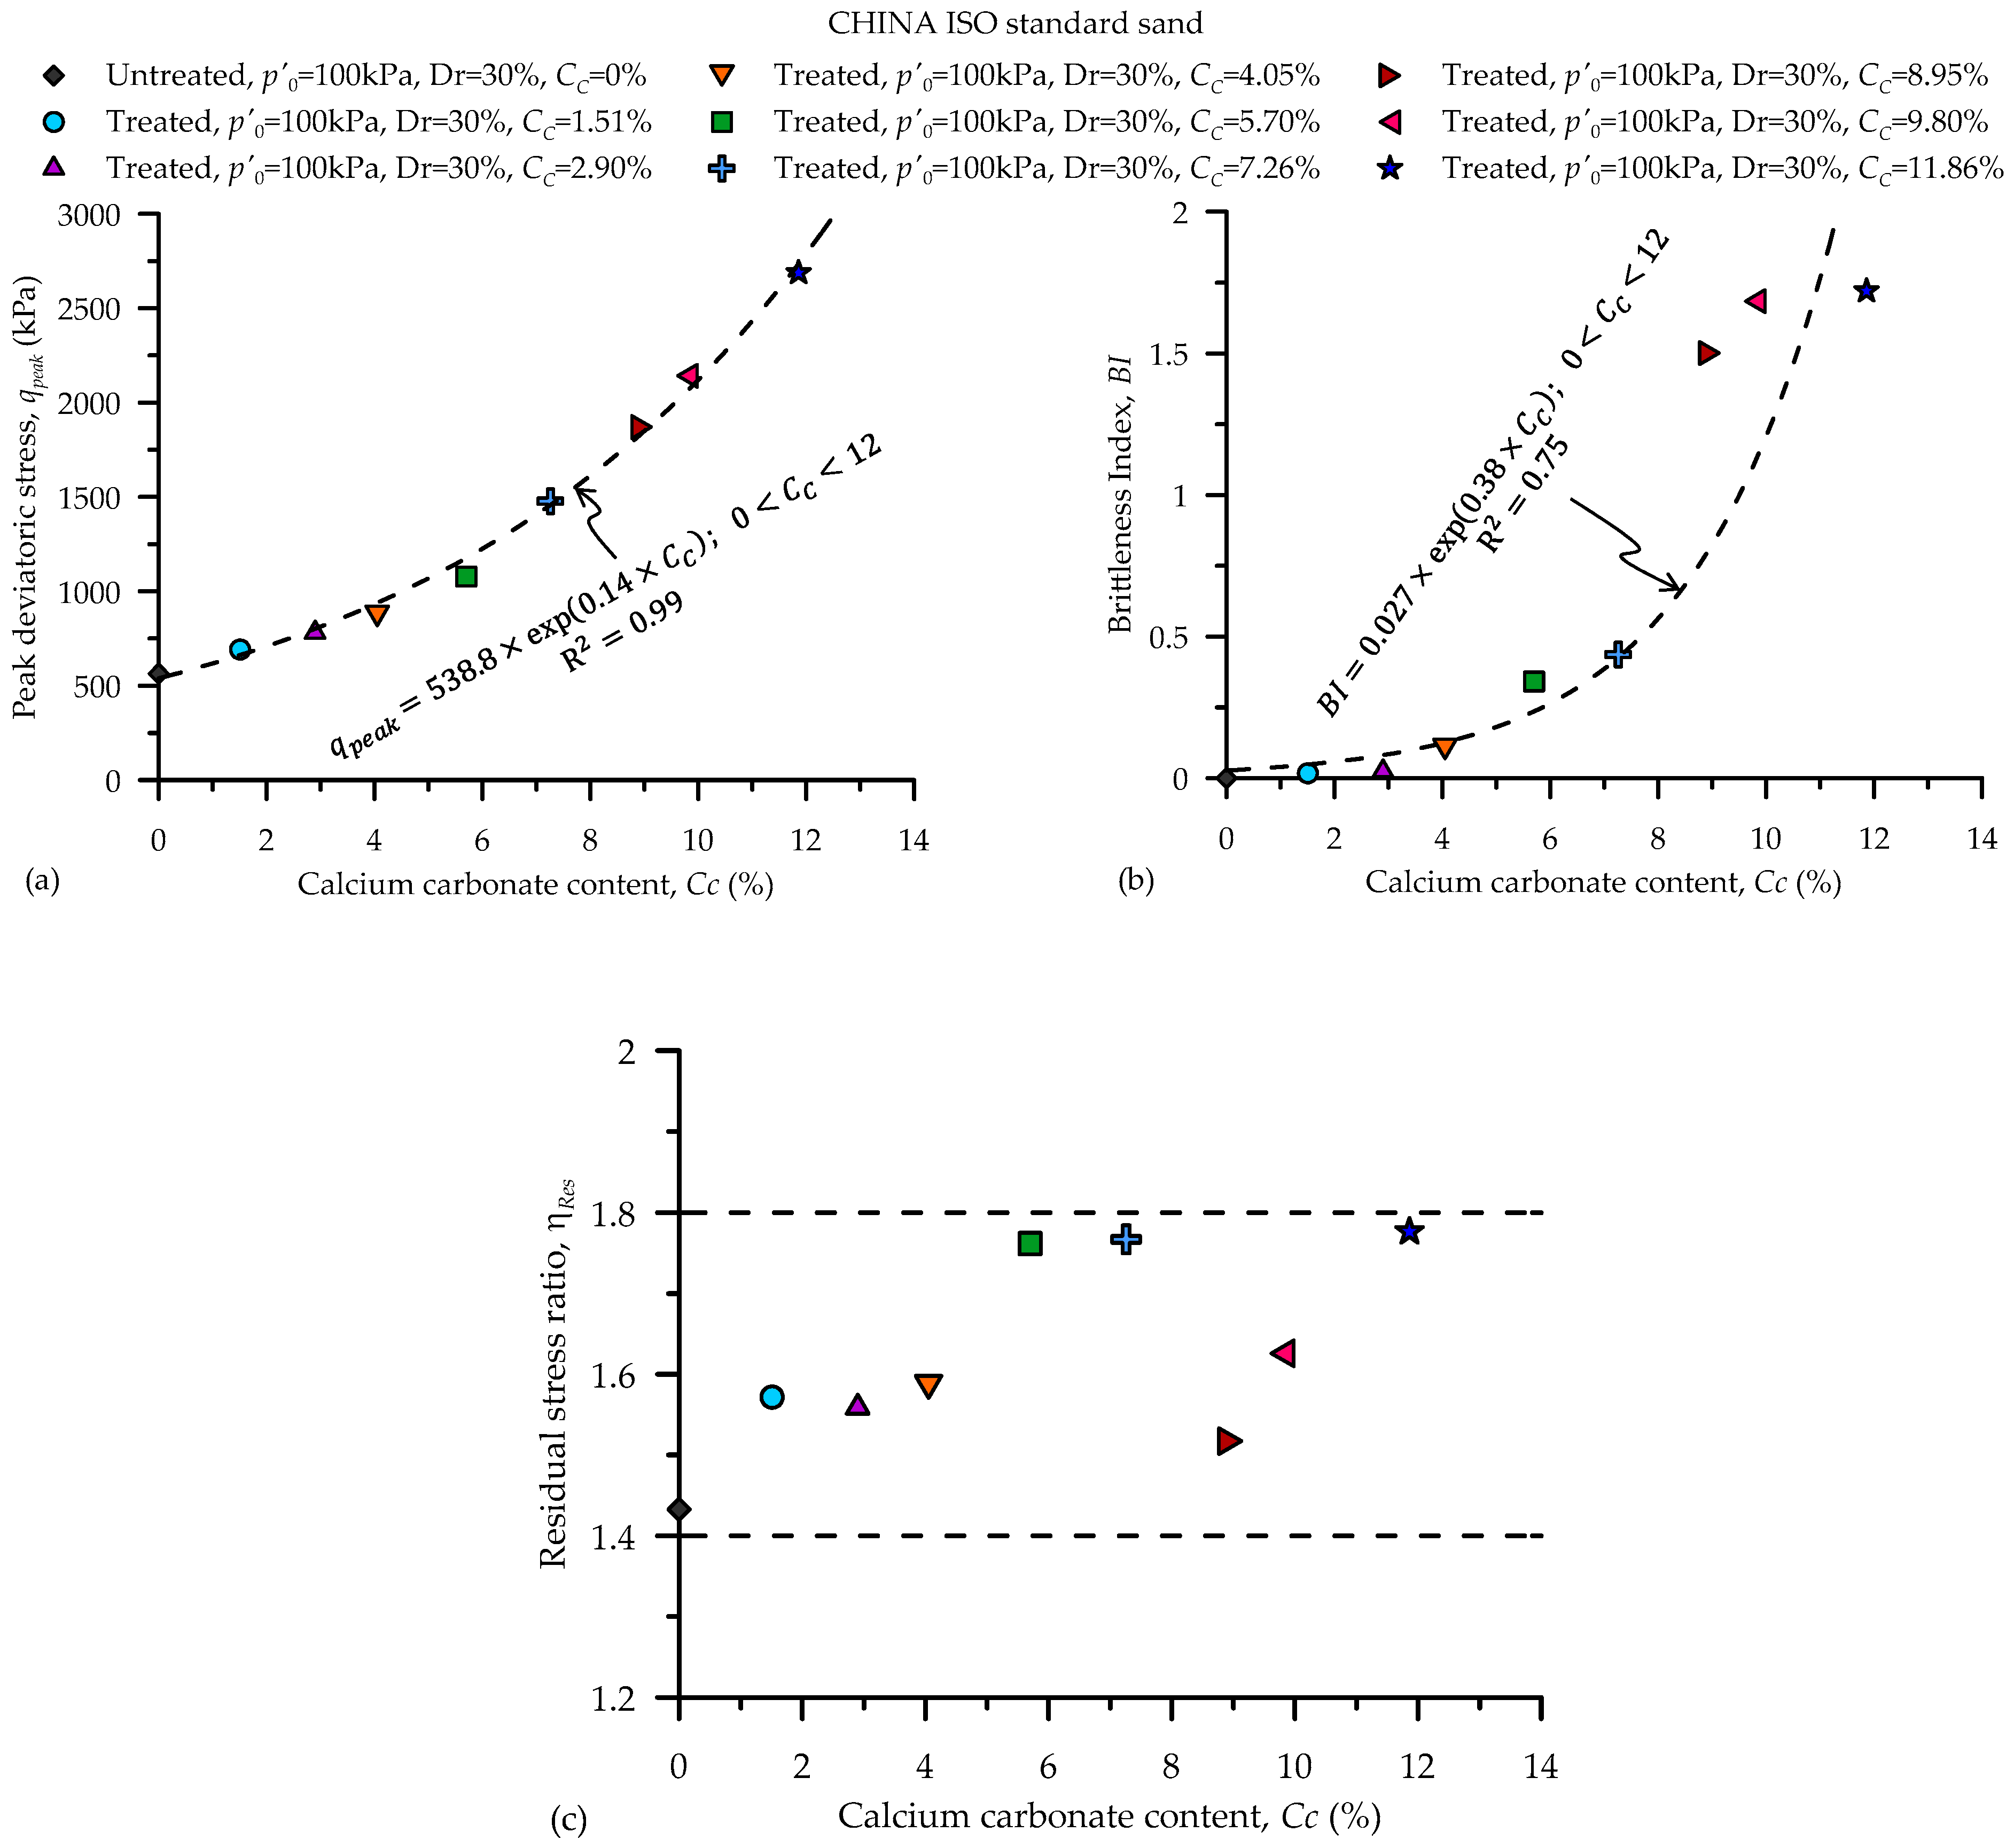
  • Evaluation of previous triaxial tests on MICP-treated soils revealed that the dilative tendency along with the peak strength of soil significantly increased with increasing CaCO3 content. At the same time, the brittleness of the soil samples also increased.
  • A range of models of various levels of complexity have been proposed in the literature to capture the strength gain in soils due to CaCO3 precipitation. Most of these models attempted to predict the unconfined compressive strength of soils as a function of the CaCO3 content. However, the strength gain is understood to be influenced by other factors such as the soil’s particle size distribution, location of precipitation and morphology of precipitates. This limits the applicability of most models to the soil for which it was developed and possibly the treatment type used. Only one study attempted to take soil properties into account, but with limited success.
  • Studies on constitutive modelling of the behaviour of MICP-treated soils have been limited to a handful of cases. A bounding surface plasticity model was shown to be able to capture some of the behavioural characteristics of cemented soils. Other studies incorporated the degradation of strength and stiffness with the degradation of CaCO3 bonds and captured many of the features of cemented soil behaviour. However, there is scope for improvement.
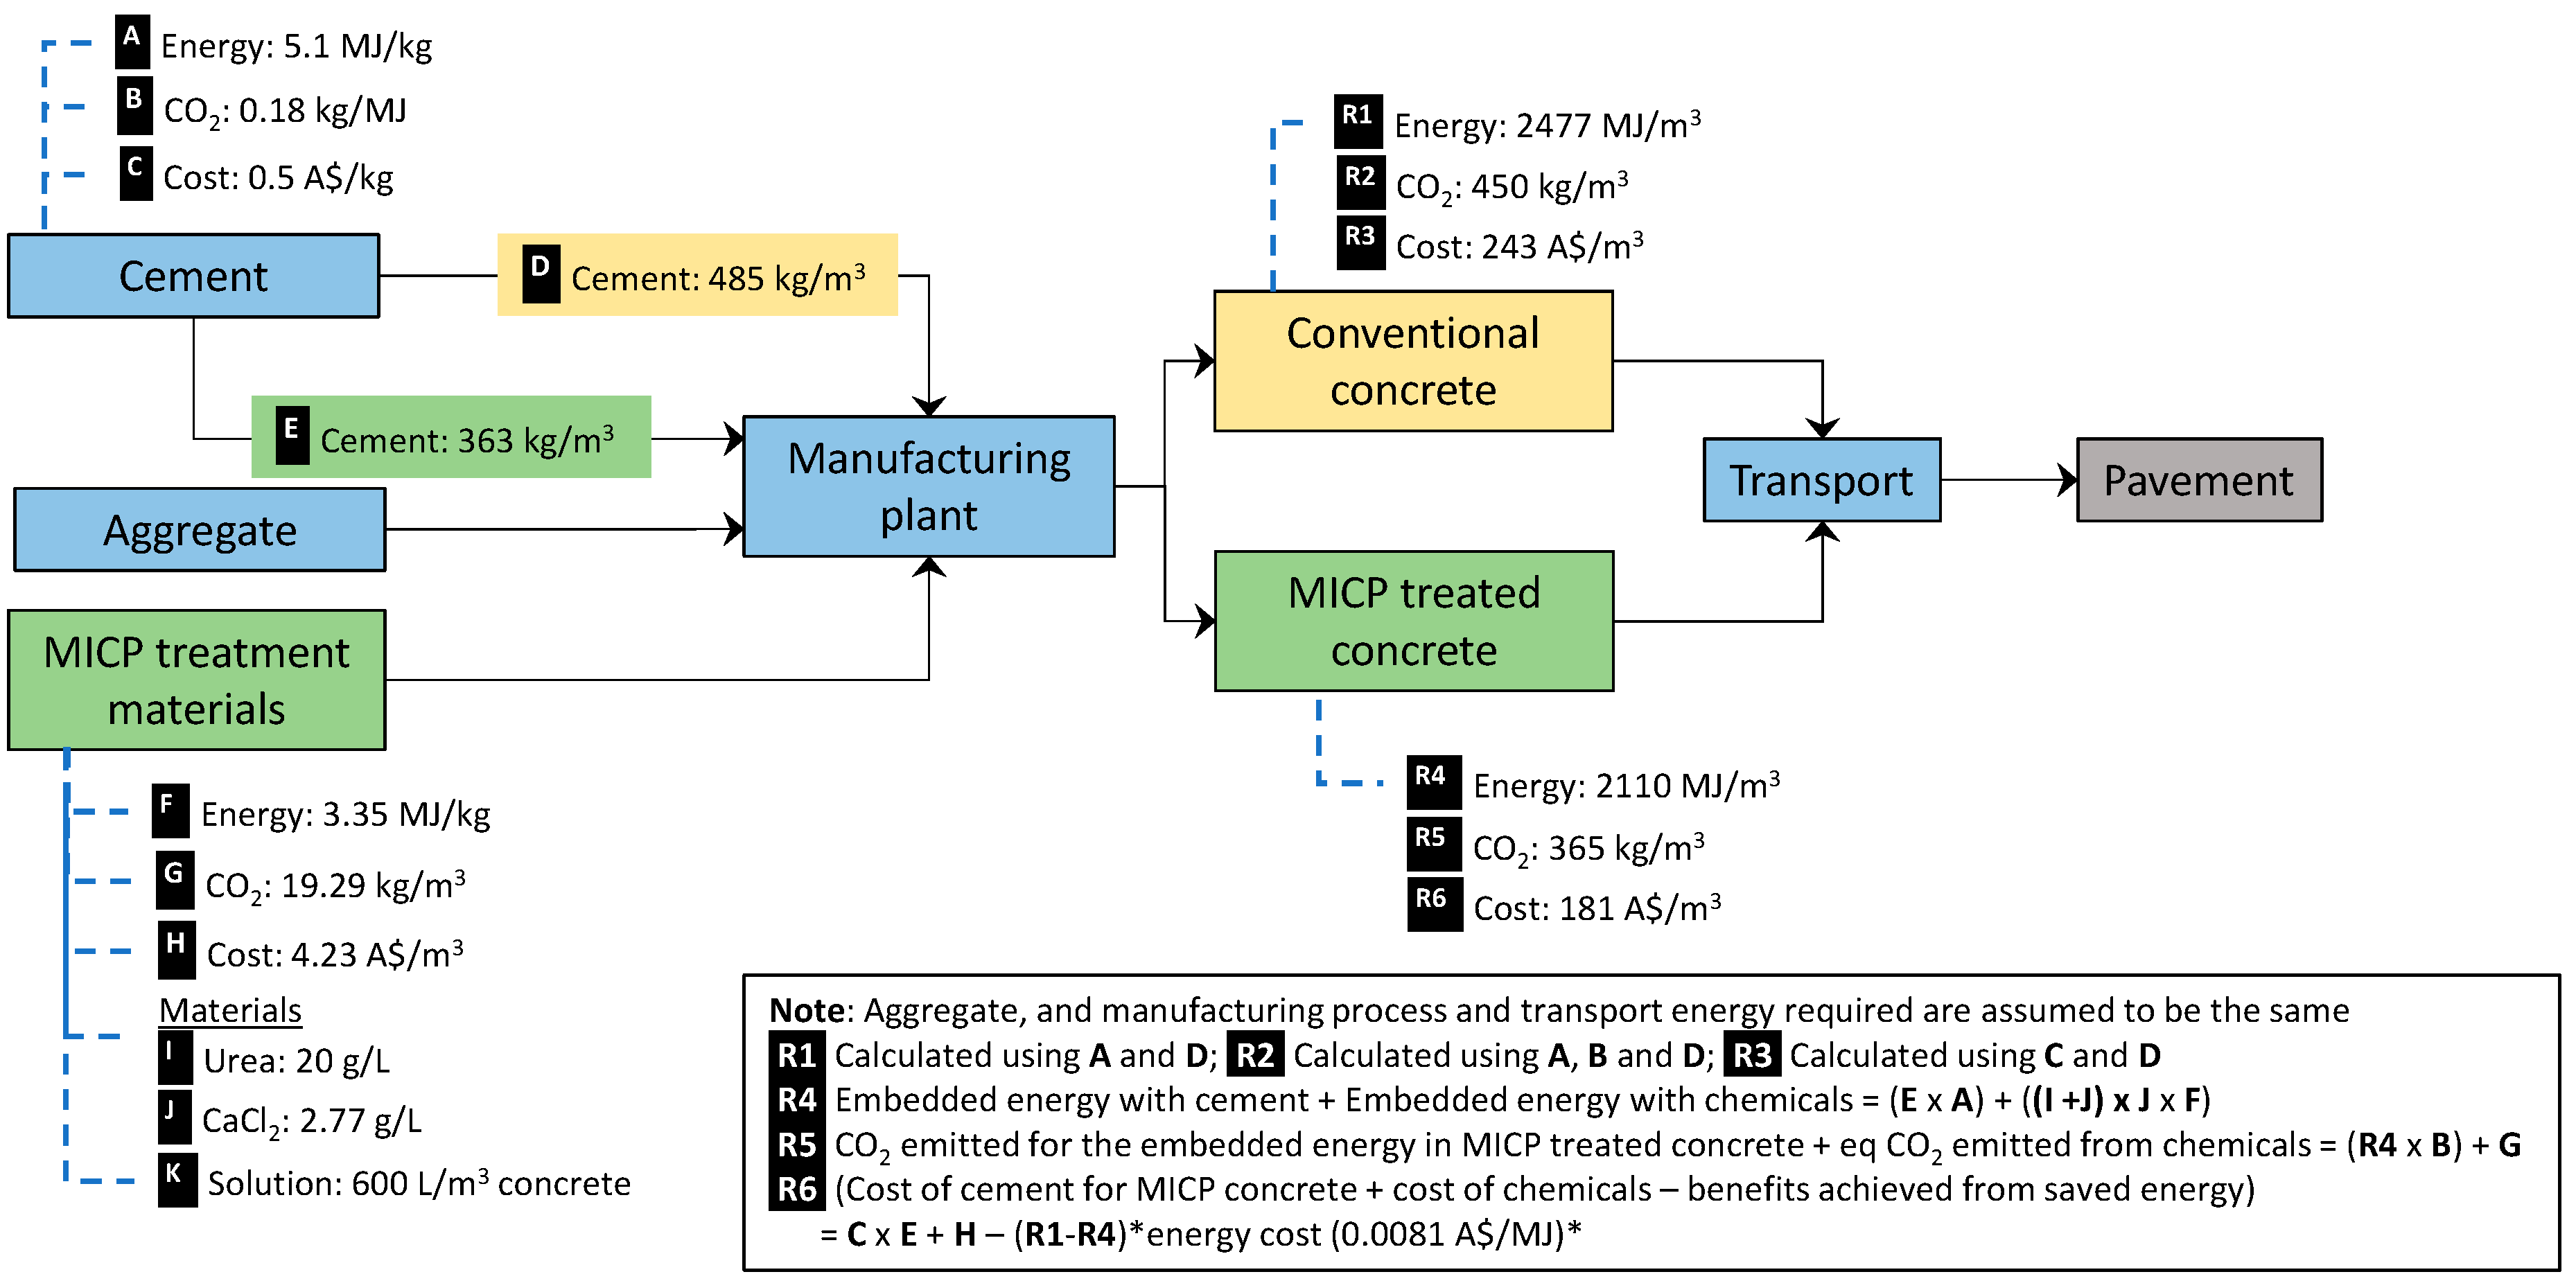
  • In the sustainability analysis, two of the three MICP treatment scenarios cost more and had a larger CO2 footprint and thus may not be economically viable or environmentally sustainable technology, at least at the current time. Alternative sources of nutrients might lower the cost and environmental footprint, and a number of alternative solutions are currently being explored. For example, Achal et al. [179] showed that a by-product from the milk industry “lactose mother liquor” can be used as an alternative source of nutrients. Fang et al. [182] showed the potential of using waste products from the tofu industry. With further research, this technology can potentially be cost-effective as well as environmentally friendly, particularly since it uses natural processes. The use of biological and other waste effluents in the process will further enhance the environmental benefits in terms of reducing CO2 and energy footprints.

Author Contributions

Conceptualization, M.M.R. and S.B.; formal analysis, M.R.K., I.A., R.N.H. and A.I.; methodology, M.M.R. and M.R.K.; resources, S.B., M.M.R., and M.R.K.; validation, M.M.R., R.N.H., I.A. and A.I.; writing—original draft, R.N.H., I.A., and M.R.K.; writing—review and editing, M.M.R., S.B., M.R.K. and A.I. All authors have read and agreed to the published version of the manuscript.

Funding

This research received no external funding.

Conflicts of Interest

The authors declare no conflict of interest.

Notations

D50soil particle size at 50% finer
Cuscoefficient of uniformity of soil particles
Ccscoefficient of curvature of soil particles
kpermeability
KBulk modulus
CCcalcium carbonate content
p 0 post-consolidation mean confining stress
p c effective pre-consolidation pressure
p b mechanical hardening parameter
C′effective cohesion
ϕfrictional angle
NLnumber of cycles to liquefaction
q deviatoric stress
q p e a k peak deviatoric stress
upore water pressure
Drrelative density
η R e s residual stress ratio
ddilatancy
BIbrittleness index
Vsshear wave velocity
nporosity
I c f cementing factor
Cmolarity of cementation solution
Castandard concentration of cementation solution
RCsample volume ratio
VCvolume of injected cementation solution
Vvolume of MICP-treated sample
evoid ratio
e0initial void ratio
ϑmineralogy of soil
ϕ p e a k peak frictional angle
ϕ cs friction angle in the critical state
P f mean effective stress at failure
P t constant representing the effect of cementation
P a t m atmospheric pressure
G m a x maximum shear modulus
G b constant depending on the soil type
P t o initial P t
γ shear strain
Zscale of degradation
rrate of degradation
Rsub-loading ratio
vPoisson’s ratio
λslope of the normal compression line in e–log(p)’ space
ε p plastic strain
ε v volumetric strain
ε q axial strain
Delastoplastic stiffness matrix
K ¯ n normal parallel bond stiffness
K ¯ s shear parallel bond stiffness
σ ¯ c normal parallel bond strength
τ ¯ c shear parallel bond strength
R ¯ parallel bond radius
F ¯ i total force in a parallel bond
F ¯ i n normal force in a parallel bond
F ¯ i s shear force in a parallel bond
r 1 ,   2 radius of two bonded particles
r 3 radius of cementing material
r b circular cross-section of the radius of the beam

References

  1. DeJong, T.J.; Soga, K.; Ian, K.; Burns, S.; Paassen, l.A.V.; Qabany, A.A.; Aydilek, A.; Bang, S.S.; Burbank, M.; Caslake, l.F.; et al. Biogeochemical processes and geotechnical applications: Progress, opportunities and challenges. Géotechnique 2013, 63, 287–301. [Google Scholar] [CrossRef] [Green Version]
  2. Hammes, F.; Van Hege, K.; Van De Wiele, T.; Vanderdeelen, J.; Siciliano, S.D.; Verstraete, W. Calcium removal from industrial wastewater by bio-catalytic CaCO3 precipitation. J. Chem. Technol. Biotechnol. 2003, 78, 670–677. [Google Scholar] [CrossRef]
  3. DeJong, J.; Fritzges, M.B.; Nusslein, K. Microbially Induced Cementation to Control Sand Response to Undrained Shear. J. Geotech. Geoenviron. Eng. 2006, 132, 1381–1392. [Google Scholar] [CrossRef]
  4. Whiffin, V.S.; Van Paassen, L.A.; Harkes, M.P. Microbial Carbonate Precipitation as a Soil Improvement Technique. Geomicrobiol. J. 2007, 24, 417–423. [Google Scholar] [CrossRef]
  5. Harkes, M.P.; Van Paassen, L.A.; Booster, J.L.; Whiffin, V.S.; Van Loosdrecht, M.C.M. Fixation and distribution of bacterial activity in sand to induce carbonate precipitation for ground reinforcement. Ecol. Eng. 2010, 36, 112–117. [Google Scholar] [CrossRef]
  6. Montoya, B.M.; Safavizadeh, S.; Gabr, M.A. Enhancement of Coal Ash Compressibility Parameters Using Microbial-Induced Carbonate Precipitation. J. Geotech. Geoenviron. Eng. 2019, 145, 04019018. [Google Scholar] [CrossRef]
  7. Yu, T.; Souli, H.; Péchaud, Y.; Fleureau, J.-M. Optimizing protocols for microbial induced calcite precipitation (MICP) for soil improvement–a review. Eur. J. Environ. Civ. Eng. 2020, 1–16. [Google Scholar] [CrossRef]
  8. Uba M, Z.; Anuar, K.K.; Sadiq, A.M. Bio-desaturation and bio-sealing techniques for mitigation of soil liquefaction: A review. In Proceedings of the 12th International Civil Engineering Post Graduate Conference, Johor, Malaysia, 27–28 August 2018. [Google Scholar]
  9. Muhammed, A.S.; Kassim, K.A.; Zango, M.U. Review on biological process of soil improvement in the mitigation of liquefaction in sandy soil. In Proceedings of the 12th International Civil Engineering Post Graduate Conference, Johor, Malaysia, 27–28 August 2018. [Google Scholar]
  10. Wang, Z.; Zhang, N.; Cai, G.; Jin, Y.; Ding, N.; Shen, D. Review of ground improvement using microbial induced carbonate precipitation (MICP). Mar. Georesources Geotechnol. 2017, 45, 1–12. [Google Scholar] [CrossRef]
  11. Mujah, D.; Shahin, M.; Cheng, L. State-of-the-art review of bio-cementation by microbially induced calcite precipitation (MICP) for soil stabilization. Geomicrobiol. J. 2016, 34, 524–537. [Google Scholar] [CrossRef]
  12. Achal, V.; Mukherjee, A. A review of microbial precipitation for sustainable construction. Constr. Build. Mater. 2015, 93, 1224–1235. [Google Scholar] [CrossRef]
  13. Osinubi, K.J.; O Eberemu, A.; Ijimdiya, T.S.; Yakubu, S.E.; Gadzama, E.W.; Sani, J.E.; Yohanna, P. Review of the use of microorganisms in geotechnical engineering applications. SN Appl. Sci. 2020, 2, 1–19. [Google Scholar] [CrossRef] [Green Version]
  14. Khodadadi, T.H.; Kavazanjian, E.; van Paassen, L.; DeJong, J. Bio-Grout Materials: A Review. In Grouting 2017: Grouting, Drilling, and Verification; Byle, M.J., Johnsen, L.F., Bruce, D.A., ElMohtar, C.S., Gazzarrini, P., Richards, T.D., Eds.; ICE: Washington, DC, USA, 2017; pp. 1–12. [Google Scholar]
  15. Ashraf, M.S.; Azahar, S.B.; Yusof, N.Z. Soil Improvement Using MICP and Biopolymers: A Review. IOP Conf. Ser. Mater. Sci. Eng. 2017, 226, 012058. [Google Scholar] [CrossRef] [Green Version]
  16. Umar, M.; Kassim, K.A.; Chiet, K.T.P.; Tiong, K.; Chiet, P. Biological process of soil improvement in civil engineering: A review. J. Rock Mech. Geotech. Eng. 2016, 8, 767–774. [Google Scholar] [CrossRef] [Green Version]
  17. Yargicoglu, E.N.; Reddy, K. Review of biological diagnostic tools and their applications in geoenvironmental engineering. Rev. Environ. Sci. Bio/Technol. 2014, 14, 161–194. [Google Scholar] [CrossRef]
  18. Phillips, A.J.; Gerlach, R.; Lauchnor, E.; Mitchell, A.C.; Cunningham, A.B.; Spangler, L.H. Engineered applications of ureolytic biomineralization: A review. Biofouling 2013, 29, 715–733. [Google Scholar] [CrossRef] [Green Version]
  19. Choi, S.-G.; Chang, I.; Lee, M.; Lee, J.-H.; Han, J.-T.; Kwon, T.-H. Review on geotechnical engineering properties of sands treated by microbially induced calcium carbonate precipitation (MICP) and biopolymers. Constr. Build. Mater. 2020, 246, 118415. [Google Scholar] [CrossRef]
  20. Sadjadi, M.; Nikooee, E.; Habibagahi, G. Biological treatment of swelling soils using microbial calcite precipitation. In Unsaturated Soils: Research & Applications; Khalili, N., Russell, A.R., Khoshghalb, A., Eds.; CRC Press: Boca Raton, FL, USA, 2014; Volume 1 and 2, pp. 917–922. [Google Scholar]
  21. Gollapudi, U.; Knutson, C.; Bang, S.; Islam, M. A new method for controlling leaching through permeable channels. Chemosphere 1995, 30, 695–705. [Google Scholar] [CrossRef]
  22. Stocks-Fischer, S.; Galinat, J.K.; Bang, S.S. Microbiological precipitation of CaCO3. Soil Boil. Biochem. 1999, 31, 1563–1571. [Google Scholar] [CrossRef]
  23. Fujita, Y.; Ferris, F.; Lawson, R.; Colwell, F.; Smith, R. Subscribed Content Calcium Carbonate Precipitation by Ureolytic Subsurface Bacteria. Geomicrobiol. J. 2000, 17, 305–318. [Google Scholar] [CrossRef]
  24. Ismail, M.; Joer, H.; Randolph, M.; Meritt, A. Cementation of porous materials using calcite. Geotechnique 2002, 52, 313–324. [Google Scholar] [CrossRef]
  25. Whiffin, V.S. Microbial CaCO3 Precipitation for the Production of Biocement; Murdoch University: Murdoch, WA, Australia, 2004. [Google Scholar]
  26. Ivanov, V.; Chu, J. Applications of microorganisms to geotechnical engineering for bioclogging and biocementation of soil in situ. Rev. Environ. Sci. Bio/Technol. 2008, 7, 139–153. [Google Scholar] [CrossRef]
  27. Chou, C.-W.; Seagren, E.A.; Aydilek, A.H.; Lai, M. Biocalcification of Sand through Ureolysis. J. Geotech. Geoenviron. Eng. 2011, 137, 1179–1189. [Google Scholar] [CrossRef] [Green Version]
  28. Montoya, B.M.; DeJong, J.T. Stress-Strain Behavior of Sands Cemented by Microbially Induced Calcite Precipitation. J. Geotech. Geoenviron. Eng. 2015, 141, 04015019. [Google Scholar] [CrossRef]
  29. Martinez, B.C.; DeJong, J.; Ginn, T.R.; Montoya, B.M.; Barkouki, T.H.; Hunt, C.E.; Tanyu, B.F.; Major, D.W. Experimental Optimization of Microbial-Induced Carbonate Precipitation for Soil Improvement. J. Geotech. Geoenviron. Eng. 2013, 139, 587–598. [Google Scholar] [CrossRef]
  30. Riveros, G.A.; Sadrekarimi, A. Liquefaction resistance of Fraser River sand improved by a microbially-induced cementation. Soil Dyn. Earthq. Eng. 2020, 131, 106034. [Google Scholar] [CrossRef]
  31. Abo-El-Enein, S.; Ali, A.; Talkhan, F.N.; Abdel-Gawwad, H. Utilization of microbial induced calcite precipitation for sand consolidation and mortar crack remediation. HBRC J. 2012, 8, 185–192. [Google Scholar] [CrossRef] [Green Version]
  32. Liu, B.; Zhu, C.; Tang, C.-S.; Xie, Y.-H.; Yin, L.-Y.; Cheng, Q.; Shi, B. Bio-remediation of desiccation cracking in clayey soils through microbially induced calcite precipitation (MICP). Eng. Geol. 2020, 264, 105389. [Google Scholar] [CrossRef]
  33. Zhang, J.; Zhao, C.; Zhou, A.; Yang, C.; Zhao, L.; Li, Z. Aragonite formation induced by open cultures of microbial consortia to heal cracks in concrete: Insights into healing mechanisms and crystal polymorphs. Constr. Build. Mater. 2019, 224, 815–822. [Google Scholar] [CrossRef]
  34. Xu, J.; Wang, X.; Wang, B. Biochemical process of ureolysis-based microbial CaCO3 precipitation and its application in self-healing concrete. Appl. Microbiol. Biotechnol. 2018, 102, 3121–3132. [Google Scholar] [CrossRef]
  35. Salifu, E.; MacLachlan, E.; Iyer, K.R.; Knapp, C.W.; Tarantino, M. Application of microbially induced calcite precipitation in erosion mitigation and stabilisation of sandy soil foreshore slopes: A preliminary investigation. Eng. Geol. 2016, 201, 96–105. [Google Scholar] [CrossRef] [Green Version]
  36. Chen, F.; Deng, C.; Song, W.; Zhang, D.; Al-Misned, F.A.; Mortuza, M.G.; Gadd, G.M.; Pan, X. Biostabilization of Desert Sands Using Bacterially Induced Calcite Precipitation. Geomicrobiol. J. 2016, 33, 243–249. [Google Scholar] [CrossRef]
  37. Chu, J.; Ivanov, V.; Stabnikov, V.; Li, B. Microbial method for construction of an aquaculture pond in sand. Géotechnique 2013, 63, 871–875. [Google Scholar] [CrossRef]
  38. Qabany, A.; Soga, K. Effect of chemical treatment used in MICP on engineering properties of cemented soils. Géotechnique 2013, 63, 331–339. [Google Scholar] [CrossRef]
  39. Al Qabany, A.; Soga, K.; Santamarina, C. Factors Affecting Efficiency of Microbially Induced Calcite Precipitation. J. Geotech. Geoenviron. Eng. 2012, 138, 992–1001. [Google Scholar] [CrossRef]
  40. Xiao, Y.; Stuedlein, A.W.; Ran, J.; Evans, T.M.; Cheng, L.; Liu, H.; Van Paassen, L.A.; Chu, J. Effect of Particle Shape on Strength and Stiffness of Biocemented Glass Beads. J. Geotech. Geoenviron. Eng. 2019, 145, 06019016. [Google Scholar] [CrossRef]
  41. Van Paassen, L.A.; Ghose, R.; Van Der Linden, T.J.M.; Van Der Star, W.; Van Loosdrecht, M.C.M. Quantifying Biomediated Ground Improvement by Ureolysis: Large-Scale Biogrout Experiment. J. Geotech. Geoenviron. Eng. 2010, 136, 1721–1728. [Google Scholar] [CrossRef]
  42. DeJong, J.; Mortensen, B.M.; Martinez, B.C.; Nelson, D.C. Bio-mediated soil improvement. Ecol. Eng. 2010, 36, 197–210. [Google Scholar] [CrossRef]
  43. Cheng, L.; Cord-Ruwisch, R. In situ soil cementation with ureolytic bacteria by surface percolation. Ecol. Eng. 2012, 42, 64–72. [Google Scholar] [CrossRef] [Green Version]
  44. Gomez, M.; Anderson, C.; DeJong, J.; Nelson, D.; Lau, X. Stimulating In Situ Soil Bacteria for Bio-Cementation of Sands. Geo-Congress 2014 Techn. Pap. 2014, 1674–1682. [Google Scholar]
  45. Wu, S.; Li, B.; Chu, J. Large-scale model tests of biogrouting for sand and rock. In Institution of Civil Engineers-Ground Improvement; Thomas Telford Ltd.: London, UK, 2019; pp. 1–10. [Google Scholar]
  46. Gai, X.; Sánchez, M. An elastoplastic mechanical constitutive model for microbially mediated cemented soils. Acta Geotech. 2018, 14, 709–726. [Google Scholar] [CrossRef]
  47. Evans, T.; Khoubani, A.; Montoya, B. Simulating mechanical response in bio-cemented sands. Comput. Methods Recent Adv. Geomech. 2014, 1569–1574. [Google Scholar] [CrossRef]
  48. Khoubani, A.; Evans, T.; Montoya, B. Particulate simulations of triaxial Tests on bio-cemented sand using a new cementation model. Geo-Chicago 2016, 84–93. [Google Scholar]
  49. Khoubani, A.; Nafisi, A.; Evans, T.; Montoya, B. The effect of grain size and shape on mechanical behavior of MICP treated sand ii: Numerical study. In Bio-Mediated and Bio-Inspired Geotechnics; Springer: Berlin/Heidelberg, Germany, 2018. [Google Scholar]
  50. Feng, K.; Montoya, B.M.; Evans, T. Discrete element method simulations of bio-cemented sands. Comput. Geotech. 2017, 85, 139–150. [Google Scholar] [CrossRef] [Green Version]
  51. Web of Science Database. Clarivate Analytics. 2020. Available online: https://apps-webofknowledge-com.access.library.unisa.edu.au/OS_GeneralSearch_input.do?product=WOS&search_mode=GeneralSearch&SID=E4AeYRwPBUJqRDDBPd2&preferencesSaved= (accessed on 13 June 2020).
  52. Van Paassen, L.A.; Daza, C.M.; Staal, M.; Sorokin, D.Y.; Van Der Zon, W.; Van Loosdrecht, M.C.M. Potential soil reinforcement by biological denitrification. Ecol. Eng. 2010, 36, 168–175. [Google Scholar] [CrossRef]
  53. Hamdan, N.; Kavazanjian, E.; Rittmann, B.E.; Karatas, I. Carbonate Mineral Precipitation for Soil Improvement Through Microbial Denitrification. Geomicrobiol. J. 2016, 34, 139–146. [Google Scholar] [CrossRef] [Green Version]
  54. Oliveira, P.J.V.; Da Costa, M.S.; Costa, J.N.P.; Nobre, M.F. Comparison of the Ability of Two Bacteria to Improve the Behavior of Sandy Soil. J. Mater. Civ. Eng. 2015, 27, 06014025. [Google Scholar] [CrossRef]
  55. Zhang, J.L.; Wu, R.S.; Li, Y.M.; Zhong, J.Y.; Deng, X.; Liu, B.; Han, N.X.; Xing, F. Screening of bacteria for self-healing of concrete cracks and optimization of the microbial calcium precipitation process. Appl. Microbiol. Biotechnol. 2016, 100, 6661–6670. [Google Scholar] [CrossRef]
  56. Liu, P.; Shao, G.-H.; Huang, R.-P. Study of the interactions between S. pasteurii and indigenous bacteria and the effect of these interactions on the MICP. Arab. J. Geosci. 2019, 12, 724. [Google Scholar] [CrossRef]
  57. Nayanthara, P.G.N.; Dassanayake, A.B.N.; Nakashima, K.; Kawasaki, S. Microbial Induced Carbonate Precipitation Using a Native Inland Bacterium for Beach Sand Stabilization in Nearshore Areas. Appl. Sci. 2019, 9, 3201. [Google Scholar] [CrossRef] [Green Version]
  58. Gomez, M.G.; Anderson, C.M.; Graddy, C.M.R.; DeJong, J.; Nelson, D.C.; Ginn, T.R. Large-Scale Comparison of Bioaugmentation and Biostimulation Approaches for Biocementation of Sands. J. Geotech. Geoenviron. Eng. 2017, 143, 04016124. [Google Scholar] [CrossRef]
  59. Chen, X.; Achal, V. Biostimulation of carbonate precipitation process in soil for copper immobilization. J. Hazard. Mater. 2019, 368, 705–713. [Google Scholar] [CrossRef] [PubMed]
  60. Fang, C.; Achal, V. Biostimulation of calcite precipitation process by bacterial community in improving cement stabilized rammed earth as sustainable material. Appl. Microbiol. Biotechnol. 2019, 103, 7719–7727. [Google Scholar] [CrossRef] [PubMed]
  61. DeJong, J.; Martinez, B.; Mortensen, B.; Nelson, D.; Waller, J.; Weil, M.; Ginn, T.; Weathers, T.; Barkouki, T.; Fujita, Y. Upscaling of Bio-Mediated Soil Improvement; Idaho National Laboratory (INL): Idaho Falls, ID, USA, 2009.
  62. Burbank, M.; Weaver, T.; Green, T.L.; Williams, B.C.; Crawford, R. Precipitation of Calcite by Indigenous Microorganisms to Strengthen Liquefiable Soils. Geomicrobiol. J. 2011, 28, 301–312. [Google Scholar] [CrossRef]
  63. Bang, S.C.; Min, S.H.; Bang, S.S. KGS awards lectures: Application of microbiologically induced soil stabilization technique for dust suppression. Int. J. Geo-Eng. 2011, 3, 27–37. [Google Scholar]
  64. Van Paassen, L.A. Biogrout, Ground Improvement by Microbial Induced Carbonate Precipitation; Delft University of Technology: Delft, The Netherlands, 2009. [Google Scholar]
  65. Al-Thawadi, S.M. Ureolytic bacteria and calcium carbonate formation as a mechanism of strength enhancement of sand. J. Adv. Sci. Eng. Res. 2011, 1, 98–114. [Google Scholar]
  66. Dhami, N.K.; Reddy, M.S.; Mukherjee, A. Biomineralization of calcium carbonates and their engineered applications: A review. Front. Microbiol. 2013, 4, 314. [Google Scholar] [CrossRef] [Green Version]
  67. Van Paassen, L.; Daza, C.; Stall, M.; Sorokin, D.; van Loosdrecht, M. In situ soil reinforcement by microbial denitrification. In Proceedings of the 1st International Conference on Bio-Geo-Civil Engineering, Delft, The Netherlands, 23–25 June 2008. [Google Scholar]
  68. Kavazanjian, E., Jr.; Karatas, I. Microbiological Improvement of the Physical Properties of Soil. In Proceedings of the 6th International Conference on Case Histories in Geotechnical Engineering, Arlington, VA, USA, 11–16 August 2008. [Google Scholar]
  69. He, J.; Chu, J.; Ivanov, V. Mitigation of liquefaction of saturated sand using biogas. Géotechnique 2013, 63, 267–275. [Google Scholar] [CrossRef]
  70. He, J.; Chu, J. Undrained Responses of Microbially Desaturated Sand under Monotonic Loading. J. Geotech. Geoenviron. Eng. 2014, 140, 04014003. [Google Scholar] [CrossRef]
  71. Achal, V.; Pan, X. Characterization of Urease and Carbonic Anhydrase Producing Bacteria and Their Role in Calcite Precipitation. Curr. Microbiol. 2010, 62, 894–902. [Google Scholar] [CrossRef]
  72. Reddy, M.S.; Mukherjee, A. Application of calcifying bacteria for remediation of stones and cultural heritages. Front. Microbiol. 2014, 5, 304. [Google Scholar] [CrossRef]
  73. Wang, K.; Chu, J.; Wu, S.; He, J. Stress–strain behaviour of bio-desaturated sand under undrained monotonic and cyclic loading. Géotechnique 2020, 1–13. [Google Scholar] [CrossRef]
  74. O’Donnell, S.T.; Rittmann, B.E.; Kavazanjian, E. Factors Controlling Microbially Induced Desaturation and Precipitation (MIDP) via Denitrification during Continuous Flow. Geomicrobiol. J. 2019, 36, 543–558. [Google Scholar] [CrossRef]
  75. Pham, V.P.; Nakano, A.; Van Der Star, W.R.L.; Heimovaara, T.J.; Van Paassen, L.A. Applying MICP by denitrification in soils: A process analysis. Environ. Geotech. 2018, 5, 79–93. [Google Scholar] [CrossRef] [Green Version]
  76. Zhao, Q.; Li, L.; Li, C.; Li, M.; Amini, F.; Zhang, H. Factors Affecting Improvement of Engineering Properties of MICP-Treated Soil Catalyzed by Bacteria and Urease. J. Mater. Civ. Eng. 2014, 26, 04014094. [Google Scholar] [CrossRef]
  77. Al-Thawadi, S. High Strength In-Situ Biocementation of Soil by Calcite Precipitating Locally Isolated Ureolytic Bacteria; Murdoch University: Murdoch, WA, Australia, 2008. [Google Scholar]
  78. Cheng, L.; Cord-Ruwisch, R.; Shahin, M.A. Cementation of sand soil by microbially induced calcite precipitation at various degrees of saturation. Can. Geotech. J. 2013, 50, 81–90. [Google Scholar] [CrossRef]
  79. Liu, L.; Liu, H.; Stuedlein, A.W.; Evans, T.M.; Xiao, Y. Strength, stiffness, and microstructure characteristics of biocemented calcareous sand. Can. Geotech. J. 2019, 56, 1502–1513. [Google Scholar] [CrossRef]
  80. Ahenkorah, I.M.M.; Rahman, M.R.; Karim, P.R. Teasdale, A comparison of mechanical responses for Microbial and Enzyme-induced cemented Sand. Géotechn. Lett. 2020, in press. [Google Scholar]
  81. Cheng, L.; Cord-Ruwisch, R. Upscaling Effects of Soil Improvement by Microbially Induced Calcite Precipitation by Surface Percolation. Geomicrobiol. J. 2014, 31, 396–406. [Google Scholar] [CrossRef] [Green Version]
  82. Nafisi, A.; Mocelin, D.; Montoya, B.M.; Underwood, S. Tensile strength of microbially induced carbonate precipitation treated sands. Canad. Geotech. J. 2019. [Google Scholar]
  83. Choi, S.-G.; Hoang, T.; Alleman, E.J.; Chu, J. Splitting Tensile Strength of Fiber-Reinforced and Biocemented Sand. J. Mater. Civ. Eng. 2019, 31, 06019007. [Google Scholar] [CrossRef]
  84. Choi, S.-G.; Wang, K.; Chu, J. Properties of biocemented, fiber reinforced sand. Constr. Build. Mater. 2016, 120, 623–629. [Google Scholar] [CrossRef]
  85. Xiao, Y.; He, X.; Evans, T.M.; Stuedlein, A.W.; Liu, H. Unconfined Compressive and Splitting Tensile Strength of Basalt Fiber–Reinforced Biocemented Sand. J. Geotech. Geoenviron. Eng. 2019, 145, 04019048. [Google Scholar] [CrossRef]
  86. Hang, L.; Gao, Y.F.; He, J.; Chu, J. Mechanical behaviour of biocemented sand under triaxial consolidated undrained or constant shear drained conditions. Geomech. Eng. 2019, 17, 497–505. [Google Scholar]
  87. Ozdogan, A. A Study on the Triaxial Shear Behavior and Microstructure of Biologically Treated Sand Specimens. Ph.D. Thesis, University of Delaware, Newark, DE, USA, 2010. [Google Scholar]
  88. Nafisi, A.; Montoya, B.M.; Evans, T.M. Shear Strength Envelopes of Biocemented Sands with Varying Particle Size and Cementation Level. J. Geotech. Geoenviron. Eng. 2020, 146, 04020002. [Google Scholar] [CrossRef]
  89. Arboleda-Monsalve, L.G.; Zapata-Medina, D.G.; Galeano-Parra, D.I. Compressibility of biocemented loose sands under constant rate of strain, loading, and pseudo K-triaxial conditions. Soils Found. 2019, 59, 1440–1455. [Google Scholar] [CrossRef]
  90. Feng, K.; Montoya, B.M. Drained Shear Strength of MICP Sand at Varying Cementation Levels. IFCEE 2015 2015, 2242–2251. [Google Scholar] [CrossRef]
  91. Nafisi, A.; Safavizadeh, S.; Montoya, B.M. Influence of Microbe and Enzyme-Induced Treatments on Cemented Sand Shear Response. J. Geotech. Geoenviron. Eng. 2019, 145, 06019008. [Google Scholar] [CrossRef]
  92. Xiao, P.; Liu, H.; Stuedlein, A.W.; Evans, T.M.; Xiao, Y. Effect of relative density and biocementation on cyclic response of calcareous sand. Can. Geotech. J. 2019, 56, 1849–1862. [Google Scholar] [CrossRef] [Green Version]
  93. Terzis, D.; Laloui, L. Cell-free soil bio-cementation with strength, dilatancy and fabric characterization. Acta Geotech. 2019, 14, 639–656. [Google Scholar] [CrossRef]
  94. Mahawish, A.; Bouazza, A.; Gates, W.P. Unconfined Compressive Strength and Visualization of the Microstructure of Coarse Sand Subjected to Different Biocementation Levels. J. Geotech. Geoenviron. Eng. 2019, 145, 04019033. [Google Scholar] [CrossRef]
  95. Hoang, T.; Alleman, J.; Cetin, B.; Choi, S.-G. Engineering Properties of Biocementation Coarse- and Fine-Grained Sand Catalyzed By Bacterial Cells and Bacterial Enzyme. J. Mater. Civ. Eng. 2020, 32, 04020030. [Google Scholar] [CrossRef]
  96. Danjo, T.; Kawasaki, S. Microbially Induced Sand Cementation Method Using Pararhodobacter sp. Strain SO1, Inspired by Beachrock Formation Mechanism. Mater. Trans. 2016, 57, 428–437. [Google Scholar] [CrossRef] [Green Version]
  97. Choi, S.G.; Chu, J.; Brown, R.C.; Wang, K.; Wen, Z. Sustainable Biocement Production via Microbially Induced Calcium Carbonate Precipitation: Use of Limestone and Acetic Acid Derived from Pyrolysis of Lignocellulosic Biomass. ACS Sustain. Chem. Eng. 2017, 5, 5183–5190. [Google Scholar] [CrossRef]
  98. Amarakoon, G.G.N.N.; Kawasaki, S. Factors affecting sand solidi cation using micp with pararhodobacter sp. Mater. Transac. 2017, 1–10. [Google Scholar]
  99. Cheng, L.; Shahin, M.A.; Mujah, D. Influence of Key Environmental Conditions on Microbially Induced Cementation for Soil Stabilization. J. Geotech. Geoenviron. Eng. 2017, 143, 04016083. [Google Scholar] [CrossRef] [Green Version]
  100. Cheng, L.; Shahin, M.; Cord-Ruwisch, R. Bio-cementation of sandy soil using microbially induced carbonate precipitation for marine environments. Géotechnique 2014, 64, 1010–1013. [Google Scholar] [CrossRef]
  101. Choi, S.-G.; Wu, S.; Chu, J. Biocementation for Sand Using an Eggshell as Calcium Source. J. Geotech. Geoenviron. Eng. 2016, 142, 06016010. [Google Scholar] [CrossRef]
  102. Gomez, M.G.; DeJong, J.; Byle, M.J.; Johnsen, L.F.; Bruce, D.A.; El Mohtar, C.S.; Gazzarrini, P.; Richards, T.D. Engineering Properties of Bio-Cementation Improved Sandy Soils. Grouting 2017 2017, 23–33. [Google Scholar]
  103. Li, M.; Wen, K.; Li, Y.; Zhu, L. Impact of oxygen availability on microbially induced calcite precipitation (MICP) treatment. Geomicrobiol. J. 2017, 34, 15–22. [Google Scholar] [CrossRef]
  104. Soon, N.W.; Lee, M.L.; Khun, T.C.; Ling, H.S. Factors Affecting Improvement in Engineering Properties of Residual Soil through Microbial-Induced Calcite Precipitation. J. Geotech. Geoenviron. Eng. 2014, 140, 04014006. [Google Scholar] [CrossRef]
  105. Cui, M.-J.; Zheng, J.-J.; Zhang, R.-J.; Lai, H.-J.; Zhang, J. Influence of cementation level on the strength behaviour of bio-cemented sand. Acta Geotech. 2017, 12, 971–986. [Google Scholar] [CrossRef]
  106. Ismail, M.A.; Joer, H.A.; Sim, W.H.; Randolph, M.F. Effect of Cement Type on Shear Behavior of Cemented Calcareous Soil. J. Geotech. Geoenviron. Eng. 2002, 128, 520–529. [Google Scholar] [CrossRef]
  107. Lin, H.; Suleiman, M.T.; Brown, D.G.; Kavazanjian, E., Jr. Mechanical behavior of sands treated by microbially induced carbonate precipitation. J. Geotech. Geoenviron. Eng. 2015, 142, 04015066. [Google Scholar] [CrossRef]
  108. Terzis, D.; Bernier-Latmani, R.; Laloui, L. Fabric characteristics and mechanical response of bio-improved sand to various treatment conditions. Géotechnique Letters 2016, 6, 50–57. [Google Scholar] [CrossRef] [Green Version]
  109. Feng, K.; Montoya, B.M. Influence of Confinement and Cementation Level on the Behavior of Microbial-Induced Calcite Precipitated Sands under Monotonic Drained Loading. J. Geotech. Geoenviron. Eng. 2016, 142, 04015057. [Google Scholar] [CrossRef]
  110. Consoli, N.C.; Prietto, P.D.M.; Ulbrich, L.A. Influence of Fiber and Cement Addition on Behavior of Sandy Soil. J. Geotech. Geoenviron. Eng. 1998, 124, 1211–1214. [Google Scholar] [CrossRef]
  111. Rabbi, A.; Rahman, M.; Cameron, D.A. The relation between the state indices and the characteristic features of undrained behaviour of silty sand. Soils Found. 2019, 59, 801–813. [Google Scholar] [CrossRef]
  112. Rahman, M.M.; Lo, S.R. Undrained behaviour of sand-fines mixtures and their state parameters. J. Geotechn. Geoenvironment. Eng. 2014, 140, 04014036. [Google Scholar] [CrossRef]
  113. Rabbi, A.T.M.Z.; Rahman, M.; Cameron, D.A. Undrained Behavior of Silty Sand and the Role of Isotropic and K0 Consolidation. J. Geotech. Geoenviron. Eng. 2018, 144, 04018014. [Google Scholar] [CrossRef]
  114. Nguyen, H.B.K.; Rahman, M.; Fourie, A. Characteristic Behavior of Drained and Undrained Triaxial Compression Tests: DEM Study. J. Geotech. Geoenviron. Eng. 2018, 144, 04018060. [Google Scholar] [CrossRef]
  115. Zhang, J.; Lo, S.-C.; Rahman, M.; Yan, J. Characterizing Monotonic Behavior of Pond Ash within Critical State Approach. J. Geotech. Geoenviron. Eng. 2018, 144, 04017100. [Google Scholar] [CrossRef]
  116. Nguyen, H.B.K.; Rahman, M.M.; Fourie, A.B. Effect of particle shape on constitutive relation: DEM study. J. Geotech. Geoenviron. Eng. 2020, 146, 04020058. [Google Scholar] [CrossRef]
  117. Rahman, M.; Lo, S.-C.; Dafalias, Y. Modelling the static liquefaction of sand with low-plasticity fines. Géotechnique 2014, 64, 881–894. [Google Scholar] [CrossRef]
  118. Li, X.S.; Dafalias, Y.F. Dilatancy for cohesionless soils. Géotechnique 2000, 50, 449–460. [Google Scholar] [CrossRef]
  119. Been, K.; Jefferies, M. Stress–dilatancy in very loose sand. Can. Geotech. J. 2004, 41, 972–989. [Google Scholar] [CrossRef]
  120. Harkes, M.; Booster, J.; van Paassen, L.; van Loosdrecht, M.C.; Whiffin, V. Microbial induced carbonate precipitation as ground improvement method–bacterial fixation and empirical correlation CaCO3 vs strength. In Proceedings of the 1st International Conference on Bio-Geo-Civil Engineering, Delft, The Netherlands, 23–25 June 2008. [Google Scholar]
  121. Al Qabany, A.; Mortensen, B.; Martínez, B.; Soga, K.; DeJong, J. Microbial Carbonate Precipitation: Correlation of S-Wave Velocity with Calcite Precipitation. Geo-Frontiers 2011 2011, 3993–4001. [Google Scholar] [CrossRef]
  122. Rebata-Landa, V. Microbial Activity in Sediments: Effects on Soil Behavior; Georgia Institute of Technology: Atlanta, GA, UK, 2007. [Google Scholar]
  123. Consoli, N.C.; Marques, S.F.V.; Sampa, N.C.; Bortolotto, M.S.; Siacara, A.; Nierwinski, H.P.; Pereira, F.; Festugato, L. A general relationship to estimate strength of fibre-reinforced cemented fine-grained soils. Geosynth. Int. 2017, 24, 435–441. [Google Scholar] [CrossRef]
  124. Rahman, M.M.; Hora, R.N. Unconfined Compressive Strength of Microbial Induced Calcite Precipitation (MICP) Treated soils. In Proceedings of the 19th International Conference on Soil Mechanics and Geotechnical Engineering, Seoul, Korea, 17–22 September 2017. [Google Scholar]
  125. Gao, Z.; Zhao, J. Constitutive modeling of artificially cemented sand by considering fabric anisotropy. Comput. Geotech. 2012, 41, 57–69. [Google Scholar] [CrossRef]
  126. Yarbakhti, P.; Hamidi, A. A Bond Model for Cemented Sands Including the Effects of Cement Type. 2011, pp. 965–970. Available online: http://ebooks.iospress.nl/publication/31746 (accessed on 28 June 2020).
  127. Porcino, D.D.; Marcianò, V. Bonding degradation and stress–dilatancy response of weakly cemented sands. Géoméch. Geoengin. 2017, 12, 221–233. [Google Scholar] [CrossRef]
  128. Islam, M.K.; Carter, J.P.; Airey, D.W. Model Simulation of Uncemented and Cemented Calcareous Sediments. In Proceedings of the International Conference on Geotechnics of Hard Soils-Soft Rocks, Naples, Italy, 12 June 1998; pp. 561–569. [Google Scholar]
  129. Rahimi, M.; Chan, D.; Nouri, A. Bounding Surface Constitutive Model for Cemented Sand under Monotonic Loading. Int. J. Géoméch. 2016, 16, 04015049. [Google Scholar] [CrossRef]
  130. Abioghli, H.; Hamidi, A. A constitutive model for evaluation of mechanical behavior of fiber-reinforced cemented sand. J. Rock Mech. Geotech. Eng. 2019, 11, 349–360. [Google Scholar] [CrossRef]
  131. Rahimi, M.; Chan, D.; Nouri, A. Constitutive model for monotonic and cyclic responses of loosely cemented sand formations. J. Rock Mech. Geotech. Eng. 2018, 10, 740–752. [Google Scholar] [CrossRef]
  132. Sun, D.; Matsuoka, H. An elastoplastic model for frictional and cohesive materials and its application to cemented sands. Mech. Cohesive-Frict. Mater. 1999, 4, 525–543. [Google Scholar] [CrossRef]
  133. Gajo, A.; Cecinato, F.; Hueckel, T. Chemo-mechanical modeling of artificially and naturally bonded soils. Géoméch. Energy Environ. 2019, 18, 13–29. [Google Scholar] [CrossRef] [Green Version]
  134. Nweke, C.; Pestana, J.; Byle, M.J.; Johnsen, L.F.; Bruce, D.A.; El Mohtar, C.S.; Gazzarrini, P.; Richards, T.D. Modeling Bio-Cemented Sands: Shear Strength and Stiffness with Degradation. Grouting 2017 2017, 34–45. [Google Scholar]
  135. El Kortbawi, M.; Ziotopoulou, K.; Gomez, M.G.; Lee, M. Validation of a Bounding Surface Plasticity Model against the Experimental Response of (Bio-) Cemented Sands. In Geo-Congress; American Society of Civil Engineers (ASCE): Reston, VA, USA, 2019. [Google Scholar]
  136. Boulanger, R.W.; Ziotopoulou, K. Pm4sand (Version 3.1): A Sand Plasticity Model for Earthquake Engineering Applications; Department of Civil & Environmental Engineering, College of Engineering, University of California at Davis: Davis, CA, USA, 2017. [Google Scholar]
  137. Pestana, J.M.; Salvati, L.A. Small-Strain Behavior of Granular Soils. I: Model for Cemented and Uncemented Sands and Gravels. J. Geotech. Geoenviron. Eng. 2006, 132, 1071–1081. [Google Scholar] [CrossRef]
  138. Nweke, C.C.; Pestana, J.M. Modeling Bio-Cemented Sands: A Strength Index For CEMENTED Sands. In IFCEE: Recent Developments in Geotechnical Engineering Practice; ASCE Press: Orlando, FL, USA, 2018; pp. 48–58. [Google Scholar]
  139. Desai, C.S.; Somasundaram, S.; Frantziskonis, G. A hierarchical approach for constitutive modelling of geologic materials. Int. J. Numer. Anal. Methods Géoméch. 1986, 10, 225–257. [Google Scholar] [CrossRef]
  140. Jiang, M.J.; Yu, H.-S.; Harris, D. Discrete element modelling of deep penetration in granular soils. Int. J. Numer. Anal. Methods Géoméch. 2006, 30, 335–361. [Google Scholar] [CrossRef]
  141. Jiang, M.; Yan, H.; Zhu, H.; Utili, S. Modeling shear behavior and strain localization in cemented sands by two-dimensional distinct element method analyses. Comput. Geotech. 2011, 38, 14–29. [Google Scholar] [CrossRef]
  142. Wang, Y.; Leung, S.C. Characterization of Cemented Sand by Experimental and Numerical Investigations. J. Geotech. Geoenviron. Eng. 2008, 134, 992–1004. [Google Scholar] [CrossRef]
  143. Wang, Y.; Leung, S.C. A particulate-scale investigation of cemented sand behavior. Can. Geotech. J. 2008, 45, 29–44. [Google Scholar] [CrossRef]
  144. De Bono, J.P.; McDowell, G.; Wanatowski, D. DEM of triaxial tests on crushable cemented sand. Granul. Matter 2014, 16, 563–572. [Google Scholar] [CrossRef] [Green Version]
  145. Shen, Z.; Jiang, M.; Thornton, C. DEM simulation of bonded granular material. Part I: Contact model and application to cemented sand. Comput. Geotech. 2016, 75, 192–209. [Google Scholar] [CrossRef]
  146. Obermayr, M.; Dressler, K.; Vrettos, C.; Eberhard, P. A bonded-particle model for cemented sand. Comput. Geotech. 2013, 49, 299–313. [Google Scholar] [CrossRef]
  147. Itasca. PFC3D (Particle Flow Code in 3 Dimensions); Version 4.0; ICG: Minneapolis, MN, USA, 2008. [Google Scholar]
  148. Chen, R.; Ding, X.; Zhang, L.; Xie, Y.; Lai, H. Discrete element simulation of mine tailings stabilized with biopolymer. Environ. Earth Sci. 2017, 76, 772. [Google Scholar] [CrossRef]
  149. Ning, Z.; Khoubani, A.; Evans, T.M. Particulate modeling of cementation effects on small and large strain behaviors in granular material. Granul. Matter 2016, 19, 7. [Google Scholar] [CrossRef]
  150. Li, Z.; Wang, Y.H.; Ma, C.H.; Mok, C.M.B. Experimental characterization and 3D DEM simulation of bond breakages in artificially cemented sands with different bond strengths when subjected to triaxial shearing. Acta Geotech. 2017, 12, 987–1002. [Google Scholar] [CrossRef]
  151. Yang, P.; Kavazanjian, E.; Neithalath, N. Particle-Scale Mechanisms in Undrained Triaxial Compression of Biocemented Sands: Insights from 3D DEM Simulations with Flexible Boundary. Int. J. Géoméch. 2019, 19, 04019009. [Google Scholar] [CrossRef]
  152. Yang, P.; O’Donnell, S.; Hamdan, N.; Kavazanjian, E.; Neithalath, N. 3D DEM Simulations of Drained Triaxial Compression of Sand Strengthened Using Microbially Induced Carbonate Precipitation. Int. J. Géoméch. 2017, 17, 04016143. [Google Scholar] [CrossRef]
  153. Le Métayer-Levrel, G.; Castanier, S.; Orial, G.; Loubière, J.-F.; Perthuisot, J.-P. Applications of bacterial carbonatogenesis to the protection and regeneration of limestones in buildings and historic patrimony. Sediment. Geol. 1999, 126, 25–34. [Google Scholar] [CrossRef]
  154. Webster, A.; May, E. Bioremediation of weathered-building stone surfaces. Trends Biotechnol. 2006, 24, 255–260. [Google Scholar] [CrossRef] [PubMed]
  155. Ramachandran, S.K.; Ramakrishnan, V.; Bang, S.S. Remediation of concrete using micro-organisms. ACI Mater. J. Am. Concr. Inst. 2001, 98, 3–9. [Google Scholar]
  156. Jonkers, H.M.; Thijssen, A.; Muyzer, G.; Çopuroğlu, O.; Schlangen, E. Application of bacteria as self-healing agent for the development of sustainable concrete. Ecol. Eng. 2010, 36, 230–235. [Google Scholar] [CrossRef]
  157. Achal, V.; Mukherjee, A.; Reddy, M.S. Microbial Concrete: Way to Enhance the Durability of Building Structures. J. Mater. Civ. Eng. 2011, 23, 730–734. [Google Scholar] [CrossRef] [Green Version]
  158. Amidi, S.; Wang, J. Surface treatment of concrete bricks using calcium carbonate precipitation. Constr. Build. Mater. 2015, 80, 273–278. [Google Scholar] [CrossRef]
  159. Sarda, D.; Choonia, H.S.; Sarode, D.D.; Lele, S. Biocalcification by Bacillus pasteurii urease: A novel application. J. Ind. Microbiol. Biotechnol. 2009, 36, 1111–1115. [Google Scholar] [CrossRef]
  160. Raut, S.H.; Sarode, D.D.; Lele, S.S. Biocalcification using B. pasteurii for strengthening brick masonry civil engineering structures. World J. Microbiol. Biotechnol. 2013, 30, 191–200. [Google Scholar] [CrossRef]
  161. Lambert, S.; Randall, D. Manufacturing bio-bricks using microbial induced calcium carbonate precipitation and human urine. Water Res. 2019, 160, 158–166. [Google Scholar] [CrossRef] [Green Version]
  162. Fu, F.; Wang, Q. Removal of heavy metal ions from wastewaters: A review. J. Environ. Manag. 2011, 92, 407–418. [Google Scholar] [CrossRef]
  163. Cunningham, A.; Gerlach, R.; Spangler, L.; Mitchell, A. Microbially enhanced geologic containment of sequestered supercritical CO2. Energy Procedia 2009, 1, 3245–3252. [Google Scholar] [CrossRef]
  164. Van Paassen, L.A. Bio-Mediated Ground Improvement: From Laboratory Experiment to Pilot Applications. Geo-Frontiers 2011 2011, 4099–4108. [Google Scholar] [CrossRef]
  165. Gomez, M.G.; Martinez, B.C.; DeJong, J.; Hunt, C.E.; DeVlaming, L.A.; Major, D.W.; Dworatzek, S.M. Field-scale bio-cementation tests to improve sands. In Institution of Civil Engineers-Ground Improvement; Thomas Telford Ltd.: London, UK, 2015; Volume 168, pp. 206–216. [Google Scholar]
  166. Gomez, M.G.; DeJong, J.; Anderson, C.M.; Nelson, D.C.; Graddy, C.M.R. Large-Scale Bio-Cementation Improvement of Sands. Geotechnical and Structural Engineering Congress 2016 2016, 941–949. [Google Scholar] [CrossRef]
  167. Nassar, M.K.; Gurung, D.; Bastani, M.; Ginn, T.; Shafei, B.; Gomez, M.; Graddy, C.M.R.; Nelson, D.C.; DeJong, J.T. Large-Scale Experiments in Microbially Induced Calcite Precipitation (MICP): Reactive Transport Model Development and Prediction. Water Resour. Res. 2018, 54, 480–500. [Google Scholar] [CrossRef]
  168. Filet, A.E.; Gadret, J.-P.; Loygue, M.; Borel, S. Biocalcis and its Applications for the Consolidation of Sands. Grouting and Deep Mixing 2012 2012, 1767–1780. [Google Scholar] [CrossRef]
  169. Rahman, M.; Beecham, S.; Iqbal, A.; Karim, R.; Rabbi, A.T.Z. Sustainability Assessment of Using Recycled Aggregates in Concrete Block Pavements. Sustainability 2020, 12, 4313. [Google Scholar] [CrossRef]
  170. Porter, H.; Mistri, A.; Mukherjee, A. Sustainable road bases with microbial precipitation. In Institution of Civil Engineers-Construction Materials; Thomas Telford Ltd.: London, UK, 2018; Volume 171, pp. 95–108. [Google Scholar]
  171. Ghosh, P.; Mandal, S.; Chattopadhyay, B.; Pal, S. Use of microorganism to improve the strength of cement mortar. Cem. Concr. Res. 2005, 35, 1980–1983. [Google Scholar] [CrossRef]
  172. Achal, V.; Mukherjee, A.; Basu, P.C.; Reddy, M.S. Strain improvement of Sporosarcina pasteurii for enhanced urease and calcite production. J. Ind. Microbiol. Biotechnol. 2009, 36, 981–988. [Google Scholar] [CrossRef] [PubMed]
  173. Piasta, W.; Zarzycki, B. The effect of cement paste volume and w/c ratio on shrinkage strain, water absorption and compressive strength of high performance concrete. Constr. Build. Mater. 2017, 140, 395–402. [Google Scholar] [CrossRef]
  174. ACI. ACI Manual of Concrete Practice 2000, Part 1: Materials and General Properties of Concrete; American Concrete Institute: Farmington Hills, MI, USA, 2000. [Google Scholar]
  175. Azam, A.M.; Cameron, D.A.; Rahman, M. Permanent Strain of Unsaturated Unbound Granular Materials from Construction and Demolition Waste. J. Mater. Civ. Eng. 2015, 27, 04014125. [Google Scholar] [CrossRef]
  176. Azam, A.; Cameron, D.A.; Rahman, M. Model for prediction of resilient modulus incorporating matric suction for recycled unbound granular materials. Can. Geotech. J. 2013, 50, 1143–1158. [Google Scholar] [CrossRef]
  177. Rahman, M.M.; Beecham, S.; McIntyre, E.; Iqbal, A. Mechanistic Design of Concrete Block Pavements. In Australian Geomechanics Society Victorian Symposium: Geotechnics and Transport. Infrastucture; King, D., Ed.; Australian Geomechanics Society: Melbourne, Australia, 2018; pp. 13–17. [Google Scholar]
  178. Rahman, M.M.; Beecham, S.; McIntyre, E. A new approach to the mechanistic design and analysis of concrete block pavement. In Proceedings of the 12 International Conference on Concrete Block Pavement, Seoul, Korea, 16–19 October 2018; pp. 37–41. [Google Scholar]
  179. Achal, V.; Mukherjee, A.; Basu, P.C.; Reddy, M.S. Lactose mother liquor as an alternative nutrient source for microbial concrete production by Sporosarcina pasteurii. J. Ind. Microbiol. Biotechnol. 2008, 36, 433–438. [Google Scholar] [CrossRef] [PubMed]
  180. Australian Standard. AS3600 Concrete Structures; Council of Standards Australia: Sydney, Australia, 2009. [Google Scholar]
  181. Omoregie, A.I.; Ngu, L.H.; Ong, D.E.; Nissom, P.M. Low-cost cultivation of Sporosarcina pasteurii strain in food-grade yeast extract medium for microbially induced carbonate precipitation (MICP) application. Biocatal. Agric. Biotechnol. 2019, 17, 247–255. [Google Scholar] [CrossRef] [Green Version]
  182. Fang, C.; He, J.; Achal, V.; Plaza, G. Tofu Wastewater as Efficient Nutritional Source in Biocementation for Improved Mechanical Strength of Cement Mortars. Geomicrobiol. J. 2019, 36, 515–521. [Google Scholar] [CrossRef]
  183. CMAA. DesignPave FAQs. 2020. Available online: https://www.cmaa.com.au/DesignPave/faq (accessed on 8 June 2020).
  184. Madlool, N.; Saidur, R.; Hossain, M.; Rahim, N.A. A critical review on energy use and savings in the cement industries. Renew. Sustain. Energy Rev. 2011, 15, 2042–2060. [Google Scholar] [CrossRef]
  185. NRMCA. Concrete CO2 Fact Sheet; National Ready Mixed Concrete Association: Alexandria, VA, USA, 2012. [Google Scholar]
  186. CA. Gas. Price Trends Review; Department of Industry, Innovation and Science, Commonwealth of Australia: Canberra, Australia, 2015.
  187. APPEA. Natural Gas–Essential for Australian Manufacturing; The Australian Petroleum Production & Exploration Association: Canberra, Australia, 2016. [Google Scholar]
  188. DTE. Indian Urea Plants Comparable to the Best Worldwide: Study; DownToEarth: New Delhi, India, 2019. [Google Scholar]
  189. CW. Emission Factors in kg CO2-Equivalent Per Unit; City of Winnipeg: Manitoba, Canada, 2012. [Google Scholar]
  190. Sigurdarson, J.J.; Svane, S.; Karring, H. The molecular processes of urea hydrolysis in relation to ammonia emissions from agriculture. Rev. Environ. Sci. Bio/Technol. 2018, 17, 241–258. [Google Scholar] [CrossRef] [Green Version]
  191. Austroads. Guide to Pavement Technology Part 2: Pavement Structural Design; Austroads: Sydney, Australia, 2017. [Google Scholar]
Figure 1. A schematic diagram of CaCO3 precipitation in the pore space of the soil matrix via MICP.
Sustainability 12 06281 g001
Figure 2. A timeline of the historical development of MICP.
Sustainability 12 06281 g002
Figure 3. (a) Publications on MICP—a year by year picture (b) country distribution of contributing authors (data source: Web of Science Creative Analytics [51]).
Sustainability 12 06281 g003
Figure 4. Performance comparison of different types of bacteria (data adapted from [57]).
Sustainability 12 06281 g004
Figure 5. Variation of CC with: (a) UCS and (b) permeability (Source: [A] = [93], [B] = [95], [C] = [79], [D] = [44], [E] = [84], [F] = [96], [G] = [97], [H] = [98], [I] = [99], [J] = [78], [K] = [100], [L] = [101], [M] = [102], [N] = [103], [O] = [104], [P] = [76], [Q] = [41], [R] = [38], [S] = [94]).
Sustainability 12 06281 g005
Figure 6. Variation of STS and CC with: (a) different soil types and (b) different fibre contents (Source: [A] = [82], [B] = [84], [C] = [83], [D] = [85], [E] = [97]).
Sustainability 12 06281 g006
Figure 7. Undrained behaviour of untreated and MICP-treated CHINA ISO standard sand: (a) stress-strain paths, (b) q p paths (data sourced from [105]).
Sustainability 12 06281 g007
Figure 8. Influence of CC on the undrained strength parameters: (a) peak deviatoric stress, (b) brittleness index and (c) residual stress ratio (data sourced from [105]).
Sustainability 12 06281 g008
Figure 9. Drained behaviour of untreated and MICP-treated sand: (a) stress-strain plot and (b) volumetric and axial strain plot for Ottawa 50–70; and (c) stress-strain plot and (d) volumetric and axial strain plot for Ottawa 20–30 (source: [A] = [28], [B] = [109], [C] = [107], [D] = [91], [E] = [88]).
Sustainability 12 06281 g009
Figure 10. Influence of CC on the drained strength parameters: (a) peak deviatoric stress, and (b) dilatancy (source: [A] = [28], [B] = [109], [C] = [107], [D] = [91], [E] = [88]).
Sustainability 12 06281 g010
Figure 11. Variation of RC with: (a) UCS and (b) STS (Source: [A] = [82], [B] = [84], [C] = [83], [D] = [79], [E] = [97], [F] = [44], [G] = [94]).
Sustainability 12 06281 g011
Figure 12. Variation of UCS with D10 and CC: (a) 3D contour plot and (b) 3D plot with Equation (16) as mesh ([D] = [44], [J] = [78], [P] = [76]; adapted from Rahman and Hora [124]).
Sustainability 12 06281 g012
Figure 13. Experimental and modelling of DSS results for untreated and MICP-treated soil: (a) stress-strain responses and (b) stress paths (data adapted from [135]).
Sustainability 12 06281 g013
Figure 14. Experimental ([A] = [28]) and modelling ([B] = [134]) results of shear stiffness versus shear strain for MICP-treated soil.
Sustainability 12 06281 g014
Figure 15. Experimental ([105]) and modelling ([46]) results of untreated and MICP-treated soil: (a) stress-strain paths and (b) q p paths.
Sustainability 12 06281 g015
Figure 16. (a) SEM image of MICP-cemented sand, (b) an illustration of a parallel bond between two particles, (c) normal and shear stiffnesses between particles.
Sustainability 12 06281 g016
Figure 17. (a) An illustration of a cement ring bond between two particles (b) geometry of a cement chain bond between two particles.
Sustainability 12 06281 g017
Figure 18. (a) An illustration of a beam bond between two particles, (b) geometry of a beam bond between two particles.
Sustainability 12 06281 g018
Figure 19. Example configurations of CBPs: (a) pavement containing only a granular base course, (b) pavement containing granular base and sub-base courses and (c) pavement containing granular base and stabilized sub-base courses.
Sustainability 12 06281 g019
Figure 20. Life cycles of conventional concrete bricks and MICP-treated concrete bricks and the associated economic and environmental costs for the process stages and the final product. (Note: A adapted from Madlool et al. (2011) [184]; B [185,186]; C average of the current market price of cement; D [174]; E approximated 25% reduction in cement concentrated by MICP for the same compressive strength; F [187,188]; G Calculated based on the eqCO2 emissions of chemicals [189,190] used for MICP as stated in Table 7; H, I, J obtained from Table 7; K [26]; * [186]).
Sustainability 12 06281 g020
Figure 21. Total economic and environmental costs of using MICP-treated bricks and conventional concrete bricks in pavers for a 1 km road.
Sustainability 12 06281 g021
Figure 22. Life cycles of a conventional cement-treated stabilized sub-base and an MICP-treated stabilized sub-base and the associated economic and environmental costs for the process stages and the final product. (Note: A adapted from Madlool et al. (2011) [184]; B [186]; C average of current market price of cement; D [191]; E estimated stabilized sub-base volume per m2 for ESA = 10 × 106 and CBR = 3.5; F [187,188]; G Calculated based on the eqCO2 emissions of chemicals [189,190] used for MICP as stated in Table 8; H, I, J obtained from Table 8; K [170]; * [186].
Sustainability 12 06281 g022
Figure 23. Total economic and environmental costs of using MICP-treated stabilized sub-base and pavers and cement-treated stabilization and pavers for a 1 km road (Note: * total cost of pavers obtained from Figure 21).
Sustainability 12 06281 g023
Figure 24. Life cycles of conventional cement-treated ground (subgrade) stabilization and MICP-treated stabilization, and the associated economic and environmental costs for the process stages and the final product. (Note: A adapted from Madlool et al. (2011) [184]; B [186]; C average of the current market price of cement; D [191]; E estimated sub-base volume per m2 for ESA = 10 × 106 and CBR = 15; F [187,188]; G calculated based on the eqCO2 emissions of chemicals [189,190] used for MICP as stated in Table 10; H, I, J obtained from Table 10; K [41]; * [186].
Sustainability 12 06281 g024
Figure 25. Total economic and environmental costs of using MICP-treated subgrade stabilization and pavers and cement-treated stabilization and pavers for a 1 km road (Note: * total cost of pavers obtained from Figure 21).
Sustainability 12 06281 g025
Table 1. A summary of the literature showing the relative advantages and limitations of major biochemical mechanisms involved in the MICP process.
Microbial PathwayRelative AdvantageLimitation
Urea hydrolysis(1) high chemical conversion efficiency up to 90% [65] and CaCO3 precipitation [71], (2) straightforward and easy process to control [66,72].(1) releases undesirable NH 4 + [53], (2) requires aerobic conditions for bacteria growth [52].
Denitrification(1) generates a large amount of N2 gas for liquefaction mitigation via desaturation of pore water [8,73,74], (2) oxygen independent (anaerobic) [53], (3) requires a lower concentration of substrate [53]. (1) has a slower rate of CaCO3 precipitation [75], (2) generates a high initial NO 3 concentration which inhibits bacteria growth [53].
Sulfate reduction(1) oxygen independent (anaerobic) [53](1) releases H2S which is odorous and highly toxic [53] (2) requires a large quantity of substrate [53].
Table 2. Summary of studies using UCS tests to evaluate strength improvement in MICP-treated soils.
Sand TypeMICP Process D10 (mm)D50 (mm)CuSCcSTesting Method
BTMDoS (%)TMSize
H × D (mm)
Ave. UCS
(MPa)
Ave. CC
(%)
k
(m/s × 10−5)
Plaster sand [44] BS100Gf 0.18-70.7102 × 513.256.60.1–100
Concrete sand [44]BS100Gf 0.18-10.10.6102 × 513.649.90.1–100
Cushion sand [44]BS100Gf 0.09-3.61.3102 × 513.959.80.1–100
Russian River [44] BS100Gf 0.24-8.70.7102 × 511.226.50.1–100
Folsom Lake [44]BS100Gf 0.24-6.90.7102 × 511.077.40.1–100
Napa Bay [44]BS100Gf 0.18-1.60.8102 × 515.3413.20.1–100
Cemex Fill [44]BS100Gf 0.38-8.41.2102 × 512.676.00.1–100
Granite sand [44]BS100Gf 0.22-7.70.6102 × 512.737.50.1–100
Coarse sand [78] BA30–100I0.540.701.270.1110 × 550.1–2.44–148.0–42
Silica sand [77]BA100I0.25---1000 × 459–20--
Pure silica sand [43]BAUnsatSP0.23---1000 × 4519.61--
Silica sand [81]BAUnsatSP0.35---2000 × 550.065--
Ottawa silica [76]BA100Sb0.190.301.81.1102 × 511.9–151.8–14-
Fine sand [93]BA100I0.100.192.10.9100 × 500.6–2.54–9-
Medium sand [93]BA100I0.260.391.60.9100 × 500.5–123–11-
Coarse sand [94]BA100I1.451.601.41.0102 × 510.5–152–23-
Coarse sand [95]BA100SP0.610.721.21.0100 × 500.2–2.33–160.1–66
Ottawa 20–30 [79]BA100I-0.721.21.075 × 252.56.5-
Ottawa 50–70 [79]BA100I-0.221.40.975 × 253.0410.8-
Navada [79]BA100I-0.121.71.275 × 252.613.9-
Ottawa 20–30 [84]BA100I0.65-1.21.0100 × 500.2–1.88–122.0–6.0
Beach sand [96]BA100I0.500.70--100 × 500.4–1010–29-
Ottawa 20–30 [97]BA100I0.65-1.21.0100 × 500.8–1.16.4–7.64.0–6.5
Mizunami sand [98]BS100Gf-1.50--60 × 300.9–1010–32-
Silica sand [99]BA100I0.5–0.1-1.2–6.30.9–1.190 × 450.1–2.01.4–10-
Silica sand [100]BA100I----180 × 500–0.311.0–4.14.0–10
Ottawa sand [101]BA100Gf-0.42--100 × 500.2–0.55.2–7.70.1–0.6
14 soil types [102]BA100I0.07–0.38-2.3–10.10.6–1.4-0.1–5.42.6–14-
Standard sand [103]BA100Sb-0.42---0.03–21.4–10-
Residual soil [104]BA100I----170 × 500–0.20.6–2.8-
Ottawa sand [76]BA100Sb0.190.30--102 × 510–2.31.8–15-
Itterbeck fine [41]BA100I-0.171.64--0.7–1312–28-
Silica sand [38]BA100I-0.17--100/250 × 35/1000–3.02.6–100–13
BTM—Bio-treatment approach, BA—Bioaugmentation; BS—Biostimulation; DoS—Degree of Saturation; Dx—Particle size at ‘x’% finner; Cus—Uniformity coefficient of sand particles; Ccs—Coefficient of curvature of sand particles; TM—Treatment method; Gf—Gravity fed; I—Injection; Sb—Submerged; SP—Surface Percolation; k—Soil permeability.
Table 3. A summary of the literature reporting STS test results on MICP-treated soils.
Sand TypeMICP ProcessD10 (mm)D60 (mm)CuSCcSTesting Method
EMTMSize H × D (mm)MethodAve. STS
(MPa)
Ave. CC
(%)
Calcarous sand [79]-I0.150.352.331.0120 × 40STS0.04–0.36-
Ottawa 20–30 [82]-I0.650.801.171.0275 × 25STS0.514.83
Ottawa 50–70 [82]-I0.180.251.400.9075 × 25STS0.528.55
Nevada [82]-I0.080.131.701.2475 × 25STS0.3914
Sand [54]Clay (0%)MC0.531.352.550.9920 × 70STS0.01-
Sand + Kaolin [54]Clay (28%)MC----20 × 70STS0.03-
Ottawa 20–30 [97]-I0.65-1.21.0100 × 50STS0.156.9
Ottawa 20–30 [84]FR (0%)I0.650.801.171.02100 × 50STS0.157.57
Ottawa 20–30 [84]FR (0.4%)I0.650.801.171.02100 × 50STS0.298.50
Ottawa 20–30 [84]FR (0.8%)I0.650.801.171.02100 × 50STS0.448.93
Ottawa 20–30 [83]FR (0%)I0.650.801.171.02100 × 50STS0.054.03
Ottawa 20–30 [83]FR (0.2%)I0.650.801.171.02100 × 50STS0.074.10
Ottawa 20–30 [83]FR (0.4%)I0.650.801.171.02100 × 50STS0.074.30
Ottawa 20–30 [83]FR (0.6%)I0.650.801.171.02100 × 50STS0.084.30
Ottawa 20–30 [83]FR (0.8%)I0.650.801.171.02100 × 50STS0.094.50
Silica sand [85]BFR (0%)I0.210.281.30.98100 × 50STS0.0910.08
Silica sand [85]BFR (0.4%)I0.210.281.30.98100 × 50STS0.3214.08
Silica sand [85]BFR (0.6%)I0.210.281.30.98100 × 50STS0.3715.94
Silica sand [85]BFR (0.8%)I0.210.281.30.98100 × 50STS0.4417.14
Silica sand [85]BFR (1.0%)I0.210.281.30.98100 × 50STS0.4517.58
Silica sand [85]BFR (1.2%)I0.210.281.30.98100 × 50STS0.3314.87
EM—Enhancement method; I—Injection; TM—Treatment method; FR—Fibre reinforcement; BFR—Basalt fibre reinforcement; MC—Mixed and compacted; STS—Splitting tensile strength; Es50—secant elastic modulus at 50% of the peak tensile stress.
Table 4. A summary of the literature on MICP and triaxial tests.
Sand type* MICP ProcessD50 (mm)CusCcsTesting Method
Dr
(%)
NTC Size H × D
(mm)
Method p 0
(kPa)
Peak c′
(kPa)
Peak ϕ
(°)
NL
Ottawa 20–30 [88]36–426–290.721.171.02144 × 72CIDC10–40010941-
Ottawa 50–70 [88]36–456–350.221.400.90144 × 72CIDC10–40010839-
Ottawa 20–30 [91]37100.721.171.02144 × 72CIDC100---
Ottawa 50–70 [91]36130.221.400.90144 × 72CIDC100---
Nevada [88]36–4210–460.121.701.24144 × 72CIDC10–40012638-
Itterbeck [108]-8–160.192.100.86100 × 50CIUC100–40025344-
CHINA ISO [105]30/802–160.525.081.0580 × 39.1CIUC100–30045045-
Ottawa 50–70 [109]40–7510–400.221.400.90145 × 72CIDC100–4005941-
Ottawa 20–30 [107]39-0.711.171.02145 × 72CIDC25–100---
Ottawa 50–70 [107]41-0.331.431.01145 × 72CIDC25–100---
Ottawa 50–70 [28]406–160.221.400.90144 × 72CIDC/CIUC100-43.7-
Calcareous sand [79]40-0.362.361.0180 × 40CIDC100–400425.643.2-
Calcareous sand [92]10–803–60.382.261.0380 × 39Cyclic100--8–380
* All MICP specimens were treated using the injection method; Dr—Relative density; NTC—Number of treatment cycles; p 0 —Initial effective confining stress; C’—Cohesion; ϕ—Frictional angle; NL—Number of cycles to liquefaction.
Table 5. A summary of DEM studies on cemented MICP and triaxial tests.
Cementation ApproachObject DimensionNo. of ParticlesParticle ShapeTesting Method SoftwareContact Bond Model
MICP [151]Rectangular (3D)1000SphericalCIUCYADECBM
MICP [152]Rectangular (3D)1000SphericalCIDCYADECBM
MICP [47]Cubic (3D)-Spherical-PFCCRBM
MICP [48]Cubic (3D)53,000Spherical-PFCCRBM
MICP [49]Cylindrical (3D)13,000DPSCIDCPFCPBM
MICP [50]Cylindrical (3D)7000SphericalCIDCPFCPBM
OPC [149]Cylindrical (3D)52,000SphericalCIDCPFCPBM
OPC [144]Cylindrical (3D)3350SphericalCIDCPFCPBM
OPC [150]Cylindrical (3D)49,864SphericalCIDCPFCCRBM
OPC [145]Rectangular (3D)20,000SphericalCIDCPFCPBM and SBM
OPC [142,143]Rectangular (2D)8000-CIDCPFCCRBM + PBM
OPC [146]Cubic (3D)1400SphericalCIDCPFCBM
BSMT [148]Cylindrical (3D)19,600SphericalCIDCPFCPBM
OPC—Ordinary Portland cement; BSMT—Bioplymer stabilized mine tailings; DPS—Different particle shape; PFC—Particle flow code.
Table 6. Mechanical properties of the different materials used in designing a pavement structure for Scenario 1 and the volume required for construction of a 1 km long and 7 m wide road.
LayersThickness
(mm)
Elastic Modulus * (MPa)Poisson’s RatioVol. Required for 1 km Length of Road (m3)
Paver8032000.30560
Bedding sand202000.35140
Base course1003500.35700
Sub-base course4452500.353150
Subgrade-350.40-
* a range of material properties can be found in the literature [169,175,176,177,178].
Table 7. Estimated cost of materials for MICP treatment.
MaterialQuantity
(g/L of Treatment Solution)
Unit Price ($/kg)Cost/L ($)
Nutrient broth8 *,#--
NaCl5 *0.5 ^0.0025
Urea20 *0.2 ^0.004
CaCl22.77 *0.2 ^0.000555
Total0.00705
* values from Achal et al. [157] and Achal et al. [179]; # assumed to be sourced from waste material [157]; ^ approximate current market price (industrial grade)*.
Table 8. Composition of growth media and cementation solution.
MaterialQuantity
(g/L)
Unit Price
$/kg
Cost/L
($)
Growth media
1.Yeast extract2018 *0.36
2.Ammonium sulphate100.15 ^0.0015
3.Nickel Chloride0.000259210 ^0.0000026
4.Tris buffer (pH 9)4.65751500.0047
Total0.366
Cementation solution
1.Urea30.030.2 ^0.006
2.CaCl255.490.2 ^0.0111
3.Yeast extract0.518 *0.009
Total0.0261
* Estimated cost after [181]; ^approximate current market price (industrial grade).
Table 9. Mechanical properties of different materials used in designing a pavement structure for Scenario 2 including the volume required for construction of a 1 km long and 7 m wide road.
LayersThickness
(mm)
Elastic Modulus (MPa)Poisson’s RatioVol. Required for 1 km Length of Road (m3)
Paver8032000.3560
Bedding sand202000.35140
Base course1003500.35700
Stabilised sub-base33035000.22310
Subgrade-350.4-
Table 10. Composition of different chemical solutions used by van Paassen et al. [41].
MaterialQuantity
(g/L)
Unit Price
($/kg)
Cost/L
($)
Nutrient broth
1.Yeast extract2018 *0.36
2. Ammonium chloride100.15 ^0.0015
3. Nickel Chloride1.29610 ^0.0000026
Total0.366
0.05M CaCl2 solution
1.CaCl25.550.20.00111
Reagent solution
1.Urea60.060.2 ^0.022
2.CaCl2110.980.2 ^0.0111
Total0.033
* Estimated cost after [181]; ^ approximate current market price (industrial grade).
Table 11. Mechanical properties of various materials used in designing the pavement structure for Scenario 3 and the volume required for construction of a 1 km long and 7 m wide road.
LayersThickness
(mm)
Elastic Modulus (MPa)Poisson’s RatioVol. Required for 1 km Length of Road (m3)
Paver8032000.3560
Bedding sand202000.35140
Base course1003500.35700
Granular sub-base 2602500.351820
Subgrade-1500.4-

