Vehicular PM Emissions and Urban Public Health Sustainability: A Probabilistic Analysis for Dhaka City


UniSA STEM, University of South Australia, SA 5095 Adelaide, Australia
*
Author to whom correspondence should be addressed.
Sustainability 2020, 12(15), 6284; https://0-doi-org.brum.beds.ac.uk/10.3390/su12156284
Submission received: 10 July 2020
/
Revised: 27 July 2020
/
Accepted: 3 August 2020
/
Published: 4 August 2020
(This article belongs to the Special Issue Urban Sustainability: Pavement Design, Construction and Environment)
Abstract
:Particulate Matter (PM) pollution is generally considered as a prime indicator of urban air quality and is linked to human health hazards. As vehicles are a vital component of an urban setting, the risks of particulate pollution need to be assessed. An emission modelling is essential for that, and thus stochastic modelling approach involving Monte Carlo simulation technique was applied, aiming to reduce the uncertainty in emission modelling. The risks scenarios for the emissions were generated for 2019 (present state) and 2024 (future), integrating the probability of emissions and the associated AQI (Air Quality Index). Despite the vehicles being a minor source of PM in Dhaka (compared to the contribution from other sources), about one-third of the city is found under high risk due to the exhaust particulate pollution; having the potentiality to cover more than 60% of the city in the coming years, affecting the urban public health sustainability. However, the extent of implementation of planning and management strategies can revert the scenarios for the city, which can plausibly reduce the risk from 80% to 50%, or even to a no-risk state.
1. Introduction
Dhaka City of Bangladesh is one of the most densely populated cities in the world (ranked within the top 15), with a population density of approximately 28,000 per sq. km as per 2016 [1]. At the same time, in terms of particulate pollution, it has been identified continuously as one of the most polluted cities [2]. Therefore, extensive population exposure to that particulate pollution is apparent, risking the overall urban public health standings of the city. Particulate Matter (PM), both coarse (PM10—particles diameter ≤ 10 micrometres) and fine (PM2.5—particles diameter ≤ 2.5 micrometres) particles, are mainly responsible for respiratory health problems [3,4,5,6,7]. The typical effects of PM exposure include asthma, bronchitis, reduced lung function, cardiovascular disease, and other chronic effects associated with premature mortality [8,9,10,11,12,13,14] when exposed for a longer period. Exposure to higher ambient PM2.5 is considered to be one of the major causes of premature deaths (about 7.6% globally), of which 59% is in the east and south Asia for the population being at risk [15]. Concerning the mortality associated with the PM exposure, an approximately 2–5% increase in mortality might result due to 1 μg/m3 increase in PM2.5 concentration [16,17]. PM is also found to be associated with high blood pressure to a great extent, especially among the elderly [14,18]. Epidemiological studies conducted in US have demonstrated a consistent association between short-term PM2.5 exposure and blood pressure level among the elderly [19]. A higher level of exposure to PM2.5 emissions from diesel engines was also identified as a cause of lung cancer [19], which might be sourced from diesel vehicles in the city. While the sustainability demands to protect the future from over-exploitation at present [20], the risk to public health is thus indicative of the urban public health sustainability of the city [21,22,23], which falls under the secondary dimension of sustainability [24]. This research, therefore, emphasized on whether the PM contribution from vehicular sources to the overall pollution level is significantly affecting the city’s public health sustainability or not.
Generally, the conventional brick kilns adjacent to the city, vehicles, uncontrolled development activities, stockpiling of uncovered construction materials along with roadside, and the biomass burning in industries in and around the city are considered as the catalysts behind such unhealthy air [25,26,27,28]. However, the pollution level varies depending on the climatic condition. The brick kilns operating during the dry seasons [29,30] contribute about % of the total PM pollution of the city [26,28,31], resulting in higher particulate pollution concentration during this time. Moreover, the low particle deposition rate at dry season facilitates higher pollution levels during this period than the wet season [28,32]. Again, prolonged uncontrolled development activities, like the ongoing MRT (Mass Rapid Transit) and BRT (Bus Rapid Transit) constructions that are taking place in Dhaka city, can be responsible for an increased PM (Particulate Matter) level, irrespective of the seasons. Industrial fossil fuel burning (especially diesel and crude oil) throughout the year is another consistent source of PM pollution [3,33], which is sourced from several power plants, cement, fertilizers, steel, pharmaceutical, and garments industries within a 100-km radius of the city [34]. The factors (other than industrial pollution) discussed above might vary depending on time, but the vehicles operated on the road remains similar throughout the year in a city, and this is also the case for Dhaka City. Vehicles significantly emit several primary pollutants like Nitrogen Oxides (NOx), Carbon Monoxide (CO), Particulate Matters (PM), and Volatile Organic Carbons (VOCs), and facilitate the formation of secondary pollutants like Ozone (O3) [35,36,37,38,39,40,41,42,43,44]. Therefore, the contribution of the traffic system to urban air quality and public health is subjected to all the emissions. However, considering severe PM pollution in Dhaka City, and for the significant contribution of that from vehicles [45,46,47,48,49,50,51,52,53,54,55,56], this research intended to individually assess the PM pollution risks correlated to the consistent vehicular sources only, aiming to analyse the city’s sustainability when other sources are maintained. This study will also aim to assess whether sustainability would be compromised if the current trend continues, and if planning and policies are not incorporated into the management approach strictly. Although industries also contribute consistently to PM emissions throughout the year, this research has set its scope only to assess the impacts of vehicular emissions and their consequences on road users.
The effects of PM exposure vary depending on the extent and enormity of exposure above the acceptable limit for public health. The World Health Organization (WHO) has a recommended guideline [57] for protecting public health worldwide. Nevertheless, the PM2.5 acceptable standards differ from countries to countries depending on many factors, including potential health risks, socio-economic capacity, technological ability, and many other aspects. Thus Bangladesh standard (65 μg/m3—24 hr average) [58] is significantly higher than the WHO (25 μg/m3—24 hr average) [57] and US EPA standard (35 μg/m3—24 hr average) [2,59,60]. In this research, the Bangladesh standard (and AQI—Air Quality Indices) was considered for classifying the risks resulting from PM pollution.
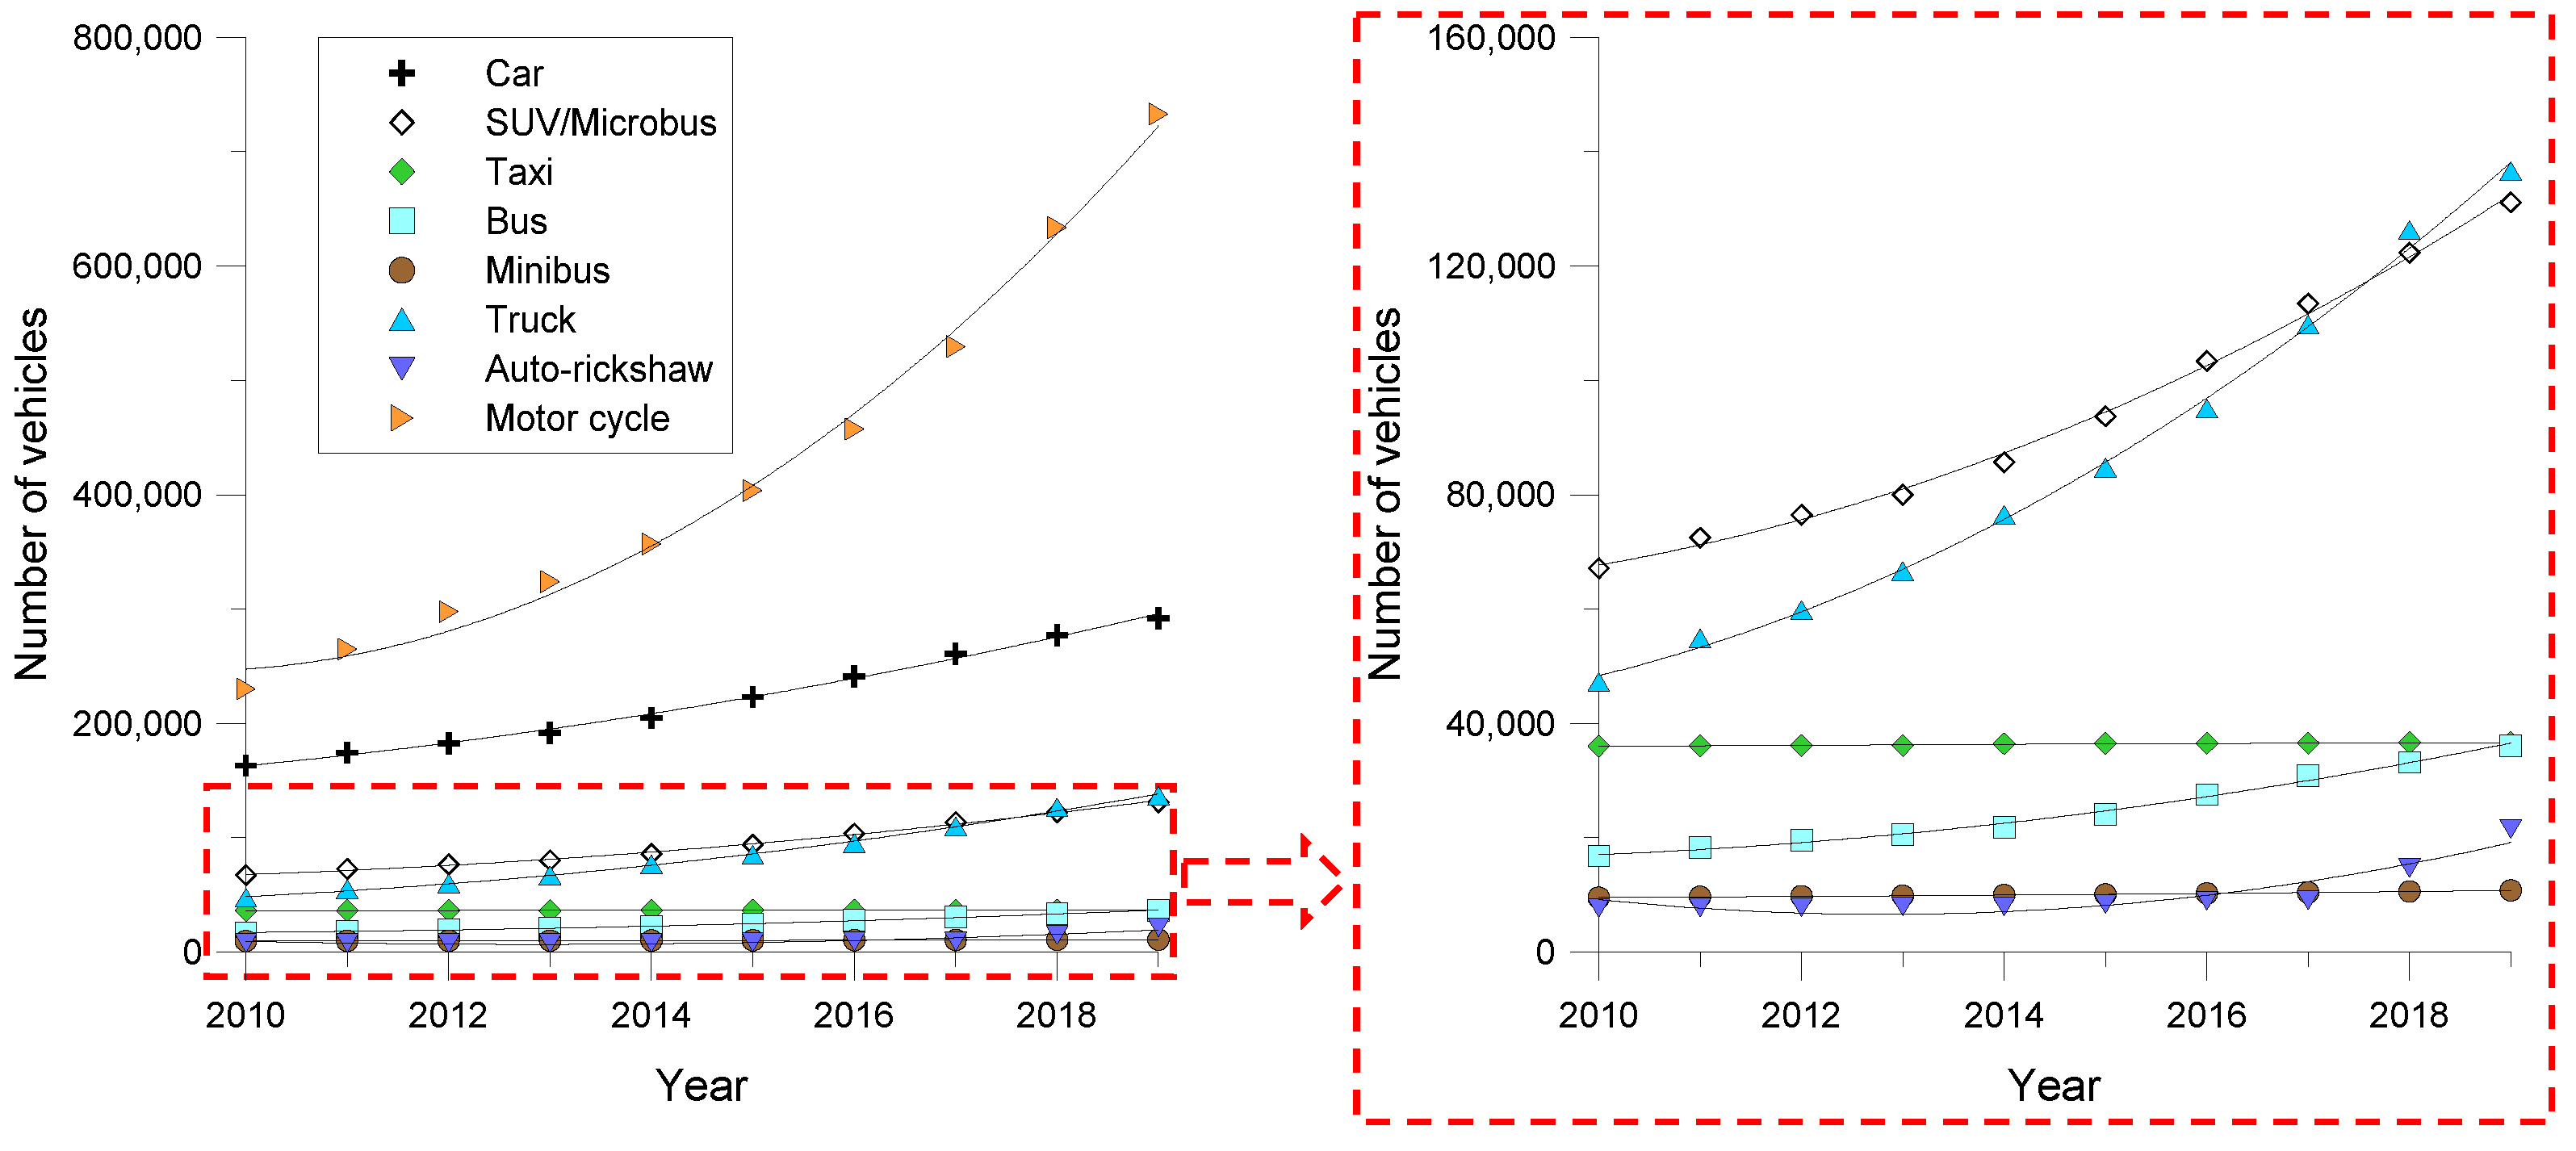
The vehicle fleet in Dhaka city is dominated by private vehicles [61,62,63] (Figure 1) due to unplanned vehicle growth over the years. While the PM emission from private vehicles became insignificant because of the increased usage of CNG (compressed natural gas) over the years, diesel vehicles and motorcycles contribute to the majority of the vehicular PM emissions [27,31,64]. The consistent growth trend of diesel vehicles alongside the sharp growth of motorcycles in the city over the decade (Figure 1) thus increases the potentiality of increasing vehicular PM emissions in the future. Again, the increased on-road traffic volume has consequently increased the congestion on the road [65,66,67,68]. The congestion resulted in increased fuel combustion in vehicles and has amplified the associated emissions in folds than a non-congested transport system. Research indicates that, at present, vehicle exhausts contribute about 35% of PM concentration during the wet season, while about 14% during the dry season [27]. However, the current transport system practice might increase the contribution in the coming days, which might cause a consistent threat to public health. The ongoing public transport projects (MRT and BRT) might improve the congestion scenario in future, but that still needs to be assessed concerning the exposure of huge inhabitants to the resulting pollution. There are research that demonstrates how the changed lifestyle changes the pollution scenarios, for instance, the impact of reduced movement during COVID-19 pandemic reduced PM emissions by approximately 28% in Malaysia [69], about 75% in Morocco [70], and about 21% in China [71]. However, these reductions are not solely from reduced vehicular emissions, somewhat reduced industrial emissions also had a part. Again, concerning the PM emissions from vehicles, research indicates that improved vehicle technology and higher speed might reduce PM emissions by 50% [47,52,72], considering other factors being involved in such reductions. Therefore, a modelling study that considers such factors can be useful to predict the contribution of vehicular emissions and what extent that needs to be managed. However, there has been not much research explicitly conducted on accounting the particulate pollution from vehicular sources in Dhaka City, especially the parametric study that can analyse the ‘what-if’ scenarios. Therefore, Dhaka City was selected for this research to assess the sustainability of both the typical and strategic scenarios, which might be useful in representing the scenarios for developing countries as well.
Emissions of different pollutants are attributed to various processes. Likewise, PM emissions from vehicle exhaust depend mainly on the fuels (gasoline and diesel mostly) [47,51,56,72,73,74] and engine technology [47,52,64,75], primarily when an engine is operated in a low-temperature condition [8,35]. Although the particulate matter is categorized in PM2.5 or PM10, however, this research considers the emission of PM2.5, as the coarse fraction, present in an insignificant amount in vehicle exhausts [64]. Other than direct combustion emissions, loose materials on the road surface might result in indirect pollution associated with vehicle movement [28,51,53,76,77,78,79], which was not considered in this research for emissions modelling.
While a monitoring network of the city is capable of showcasing an overall PM pollution scenario, a modelling study can address the responsible factors (e.g., traffic volume, engine technology, fuel types) for vehicular emissions only, and thus can facilitate further planning for attaining sustainability. The number of samples representing a scenario is always a crucial factor, which is often compromised in the modelling studies due to a lack of data. Therefore, adopting a stochastic modelling approach (be generating a series of random scenarios) to obtain average emissions, along with analysing the probability of getting that average emission, might improve the performance of the model. The intensity of the emissions concentrations and its associated probability of occurrence can signify the risks associated with the pollution, and thus can be ranked accordingly. The spatial analysis of risk severity thus was demonstrated in this research denoting the sustainability scenarios.
The emissions modelling, along with other factors, relies on vehicle attributes and their operation patterns at the road links [44]. To reduce the uncertainty of these parameters induced from limited surveys, implementing Monte Carlo simulation technique [80,81] would randomly generate thousands of data considering the range provided by the field survey (fleet characteristics/volume and speed profile for both peak and off-peak periods). The same research group conducted similar research earlier, focusing on the probabilistic risk assessment for vehicular NOx emissions [82] and could demonstrate the risk scenarios associated with that. Therefore, this research adopted the same methodology for PM2.5, aiming to assess the probabilistic air quality risks resulting from vehicular sources, which in turn might trade-off the urban health sustainability of the city.
2. Methodology
The risks assessment was conducted following the 3 major steps: (a) conducting a probabilistic PM2.5 emissions inventory that generates emission concentration and the probability of occurrence, (b) risks analysis considering emission intensity and probability, and (c) spatial analysis to demonstrate the scenarios and hot zones.
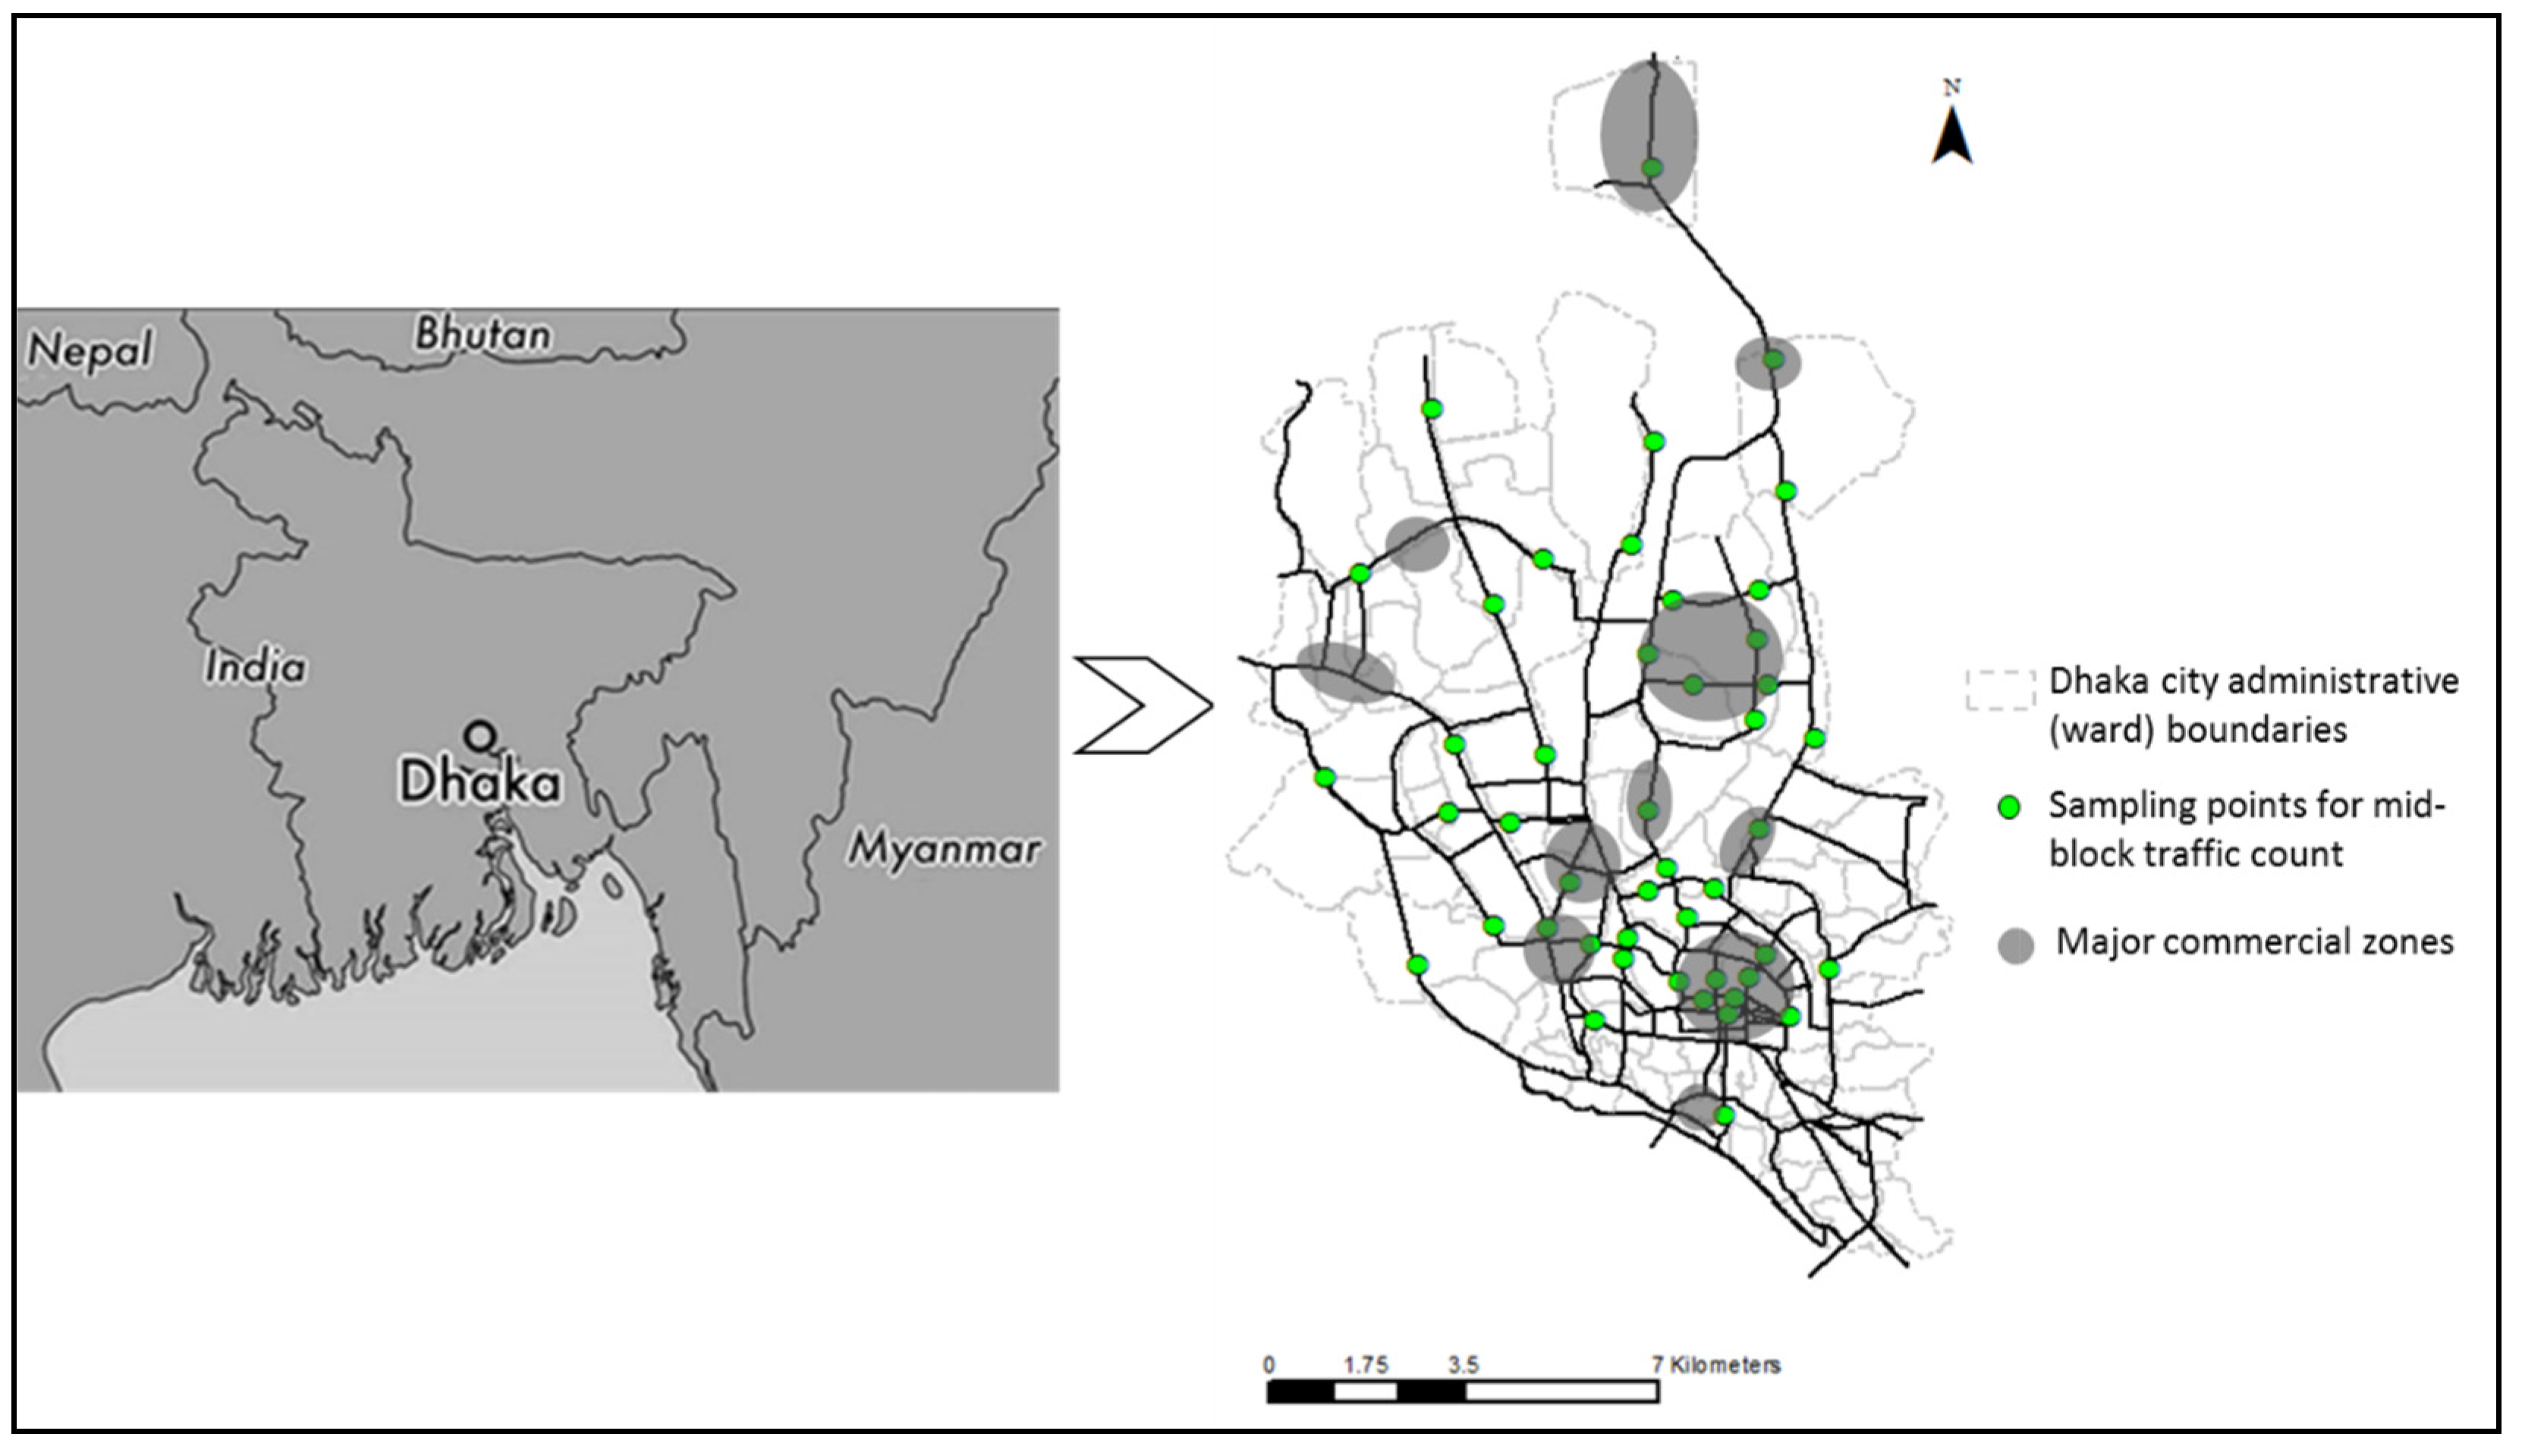
Dhaka, the capital city of Bangladesh, has a quite widespread road network with several major road links supporting mobility (Figure 2). As the city is extended more in north–south directions, the north–south–north flow of vehicles along the arterial links supporting the commercial hotspots at the north, south, and middle (shaded areas in Figure 2) parts, would be significant for pollution levels in the city. The flow and characteristics of vehicles differ significantly on the functionality of the zones, and thus the pollution concentration would vary spatially.
2.1. Probabilistic PM2.5 Emissions Assessment
The standard vehicular PM2.5 emissions calculation methodology provided by the European Environment Agency (EEA) [64] was adopted in this research, which was also implemented on Dhaka City earlier by Iqbal et al. [44]. The standard method is provided in Equation (1) below.
where, r = road link; i = vehicle types (e.g., private vehicles, bus, truck, motorcycles, etc.); j = fuel types (petrol, diesel, Compressed Natural Gas—CNG); AADT = average annual daily traffic at a road link r for a vehicle type i with fuel type j; and EFij = PM2.5 emissions factor for each vehicle category (g/km).
While the emission factor depends predominantly on vehicle technology and fuel being used in the vehicles, the fuel consumption rate by different vehicles is thus important to scale the emission rate. The Tire-2 PM2.5 emissions factors (g/km) provided by EEA [64] was scaled along with the Tire-3 fuel consumption (g/km) factor for each vehicle category, and fuel consumption-based emissions factor was calculated [44], as is shown in Table 1. Therefore, the scaled emission factor could accommodate the variations in fuel consumptions depending on the vehicle speeds, and thus PM2.5 emissions for each road link were calculated. The vehicle specific fuel consumption rate for Dhaka City was acquired from earlier research carried out by Iqbal et al. [82].
2.1.1. Modelling Data
The total registered traffic data for each year was collected from the Bangladesh Road Transport Authority [61], which predicted the vehicle-specific growth patterns for the city (Figure 2). In case of future scenario analysis, the growth trend was considered to predict the vehicle numbers for the scenario.
The distribution of vehicles along the road networks determine the spatial distribution of emissions generated by the vehicles. The dispersion of traffic volume at the major arterial road links, accounted in Iqbal et al. [44], was extrapolated in this research according to the changed vehicle numbers for analysing the emissions. However, plausibly, the limited number of samples collected during the traffic survey might lead to an uncertain estimation, which was controlled in this research using the Monte Carlo simulation technique (a stochastic modelling approach). The stochastic modelling tested by Iqbal et al. [82] for the same traffic dataset determined that the results were steady for more than 10,000 iterations and, thus, in this research, 20,000 random traffic volume were generated within the range obtained in the survey or extrapolated for a year. The simulation was conducted separately for peak (generally 9 am to 11 am, 1 pm to 2.30 pm, and 5 pm to 8 pm) and off-peak periods (other times) [44] valuing the diurnal variation of the traffic volume. The mid-day peak traffic period (1 to 2.30 pm) is induced due to the school traffic (private vehicles); while the morning peak is a bit late than usual in Dhaka city as most of the offices, businesses, and tertiary educational institutions generally starts operation at 10 am [44].
Likewise, the vehicle speed profile was also varied randomly for stochastic modelling, considering the base speed profile data provided by Iqbal et al. [44]. The vehicle speed profile for any subsequent scenarios was adjusted based on the relationship developed by Iqbal and Allan [83], as stated in Equation (2).
where v = estimated vehicle speed (km/h); Ce = car equivalent of vehicles running on the road established by Iqbal and Allan for Dhaka City [83].
2.1.2. Estimating On-Road PM2.5 Concentrations
The US EPA [84] recommended model for line source dispersion of inert pollutants in urban areas, CALINE4 [85] was used in this research for estimating PM2.5 concentrations at each road links (data nodes portrayed in Figure 2):
- ○
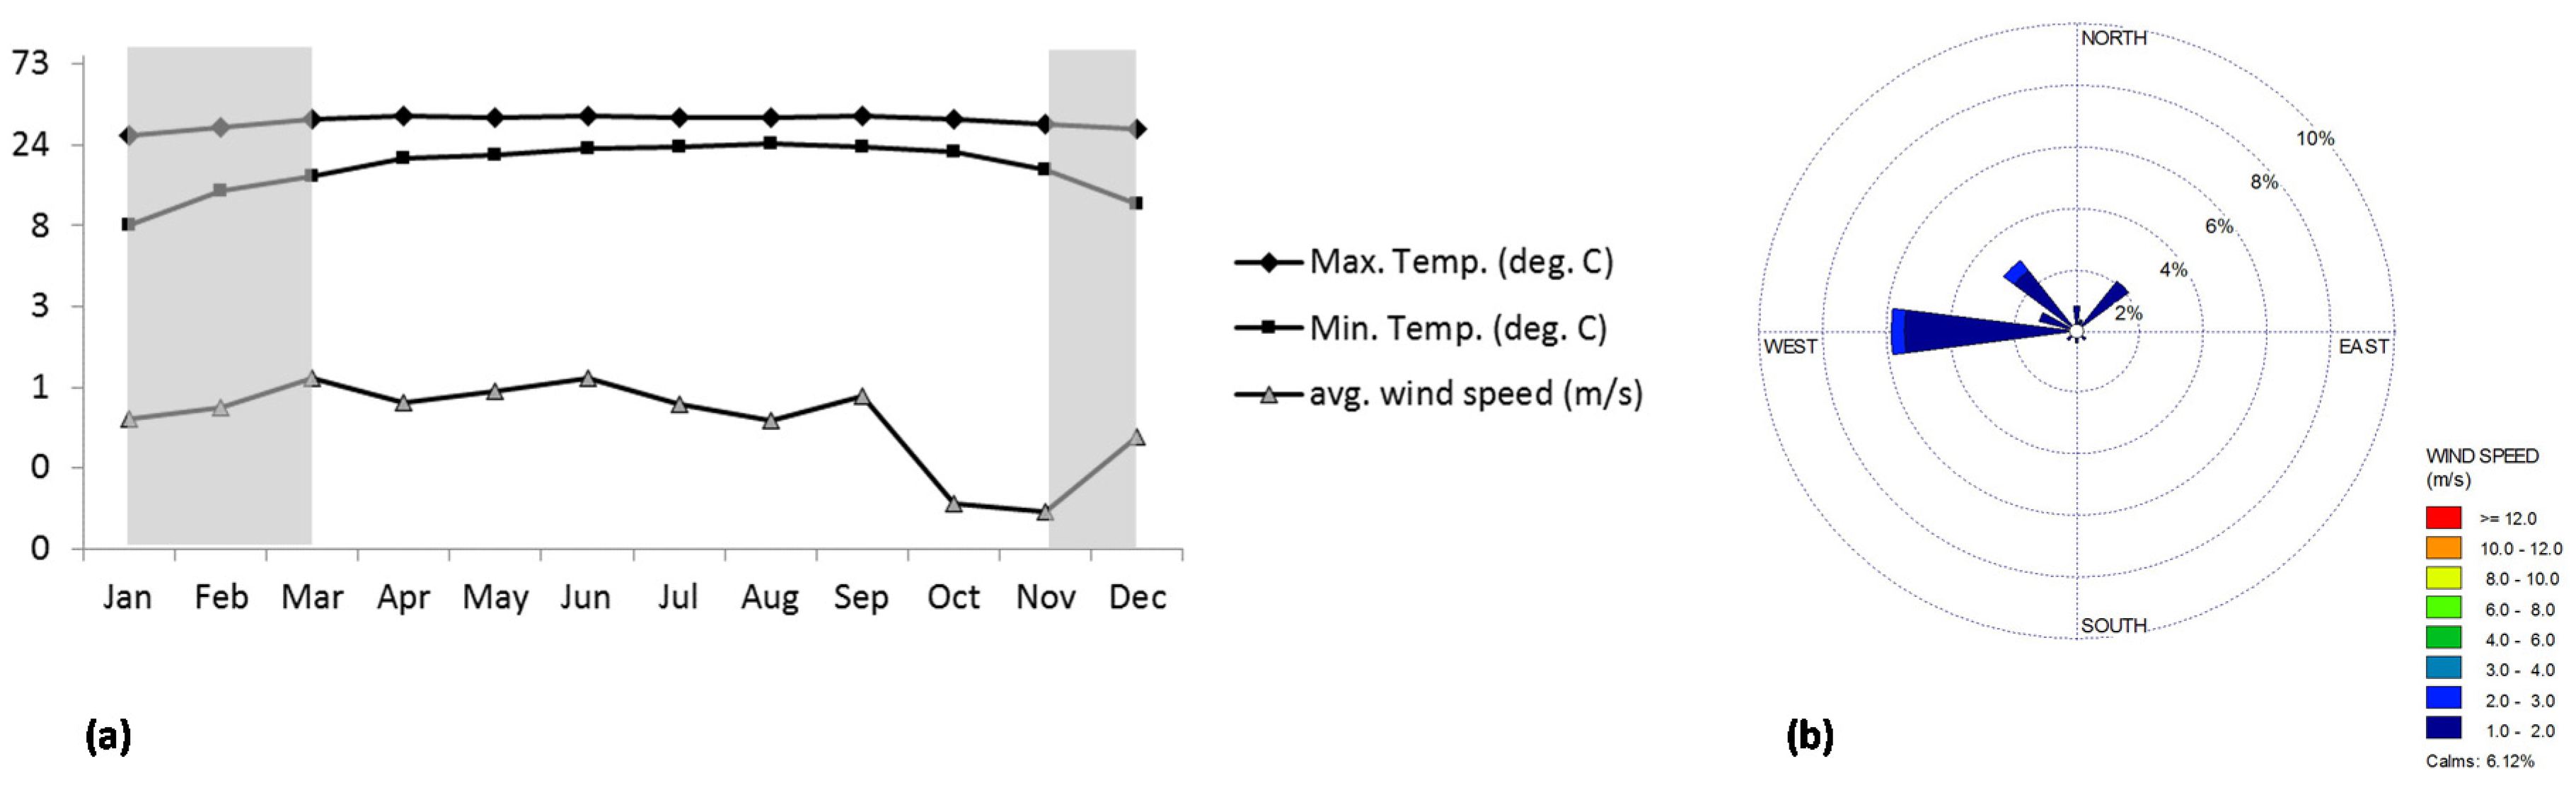
- The required meteorological data [82] were obtained from the Bangladesh Bureau of Meteorology [86]. CALINE4 was simulated for the dry season of the year (November–March), as the rate of deposition is lower during this period [32]. Thus, having a higher concentration scenario would allow planning for the worst-case scenarios. The meteorological data are provided in Figure 3, showing an east–west movement of the wind (Figure 3b) stimulating the east–west dispersion of pollutants. The model was run for December assuming to be applicable for dry months.
- ○
- The average concentration of peak and off-peak periods was estimated separately by running the model for 1 h for each period. The 1-h average is considered representative as the stochastic modelling generated the average for each period by considering the highest and lowest values.
- ○
- The model was run without considering any background PM2.5 concentration so that it can predict the concentration resulted from vehicular sources only.
2.2. Probability of Emissions/Risks
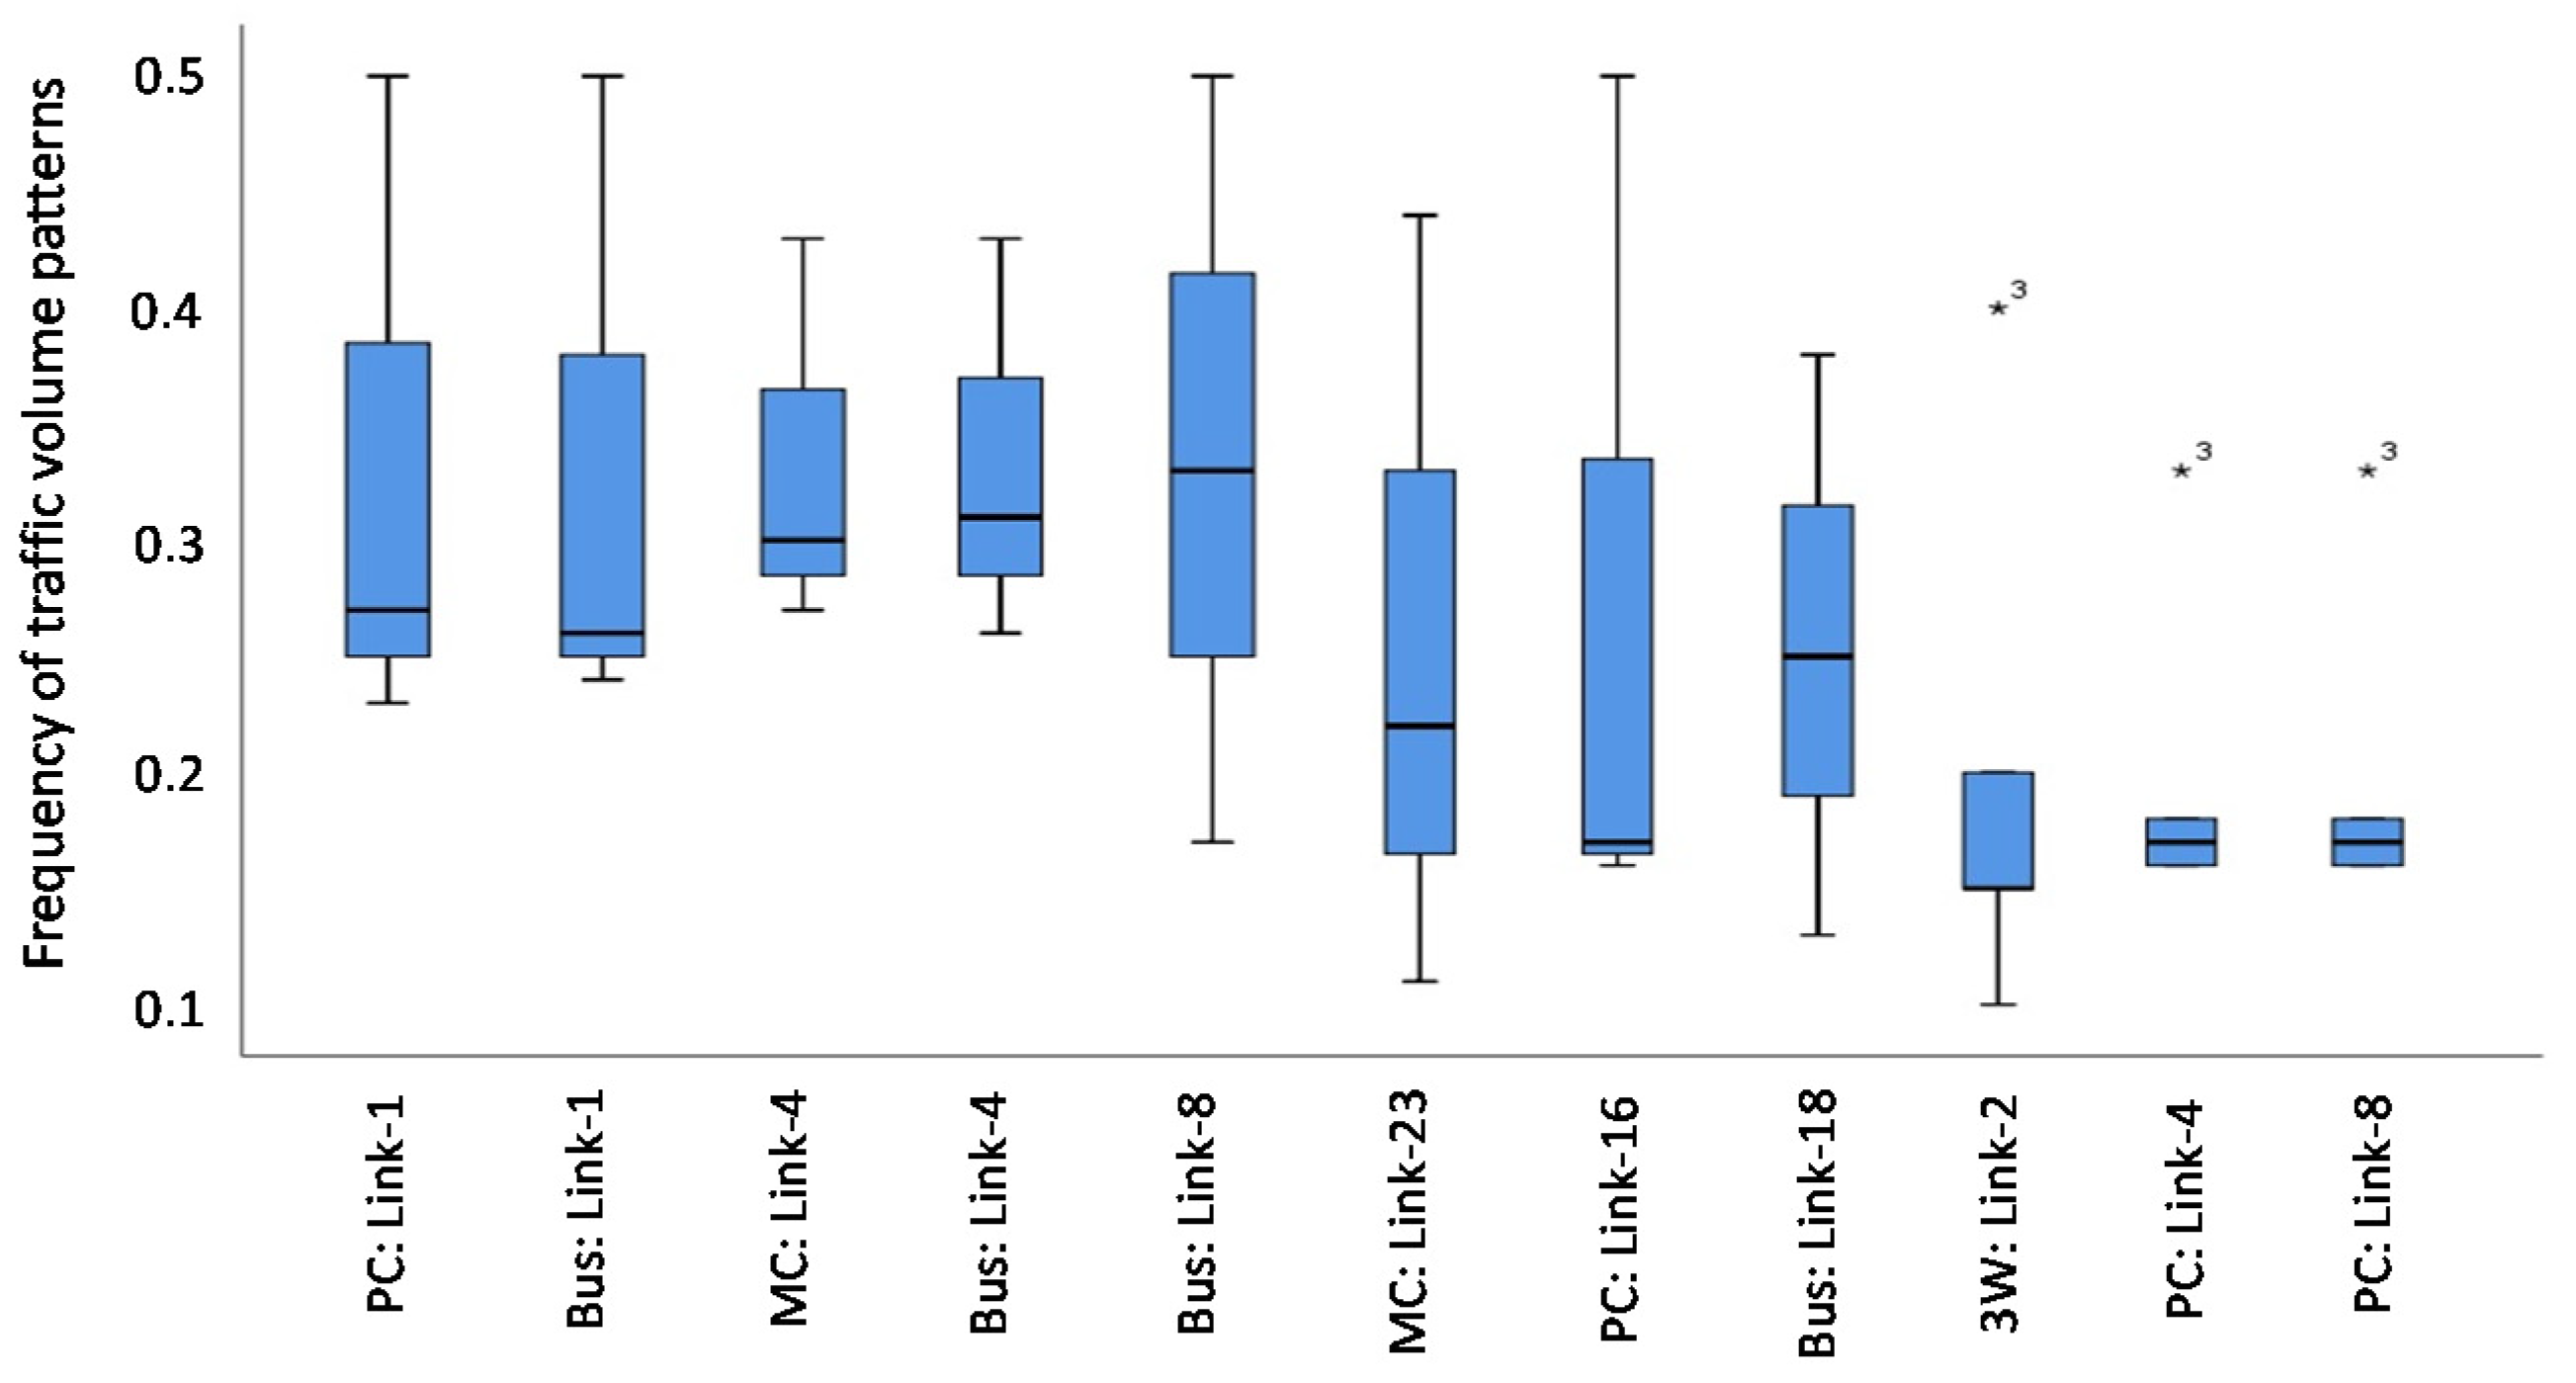
To conceive the probability function, it is important to know the distribution of data. The traffic volume data on different road links were used to assess the normality of the data, which demonstrated a normal distribution pattern for many cases, while the skewed distribution was also evident (Figure 4).
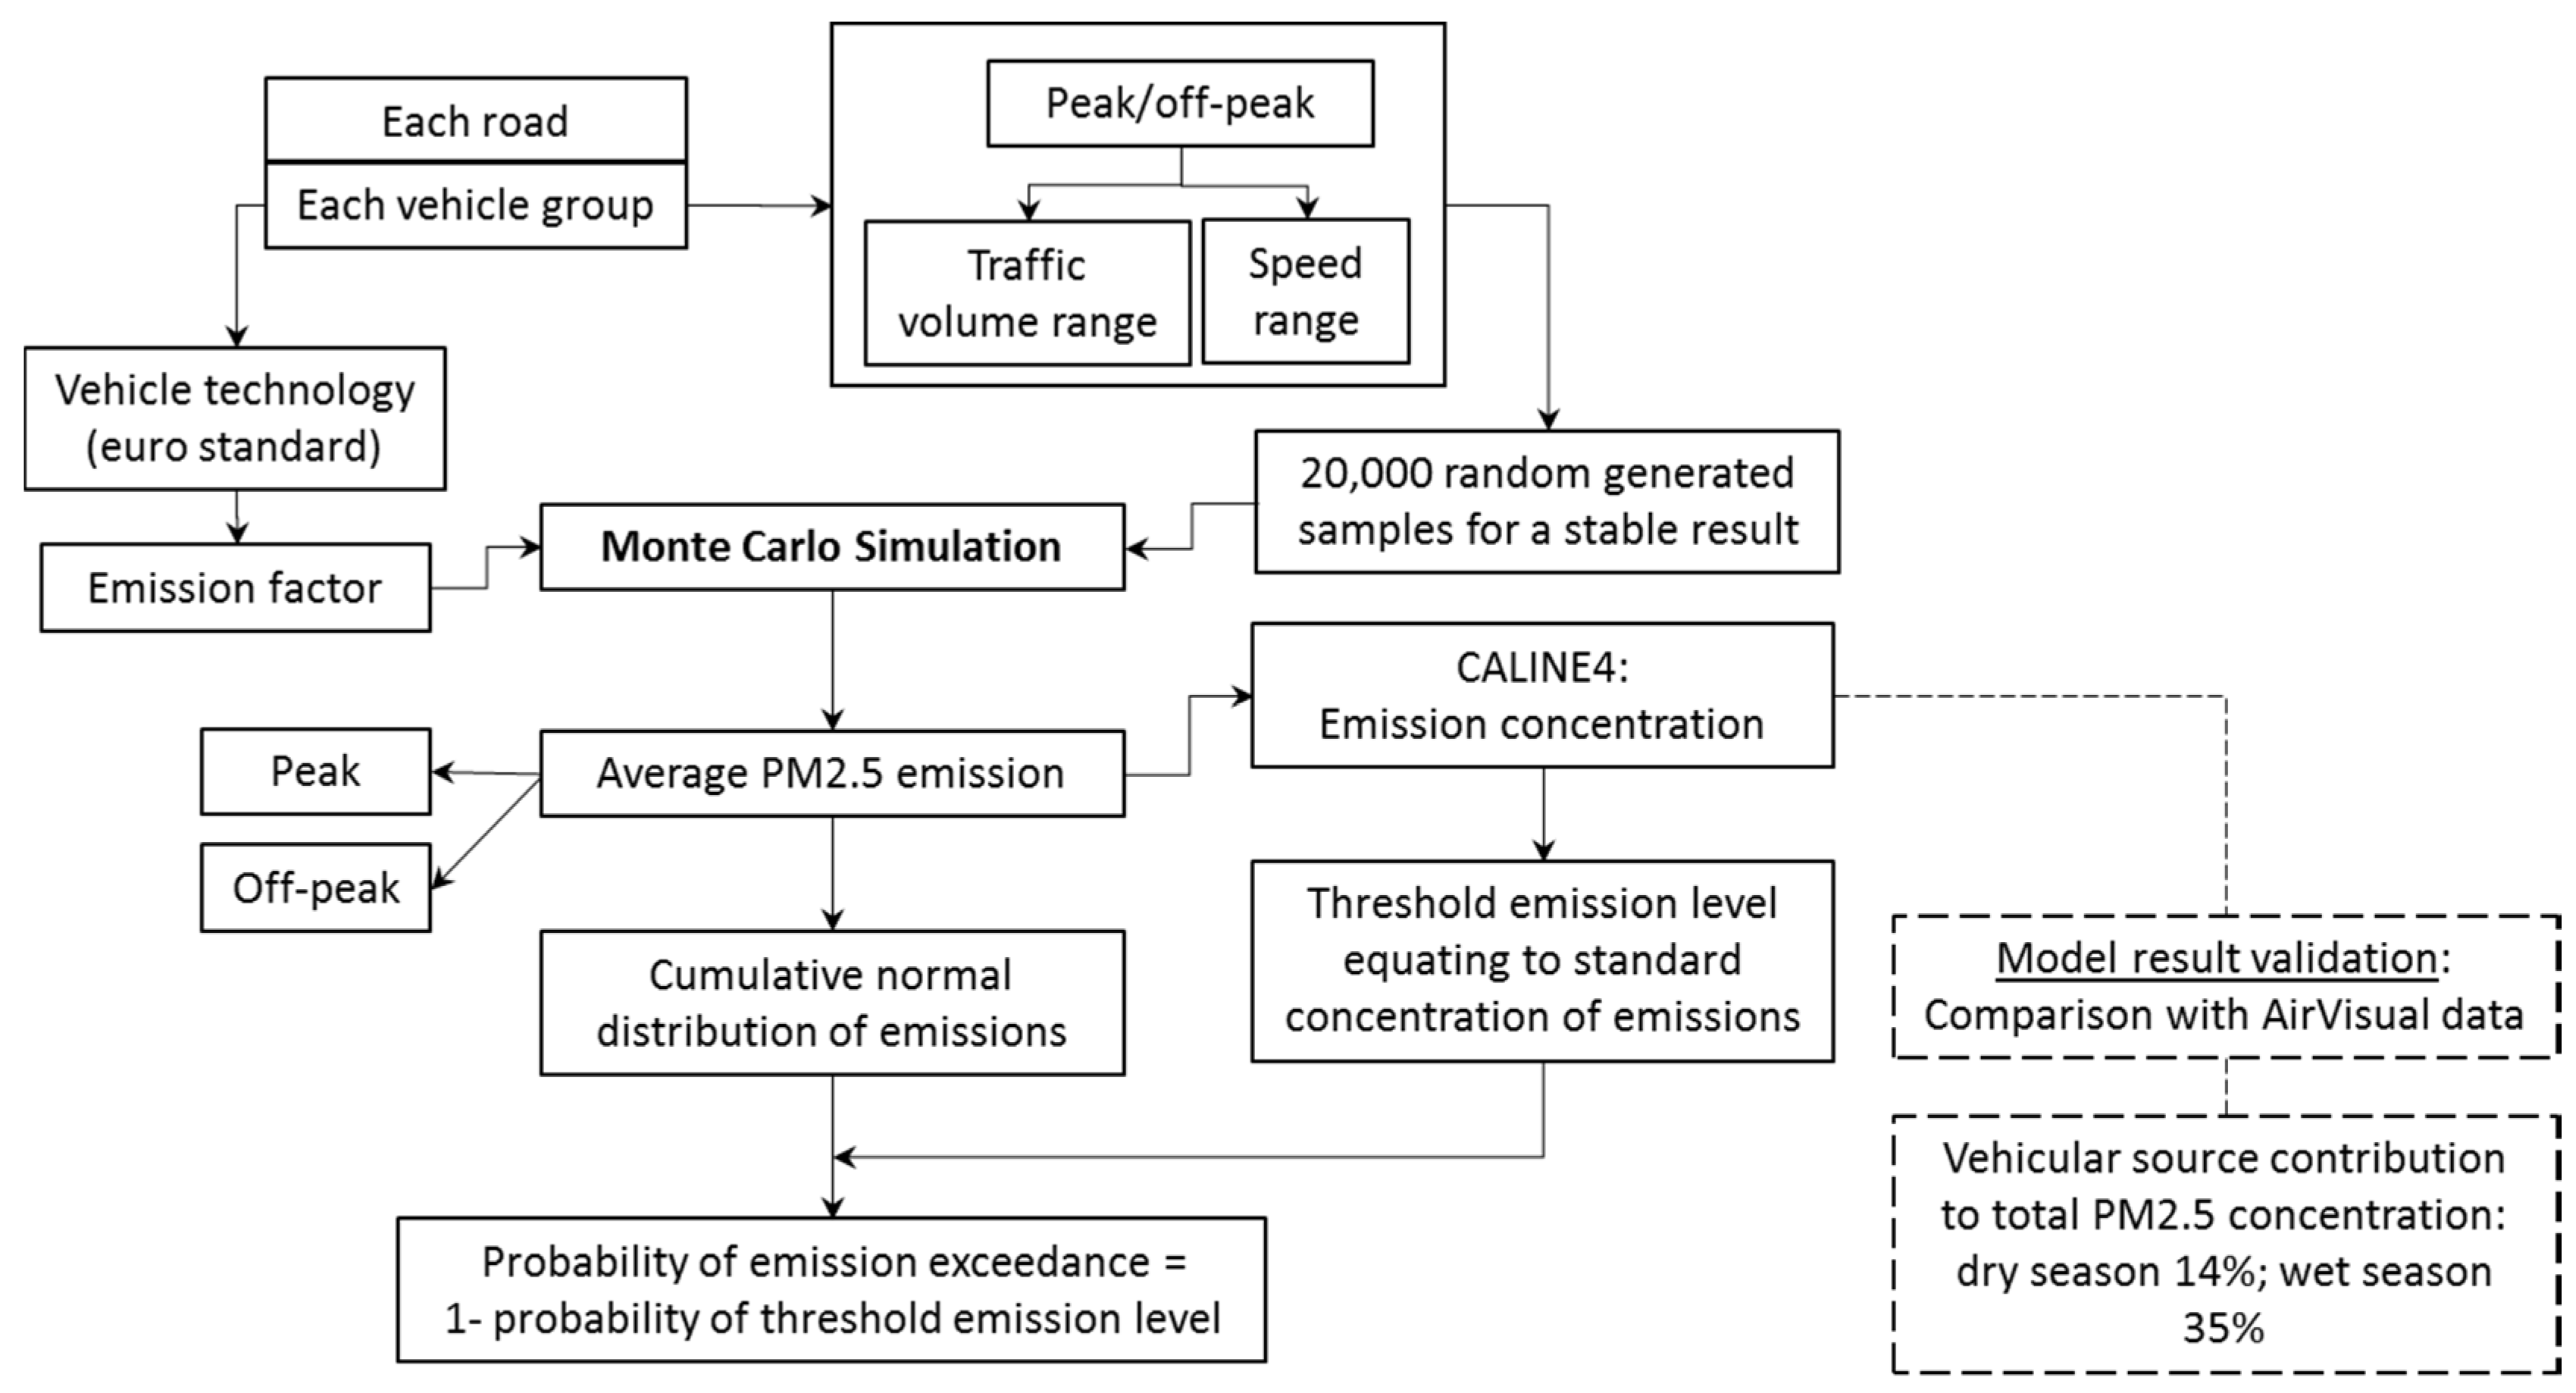
Despite not having concrete normality of data, the normal distribution function was conceived for the probabilistic analysis of PM2.5 emissions for simplicity (Equation (3)). At the same time, the risk probability was assessed concerning the probability of emissions at the standard level (Equation (4)). As a summary of the whole process, a flow diagram to evaluate the probability of exceeding threshold emissions is shown in Figure 5.
where x = PM2.5 emissions; μ = mean and σ = standard deviation of PM2.5 emissions.
In addition,
2.3. Risk Analysis
The intensity of risk is associated with the severity of the risk and the corresponding probability of obtaining that severity:
- The severity was classified in this research considering the magnitude of emissions compared to the threshold (standard) level, which is 65 µg/m3 (hourly average) for PM2.5 as per Bangladesh standard [58].
- ○
- Very severe—5: hourly emission concentration > 278 µg/m3 = AQI 200 – 300 (extremely unhealthy air quality);
- ○
- Severe—4: hourly emissions concentration > 102 µg/m3 = AQI 150 – 200 (unhealthy air quality);
- ○
- Critical—3: hourly emissions concentration > 65 µg/m3 = AQI 100 – 150 (unhealthy air quality for sensitive groups);
- ○
- Marginal—2: emissions concentration ≤ 65 µg/m3 = AQI 50 – 100 (moderate air quality);
- ○
- Negligible—1: emissions concentration < 22 µg/m3 = AQI 0 – 50 (good air quality).
- The probability of exceeding the threshold level was classified based on the percentage of probability. A general rule of scaling the probability practised in project management [87,88] was adopted for this research, which was in line with the previous research conducted on NOx probability analysis [82]; viz., probability ≥ 80% = Strong (scale 5), 60–80% = High (scale 4), 40–60% = Medium (scale 3), 10–40% = Low (scale 2), and < 10% = improbable (scale 1).
2.4. Spatial Distribution of Emissions/Risks
The emission concentrations and the severity of the risks associated with PM2.5 emissions from vehicular sources were assessed through modelling for distributed representative nodes of the city, as shown in Figure 2. Depending on the values on the scattered nodes, the spatial distribution of concentration or risk severity was assessed by using interpolation analysis (IDW) of ArcMap (ArcGIS 10.5).
3. Results and Discussions
3.1. Emissions and Their Probability
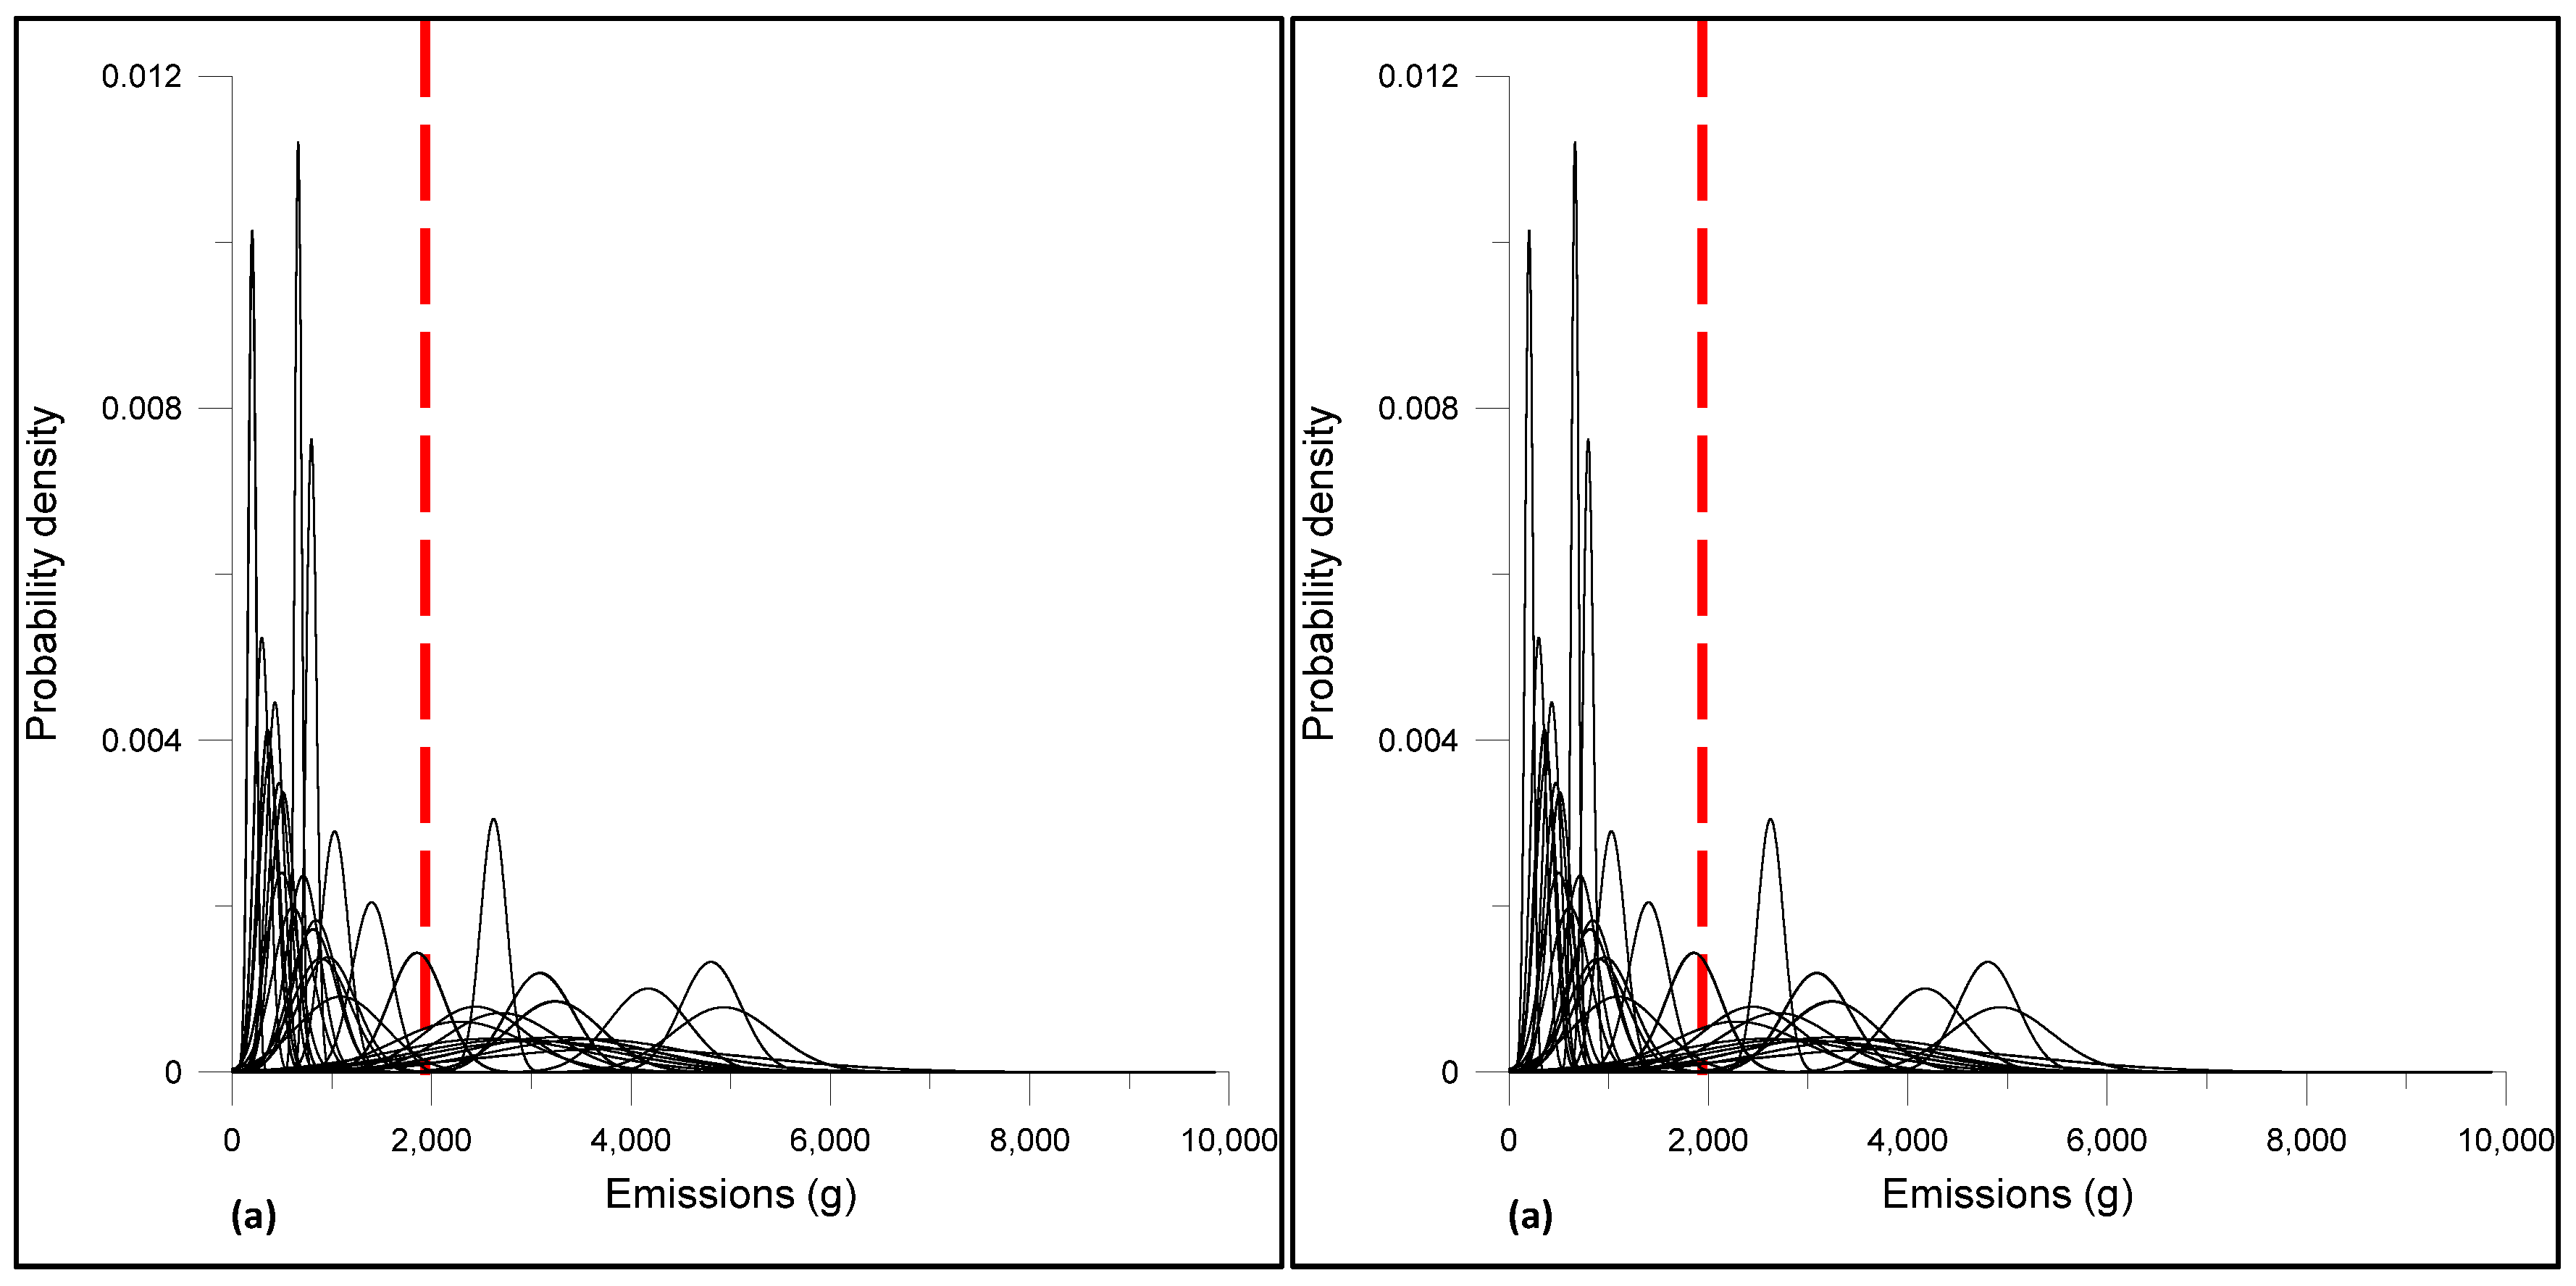
As outlined in methodology, the normal distribution and the cumulative distribution of PM2.5 emissions for each road link (46 road links) was obtained; the result for 2019 is portrayed in Figure 6. The distribution result shows that in the majority of cases higher probability would be around mean emissions, as is indicated by the peakedness of the curves (Figure 6a). As per the cumulative distribution of the emissions, a significant number of the roads (around 35%) would be susceptible to a higher probability of exceeding the threshold level (Figure 6b).
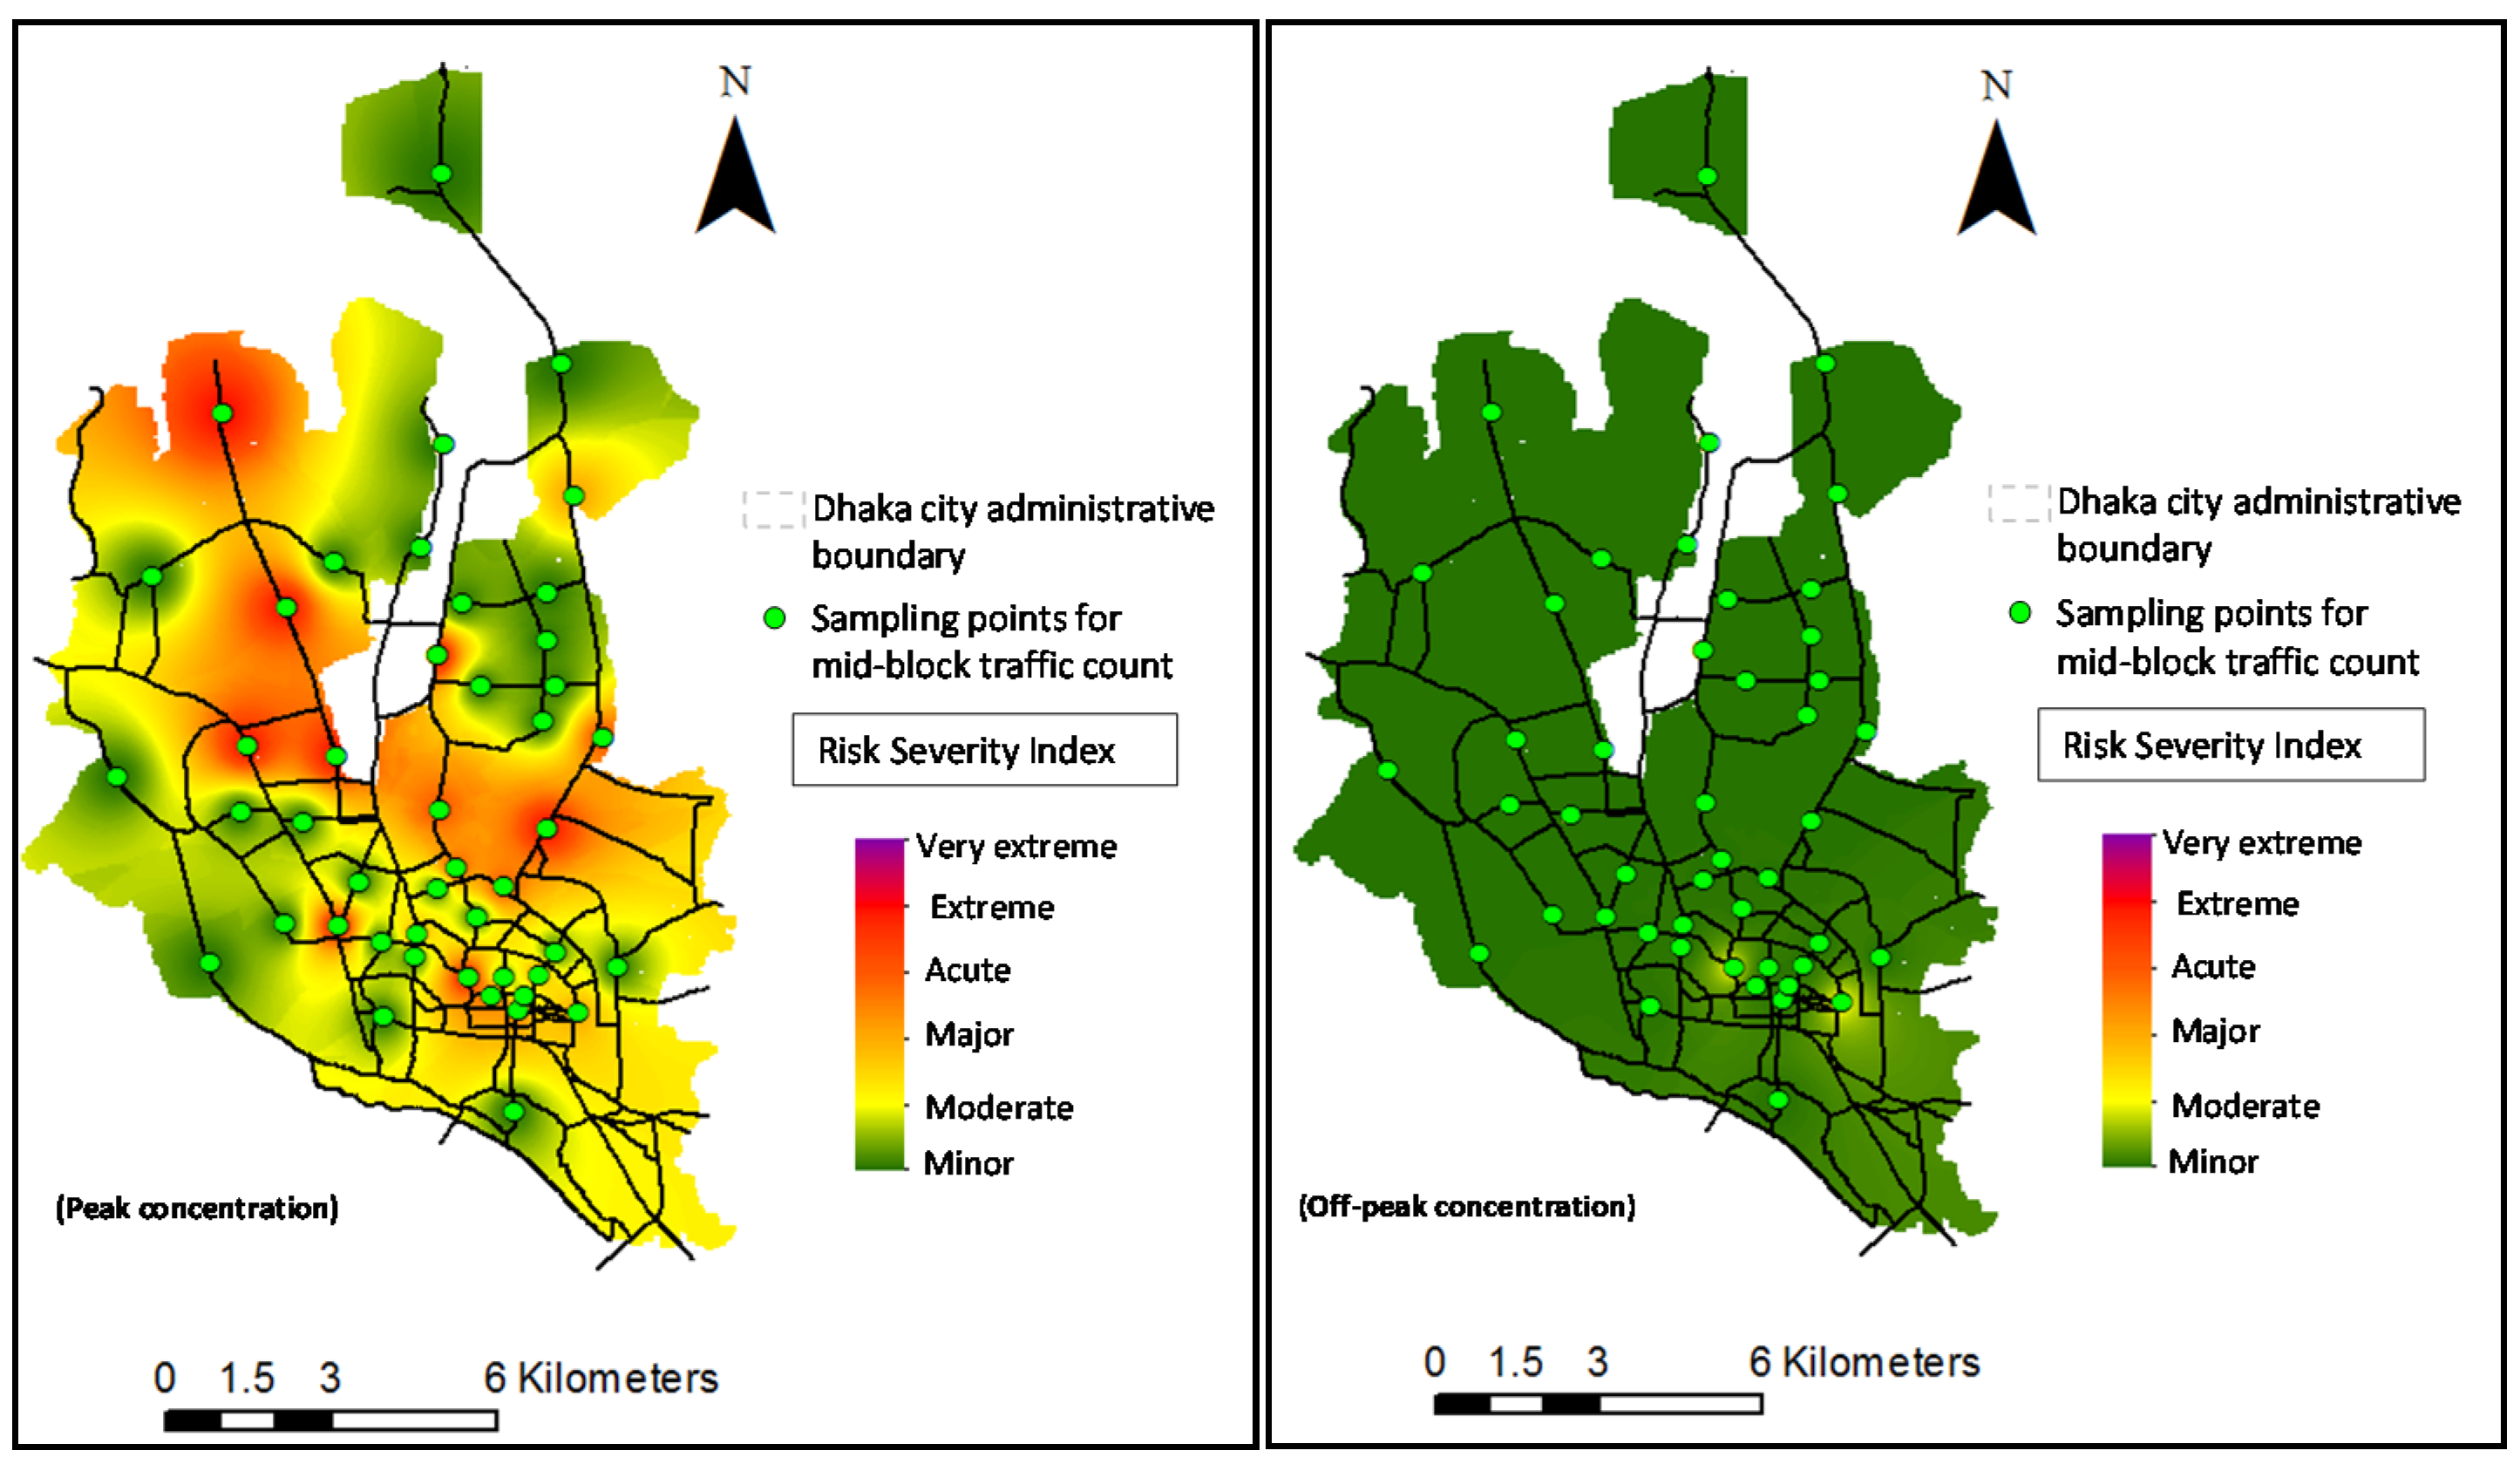
3.2. Risk Severity from Particulate Pollution
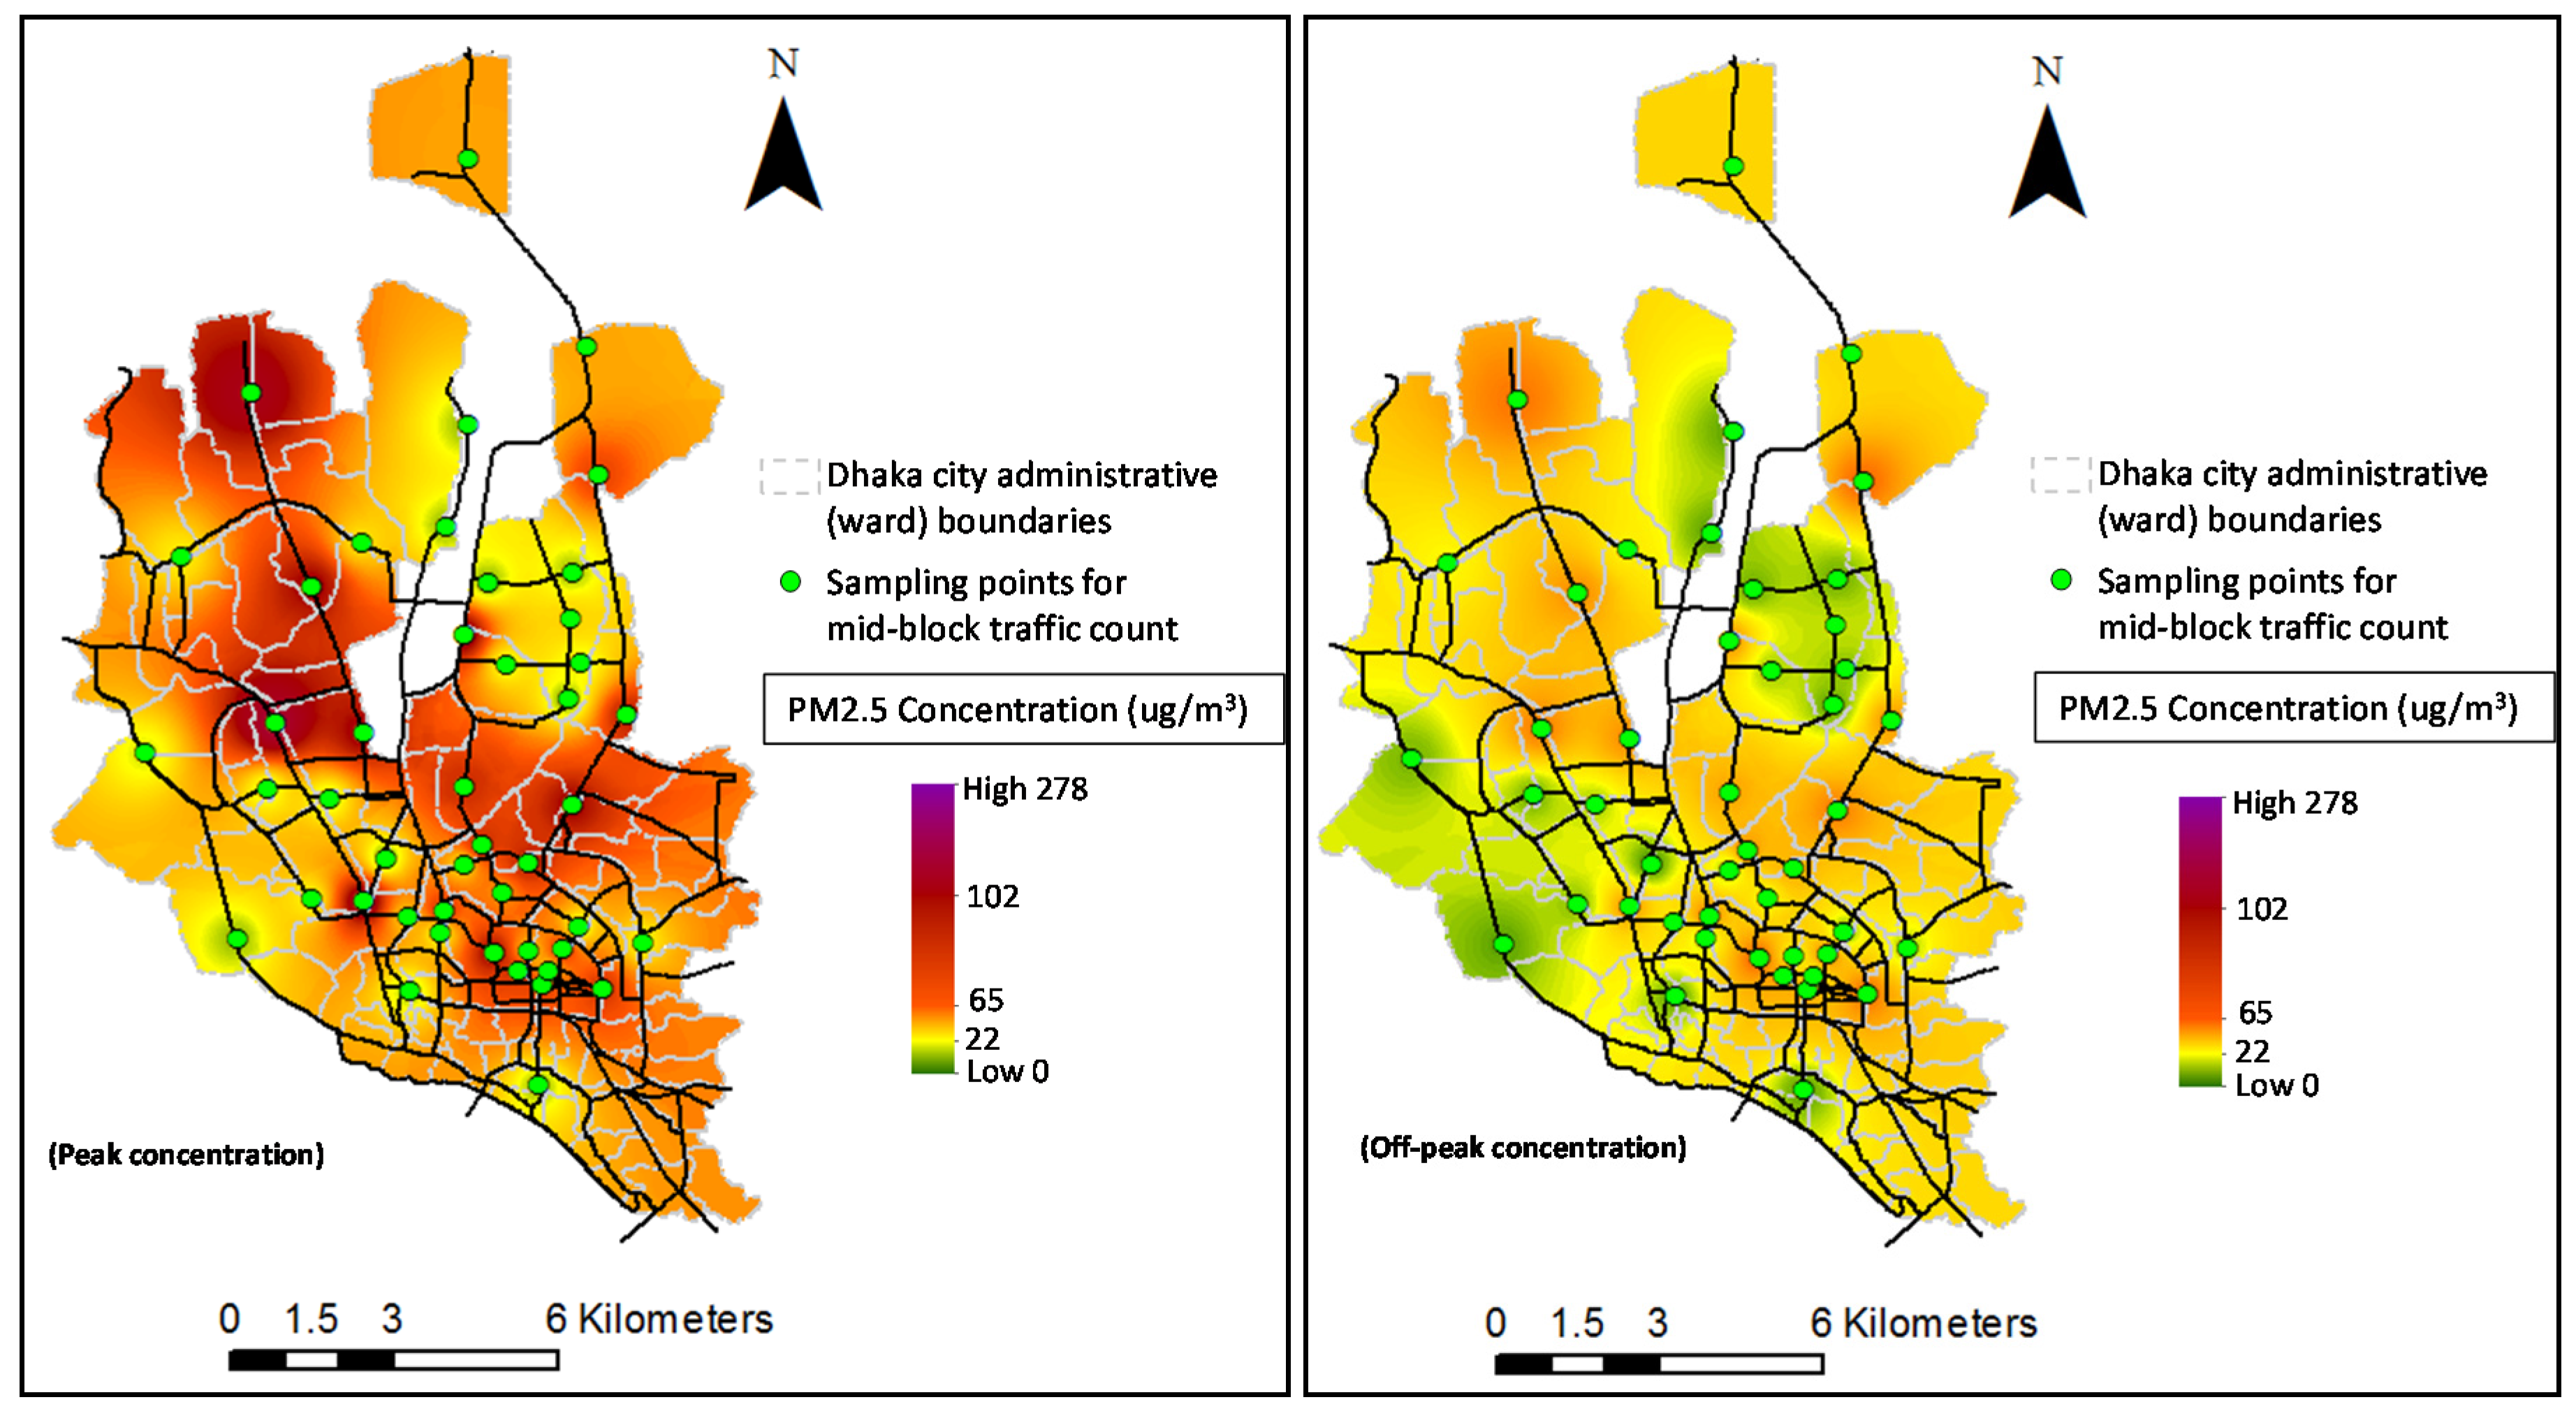
The risks of being exposed to an unhealthy air quality depend on the concentration prevailing, and therefore the PM2.5 concentration contributed from the vehicular sources was estimated. By interpolating the concentrations estimated at 46 points (locations) in the city, a spatial distribution map of PM2.5 concentrations (1-hr average) for the city was generated for both peak and off-peak periods (Figure 7). The magnitudes of concentrations were categorized according to the concentrations corresponding to AQI levels as per Bangladesh national standard (Figure 7).
Though the spatial analysis provides an approximate estimation of concentration, nevertheless, it can demonstrate the air quality hotspots of the city. While considering only the emissions from vehicles (Figure 7), inhabitants of around 10% area in Dhaka City during peak period become susceptible to a PM2.5 concentration that is unhealthy; for around 40% of areas, the exposure level is found unhealthy for sensitive groups. The exposure map for the off-peak period is indicative of cleaner air; however, about 50% of city areas is found approaching the threshold level.
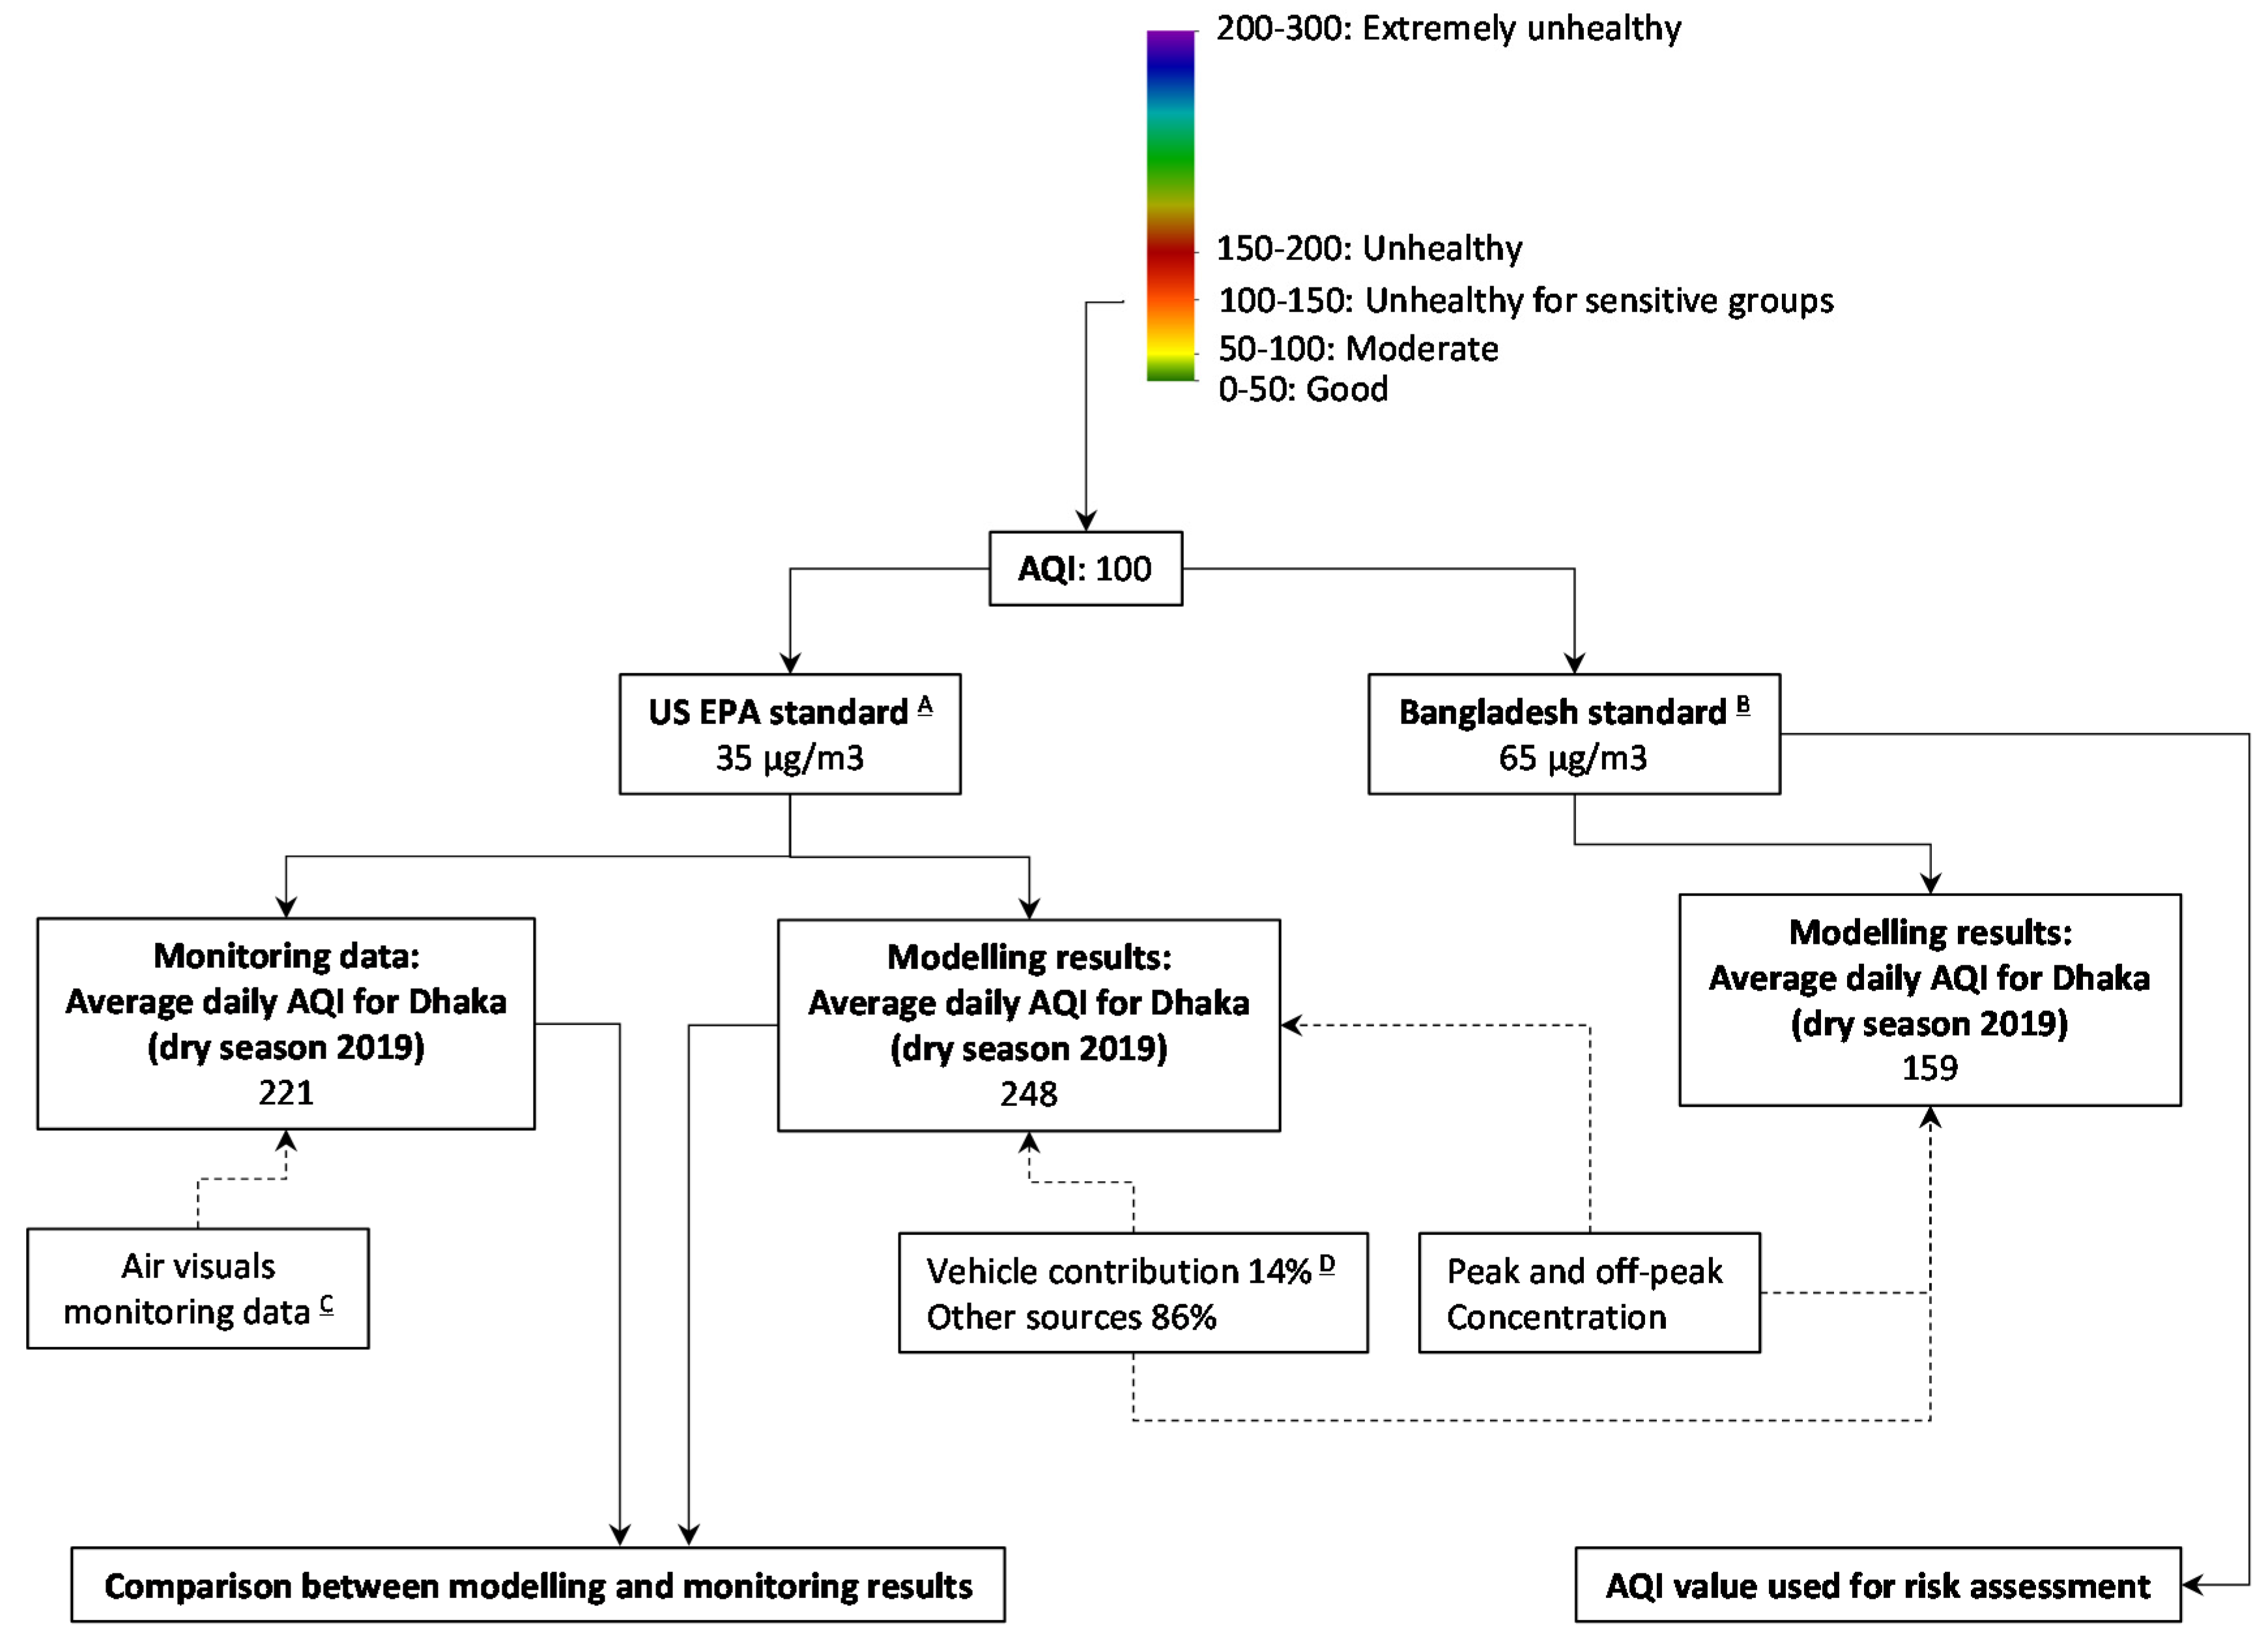
The pollution concentration level corresponds to an AQI value, which considers threshold emission levels as per the standards. AirVisuals [2] provides continuous AQI levels, based on US EPA standards, for different cities. To assess the validity of the estimations, it was important to compare the modelling result with the available AQI results provided by AirVisuals. Therefore, a total PM2.5 concentration was estimated, considering that the vehicular sources are responsible for 14% of total concentration. The assumption was made based on the source apportionment study conducted for Dhaka City by Begum and Hopke [27]. Figure 8 shows a schematic diagram of the comparison, which shows a close match between modelling and monitoring data, although the modelling slightly overestimated the AQI value (248 for modelling vs. 221 for monitoring). Considering the factors that might affect the modelling result, for example, the relative contribution of vehicles to overall pollution, and by considering the proximity or modelling and monitoring results, the model was considered acceptable for further analysis.
However, the Bangladesh national standard for PM2.5 is different from the WHO standard or the US EPA standard applied for globally demonstrated AQI. The threshold values for the same AQI level are higher as per Bangladesh standard for PM2.5 than the US EPA standards (Figure 8) (65 µg/m3 vs. 35 µg/m3 for AQI = 100). As the research was conducted for Dhaka, hence the Bangladesh national standard for PM2.5 was considered for risk severity assessment of the estimated concentration. The probability of estimated concentration was considered along with the concentration magnitude to calculate the risk intensity (as per the risk index matrix demonstrated in Section 2.3) for 2019 (Figure 9) and subsequent scenarios.
Complementing the exposure magnitude mapped in Figure 7, a significant portion of Dhaka City (about 35% area) is found to be in the acute risk zone during peak time. While the majority of the areas remaining within the safe limit during peak time, the off-peak period has not exhibited any risk induced from the vehicular PM2.5 emissions. This is due to the lower emissions level during off-peak period supported by low traffic congestion, and the lower probability of exceeding the threshold emission level during this time. In general, the data points accommodating higher commercial vehicles alongside higher congestion exhibited higher risks. Thus, the travellers/residents in the congested commercial roads/zones are susceptible to a considerable level of health risk only for vehicular emissions.
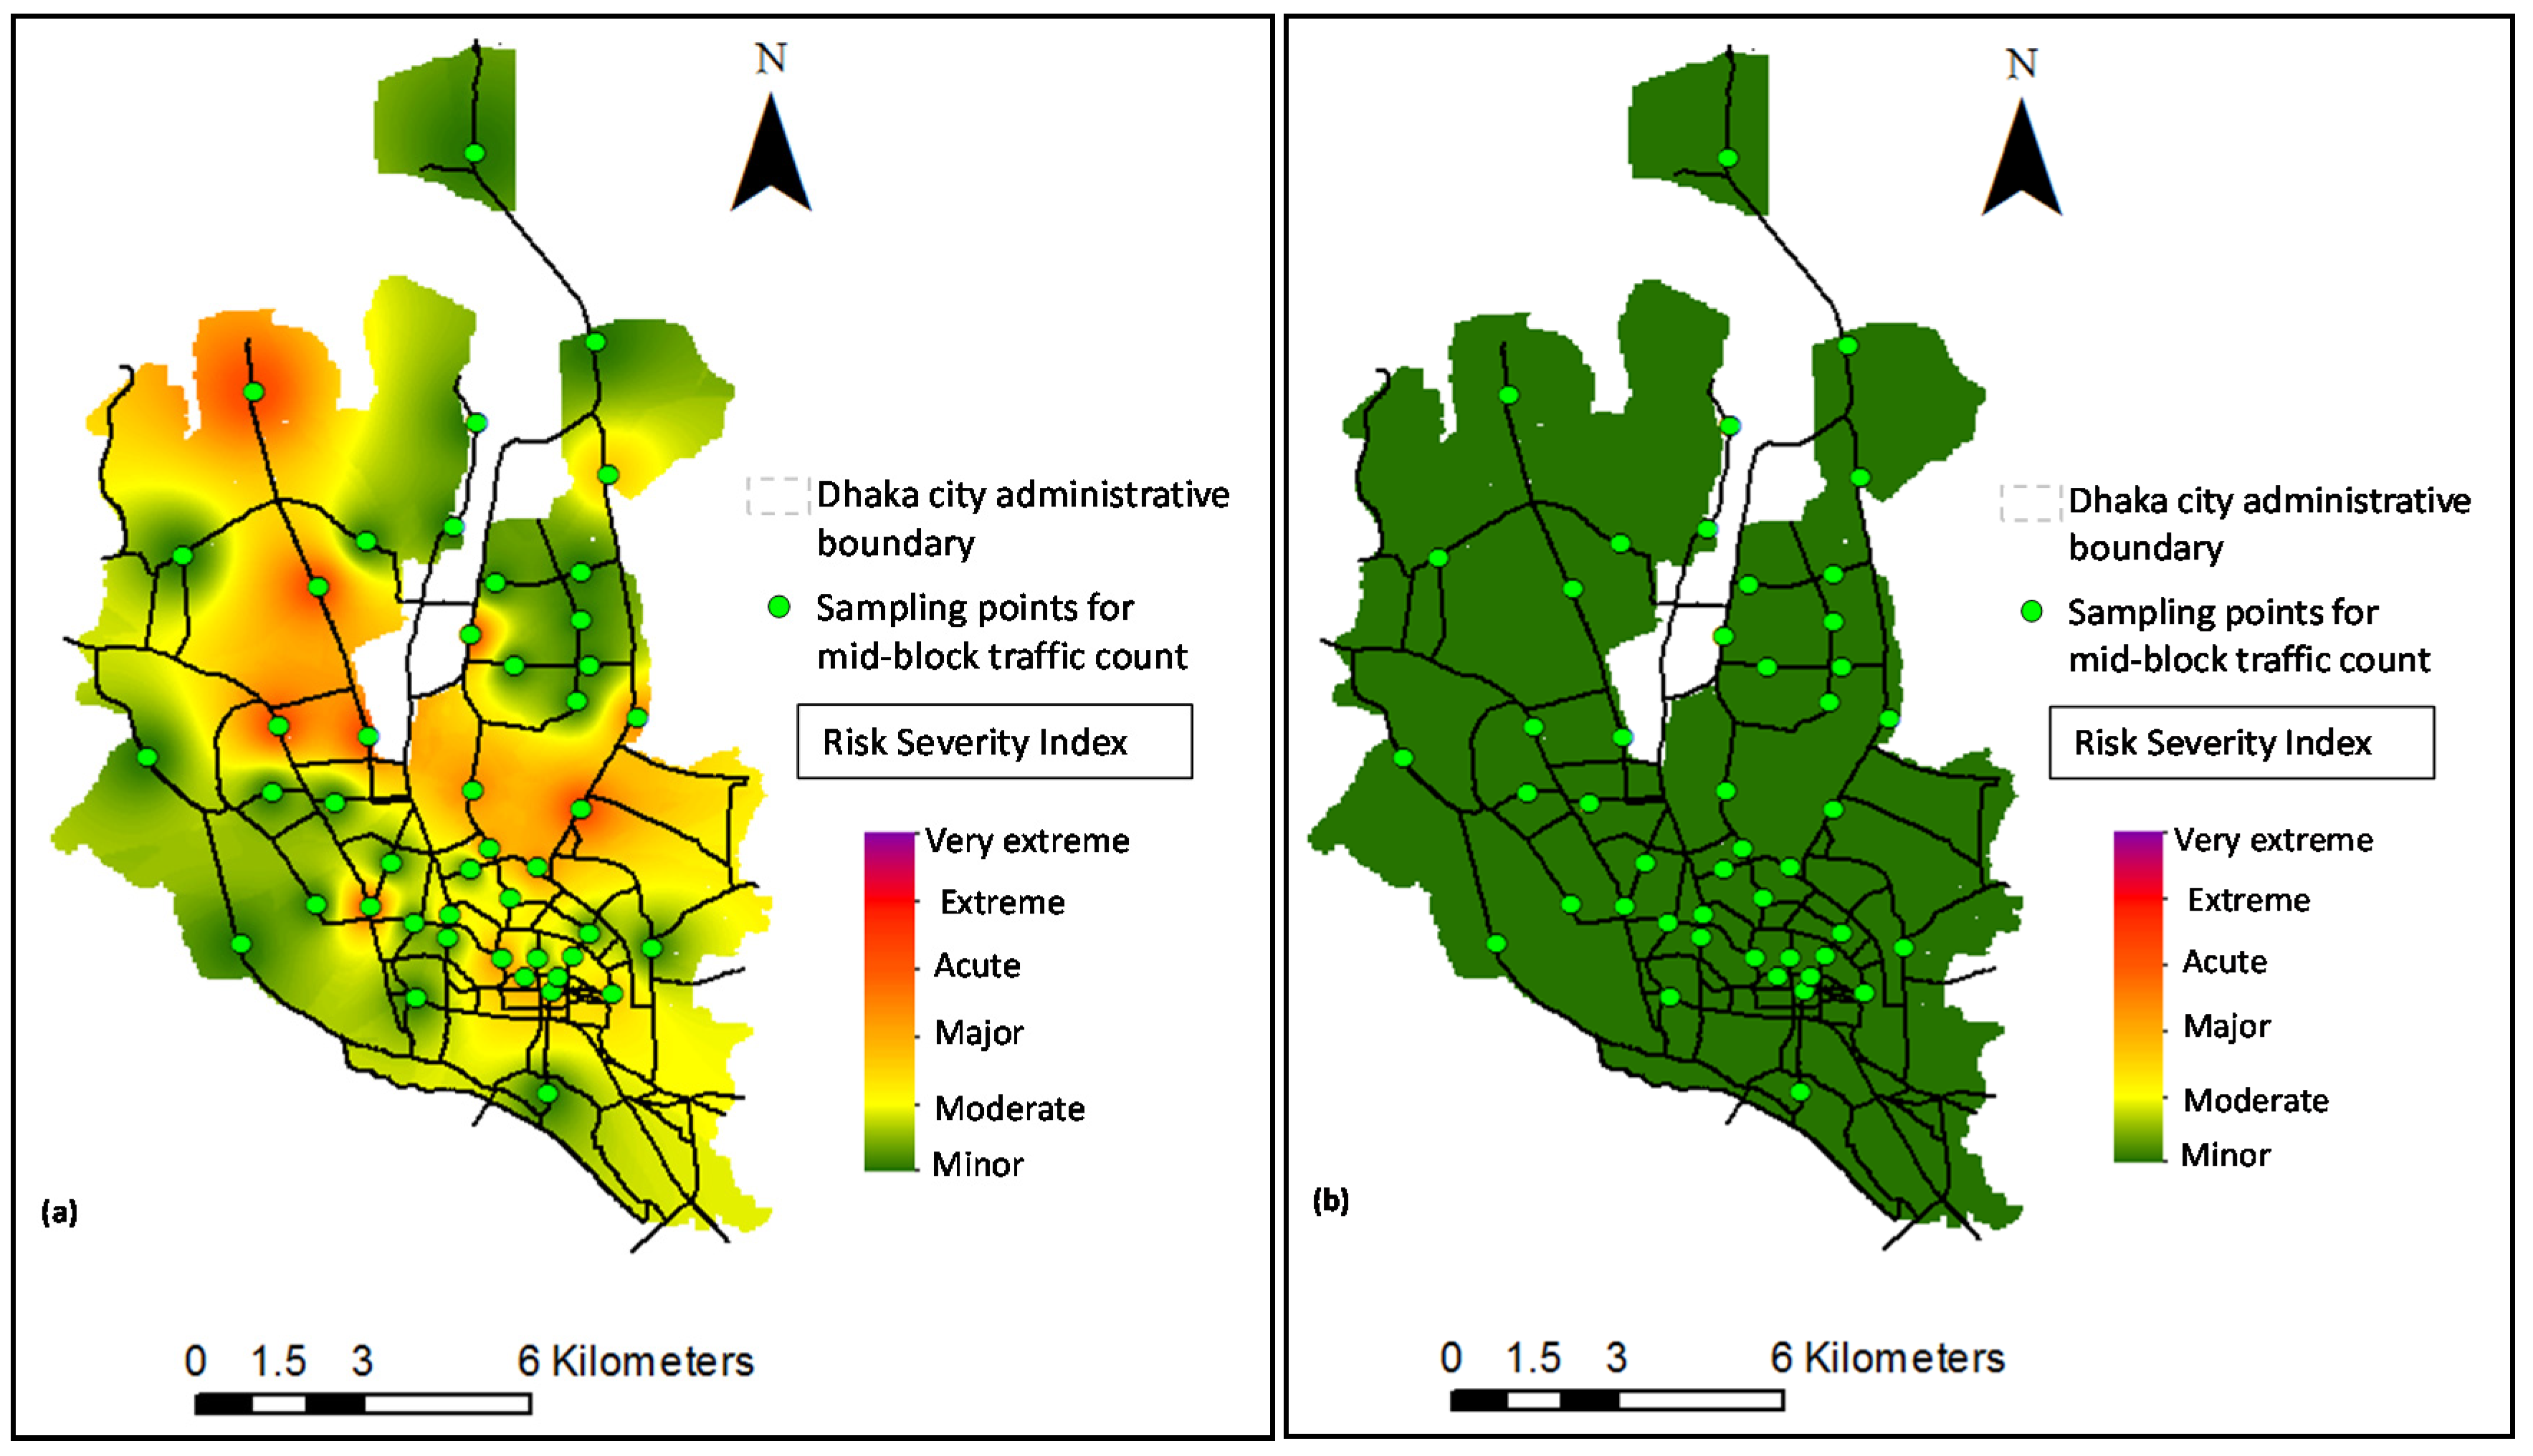
Inadequate vehicle standard policies (viz, allowing old and unfit vehicles to operate) that support a higher level of emissions from vehicles, and the unplanned growth of vehicles stimulating traffic congestion on roads, would increase the risks over the years. Considering the prevailing growth rate of vehicles supporting the existing level of congestion and the emissions standard (a ‘business-as-usual’ case), a risk scenario was assessed for 2024 (Figure 10). Although there might be reasons that can increase or decrease the magnitude of the risks, those were not considered for the scenario.
As the emissions are expected to increase in a ‘business-as-usual’ 2024 scenario, the risk projection shows that the extremely risky zones would increase to about 40% compared to a current 15%, while the inhabitants of about two-thirds of the city would undergo major health effects during peak time (Figure 10). For the off-peak period, a sign of moderate risks would appear. The relatively safer zones in the peak period are correlated to areas where vehicles with cleaner fuel operate mainly or the areas with lower congestion. This scenario analysis reveals the fact again that, unless adopting appropriate strategies to control emission rates, the vehicular sources would be capable solely for hazardous air quality in the city.
As Bangladesh authority has planned for improving the vehicle emissions standard from 2019 (euro 1 to euro 3, and euro 2 to euro 4; details is provided in Table 1) [89], the 2024 ‘business-as-usual’ scenario was modified as per the new vehicle emissions standard. The new emission standard is applicable for vehicles registered from 2019 onwards, thus a portion of vehicles would still run on old emissions standard in 2024, which was also incorporated into the scenario (Figure 11). The ratio of vehicles distributed among standards was adopted from Iqbal et al. [82], anticipating that around 50% of the commercial vehicles (more pollution generating category, Table 1) would fall under new vehicle emission standards. The growth rate of CNG vehicles would not affect the PM2.5 pollution scenario (as CNG vehicles have zero PM emission); however, the gasoline and diesel vehicles would be important for such a case. It is acknowledged that the scenarios assessed here are imaginary and might differ from the actual cases; however, this is capable of predicting a closer risk scenario for such a case.
The risk assessment for the modified 2024 ‘business-as-usual’ scenario reveals that the risk intensity would reduce in such a case. The extremely risky zones would reduce significantly (from the 2024 ‘business-as-usual’ case) though will not be eliminated, however, moderate risk intensity would dominate the city during the peak periods (Figure 11a). The off-peak period risks would be insignificant considering the result obtained in 2024 ‘business-as-usual’ scenario and thus was not portrayed here. This scenario analysis reveals the fact that applying the vehicle emission standard comprehensively might be influential to bring the risk level down, but it might not be enough for eliminating the risk.
To accommodate the growing demand for mobility and to enhance the performances of public transports in Dhaka City, new MRT and BRT corridors are underway, expected to be operational from 2024. Thus, this research intended to assess the probable scenario for that time, anticipating modal shift of travellers from private vehicles to public transport, especially for travelling to major commercial areas. To assess the scenario, the 2024 modified ‘business-as-usual’ scenario was enhanced further by reducing the expected private vehicle count by 50% for travelling to work. This would, in turn, increase the vehicle average speed, complementing the relationship provided in eq 2 (Figure 11b). The rationale of this hypothetical scenario is assessed previously by Iqbal et al. [66] and was also implemented by Iqbal et al. in NOx scenario assessment [82]. While acknowledging that the scenario might be very gross, it might provide a guideline for future management approaches through this ‘what-if’ scenario in achieving a sustainable urban health standing.
The risks scenario revealed through this hypothetical scenario predicts no risks induced due to vehicular PM2.5 emissions (Figure 11b), highlighting the significance of adopting comprehensive strategies. While the hypothesis for this scenario is ambitious, it does not suppress the fact that such uncompromising strategies might control vehicular sources to become solely capable of unhealthy air quality. Otherwise, incorporating the PM2.5 concentration contributed by other sources, the air quality would be fatal for the city dwellers.
Supporting the current vehicle growth without banning the unfit old vehicles might lead to a situation in five years (by 2024) when eliminating other sources (like banning conventional brick burning, or relocating the industries out of the city) around the city would not be enough to improve the air quality of Dhaka (Figure 10). Thus, strict improvement and implementation of the standard for emission sources, along with decentralization of facilities, might be influential approaches that need to be thought of now for the future urban health sustainability of the city.
4. Conclusions
Particulate pollution (especially the fine fraction) is a global issue and is especially important for developing countries where the emission sources remain massively uncontrolled. While there are existing research works that have assessed the particulate pollution levels along with the contributing sources, this research intended to dig further in terms of the contribution from vehicular sources by modelling what-if scenarios. A probabilistic approach supported by stochastic modelling was incorporated with the conventional emission modelling approach to assess the urban health risks, which is believed to produce results with lesser uncertainty.
The analysis pointed to the fact that the uncontrolled emissions from older vehicles in highly congested roads are susceptible to an extremely risky urban health standing. At current practise, about 35% of the city falls under the acute risk zone (very high probability of unhealth air quality) during the day only for vehicular PM emissions. If the current practise persists, about 60% of the city would fall under acute risk zone in five years (by 2024). The risk projection shows that more than 40% of the city would fall under the extreme-risk zone (strong probability of very unhealthy air quality) in 2024, compared to current 15%. If the improved vehicle emission standard (as planned by the government) is implemented now, it would be able to revert the risk but still 30% of the city would fall under major-risk zone (high probability of unhealthy air for sensitive groups). An integrated approach of better traffic management to reduce the congestion along with the emission standard might revert the risk completely, and the city has the potentiality to adopt that considering the future public transport planning to support the mobility. Although it is difficult to implement aggressive policies in the city considering the continuous socio-economic progression, more aggressive strategies at a later stage would be more socio-economically unacceptable.
However, the risks mentioned above is only resulting from the vehicular sources, and if the other sources prevail as it is, the air quality would be fatal if appropriate measures are not taken now. This is been indicated by the current trend of air quality in Dhaka, positioning the city among the toppers of the most polluted cities. Although the researchers estimated the air quality based on vehicular sources only, it indicated a critical urban health environment prevailing in Dhaka City. This creates the opportunity for further research, where the probabilistic contribution of all the sources can be incorporated, and thus the management approaches can be illustrated for each source separately.
Author Contributions
“Conceptualization, A.I. and M.M.R.; methodology, A.I. and S.A.; software, A.I. and M.M.R.; validation, S.A. and A.I.; formal analysis, A.I.; resources, M.M.R. and A.I.; data curation, S.A.; writing—original draft preparation, A.I.; writing—review and editing, A.I., S.A. and M.M.R.; visualization, A.I. All authors have read and agreed to the published version of the manuscript.”
Funding
This research received no external funding.
Conflicts of Interest
The authors declare no conflicts of interest.
References
- Roy, S.; Sowgat, T.; Mondal, J. City Profile: Dhaka, Bangladesh. Environ. Urban. ASIA 2019, 10, 216–232. [Google Scholar] [CrossRef]
- WAQI. Air Pollution: Real-Time Air Quality Index (AQI). 2020. Available online: https://aqicn.org/city/bangladesh/dhaka/us-consulate/ (accessed on 1 May 2020).
- Yang, H.H.; Arafath, S.M.; Lee, K.T.; Hsieh, Y.S.; Han, Y.T. Chemical characteristics of filterable and condensable PM2.5 emissions from industrial boilers with five different fuels. Fuel 2018, 232, 415–422. [Google Scholar] [CrossRef]
- Hama, S.M.L.; Kumar, P.; Harrison, R.M.; Bloss, W.J.; Khare, M.; Mishra, S.; Namdeo, A.; Sokhi, R.; Goodman, P.; Sharma, C. Four-year assessment of ambient particulate matter and trace gases in the Delhi-NCR region of India. Sustain. Cities Soc. 2020, 54, 102003. [Google Scholar] [CrossRef]
- Wu, J.Z.; Ge, D.D.; Zhou, L.F.; Hou, L.Y.; Zhou, Y.; Li, Q.Y. Effects of particulate matter on allergic respiratory diseases. Chronic Dis. Transl. Med. 2018, 4, 95–102. [Google Scholar] [CrossRef]
- Karakatsani, A.; Analitis, A.; Perifanou, D.; Ayres, J.G.; Harrison, R.M.; Kotronarou, A.; Kavouras, I.G.; Pekkanen, J.; Hämeri, K.; Kos, G.P.; et al. Particulate matter air pollution and respiratory symptoms in individuals having either asthma or chronic obstructive pulmonary disease: A European multicentre panel study. Environ. Health 2012, 11, 75. [Google Scholar] [CrossRef] [Green Version]
- Pani, S.K.; Chantara, S.; Khamkaew, C.; Lee, C.T.; Lin, N.H. Biomass burning in the northern peninsular Southeast Asia: Aerosol chemical profile and potential exposure. Atmos. Res. 2019, 224, 180–195. [Google Scholar] [CrossRef] [Green Version]
- BTRE. Health Impacts of Transport Emissions in Australia: Economic Costs; Bureau of Transport and Regional Economics: Canberra, Australia, 2005.
- WHO. Health Effects of Transport-Related Air Pollution: Summary for Policy Makers; WHO Regional Office for Europe: Geneva, Switzerland, 2005. [Google Scholar]
- Cheng, Z.; Jiang, J.; Fajardo, O.; Wang, S.; Hao, J. Characteristics and health impacts of particulate matter pollution in China (2001–2011). Atmos. Environ. 2013, 65, 186–194. [Google Scholar] [CrossRef]
- Guttikunda, S.K.; Kopakka, R.V. Source emissions and health impacts of urban air pollution in Hyderabad, India. Air Qual. Atmos. Health 2014, 7, 195–207. [Google Scholar] [CrossRef]
- Guttikunda, S.K.; Goel, R. Health impacts of particulate pollution in a megacity—Delhi, India. Environ. Dev. 2013, 6, 8–20. [Google Scholar] [CrossRef]
- Brugha, R.; Grigg, J. Urban air pollution and respiratory infections. Paediatr. Respir. Rev. 2014, 15, 194–199. [Google Scholar] [CrossRef]
- Kelly, F.J.; Fussell, J.C. Air pollution and public health: Emerging hazards and improved understanding of risk. Environ. Geochem. Health 2015, 37, 631–649. [Google Scholar] [CrossRef] [PubMed] [Green Version]
- Cohen, A.J.; Brauer, M.; Burnett, R.; Anderson, H.R.; Frostad, J.; Estep, K.; Balakrishnan, K.; Brunekreef, B.; Dandona, L.; Dandona, R.; et al. Estimates and 25-year trends of the global burden of disease attributable to ambient air pollution: An analysis of data from the Global Burden of Diseases Study 2015. Lancet 2017, 389, 1907–1918. [Google Scholar] [CrossRef] [Green Version]
- De Miranda, R.M.; Andrade, M.d.; Fornaro, A.; Astolfo, R.; de Andre, P.A.; Saldiva, P. Urban air pollution: A representative survey of PM2.5 mass concentrations in six Brazilian cities. Air Qual. Atmos. Health 2012, 5, 63–77. [Google Scholar] [CrossRef] [Green Version]
- Janssen, N.A.H.; Hoek, G.; Simic-Lawson, M.; Fischer, P.; van Bree, L.; Brink, H.T.; Keuken, M.; Atkinson, R.W.; Anderson, H.R.; Brunekreef, B.; et al. Black Carbon as an Additional Indicator of the Adverse Health Effects of Airborne Particles Compared with PM10 and PM2.5. Environ. Health Perspect. 2011, 119, 1691–1699. [Google Scholar] [CrossRef] [PubMed] [Green Version]
- Chuang, K.J.; Yan, Y.H.; Chiu, S.Y.; Cheng, T.J. Long-term air pollution exposure and risk factors for cardiovascular diseases among the elderly in Taiwan. Occup. Environ. Med. 2011, 68, 64–68. [Google Scholar] [CrossRef] [PubMed]
- Grahame, T.J.; Klemm, R.; Schlesinger, R.B. Public health and components of particulate matter: The changing assessment of black carbon. J. Air Waste Manag. Assoc. 2014, 64, 620–660. [Google Scholar] [CrossRef] [PubMed]
- WCED, Our common future. UN World Commission on Environment and Development; Oxford University Press: Oxford, UK, 1987; pp. 1–91. [Google Scholar]
- Bentley, M. An ecological public health approach to understanding the relationships between sustainable urban environments, public health and social equity. Health Promot. Int. 2014, 29, 528–537. [Google Scholar] [CrossRef] [PubMed] [Green Version]
- Goldman, T.; Gorham, R. Sustainable urban transport: Four innovative directions. Technol. Soc. 2006, 28, 261–273. [Google Scholar] [CrossRef]
- Harpham, T.; Werna, E. Sustainable urban health in developing countries. Habitat Int. 1996, 20, 421–429. [Google Scholar] [CrossRef]
- Holden, E.; Linnerud, K.; Banister, D. Sustainable development: Our Common Future revisited. Glob. Environ. Chang. 2014, 26, 130–139. [Google Scholar] [CrossRef] [Green Version]
- Begum, B.A.; Biswas, S.K.; Markwitz, A.; Hopke, P.K. Identification of sources of fine and coarse particulate matter in Dhaka, Bangladesh. Aerosol Air Qual. Res. 2010, 10, 345–353. [Google Scholar] [CrossRef]
- Begum, B.A.; Hopke, P.K.; Markwitz, A. Air pollution by fine particulate matter in Bangladesh. Atmos. Pollut. Res. 2013, 4, 75–86. [Google Scholar] [CrossRef] [Green Version]
- Begum, B.A.; Hopke, P.K. Ambient air quality in Dhaka Bangladesh over two decades: Impacts of policy on air quality. Aerosol Air Qual. Res. 2018, 18, 1910–1920. [Google Scholar] [CrossRef] [Green Version]
- Mahmood, A.; Hu, Y.; Nasreen, S.; Hopke, P.K. Airborne particulate pollution measured in Bangladesh from 2014 to 2017. Aerosol Air Qual. Res. 2019, 19, 272–281. [Google Scholar] [CrossRef]
- Guttikunda, S.K.; Begum, B.A.; Wadud, Z. Particulate pollution from brick kiln clusters in the Greater Dhaka region, Bangladesh. Air Qual. Atmos. Health 2013, 6, 357–365. [Google Scholar] [CrossRef]
- Haque, M.I.; Nahar, K.; Kabir, M.H.; Salam, A. Particulate black carbon and gaseous emission from brick kilns in Greater Dhaka region, Bangladesh. Air Qual. Atmos. Health 2018, 11, 925–935. [Google Scholar] [CrossRef]
- Begum, B.A.; Hopke, P.K. Identification of sources from chemical characterization of fine particulate matter and assessment of ambient air quality in Dhaka, Bangladesh. Aerosol Air Qual. Res. 2019, 19, 118–128. [Google Scholar] [CrossRef] [Green Version]
- Iqbal, A.; Oanh, N.T.K. Assessment of acid deposition over Dhaka division using CAMx-MM5 modeling system. Atmos. Pollut. Res. 2011, 2, 452–462. [Google Scholar] [CrossRef] [Green Version]
- Bano, S.; Pervez, S.; Chow, J.C.; Matawle, J.L.; Watson, J.G.; Sahu, R.K.; Srivastava, A.; Tiwari, S.; Pervez, Y.F.; Deb, M.K. Coarse particle (PM10–2.5) source profiles for emissions from domestic cooking and industrial process in Central India. Sci. Total Environ. 2018, 627, 1137–1145. [Google Scholar] [CrossRef]
- Rana, M.M.; Sulaiman, N.; Sivertsen, B.; Khan, M.F.; Nasreen, S. Trends in atmospheric particulate matter in Dhaka, Bangladesh, and the vicinity. Environ. Sci. Pollut. Res. 2016, 23, 17393–17403. [Google Scholar] [CrossRef]
- Bluett, J.; Dey, K.; Fisher, G. Assessing Vehicle Air Pollution Emissions; National Institute for Water and Atmospheric Research: Auckland, New Zealand, 2008. [Google Scholar]
- Cao, X.; Yao, Z.; Shen, X.; Ye, Y.; Jiang, X. On-road emission characteristics of VOCs from light-duty gasoline vehicles in Beijing, China. Atmos. Environ. 2016, 124, 146–155. [Google Scholar] [CrossRef]
- Cui, L.; Wang, X.L.; Ho, K.F.; Gao, Y.; Liu, C.; Ho, S.S.H.; Li, H.W.; Lee, S.C.; Wang, X.M.; Jiang, B.Q.; et al. Decrease of VOC emissions from vehicular emissions in Hong Kong from 2003 to 2015: Results from a tunnel study. Atmos. Environ. 2018, 177, 64–74. [Google Scholar] [CrossRef]
- EPA. Vehicle Emissions and Air Quality. 2019. Available online: https://www.epa.vic.gov.au/your-environment/air/vehicle-emissions-and-air-quality (accessed on 14 August 2019).
- Gong, M.; Yin, S.; Gu, X.; Xu, Y.; Jiang, N.; Zhang, R. Refined 2013-based vehicle emission inventory and its spatial and temporal characteristics in Zhengzhou, China. Sci. Total Environ. 2017, 599, 1149–1159. [Google Scholar] [CrossRef] [PubMed]
- Goyal, P.; Mishra, D.; Kumar, A. Vehicular emission inventory of criteria pollutants in Delhi. SpringerPlus 2013, 2, 216. [Google Scholar] [CrossRef] [PubMed] [Green Version]
- Hassler, B.; McDonald, B.C.; Frost, G.J.; Borbon, A.; Carslaw, D.C.; Civerolo, K.; Granier, C.; Monks, P.S.; Monks, S.; Parrish, D.D.; et al. Analysis of long-term observations of NOxand CO in megacities and application to constraining emissions inventories. Geophys. Res. Lett. 2016, 43, 9920–9930. [Google Scholar] [CrossRef] [Green Version]
- Li, B.; Ho, S.S.H.; Xue, Y.; Huang, Y.; Wang, L.; Cheng, Y.; Dai, W.; Zhong, H.; Cao, J.; Lee, S. Characterizations of volatile organic compounds (VOCs) from vehicular emissions at roadside environment: The first comprehensive study in Northwestern China. Atmos. Environ. 2017, 161, 1–12. [Google Scholar] [CrossRef] [Green Version]
- Zhang, S.; Wu, Y.; Liu, H.; Wu, X.; Zhou, Y.; Yao, Z.; Fu, L.; He, K.; Hao, J. Historical evaluation of vehicle emission control in Guangzhou based on a multi-year emission inventory. Atmos. Environ. 2013, 76, 32–42. [Google Scholar] [CrossRef]
- Iqbal, A.; Allan, A.; Zito, R. Meso-scale on-road vehicle emission inventory approach: A study on Dhaka City of Bangladesh supporting the cause-effect’ analysis of the transport system. Environ. Monit. Assess. 2016, 188, 149. [Google Scholar] [CrossRef]
- Zhao, T.; Yang, L.; Huang, Q.; Zhang, W.; Duan, S.; Gao, H.; Wang, W. PM2.5-bound polycyclic aromatic hydrocarbons (PAHs) and nitrated-PAHs (NPAHs) emitted by gasoline vehicles: Characterization and health risk assessment. Sci. Total Environ. 2020, 727, 138631. [Google Scholar] [CrossRef]
- Singh, V.; Biswal, A.; Kesarkar, A.P.; Mor, S.; Ravindra, K. High resolution vehicular PM10 emissions over megacity Delhi: Relative contributions of exhaust and non-exhaust sources. Sci. Total Environ. 2020, 699, 134273. [Google Scholar] [CrossRef]
- Papadopoulos, G.; Ntziachristos, L.; Tziourtzioumis, C.; Keramydas, C.; Lo, T.S.; Ng, K.L.; Wong, H.L.A.; Wong, C.K.-L. Real-world gaseous and particulate emissions from Euro IV to VI medium duty diesel trucks. Sci. Total Environ. 2020, 731, 139137. [Google Scholar] [CrossRef] [PubMed]
- Pant, P.; Harrison, R.M. Estimation of the contribution of road traffic emissions to particulate matter concentrations from field measurements: A review. Atmos. Environ. 2013, 77, 78–97. [Google Scholar] [CrossRef]
- Mitchell, R.; Maher, B.A. Evaluation and application of biomagnetic monitoring of traffic-derived particulate pollution. Atmos. Environ. 2009, 43, 2095–2103. [Google Scholar] [CrossRef]
- Li, Y.; Xiang, R. Particulate pollution in an underground car park in Wuhan, China. Particuology 2013, 11, 94–98. [Google Scholar] [CrossRef]
- Lawrence, S.; Sokhi, R.; Ravindra, K. Quantification of vehicle fleet PM 10 particulate matter emission factors from exhaust and non-exhaust sources using tunnel measurement techniques. Environ. Pollut. 2016, 210, 419–428. [Google Scholar] [CrossRef]
- Kontses, A.; Ntziachristos, L.; Zardini, A.A.; Papadopoulos, G.; Giechaskiel, B. Particulate emissions from L-Category vehicles towards Euro 5. Environ. Res. 2020, 182, 109071. [Google Scholar] [CrossRef]
- Ketzel, M.; Omstedt, G.; Johansson, C.; Düring, I.; Pohjola, M.; Oettl, D.; Gidhagen, L.; Wåhlin, P.; Lohmeyer, A.; Haakana, M.; et al. Estimation and validation of PM2.5/PM10 exhaust and non-exhaust emission factors for practical street pollution modelling. Atmos. Environ. 2007, 41, 9370–9385. [Google Scholar] [CrossRef]
- Al-Thani, H.; Koç, M.; Fountoukis, C.; Isaifan, R.J. Evaluation of particulate matter emissions from non-passenger diesel vehicles in Qatar. J. Air Waste Manag. Assoc. 2020, 70, 228–242. [Google Scholar] [CrossRef]
- Andreão, W.L.; Alonso, M.F.; Kumar, P.; Pinto, J.A.; Pedruzzi, R.; De Almeida Albuquerque, T.T. Top-down vehicle emission inventory for spatial distribution and dispersion modeling of particulate matter. Environ. Sci. Pollut. Res. 2020. [Google Scholar] [CrossRef]
- Huy, L.N.; Oanh, N.T.K.; Htut, T.T.; Hlaing, O.M.T. Emission inventory for on-road traffic fleets in Greater Yangon, Myanmar. Atmos. Pollut. Res. 2020, 11, 702–713. [Google Scholar] [CrossRef]
- WHO. WHO Air Quality Guidelines for Particulate Matter, Ozone, Nitrogen Dioxide and Sulfur Dioxide; World Health Organization: Geneva, Switzerland, 2006. [Google Scholar]
- DoE. Ambient air quality in Bangladesh. In Clean Air and Sustainable Environment Project; Department of Environment: Dhaka, Bangladesh, 2018. [Google Scholar]
- EPA. Air Quality Index: A Guide to Air Quality and Your Health; U.S. Environmental Protection Agency: Washington, DC, USA, 2014.
- IQAir. Explore the Air Quality: Live City Ranking. 2020. Available online: https://www.iqair.com/ (accessed on 14 May 2020).
- BRTA. Registered Vehicles in Dhaka: Statistics. 2020. Available online: www.brta.gov.bd (accessed on 19 January 2020).
- DTCB. BRT and Corridor Restructuring Implementation Study and Preliminary Design Work for the Uttara-Mohakhali-Ramna-Sadarghat Corridor in Dhaka: Interim Report; Dhaka Transport Coordination Board: Dhaka, Bangladesh, 2011.
- Rahman, M.M.; Hoque, S.M.A.; Zaber, M.I. Understanding real time traffic characteristics of urban zones using GPS data: A computational study on Dhaka City. In Proceedings of the 2018 Joint 7th International Conference on Informatics, Electronics & Vision (ICIEV) and 2018 2nd International Conference on Imaging, Vision & Pattern Recognition (icIVPR), Kitakyushu, Japan, 25–28 June 2018; pp. 514–519. [Google Scholar]
- EEA. EMEP/EEA Air Pollutant Emission Inventory Guidebook; European Environment Agency: Luxembourg, 2009. [Google Scholar]
- Rahman, M.M.; Jahan, J.; Zhou, Y. Alleviating traffic congestion by the strategy of modal shift from private cars to public transports: A case of Dhaka City, Bangladesh. In Proceedings of the 2018 Conference of the Computational Social Science Society of the Americas, Santa Fe, NM, USA, 25–28 October 2018; Springer International Publishing: Cham, Switzerland, 2020. [Google Scholar]
- Iqbal, A.; Allan, A.; Afroze, S. Analysis of transport eco-efficiency scenarios to support sustainability assessment: A study on Dhaka City, Bangladesh. Environ. Monit. Assess. 2017, 189, 366. [Google Scholar] [CrossRef] [PubMed]
- Rahman, M.M.; Shuvo, M.M.M.; Zaber, M.I.; Ali, A.A. Traffic pattern analysis from gps data: A case study of Dhaka City. In Proceedings of the 2018 IEEE International Conference on Electronics, Computing and Communication Technologies (CONECCT), Bangalore, India, 16–17 March 2018. [Google Scholar]
- Noor, R.E.; Imran, M.; Hossain, M.I. A brief study on capacity loss at major Dhaka City roads. Int. J. Transp. Eng. Technol. 2016, 2, 1–7. [Google Scholar]
- Abdullah, S.; Mansor, A.A.; Napi, N.N.L.M.; Mansor, W.N.W.; Ahmed, A.N.; Ismail, M.; Ramly, Z.T.A. Air quality status during 2020 Malaysia Movement Control Order (MCO) due to 2019 novel coronavirus (2019-nCoV) pandemic. Sci. Total Environ. 2020, 729, 139022. [Google Scholar] [CrossRef] [PubMed]
- Otmani, A.; Benchrif, A.; Tahri, M.; Bounakhla, M.; Chakir, E.M.; el Bouch, M.; Krombi, M.H. Impact of Covid-19 lockdown on PM10, SO2 and NO2 concentrations in Salé City (Morocco). Sci. Total Environ. 2020, 735, 139541. [Google Scholar] [CrossRef] [PubMed]
- Wang, Y.; Yuan, Y.; Wang, Q.; Liu, C.; Zhi, Q.; Cao, J. Changes in air quality related to the control of coronavirus in China: Implications for traffic and industrial emissions. Sci. Total Environ. 2020, 731, 139133. [Google Scholar] [CrossRef] [PubMed]
- Cheng, S.; Lu, F.; Peng, P. A high-resolution emissions inventory and its spatiotemporal pattern variations for heavy-duty diesel trucks in Beijing, China. J. Clean. Prod. 2020, 250, 119445. [Google Scholar] [CrossRef]
- Oanh, N.T.K.; Upadhyay, N.; Zhuang, Y.H.; Hao, Z.P.; Murthy, D.V.S.; Lestari, P.; Villarin, J.T.; Chengchua, K.; Co, H.X.; Dung, N.T.; et al. Particulate air pollution in six Asian cities: Spatial and temporal distributions, and associated sources. Atmos. Environ. 2006, 40, 3367–3380. [Google Scholar] [CrossRef]
- Wei, T.; Frey, H.C. Factors affecting variability in fossil-fueled transit bus emission rates. Atmos. Environ. 2020, 233, 117613. [Google Scholar] [CrossRef]
- Requia, W.J.; Arain, A.; Koutrakis, P.; Dalumpines, R. Assessing particulate matter emissions from future electric mobilityand potential risk for human health in Canadian metropolitan area. Air Qual. Atmos. Health 2018, 11, 1009–1019. [Google Scholar] [CrossRef]
- Padoan, E.; Ajmone-Marsan, F.; Querol, X.; Amato, F. An empirical model to predict road dust emissions based on pavement and traffic characteristics. Environ. Pollut. 2018, 237, 713–720. [Google Scholar] [CrossRef]
- Panko, J.; Hitchcock, K.; Fuller, G.; Green, D. Evaluation of Tire Wear Contribution to PM2.5 in Urban Environments. Atmosphere 2019, 10, 99. [Google Scholar] [CrossRef] [Green Version]
- Park, I.; Kim, H.; Lee, S. Characteristics of tire wear particles generated in a laboratory simulation of tire/road contact conditions. J. Aerosol Sci. 2018, 124, 30–40. [Google Scholar] [CrossRef]
- Penkała, M.; Ogrodnik, P.; Rogula-Kozłowska, W. Particulate Matter from the Road Surface Abrasion as a Problem of Non-Exhaust Emission Control. Environments 2018, 5, 9. [Google Scholar] [CrossRef] [Green Version]
- Frey, H.C.; Zheng, J. Probabilistic Analysis of Driving Cycle-Based Highway Vehicle Emission Factors. Environ. Sci. Technol. 2002, 36, 5184–5191. [Google Scholar] [CrossRef]
- O’ Ryan, R.; Benavides, C.; Díaz, M.; Martín, J.P.S.; Mallea, J. Using probabilistic analysis to improve greenhouse gas baseline forecasts in developing country contexts: The case of Chile. Clim. Policy 2019, 19, 299–314. [Google Scholar] [CrossRef]
- Iqbal, A.; Afroze, S.; Rahman, M.M. Probabilistic health risk assessment of vehicular emissions as an urban health indicator in Dhaka city. Sustainability 2019, 11, 6427. [Google Scholar] [CrossRef] [Green Version]
- Iqbal, A.; Allan, A. Modelling eco-effciency for vehicular emissions from the perspective of Dhaka city: Development of a tool for sustainable transport planning. In Proceedings of the 14th International Conference on Computers in Urban Planning and Urban Management, Massachusetts Institute of Technology (MIT), Cambridge, MA USA, 7–10 July 2015; MIT: Cambridge, MA, USA, 2015. Available online: http://web.mit.edu/cron/project/CUPUM2015/proceedings/Content/modeling/260_iqbal_h.pdf (accessed on 26 March 2020).
- USEPA. Preferred Dispersion Models. 2019. Available online: https://www.epa.gov/scram/air-quality-dispersion-modeling-preferred-and-recommended-models (accessed on 18 February 2019).
- CL4, User’s guide for cl4: A user friendly interface for the caline4 model for transportation project impact assessments. In California Line Source Dispersion Model Version 4 (CALINE4); California Department of Transportation: Sacramento, CA, USA, 1998.
- BMD. Statistics, G.o.B; Bangladesh Meteorological Department: Dhaka, Bangladesh, 2019.
- Garvey, P.R. Track 2: Implementing a Risk Management Process for a Large Scale Information System Upgrade—A Case Study. Insight 2001, 4, 15–22. [Google Scholar] [CrossRef]
- ACS. Risk Rating and Assessment. 2019. Available online: https://0-www-acs-org.brum.beds.ac.uk/content/acs/en/chemical-safety/hazard-assessment/fundamentals/risk-assessment.html (accessed on 24 June 2019).
- DoE. Revisions of vehicular emission standards for Bangladesh. In Clean Air and Sustainable Environment Project; Department of Environment: Dhaka, Bangladesh, 2012. [Google Scholar]
Figure 1.
Year-wise registered vehicles in Dhaka (2010–2019) indicating a growth pattern of the vehicles (Data source: BRTA [61]).
Figure 1.
Year-wise registered vehicles in Dhaka (2010–2019) indicating a growth pattern of the vehicles (Data source: BRTA [61]).

Figure 2.
The positioning of Dhaka City and the map of its arterial road links indicating the nodes contemplated for the emissions modelling; Source: adapted from Iqbal et al. [82].
Figure 2.
The positioning of Dhaka City and the map of its arterial road links indicating the nodes contemplated for the emissions modelling; Source: adapted from Iqbal et al. [82].

Figure 3.
Meteorological data for Dhaka (a) monthly average temperature and wind speed (b) wind direction for December (data source: Bangladesh Meteorological Department [86]).
Figure 3.
Meteorological data for Dhaka (a) monthly average temperature and wind speed (b) wind direction for December (data source: Bangladesh Meteorological Department [86]).

Figure 4.
Traffic distribution characteristics for the road networks in Dhaka City (2019).

Figure 5.
A schematic diagram for analysing the probabilistic risk of PM2.5 emissions above the threshold level.
Figure 5.
A schematic diagram for analysing the probabilistic risk of PM2.5 emissions above the threshold level.

Figure 6.
(a) Normally distributed vehicular PM2.5 emissions and (b) cumulative distribution at 46 data points in Dhaka for 2019. The reference dashed lines are indicative to the threshold emission level (g/km/hr) relating to Bangladesh standard.
Figure 6.
(a) Normally distributed vehicular PM2.5 emissions and (b) cumulative distribution at 46 data points in Dhaka for 2019. The reference dashed lines are indicative to the threshold emission level (g/km/hr) relating to Bangladesh standard.

Figure 7.
The exposure map of PM2.5 concentration (µg/m3) from vehicular sources for peak and off-peak periods in 2019.
Figure 7.
The exposure map of PM2.5 concentration (µg/m3) from vehicular sources for peak and off-peak periods in 2019.

Figure 8.
A schematic diagram showing the comparison between modelling and monitoring results for 2019. Source: A US EPA [59]; B Department of Environment [58]; C AirVisuals [2]; D Begum and Hopke [27].

Figure 9.
The risk intensity map of PM2.5 emissions from vehicular sources for peak and off-peak periods in 2019.
Figure 9.
The risk intensity map of PM2.5 emissions from vehicular sources for peak and off-peak periods in 2019.

Figure 10.
The risk intensity map of PM2.5 emissions from vehicular sources for peak and off-peak periods for the 2024 scenario: “business-as-usual”.
Figure 10.
The risk intensity map of PM2.5 emissions from vehicular sources for peak and off-peak periods for the 2024 scenario: “business-as-usual”.

Figure 11.
The risk intensity map of PM2.5 emissions from vehicular sources for peak periods for the 2024 scenarios: (a) modified “business-as-usual” scenario by integrating proposed new euro standards, (b) further enhancement of the modified ‘business-as-usual’ scenario when vehicle speed increases with the implementation of MRT-BRT.


Table 1.
Particulate Matter (PM2.5) emission factors (mg/g of fuel) from vehicles in Dhaka; Source: adapted from Iqbal et al. [44] calculated based on EEA methodology [64].
| PM2.5 Emissions (mg/g of Fuel) | |
|---|---|
| Gasoline | |
| Passenger Car (Euro 2/Euro 4) | |
| < 1.4 L | 1.125/0.02 |
| 1.4−2.0 L | 0.985/0.017 |
| > 2.0 L | 0.844/0.013 |
| LDV (Conventional/Euro 4) | 0.844/0.011 |
| MC ( > 50 cc) (Euro 2/Euro 4) | 7.032/0.097 |
| Diesel | |
| LDV (conventional/Euro 3) | 5.889/0.879 |
| Truck < 7.5 t (Euro 1/Euro 3) | 7.853/0.453 |
| Bus—urban midi (Euro 1/Euro 3) | 3.926/0.566 |
| CNG | |
| Passenger Car (Euro 2/Euro 4) (all capacities) | 0.21/0 |
| LDV ( > 2.0 L) (Euro 2/Euro 4) | 0.18/0 |
| HDV bus (Euro 4) | 0.018 |
| 3W ( < 1.4 L) (Euro 2/Euro 4) | 0.21/0 |
Note: LDV: light-duty vehicles; MC: motorcycle (4 stroke); CNG: Compressed Natural Gas; 3W: three-wheeler vehicles.
Table 2.
Risk index matrix: (severity x probability of exceeding the threshold) (Source: adopted and modified from Iqbal et al. [82]).
Table 2.
Risk index matrix: (severity x probability of exceeding the threshold) (Source: adopted and modified from Iqbal et al. [82]).
| Probability | Severity | ||||
|---|---|---|---|---|---|
| Very Severe—5 | Severe—4 | Critical—3 | Marginal—2 | Negligible—1 | |
| Strong—5 | Very extreme (25) | Extreme (20) | Acute (15) | Major (10) | Minor (5) |
| High—4 | Extreme (20) | Acute (16) | Major (12) | Modest (8) | Minor (4) |
| Medium—3 | Acute (15) | Major (12) | Modest (9) | Modest (6) | Minor (3) |
| Low—2 | Major (10) | Modest (8) | Modest (6) | Minor (4) | Minor (2) |
| Improbable—1 | Minor (5) | Minor (4) | Minor (3) | Minor (2) | Minor (1) |
© 2020 by the authors. Licensee MDPI, Basel, Switzerland. This article is an open access article distributed under the terms and conditions of the Creative Commons Attribution (CC BY) license (http://creativecommons.org/licenses/by/4.0/).
Share and Cite
MDPI and ACS Style
Iqbal, A.; Afroze, S.; Rahman, M.M. Vehicular PM Emissions and Urban Public Health Sustainability: A Probabilistic Analysis for Dhaka City. Sustainability 2020, 12, 6284. https://0-doi-org.brum.beds.ac.uk/10.3390/su12156284
AMA Style
Iqbal A, Afroze S, Rahman MM. Vehicular PM Emissions and Urban Public Health Sustainability: A Probabilistic Analysis for Dhaka City. Sustainability. 2020; 12(15):6284. https://0-doi-org.brum.beds.ac.uk/10.3390/su12156284
Chicago/Turabian StyleIqbal, Asif, Shirina Afroze, and Md. Mizanur Rahman. 2020. "Vehicular PM Emissions and Urban Public Health Sustainability: A Probabilistic Analysis for Dhaka City" Sustainability 12, no. 15: 6284. https://0-doi-org.brum.beds.ac.uk/10.3390/su12156284
Note that from the first issue of 2016, this journal uses article numbers instead of page numbers. See further details here.