Rut Depth Evaluation of a Triple-Bogie System for Forwarders—Field Trials with TLS Data Support


1
School of Agricultural, Forest and Food Sciences (HAFL), Bern University of Applied Sciences, 3052 Zollikofen, Switzerland
2
Staatsbetrieb Sachsenforst, Maschinenstation Königstein, 01824 Königstein, Germany
*
Author to whom correspondence should be addressed.
Sustainability 2020, 12(16), 6412; https://0-doi-org.brum.beds.ac.uk/10.3390/su12166412
Submission received: 19 June 2020
/
Revised: 6 August 2020
/
Accepted: 7 August 2020
/
Published: 10 August 2020
(This article belongs to the Special Issue Technologies, Applications and Assessments for Proper Sustainable Forest Operations (SFO))
Abstract
:In 2019, the machine manufacturer HSM presented a forwarder prototype for timber hauling in cut-to-length processes fitted with a new 10-wheel triple-bogie (TB) setup approach aimed at promoting sustainable forest management by reducing the ecological impact of forest operations, especially under soft-soil working conditions. The purpose of our study was to assess the resulting soil-protection effect emerging from additional wheel-contact surface area. For this, the rut development under known cumulative weight, related to the soil conditions of shear strength and moisture content, was recorded for later comparison. Additional terrestrial laser scanning (TLS) was used to generate a multi-temporal digital terrain model (DTM) in order to enhance the data sample, assess data quality, and facilitate visualization of the impact of local disturbance factors. In all TB configurations, a rut depth of 10 cm (5.8–7.2 cm) was not exceeded after the hauling of a reference amount of 90 m3 of timber (average soil shear strength reference of 67 kPa, volumetric water content (VMC) 43%). Compared to a reference dataset, all observed configurations ranked in the lowest-impact machine categories on related soil stability classes, and the configuration without bogie tracks revealed the highest machine weight to weight distribution trade-off potential.
Keywords:
forest operation; forwarder; cut-to-length; soft soil; soil protection; rut depth; TLS data1. Introduction
Since the introduction of larger machines in forestry, their effect on the environment has been a continuously debated topic. Soil protection is a particular point of concern [1]. With increased awareness and defined restrictions, the surrounding conditions for forest work have become more important, as global warming forces forestry contractors to work under suboptimal conditions outside the frost period [2]. This has also started to affect regions that historically could rely on frozen soils in certain time periods during the year [3,4]. Normally, workers would interrupt harvesting during unsuitable weather conditions but with the increasing absence of good working conditions, amplified by high machine costs, they must continue their work for economic reasons [5]. In order to continue supplying timber with a tolerable ecological impact in the context of sustainable forest management (SFM), different machine designs, that are further described below, are gaining interest, in addition to such operational solutions as the intense use of brush mats to reduce soil impact [6].
When machine configurations without bogie tracks are discussed, the enlargement of the soil contact area is generally divided into three main machine configuration-related solutions with different soil protection effects: the number of tires on the machine (effect 55%), the air pressure in the tires (35%), and the tire width (10%) [7]. The use of a low tire-pressure machine setup, along with the number of tires, is a particularly suitable approach [8,9,10]. However, the resulting change in machine weight must always be kept in mind as a trade-off parameter [2].
Other basic trends to achieve a high soil-protection effect are the use of bogie tracks [11] or a switch to a tracked undercarriage of the machine. A possible extension of the bogie axle length should also be noted here [12,13]. Specially designed machines for soft soil conditions such as the Elliator [14] or the Ponsse “OnTrack” prototype [15] are existing examples of tracked forwarder setups.
With the now common switch from 6- to 8-wheeled machines, the addition of another pair of wheels seems a logical development. Hence, also 10-wheeled forwarder setups are not a new development per se [2], and several variants have already been tested with proven positive effects.
One such market-available solution is provided by Ponsse with its “10w setup”. Based on the Wisent, Elk, and Buffalo forwarder model types, the larger carriage designed models have the option to vertically adjust a third pair of wheels at the rear axle of the machine, whereas the wheel of the lighter model remains in a fixed position [16]. One three-axle bogie, or triple-bogie (TB), solution considers the trade-off between the energy efficiency of the machine and the friction, in terms of machine-soil interaction, resulting in the invention of a new rocker design of the bogie axle that only uses the maximum contact surface of the additional pair of wheels at higher torque requirements and thus only when needed [17,18].
Another solution has recently been developed by “Hohenloher Spezial Maschinenbau GmbH” (HSM) with its TB system. This 10-wheeled forwarder setup is based on a HSM 208F 10 t machine [19] and provides the option to be used either with specially designed bogie tracks for extremely soft soil conditions or with low pressurized “BigFoot” tires with three actively driven wheels.
To compare the resulting soil protection effect of different machinery, an assessment method is needed. There are various approaches to evaluating the impact of a forest machine on sensitive soils [20]. The first methodological option consists of calculation-based estimations, e.g., by determining the nominal ground pressure (NGP) of a forest machine [21]. Furthermore, more accurate calculations such as the mean maximum pressure (MMP) [22] of a certain machine can be included in order to derive the soil impact from calculated machine characteristics. Dynamic local tire-soil effects make this approach not only very difficult to implement, but also potentially inaccurate under certain conditions (ibid.), with the necessary input data sometimes hard to acquire [20].
Another possibility is to measure the impact of the machine in describing the soil characteristics, e.g., with the bulk-density change over time during the harvest operation [22,23,24,25]. The machine impact can thereby be distinguished between shearing effects caused by traction loss and direct compaction [26], both of which lead to ruts in the driving lanes. As the bulk density cannot be visually observed in the field and does not explain technical accessibility, guidelines for practical use focus on the visually detectable rut depth and its shape, related to previously described soil parameters [27].
Related research uses various methods of describing and measuring this rut expression. For fast or larger area observations, it can be separated by classes, where the rut depths or the moved soil volumes have been determined visually [28,29], with photogrammetric methods (such as an unmanned aerial vehicle (UAV)-based evaluation method [30]), or have been measured with a traditional terrestrial or newer portable laser scanners [26,31,32]. To achieve a higher resolution for the comparison of different machine types, other studies have manually recorded the rutting development [33] and checked its correlation to the cumulative weight consisting of machine weight, load weight, equipment weight, and the number of transits [2,34,35,36]. Because manual measurements are very labor-intensive [31], combined approaches have been developed using close-range photogrammetry and multi-temporal digital terrain models (DTM) to measure the rut developments with higher resolution [8,37,38]. This method has already been successfully used with additional consideration of the number of machines passes with known impact weight, thus offering additional possibilities of data recording and evaluation [8,38,39].
In such evaluations, it is important to record the related soil parameters as influencing factors [20,40]. Soil parameters that can be used to rank soil stability are shear strength (τ) [2,38,40], penetration resistance, or E-module [41]. Shear-strength classification may have higher replicability and objectivity compared to the cone penetrometer test for determining penetration resistance [42].
A remaining problem with soil characterization using the cone penetrometer is the occurrence of skeletal content, which can influence the reliability of the data [35]. A similar effect may arise during manual measurements with a lower number of sample points caused by the root system of the trees [36]. Nevertheless, both measuring setups are regarded as common and reliable techniques to characterize physical soil parameters [40] and are also used in combination [23]. The related (volumetric) soil moisture content and the Unified Soil Classification System (USCS) or similar soil type description is valuable additional information as they both directly influence the soil characteristics [20].
Based on the previously mentioned methodological elements, applications for comparing the rut depth development of multiple different machines do exist [36,42], which can be used to rate our own results. In one mentioned application [36], the rutting development of different forwarder bogie-track setups were manually recorded on flat terrain during the hauling process under predominantly soft soil conditions. For this, a Valmet 860.4 base machine was equipped with different bogie-track types. To illustrate the overall impact on the skid trails, the cumulative weights (consisting of machine weight, load weight, and the weight of the bogie tracks) of each variant were recorded. Furthermore, the respective soil conditions were documented in order to classify soil conditions by shear strength in three classes [36] (Table 1).
The soil moisture ranges were then used to cluster the data as a further common influence factor [20,33,41,43,44].
This following study investigates the newly developed HSM TB system configurations with regards to their rutting effects on predominantly very sensitive soil conditions. It is therefore compared with existing 8-wheel and bogie-track setups from direct measurements and additional reference data available for similar soil conditions. Terrestrial laser scanning (TLS) data will be used to visualize small-scale influences that may distort rutting effects and to directly support the selected manual measurement setup, including data-quality assessment and additionally recorded samples.
2. Materials and Methods
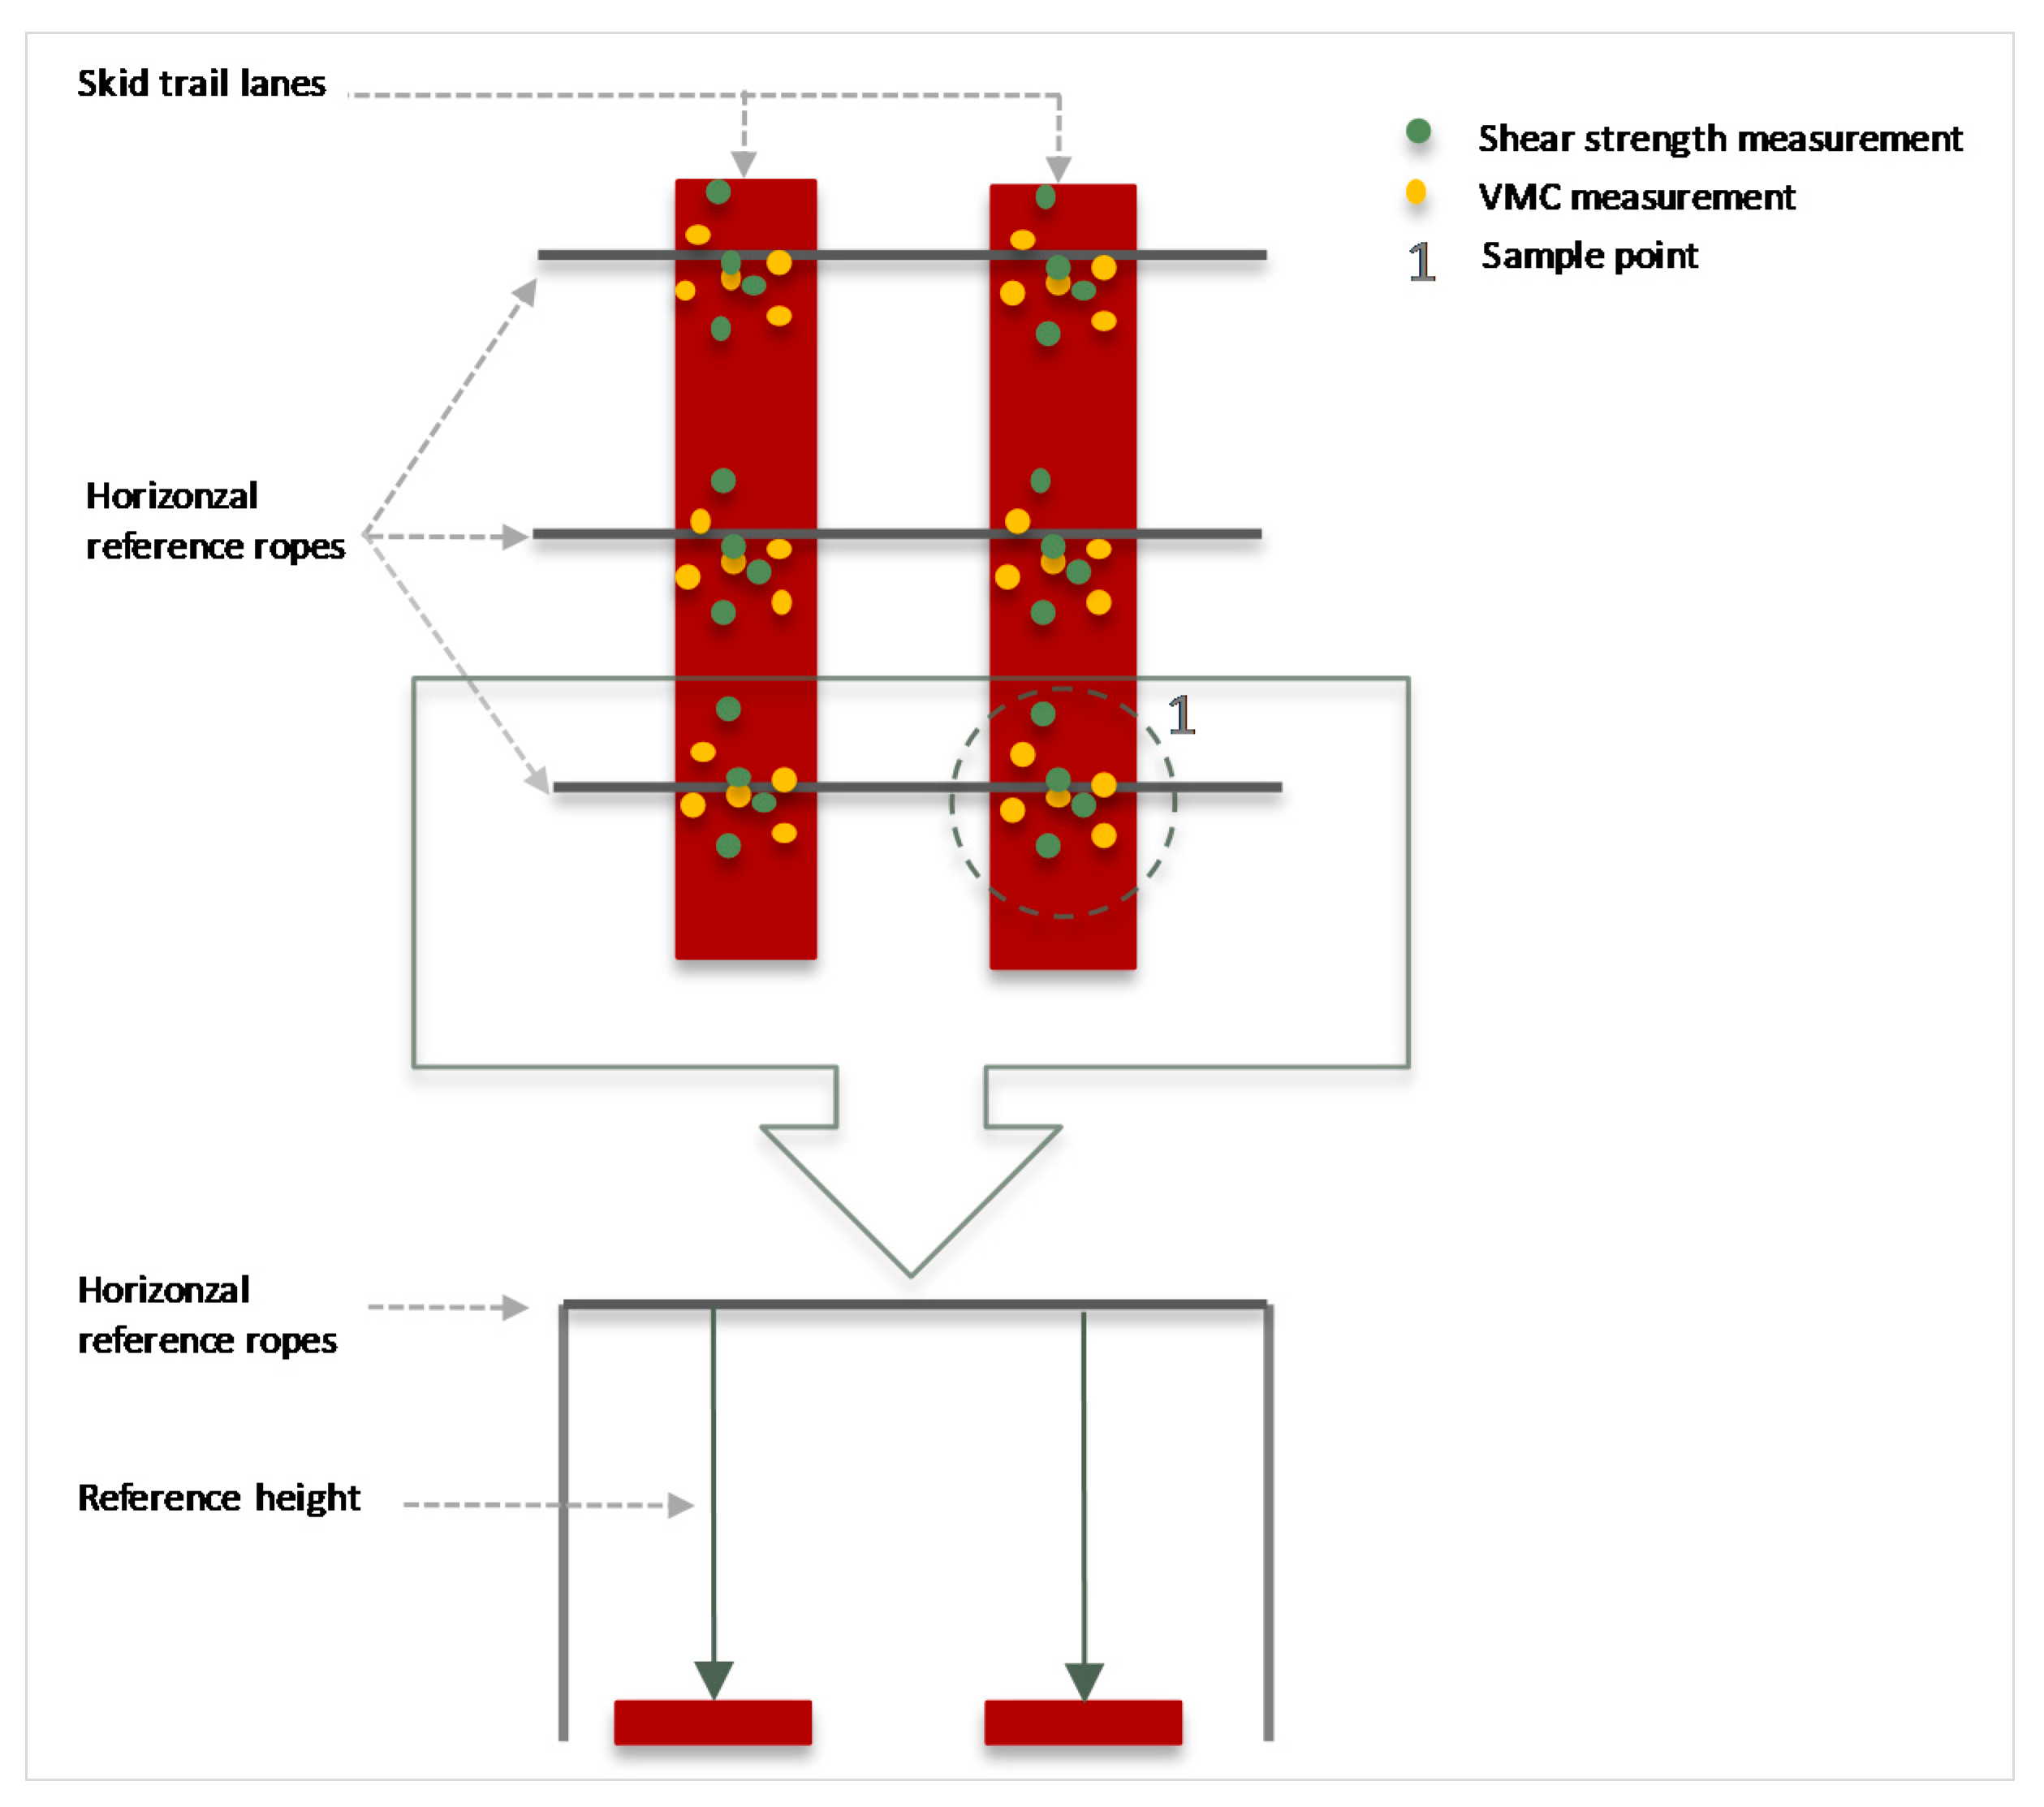
The study was performed in Saxony, Germany, near the cities of Tharandt (50.94° N, 13.49° E) and Schönheide (50.47° N, 12.51° E), in two field trials and in combination with a pre-test that was made to test the functionality of the machine setup and to assess the applicability of the study layout [45]. In the second campaign (Schönheide), a further developed machine setup was finalized to be tested. All measurements were taken in springtime to guarantee high soil water saturation. The selection of the testing areas was based on an assumed soil stability classified as B3 of the Saxonian soil protection guideline: “Trafficability is severely limited by weather conditions” [46], which makes it comparable with the requirements of the additional reference data [36]. The measurement points (Figure 1) were selected inside forest stands on different, existing skid trails that had initially no visible soil disturbance from previous timber hauling or harvesting operations that had been carried out several years earlier. To observe a rut deepening effect, soil stress was then provoked by multiple passes over the area of interest with a loaded machine in a straight line while the changes were recorded (Table 2). For the layout documentation, the measuring points were named according to the tested machine configuration (1–4), the recording type when multiple methods were used (a: TLS; b: manual), the recording cycle (A, B), and the consecutive number of measuring points per setup (e.g., 1a_A1).
In advance of the trials, the selected sample points were cleared of organic litter to reveal the mineral soil. Shear strength and moisture content were then determined with six measurements in a 1 m2 area around the sample point on the assumed driving lane directly in advance of the measurements (Figure 1), which defines the minimum, longitudinal sample point spacing. The data were collected manually with a shear-strength meter (varying depth of mainly 15 cm) and a time-domain reflectometry (TDR) probe to determine soil moisture as volumetric water content (VMC) with 20 cm-long probe forks.
To measure the rut depth, the vertical distance between the horizontal rope (Figure 1) was taken after each pass of the machine for at least 10 passes. The deepest point in the middle of the lane (inner 2.5 cm range) was measured for each sample point during the “Tharandt” measurement campaign and at the highest point in the middle of the lane during the second measurement campaign “Schönheide”. This change of measurement principle promised smaller disturbances for the second measurement setup.
To create a multi-temporal DTM that is further used to enhance the data collected by manual measurements, a FARO Focus 3D X330 terrestrial laser scanner (TLS) was positioned outside the lane of the skid trail at four measurement points during the “Tharandt” campaign. With this setup, a scan of each measuring point was made after every second pass of the machine in the frequency [1,3,5,7,9,11] for the measurements 1a and [2,4,6,8,10] for the measurements 2a (see also Table 3).
The sample point validity of the evaluated manual data series was defined by an upper limit of a mean shear strength of 80 kPa out of six measurements, to focus on the average soil sensitivity range of 67 kPa on the fully manually recorded measuring points [36]. For the TLS measurements, the higher shear-strength data series of the directly related measurement points remained in the study as the samples are drawn in a continuous manner, cannot be separated, and are thus part of the measurement principle.
To compare the TLS data with the manual measurements, the changes in rut geometry over time were calculated. The first scan without impact was regarded as the initial situation. For each subsequent scan, the absolute difference from the initial situation was calculated in z-direction with a 6-kNN algorithm for the scan points using the cloud distance functionality of “CloudCompare” open-source software (Version 2.11 beta (Anoia)) and stored as a scalar field.
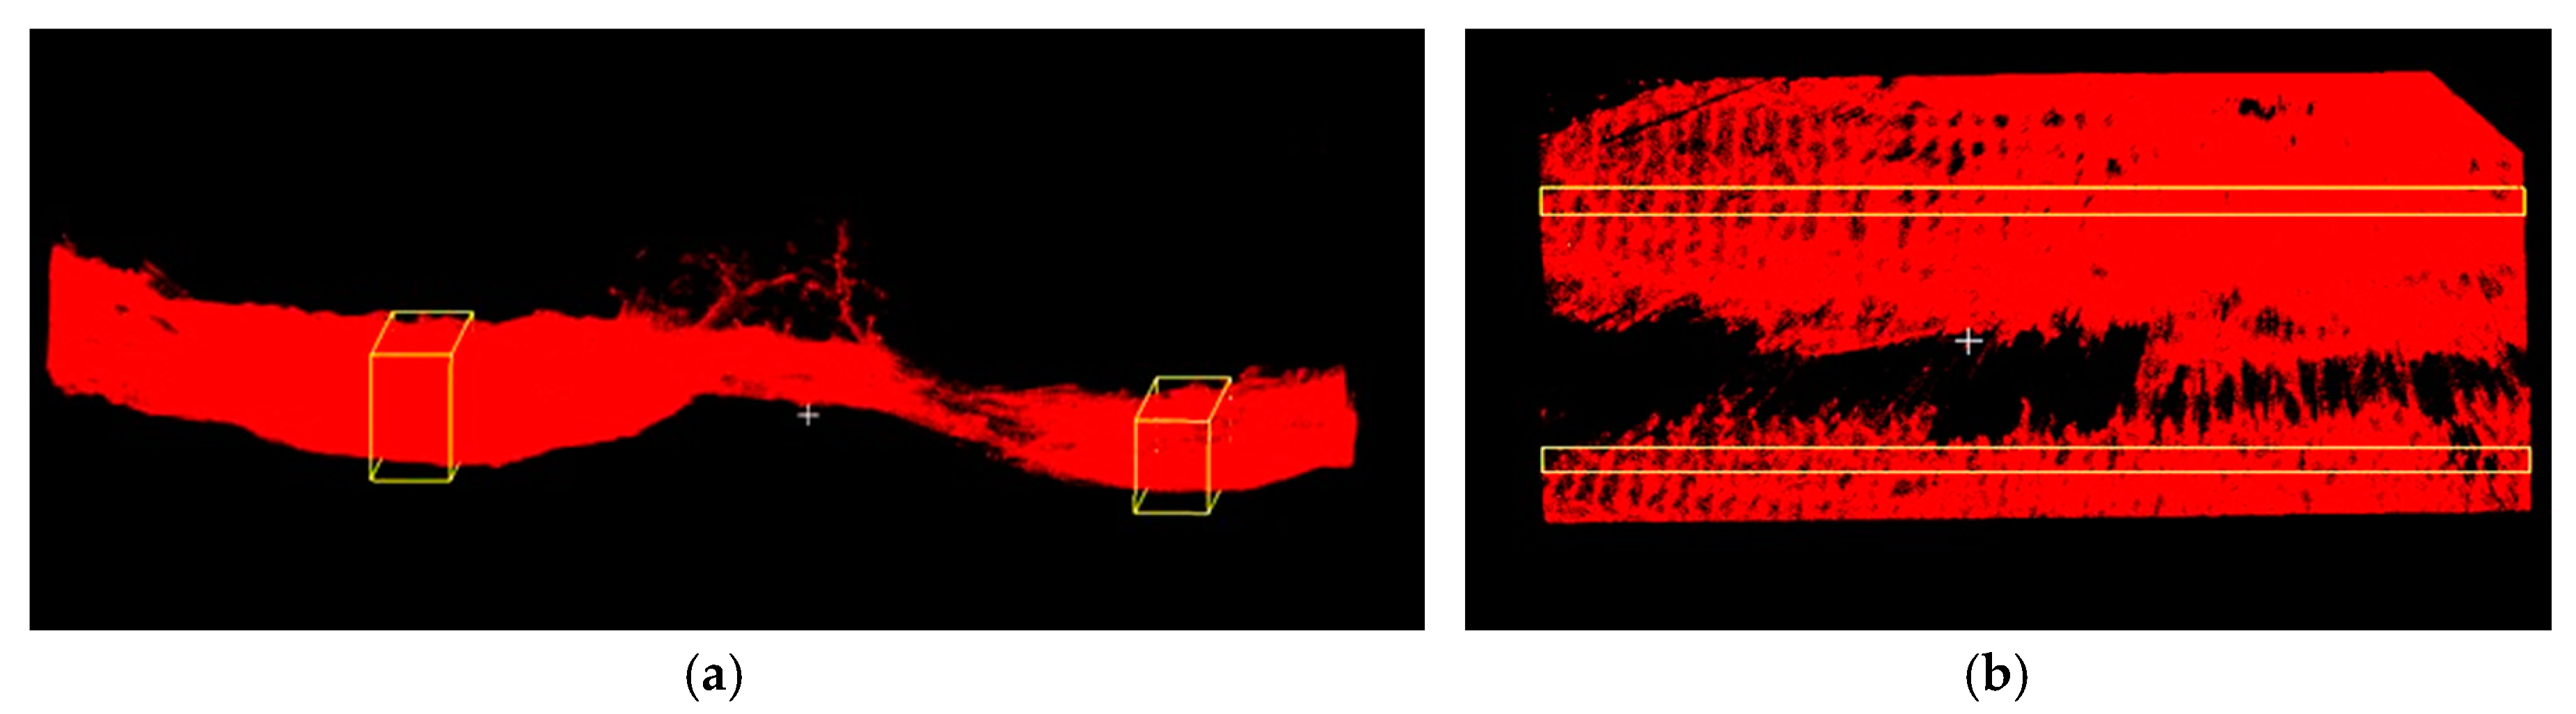
The data samples for evaluation were then taken as a longitudinally oriented segment for both lanes on the skid trail, covering the deepest point of the lane. As the visibility and the point density of the laser scan lose resolution with increasing distance from the scanning center, the sample length (Figure 2) was visually estimated to be reliable on a 7.8 m length of observation. The sample width of 20 cm ensured a positioning in the main center of the lane, thus allowing lateral machine movement without influencing the measurement point.
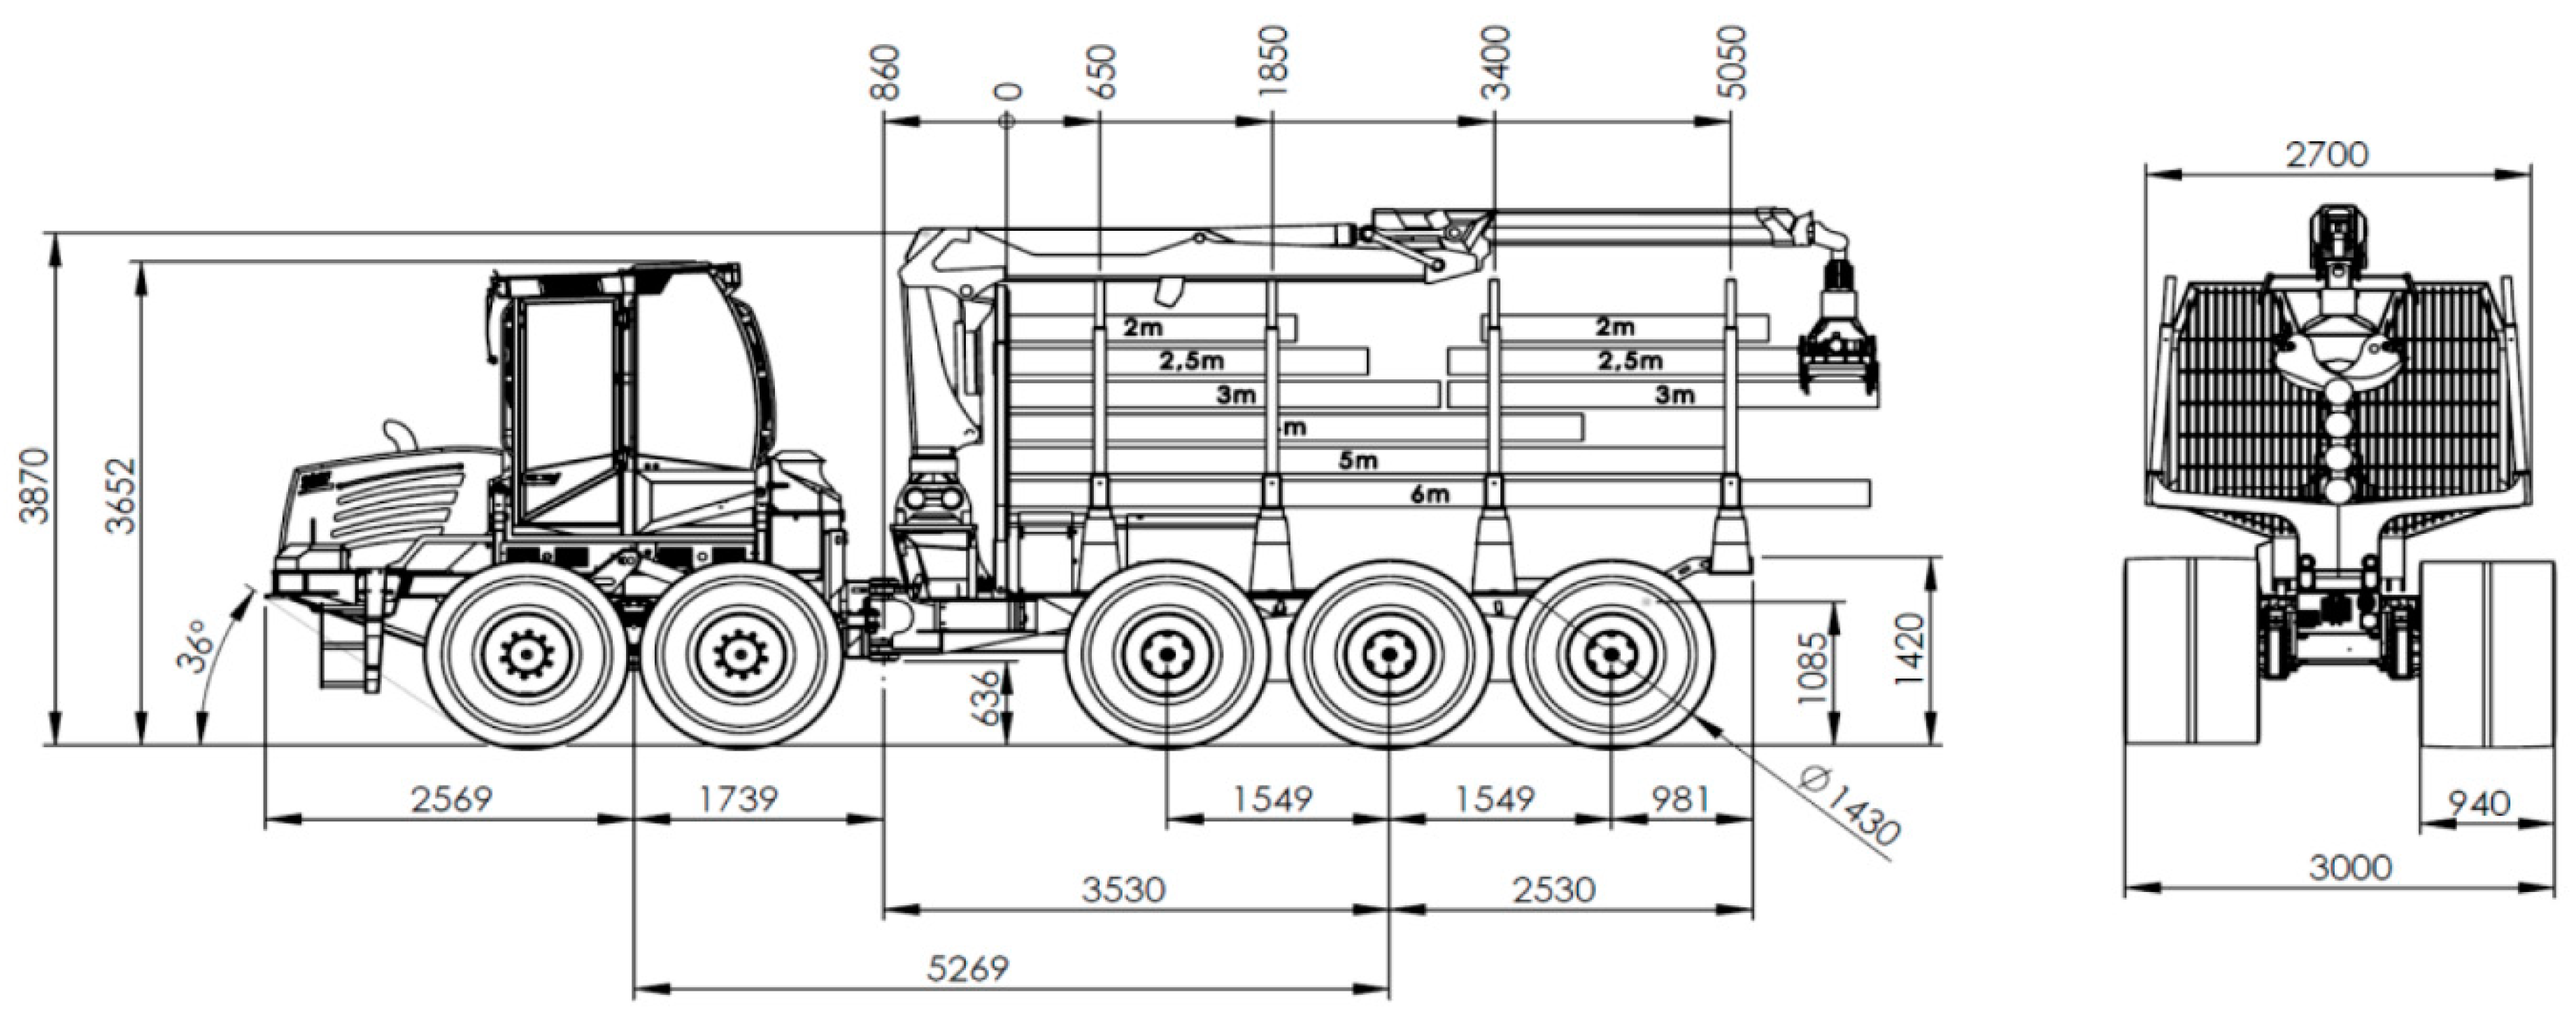
The technical equipment investigated is a TB axle designed by HSM as a modular system to be used in exchange with a conventional bogie axle.
The total length of the bogie axle is 4528 mm (Figure 3) and is connected to the machine at the angle point of the center of the middle wheel and is thus mounted without suspension and not as a real bogie functionality setup. All wheels are actively driven and thus allow the use without bogie tracks and high traction values at the same time. The machine is designed to be equipped with “BigFoot” tires (Firestone 54 × 37.00 − 25, 940 mm [50]), but with the option to switch to lower tire widths.
Without bogie tracks, the TB axle setup has a determined weight of 21.9 t, including other prototype components, such as the enhanced hydraulic setup for energy recovery [51], that were installed on the machine. The definite weight of the series machine is therefore expected to be lower than the prototypes tested in this study and is more likely to approach the listed and communicated manufacturer’s weight of 16 t [52].
An additional component of the machine is the specially produced bogie track for soft soil conditions. Clark TXL 150 TerraXlite bogie tracks were used with a special design to fit BigFoot tires. They were used in a symmetric design on the TB axle (width: 1345 mm, weight: 5740 kg) and in an asymmetric design on the front axle (width: 1175 mm, weight: 3058 kg).
The measurements were carried out with different machine setups. The TB prototype was tested in three different configurations: with the use of bogie tracks, with the standard tire pressure (also suitable for the use of tracks), and with a lowered tire pressure to achieve further soil protection effects. Table 3 shows all configurations, the number of collected datasets, and the measuring location.
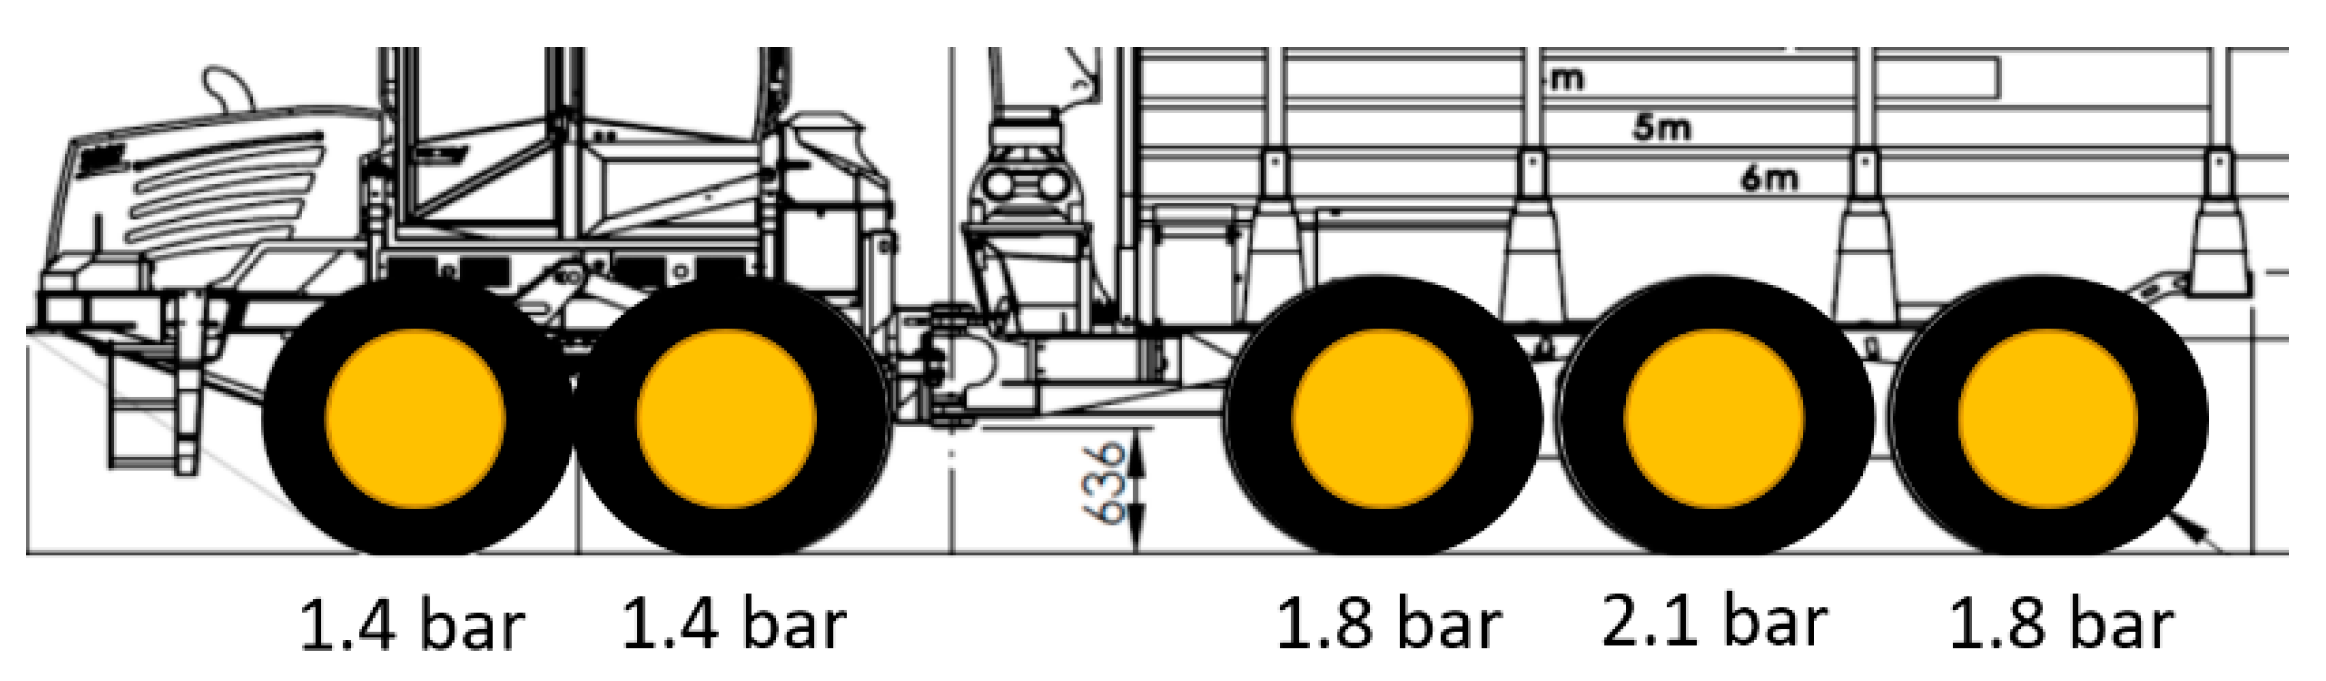
The low tire pressure setup tested in this study was that specified in the user’s manual as the lowest tire pressure configuration authorized for this machine setup without specially designed rims. One manufacturer’s concern in this setup was related to the middle tire of the axle. As load peaks were expected when the machine passes over an obstacle without suspending the middle wheel, they advised that the pressure should stay above 2.1 bar. The final tire pressure setup is shown in Figure 4.
To compare the machine’s behavior with conventional setups, an HSM 208F 10 t 8-wheeled forwarder, equipped with standard 710/45-26.5 tires with 3.5 bar tire pressure, was also observed. The base weight of this machine was 16.9 t [53].
In addition to the configuration setup, the machine carried a common load, defined as “just below” the stanchion height of the machine when equally loaded. The respective weight was measured by weighing small bundles of logs that were choked with a sling and lifted with the forwards crane to which a mobile crane scale was attached. The mobile crane scales that were used have an accuracy of at least 10 kg per load under static conditions. The loads used were thus 13,010 kg (15.7 m3, 46 logs) for the Tharandt dataset and 10,750 kg (12.9 m3, 36 logs) for the Schönheide dataset.
All datasets were evaluated with the statistic software R [54]. Due to the high number of samples in some data series, the normality assumption was assumed as given. For lower n-cases, a visual assessment followed by a Shapiro-Wilk test was performed. For the data series comparison of the different measuring setups, the data series were described by the measured shear strength and soil moisture, and a comparison of the rut depth at referenced 90 m3 hauled timber was conducted. To prove the significance of different groups, an exact Wilcoxon Rank-Sum test without p-value correction was made.
3. Results
3.1. Data Quality Assessment of the Manual Rutting Development Measurements with TLS Data Enhancement
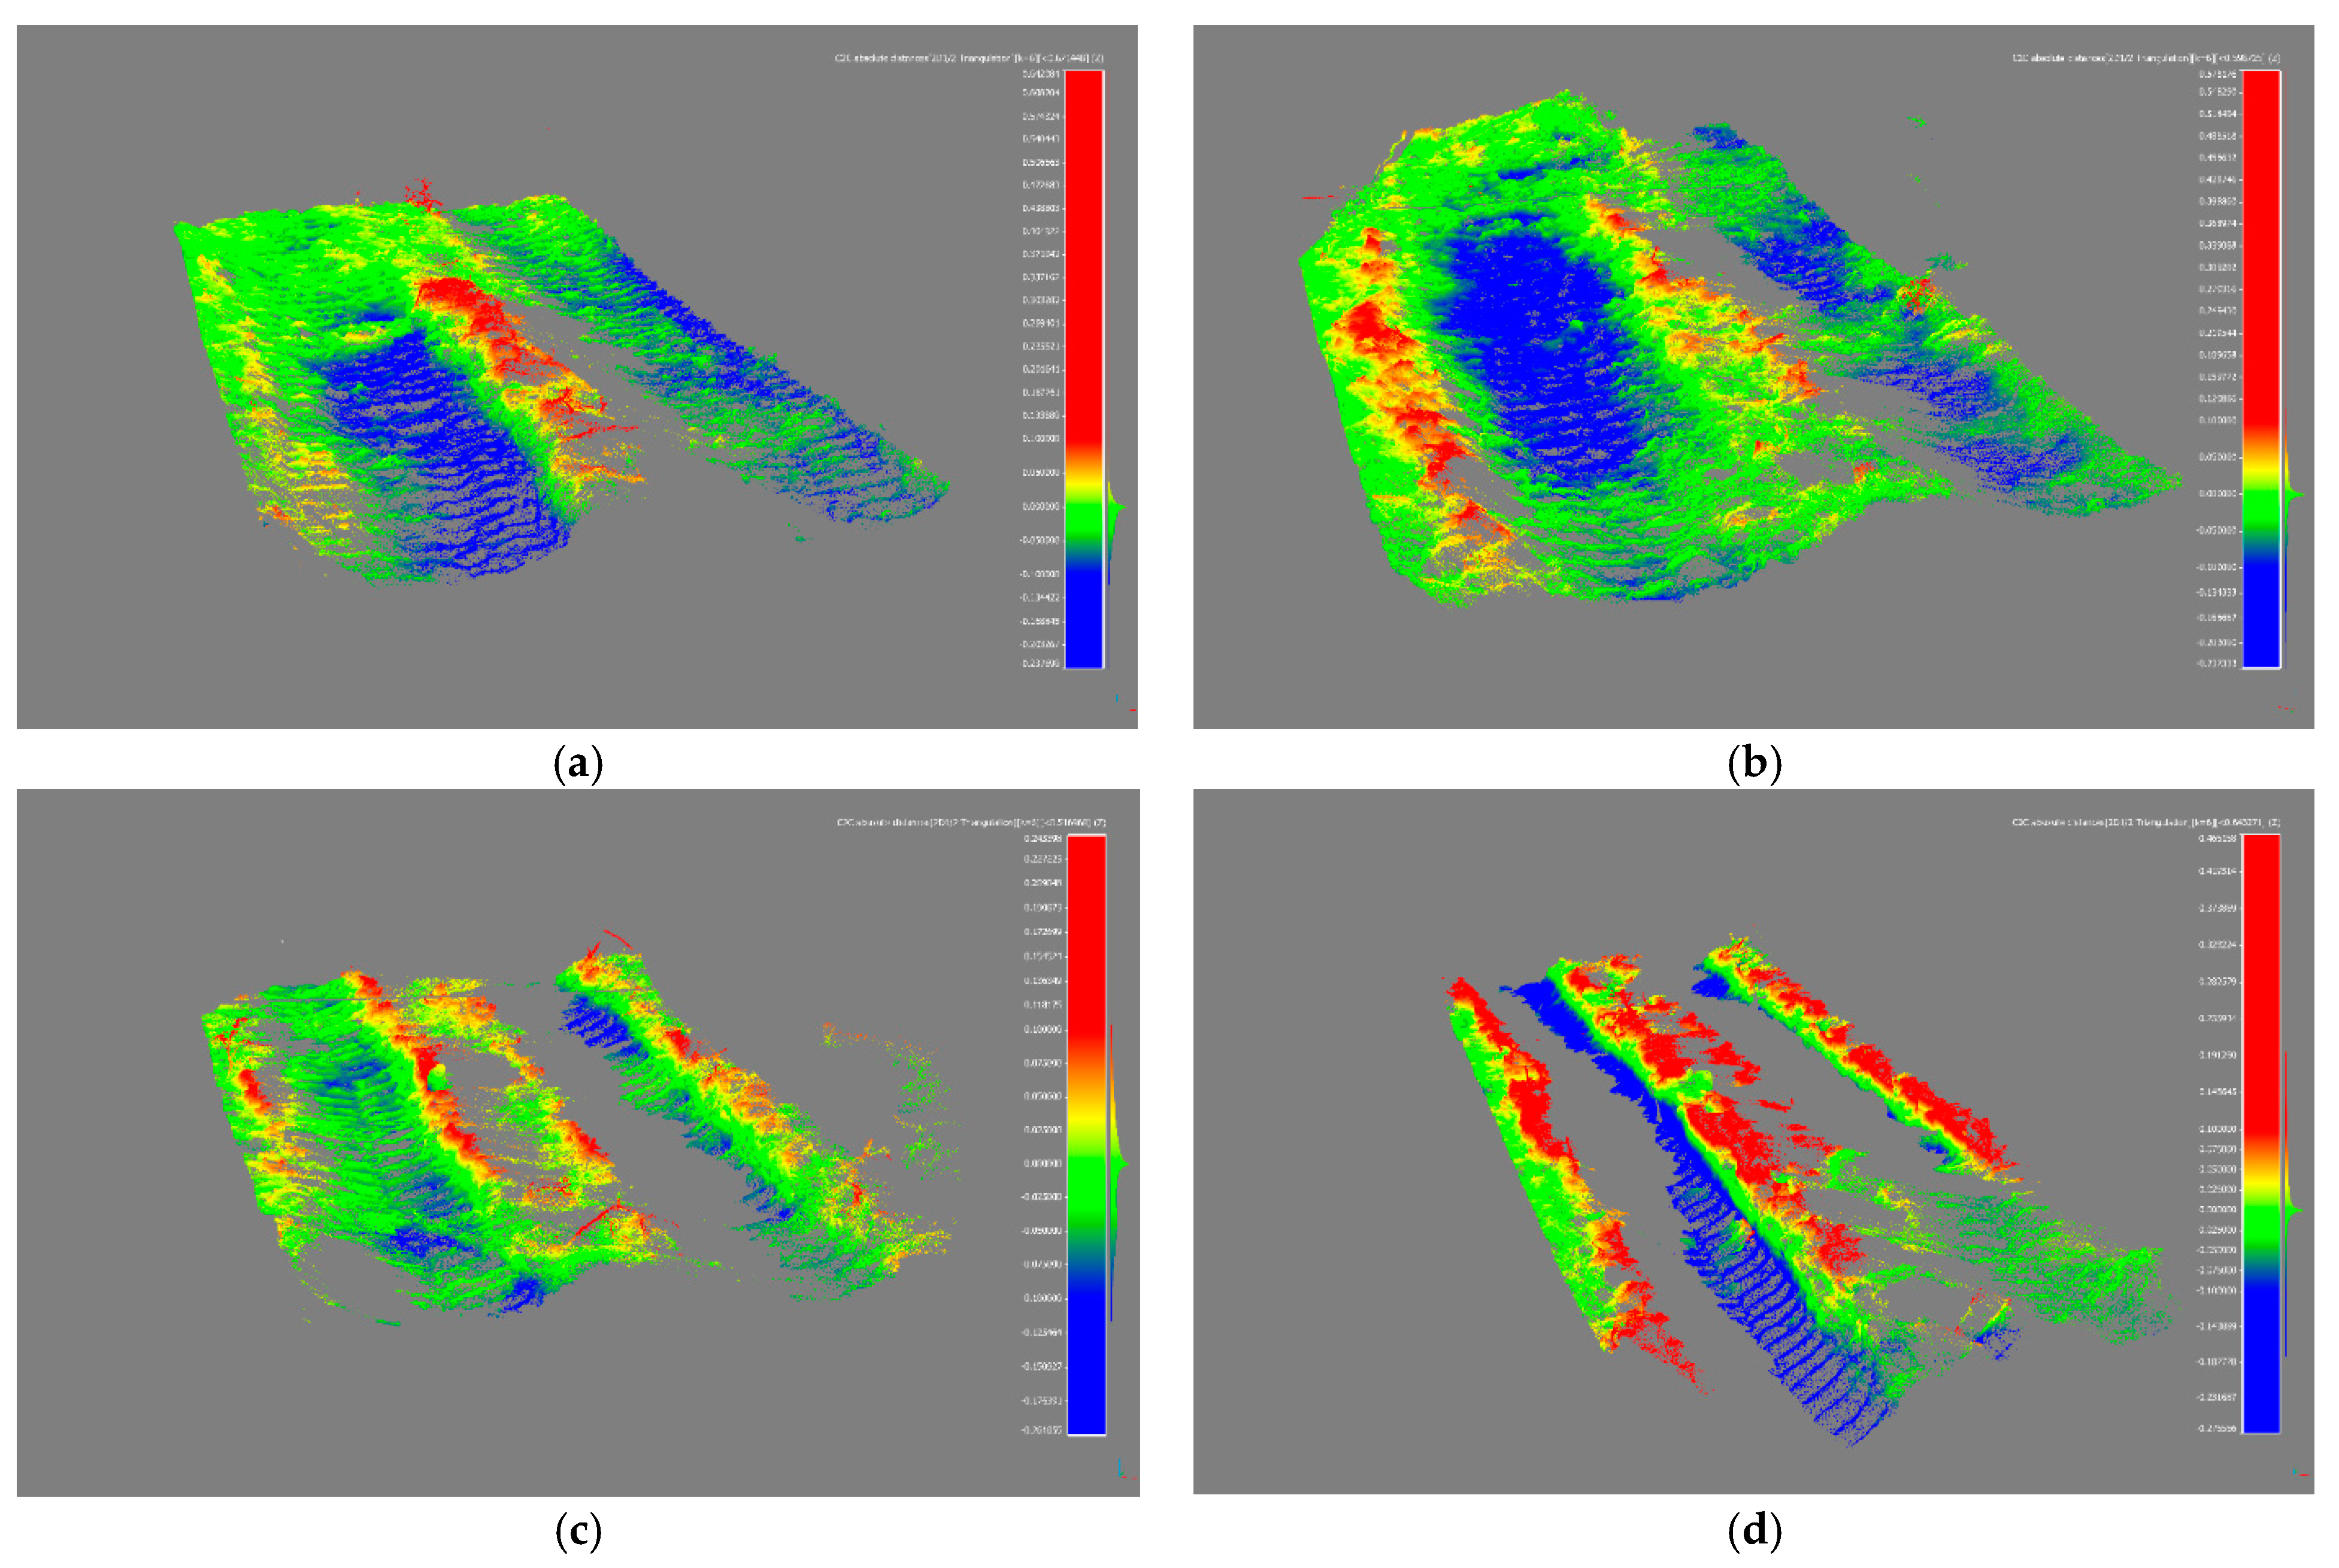
Figure 5 visualizes the TLS data for the optical recognition of small-scale influence parameters and the homogeneity of the data points. In Section 2a (Figure 5), the shadowing effect of the sidewise scanner setup is visible. The depth-value histogram of the 11th pass of the machine still shows a left skewed data series, supporting the theory that there is seemingly still no influence of the data quality on the validity of the data, and no higher value recordings are missing.
Within series 1a, the deepening effect changes locally in both visualizations but seems to have a higher expression in the 1a_A4 data series. The 2a_B4 series also shows a region of higher soil stability but is combined with extreme rut depths in the same lane and so displays a high inhomogeneity of the measurement point.
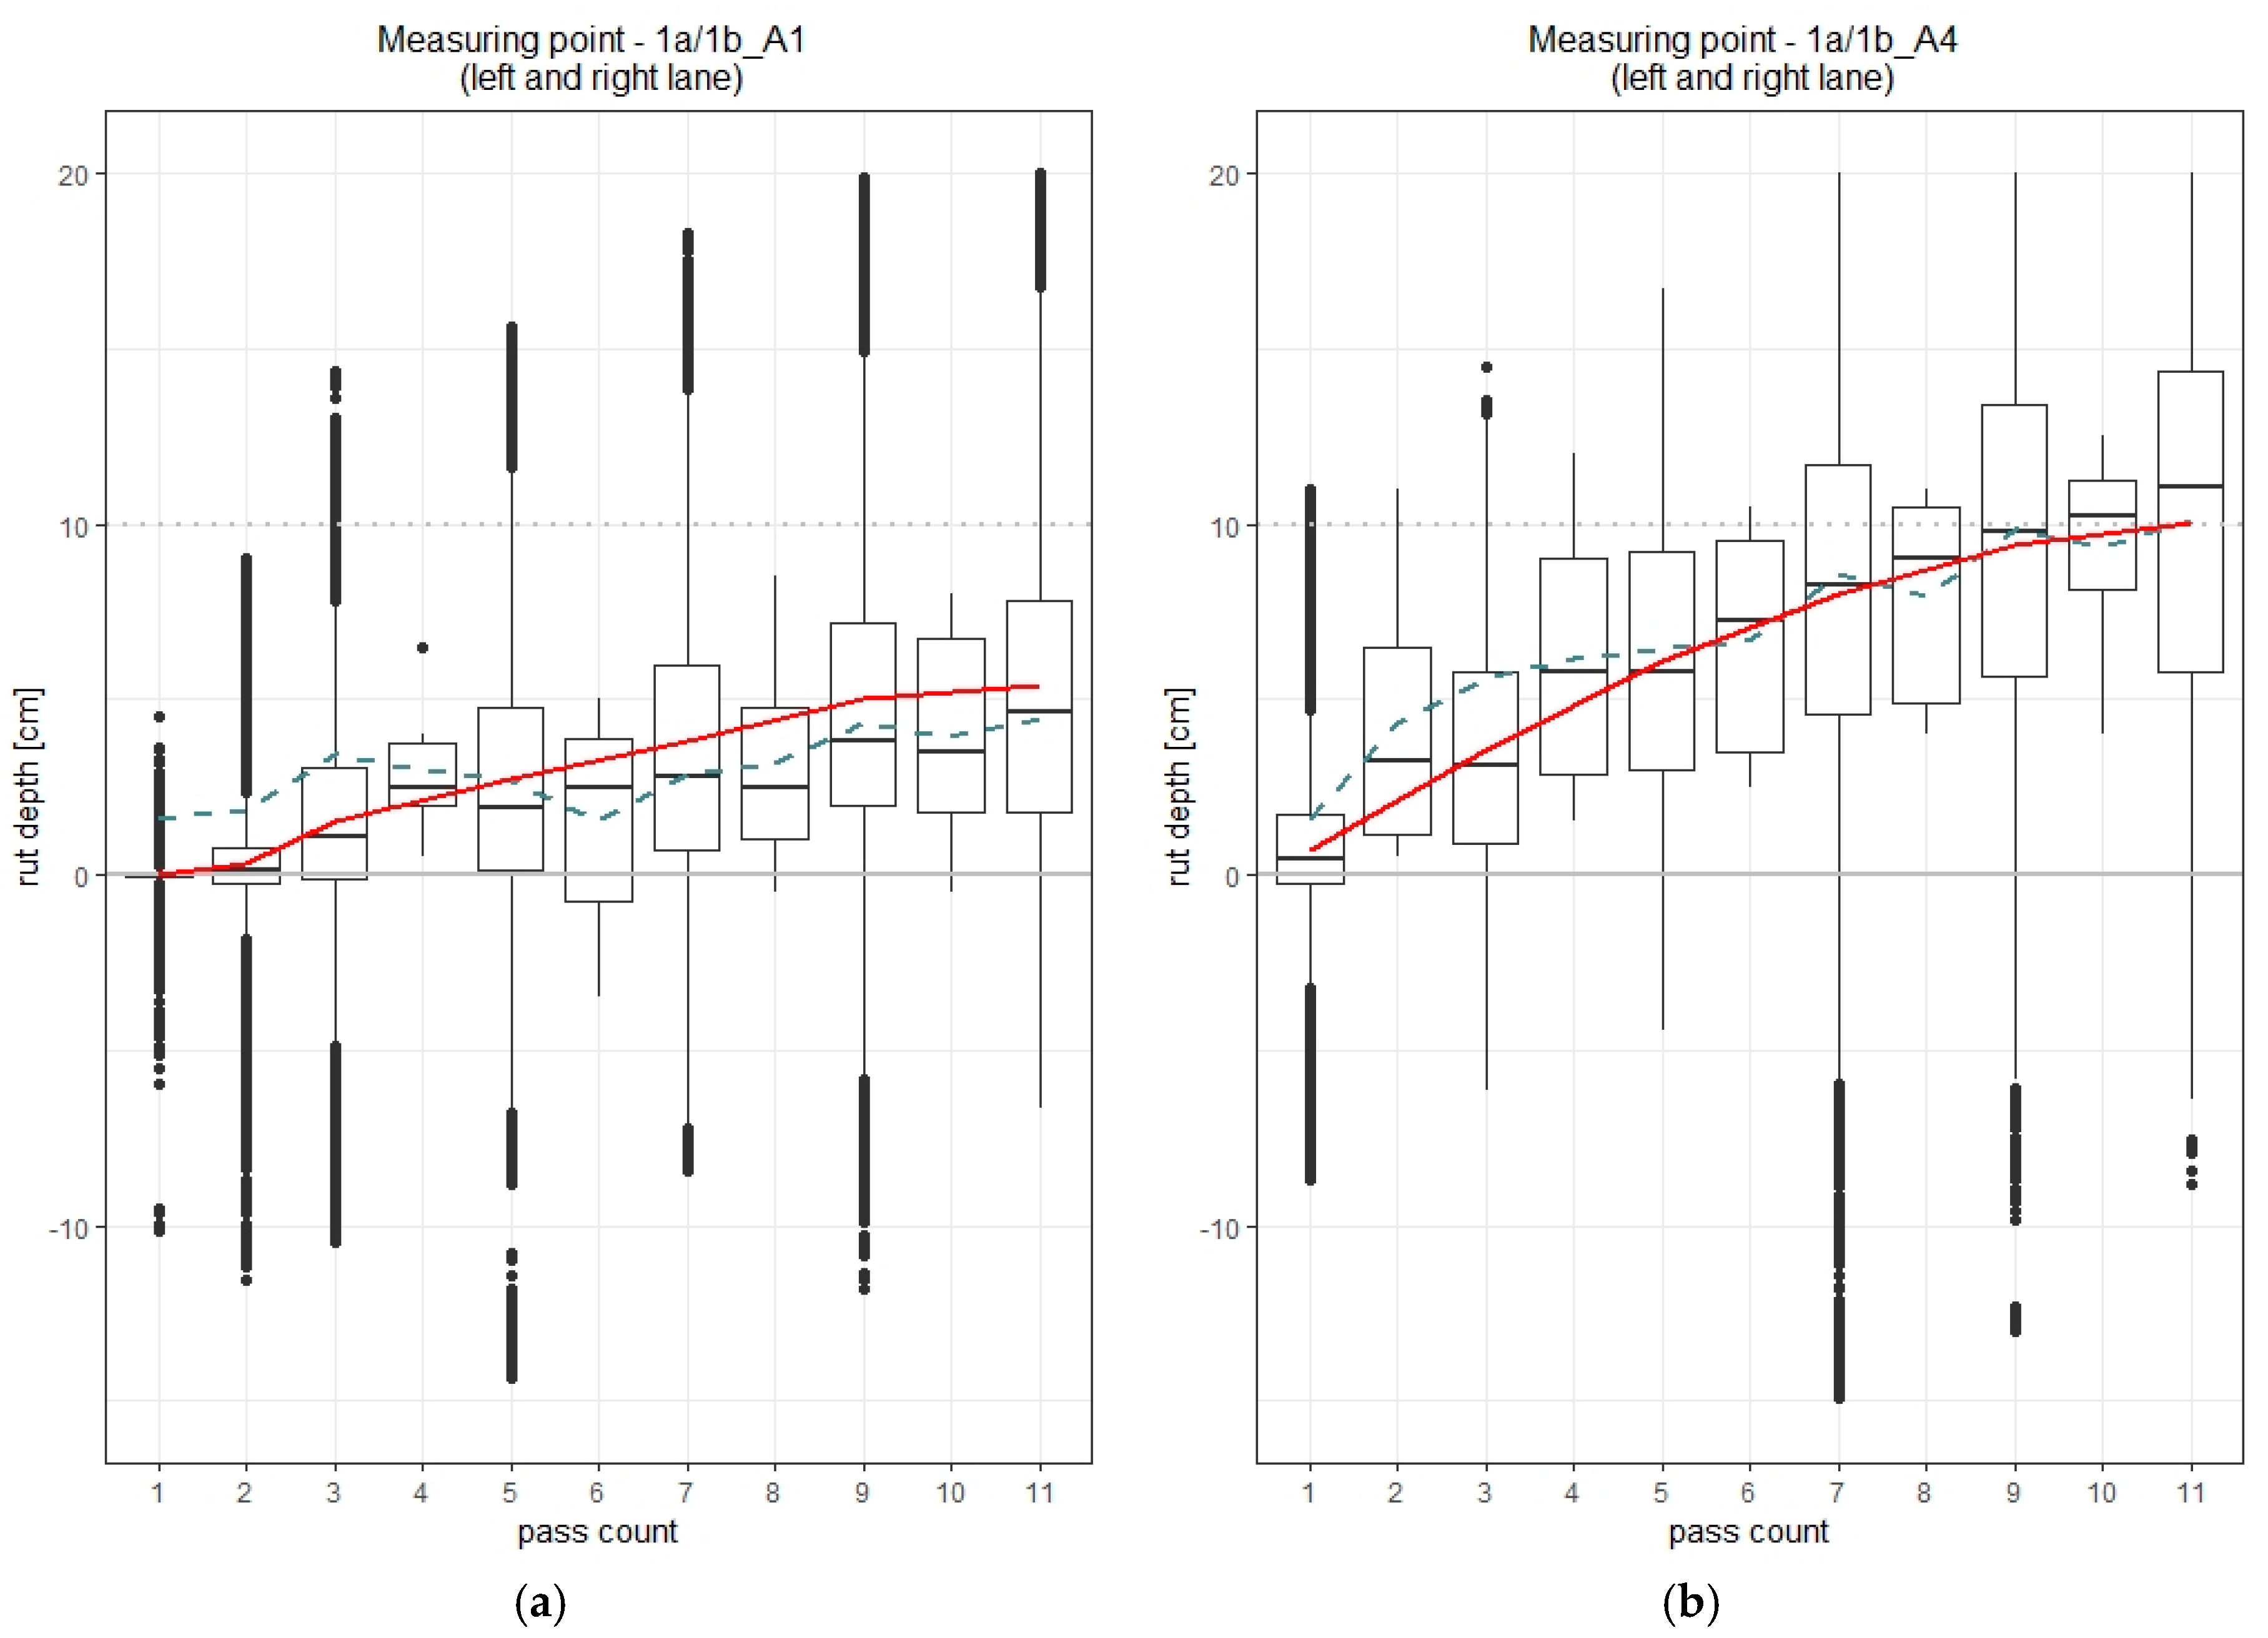
Figure 6 illustrates the TLS and manual data quality in direct comparison for two measuring points. Negative values are caused by local warping effects and objects that moved on the scan surface area. As in Figure 5, the variation of the two measuring points under the same soil types with comparable soil conditions is visible. The manual datasets and the TLS results thereby show the same tendencies towards deepening on the related measurement points but with a higher linearity in the TLS data.
Table 4 provides an overview of all data collected. At 76 kPa, the soil strength value of the 2a machine configuration lies 20% above the next comparable data series and is characterized by a relatively high mean shear strength value. The related dataset of manual measurements (2b) shows a lower mean value of 53 kPa and so focuses more on softer soil conditions. All other measurement point characterizations lie within the targeted range of soil classification.
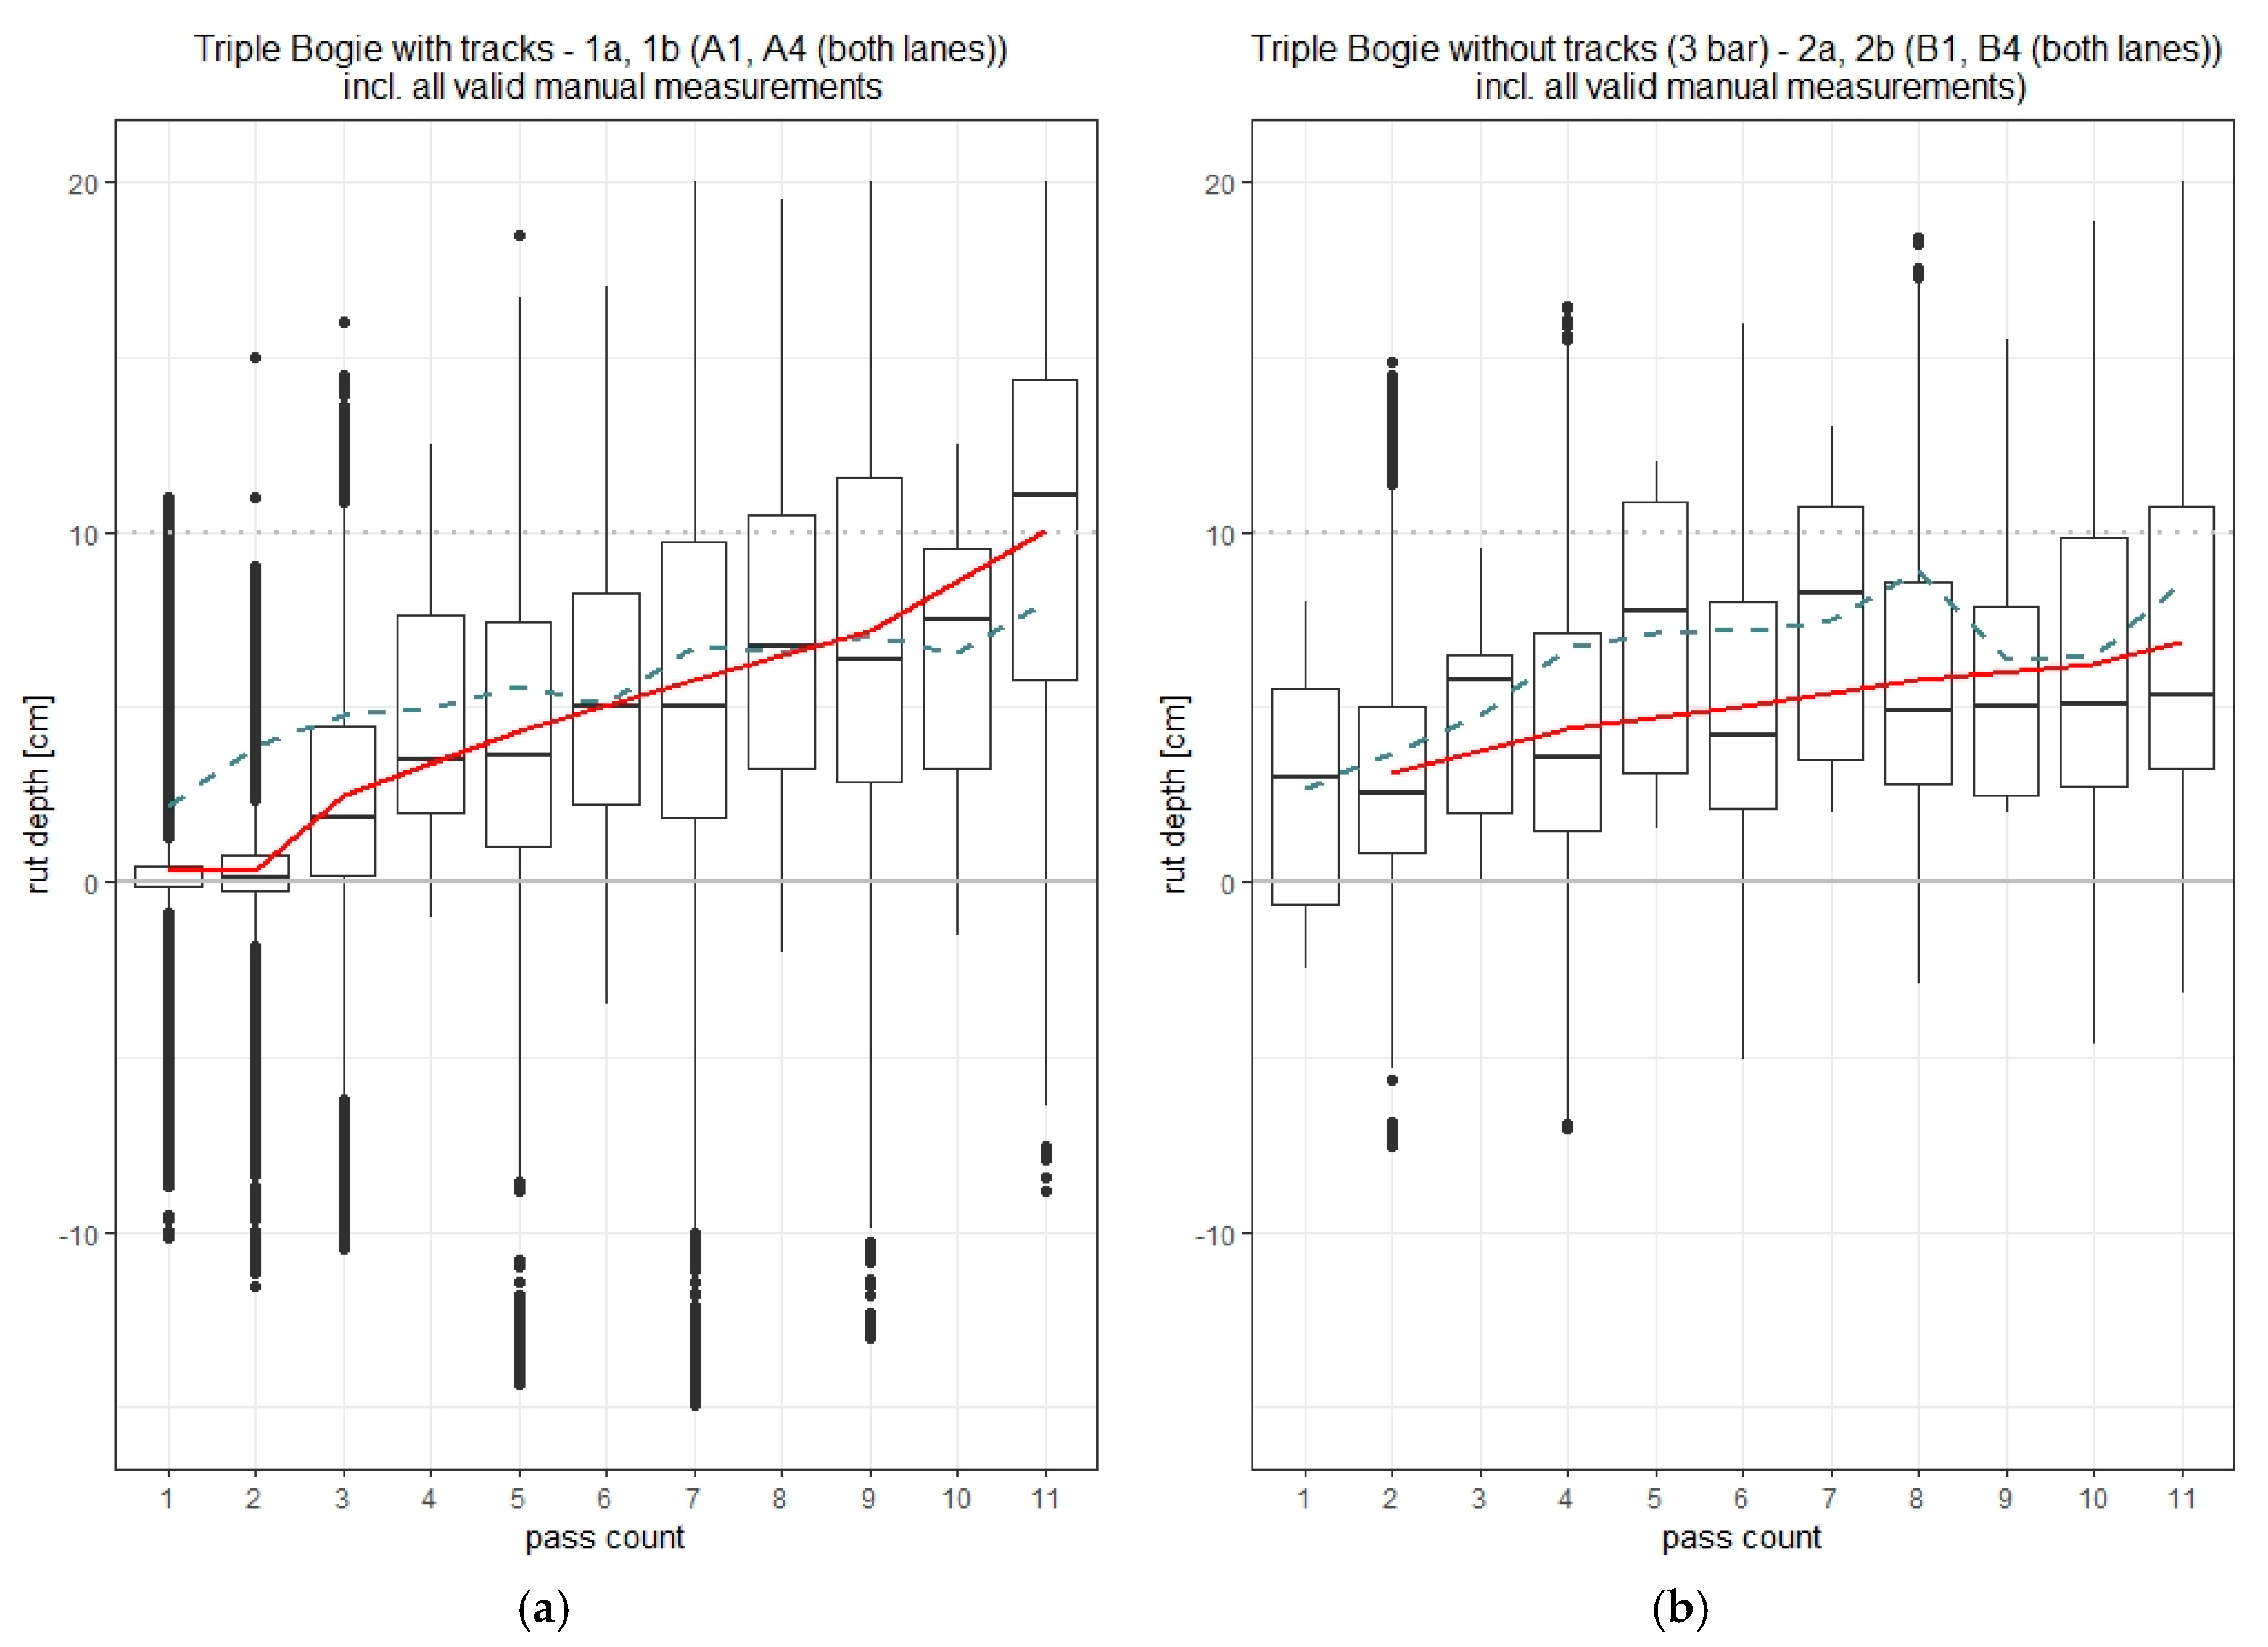
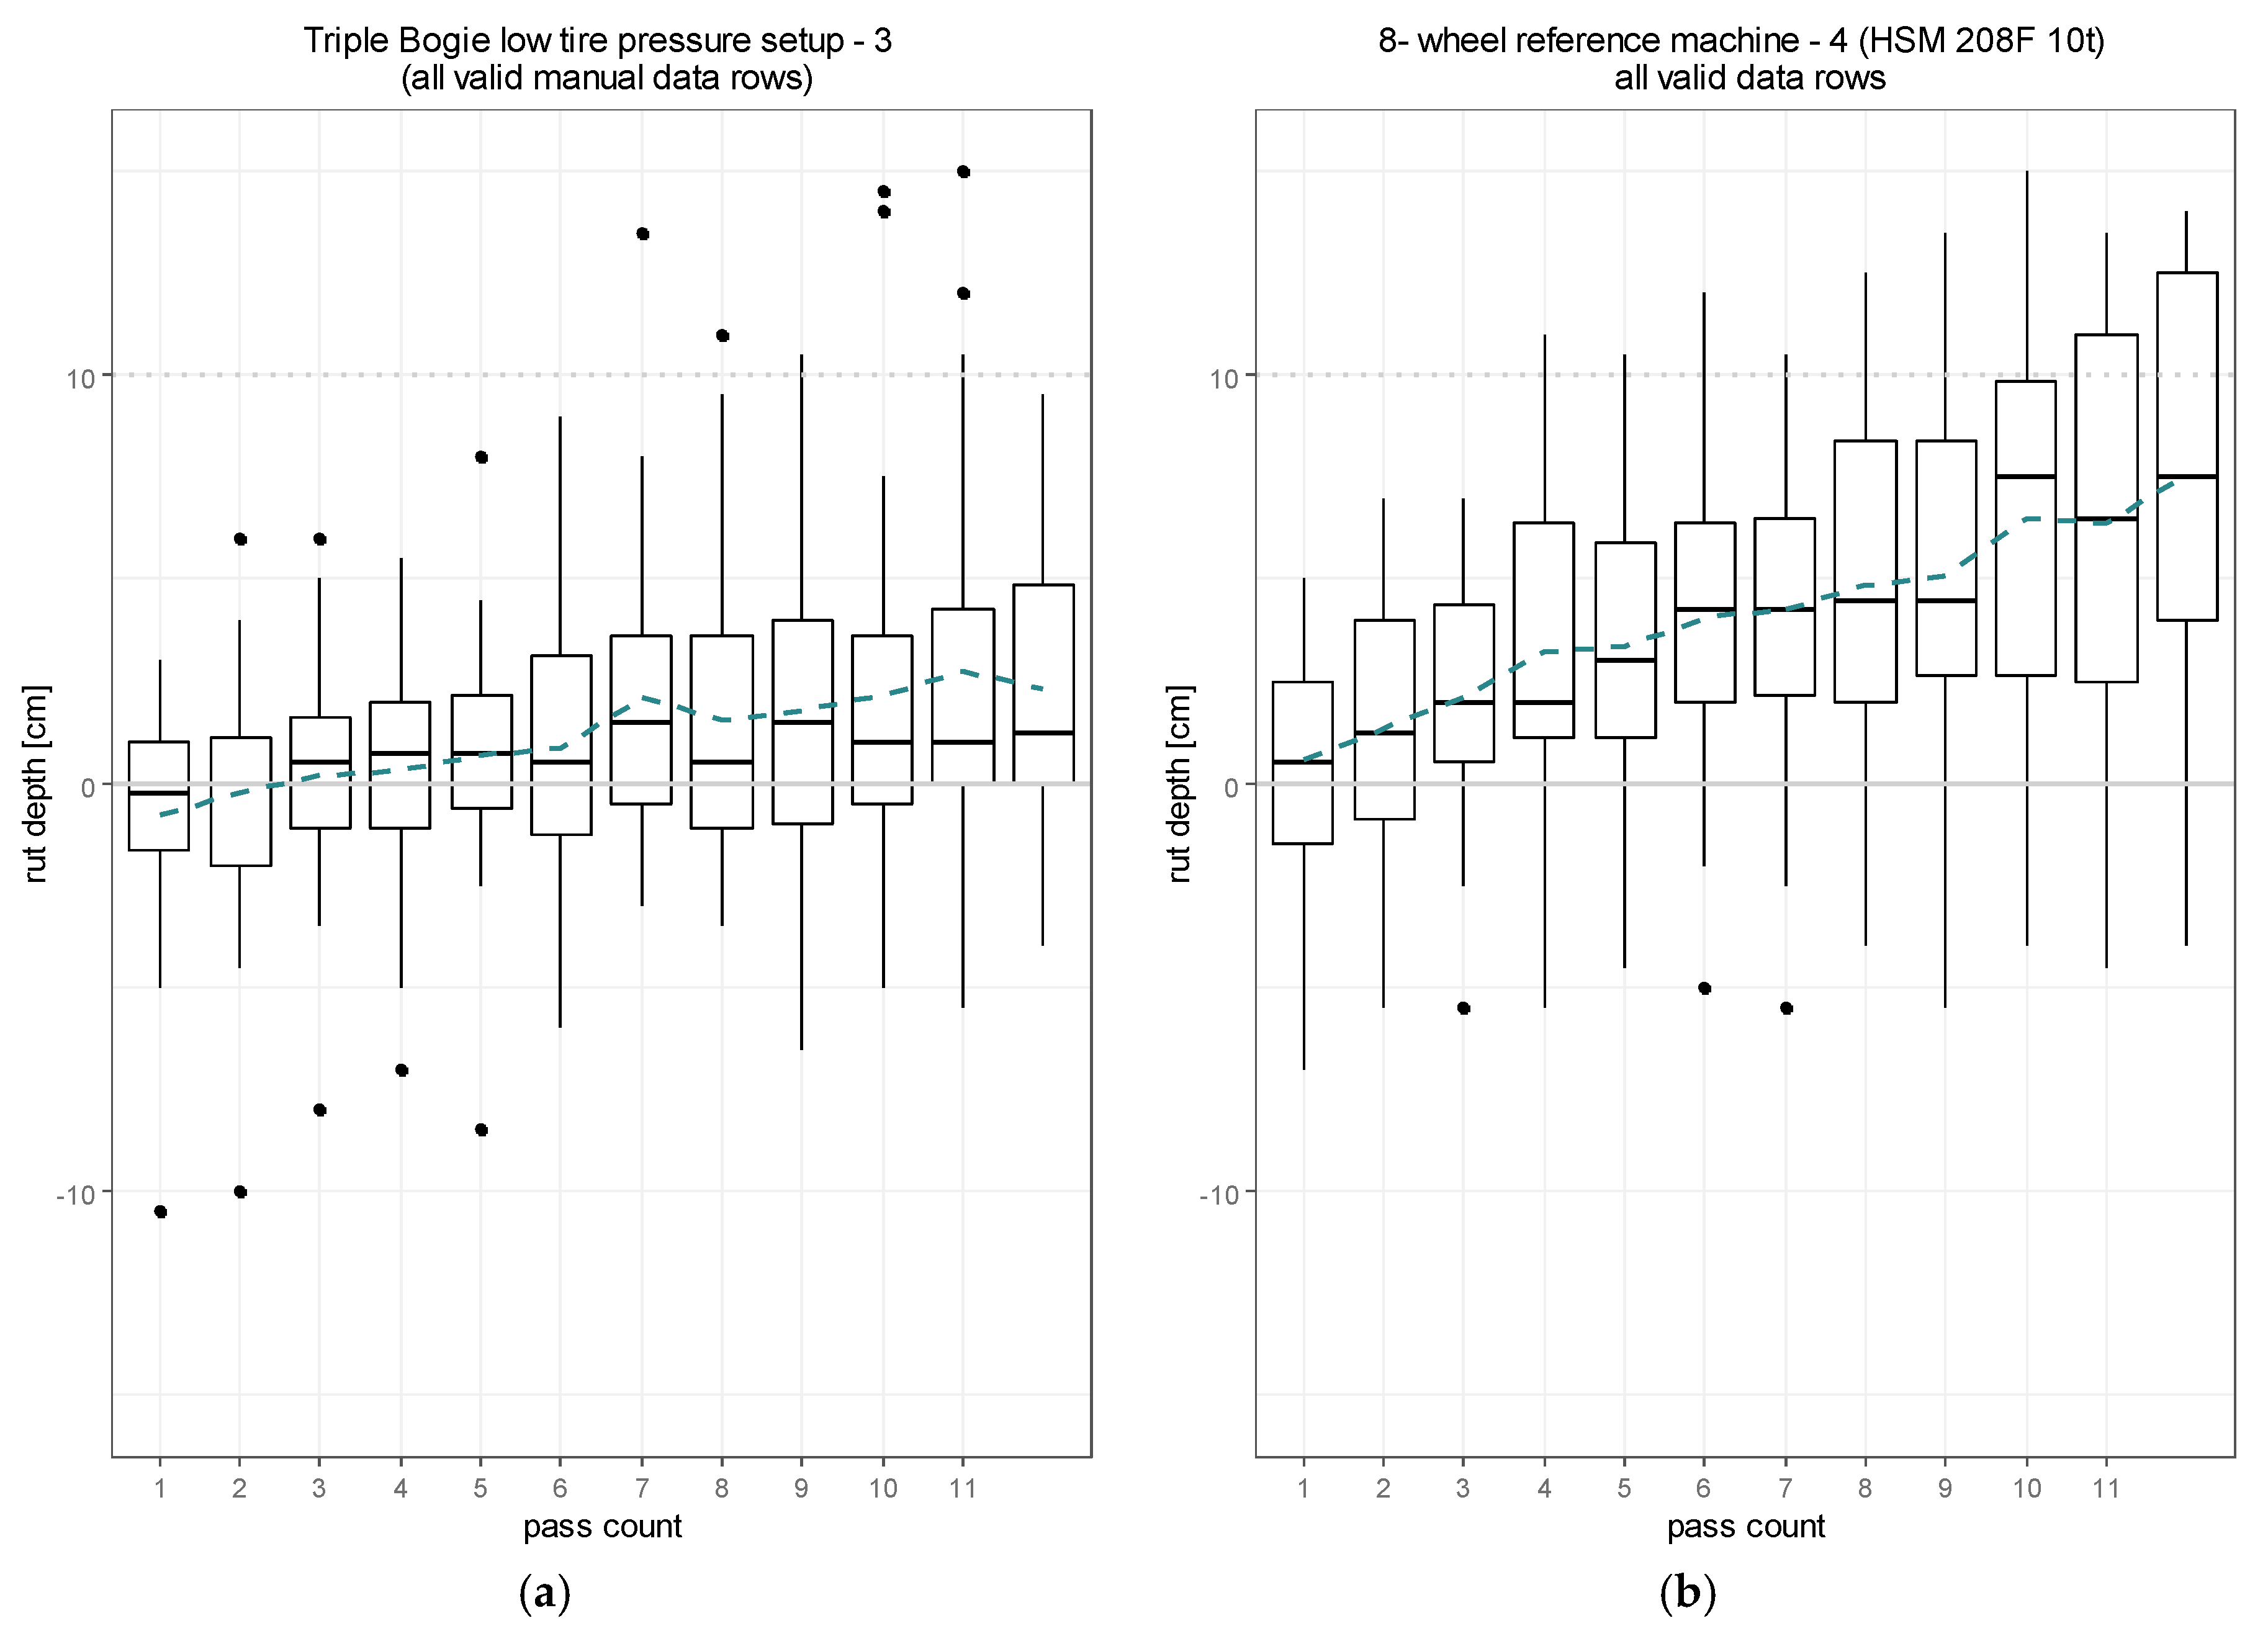
The results of the mean rut-depth development after each pass of the machine, and so the configuration characteristics and the machine behavior on the different machine setups (as described in Table 3), are visualized in Figure 7; Figure 8. Figure 7 shows the rut-depth development with the use of bogie tracks and without bogie tracks set with 3-bar tire pressure for the Tharandt measurement site. In Figure 8, the datasets collected in Schönheide are visualized. These series show the values of manual measurements of the TB setup related to the lower tire pressure adopted and the results of the 8-wheeled reference machine. Concerning the data quality of these manual measurement series, no issues are visible.
3.2. Comparison of Machine Setups
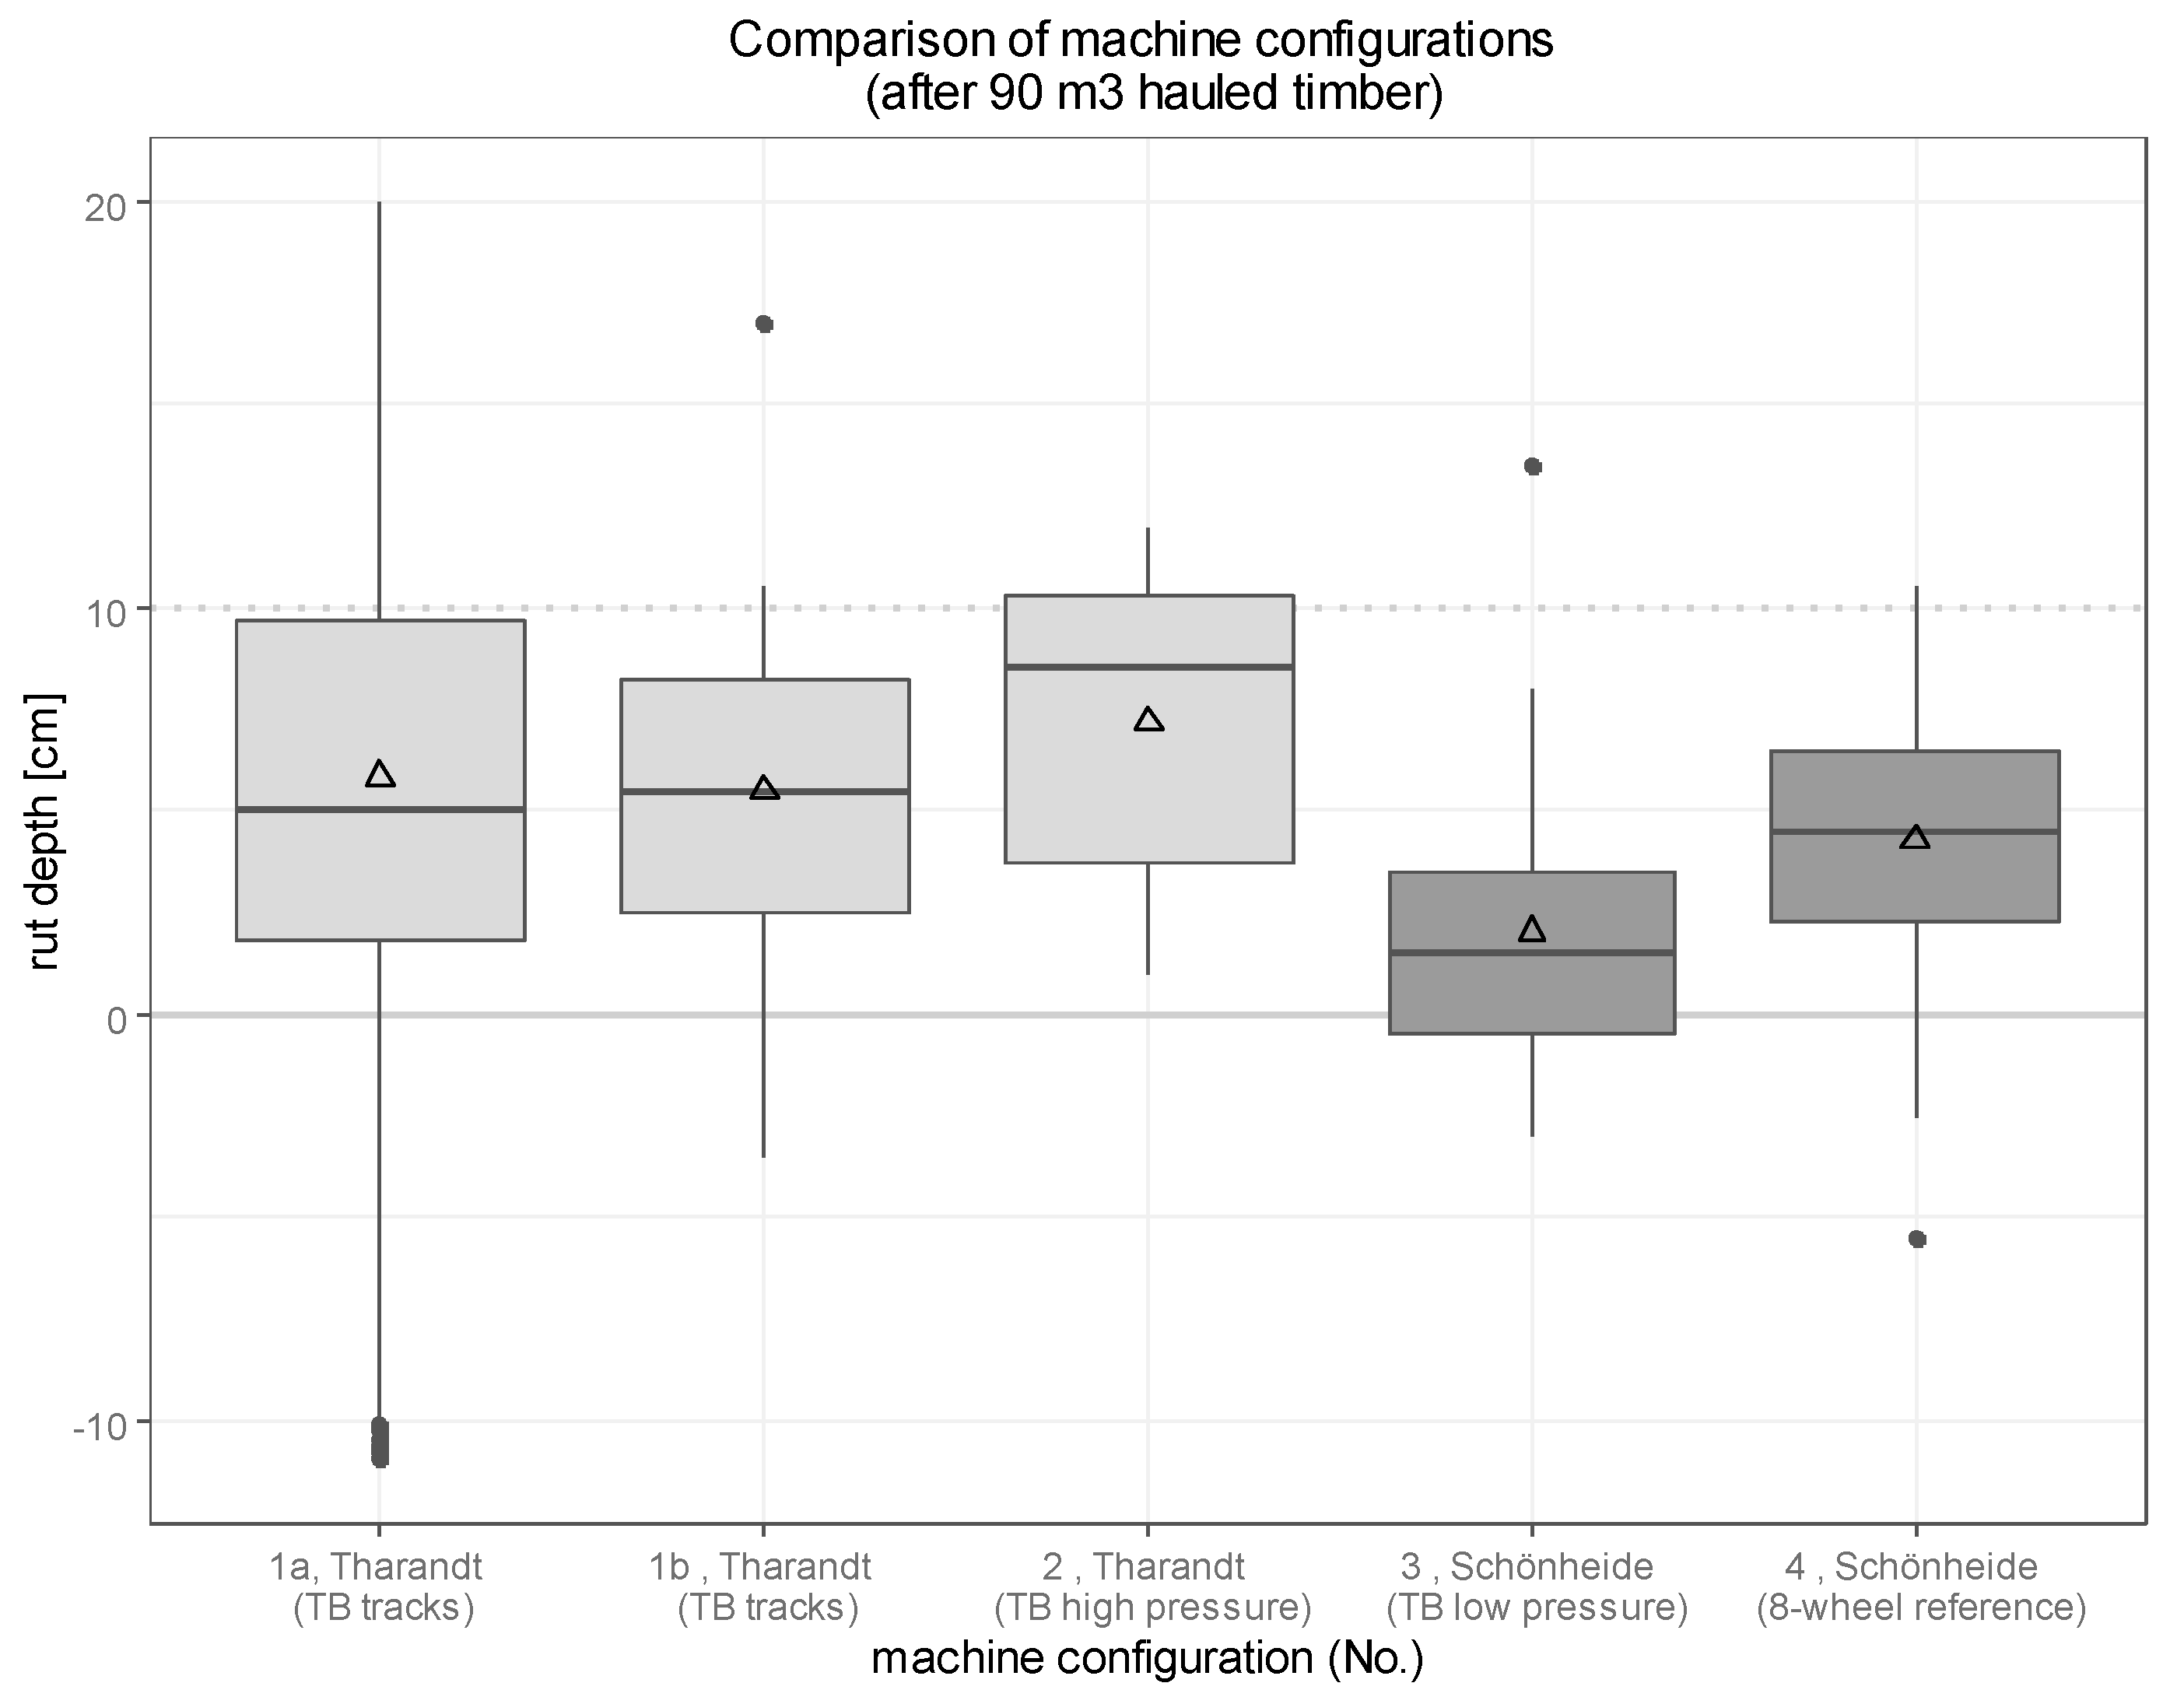
To enable a comparison of the different machine setups, the rutting effect is shown for all setups at a reference point of 90 m3 of timber hauled (Figure 9). As the loads and the machine configurations differ between the setups, the soil-stress level varies according to the reference weights listed in Table 3. The TLS dataset reference was changed due to the scanning layout being performed every second time. Therefore, the closest number of passes was missing and was substituted by the next higher value, representing 91 t of load.
The normality assumption was not rejected for all tested manual datasets (Shapiro-Wilk test p < 0.05), but the according qqPlots showed additional anomalies. The following group comparison (Wilcoxon Rank-Sum) shows that the groups differ significantly (p < 0.05). Table 5 shows the p-values of the pairwise comparison of all valid data series. In contrast to the Tharandt machine configurations, where no directly significant difference of rut expression on the same testing area is given, the Schönheide data series shows significant differences on the same testing area.
4. Discussion
A rut-depth limit of 10 cm was introduced as a basic benchmark for rating the soil impact similar to the fundamental soil-impact warning threshold for forest operations used in other studies [55]. Within this threshold, soil impairments (soil life, decomposing organic matter, germination capacity of tree seeds, rooting capacity, and soil structure for drainage) start to occur, but in a reversible manner of potential natural regeneration. This is necessary as basic guidance for a potential sustainable forest operation. Above this value, irreversible destruction of soil functionalities can be assumed [27]. In this regard, all examined machine setups fulfilled this requirement for a reference amount of 90 m3 timber hauled, indicating that they are suitable for use on related soil conditions.
To enable a direct comparison of the recorded absolute values with those of the reference data [36], our own reference machine results (Configuration 4) must be considered. A rut depth of more than 33.7 cm is expected for the standard setup without bogie tracks [36]. However, Configuration 4 is characterized by a low mean rut depth of only 4.3 cm. As the shear-strength values of all recorded data series lie within the defined limits of the reference data [36] for “very sensitive soil conditions (SC3)”, soil moisture is considered separately to estimate its influence in case of equal shear-strength classes. With a 29% lower moisture content compared to the valid range of the reference soil stability class, the dataset of the reference machine is particularly affected by this unexpected ratio of shear strength to moisture content. It therefore does not fit the expected requirements of the SC3 site classification in this case. This dataset thus seems to underestimate the results between the different measurement sites. Even though moisture content should influence the shear-strength value directly [41], it must be separately taken into consideration. Within the framework used in the reference study, the “less-sensitive soils (SC1)” class was chosen for the Schönheide datasets because of its tendency towards lower soil moisture content. The related higher shear strength of the reference soils in the new class suggests that these classes are related to different soil types. Nevertheless, the systems can still be compared on this basis as the TB system classification is characterized by higher technical requirements to avoid soil disturbances than the reference classification.
In this new reference range, the low-pressure TB setup, as the only related TB configuration, is ranked equally with the best reference machine setup, represented by the 8-wheel Clark Terra-X TXL 150 bogie track equipment with a mean rut depth of 2.2 cm after 90 m3 reference volume.
Furthermore, a significantly better result of the TB low-tire pressure setup compared to the 8-wheeled reference machine (p < 0.05) was observed at this measuring site, which underlines the consistency of the expected results.
In contrast to the already discussed measurements, those made in Tharandt are completely classified within the boundaries of the target range of the SC3 soil stability class. The results do not show any significant variations amongst the different setups of the tracked and high tire pressure machine configurations.
However, influences or disturbances of the data gathered in Tharandt become evident in the non-linear rut development of the manually gathered dataset (Figure 6; Figure 7). The manual data is therefore compared with the additionally collected TLS data to obtain clarity about the behavior. The occurred effects of the manually gathered data are not visible in the TLS data and thus seem to be either related to the manual measurement principle or are very locally expressed.
Another observation, visible in both the manual and the TLS data, is the difference in mean rut-depth development between the comparable measuring points 1a_A1 and 1a_A4. In the additional visual assessment of the multi-temporal DTMs (Figure 5), in the first (sample 1a_A1), second (sample 1a_A4), and especially the fourth image (sample 2a_B4), disturbances in the soil as areas with a higher soil stability appear at the beginning and the end of the right track. This also shows a related deepening effect behind the disturbance point and serves as an example of how the manual measurements can be both positively and negatively influenced by small- to medium-scale factors that are part of the machine behavior under real working conditions. The different expression of these structural changes at the 1a_A4 measuring point compared to the 1a_A1 point might be the reason for the relatively higher or lower values. As these influences are not obviously visible before starting measurements and are difficult to quantify without documentation, other studies have relied on open-area study sites like agricultural or similar areas [2,39,56] where these effects can be avoided. With a small number of sample points, as for the manual measurements, these expressions lead to a high variation in the data with a respective high standard error, especially between multiple data series. With the additional TLS data, the impact of one data point can be reduced, thus helping to raise the quality of the data and reduce the number of measuring points necessary. In this case, the standard error of means concerning one whole measurement point (1a/b_A1 with six sample points) was here reduced from 45% to 0.3%. The comparison of the manual data with the TLS measurements in Figure 5, the results in Figure 6, and also in view of the multiple frequency peaks underline the fact that, while one TLS measuring point tends to represent one unknown influenced situation, it does so very precisely. With just two repetitions of scans at two sites, the TLS data on its own therefore promises more objective results on representing a variety of different measurement point characteristics.
After discussing the potential influence parameters of the different measurements sites, a direct comparison of the Tharandt results with the previous results of the reference study [36] can only be made with care, as not all parameters of the reference study are known. Assuming comparable basic conditions in terms of the frequency and intensity of disturbance factors, the results of the tracked-bogie setup (∆zmean = 5.8 cm/5.5 cm) and the setup without bogie tracks and high tire pressure (∆zmean = 7.2 cm) would be most closely ranked with the best results of the reference study. This is represented by the Clark Terra-X TXL 150 bogie-track equipment on the 8-wheeled reference machines with a mean rut development of ∆zmean = 4.2 cm after 90 m3 of timber hauled. It must be mentioned that the relatively poor results of the high-pressure TB setup are still ranked within the range of all listed 8-wheeled bogie-track setups. The TB configuration without bogie tracks is at least an alternative to the use of 8-wheeled bogie track configurations as the differences in results are very small, even considering high tire pressure and in relation to track setups. This would confirm the previous study’s conclusions that 10-wheeled configurations would benefit from less heavy configurations [2]. The lowered tire pressure setup shows a further significant improvement of the non-tracked setups (p < 0.05). This conclusion must be taken with care, because the respective data series, as previously discussed, are related to different soil conditions. Although the coherent soil-conservation effect of lower tire pressure setups was observed [8,10] and was already known from different studies [8,9,57], this configuration should receive further attention in follow-up studies in direct comparison with other machines on similar soils and thus direct comparable testing conditions.
5. Conclusions
In this study, the rutting effect of the new HSM triple-bogie system on sensitive soil conditions was tested. The results show that an at least equally high soil-protection effect is achieved on flat terrain compared to standard 8-wheeled machines with bogie tracks. Even when no additional bogie tracks are used on the TB system setup, the results are very promising. In particular, this setup shows additional potential when optimizing/lowering tire pressure. Due to the diverging soil conditions and the resulting higher soil stability classes, this effect should receive further attention, especially on soft soil conditions.
The TLS data was very valuable in this study as it helped minimize the effort of manual data collection, increased the data quality, and showed additional potential for assessing selected data samples with the support of multi-temporal digital terrain models. Indeed, apart from measuring soil characteristics, manual data recording could be fully replaced by the presented longitudinal sample drawing method.
Author Contributions
Conceptualization, M.S., F.H., and M.Z.; methodology, M.S. and F.H.; validation, M.S., C.D., and F.H.; formal analysis, M.S. and C.D.; investigation, M.S., C.D., and F.H.; resources, M.S., C.D., F.H., and M.Z.; data curation, M.S. and C.D.; writing—original draft preparation, M.S., C.D., F.H., and M.Z.; writing—review and editing, M.S., C.D., F.H., and M.Z. visualization, M.S.; supervision, M.S., C.D., F.H., and M.Z.; project administration, M.Z.; funding acquisition, M.Z. All authors have read and agreed to the published version of the manuscript.
Funding
This project has received funding from the European Union’s Horizon 2020 research and innovation program under grant agreement No 727883.
Acknowledgments
We acknowledge the Forwarder2020 project partners’ contribution in data acquisition and are further grateful to Anton Kunneke for his technical support in data preparation and to Karl Stampfer for his support in structuring the article. We appreciate the constructive comments of the three anonymous reviewers.
Conflicts of Interest
The authors declare no conflict of interest. The funders had no role in the design of the study; in the collection, analyses, or interpretation of data; in the writing of the manuscript, or in the decision to publish the results.
References
- Frey, B.; Kremer, J.; Rüdt, A.; Sciacca, S.; Matthies, D.; Lüscher, P. Compaction of forest soils with heavy logging machinery affects soil bacterial community structure. Eur. J. Soil Biol. 2009, 45, 312–320. [Google Scholar] [CrossRef]
- Ala-Ilomäki, J.; Högnäs, T.; Lamminen, S.; Sirén, M. Equipping a Conventional Wheeled Forwarder for Peatland Operations. Int. J. For. Eng. 2011, 22, 7–13. [Google Scholar] [CrossRef]
- Contosta, A.R.; Casson, N.J.; Garlick, S.; Nelson, S.J.; Ayres, M.P.; Burakowski, E.A.; Campbell, J.; Creed, I.; Eimers, C.; Evans, C.; et al. Northern forest winters have lost cold, snowy conditions that are important for ecosystems and human communities. Ecol. Appl. 2019, 29, e01974. [Google Scholar] [CrossRef] [PubMed]
- Soja, A.J.; Tchebakova, N.M.; French, N.H.F.; Flannigan, M.D.; Shugart, H.H.; Stocks, B.J.; Sukhinin, A.I.; Parfenova, E.I.; Chapin, F.S.; Stackhouse, P.W. Climate-induced boreal forest change: Predictions versus current observations. Glob. Planet. Chang. 2007, 56, 274–296. [Google Scholar] [CrossRef] [Green Version]
- Rittenhouse, C.D.; Rissman, A.R. Changes in winter conditions impact forest management in north temperate forests. J. Environ. Manag. 2015, 149, 157–167. [Google Scholar] [CrossRef] [PubMed]
- Labelle, E.R.; Poltorak, B.J.; Jaeger, D. The role of brush mats in mitigating machine-induced soil disturbances: An assessment using absolute and relative soil bulk density and penetration resistance. Can. J. For. Res. 2019, 49, 164–178. [Google Scholar] [CrossRef]
- Kremer, J.; Wolf, B.; Matthies, D.; Borchert, H. Bodenschutz Beim Forstmaschineneinsatz [Soil Protection when Using Forest Machinery]. LWF Merkblatt 2012, 22. Available online: http://www.lwf.bayern.de/mam/cms04/service/dateien/mb-22-bodenschutz.pdf (accessed on 6 August 2020). (In Germany).
- Marra, E.; Cambi, M.; Fernandez-Lacruz, R.; Giannetti, F.; Marchi, E.; Nordfjell, T. Photogrammetric estimation of wheel rut dimensions and soil compaction after increasing numbers of forwarder passes. Scand. J. For. Res. 2018, 33, 613–620. [Google Scholar] [CrossRef]
- Ziesak, M. Entwicklung eines Informationssystems zum bodenschonenden Forstmaschineneinsatz. [Development of an information system for soil-conserving forestry machine use]. Ph.D. Thesis, Technische Universität München, Freising, Germany, 13 October 2004. Available online: https://mediatum.ub.tum.de/doc/603531/603531.pdf (accessed on 6 August 2020). (In Germany).
- Sakai, H.; Nordfjell, T.; Suadicani, K.; Talbot, B.; Bøllehuus, E. Soil Compaction on Forest Soils from Different Kinds of Tires and Tracks and Possibility of Accurate Estimate. Croat. J. For. Eng. 2008, 29, 15–27. [Google Scholar]
- Bygdén, G.; Eliasson, L.; Wästerlund, I. Rut depth, soil compaction and rolling resistance when using bogie tracks. J. Terramech. 2003, 40, 179–190. [Google Scholar] [CrossRef]
- John Deere. 1010G Forwarder. Available online: https://www.deere.co.uk/en/forwarders/1010g/ (accessed on 12 December 2019).
- PONSSE. PONSSE Forwarder Systems. Available online: https://www.ponsse.com/products/information-systems/product#/forwarder_systems (accessed on 15 August 2019).
- EMB Baumaschinen GmbH. Elliator. Available online: https://www.elliator.com/ (accessed on 12 December 2019).
- Talbot, B.; Björheden, R.; Poikela, A.; Lazdins, A.; Kopetzky, M. Forest Operations in Response to Environmental Challenges: The OnTrack forwarder—Results and experiences from constructing and testing a rubber-tracked forwarder with low ground pressure. In Proceedings of the Nordic-Baltic Conference on Operational Research (NB-NORD), Honne, Norway, 3–5 June 2019; Volume 5, pp. 32–34. Available online: https://nordicforestresearch.org/wp-content/uploads/2019/06/Proceedings-Lowres-Honne-2019.pdf (accessed on 6 August 2020).
- Wahlers Forsttechnik GmbH. PONSSE 10w. Available online: https://wahlersforsttechnik.de/Produkte/ponsse-10w/ (accessed on 28 January 2020).
- Edlund, J.; Keramati, E.; Servin, M. A long-tracked bogie design for forestry machines on soft and rough terrain. J. Terramech. 2013, 50, 73–83. [Google Scholar] [CrossRef]
- Edlund, J.; Bergsten, U.; Arvidsson, H. A forest machine bogie with a bearing capacity dependent contact area: Acceleration and angular orientation when passing obstacles and drawbar pull force and free rolling resistance on firm ground. Silva Fenn. 2013, 47. [Google Scholar] [CrossRef]
- HSM Hohenloher Spezial-Maschinenbau GmbH und Co. KG. HSM 208F 10t 2020—Datasheet, 2018.
- Cambi, M.; Certini, G.; Neri, F.; Marchi, E. The impact of heavy traffic on forest soils: A review. For. Ecol. Manag. 2015, 338, 124–138. [Google Scholar] [CrossRef]
- Porinsky, T.; Pentek, T.; Bosner, A.; Stanki, I. Ecoefficient Timber Forwarding on Lowland Soft Soils. In Global Perspectives on Sustainable Forest Management: Ecoefficient Timber Forwarding on Lowland Soft Soils; Okia, C.A., Ed.; Intec: Rijeka, Croatia, 2012; ISBN 978-953-51-0569-5. [Google Scholar]
- Labelle, E.R. Effects of brush mats and machine characteristics on dynamic peak loads and surface contact pressures exerted by forest machinery. Ph.D. Thesis, The University of New Brunswick, Fredericton, NB, Canada, 2012. [Google Scholar] [CrossRef]
- Venanzi, R.; Picchio, R.; Spinelli, R.; Grigolato, S. Soil Disturbance and Recovery after Coppicing a Mediterranean Oak Stand: The Effects of Silviculture and Technology. Sustainability 2020, 12, 4074. [Google Scholar] [CrossRef]
- Labelle, E.R.; Jaeger, D. Soil Compaction Caused by Cut-to-Length Forest Operations and Possible Short-Term Natural Rehabilitation of Soil Density. Soil Sci. Soc. Am. J. 2011, 75, 2314–2329. [Google Scholar] [CrossRef] [Green Version]
- Cullen, S.J.; Montagne, C.; Ferguson, H. Timber Harvest Trafficking and Soil Compaction in Western Montana. Soil Sci. Soc. Am. J. 1991, 55, 1416–1421. [Google Scholar] [CrossRef]
- Frutig, F.; Lüscher, P. Was bringt das Rücken mit halber Ladung? Bodenverdichtung und Spurbildung auf Rückegassen. [What’s the point of working with half a load? Soil compaction and rut development on skid trails]. Wald Holz 2015, 8, 49–52. (In Germany) [Google Scholar]
- Lüscher, P.; Frutig, F.; Thees, O. Physikalischer Bodenschutz im Wald: Waldbewirtschaftung im Spannungsfeld zwischen Wirtschaftlichkeit und Erhaltung der physikalischen Bodeneigenschaften; [Physical soil protection in forests: Forest management in the area of conflict between economic efficiency and preservation of physical soil properties]; Bundesamt für Umwelt: Bern, Switzerland, 2016; Umwelt-Wissen Nr. 1607; p. 159. Available online: https://www.bafu.admin.ch/dam/bafu/de/dokumente/wald-holz/uw-umwelt-wissen/physikalischer_bodenschutzimwald.pdf.download.pdf/physikalischer_bodenschutzimwald.pdf (accessed on 6 August 2020). (In Germany)
- Aust, W.M.; Burger, J.A.; Carter, E.A.; Preston, D.P.; Patterson, S.C. Visually Determined Soil Disturbance Classes Used as Indices of Forest Harvesting Disturbance. South. J. Appl. For. 1998, 22, 245–250. [Google Scholar] [CrossRef] [Green Version]
- Spinelli, R.; Magagnotti, N.; Nati, C. Benchmarking the impact of traditional small-scale logging systems used in Mediterranean forestry. For. Ecol. Manag. 2010, 260, 1997–2001. [Google Scholar] [CrossRef]
- Talbot, B.; Rahlf, J.; Astrup, R. An operational UAV-based approach for stand-level assessment of soil disturbance after forest harvesting. Scand. J. For. Res. 2018, 33, 387–396. [Google Scholar] [CrossRef] [Green Version]
- Giannetti, F.; Chirici, G.; Travaglini, D.; Bottalico, F.; Marchi, E.; Cambi, M. Assessment of Soil Disturbance Caused by Forest Operations by Means of Portable Laser Scanner and Soil Physical Parameters. Soil Sci. Soc. Am. J. 2017, 81, 1577–1585. [Google Scholar] [CrossRef]
- Koren, M.; Slančík, M.; Suchomel, J.; Dubina, J. Use of terrestrial laser scanning to evaluate the spatial distribution of soil disturbance by skidding operations. iForest 2015, 8, 386–393. [Google Scholar] [CrossRef]
- Naghdi, R.; Solgi, A.; Zenner, E.K.; Tsioras, P.A.; Nikooy, M. Soil disturbance caused by ground-based skidding at different soil moisture conditions in Northern Iran. Int. J. For. Eng. 2016, 27, 169–178. [Google Scholar] [CrossRef]
- Sirén, M.; Salmivaara, A.; Ala-Ilomäki, J.; Launiainen, S.; Lindeman, H.; Uusitalo, J.; Sutinen, R.; Hänninen, P. Predicting forwarder rut formation on fine-grained mineral soils. Scand. J. For. Res. 2019, 34, 145–154. [Google Scholar] [CrossRef]
- Eliasson, L. Effects on Forwarder Tyre Pressure on Rut Formation and Soil Compaction. Silva Fenn. 2005, 39, 549–557. [Google Scholar] [CrossRef] [Green Version]
- Heubaum, F.; Padberg, A. Praxisobjekt zur bodenschonenden Holzernte mit Bogie-Bändern. [Field trial for soil-conserving timber harvesting with bogie tracks]. AFZ/Wald 2014, 17, 16–20. (In Germany) [Google Scholar]
- Pierzchała, M.; Talbot, B.; Astrup, R. Measuring wheel ruts with close-range photogrammetry. Forestry 2016, 89, 383–391. [Google Scholar] [CrossRef] [Green Version]
- Cambi, M.; Giannetti, F.; Bottalico, F.; Travaglini, D.; Nordfjell, T.; Chirici, G.; Marchi, E. Estimating machine impact on strip roads via close-range photogrammetry and soil parameters: A case study in central Italy. iForest 2018, 11, 148–154. [Google Scholar] [CrossRef] [Green Version]
- Haas, J.; Hagge Elhöft, K.; Schack-Kirchner, H. Spurgleisbildung bei der Befahrung mit Forwardern. Vergleich Unterschiedlicher Bereifungsvarianten Hinsichtlich Erhaltung der Technischen Befahrbarkeit von Rückegassen in der Mechanisierten Holzernte; [Rut development in forwarder use. Comparison of different tyre variants with regard to maintaining the technical usability of skid trails in mechanised timber harvesting]; University of Freiburg: Freiburg, Germany, 2013. Unpublished work. (In Germany) [Google Scholar]
- Cambi, M.; Grigolato, S.; Neri, F.; Picchio, R.; Marchi, E. Effects of Forwarder Operation on Soil Physical Characteristics: A Case Study in the Italian Alps. Croat. J. For. Eng. 2016, 37, 233–239. [Google Scholar]
- Poršinsky, T.; Sraka, M.; Stankić, I. Comparison of two approaches to soil strength classifications. Croat. J. For. Eng. 2006, 27, 17–26. [Google Scholar]
- Jacke, H.; Hittenbeck, J.; Stiehm, C. Spuren im Wald: Zur Spurrillen-Diskussion um und auf Rückegassen. [Forest tracks: Contributing to the wheel rut discussion on skid trails]. In Ifa Mitteilungen, Reihe A Heft 9; Abteilung Arbeitswissenschaften und Verfahrenstechnologie der Universität Göttingen: Göttingen, Germany, 2011. (In Germany) [Google Scholar]
- Heubaum, F. Bodenscherfestigkeit auf Rückegassen. [Soil shear strength on skid trails]. Forst Tech. 18–22. Available online: https://www.waldwissen.net/technik/holzernte/boden/sbs_scherfestigkeit/sbs_scherfestigkeit_originalpdf.pdf (accessed on 6 August 2020). (In Germany).
- Jansson, K.-J.; Johansson, J. Soil changes after traffic with a tracked and a wheeled forest machine: A case study on a silt loam in Sweden. Forestry 1998, 71, 57–66. [Google Scholar] [CrossRef] [Green Version]
- Wüthrich, M. Vorteile des Triplebogies im Forwardereinsatz. [Advantages of the triple-bogie in forwarder use]. Bachelor’s Thesis, Bern University of Applied Sciences, Zollikofen, Switzerland, 10 August 2018. [Google Scholar]
- Holzerntetechnologien. Richtlinie zur Anwendung im Staatswald des Freistaates Sachsen. [Timber harvesting technologies. Guideline for application in the state forest of the Free State of Saxony]. Guideline. 2006. Available online: https://docplayer.org/58632673-Holzerntetechnologien-richtlinie-zur-anwendung-im-staatswald-des-freistaates-sachsen-staatsbetrieb-sachsenforst.html (accessed on 7 August 2020). (In Germany).
- Najafi, A.; Solgi, A.; Sadeghi, S.H. Soil disturbance following four wheel rubber skidder logging on the steep trail in the north mountainous forest of Iran. Soil Tillage Res. 2009, 103, 165–169. [Google Scholar] [CrossRef]
- World reference base for soil resources. International Soil Classification System for Naming Soils and Creating Legends for Soil Maps; FAO: Rome, Italy, 2014; ISBN 978-92-5-108369-7. [Google Scholar]
- Benning, R.; Petzold, R.; Danigel, J. Umweltdatenbank Bodenprofile. [Environmental data repository soil profiles]. BWI 2012, 2019.
- HSM Hohenloher Spezial-Maschinenbau GmbH und Co. KG. HSM 208F BigFoot. Available online: https://www.hsm-forest.net/hsm-208f-bigfoot-en.html (accessed on 17 January 2020).
- Geiger, C.; Geimer, M. Efficiency Optimisation of a Forestry Crane by Implement Hydraulics with Energy Recovery. In Proceedings of the VDI-MEG Conference: Agricultural Engineering—Land. Technik AgEng, Hannover, Germany, 10–11 November 2017; VDI Verlag: Düsseldorf, Germany, 2017. [Google Scholar]
- Gabriel, O. Triple Bogie. Forst und Technik; 2019, Sonderheft 2019, 54–57. (In Germany).
- HSM Hohenloher Spezial-Maschinenbau GmbH und Co. KG. HSM 208F 10t Kombi short/long. Available online: https://www.hsm-forest.net/hsm-208f-10-t-kombi-short-long.html (accessed on 20 January 2019).
- The CRAN R-Project. The CRAN R-Project. Available online: https://cran.r-project.org/ (accessed on 23 April 2020).
- Heubaum, F. Bodenschutz im Staatsbetrieb Sachsenforst. Projekte zur Technologiererprobung. [Soil protection in the state enterprise Sachsenforst. Projects for testing technology]. 2014. Available online: https://www.sbs.sachsen.de/download/Bodenschutz_Projekte_2015_09_30.pdf (accessed on 30 August 2018). (In Germany).
- Björheden, R. Arbetsrapport 989–2018. Rutting and Vibration Levels of the on Track Concept Forwarder on Standardised Test Tracks. 2018. Available online: https://www.skogforsk.se/contentassets/54df1878341a454ea81955692d7dd4f2/arbetsrapport-989-2018.pdf (accessed on 5 February 2020).
- McDonald, T.; Way, T.; Löfgren, B.; Seixas, F.; Landström, M. Load and inflation pressure effects on soil compaction of forwarder tires. In Proceedings of the Joint Conference of the Canadian Woodlands Forum, Canadian Pulp and Paper Association and the International Union of Forest Research Organisations, Quebec City, QC, Canada, 9–11 September 1996; pp. 67–70. [Google Scholar]
Figure 1.
Measuring point, consisting of max. eight sample points for the manual measurements in horizontal (top) and vertical (bottom) schematic view (changed after [33,42,44,47]).

Figure 2.
Schematic presentation of samples taken from the TLS datasets in (a) cross-section and (b) bird’s eye view: measurement point length 7.8 m and width 0.2 m.
Figure 2.
Schematic presentation of samples taken from the TLS datasets in (a) cross-section and (b) bird’s eye view: measurement point length 7.8 m and width 0.2 m.

Figure 3.
Schematic presentation of the Forwarder2020 base machine with the TB-BigFoot configuration [19].
Figure 3.
Schematic presentation of the Forwarder2020 base machine with the TB-BigFoot configuration [19].

Figure 4.
Tire pressure setup of the low-pressure measurements.

Figure 5.
Visualization of the TLS measurement points after 11 passes, showing the absolute difference in z-direction (blue: 10 cm deepening, red: 10 cm warping color thresholds): 1a ((a) 1a_A1, (b) 1a_A4), 2a ((c) 2a_B1, (d) 2a_B4).
Figure 5.
Visualization of the TLS measurement points after 11 passes, showing the absolute difference in z-direction (blue: 10 cm deepening, red: 10 cm warping color thresholds): 1a ((a) 1a_A1, (b) 1a_A4), 2a ((c) 2a_B1, (d) 2a_B4).

Figure 6.
TLS results (red line, pass no: 1,2,3,5,7,9,11) of the measuring points (a) A1 (n = 12, τ = 61 kPa, sdτ = 15 kPa, VMC = 43%, sdVMC = 1.1%) and (b) A4 (n = 12, τ = 58 kPa, sdτ = 24 kPa, VMC = 46%, sdVMC = 5.6%), showing the related rutting effect on point 1a_A1 (∆zmean pass 7 = 3.79 cm, sdpass 7 = 4.21 cm, SEMpass 7 = 0.01 cm (0.3% ), 1a_A4 (∆zmean pass 7 = 8.01 cm, sdpass 7 = 4.56 cm, SEMpass 7 = 0.01 cm (0.2%)) and the associated manual data (blue, dashed line, pass no: 1–11, 1b_A1 (n = 6 × 11, ∆zmean pass 7 = 2.83 cm, sdpass 7 = 3.13 cm, SEMpass 7 = 1.28 cm (45%)) 1b_A4 (n = 6 × 11, ∆zmean pass 7 = 8.58 cm, sdpass 7 = 4.02 cm, SE pass 7 = 1.64 cm (19%))).

Figure 7.
Rut-depth development data of TLS and manual measurements for each pass of the triple-bogie configuration (a) with bogie tracks and (b) without bogie tracks; the mean of the series values are visualized as a red line for the TLS data (row 1a left (n = 2.03 m), row 2a (right, n = 0.57 m)) and for all valid manual measurements as a dashed blue line (row 1b ((a), n = 16 × 11) and row 2b ((b), n = 6 × 11)).

Figure 8.
Rut-depth development data of manual measurements for each pass of the (a) triple-bogie configuration with lowered tire air pressure and (b) the results of the reference machine; the mean of the series values are visualized as a dashed blue line (row 3 ((a), n = 29 × 11) and row 4 ((b), n = 23 × 11)).

Figure 9.
Machine setup comparison incl. the visualization of the mean value (triangle) and the median (horizontal line) of the tracked machine (TLS data: 1a (∆zmean = 5.8 cm for 7 passes)), manual data: 1b (∆zmean = 5.5 cm), 2: Triple-bogie (TB) with 3 bar tire air pressure (∆zmean = 7.2 cm), 3: Triple-bogie with low tire pressure setup (∆zmean = 2.1 cm), 4: 8-wheeled reference machine (∆zmean = 4.3 cm), clustered by soil types (location 1, blue: τmean = 53–63 kPa, VMCmean = 43–48%; location 2, green: τmean = 54–55 kPa, VMCmean = 34–38%).


Table 1.
“Sachsenforst” reference soil stability classes for the Leipzig region (Wermsdorfer Wald) for mean soil characteristic values [36].
Table 1.
“Sachsenforst” reference soil stability classes for the Leipzig region (Wermsdorfer Wald) for mean soil characteristic values [36].
| Soil Stability Class | Description | Mean Shear Strength τ [kPa] | Mean Volumetric Soil Moisture Content (VMC) [%] |
|---|---|---|---|
| SC1 | Less sensitive soils | 124 | 39 |
| SC2 | Sensitive soils | 91 | 46 |
| SC3 | Very sensitive soils | 67 | 48 |
Table 2.
Overview of the data recording sites for the rut-depth evaluation.
| Tharandt (Saxony, GER) | Schönheide (Saxony, GER) | |||||||||
|---|---|---|---|---|---|---|---|---|---|---|
| Recording Date | 3–6 April 2018 | 5–11 April 2019 | ||||||||
| Manual Measurements | X | X | ||||||||
| Terrestrial Laser Scanning (TLS) Measurements | X | - | ||||||||
| Soil Type [48] | Stagnosol | Gleysol, Cambisol | ||||||||
| Soil Compartments of the Predominant Soil Type [49] | Sand [%] | Silt [%] | Clay [%] | Skeletal Comp. [%] | Sand [%] | Silt [%] | Clay [%] | Skeletal Comp. [%] | ||
| Soil Horizon [max. depth] | I [12 cm] | 20 | 40 | 40 | 10.5 | I [8 cm] | 64.6 | 26.8 | 9.6 | 23.3 |
| - | - | - | - | - | II [15 cm] | 57.9 | 32.5 | 9.6 | 31.8 | |
| II [30 cm] | 8.8 | 48.6 | 42.6 | 17.9 | III [27 cm] | 55.8 | 33.6 | 10.6 | 23.9 | |
| - | - | - | - | - | IV [51 cm] | 55.0 | 35.0 | 10.0 | 35.6 | |
| III [60 cm] | 21.7 | 54.6 | 23.7 | 80.0 | V [75 cm] | 56.3 | 32.4 | 11.4 | 46.1 | |
Table 3.
Overview of the collected data according to different machine configuration setups.
| Machine Configuration Number | Configuration Description | No. of Measuring Points (TLS Datasets) | Related Machine Weight with Tracks and (Load) [t] | No. of Passes for 90 m3 (Cumulative Weight) | Location |
|---|---|---|---|---|---|
| 1 (1a TLS, 1b manual data) | Triple-bogie incl. tracks | 2 (2) | 21.9 + 8.8 (+13) | 1a:7 (305.9), 1b:6 (262.2) | Tharandt (Saxony, GER) |
| 2 (2a TLS, 2b manual data) | Triple-bogie high tire air pressure (3 bar) (BigFoot) | 2 (2) | 21.9 (+13) | 6 (209.4) | Tharandt (Saxony, GER) |
| 3 | Triple-bogie low tire air pressure (BigFoot) | 7 | 21.9 (+10.8) | 7 (228.9) | Schönheide (Saxony, GER) |
| 4 | 8-wheeled reference machine (HSM 208F 710 mm-high tire pressure (3.5 bar)) | 3 | 16.9 (+10.8) | 7 (193.9) | Schönheide (Saxony, GER) |
Table 4.
Data description of the measuring point characteristics (TSL points and related soil characteristics) characteristics in combination with machine configurations.
Table 4.
Data description of the measuring point characteristics (TSL points and related soil characteristics) characteristics in combination with machine configurations.
| Machine Configuration Number | Measuring Point Name or Count of Points | Number of Sample Points | Number of Observations TLS | Related Shear Strength [kPa] Incl. (n, sd) | Related Soil Volume Moisture Content [%] Incl. (n, sd) |
|---|---|---|---|---|---|
| 1a | A1, A4 | 12 | 2.03 m | 63 (68, 24) | 43.2 (70, 5.8) |
| 1b | 4 (count) | 16 | - | 58 (98, 20) | 45.3 (94, 5.7) |
| 2a | B1; B4 | 12 | 0.57 m | 76 (72, 27) | 44.3 (71, 7.7) |
| 2b | 3 (count) | 6 | - | 53 (36, 18) | 48.8 (36, 5.4) |
| 3 | 7 (count) | 29 | - | 55 (168, 20) | 38.3 (168, 8.9) |
| 4 | 3 (count) | 23 | - | 54 (138, 22) | 34.2 (138, 9.0) |
Table 5.
p-Value table output from the exact Wilcoxon Rank-Sum test for group comparison (p = 0.05) for the different machine setups: 1a: Triple-bogie (TB) with tracks (TLS data), 1b: Triple-bogie with tracks (manual data), 2: Triple-bogie 3-bar tire pressure, 3: Triple-bogie adapted tire pressure, 4: 8-wheel reference machine. The grey background clusters the different soil types for direct comparison without measuring-site classification.
| 1a (TB Tracks, TLS) | 1b (TB Tracks, Man.) | 2 (TB High Pressure) | 3 (TB Low Pressure) | |
|---|---|---|---|---|
| 1b (TB tracks, man.) | 0.911 | - | - | - |
| 2 (TB high pressure) | 0.471 | 0.416 | - | - |
| 3 (TB low pressure) | 0.000 | 0.010 | 0.021 | - |
| 4 (8-wheeled, 710) | 0.275 | 0.520 | 0.205 | 0.024 |
© 2020 by the authors. Licensee MDPI, Basel, Switzerland. This article is an open access article distributed under the terms and conditions of the Creative Commons Attribution (CC BY) license (http://creativecommons.org/licenses/by/4.0/).
Share and Cite
MDPI and ACS Style
Starke, M.; Derron, C.; Heubaum, F.; Ziesak, M. Rut Depth Evaluation of a Triple-Bogie System for Forwarders—Field Trials with TLS Data Support. Sustainability 2020, 12, 6412. https://0-doi-org.brum.beds.ac.uk/10.3390/su12166412
AMA Style
Starke M, Derron C, Heubaum F, Ziesak M. Rut Depth Evaluation of a Triple-Bogie System for Forwarders—Field Trials with TLS Data Support. Sustainability. 2020; 12(16):6412. https://0-doi-org.brum.beds.ac.uk/10.3390/su12166412
Chicago/Turabian StyleStarke, Michael, Cédric Derron, Felix Heubaum, and Martin Ziesak. 2020. "Rut Depth Evaluation of a Triple-Bogie System for Forwarders—Field Trials with TLS Data Support" Sustainability 12, no. 16: 6412. https://0-doi-org.brum.beds.ac.uk/10.3390/su12166412
Note that from the first issue of 2016, this journal uses article numbers instead of page numbers. See further details here.