Article

Variations in the Temporal and Spatial Distribution of Microalgae in Aquatic Environments Associated with an Artificial Weir

1
Exhibition & Education Department, Nakdonggang National Institute of Biological Resources, Sangju-si, Gyeongsangbuk-do 37242, Korea
2
Microbial Research Department, Nakdonggang National Institute of Biological Resources, Sangju-si, Gyeongsangbuk-do 37242, Korea
3
Animal & Plant Research Department, Nakdonggang National Institute of Biological Resources, Sangju-si, Gyeongsangbuk-do 37242, Korea
4
Department of Oceanography, Kunsan National University, Gunsan-si, Jeollabuk-do 54150, Korea
*
Author to whom correspondence should be addressed.
Sustainability 2020, 12(16), 6442; https://0-doi-org.brum.beds.ac.uk/10.3390/su12166442
Submission received: 31 May 2020 / Revised: 18 July 2020 / Accepted: 21 July 2020 / Published: 10 August 2020
(This article belongs to the Special Issue Harmful Organisms and their Management for Sustainable Environment)

Abstract

:
The construction of weirs causes changes in the aquatic environment and affects several aquatic organisms. To understand the ecosystem in the Sangju Weir, Gyeongsangbuk-do Province, variations in the spatiotemporal distribution and composition of microalgae communities were analyzed. Microalgae were collected fortnightly from April to November 2018 from six sites in the Nakdonggang River. There was significant variation in environmental factors, microalgal community structure, and flora. Microalgae communities were dominated by diatoms (e.g., Fragilaria crotonensis, Ulnaria acus, and Aulacoseira ambigua), green algae (e.g., genera Eudorina and Desmodesmus), cyanobacteria (e.g., genera Anabaena and Microcystis). Multidimensional scaling indicated that species composition and diversity were generally similar among sites but varied between the bottom and the surface and middle water layers. Vertical migration of microalgae was difficult to investigate because of the thermocline in the study area and high turbidity in the lower layer. The distribution of microalgae was little affected by the construction of the weir, but the formation of thermocline changed microalgae communities in the water layer.

1. Introduction

The Nakdonggang River is the largest river in the Republic of Korea, with a length of 510 km and a watershed area of 23,384 km2 [1,2]. The upper stream flows into the western part of the Banbyeoncheon Stream in Andong-si, and several tributaries, such as the Naeseongcheon Stream and the Yeonggang River (the first tributary of the Nakdonggang River) near the Hamchang Stream, gather to flow southward through Sangju, Sunsan, and Daegu [1,2]. The Nakdonggang River is important since it has become a major source of agricultural, public, and industrial water near the metropolis [1,2].
A weir is a barrier across the width of a river, installed to allow the flow of a certain amount of water along the water intake channel to maintain a constant water level upstream by blocking the waterway and to harvest water for agricultural and domestic use. In addition to water abstraction from rivers and pollution, damming is probably one of the greatest stressors affecting water flow [3,4,5]. Through the “The Four Major Rivers Restoration Project” in Korea, 16 weirs have been constructed. Weirs and dams can interfere with or prevent the transport of sediments and nutrients along rivers, reduce fluctuations in natural discharge, stop the inundation of floodplains, and result in the formation of wider and shallower rivers [3]. Such riverine changes can lead to increased algal blooms, increased erosion, and reductions in water quality [3,6]. The Sangju Weir, located in the upper stream of the Nakdonggang River, was constructed at the Jungdong-myeon, Sangju-si, Gyeongsangbuk-do Province (81 km downstream of the Andong Dam) as part of the “The Four Major Rivers Restoration Project.” Its watershed area is 7404 km2, which corresponds to about 32% of the area of the Nakdonggang River, its management water level is 47.0 m, and it secures 27.4 million m3 of water.
Microalgae are primary producers in aquatic ecosystems and are used as indicators for underwater environments owing to the responsiveness of communities to changes in water quality [7,8,9,10,11] and physicochemical factors [1]. In addition, when pollution increases, certain species may cause oxygen depletion and fish death [12].
First studies of microalgal communities in major freshwater aquatic systems in Korea were conducted by Chung et al. [13]. This was followed by studies on the Nakdonggang River, especially on phytoplankton communities [1,2,14,15,16,17,18,19,20]. Currently, many research institutes are conducting research on the Nakdonggang River from various perspectives.
In this study, we aimed to further understand how artificial weirs affect the spatiotemporal distribution and community composition of microalgae in the aquatic ecosystem. In addition, through a diurnal vertical migration study of microalgae, we aimed to understand the environmental factors affecting the vertical distribution of microalgae.

2. Materials and Methods
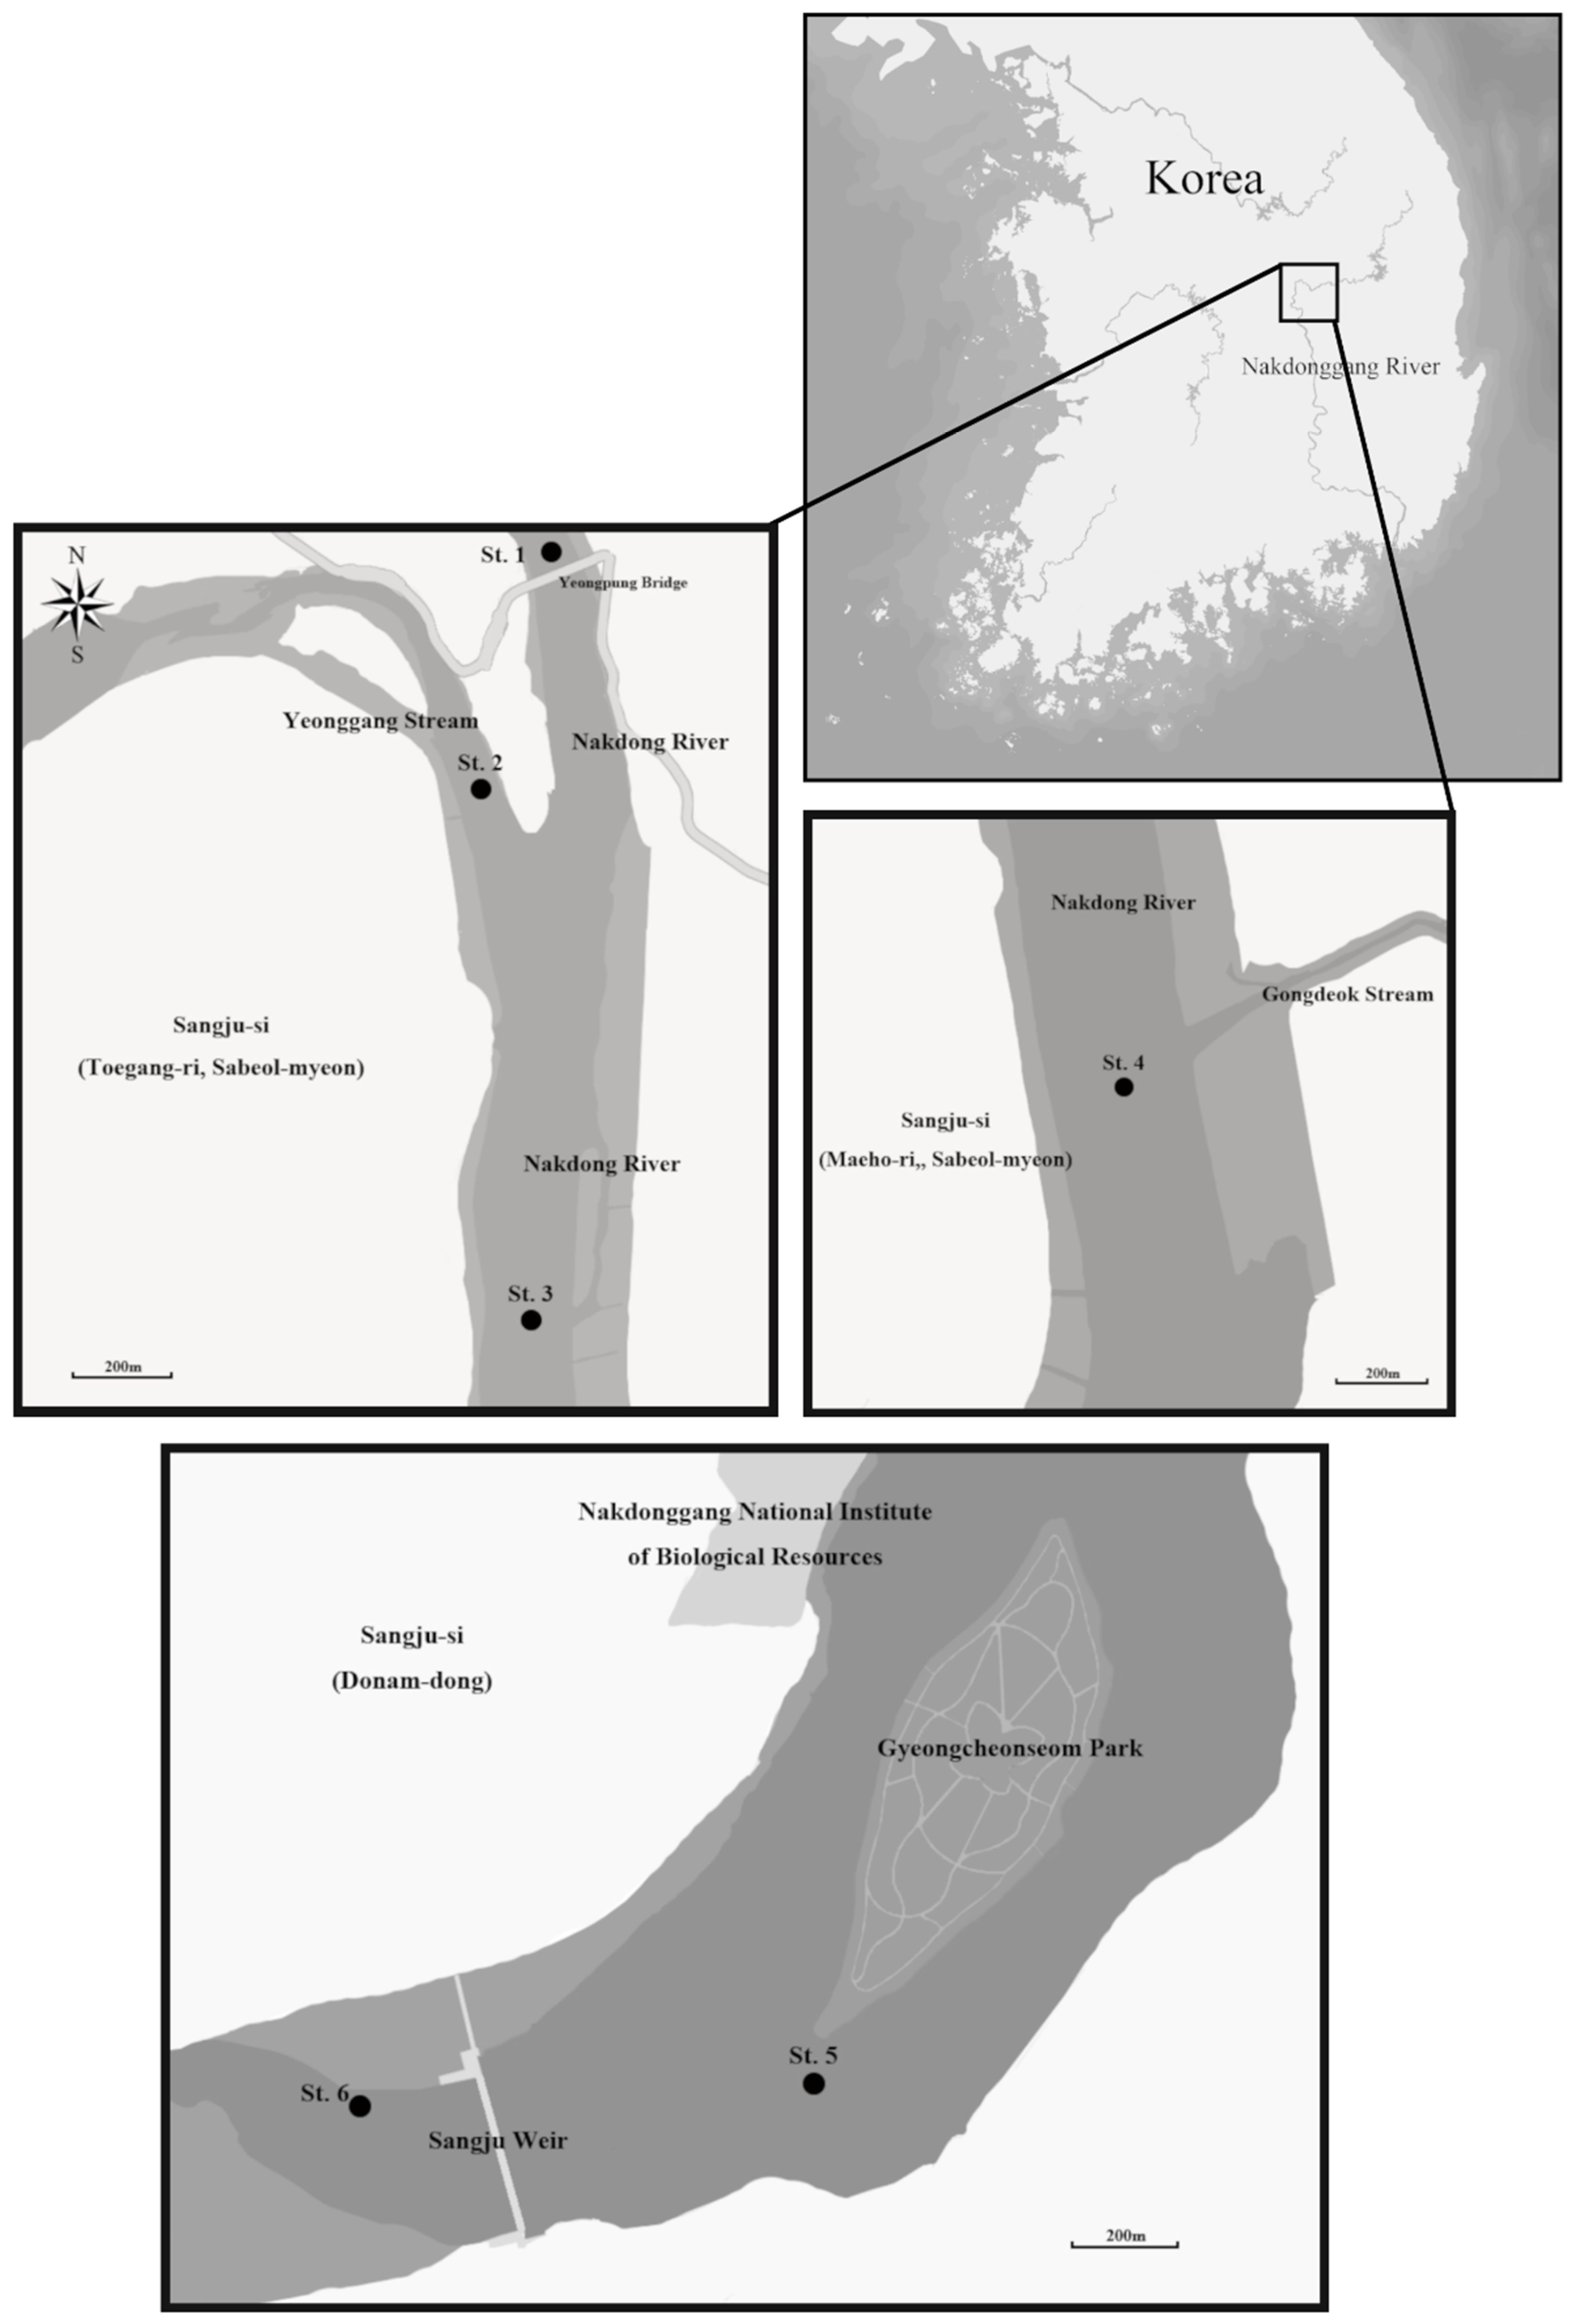
2.1. Sampling Sites

Six sampling sites were established: Site 1 (St. 1) in the upper part of the Sangju Weir, near the Yeongpung Bridge; St. 2 in the Yeonggang River (the first tributary of the Nakdonggang River); St. 3 at the junction of the Nakdonggang River and Yeonggang River; St. 4 is the confluence of the Nakdonggang River and Gongdeokcheon Stream; St. 5 near the Gyeongcheon Island Park and Sangju Weir; and St. 6 in the lower part of the Sangju Weir. Selected sites were expected to remain unaffected (Sites 1 and 2) or affected either by the tributary (Sites 3 and 4) or the weir (Sites 5 and 6). The distance between St. 1 and St. 6 was approximately 20 km (Figure 1). Sampling was undertaken every two weeks from April to November 2018.
A study was conducted on the vertical migration of microalgae during the first survey (7–8 June 2018) and the second survey (18–19 September 2018). Mooring analysis was conducted at St. 5 (near the Gyeongcheon Island), where the water depth is constantly maintained at 10 m. The microalgae were collected from depths of 1 m (surface layer), 5 m (middle layer), and 10 m (bottom layer).

2.2. Monitoring Microalgae and Abiotic Factors

Water samples were collected at each site (Figure 1) over three seasons: spring (March–May 2018), summer (June–August 2018), and autumn (September–November 2018). Winter surveys were not carried out because of the freezing of the river. The physical and chemical factors affecting the microalgae were analyzed in these surveys. Vertical profiles of water temperature (WT), dissolved oxygen (DO), conductivity (CON), pH, and turbidity (TUR) were measured using water quality sampling and monitoring meters (ProDSS, YSI, Yellow Springs, OH, USA). Water samples were collected from the surface (0.5 m depth), middle (4 m depth), and bottom (1 m above the riverbed) using a 5 L Van Dorn sampler. We also analyzed the total organic carbon (TOC), total phosphorus (TP), and total nitrogen (TN) content (Supplementary Tables S1 and S2). To analyze the concentrations of nutrients, each 30 mL sample of water was collected in a 50 mL poly-ethylene bottle. The TN, TP, and TOC concentrations were measured using a TOC analyzer (Shimadzu TOC analyzer, Shimadzu, Kyoto, Japan) and UV/Vis spectrophotometer (G1103A, Agilent, Pal Alto, CA, USA) and the concentrations were determined following modified methods [21]. Counts and identification of at least 500 cells per sample were performed using a Counting Chamber Sedgewick Rafter Cell at 400 × magnification and a light microscope (LM, Eclipse Ni, Nikon, Tokyo, Japan). The fine structure of the diatom (Bacillariophyta) was observed using a field emission scanning electron microscope (FE-SEM, MIRA 3, TESCAN, Brno, Czech Republic). The diatom in each water sample were collected on an Isopore membrane filter (pore size: 0.22 µm, GTTP04700; Burlington, Millipore). The samples were dried in a desiccator. Each dried sample was gold coated and then inspected using the FE-SEM instrument at magnification of 3,000–20,000 × magnification.

2.3. Data Analysis

Cluster analysis of microalgae data was performed using the statistical software Primer v6 (Primer-E Ltd., Lutton, UK) [22,23,24]. Non-metric multidimensional scaling (MDS) was applied to determine the relationships among microalgae and to explain their relationships in a two-dimensional space. The procedure for MDS was calculated with 25 restarts to arrive at a minimum stress value (0.01), as suggested by Field et al. [25] and Clarke [22]. We used canonical correspondence analysis (CCA) to relate assemblage structure to environmental factors and to explore their relationships by using the statistical software MVSP v3.1 (Kovach Computing Services, Wales, UK) [26]. We also employed forward selection and associated Monte Carlo permutation tests (999 unrestricted permutations, p < 0.01) to identify variables that better explain each gradient. The species–environmental factor biplots showed the species distribution with respect to the forward-investigated environmental variables.

3. Results

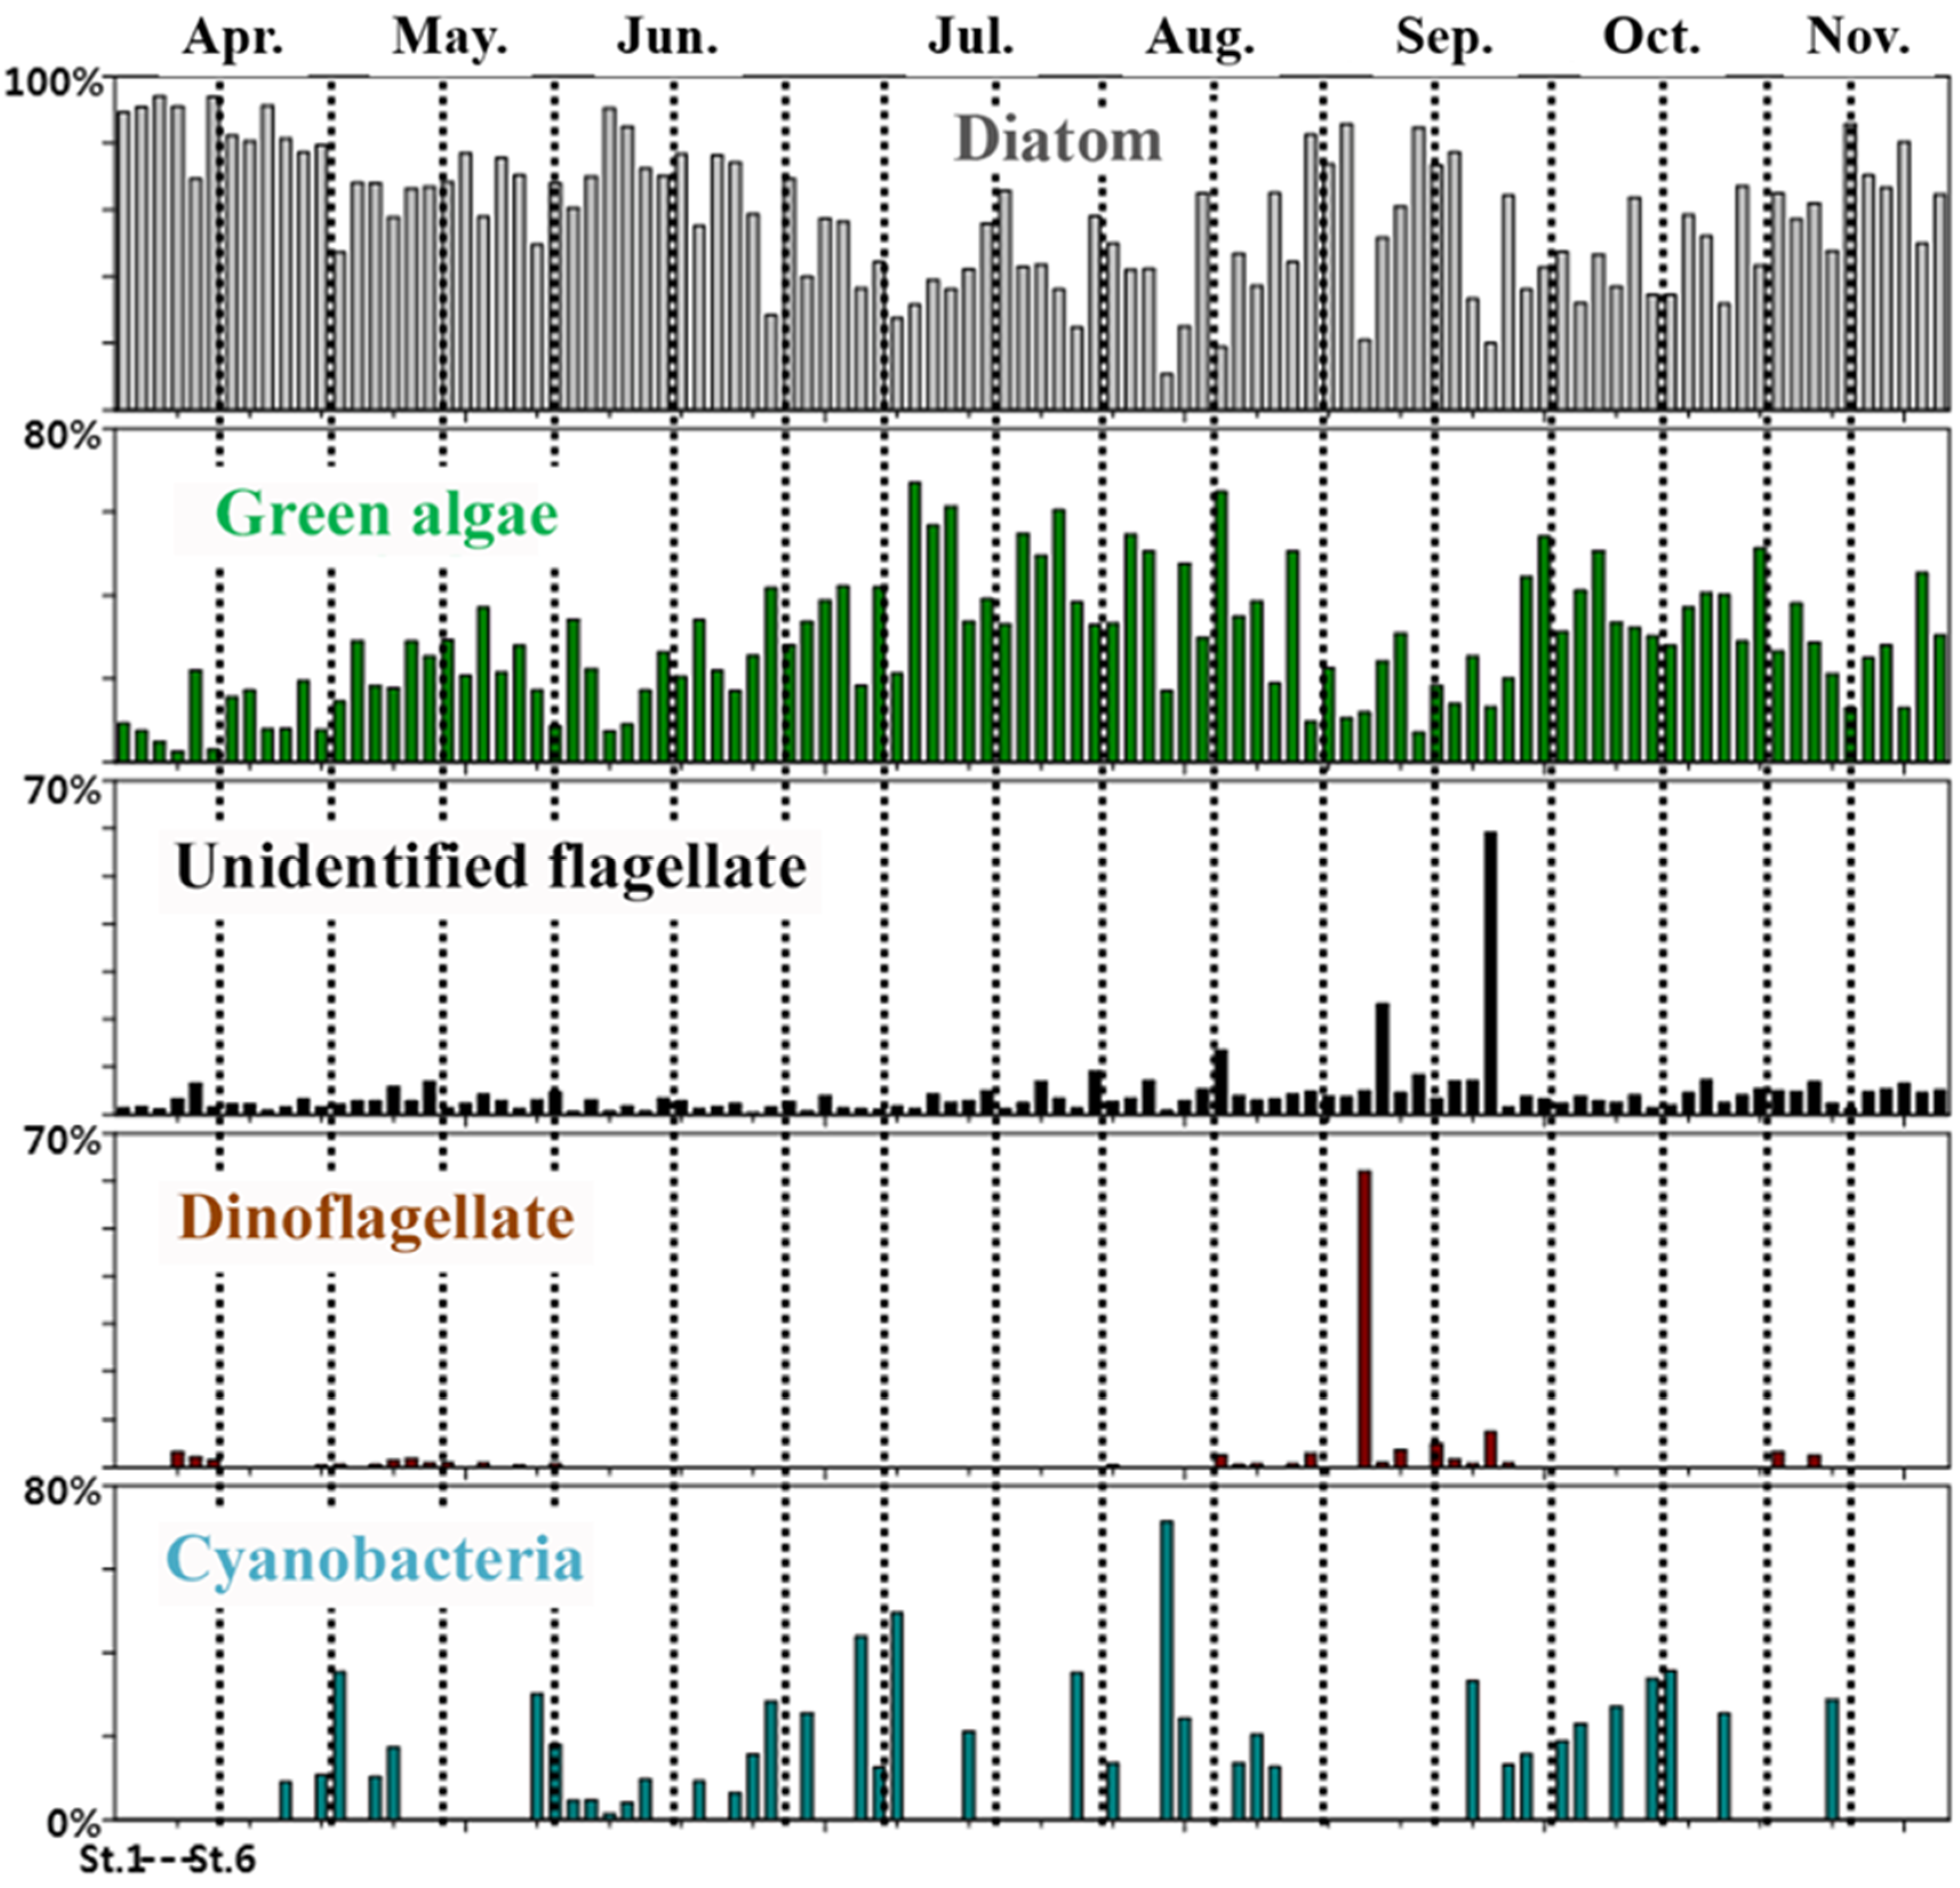
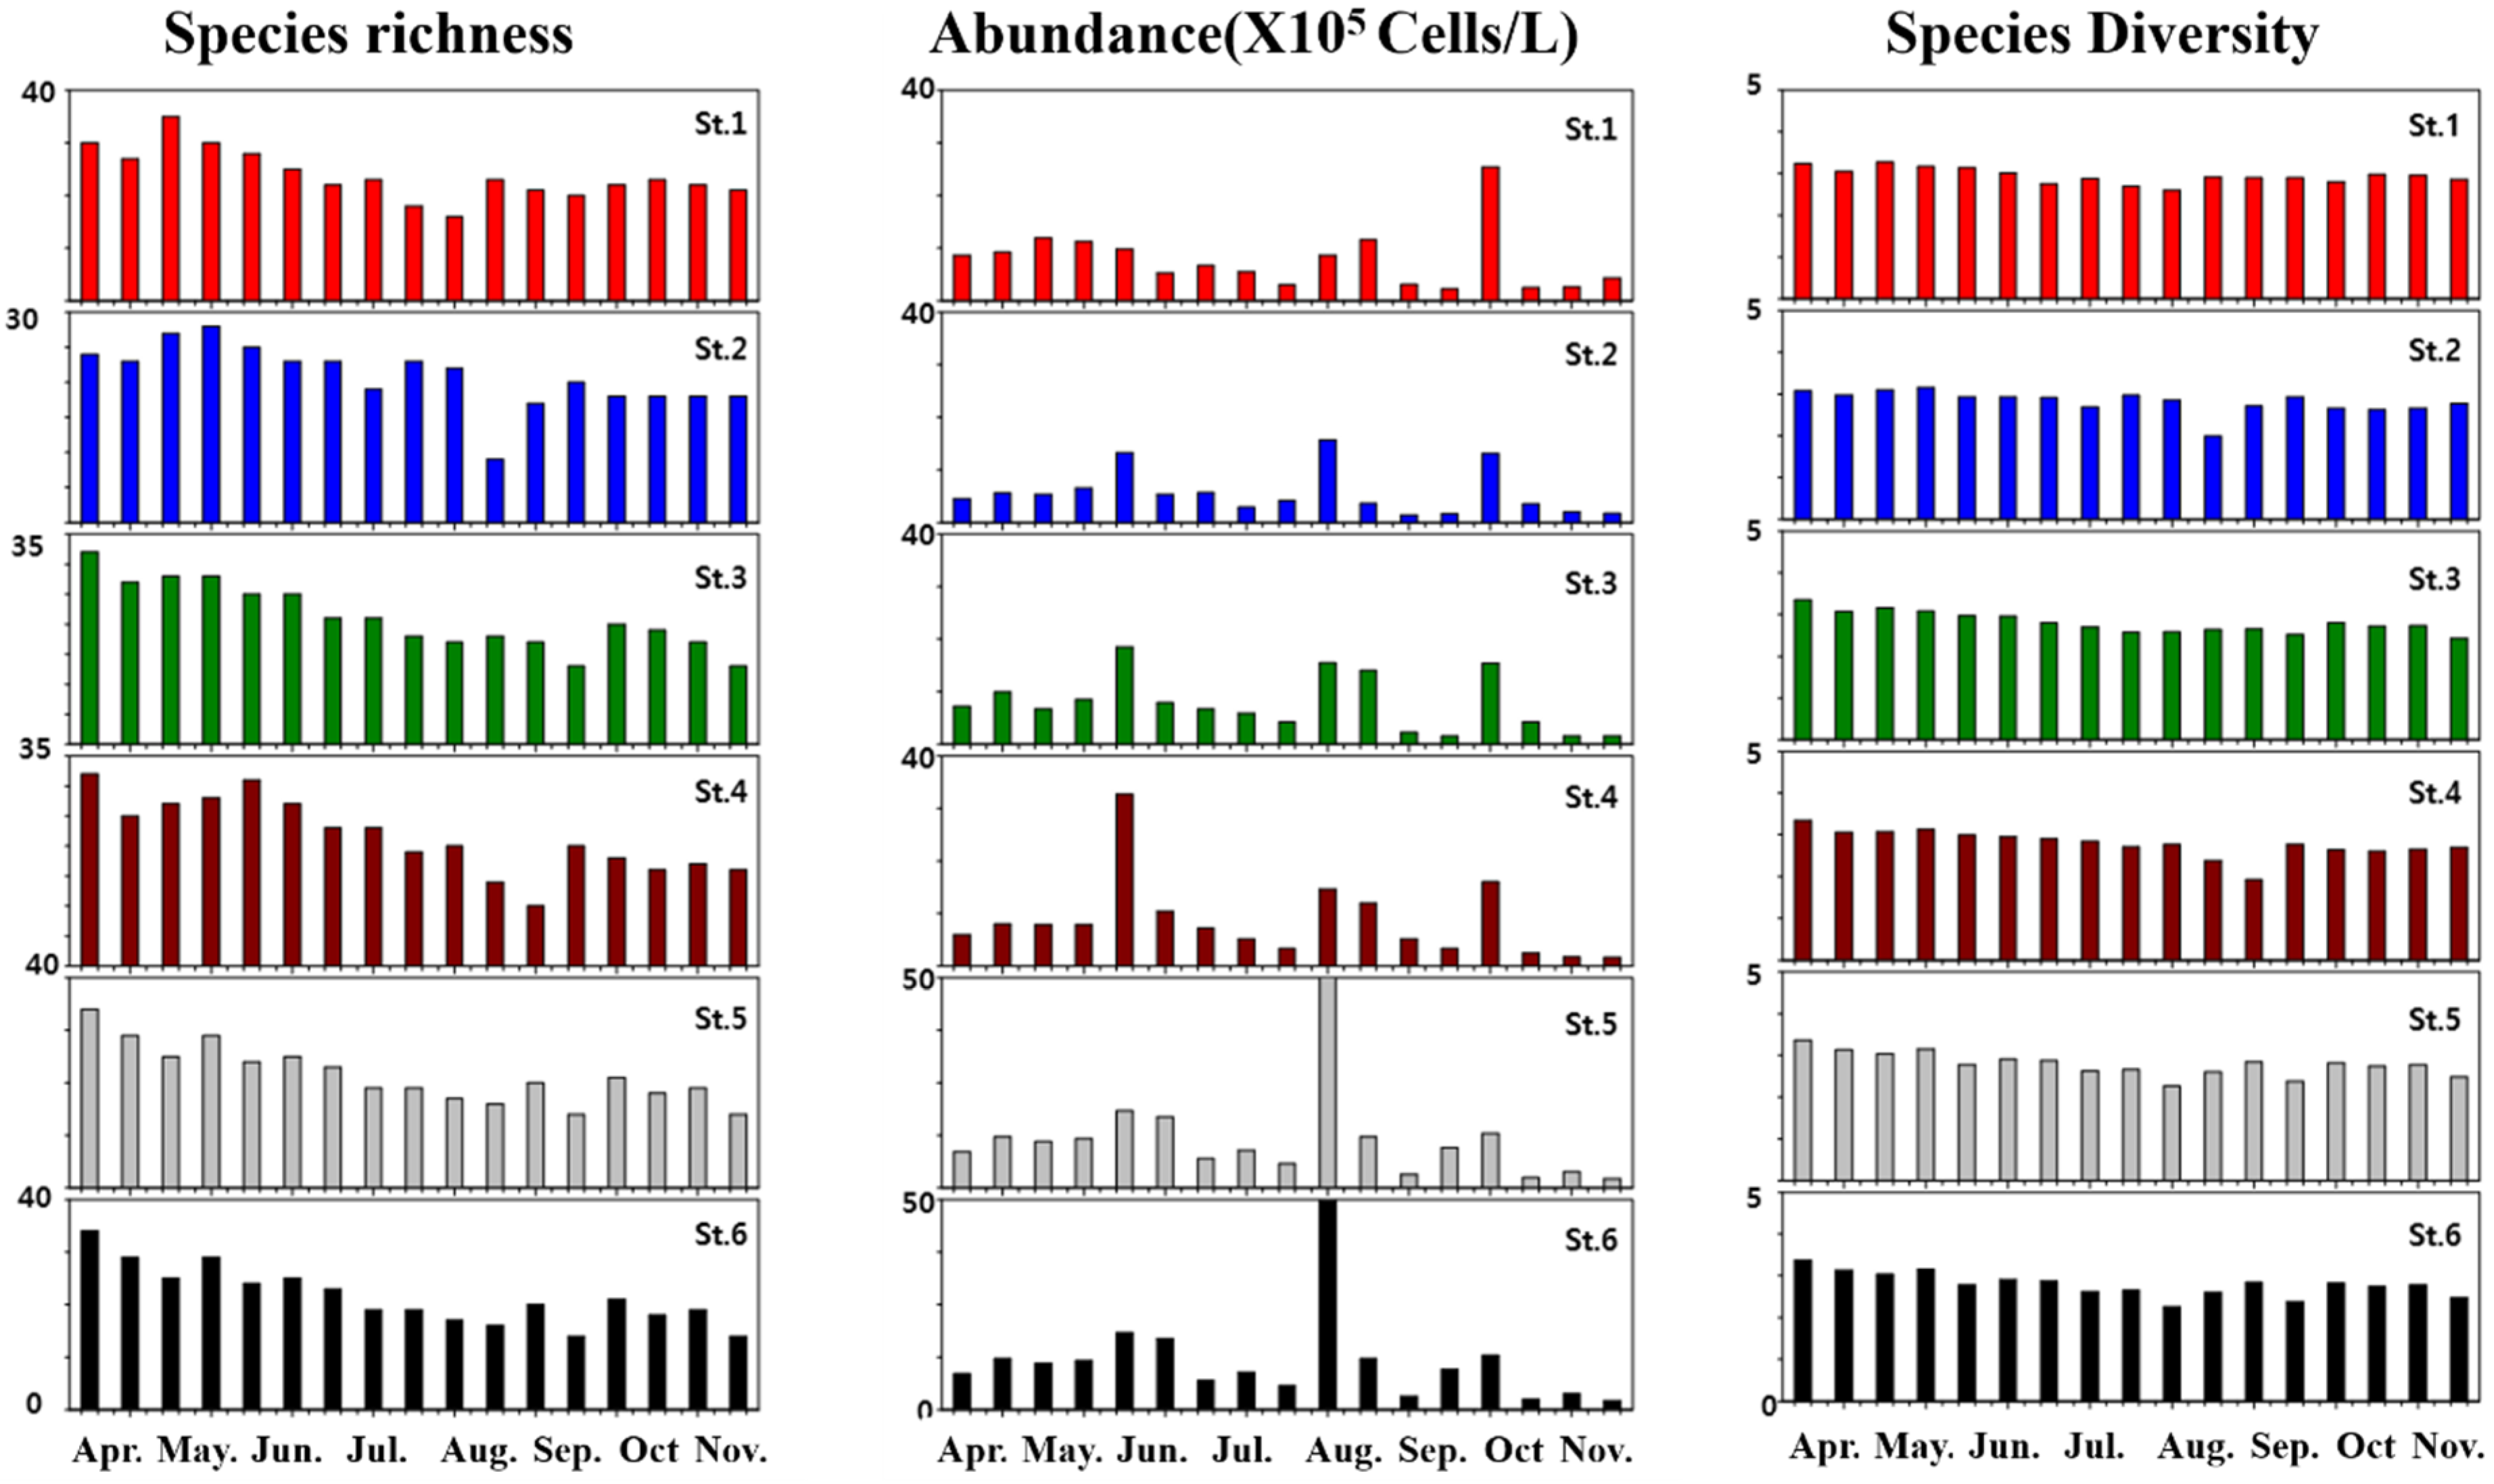
3.1. Temporal and Spatial Distribution of Microalgae

Overall, 121 microalgal taxa were identified in this study, representing five phyla, five classes, 20 orders, 29 families, 45 genera, 116 species, and five formae. The main taxa in the study area were diatoms, green algae (chlorophyta), unidentified flagellates, dinoflagellates, and cyanobacteria (Figure 2). During the survey period, the average species richness of diatoms, green algae, unidentified flagellates, dinoflagellates, and cyanobacteria was 58.20 ± 19.81, 28.59 ± 14.98, 4.12 ± 6.23, 1.11 ± 6.20, and 7.98 ± 13.53, respectively (Figure 3).
In this study, the abundance of microalgae ranged from 1.44 to 44.62 × 10⁵ cells/L at all sites, with an average of 8.38 ± 7.00 × 10⁵ cells/L (Figure 3). The site of highest abundance was St. 6 (average 11.07 ± 7.69 × 10⁵ cells/L) and that of lowest abundance was St. 1 (average 5.65 ± 4.31 × 10⁵ cells/L). The month with the highest abundance was August, while November showed the lowest abundance. The average abundance of diatoms was higher in the Sangju Weir. Fragilaria crotonensis, Ulnaria acus, and Aulacoseira ambigua were the most frequent species of diatoms. Among green algae, the genera Eudorina and Desmodesmus were the most dominant, while those in cyanobacteria were Anabaena and Microcystis (Figure 4).
The species diversity index of microalgae ranged from 1.93 to 3.37 (average 2.85 ± 0.26) across all the sites (Figure 3). The highest species diversity was found at St. 1 (average 2.95 ± 0.19) (near the Yeongpung Bridge) and was lower for St. 4 and 5 (near Gongdeok and Gyuncheon Stream). The highest diversity was observed in April (average 3.27 ± 0.11) and the lowest in August (average 2.56 ± 0.34).

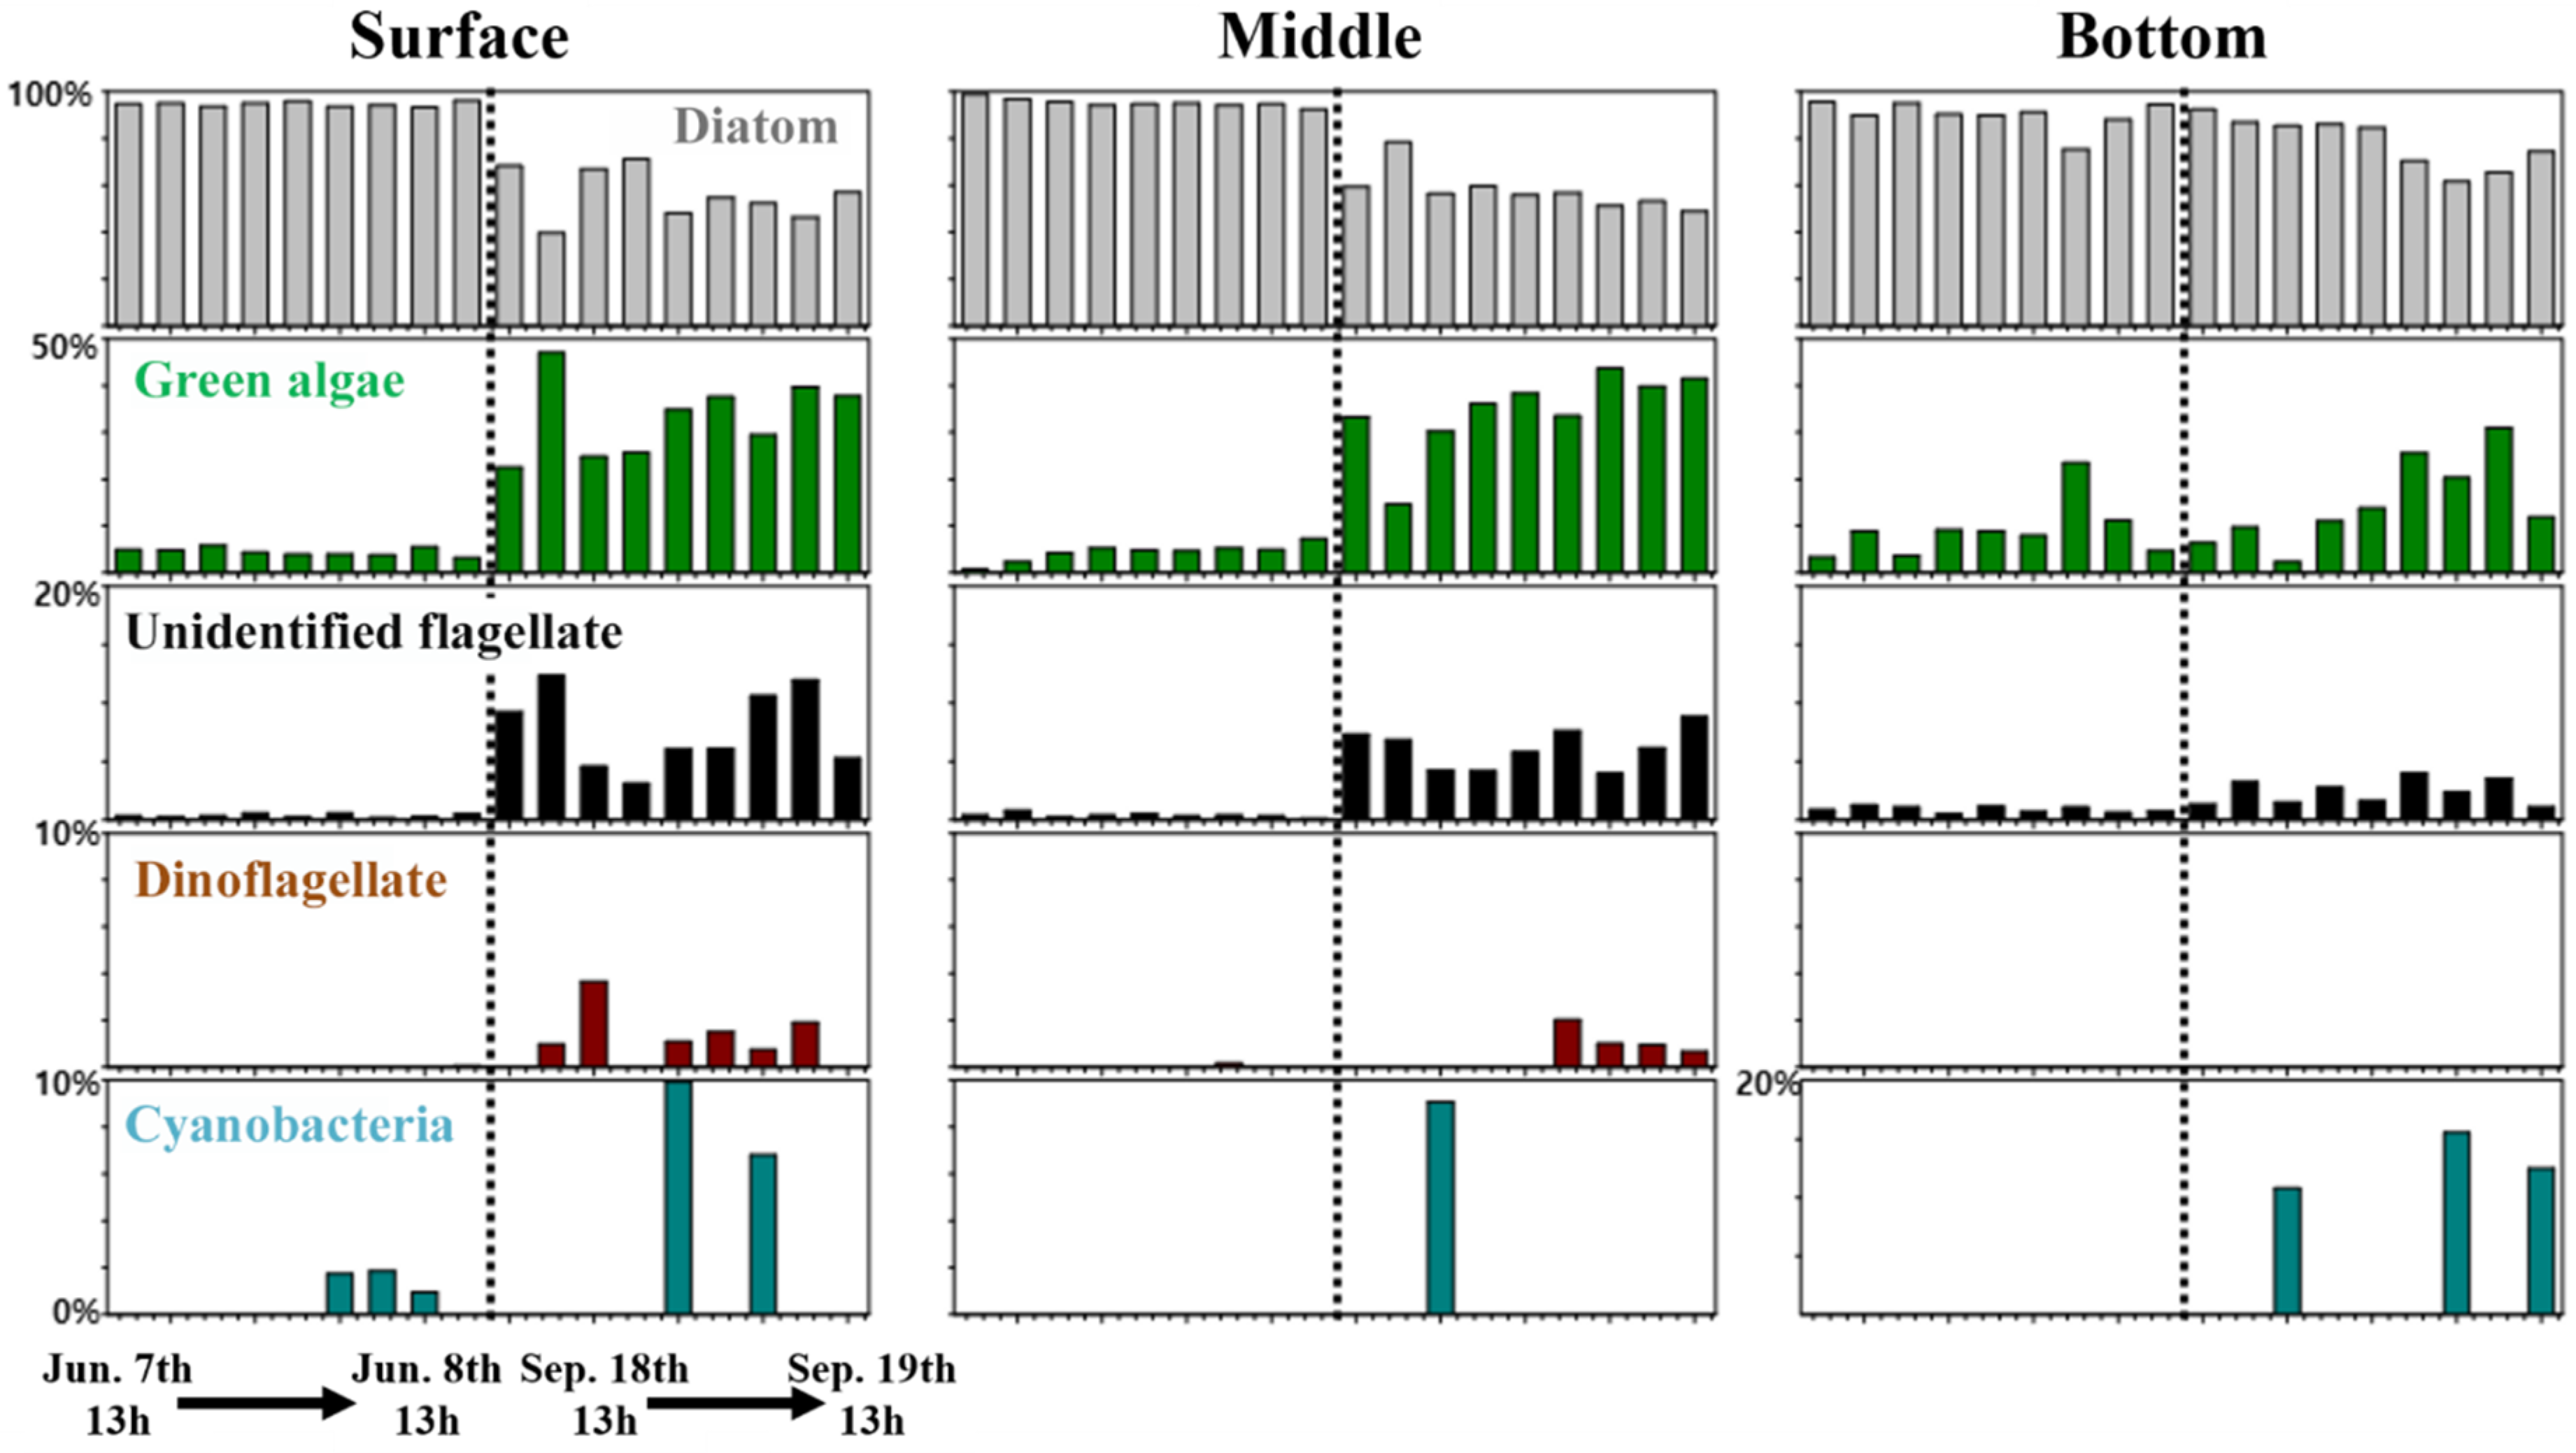
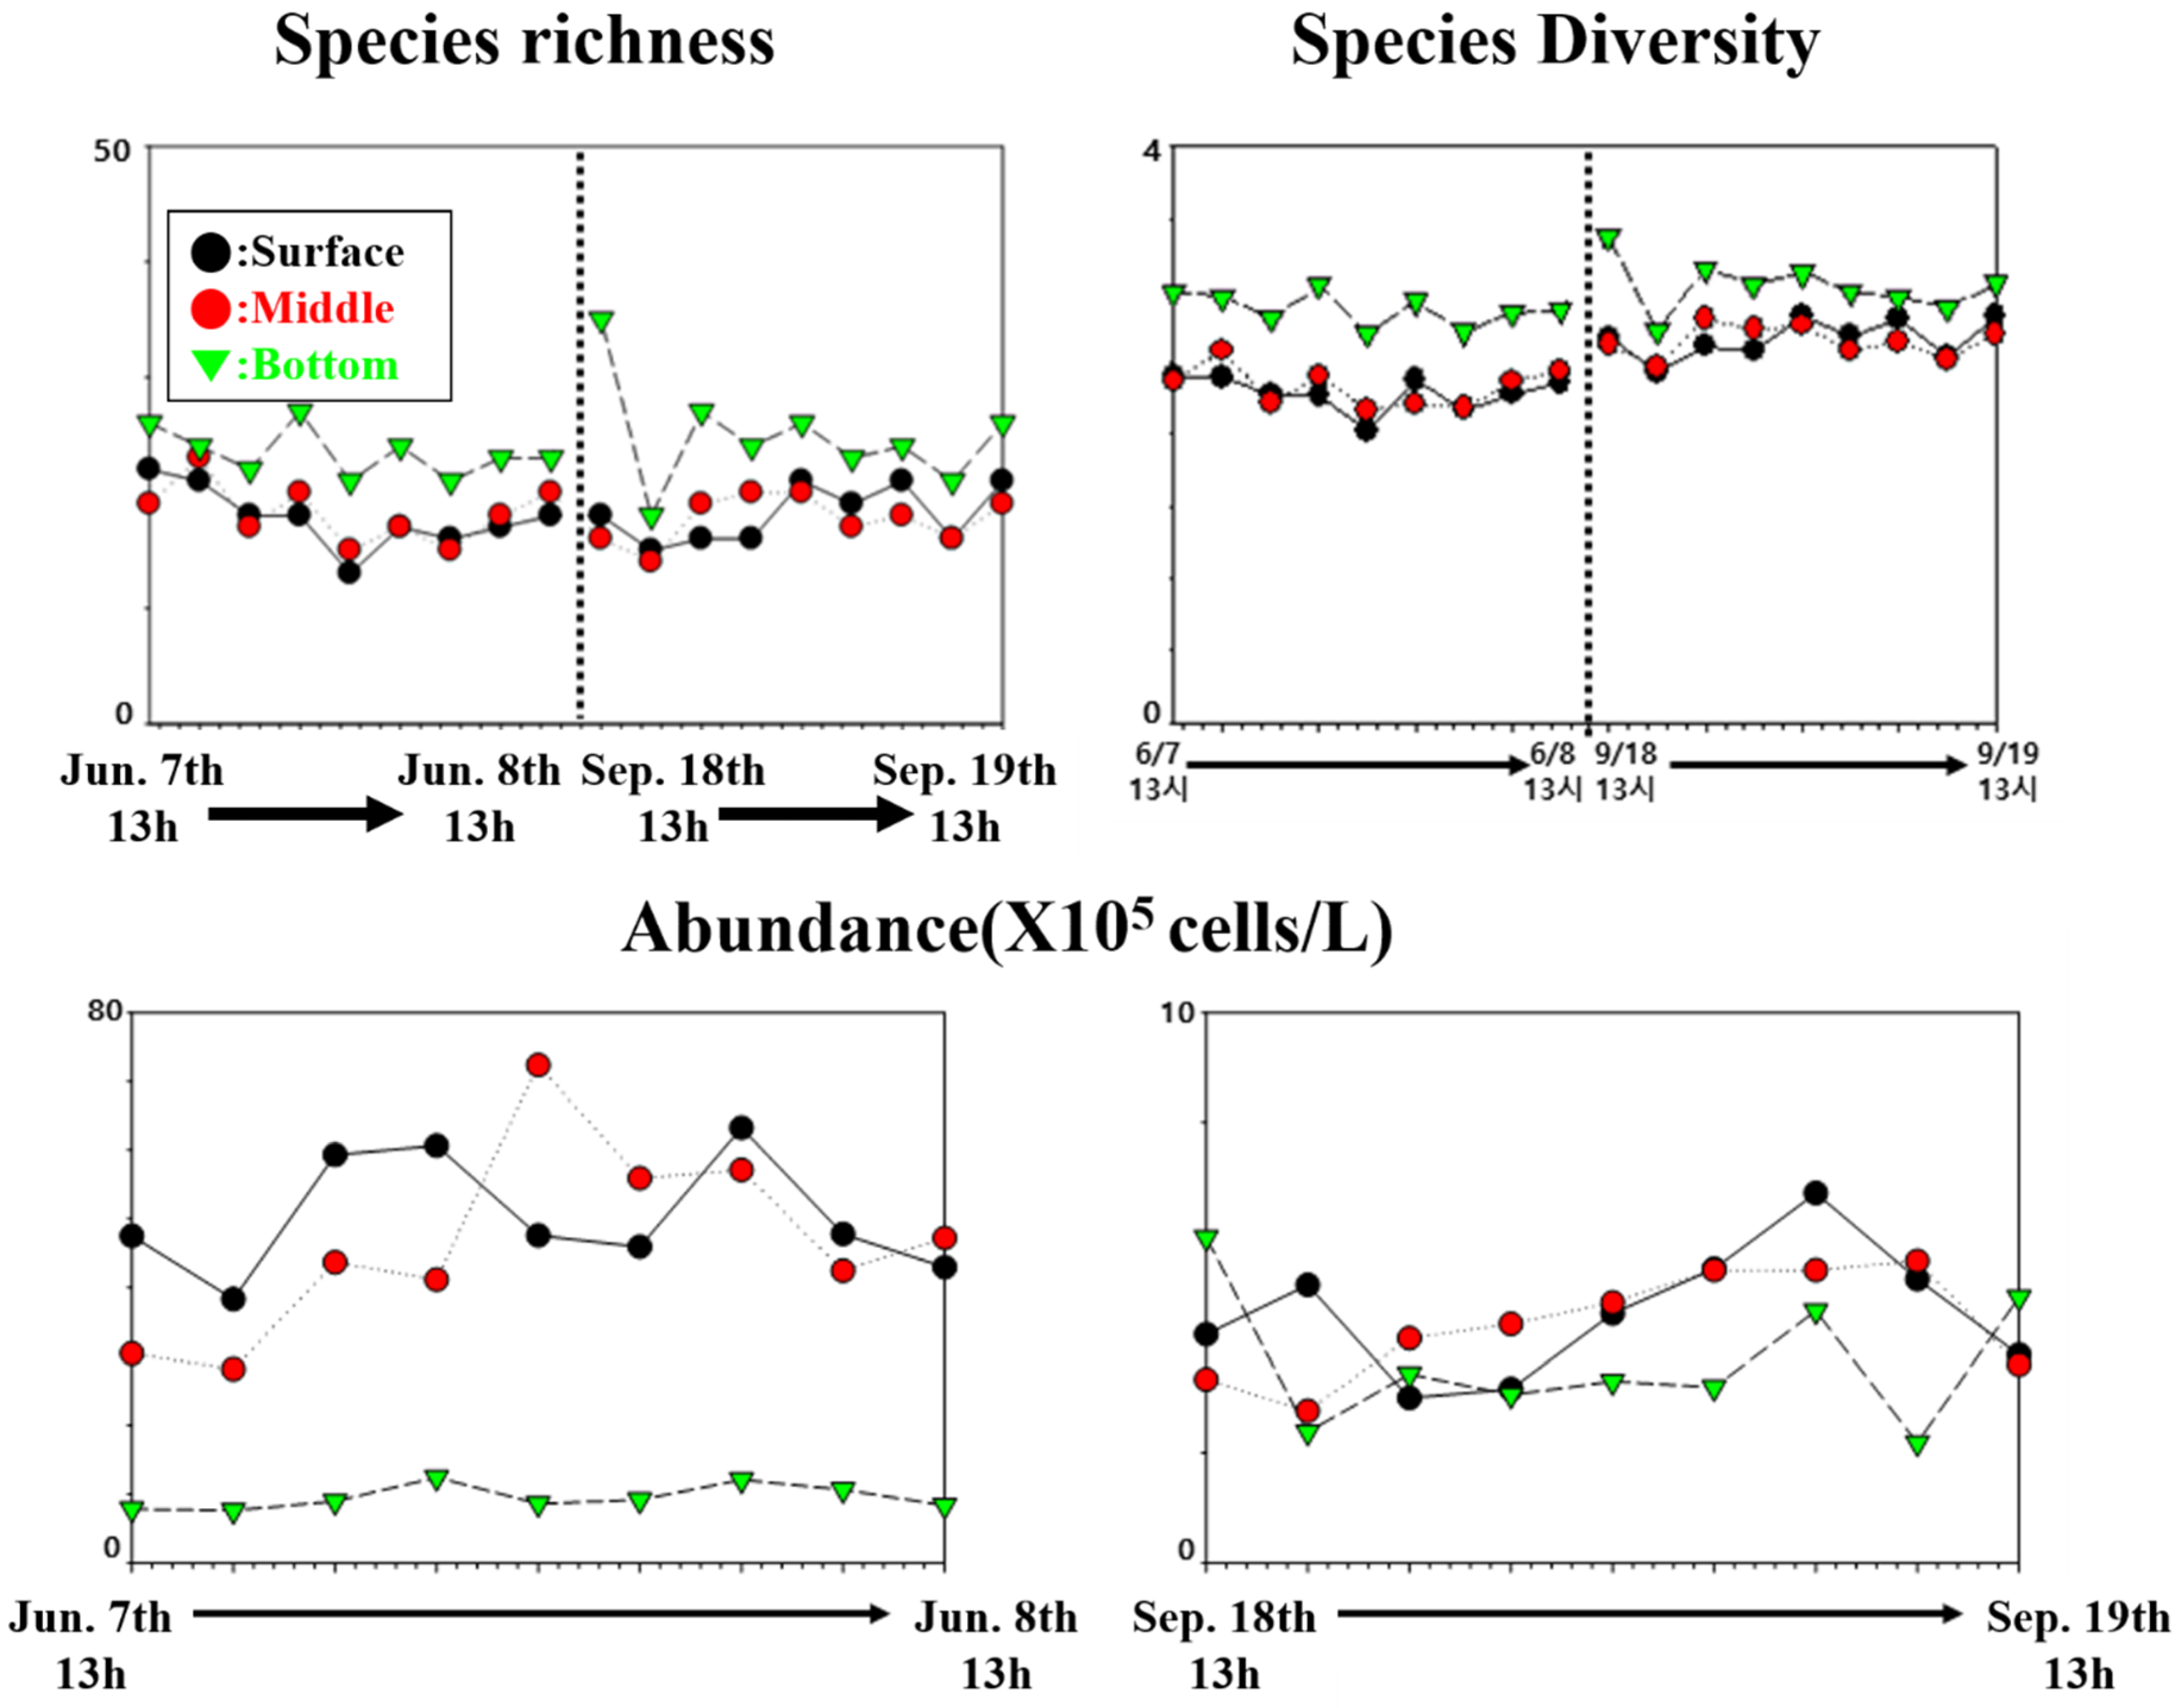
3.2. Diurnal Vertical Migration of Microalgae

A total of 78 microalgae taxa were identified in the diurnal migration study, representing five phyla, five classes, 18 orders, 26 families, and 38 genera. The main taxa in this study were diatoms, green algae, unidentified flagellates, dinoflagellates, and cyanobacteria (Figure 5).
During the survey period, the highest average species richness was that of diatoms (78.69 ± 18.03) and the lowest average species richness was that of dinoflagellates (0.28 ± 0.68) (Figure 6). In the surface and middle layers, the highest average species richness was that of diatoms.
The total abundance of microalgae across surveys ranged from 2.19 to 72.36 × 10⁵ cells/L, with an average of 19.81 ± 21.50 × 10⁵ cells/L (Figure 6). The average abundance was similar in the surface and middle layers, and the value of the bottom layer was the lowest. In the first survey, the range was 7.65~72.36 × 10⁵ cells/L, and the average was 35.45 ± 20.81 × 10⁵ cells/L. There was almost no difference between the surface and middle layers, and the bottom layer was the lowest. In the second survey, the range was 2.19~6.71 × 10⁵ cells/L, and the average was 4.17 ± 1.15 × 10⁵ cells/L. There was little difference between the water layers.
The most dominant species in this study were Fragilaria crotonensis and Aulacoseira ambigua (Figure 4). Among green algae, Eudorina sp. and Desmodesmus sp. were dominant, and among cyanobacteria, Anabaena sp. and Microcystis sp. (Figure 4). The monitoring survey of these species exhibited no significant quantitative difference.
In this study, the species diversity index of microalgae across both surveys ranged from 2.03 to 3.37 at all sites, with an average of 2.64 ± 0.30. There was little difference between the water layers and the first and second surveys (Figure 6).

3.3. Abiotic Analysis

The physical and chemical factors affecting the microalgae were analyzed in the first and second surveys. WT ranged from 19.6 °C (bottom layer in the first survey) to 28.4 °C (surface layer in the first survey), with an average of 22.6 °C. DO was highest in the surface layer in all surveys. The CON was greater than 230 µs/cm3. pH ranged from 7.78 (bottom layer in the first survey) to 11.48 (surface layer in the first survey), with an average of 9.67, indicating that an alkaline environment was predominant in the study area. The TUR was higher in the bottom layer because of the upwelling of sediments and the inflow of organic particles from upstream. TOC, TP, and TN ranged from 0.87 to 6.06 mg/L, 4.46 to 72.1 mg/L, and 0.61 to 4.72 mg/L, respectively, with an average of 3.11 ± 0.93 mg/L, 30.55 ± 12.15 mg/L, and 1.94 ± 0.42 mg/L, respectively.

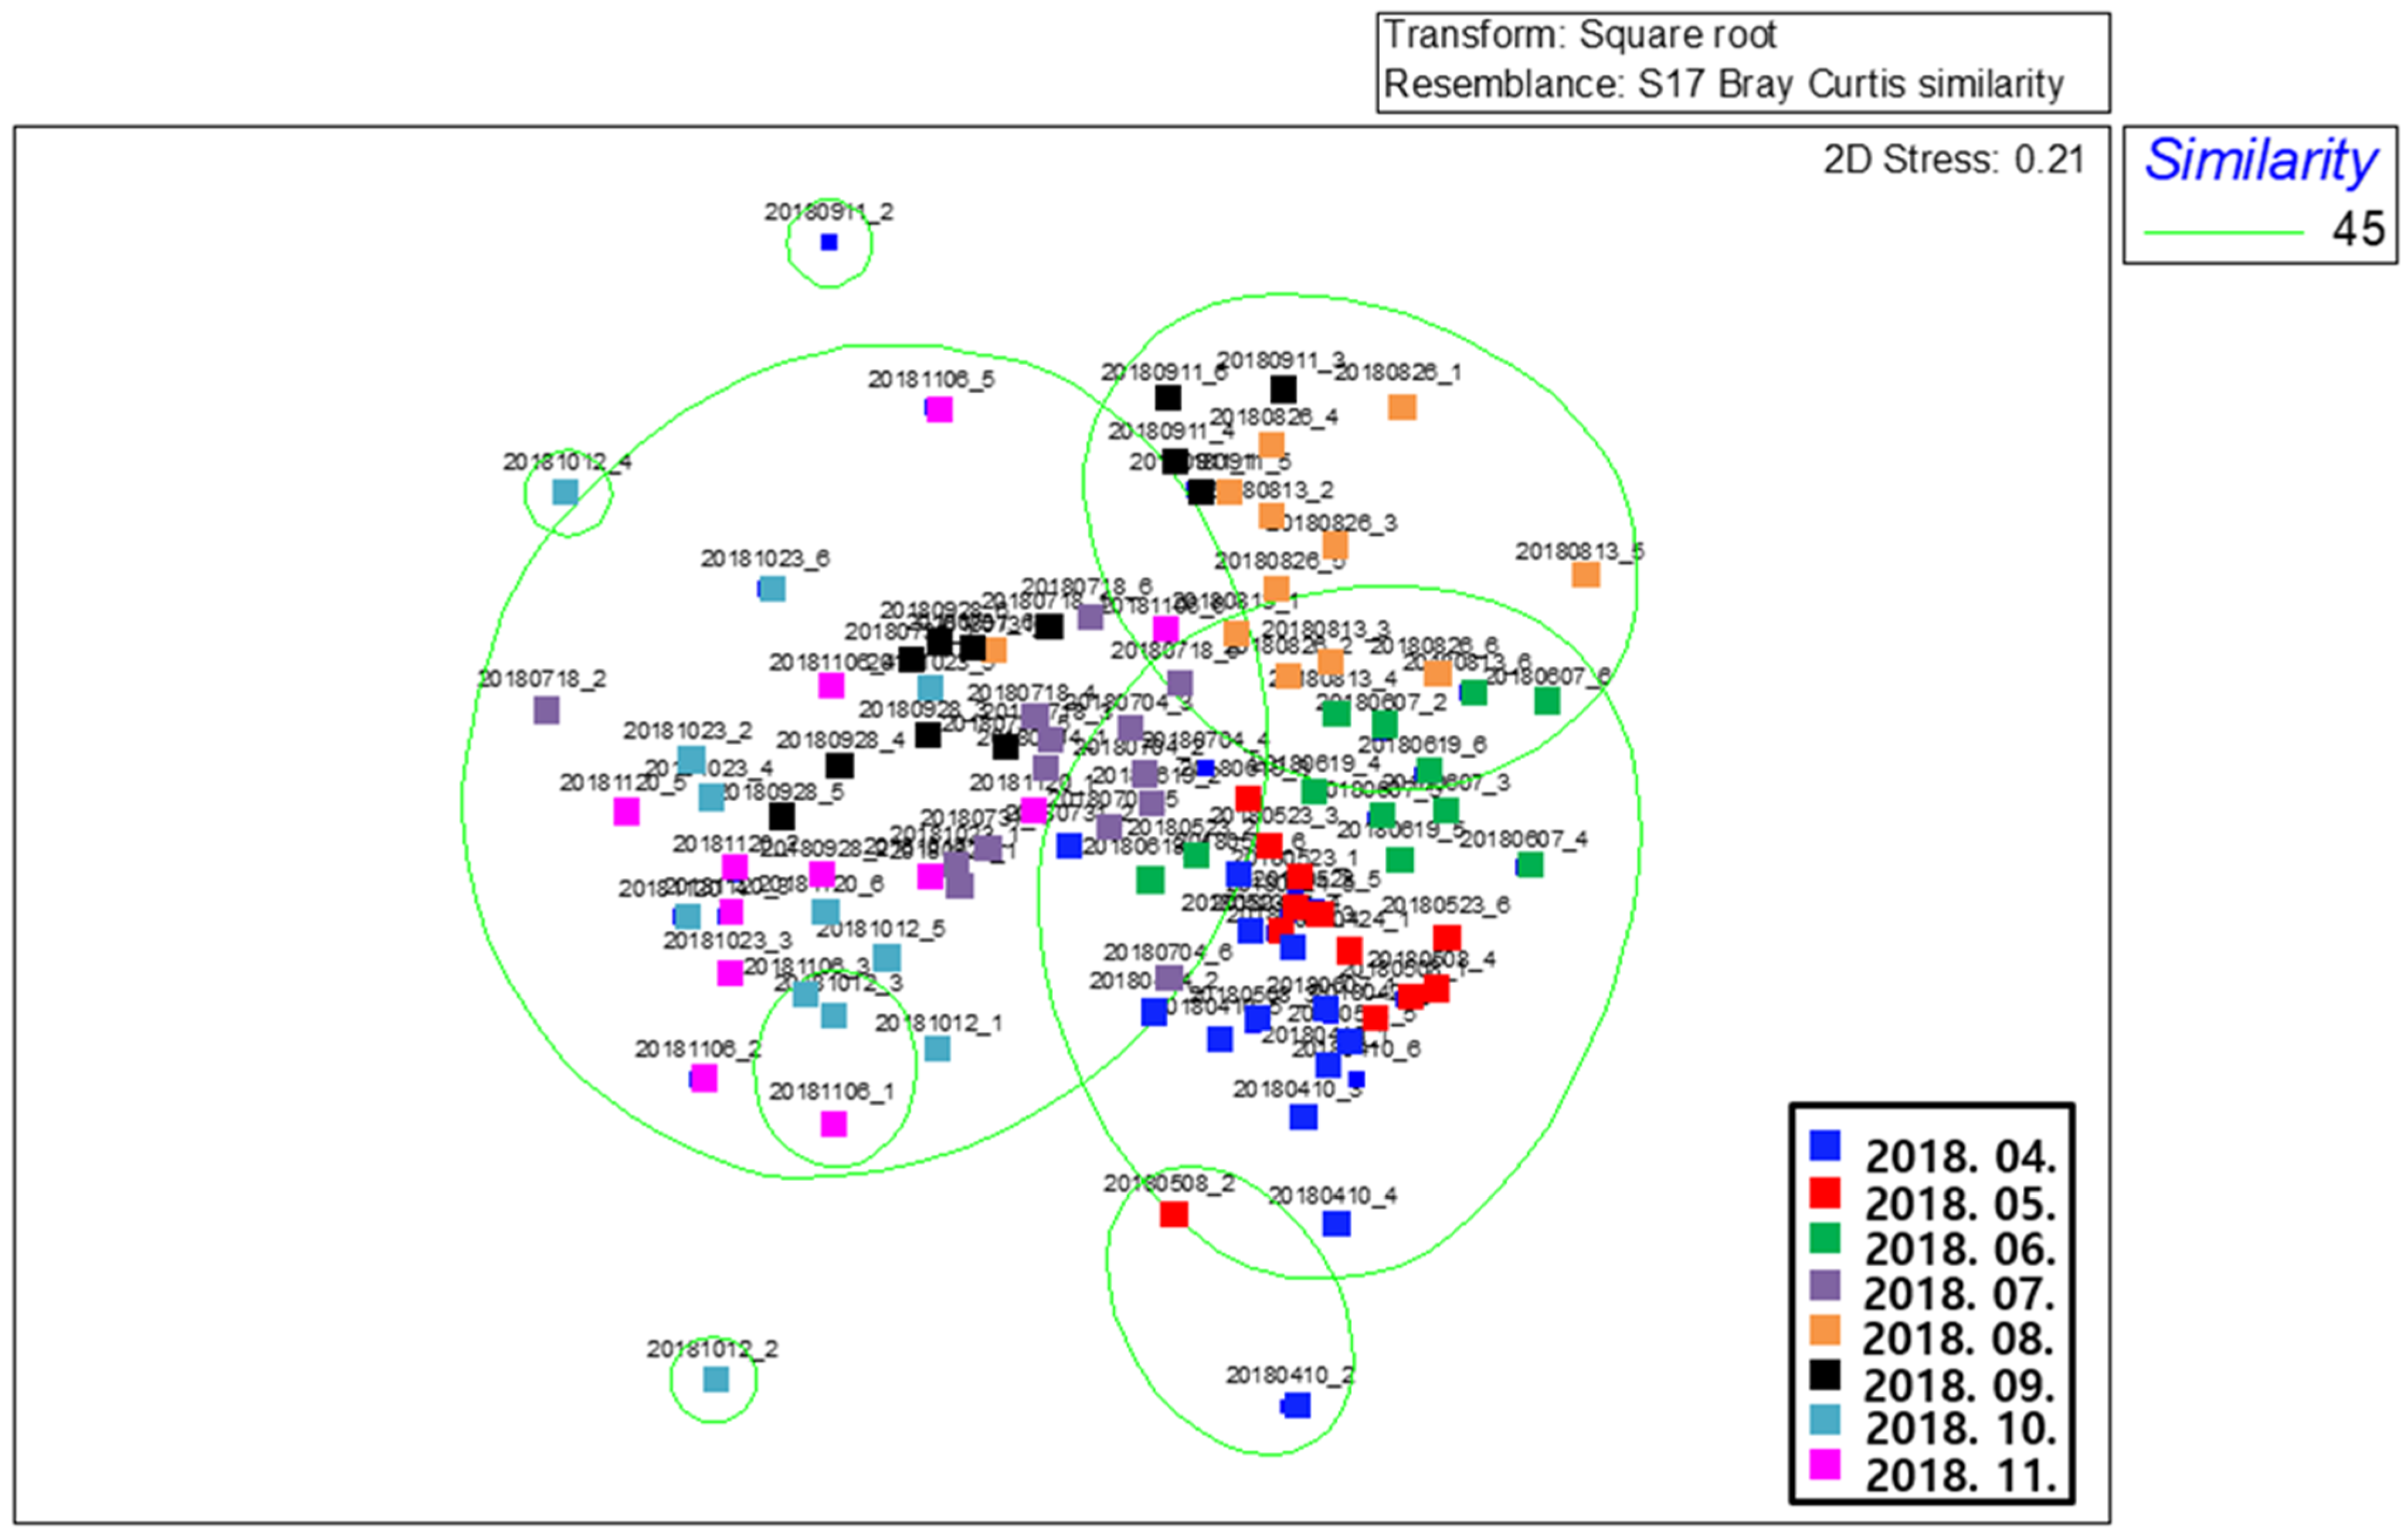
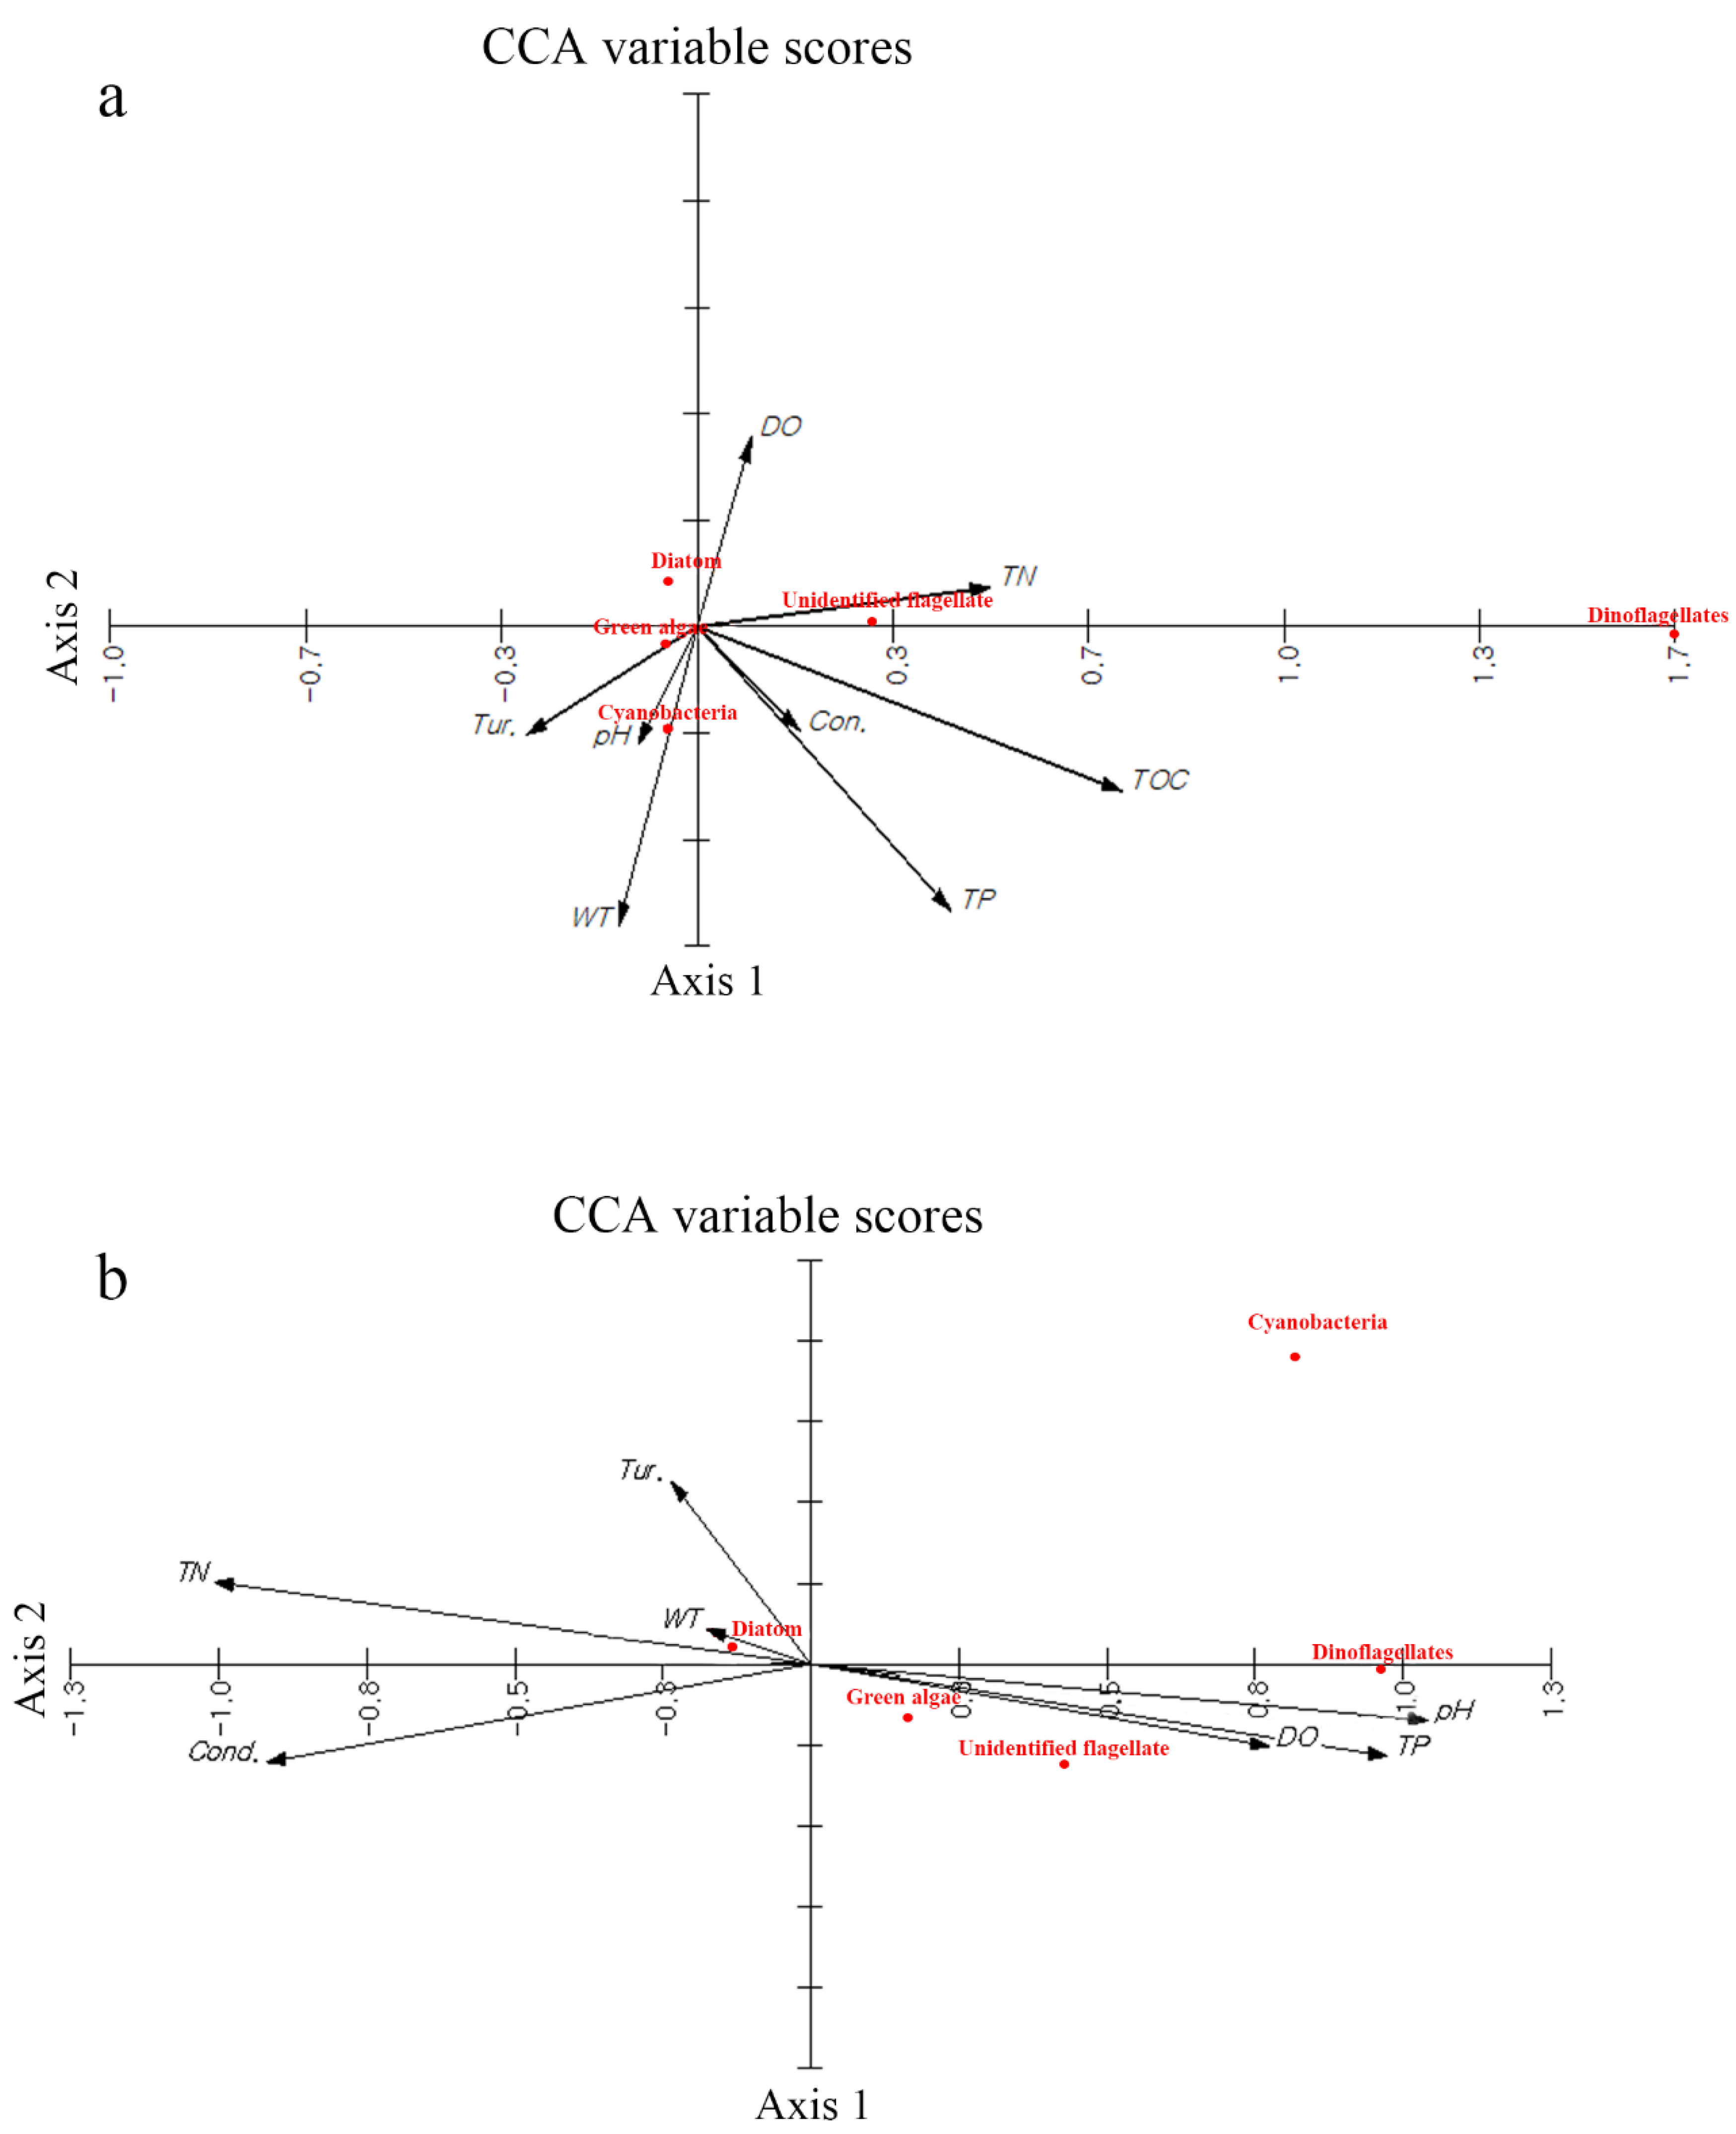
3.4. Statistical Analysis

The six study areas were divided into groups based on species composition and population (Figure 7). Groups of one stage of microalgae were observed in the divided group, mostly at St. 2. In addition, St. 4 (the site of the confluence of Gongduk Stream and the main river) was found to be different from other peaks at the time of the survey, and the factors affecting the distribution of microalgae in the residential area were influenced by the main stream and other tributaries. The CCA results for the two studies, shown in Figure 8, indicate that seven environmental factors were responsible for a significant proportion of variance in the five selected taxa. The ordination axes 1 and 2 were both statistically significant (p < 0.001) (Supplementary Table S3). Cyanobacteria were most influenced by pH and WT, whereas unidentified flagellates were affected by TN (Figure 8a). The diatoms and green algae, which were relatively higher in abundance than other taxa, were not affected by these factors. On the other hand, dinoflagellates were not related to these factors because of their low abundance.
The similarities were divided into three groups at around the 60% level by the Bray–Curtis similarity index (Figure 9). The Bray–Curtis similarity index was calculated using the relative percentage of each class in each sample. There were differences in the species composition and biodiversity between the summer and autumn. In the summer, the surface and middle layers were grouped, while the bottom layer formed another group. Similarly, in the autumn survey, the surface and middle layers were grouped, while the bottom layer formed a different group. However, this tendency was found to be slightly lower in autumn than in summer. Based on these results, we could indirectly confirm the formation of a thermocline that interferes with the vertical movement of microalgae between the lower and middle layers, with the depth of formation of the thermocline according to season. Diatoms were seen to be most influenced by CON, TUR, and WT as well as by TN. The changes observed in species richness and abundance concentration in the vertical migration studies confirmed these results.

4. Discussion

As part of the “Four Major Rivers Restoration Project” in 2012, the Sangju Weir was built in the Nakdonggang River in Korea [27]. Since the construction of the Sangju Weir, the water depth has increased making it is easy to secure water for agriculture.
In terms of the temporal and spatial distribution patterns of microalgae, the highest number of species was near the bottom of the Sangju Weir, in seven out of 17 surveys (Figure 2). Overall, the number of microalgae appeared to decrease from spring to winter in all sites. Diatoms showed a high occurrence from spring (April and May) to early summer (June to July), while green algae showed the highest appearance from June to August. Previous studies have found that changes from diatoms to blue-green algae and green algae occur as the temperature rise continues [28]. Thus, we concluded that the green algae replaced the diatoms not only in the water bodies of the Nakdonggang River but also in the domestic freshwater environment. In addition, other species, such as unidentified flagellates and dinoflagellates, were found to have a high rate of occurrence in autumn (September), and further studies on these are needed. Cyanobacteria were not observed for some time but had a somewhat higher occurrence rate once they appeared. Many hypotheses have tried to demonstrate the dominance of cyanobacteria, and several emphasized the importance of various TN for the success of the group [29]. In this study, the water temperature and cyanobacteria were significantly higher during the summer and were associated with some climatic features (Figure 2), such as monsoons. We understood that seasonal changes in this study area affect microalgae.
Among dominant diatom species, Fragilaria crotonensis is known to have a high abundance in rivers, lakes, and estuaries all over Korea [30]. Joh et al. [31] reported that they are more common in lakes than in rivers, and Kobayasi et al. [32] reported their distribution in alkaline, middle aqueous, and eutrophic lakes. In addition, Watanabe et al. [33] classified this species as alkaliphilous and mesosaprobous or mesotraphentic. Aulacoseira ambigua is a floating species, frequently observed in Korea, in freshwater ecosystems [30,34]. In dominant green-algae species, the genera Eudorina and Desmodesmus are frequently observed in various domestic water bodies and in nutrient-rich lakes, reservoirs, paddy fields, and slow-flowing streams [35]. On the other hand, cyanobacteria Anabaena and Microcystis are commonly found in freshwater ecosystems worldwide and cause major blooming during summer [36].
In the diurnal vertical migration of microalgae in the summer, the appearance of diatoms was overwhelmingly high, while that of other taxa was relatively negligible (Figure 6). However, the appearance of green and other algae was higher in the autumn when that of diatoms was relatively lower. In some cases, the appearance of cyanobacteria was approximately 10%, which was different from the first survey. Cyanobacteria have a high flotation, high light adaptability, and high CO2 utilization and absorption [37], in this study, it is analyzed that the appearance of cyanobacteria is higher than that of other microalgae in the diurnal vertical migration. In summer, the species richness in all the layers decreased between 13:00 hours on one day and 01:00 hours on the following day and increased again after that. Then, 24 h later, at 13:00 hours on the following day, the species richness level was restored. In autumn, the high species richness of the surface layer decreased rapidly and then increased again. On the other hand, there was a steady increase in species richness in both the middle and bottom layers. Species diversity was similar between the surface and middle layers but different in the lower. Based on these results, we could indirectly confirm the formation of a thermocline that interferes with the vertical movement of microalgae (between the lower and middle layers), and the depth of formation of the thermocline varies according to season. In Figure 8b, diatoms are seen to be most influenced by physical characteristics, such as CON, TUR, and WT as well as by the chemical factor TN. Since water temperature accelerates or delays the growth of microalgae, it affects the seasonal changes of the population and is an important factor in the structure of the ecosystem [2], apparently forms a thermocline layer in this area. The changes observed in species richness and abundance concentration in the vertical migration studies confirmed these results. Unidentified flagellates, green algae, and dinoflagellates were seen to be slightly affected by DO, TP, and pH. The change in pH is related to the change of the carbon source (e.g. H2CO3, HCO3, CO3−2), it affects the amount and community of microalgae [2], and in this study, the pH in aquatic ecosystem were affected the microalgae. The concentration of essential nutrients such as TN and TP are not only factors that determine the amount of microalgae, but the N/P ratio also affects abundance and species composition [37,38]. Therefore, the vertical migration of microalgae in the aquatic ecosystem in the Sangju Weir is considered to be somewhat difficult. The variation in pH was similar to that of water temperature in the summer, while in the autumn, there was no clear pattern in the variation. Turbidity was found to be high in the bottom layer in both seasons.

5. Conclusions

In this study, we aimed to understand the environmental factors affecting the temporal and spatial distribution and composition of microalgae communities in the Sangju Weir. The following conclusions were drawn:
(1)
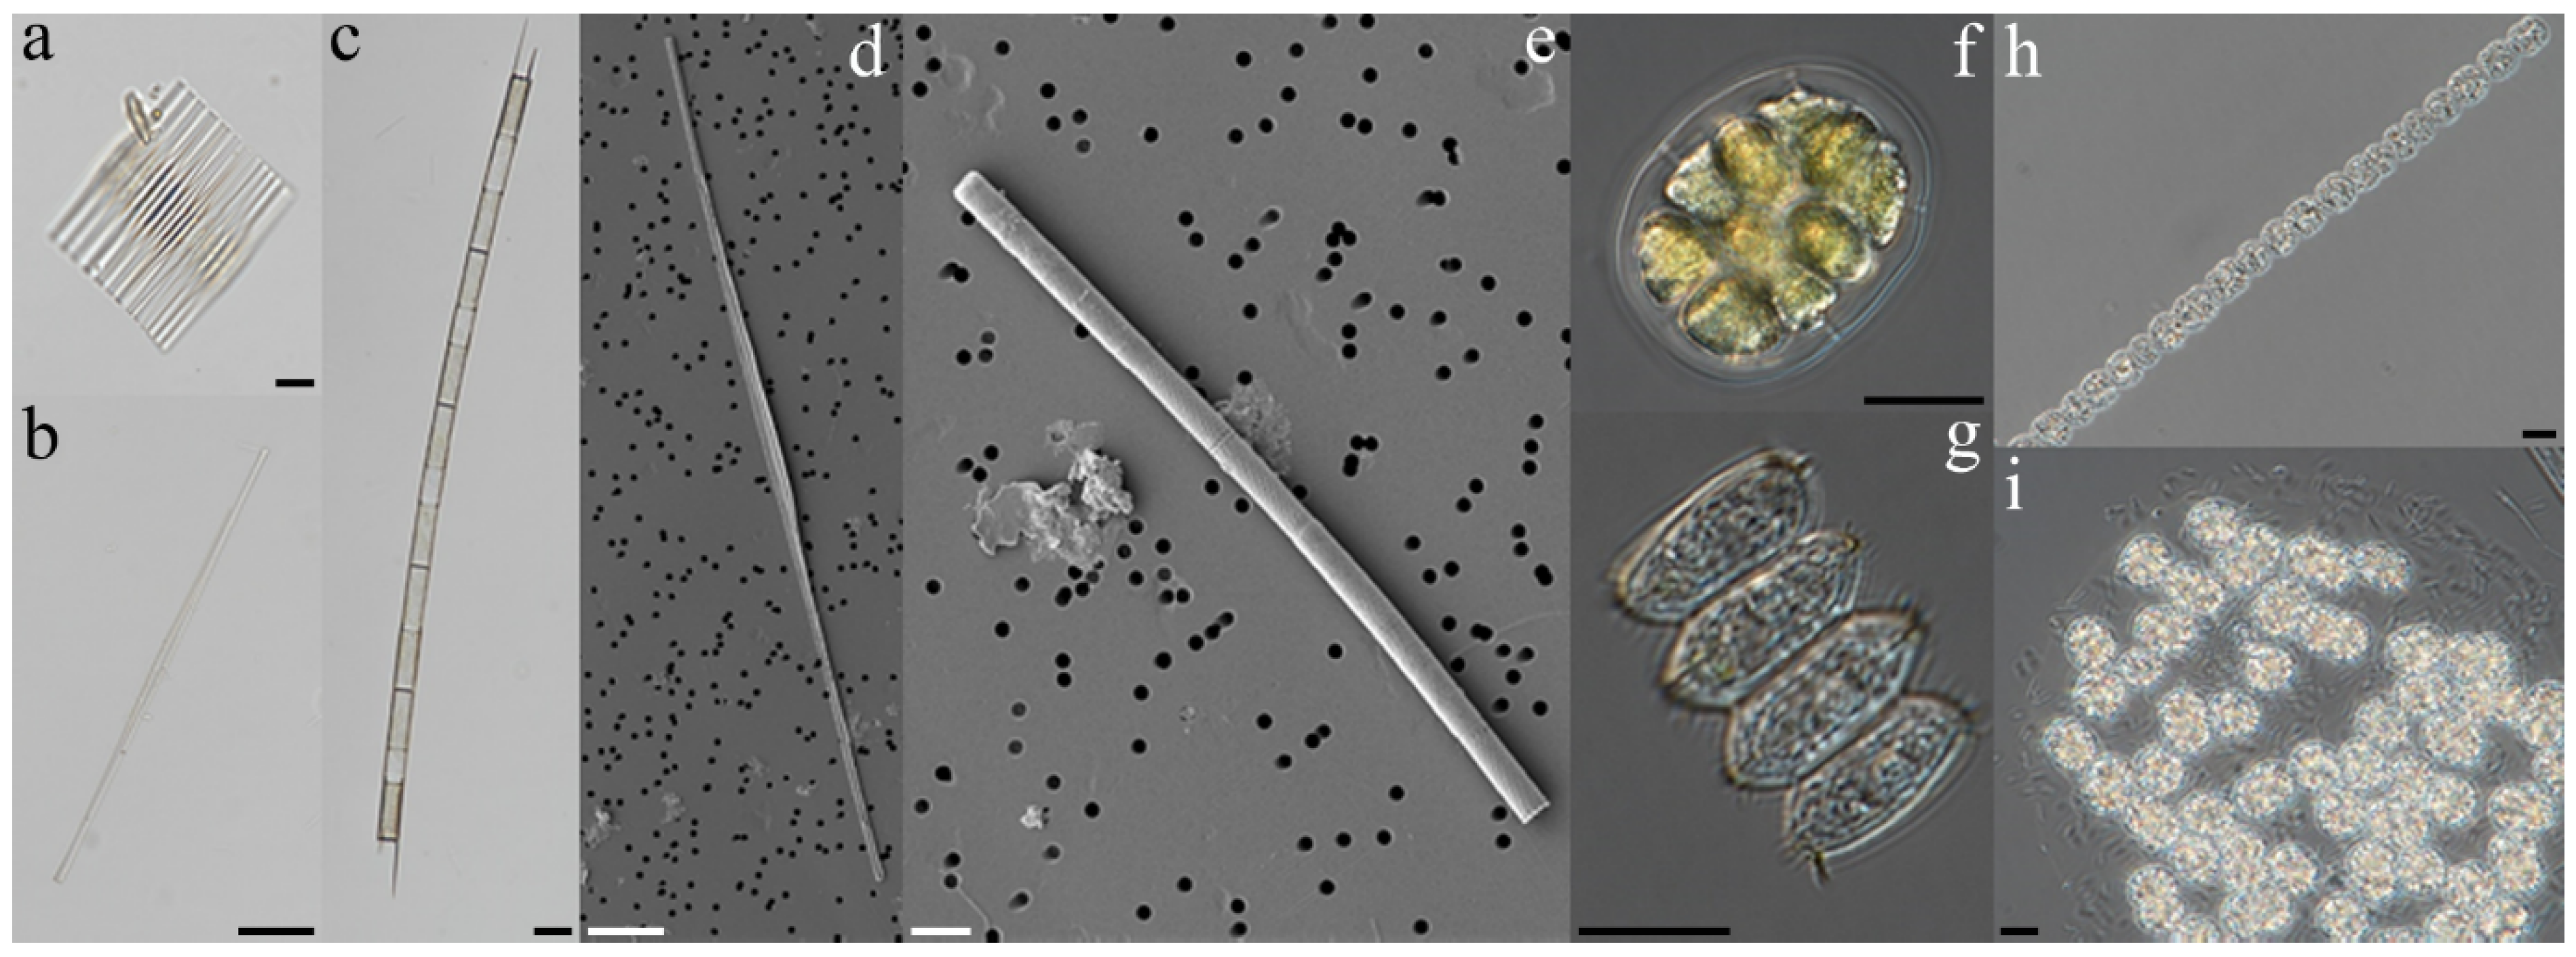
They are dominated by various microalgae, such as diatoms (e.g., Fragilaria crotonensis, Ulnaria acus, and Aulacoseira ambigua), green algae (e.g., genera Eudorina and Desmodesmus), cyanobacteria (e.g., genera Anabaena and Microcystis). Dinoflagellates and unidentified flagellates occasionally observed high abundance.
(2)
The distribution of microalgae was hardly affected by the weir but showed variability with temporal and spatial changes. The microalgal community structures in the main stream of the river were different from that in the Nakdonggang River stream. Species composition and diversity were very similar for all sites, except for the area around the Yeonggang River, where there was little impact from weir.
(3)
The species composition and diversity in the bottom layer were different from those of the surface and middle layer. Vertical migration of the microalgae was somewhat difficult because of the formation of a thermocline and the high turbidity of the lower layer.

Supplementary Materials

The following are available online at https://0-www-mdpi-com.brum.beds.ac.uk/2071-1050/12/16/6442/s1, Table S1: List of environmental factors for the ‘Temporal and spatial distribution patterns of microalgae’ survey in study area, Table S2: List of environmental factors for the ‘Diurnal vertical migration of microalgae’ survey in study area. Table S3. Summary of CCA analysis based on the species environment factors in study area.

Author Contributions

Conceptualization, S.M.Y., S.D.L., and D.R.K.; methodology, S.M.Y., S.D.L., and P.Y.C.; software, S.M.Y. and D.R.K.; validation, S.D.L. and S.W.N.; formal analysis, S.M.Y., S.D.L., and D.R.K.; investigation, S.M.Y., S.W.N., C.H.C., J.-Y.K., and J.-S.L.; resources, S.M.Y., S.W.N., P.Y.C., J.-Y.K., and J.-S.L.; data curation, S.M.Y. and S.D.L.; writing—original draft preparation, S.M.Y., S.D.L., and C.H.C.; visualization, S.M.Y. and D.R.K.; supervision, S.M.Y.; project administration, S.M.Y. and P.Y.C. All authors have read and agreed to the published version of the manuscript.

Funding

This study was supported by a research fund from NNIBR (NNIBR2018000011310, Study on the variation of time and space distribution of microalgae in resident aquatic ecosystem-Vol. I; NNIBR201901106, Study of protist on the freshwater and brackish habitant-Vol. III and NNIBR202001103, Study of protist diversity from the freshwater-Vol. IV).

Acknowledgments

We thank Chung Hyun Choi from Kunsan National University and KOTITI Testing & Research Institute Inc. (Seongnam, Gyeonggi-do, Republic of Korea) for helping with analyses of the water samples. We gratefully acknowledge the valuable comments from anonymous reviewers who helped improve this manuscript.

Conflicts of Interest

The authors declare no conflict of interest.

References

  1. Chung, J.; Kim, H.S.; Kim, Y.J. Structure of phytoplankton community in the Nakdong River estuary dam. Korean J. Limnol. 1994, 27, 33–46. [Google Scholar]
  2. Shin, J.H.; Lee, K.S.; Park, C. Dynamics of phytoplankton community in the up-stream of Naktong River. J. Nat. Sci. 1998, 15, 409–421. [Google Scholar]
  3. De Leaniz, C.G. Weir removal in salmonid streams: Implications, challenges and practicalities. Hydrobiologia 2008, 609, 83–96. [Google Scholar] [CrossRef]
  4. Churchman, C.W. Science and Decision Making. Philos. Sci. 1956, 23, 247–249. [Google Scholar] [CrossRef]
  5. Pielou, E.C. Freshwater; The University of Chicago Press: Chicago, IL, USA, 1998. [Google Scholar]
  6. Kondolf, G.M. PROFILE: Hungry Water: Effects of Dams and Gravel Mining on River Channels. Environ. Manag. 1997, 21, 533–551. [Google Scholar] [CrossRef] [PubMed]
  7. Harper, D. What is eutrophication? In Eutrophication of Freshwaters; Springer Science and Business Media LLC: London, UK, 1992; pp. 1–28. [Google Scholar]
  8. James, A. The value of biological indicators in relation to other parameters of water quality. In Biological Indicators of Water Quality; James, A., Evison, L., Eds.; John Wiley and Sons: Chichester, UK, 1979; Chapter 1. [Google Scholar]
  9. Watanabe, T.; Tohei, M.; Kakutani, U. Epilithic diatoms which have tolerance of organic population and adaptability. Res. Rep. Environ. Biol. 1982, B121–R12–10, 34–43. [Google Scholar]
  10. Watanabe, T.; Negoro, K.; Fukushima, H.; Kobayasi, H.; Asai, K.; Gotoh, T.; Kobayashi, T.; Mayama, S.; Nagumo, T.; Holum, A. Studies of the quantitative water quality estimation on freshwater pollution using diatom communities as the biological indicators (1). Ann. Rep. Nissan Sci. Found. 1983, 10, 336–341. [Google Scholar]
  11. Watanabe, T.; Negoro, K.; Fukushima, H.; Kobayasi, H.; Asai, K.; Gotoh, T.; Kobayashi, T.; Mayama, S.; Nagumo, T.; Holum, A. Studies of the quantitative water quality estimation on freshwater pollution using diatom communities as the biological indicators (2). Ann. Rep. Nissan Sci. Found. 1984, 11, 308–317. [Google Scholar]
  12. Lee, O.M. The annual dynamics of standing crops and distribution of phytoplankton in Juam lake in 1992. Korean J. Limnol. 1994, 27, 327–337. [Google Scholar]
  13. Chung, Y.H.; Shim, J.H.; Lee, M.J. A study on the microflora of the Han River I. The phytoplanktons and the effect of the marine water in the lower course of the Han River. J. Plant Biol. 1965, 8, 47–65. [Google Scholar]
  14. Cho, K.J. Spatial and temporal distribution of phytoplanktonic and periphytic diatom assemblages of Naktong River estuary. Korean J. Phycol. 1991, 6, 47–53. [Google Scholar]
  15. Cho, K.J.; Chung, I.K.; Lee, J.A. Seasonal dynamics of phytoplankton community in the Naktong River estuary. Korea. Korean J. Phycol. 1993, 8, 15–28. [Google Scholar]
  16. Chung, Y.H.; Noh, K.H.; Lee, O.M. The flora and dynamics of phytoplankton in estuary of Naktong River. Bull. Korean Assoc. Conserv. Nat. 1987, 9, 5–30. [Google Scholar]
  17. Kim, J.W.; Lee, H.Y. A study on phytoplankton communities in the reservoir of Naktong River estuary. Korean J. Limnol. 1991, 24, 143–151. [Google Scholar]
  18. Kim, Y.J.; Lee, J.H. Comparison of phytoplankton communities of six dam lakes in the Naktong River system. Korean J. Limnol. 1996, 29, 347–362. [Google Scholar]
  19. Moon, S.; Chung, J.; Choi, C. The structure of phytoplankton community in the middle-lower part of the Naktong River. J. Korean Environ. Sci. Soc. 2001, 10, 41–45. [Google Scholar]
  20. Park, H.; Chung, C.M.; Bahk, J.; Hong, Y.K. The relationship between phytoplankton productivity and water quality changes in downstream of Nakdong River. J. Korean Environ. Sci. Soc. USA 1999, 8, 101–106. [Google Scholar]
  21. American Public Health Association (APHA). Standard Methods for the Examination of Water and Wastewater, 19th ed.; American Public Health Association: Washington, DC, USA, 1995; pp. 1–733. [Google Scholar]
  22. Clarke, K.R. Non-parametric multivariate analyses of changes in community structure. Austral Ecol. 1993, 18, 117–143. [Google Scholar] [CrossRef]
  23. Clarke, K.; Ainsworth, M. A method of linking multivariate community structure to environmental variables. Mar. Ecol. Prog. Ser. 1993, 92, 205–219. [Google Scholar] [CrossRef]
  24. Clarke, K.R.; Warwick, R.M. Change in Marine Communities: An Approach to Statistical Analysis and Interpretation, 2nd ed.; Primer-E Ltd.: Plymouth, UK, 2001. [Google Scholar]
  25. Field, J.G.; Clarke, K.R.; Warwick, R.M. A practical strategy for analyzing multispecies distribution patterns. Mar. Ecol. Prog. Ser. 1982, 8, 37–52. [Google Scholar] [CrossRef]
  26. Ter Braak, C.J.F.; Verdonschot, P.F.M. Canonical correspondence analysis and related multivariate methods in aquatic ecology. Aquat. Sci. 1995, 57, 255–289. [Google Scholar] [CrossRef]
  27. Kim, J.-H.; Yoon, J.-D.; Baek, S.-H.; Jang, M.-H. Estimation of optimal ecological flowrates for fish habitats in a nature-like fishway of a large river. J. Ecol. Environ. 2016, 39, 43–49. [Google Scholar] [CrossRef]
  28. Patrick, R.; Crum, B.; Coles, J. Temperature and manganese as determining factors in the presence of diatom or blue-green algal floras in streams. Proc. Natl. Acad. Sci. USA 1969, 64, 472–478. [Google Scholar] [CrossRef] [Green Version]
  29. Rückert, G.V.; Giani, A. Effect of nitrate and ammonium on the growth and protein concentration of Microcystis viridis Lemmermann (Cyanobacteria). Braz. J. Bot. 2004, 27, 325–331. [Google Scholar] [CrossRef] [Green Version]
  30. Lee, J.H. Checklist of freshwater planktonic diatoms in Korea. J. Basic Sci. Sangmyung Univ. 1997, 10, 59–204. [Google Scholar]
  31. Joh, G.; Lee, J.H.; Lee, K.; Yoon, S.-K. Algal flora of Korea. In Chrysophyta: Bacillariophyceae: Pennales: Araphidineae: Diatomaceae Freshwater Diatoms II; National Institute of Biological Resources Ministry of Environment: Incheon, Korea, 2010; Number 2; Volume 3, pp. 1–53. [Google Scholar]
  32. Kobayasi, H.; Idei, M.; Mayama, S.; Nagumo, T.; Osada, K. Kobayasi’s Atlas of Japanese Diatoms Based on Electron Microscopy; Uchida Rokakuho Publ. Co. Ltd.: Tokyo, Japan, 2006; Volume 1. [Google Scholar]
  33. Watanabe, T.; Ohtsuka, T.; Tuji, A.; Houki, A. Picture Book and Ecology of the Freshwater Diatoms; Uchida-Rokakuho: Tokyo, Japan, 2005. [Google Scholar]
  34. Mizuno, T. Illustrations of Freshwater Plankton of Japan; Hoikusha Publishing Co. Ltd.: Osaka, Japan, 1993. [Google Scholar]
  35. John, D.M.; Whitton, B.A.; Brook, A.J. The Freshwater Algal Flora of the British Isles: An Identification Guide to Freshwater and Terrestrial Algae, 2nd ed.; Cambridge University Press: Cambridge, UK, 2011. [Google Scholar]
  36. Lee, J.H.; Kim, H.S.; Jung, S.W. Illustration of Phytoplankton in the Nakdong River; Nakdonggang National Institute of Biological Resources (NNIBR): Sangju, Korea, 2017; pp. 1–461. [Google Scholar]
  37. Cho, K.-J.; Shin, J.-K. Growth and nutrient kinetics of some algal species isolated from the Naktong River. Algae 1998, 13, 235–240. [Google Scholar]
  38. Kilham, P.; Hecky, R.E. Comparative ecology of marine and freshwater phytoplankton. Limnol. Oceanogr. 1988, 33, 776–795. [Google Scholar] [CrossRef] [Green Version]
Figure 1. Aerial map of the study area.
Sustainability 12 06442 g001
Figure 2. Appearance of microalgae in the study area.
Sustainability 12 06442 g002
Figure 3. Species richness, abundance, and diversity of microalgae in the study area.
Sustainability 12 06442 g003
Figure 4. Frequency of microalgae during the survey period Micrographs of microalgae taken using light microscopy (ac,fi) and scanning electron microscopy (d,e). (a) Fragilaria crotonensis; (b,d) Ulnaria acus; (c,e) Aulacoseira ambigua; (f) Eudorina sp.; (g) Desmodesmus sp.; (h) Anabaena sp.; (i) Microcystis sp. Scale bars represent 20 μm (b,d,f), 10 μm (a,c,e,g,i), and 5 μm (h).
Sustainability 12 06442 g004
Figure 5. Vertical distribution of microalgae in the study area.
Sustainability 12 06442 g005
Figure 6. Species richness, abundance, and diversity in the vertical distribution of microalgae in the study area.
Sustainability 12 06442 g006
Figure 7. Non-metric multidimensional scaling analysis plot based on Bray-Curtis similarities between observed microalgae in this study and a total of 17 surveys distinguished by CLUSTER analysis (symbols).
Sustainability 12 06442 g007
Figure 8. Distribution of the microalgae in an ordination diagram using the two first axes of the Canonical Correspondence Analysis for the study are (a) results of the ‘Temporal and spatial distribution patterns of microalgae’ survey; (b) results of the ‘Diurnal vertical migration of microalgae’ survey.
Sustainability 12 06442 g008
Figure 9. Non-metric multidimensional scaling analysis plot based on Bray-Curtis similarities between the vertical distribution of microalgae in this study and a total of two surveys distinguished by CLUSTER analysis (symbols).
Sustainability 12 06442 g009

