Effects of Urbanization on Regional Extreme-Temperature Changes in China, 1960–2016


1
School of Geographical Sciences, Guangzhou University, Guangzhou 510006, China
2
Rural Non-Point Source Pollution Comprehensive Management Technology Center of Guangdong Province, Guangzhou University, Guangzhou 510006, China
*
Author to whom correspondence should be addressed.
Sustainability 2020, 12(16), 6560; https://0-doi-org.brum.beds.ac.uk/10.3390/su12166560
Submission received: 22 June 2020
/
Revised: 5 August 2020
/
Accepted: 12 August 2020
/
Published: 13 August 2020
(This article belongs to the Collection Urban Planning and Built Environment)
Abstract
:Urbanization in China has been expanding dramatically since 1978, significantly affecting the extreme temperature changes in cities, which is a vital indicator of urban climate change. To assess urban-related effect on regional extreme-temperature changes in China, this study employed high-resolution land use data to divide meteorological stations into rural stations, suburban stations, and urban stations, and evaluated the annual and seasonal changes in extreme minimum temperature (TNN), mean temperature (Tavg) and extreme maximum temperature (TXX) at each meteorological station. The result revealed that extreme temperature indices (TNN, TXX) and Tavg increased significantly from 1960 to 2016 with varied degrees in different seasons and different regions. Extreme temperature indices in high latitudes increased more rapidly than in low latitudes; while the trends in summer are slower than in other seasons. Urbanization effects on the trends of TNN, Tavg and TXX were all statistically significant, but urbanization effects on TNN and Tavg were more significant than TXX. The urbanization effects were more significant in low altitudes, especially in North, South, Northwest and Northeast China. In North, Northwest and Northeast China, the urban-related effects on temperature increase were mainly observed in spring and winter, but in South China, the urban-related effects were more evident in summer. This study is valuable for sustainable urban planning in China.

1. Introduction
Global warming is a hot scientific topic in climate change research [1,2]. Global warming has caused a large range of problems, including rising sea levels, increasing the frequency and intensity of extreme weather events, melting glaciers, etc. [3,4,5,6]. Contributors to global warming include solar variations [7], greenhouse gas emissions and land use changes [8,9], etc. Among them, the changes in greenhouse emissions and land use are closely related to the degree of urbanization. Urbanization typically results in built-up environments containing large areas of impervious surfaces with increased thermal inertia [10]. The Intergovernmental Panel on Climate Change (IPCC report) pointed out that, after the industrial revolution, anthropogenic activities have contributed 0.8–1.2 °C to global warming [11]. Various studies have reported urban areas are warmer than their rural neighboring areas [12]. These studies about the urban effects on temperature trends were not aimed to identify extreme differences, nor to evaluate the Urban Heat Island based on some individual meteorological sites, but to look for variations to urban effects over a period of decades in large area based on mean values from many site records [13,14,15]. We should also note the fact that, at large scales, the urban area in developing countries occupies a very low ratio of the territorial land [12,16]. Therefore, any urban effects cannot be displayed.
Urbanization refers to the process by which large numbers of rural people become urban people [17]. During the period 1960–2016, the urban population increased from about 0.1 billion to about 0.8 billion in China. Simultaneously, the total population increased from about 0.6 billion to about 1.4 billion; GDP per capita surged from about 0.1 thousand RMB to 60 thousand RMB, which depicted the drastic urbanization in China. Energy consumption would absolutely increase with urbanization. The generated superfluous artificial heat would be released to the land surface air, leading to land surface air temperature change. CO2 emissions per capita had rapidly increased as the total urban population had risen by 0.8 billion during the period 1960–2016. The above statements have qualitatively confirmed that development of urbanization would accelerate temperature changes. Significantly, the above important indices for urbanization level have been increasing over time during the period 1960–2016. The population, CO2 emission, GDP, impervious surface area can be used as the indicators of urbanization. Since China’s economic reform in 1978, fast urbanization has become a ubiquitous phenomenon in China, especially in East China. For example, build-up areas in China increased by 5327 km2 during the period 1995–2000 [18], and increased by more than 300% in Pearl River Delta region during the periods 1988–1996 [19]. The urbanization ratio has expanded from 17.92% in 1978 to 58.5% in 2017 [20], and will rise by 70% in 2030 [21]. Thus, it represents a country of world where, if there was to be noticeable urbanization-related temperature change, it should be in China and over recent decades. The dramatic process of urbanization is affecting temperature change to some extent. However, the varied degrees of urbanization in urban, suburban and rural areas, leading to different amount of greenhouse gas emission and land use change, will further result in urban-related effects on temperature changes in different regions. Quantitative assessment on such effects is beneficial for understanding the pattern of urban-related effects on temperature changes, and thus provide some reference for urban management and urban sustainability.
Many studies have reported possible urban-related climate change based on China’s temperature datasets [22,23]. More recent studies have also illustrated such phenomenon [24,25,26,27]. For example, Li et al. [28] highlighted that urbanization effect contributed 0.05 °C per decade−1 to mean surface temperature increase for the period 1979–1998. Ren et al. [29] revealed that urbanization contributed 0.11 °C per decade−1 to the increase in mean surface temperature in North China during the period 1961–2000. The overall study in mainland China by Zhang et al. [30] found that urbanization contributed 0.076 °C per decade−1 to the increase in mean surface temperature during the period 1961–2004. Ren et al. [27] organized 282 meteorological stations in North China into four groups of rural, small city, medium city, large city and metropolis, indicating that the highest urban warming occurred in large-city group at a rate of 0.16 °C per decade−1, while the lowest urban warming occurred in small-city group at a rate of 0.07 °C per decade−1. Stone [31] assessed that urbanization contributed 0.05 °C per decade−1 to mean surface temperature, increase change for 50 large cities in USA for the period 1951–2000. Chrysanthou et al. [32] revealed that urbanization contributed 0.0026 °C per decade−1 to the increase in mean temperature in pan-Europe for the period 1960–2012. However, such studies about urbanization effects on temperature change mostly used mean surface temperature as the key indicator. The aforementioned studies consistently concluded that, urbanization has enhanced temperature change in China, North America and Europe. However, an overall study covering the entirety of mainland China, which also considered the effects on extreme temperature change, is not common in the academic community.
Katz et al. [33] believed that extreme minimum temperatures are more sensitive to climate change than mean temperatures. Alexander et al. [34] evaluated changes in extreme minimum temperatures for 2223 meteorological stations over the world, concluding that extreme minimum temperature has significantly increased in 45% of the stations. Ren et al. [35] evaluated extreme temperature for the time period 1961–2008 in mainland China and found that urbanization contributed approximately 0.118 °C per decade−1 to annual extreme minimum temperature increase, but just contributed approximately 0.047 per °C decade−1 to the increase of annual mean temperature. In the. Pearl River Delta of China, based on meteorological stations with observations since 1960, Qiu et al. [36] found that decadal rate of increase for extreme minimum temperature was 0.49 °C per decade−1 for the time period 1960–2011, while the counterpart for the mean annual temperature was just 0.21 °C per decade−1. The above studies have undoubtedly shown that extreme temperatures are more sensitive to climate change, and extreme temperature changes are closely related to extreme weather events (such as heat waves and drought) [37], which are thus more important for urban sustainability.
This study, employing monthly temperature dataset from 1960 to 2016 homogenized by National Meteorological Information Center of China and high-resolution land use map derived from Sentinel satellite images, analyzed extreme temperature changes in mainland China, followed by the analysis of urbanization contribution to extreme temperature change. Moreover, by comparing with previous studies, we updated the characteristics of temperature changes in China after 2008 and derived a new trend of extreme temperature changes in China.
2. Materials and Methods
2.1. Study Area
The study area is in mainland China (Figure 1). Since the economic reform in 1978, urbanization in China has experienced rapid development (Figure 2); both heat balance and land use have thus undergone tremendous changes. Therefore, China can be regarded as a representative case study for the impact of urbanization on temperature changes. Because some parts of the Northwest and Southwest region are plateaus or deserts, the density of meteorological stations in these two regions is relatively low. According to Figure 2, the important indices for urbanization in China have been increasing over time during the period 1960–2016. Thus, in this study, time was assumed to be an indicator for urbanization.
China has a vast territory and different climate zones. According to previous research on China’s natural zoning based on some key factors, including hydrothermal and geomorphic conditions, etc. [39,40,41], this study uses China’s division into seven natural regions, namely Northeast China, North China, East China, Southeast China, Central China, Southwest China and Northwest China (Figure 1). Moreover, in order to analyze the latitudinal effects of urbanization on temperature changes, the meteorological stations were divided into 5 groups, namely 18°–25° N, 25°–32° N, 32°–39° N, 39°–46° N and 46°–53° N.
2.2. Data Source
The Monthly Value Dataset of China Ground Climate Materials was collected from the China Meteorological Data Network (http://www.data.cma.cn), which was managed by the China Meteorological Administration. Quality control procedures were conducted by the data provider and include the checking of continuous erroneous data, temporal and spatial checking of outliers, and manual advanced identification of continuous suspicious data and outliers. Further details on the processing methods have been reported by Ren et al. [42]. According to the description for the dataset in the China Meteorological Data Network, the original dataset has undergone strict quality control, and the potential error rate of extreme minimum temperature (TNN), mean temperature (Tavg) and extreme maximum temperature (TXX) are less than 1‰. The dataset included 613 meteorological stations, most of which are national-level climate stations and few provincial meteorological stations. This study selected 555 meteorological stations with continuous observation records greater than 42 years for the time period 1960–2016. For a few stations with missing monthly data, the moving average of the adjacent 10 years of data was used as a replacement to ensure the integrity and continuity of the dataset. The distribution of the meteorological station is shown in Figure 1. This study used TNN, Tavg and TXX of the dataset as temperature indices. The indices are defined in Table 1.
Before data analysis, we examined and adjusted the inhomogeneity caused by relocation of sites, changes in observation times, modifications in the time system used, and the upgradation or modification of instruments. Among the problems, station relocation was the major cause of discontinuous points in the station temperature series. Various methods have been proposed to examine and adjust the inhomogeneity of temperature series in the international academic community. Accordingly, some approaches for the homogenization have been developed [43,44,45,46]. Here, we used a method introduced by Li et al. [47] for the homogenization of the temperature series. The method was adopted from the Easterling and Peterson method [43,44] to conduct the examination and adjustment of inhomogeneity of the monthly temperature data. By comparing with the pre-adjustment series, it can be found that the method is comparatively effective for examining the inhomogeneity of the Chinese temperature series. During this process, the stations with possible inhomogeneity were identified. Their spatial locations were updated to the latest accordingly. We reviewed all the stations with possible inhomogeneity and double-checked their location changes from the Internet as well as the reports and public publications released by meteorological agencies. We carried out the updates in spatial locations in very conservative way; for example, only when a relocation event was reported in multiple sources, the relevant spatial location change was confirmed.
Gong et al. [48] developed a global land cover map with 10-m resolution based on 2017 Sentinel-2 images in the Google Earth Engine using a random forest algorithm with 200 trees (http://data.ess.tsinghua.edu.cn). The mapping works set approximately 340,000 training samples and approximately 140,000 validation samples derived from 2014 and 2015 Landsat 8 images, with classification types of cropland, forest, grassland, shrubland, wetland, water, tundra, impervious area, bare land and snow. The overall accuracy for this classification is 72.76%, but accuracy for the impervious area is slightly lower (72.19%). However, due to the enormous of training and validation samples, the classification accuracies are stable. Therefore, the accuracy and resolution are relatively stable enough to group meteorological stations (urban station, suburban station and rural station). The specific method to identify the type of meteorological stations will be described in detail in Section 2.3. To generate the land cover map with 10-m resolution in China (Figure 3), a total of 320 images from the global land cover dataset were appended and then clipped by the China boundary. (Figure 3). According to Figure 3, densities of impervious area in South China, East China and North China are higher than other regions, and according to Figure 1, densities of rural stations in Northwest China and Southwest China are higher than other regions. Therefore, the heterogeneity of impervious surfaces and meteorological locations reflect the spatial characteristics of urbanization in China, which will cause different urbanization effects on extreme temperature changes.
The GDP data in South China was collected from the National Bureau of Statistics (http://www.stats.gov.cn/tjsj/), which is the most authoritative statistical agency in China.
2.3. Identification of the Group of Meteorological Stations
In evaluating the effect of urbanization on temperature changes, it is crucial to identify the type of meteorological station. There are two indexes to identify the type of meteorological stations: one is based on social and economic indicators, for example, population as the indicator of the group of meteorological station [49,50]. The stations in the highly populated area are assumed to be in the urban group; the ones in relatively lowly or sparsely populated areas are assumed to be in the suburban and rural groups. This method, not considering the specific location of the meteorological stations, takes the administrative region as the smallest unit, ignoring the spatial heterogeneity of the terrestrial object in the administrative region, thus, easily causing misjudgment. Another method is to determine the density of the built-up area around the meteorological stations based on low-resolution satellite images such as DMSP/OLS nighttime lighting images (spatial resolution 1 km) or MODIS images (space resolution 500 m) or resampled images (space resolution more than 100 m) etc., thereby assigning the group for each meteorological station [51,52,53,54,55]. Due to the low resolution of these images, the accuracy of the built-up area based on the images was relatively low. In recent years, some free high-resolution satellite images have been made available to the public for free of charge, such as the Sentinel series. However, these datasets take up enormous storage space for such a large study area as mainland China; it is very challenging to process these images for a big region. Fortunately, with the advent of the Google Earth Engine, large-scale land use assessment based on high-resolution satellite images is much more efficient. Gong et al. [48] released a global 10-m resolution land cover map, this study will use this dataset to identify the type of meteorological station and sort them into urban, suburban and rural groups.
In this study we classified the meteorological stations into 4 groups: the first group have been the urban stations since the 1960s, which is merely an extremely small proportion of the total stations; the second and third groups initially were rural stations in the 1960s and became urban stations and suburban stations during the period 1960–2016, respectively; the last group remained rural stations until 2016. Unfortunately, no public maps or satellite images were available to identify the initial status in the 1960s. Here we used the confidential digital collection of China Military Topographic Maps to check the initial status in the 1960s. The first group of stations was excluded in first stage of data analysis as the stations experienced urbanization before the 1960s. The identification of the group of the remaining meteorological stations was as follows. We first made a 1 km buffer for each meteorological station and used the buffer to clip the land cover map. The 1-km threshold came about for the theory of boundary layer urban heat islands [56,57]. The two studies defined boundary layer urban heat islands as starting from the rooftop and treetop level and extending up to the point where urban landscapes no longer influence the atmosphere. This region typically extends no more than one mile (1.5 km) from the surface. Horizontally, the region typically extends less than one kilometer. Therefore, a 1-km buffer was used in this study. We then calculated the ratio of impervious surface area (RISA) in each clipped area. The corresponding meteorological stations with RISA of less than 10% were classified into the rural group, and those with RISA between 10% and 80% were classified into suburban group, and those with RISA of more than 80% were classified into urban group. The distribution of different types of meteorological stations is showed as Figure 1.
2.4. Analysis of Exterme Temperature Change and Urbanization Effect
This study primarily focused on five time series: spring (March–May), summer (June–August), autumn (September–November), winter (December–February) and annual. The TNN and TXX in each dataset are the maximum and minimum values; the Tavg, like in other studies, is the mean value in the corresponding time periods. We first investigated the data series to explore the mathematical relationship between the temperature series and time. Pearson’s correlation coefficient (r) was used as a measure of the strength of the association between the two variables. Positive correlation indicates that temperature increased with time, whereas negative correlation indicates temperature decreased with time. Data pairs with strong correlation were used for further analysis. Trends for TNN, Tavg and TXX were evaluated by a linear regression model, followed by the assessment based Student-test with the confidence level above 95%. Then, in different zones (Figure 1), the mean temperature-change rates (TNN, Tavg, TXX) were derived by group (rural stations, suburban stations, urban stations) from all the stations passing through the test, and the obtained values were marked as the temperature change rates in the specific zones.
In different zones, the difference in temperature-change rate between the urban group and the rural and suburban groups were calculated. If we assume the temperature change in the rural group or suburban group as the baseline, the urban-related effect on temperature change in the urban group can be obtained. They can be expressed as
where is the average temperature-change rate (TNN, Tavg, TXX) for the urban group in the corresponding region; is the average temperature-change rate (TNN, Tavg, TXX) for the rural group in the identical region; is the measurement of the urban-related effect on urbanization in the aforementioned region; is the measurement of the urban-related effect on based on the suburban group in the same region. Moreover, the relative urban-related effect on climate change was defined as:
or
where is the urbanization contribution to temperature change based on the rural or suburban groups.
3. Results
3.1. Urban-Related Effect on TNN Changes
After evaluating the rates of the changes of TNN for 555 meteorological stations, the number of meteorological stations passing the statistical significance test (95%) in spring, summer, autumn, winter and annual are 214, 424, 320, 366 and 366, respectively. The data showed that there were the fewest meteorological stations with obvious TNN changes in spring, while most meteorological stations with obvious TNN change occurred in summer, followed by autumn and winter. The changing rates of TNN in each zone is summarized in Table 2.
As shown in Table 2 and Figure 4, TNN change in China displayed significantly regional and seasonal increasing trends. In the four seasons and annually, the TNN changes in the high latitudes such as Northeast China, North China and Northwest China were significantly faster than other regions: in South China rate of increase was the slowest among the seven zones. Regarding the annual variation, TNN warming rates in Northeast China, North China and Northwest China were 0.800 °C per decade−1, 0.772 °C per decade −1, and 0.759 °C per decade −1, respectively, much higher than in other regions (lower than 0.600 °C per decade −1), indicating that the TNN change in China has strong latitudinal zonality. If the changes based on latitudinal gradient pattern (Figure 4 and Table 3) are considered, it can be seen that, both the seasonal and annual changes, with the increase in latitude, revealed increasing trends, displaying a more significant effect on the TNN increase. For instance, in the region of 18°–25° N, the seasonal and annual rates of TNN were 0.527 °C per decade−1, 0.315 °C per decade−1, 0.494 °C per decade−1, 0.417 °C per decade−1, and 0.415 °C per decade−1, respectively; but the counterparts in the region of 46–53° N, are 0.947 °C decade−1, 0.667 °C per decade−1, 0.817 °C per decade−1, 0.843 °C per decade−1, and 0.842 °C per decade−1, which are double or near-double of the changes in the region of 18°–25° N.
TNN change also displayed its typical seasonality. In Table 2, in all regions, the slowest increase in TNN change happened in summer; the fastest warming was observed in winter in Northeast, North and Central China. In East, South and Northwest China, the fastest changes in TNN occurred in autumn, corresponding to the fastest increases in Spring in Southwest China. In Spring, the fastest rate of increase was 0.782 °C per decade−1 in Northwest China, while the slowest increasing rate was 0.334 °C per decade−1 in South China. In summer, the fastest rate of TNN change was 0.646 °C per decade−1 in North China, corresponding to the slowest rate of increase of 0.313 °C per decade−1 in South China. In autumn, the fastest rate of increase occurred in Northwest China at a rate of 0.838 °C per decade−1, while the slowest rate of increase occurred in South China at a rate of 0.489 °C per decade−1. In winter, the highest rate of increase of 0.801 °C per decade−1 was in Northeast China, much higher than the lowest rate of increase of 0.405 °C per decade−1 in South China. Overall, the increasing trend was more significant in Spring, Autumn and Winter than in Summer. The fastest annual increase occurred in Northeast China at a rate of 0.800 °C per decade−1, corresponding to the lowest in South China at a rate of 0.411 °C per decade−1.
The altitudes for the meteorological stations range from 0 to 4500 m in China. However, in some regions such as South China and East China, all the station altitudes are less than 1500 m, so there are one or two ranges (0–500 m and 500–1000 m) available for these regions. As shown in Figure 5, the altitudinal effect on TNN variation displayed strong spatial heterogeneity. Specifically, in Southwest China, except in autumn, with regard to both seasonal and annual changes, the TNN rate of increase significantly became stronger with the increase in altitude (above 95% level). The annual trend for the entirety of mainland China, except in summer, the rate of increase became slightly stronger as the altitude increased despite the fact that the trend was not statistically significant. In Northwest China, as the altitude increases, the rates of seasonal and annual change in TNN dropped despite the fact that the trend was not statistically significant in spring and summer.
As shown in Table 4, the urban-related effect caused by urbanization on TNN warming was quite significant during the study period 1960–2016, but without noticeable latitudinal zonality. In addition to East China and Southwest China, urbanization had an evident positive effect on TNN increase; however, unlike the warming trend becoming increasingly strong with latitudinal increase, the most evident urban-related effect was observed in North China, South China, and Northwest China, followed by Northeast China. Despite the lowest temperature increase being observed in South China (Table 2), the urban-related effect in South China was more evident than some other regions. In the zones of Northeast China, South China, East China and Northwest China, was larger than , which indicates that urban-related effect contributes more with a higher urbanization level. However, in Southwest China, regarding the winter and annual values, both and are less than zero, indicating that there are probably other natural factors that have a greater impact on TNN change. As described in previous section, as the altitude increases, the TNN rate of increase also became stronger in Southwest China, possibly offsetting the effect caused by urbanization. However overall, except for Southwest China, urbanization had a significant positive effect on TNN increase.
The urban-related effects in different seasons were quite representative, but with varied degrees. In Table 3, the highest seasonal temperature increase happened in winter, followed by spring, autumn, and then summer with the lowest warming trend. However, in Table 4, the highest urban-related effect on TNN increase was observed in summer. The observed urban-related effect was quite consistent with the results by Ren et al. [27]. In Northeast, East and South China, largest urban-related effects were observed in summer, with urbanization effects of 0.137 °C per decade−1, 0.101 °C per decade−1, and 0.176 °C per decade−1, respectively, and the relative contributions to TNN increase were 19.7%, 24.0% and 41.7%, respectively. In North China and Northwest China, largest augmenting effect occurred in winter with an absolute contribution of 0.431 °C per decade−1 and 0.243 °C per decade−1, respectively, and a relative contribution of 40.5% and 27.8%, respectively. In Central China, the largest effect happened in Spring, with an absolute contribution of 0.234 °C per decade−1, and a relative contribution of 40.0%. In Southwest China, the largest urban-related effect occurred in autumn, with an absolute increase of 0.356 °C per decade−1, and a relative increase of 43.8%. In the entirety mainland China, the largest augmenting effect occurred in winter, with an absolute increase of 0.132 °C per decade−1, and a relative increase of 18.1%.
Figure 6 displays the changes in TNN over the years in South China, which was one of the most prosperous regions in China, implementing economic reform since 1978. Three urbanization stages can be discerned according to the GDP trends in South China, with almost no increasing trend during 1960–1978, a slightly increasing trend during 1979–1995 and an abruptly increasing trend after 1996. In the rural group, there were 31 years during which TNN was higher than the average TNN during 1960–2016. Among those, 26 years occurred after 1978 and 18 years occurred after 1991. In the suburban group, there were 27 years during which TNN was higher than the average TNN. Among those, 25 years occurred after 1978 and 18 years occurred after 1991. In the urban group, there were 28 years during which TNN was higher than the average TNN. Among those, 27 years occurred after 1978 and 22 years occurred after 1991. In conclusion, TNN increased faster after 1978, which was highly consistent with the GDP trend.
In summary, the urban-related effect on TNN change displayed obviously regional and seasonal characteristics. In assessment of the effect by urbanization on the change in TNN, it is necessary to consider the impact of altitude, which would probably cause bias for the analysis.
3.2. Urban-Related Effect on Tavg Changes
After evaluating the rates of the change of Tavg for 555 meteorological stations, the number of meteorological stations passing the significance test (95%) in spring, summer, autumn, winter and annual were 474, 406, 487, 442 and 527, respectively. For each season, the number of stations with a Tavg measurement which passed the statistical test were much more than the amount of stations for TNN measurement. The rate of Tavg change in each region is displayed in Table 5.
As shown in Table 5 and Figure 7, Tavg change in mainland China also displayed significantly regional and seasonal characteristics. Overall, the seasonal and annual rates for Tavg changes in the high latitudes such as Northeast China, North China and Northwest China were significantly faster than in other regions. The rate of Tavg increase in South China was slower than in other regions. As shown in Figure 7 and Table 6, these results revealed that Tavg change in mainland China also had strong latitudinal zonality. For both seasonal and annual changes in Tavg, with the increase in latitude, the degree of Tavg change became higher, indicating the importance of latitude in Tavg changes. In Figure 7, in the range of 18°–25° N, the rates of Tavg increase in spring, summer, autumn, winter, and annual were 0.186 °C per decade−1, 0.153 °C per decade−1, 0.221 °C per decade−1, 0.262 °C per decade−1, and 0.177 per °C decade−1, respectively; in the range of 46°–53° N, the rates of change of Tavg in spring, summer, autumn, winter, and annual were 0.417 °C per decade−1, 0.338 °C per decade−1, 0.351 °C per decade−1, 0.507 °C per decade−1, and 0.370 °C per decade−1, which were respectively double or even higher than the range of 18°–25° N. It should be noted that the amplitude of Tavg change was much lower the above mentioned TNN, which is highly consistent with the previous studies [33,34,35,36].
Tavg change also showed obvious seasonality. According to Table 5, in all zones, Tavg increase was the slowest in summer. The fastest change in Tavg primarily happened in winter in Northeast, North, Northwest, Southwest, South China. However, for East and Central China, this occurred in spring. In Spring, the fastest change occurred in North China at a rate of 0.365 °C per decade−1, while the slowest occurred in South China at a rate of 0.160 °C per decade−1. In summer, the fastest increase in Tavg happened in Northeast China at a rate of 0.277℃ per decade−1, corresponding to the slowest one in Central China at a rate of 0.043 °C per decade−1. In autumn, the highest Tavg change was observed in Northwest China at a rate of 0.366 °C per decade−1, but the slowest Tavg change also occurred in Central China at a rate of 0.213 °C per decade−1. In winter, the fastest increase emerged in North China at a rate of 0.483℃ per decade−1, corresponding to the slowest counterpart in South China at a rate of 0.236 °C per decade−1. The annual fastest change in Tavg also occurred in Northwest China at a rate of 0.341 °C per decade−1, while the slowest occurred in South China at a rate of 0.165 °C per decade−1. Thus, it can be concluded that the fast change in Tavg often happened in the northern part of China (North or Northeast, Northwest China), which is also a further evidence of the previously reported latitudinal zonality in Tavg.
In the entirety of mainland China, except in spring, the amplitude in Tavg increase stably went up with the increase in altitude in summer, autumn, winter and annual. This trend was more typical than that of TNN. In Southwest China, the trend was more representative, which could be seen in both seasonal and annual changes. In Northwest China, unlike the altitudinal effect on TNN, the rate of Tavg change also increased in summer, autumn, winter and annual, as the altitude increased. Therefore, in the evaluation of the effect of urbanization on Tavg change, the consideration of the impact from altitude was necessitated.
In Table 7, it can be seen, the urban-related effect on Tavg increase was quite significant during the period 1960–2016, excluding Southwest China. Urbanization has a positive effect on Tavg increase, when using rural and suburban groups as the baselines. In the zones of Northeast China, South China, East China and Northwest China, was generally larger than , revealing that urbanization contributed more to Tavg increase with the increase in urbanization level. However, in North and Central China, was generally larger than , which implied that an augmenting effect did not always display an increasing trend with the increase in urbanization level. In Southwest China, both and for the annual change were less than zero. According to Figure 8, in Southwest China, the Tavg rate of increase significantly became stronger with the increase in altitude (above 95% level). The augmenting effect of urbanization had been offset by the relatively stronger altitudinal effect, which led to an insignificant urbanization effect on Tavg change. That is also was why Southwest China obtained the lowest change in Tavg in the period 1960–2016. Overall, urbanization has a significant effect on the trends for Tavg.
Considering the urban-related effect in different seasons, in North, East, South and Northwest China, the largest augmenting effect on Tavg increase was observed in spring, with values of 0.119 °C per decade−1, 0.101 °C per decade−1, 0.123 °C per decade−1, and 0.158 °C per decade−1 based on the baseline from the rural group; the resultant relative urbanization contributions to Tavg changes were 26.3%, 30.9%, 55.2% and 41.7%, respectively. In Northeast China, the largest urbanization effect on the trend for Tavg occurred in autumn, with a value of 0.050 °C per decade−1 based on rural stations, and the urbanization contribution to the trends for Tavg was 15.6%. In Central China, largest augmenting effect on Tavg occurred in summer, with a value of 0.086 °C per decade−1 based on the baseline of the suburban group, resulting in the relative contribution of 74.1%. In Southwest China, the largest augmenting effect happened in summer, with a value of 0.086 °C per decade−1 based on the baseline of suburban group, causing a relative contribution of 34.6% to the Tavg change. In the of whole mainland China, the highest urbanization effect on the trend for Tavg occurred in spring, with a value of 0.063 °C per decade−1 based on rural stations, and the urbanization contribution to the trends for Tavg was 17.7%. In an early report released by the Intergovernmental Panel on Climate Change (IPCC), it was pointed out that the urban-related effect is of inferior importance; it had an effect of less than 0.05 °C in the century on the global average [58]; our results indicated that the urban-related effect might make a greater contribution to temperature increase. The effect thus should be given more attention.
In general, like TNN, the urbanization effect on the trends for Tavg also has obviously regional and seasonal characteristics. However, overall, in seasonal characteristics, urbanization presented the strongest effects on the trends for Tavg in spring in China, but presented the strongest effects on the trends for TNN in winter.
3.3. Urban-Related Effect on TXX Changes
Compared with TNN and Tavg, trends for TXX were not so evident. For the t-test (95%) in the trends for TXX, there were merely 149, 198, 233, 130 and 185 meteorological stations with significant trends in spring, summer, autumn, winter and annual, respectively. After averaging the rates of the changes of TXX for corresponding meteorological stations in each region, the rate of the change of TXX in each region was summarized in Table 8.
As shown in Table 8 and Table 9 and Figure 9, latitudinal zonality for TXX change had no obvious trends as displayed by TNN and Tavg. According to Section 3.1 and Section 3.2, in the four seasons and annual, in Northeast, North and Northwest China, the rates of the changes of TNN and Tavg were significantly faster than in the other regions. However, in Northeast China, in spring, the change of TXX was slower than in the others, with value of 0.230 °C per decade−1. Even so, it can be seen from the Table 9 that in four seasons and annual trends, the slowest TXX change still occurred in latitudes of 18°–25° N, proving that TXX changes in low latitudes were slower than that in mid-high latitudes. The seasonality of the trends for TXX was also less pronounced than TNN and Tavg. The changes in TNN and Tavg were the lowest in summer in all regions, but the TXX changes in many regions were not the lowest in summer.
In the whole of China, the fastest change for TXX occurred in winter at a rate of 0.469 °C per decade−1. In spring, the fastest increase in TXX occurred in Northwest China at a rate of 0.452 °C per decade−1, corresponding to the slowest in South China at a rate of 0.250 °C per decade−1. In summer, the fastest increase in TXX was observed in Northeast China at a rate of 0.391 °C per decade−1, but the slowest change in TXX was reported in Central China at a rate of 0.133 °C per decade−1. In autumn, the highest change in TXX happened in Northwest China at a rate of 0.470 °C per decade−1, corresponding to the slowest in South China at a rate of 0.245 °C per decade−1. In winter, the fastest increase in TXX occurred in North China at a rate of 0.597 °C per decade−1, while the slowest increase in TXX occurred in South China at a rate of 0.224 °C per decade−1. For the annual trend, the fastest increasing TXX occurred in Northeast China at a rate of 0.371 °C per decade−1, while the slowest happened in Central China at a rate of 0.087 °C per decade−1. Overall, according to Section 3.1 and Section 3.2, the seasonality of the trends for TXX is less pronounced than TNN and Tavg.
According to Figure 10, in the whole of mainland China, especially in the Southwest China, TXX also roughly increased with the increase in altitude in spring, summer, winter and annual. In Northwest China, the TXX change became faster with altitude change in the summer and annual periods, but became lower in spring, autumn and winter. Generally speaking, in most regions, the altitudinal effect on TXX change was slightly significant, but not as representative as that on TNN and Tavg.
According to Table 10, unlike the augmenting effect of urbanization on TNN and Tavg, the effect on TXX was almost negative. Moreover, in North, Central and Northwest China, in some time scales, the urbanization effects on TXX were also negative, suggesting that urbanization has actually weakened TXX changes. However, in South and East China, both and were larger than zero, which was consistent with TNN and Tavg, indicating that augmenting effects in South and East China were more stable. However, urbanization still had significant effects on the trends for TXX in South and East China. In South China, the largest urbanization effect occurred in winter using the baseline of the rural group, with a rate at 0.272 °C per decade−1, with the relative contribution of 65.3%. In East China, largest urbanization effect occurred in winter using the baseline of the remote group, with a rate at 0.185 °C per decade−1, with the relative contribution of 37.3%.
In the entire mainland China, the largest augmenting effect on TNN and Tavg occurred in winter, with an absolute increase of 0.132 °C per decade−1 and 0.063 °C per decade−1 with a relative increase of 18.1% and 19.8%. For the entirety of mainland China, the largest augmenting effect occurred in winter, with a rate at 0.131 °C per decade−1, with a relative contribution of 31.5%. The augmenting effect on TXX was much stronger than those of TNN and Tavg. Thus, without the augmenting effect caused by urbanization, the temperature change should be much lower than the current condition. Urbanization played an important role in TXX temperature increase.
Some studies have investigated the relationship between temperature change and atmospheric circulation patterns. Zhang and Fang [59] used data series from 1951–1985 to obtain spatially-specific differentiation characteristics of Tavg variations. They revealed that regional temperature changes are consistent with global observations with increased warming at high latitudes and less warming at lower latitudes. This statement is consistent with our results. Moreover, they also indicated spatial differences of temperature variations in the eastern, central, and western Chinese regions, which may be related to regional differences in monsoon circulation variation and the influence of large terrain features on the atmospheric circulation. Based on 303 TXX and TNN series in China for the period 1961–2003, You et al. [60] reported that, like what is shown in our results, stations in Northeast China, North China and Northwest China indicated the largest magnitudes in temperature change. They concluded that a strengthening anticyclonic circulation, increasing geopotential height and rapid warming over the Eurasian continent have contributed to the changes in temperature extremes in China. More specifically, Peng et al. [61] indicated that the variation of TXX over East China was mainly influenced by anthropogenic activities (e.g., land cover change), while TNN was more affected by atmospheric circulations (e.g., the Eurasian zonal circulation index and the cold air activity index). For Tavg, it was a result of the comprehensive effects of both atmospheric circulations and anthropogenic activities. All in all, the relationship between temperature changes and atmospheric circulation is very complicated; different regions may be affected by different atmospheric circulations. More studies are needed in the future to discover more specific conclusions.
4. Discussion
4.1. Uncertain Analysis
The investigation of the effects of urbanization on climate change is unlike other studies in the environment, where it is enough to investigate climate change for its own sake. In urban regions, the aims of the investigation are to understand the role of urbanization in climate change, which is something like the evaluation of possible fluctuations in climatic variables as a city expands over time, compared to what would have occurred had the built-up areas not been constructed. In fact, this is an investigation which is not essentially conclusive as the built-up areas had already been constructed, and even though they had not, the cities may have developed into a different stage than the pre-existing one anyway (i.e., because of other anthropogenic activities such as land reclamation or forest removal). Thus, the measurement of urban impacts on temperature is replete with technological barriers and no truth is available, only delicate estimations. The difficulty is in the development of a universally acceptable method to measure the urban effect. The study, in itself, is just an approximation of the facts about urban impacts. It should be used under consideration to avoid any misleading interpretation.
In addition, since the economic reform in 1978, China’s urbanization has developed rapidly, and few meteorological stations such as the Wutaishan station have been experienced multiple migrations [27]. Although we rectified the issue, it could not be fully eliminated, which could cause bias in the analysis of temperature changes. However, the migrations of some stations are only known by the local meteorological bureau, which requires further investigation about the situation of the relocation. Furthermore, there may be a relative offset in the spatial coordinates of the meteorological stations, which may have an impact on the selection of the group for each meteorological station, thus affecting the subsequent analysis of the contribution of the heat island warming. However, the above factors were related to the original data provided by the China Meteorological Data Network, in which it was difficult to correct the bias from the relocation and spatial offset. Therefore, in future analysis, it is necessary to consider how to eliminate the impact from these two factors.
The urban-related warming trend also heavily depended on the study periods. Different periods of analysis could derive very different trends (e.g., the period 1954–1983 for Jones’s study [22] versus the period of 1960 to 2016 used in this study and the period of 1961 to 2000 used by Ren et al. [27]). Moreover, the urban-related warming trend also heavily depended on study areas. This study has indicated that different regions of China represented different changing trends. In some regions there were not even any significant trends. The differences in both periods and study areas are all important. However, since the urbanization in China primarily happened in the most recent 40 years, the urban effects on temperature increase are more significant in this period. Thus, studies based on such a period could obtain more significant trends. Studies based on other periods (e.g., the period 1954–1983 for Jones’s study [22]) achieved less significant trends. For example, in Ren’s study [27], if we divide the analysis into two sub periods, namely, 1961–1980 and 1981–2000, both sub-periods will derive warming trends of 0.06 and 0.14 °C per decade−1, respectively, indicating that the warming trend in the second sub period is much higher than in the first sub period. Despite the varied degrees in urban-related warming assessments, all the studies have confirmed the positive effects of urbanization on temperature increase in urban regions.
We also compared our regression analysis results with the results obtained from a Mann–Kendall trend test at a 95% confidence level for both seasonal and annual temperature series used in this study. The comparison revealed that the stations with statistically significant increasing/decreasing trends obtained by regression analysis are almost the same as the stations obtained from the Mann–Kendall trend test (Figure 11). It can also be seen from the figure that the Z-values for most of the TNN and Tavg series are greater than 1.64, corresponding to their P-values (less than 0.05), indicating the trends for such stations are statistically significant. However, for TXX, the number of stations with statistically significant temperature changes is relatively small, but the results from both the trend analyses are quite similar. Thus, despite the numerous changes in the location of the stations and the related inhomogeneity of the temperature series, as well as naturally occurring outliers, the trend analysis results from statistical approaches remained reliable for such a long-term data series as the Chinese temperature dataset for the period 1960–2016.
In addition, the stations without significant trends should also be well investigated. According to the aforementioned results, seasonal and annual trends for TNN and Tavg series at most stations were statistically significant, while trends for TXX series at most stations were insignificant. Although the stations without significant trends are located in different regions, they did display two obvious aggregations (Figure 12): one was the spring and winter series for Tavg in South China. Another one was the summer series for TNN and Tavg in Central China. According to the study of Hu et al. [62], Central China showed a wetting trend in summer, and South China showed a wetting trend in spring. Because the specific heat capacity of water is larger than that of the land surface, the above two wetting trends would probably mitigate the warming trend in summer in Central China and in spring in South China.
Another point that should be highlighted is that most Chinese meteorological stations are located in the suburban areas [29], and only a few stations are located in urban or rural areas. This fact suggests that, if our meteorological stations are grouped into urban, suburban and rural categories, the number of urban stations and rural stations will be relatively small, while the number of suburban stations will be relatively large. As can be seen from Table 11, the three groups reflect the aforementioned fact: approximately 65% of the stations are located in suburbs. Meanwhile, it can also be seen that the TXX series includes many stations with insignificant trends, indicating that the temperature change in TXX was not quite typical over the period 1960–2016.
4.2. Compared with Previous Studies
Chrysanthou et al. [32] highlighted that annual-averaged temperature increased at a rate of 0.179 °C per decade−1 in pan-Europe since 1950, and the urbanization contributed 0.0026 °C per decade−1 to the change of annual-averaged temperature. In this study, both change of annual increase in Tavg (0.27 °C per decade−1) and the urban-related effect on annual Tavg change (0.031 °C per decade−1) in China were higher than the corresponding changes in Chrysanthou’s study. Regarding the seasonal temperature changes, the largest averaged temperature change occurred in summer in pan-Europe, according to Chrysanthou’s study, while in this study the lowest Tavg change occurred in summer in China, which presented the different pattern of temperature change between Europe and China. As for the situations of temperature change in North America, Stone Jr. B. [31] concluded that urbanization contributed 0.05 °C per decade−1 to the increase of mean temperature in the US, which was consistent with our results with regard to the urbanization contribution to the trend for Tavg between 0.031 °C and 0.063 °C per decade−1 in China.
Alexander et al. [34] reported that TNN has significantly increased in 45% of the 2223 meteorological stations over the world during the period 1951–2003. In this study, TNN has significantly increased in 65% of the 565 meteorological stations in China during the period 1960–2016, which was relatively higher than Alexander’s results as the fast urbanization has caused a rapid augment in urbanized area and population, leading to increasing taller and denser buildings and more emissions and resource consumption, as well as the resultant higher contribution to urban warming. Take the Pearl River Delta for example, since 1978, this region has been reported as a rising star because of its dramatic economic development and resultant fast urbanization under the country’s economic reform and opening policies (Table 11). In Table 12, it can be seen that most of the cities, especially the big cities (i.e., Guangzhou, Shenzhen, Zhuhai and Dongguan), have experienced extremely rapid urbanization. The total urbanized area in the Pearl River Delta has increased from 114,708.7 ha in 1989 to 691,014.9 ha in 2017.
Chen et al. [64] stated that China’s urbanization has experienced three periods, namely the fast shrinking stage (1960–1978), the stable soaring period (1978–1995) and the rapid augment stage (1996–2017). In fact, in the most recent 20 years, urban development in China has progressed more rapidly than its economic development. Thus, if there are any urban-related effects on temperature change, the effects can be observed in the third stage. Previous studies have reported that the warming trend (0.57 °C per decade−1) in the period 1981–2004 was much more significant than the overall period 1951–2004 (0.25 °C per decade−1) or the first half period 1951–1983 (0.15 °C per decade−1) (Table 12). These studies revealed that, in Eastern China, in one of the representative heavily urbanized regions, temperature increase is more significant. Even though we considered the overall situation in China, our study still found that during the period 1996–2016, the mean surface temperature increased much more rapidly (0.359 °C per decade−1) than in the overall period 1960–2016 (0.27 °C per decade−1). Although the urban-related effect on annual temperature increase was not so evident, its effect on seasonal mean surface temperature increase, especially for the seasons of spring, summer and autumn, is relatively noticeable: urbanization contributed 0.14 °C per decade−1, 0.08 °C per decade−1 and 0.016 °C per decade−1 to the increase in mean surface temperature in spring, summer and autumn, respectively (Table 13).
Compared with the study of Ren [35], in the four seasons and annually, the rate of TNN change in this study were slightly higher; furthermore, the rate of TXX change was almost double that of the former study result. The rate of Tavg change was almost similar. The major difference is probably because the studies were based on different periods and slightly different datasets. The meteorological dataset in this study came from the Monthly Value Dataset of the China Ground Climate Materials from the China Meteorological Network, which has only 613 meteorological stations. In the study of Ren, the meteorological dataset was from the National Meteorological Information Center, with 730 meteorological stations. Ren’s study was based on the records from 1961 to 2008, differently from our records from 1960 to 2016. As aforementioned, in the most recent two decades, urbanization in China has developed more rapidly than in other periods. Thus, urban-related effects on temperature increase in our study should be more significant than Ren’s study. For instance, for Tavg, the definition between the two studies was the same, but the data sources were slightly different, which was the probable reason for the difference between the two studies. However, the slowest trends for TNN and Tavg occurred in summer in both studies; this is highly consistent. On the scale of the whole of mainland China, the urban-related effect on the changes of TNN, Tavg, TXX in this study were slightly slower than that merely in North China reported Ren [27]. This is straightforward, because the urban development in northern China was significantly above the national average, and the resultant urban-related effect was also more illustrative in North China. Both studies indicated that urbanization has a significant effect on temperature change, but overall the largest urbanization effect uncertainly occurs in the region with the highest urbanization. According to Section 3.1 Section 3.2 and Section 3.3, altitude change also has an effect on temperature change, which could be a probable reason for the above phenomenon.
4.3. Implications for Sustainable Urban Development in China
Rapid urbanization in the world has led to nearly 54.5% of the world’s population residing in urbanized regions and this is predicted to grow by 2.5 billion by 2050 [67]. China’s urbanization will develop even faster as China has the larger population and higher building density [68]. This study revealed that fast urbanization and the resultant temperature increase has adverse effects on the dwellers in the cities and urban sustainability. In the case of mainland China, the biggest urban-related effects are located in North, South, Northwest and Northeast China. The relationship between the urban-related effect and social–ecological elements (i.e., land cover change, vegetation variation, impervious surface development, population density) should be carefully investigated. The corresponding countermeasures should first be implemented in such regions. In this study, the land cover map of 2017 indicated that vegetation cover in North and Northwest China is relatively low. In addition, the dominant vegetation in such regions are crops or deciduous forests (Figure 3), which are harvested in autumn, with a resultant extremely low cooling effect in winter and spring. Therefore, increasing vegetation cover, especially evergreen forests, in the cities could be an applicable measure to mitigate the urban-related effects in North and Northwest China. In this study, the land cover map of 2017 also indicated that vegetation cover in the cities in South China is already very high (Figure 3). Our study revealed the highest urban-related effect on temperature increase in South China primarily happened in summer. The largest possible contributor to urban-related effect in South China is rapid population growth and the resultant high building density and anthropogenic heat. Thus, it is crucial for the government to provide more urban green spaces like urban city green parks in the future urban planning to mitigate urban-related effects in these regions.
5. Conclusions
This study applied the 10-m high-resolution land cover map to identify the types of meteorological stations for the first time, providing a new idea for more accurate identification of the types of meteorological stations. This study investigated the trends of extreme-temperature change in China for the period 1960–2016 and the urban-related effects on seasonal- and annual-extreme-temperature variations. The results indicated that, in the period 1960–2016, TNN, Tavg and TXX experienced significant increasing trends, and trends for TNN were faster than Tavg and TXX. Annually, the rates of changes of TNN, Tavg and TXX were 0.618 °C per decade−1, 0.272 °C per decade−1 and 0.352 °C per decade−1. The changes in TNN and Tavg displayed obvious seasonality and regionality: the slowest rates of change of TNN and Tavg occurred in summer, while the relatively faster rates of the change of TNN and Tavg occurred in winter. Regionality was reflected in that the changes in TNN and Tavg in North China was more significant than in South China. As latitude increased, the changes in TNN and Tavg also increased. The study also revealed that altitude had a significant impact on temperature change, especially in Southwest China. In 1960–2016, urban-related effects on the changes in TNN, Tavg and TXX in China were validated, but the effect on TNN was more pronounced. In the annual trend, in the whole of China, urbanization effects on TNN variations based on rural stations and suburban stations were 0.098 °C per decade−1 and 0.121 °C per decade−1, respectively, and the urbanization contributions were 13.7% and 17.0%, respectively; urbanization effects on Tavg changes based on rural stations and suburban stations were 0.031 °C per decade−1 and 0.063 °C per decade−1 respectively, and the urbanization contributions are 9.8% and 19.8% respectively; urbanization effects on TXX changes based on rural stations and suburban stations were −0.01 °C per decade−1 and 0.032 °C per decade−1, respectively, and the urbanization contributions were −2.1% and 9.5% respectively. Urbanization has a regional effect on the changes in TNN, Tavg and TXX. In the Southwest China, the urbanization effect was not significant at altitudes more than 3000 m. Conversely, urbanization effect was more stably significant at low altitudes, especially in North, South, Northwest and Northeast China. In North, Northwest and Northeast China, the urban-related effect on temperature increase was mainly observed in spring and winter, but in South China, the urban-related effect was more evident in summer. This study is valuable for sustainable urban development in China.
Author Contributions
Conceptualization and methodology, J.Q. and X.Y.; data analysis, J.Q., B.C., Z.C. and Y.L.; writing—original draft preparation, J.Q.; writing—review and editing, J.Q. and X.Y. All authors have read and agreed to the published version of the manuscript.
Funding
This research was funded by the National Natural Science Foundation of China, grant number 41871017, and research support from Guangzhou University, grant number 69-18ZX1000201.
Acknowledgments
The authors would like to acknowledge the financial support from the Research Plan for Joint-Training Graduate of Guangzhou University.
Conflicts of Interest
The authors declare no conflicts of interest.
References
- Root, T.L.; Price, J.T.; Hall, K.R.; Schneider, S.H.; Rosenzweig, C.; Pounds, J.A. Fingerprints of global warming on wild animals and plants. Nature 2003, 421, 57–60. [Google Scholar] [CrossRef]
- Trenberth, K.E.; Dai, A.; Van Der Schrier, G.; Jones, P.D.; Barichivich, J.; Briffa, K.R.; Sheffield, J. Global warming and changes in drought. Nat. Clim. Chang. 2014, 4, 17–22. [Google Scholar] [CrossRef]
- Meehl, G.A.; Washington, W.M.; Collins, W.D.; Arblaster, J.M.; Hu, A.; Buja, L.E.; Strand, W.G.; Teng, H. How much more global warming and sea level rise? Science 2005, 307, 1769–1772. [Google Scholar] [CrossRef] [PubMed] [Green Version]
- Schiermeier, Q. Increased flood risk linked to global warming. Nature 2011, 470, 316–317. [Google Scholar] [CrossRef] [PubMed] [Green Version]
- Free, M.; Robock, A. Global warming in the context of the Little Ice Age. J. Geophys. Res. Atmos. 1999, 104, 19057–19070. [Google Scholar] [CrossRef]
- Yang, X.K.; Lu, X.X.; Park, E.; Tarolli, P. Impacts of Climate Change on Lake Fluctuations in the Hindu Kush-Himalaya-Tibetan Plateau. Remote Sens. 2019, 11, 1082. [Google Scholar] [CrossRef] [Green Version]
- Foukal, P.; North, G.; Wigley, T. A Stellar View on Solar Variations and Climate. Science 2004, 306, 68–69. [Google Scholar] [CrossRef]
- Lashof, D.A.; Ahuja, D.R. Relative contributions of greenhouse gas emissions to global warming. Nature 1990, 344, 529–531. [Google Scholar] [CrossRef]
- Kalnay, E.; Cai, M. Impact of urbanization and land-use change on climate. Nature 2003, 423, 528–531. [Google Scholar] [CrossRef]
- Chen, Y.C.; Chiu, H.W.; Su, Y.F.; Wu, Y.C.; Cheng, K.S. Does urbanization increase diurnal land surface temperature variation? Evidence and implications. Landsc. Urban Plan. 2017, 157, 247–258. [Google Scholar] [CrossRef]
- Zhai, P.; Pörtner, H.O.; Roberts, D.; Skea, J.; Shukla, P.R.; Pirani, A.; Moufouma-Okia, W.; Péan, C.; Pidcock, R.; Connors, S.; et al. Global Warming of 1.5 OC: An IPCC Special Report on the Impacts of Global Warming of 1.5 °C above Pre-Industrial Levels and Related Global Greenhouse Gas Emission Pathways, in the Context of Strengthening the Global Response to the Threat of Climate Change, Sustainable Development, and Efforts to Eradicate Poverty; Masson, D., Ed.; World Meteorological Organization: Geneva, Switzerland, 2018. [Google Scholar]
- Jones, P.D.; Lister, D.H.; Li, Q. Urbanization effects in large-scale temperature records, with an emphasis on China. J. Geophys. Res. Atmos. 2008, 113, D16122. [Google Scholar] [CrossRef]
- Peterson, T.C. Assessment of Urban Versus Rural In Situ Surface Temperatures in the Contiguous United States: No Difference Found. J. Clim. 2003, 16, 2941–2959. [Google Scholar] [CrossRef] [Green Version]
- Parker, D.E. Large-scale warming is not urban. Nature 2004, 432, 290. [Google Scholar] [CrossRef]
- Parker, D.E. A demonstration that large-scale warming is not urban. J. Clim. 2006, 19, 2882–2895. [Google Scholar] [CrossRef]
- Oke, T.R. Initial Guidance to Obtain Representative Meteorological Observations at Urban Sites, Instruments and Methods of Observation Program; IOM Report No. 81, WMO/TD 1250; World Meteorological Organization: Geneva, Switzerland, 2004. [Google Scholar]
- Williamson, J.G. Migration and urbanization. In Handbook of Development Economics; Elsevier: Amsterdam, The Netherlands, 1988; Volume 1, pp. 425–465. [Google Scholar]
- Liu, J.; Liu, M.; Zhuang, D.; Zhang, Z.; Deng, X. Study on spatial pattern of land-use change in China during 1995–2000. Sci. China Ser. D Earth Sci. 2003, 46, 373–384. [Google Scholar]
- Seto, K.C.; Woodcock, C.; Song, C.; Huang, X.; Lu, J.; Kaufmann, R. Monitoring land-use change in the Pearl River Delta using Landsat TM. Int. J. Remote Sens. 2002, 23, 1985–2004. [Google Scholar] [CrossRef]
- Luo, X.; Yu, C.W.; Zhou, D.; Gu, Z. Challenges and adaptation to urban climate change in China: A viewpoint of urban climate and urban planning. Indoor Built Environ. 2019, 28, 1157–1161. [Google Scholar] [CrossRef]
- Xuemei, B.; Peijun, S.; Yansui, L. Realizing China’s urban dream. Nature 2014, 509, 158–160. [Google Scholar]
- Jones, P.D.; Groisman, P.Y.; Coughlan, M.; Plummer, N.; Wang, W.-C.; Karl, T.R. Assessment of urbanization effects in time series of surface air temperature over land. Nature 1990, 347, 169–172. [Google Scholar] [CrossRef]
- Portman, D.A. Identifying and correcting urban biases in regional time series: Surface temperature in China’s Northern Plains. J. Clim. 1993, 6, 2298–2308. [Google Scholar] [CrossRef] [Green Version]
- Li, Q.; Zhang, H.; Liu, X.; Huang, J. Urban heat island effect on annual mean temperature during the last 50 years in China. Theor. Appl. Climatol. 2004, 79, 165–174. [Google Scholar] [CrossRef]
- He, J.F.; Liu, J.Y.; Zhuang, D.F.; Zhang, W.; Liu, M.L. Assessing the effect of land use/land cover change on the change of urban heat island intensity. Theor. Appl. Climatol. 2007, 90, 217–226. [Google Scholar] [CrossRef]
- Ren, G.Y.; Chu, Z.Y.; Chen, Z.H.; Ren, Y.Y. Implications of temporal change in urban heat island intensity observed at Beijing and Wuhan stations. Geophys. Res. Lett. 2007, 34, L05711. [Google Scholar] [CrossRef]
- Ren, G.; Zhou, Y.; Chu, Z.; Zhou, J.; Zhang, A.; Guo, J.; Liu, X. Urbanization effects on observed surface air temperature trends in North China. J. Clim. 2008, 21, 1333–1348. [Google Scholar] [CrossRef] [Green Version]
- Li, M.; Dickinson, R.E.; Tian, Y.; Fang, J.; Li, Q.; Kaufmann, R.K.; Tucker, C.J.; Myneni, R.B. Evidence for a significant urbanization effect on climate in China. Proc. Natl. Acad. Sci. USA 2004, 101, 9540–9544. [Google Scholar]
- Ren, G.Y.; Chu, Z.Y.; Zhou, Y.Q.; Xu, M.Z.; Wang, Y.; Tang, G.L.; Zhai, P.M.; Zhao, X.M.; Zhang, A.Y.; Chen, Z.H. Recent Progresses in Studies of Regional Temperature Changes in China. Clim. Environ. Res. 2005, 10, 701–716. (In Chinese) [Google Scholar]
- Zhang, A.Y.; Ren, G.Y.; Zhou, J.X.; Ren, Y.Y.; Tang, G.L. On the urbanization effect on surface air temperature trends over China. Acta Meteor. Sin. 2010, 68, 957–966. (In Chinese) [Google Scholar]
- Stone, B., Jr. Urban and rural temperature trends in proximity to large US cities: 1951–2000. Int. J. Climatol. 2007, 27, 1801–1807. [Google Scholar] [CrossRef]
- Chrysanthou, A.; Van der Schrie, G.; Van den Besselaa, E.J.M.; Klein Tank, A.M.G.; Brandsma, T. The effects of urbanization on the rise of the European temperature since 1960. Geophys. Res. Lett. 2014, 41, 7716–7722. [Google Scholar] [CrossRef]
- Katz, R.W.; Brown, B.G. Extreme events in a changing climate: Variability is more important than averages. Clim. Chang. 1992, 21, 289–302. [Google Scholar] [CrossRef]
- Alexander, L.V.; Zhang, X.; Peterson, T.C.; Caesar, J.; Gleason, B.; Klein Tank, A.; Haylock, M.; Collins, D.; Trewin, B.; Rahimzadeh, F. Global observed changes in daily climate extremes of temperature and precipitation. J. Geophys. Res. Atmos. 2006, 111, D05109. [Google Scholar] [CrossRef] [Green Version]
- Ren, G.; Zhou, Y. Urbanization effect on trends of extreme temperature indices of national stations over Mainland China, 1961–2008. J. Clim. 2014, 27, 2340–2360. [Google Scholar] [CrossRef]
- Qiu, J.L.; Yang, X.K.; Tarolli, P. Influence of urbanization to regional temperature of Pearl River Delta. J. GZHU (Nat. Sci. Ed.) 2018, 17, 74–82. (In Chinese) [Google Scholar]
- Stott, P. How climate change affects extreme weather events. Science 2016, 352, 1517–1518. [Google Scholar] [CrossRef] [PubMed]
- The World Bank. Available online: https://data.worldbank.org (accessed on 10 August 2020).
- Fu, B.J.; Chen, L.D.; Liu, G.H. The objectives, tasks and characteristics of China ecological regionalization. Acta Ecol. Sin. 1999, 19, 591–595. [Google Scholar]
- Zheng, D.; Ge, Q.S.; Zhang, X.Q.; He, F.N.; Wu, S.H.; Yang, Q.Y. Regionalization in China: Retrospect and prospect. Geogr. Res. 1983, 50, 1–10. (In Chinese) [Google Scholar]
- Zhao, S.Q. A new scheme for comprehensive physical regionalization in China. Acta Geogr. Sin. 1983, 50, 1–10. (In Chinese) [Google Scholar]
- Ren, Z.H.; Xiong, A.Y.; Zou, F.L. The quality control of surface monthly climate data in China. J. Appl. Meteorol. Sci. 2007, 18, 516–523. (In Chinese) [Google Scholar]
- Easterling, D.R.; Peterson, T.C. A new method for detecting and adjusting for undocumented discontinuities in climatological time series. Int. J. Climatol. 1995, 15, 369–377. [Google Scholar] [CrossRef]
- Peterson, T.C.; Easterling, D.R.; Karl, T.R.; Groisman, P.; Nicholls, N.; Plummer, N.; Torok, S.; Auer, I.; Boehm, R.; Gullett, D.; et al. Homogeneity adjustments of in situ atmospheric climate data: A review. Int. J. Climatol. 1998, 18, 1493–1517. [Google Scholar] [CrossRef]
- Jones, P.D.; Moberg, A. Hemispheric and large-scale surface air temperature variations: An extensive revision and an update to 2001. J. Clim. 2003, 16, 206–223. [Google Scholar] [CrossRef] [Green Version]
- Feng, S.; Hu, Q.; Qian, W. Quality control of daily meteorological data in China, 1951–2000: A new dataset. Int. J. Climatol. 2004, 24, 853–870. [Google Scholar] [CrossRef]
- Li, Q.; Xiao, L.; Zhang, H.; Peterson, T.C.; Easterling, D.R. Detecting and adjusting on temporal inhomogeneity in Chinese mean surface air temperature data set. Adv. Atmos. Sci. 2009, 21, 260–268. [Google Scholar] [CrossRef]
- Gong, P.; Liu, H.; Zhang, M.; Li, C.; Wang, J.; Huang, H.; Clinton, N.; Ji, L.; Li, W.; Bai, Y. Stable classification with limited sample: Transferring a 30-m resolution sample set collected in 2015 to mapping 10-m resolution global land cover in 2017. Sci. Bull. 2019, 64, 370–373. [Google Scholar] [CrossRef] [Green Version]
- Hua, L.; Ma, Z.; Guo, W. The impact of urbanization on air temperature across China. Theor. Appl. Climatol. 2008, 93, 179–194. [Google Scholar] [CrossRef]
- Tayanç, M.; Karaca, M.; Yenigün, O. Annual and seasonal air temperature trend patterns of climate change and urbanization effects in relation to air pollutants in Turkey. J. Geophys. Res. Atmos. 1997, 102, 1909–1919. [Google Scholar] [CrossRef]
- Ren, Y.; Ren, G. A remote-sensing method of selecting reference stations for evaluating urbanization effect on surface air temperature trends. J. Clim. 2011, 24, 3179–3189. [Google Scholar] [CrossRef] [Green Version]
- Tysa, S.K.; Ren, G.; Qin, Y.; Zhang, P.; Ren, Y.; Jia, W.; Wen, K. Urbanization effect in regional temperature series based on a remote-sensing classification scheme of stations. J. Geophys. Res. Atmos. 2019, 124, 10646–10661. [Google Scholar] [CrossRef]
- Zhang, Y.W.; He, Q.J.; Zhao, X.L.; Wu, Y.Q. Remote Sensing Monitoring and Analysis of Land Surface Temperature at Pearl River Delta in July 2005. Meteorological 2006, 32, 23–27. [Google Scholar]
- Owen, T. Using DMSP-OLS light frequency data to categorize urban environments associated with US climate observing stations. Int. J. Remote Sens. 1998, 19, 3451–3456. [Google Scholar] [CrossRef]
- Peterson, T.C.; Gallo, K.P.; Lawrimore, J.; Owen, T.W.; Huang, A.; McKittrick, D.A. Global rural temperature trends. Geophys. Res. Lett. 1999, 26, 329–332. [Google Scholar] [CrossRef] [Green Version]
- Wong, E.; Hogan, K.; Rosenberg, J.; Denny, A. Reducing Urban Heat Islands: Compendium of Strategies Urban Heat Island Basics; Climate Protection Partnership Division in the US Environmental Protection Agency’s Office of Atmospheric Programs; Environmental Protection Agency: Washington, DC, USA, 2016.
- Oke, T.R. The energetic basis of the urban heat island. Q. J. R. Meteorol. Soc. 1982, 108, 1–24. [Google Scholar] [CrossRef]
- Houghton, J.T.; Ding, Y.; Griggs, D.J.; Noguer, M.; Winden, P.J.; Dai, X. Climate Change 2001: The Scientific Basis. Contribution of Working Group 1 to the Third Assessment report of the Intergovernmental Panel on Climate Change. Int. J. Epidemiol. 2003, 32, 321–323. [Google Scholar]
- Zhang, L.S.; Fang, X.Q. Regional differentiation of the temperature fluctuation process in China. J. Beijing Norm. Univ. (Nat. Sci.) 1988, 3, 78–85. (In Chinese) [Google Scholar]
- You, Q.; Kang, S.; Aguilar, E.; Pepin, N.; Flügel, W.A.; Yan, Y.; Xu, Y.; Zhang, Y.; Huang, J. Changes in daily climate extremes in China and their connection to the large scale atmospheric circulation during 1961–2003. Clim. Dyn. 2011, 36, 2399–2417. [Google Scholar] [CrossRef]
- Peng, X.; She, Q.; Long, L.; Liu, M.; Xu, Q.; Zhang, J.; Xiang, W. Long-term trend in ground-based air temperature and its responses to atmospheric circulation and anthropogenic activity in the Yangtze River Delta, China. Atmos. Res. 2017, 195, 20–30. [Google Scholar] [CrossRef]
- Hu, Z.Z.; Yang, S.; Wu, R. Long term climate variations in China and global warming signals. J. Geophys. Res. 2003, 108, 4614. [Google Scholar] [CrossRef]
- Weng, Q. A remote sensing?GIS evaluation of urban expansion and its impact on surface temperature in the Zhujiang Delta, China. Int. J. Remote Sens. 2010, 22, 1999–2014. [Google Scholar]
- Chen, M.; Liu, W.; Tao, X. Evolution and assessment on China’s urbanization 1960–2010: Under-urbanization or over-urbanization? Habitat Int. 2013, 38, 25–33. [Google Scholar] [CrossRef]
- Rayner, N.A.; Brohan, P.; Parker, D.E.; Folland, C.K.; Kennedy, J.J.; Vanicek, M.; Ansell, T.J.; Tett, S.F.B. Improved Analyses of Changes and Uncertainties in Sea Surface Temperature Measured In Situ since the Mid-Nineteenth Century: The HadSST2 Dataset. J. Clim. 2006, 19, 446–469. [Google Scholar] [CrossRef] [Green Version]
- Li, Q.; Li, W. Development of the gridded historic temperature dataset over China during recent half century. Acta Metall. Sin. 2007, 65, 293–299. (In Chinese) [Google Scholar] [CrossRef]
- United Nations. World Urbanization Prospects: The 2014 Revision, Methodology. 2014. Available online: https://population.un.org/wup/Publications/Files/WUP2014-Methodology.pdf (accessed on 10 August 2020).
- Zhang, X.; Estoque, R.C.; Murayama, Y. An urban heat island study in Nanchang City, China based on land surface temperature and social-ecological variables. Sustain. Cities Soc. 2017, 32, 557–568. [Google Scholar] [CrossRef]
Figure 1.
Geographically distribution of meteorological stations and their corresponding classification based on urbanization level in China.
Figure 1.
Geographically distribution of meteorological stations and their corresponding classification based on urbanization level in China.

Figure 2.
Important indices for urbanization in China, 1960–2016: (a) total population; (b) Urban population; (c) CO2 emissions per capita; (d) GDP per capita. (Data source: [38]).
Figure 2.
Important indices for urbanization in China, 1960–2016: (a) total population; (b) Urban population; (c) CO2 emissions per capita; (d) GDP per capita. (Data source: [38]).

Figure 3.
10-m resolution land cover map in China.

Figure 4.
Trends for TNN in China, 1960–2016.

Figure 5.
Altitudinal effect on TNN change in Northeast China (NE), North China (NC), East China (EC), South China (SC), Central China (CC), Northwest China (NE), Southwest China (SW) and China (CHN), 1960–2016, respectively, in (a) spring, (b) summer, (c) autumn, (d) winter and (e) annual.
Figure 5.
Altitudinal effect on TNN change in Northeast China (NE), North China (NC), East China (EC), South China (SC), Central China (CC), Northwest China (NE), Southwest China (SW) and China (CHN), 1960–2016, respectively, in (a) spring, (b) summer, (c) autumn, (d) winter and (e) annual.

Figure 6.
Trends for TNN in (a) rural group, (b) suburban group and (c) urban group, South China, 1960–2016, (d) GDP in South China, 1960–2016.
Figure 6.
Trends for TNN in (a) rural group, (b) suburban group and (c) urban group, South China, 1960–2016, (d) GDP in South China, 1960–2016.

Figure 7.
Trends for Tavg in China, 1960–2016.

Figure 8.
Altitudinal effect on trends for Tavg in Northeast China (NE), North China (NC), East China (EC), South China (SC), Central China (CC), Northwest China (NE), Southwest China (SW) and China (CHN), 1960–2016, respectively, in (a) spring, (b) summer, (c) autumn, (d) winter and (e) annual.
Figure 8.
Altitudinal effect on trends for Tavg in Northeast China (NE), North China (NC), East China (EC), South China (SC), Central China (CC), Northwest China (NE), Southwest China (SW) and China (CHN), 1960–2016, respectively, in (a) spring, (b) summer, (c) autumn, (d) winter and (e) annual.

Figure 9.
Trends for TXX in China, 1960–2016.

Figure 10.
Altitudinal effect on TXX change in Northeast China (NE), North China (NC), East China (EC), South China (SC), Central China (CC), Northwest China (NE), Southwest China (SW) and China (CHN), 1960–2016, respectively, in (a) spring, (b) summer, (c) autumn, (d) winter and (e) annual.
Figure 10.
Altitudinal effect on TXX change in Northeast China (NE), North China (NC), East China (EC), South China (SC), Central China (CC), Northwest China (NE), Southwest China (SW) and China (CHN), 1960–2016, respectively, in (a) spring, (b) summer, (c) autumn, (d) winter and (e) annual.

Figure 11.
Comparison of trend analysis results based on regression analysis and a Mann–Kendall test for (a) TNN, (b) Tavg and (c) TXX data series; the data series include both seasonal and annual datasets used in this study.
Figure 11.
Comparison of trend analysis results based on regression analysis and a Mann–Kendall test for (a) TNN, (b) Tavg and (c) TXX data series; the data series include both seasonal and annual datasets used in this study.

Figure 12.
The two evident aggregations displayed by the stations without significant trends: One was the spring and winter series for Tavg in South China. Another one the was summer series for TNN and Tavg in Central China.
Figure 12.
The two evident aggregations displayed by the stations without significant trends: One was the spring and winter series for Tavg in South China. Another one the was summer series for TNN and Tavg in Central China.


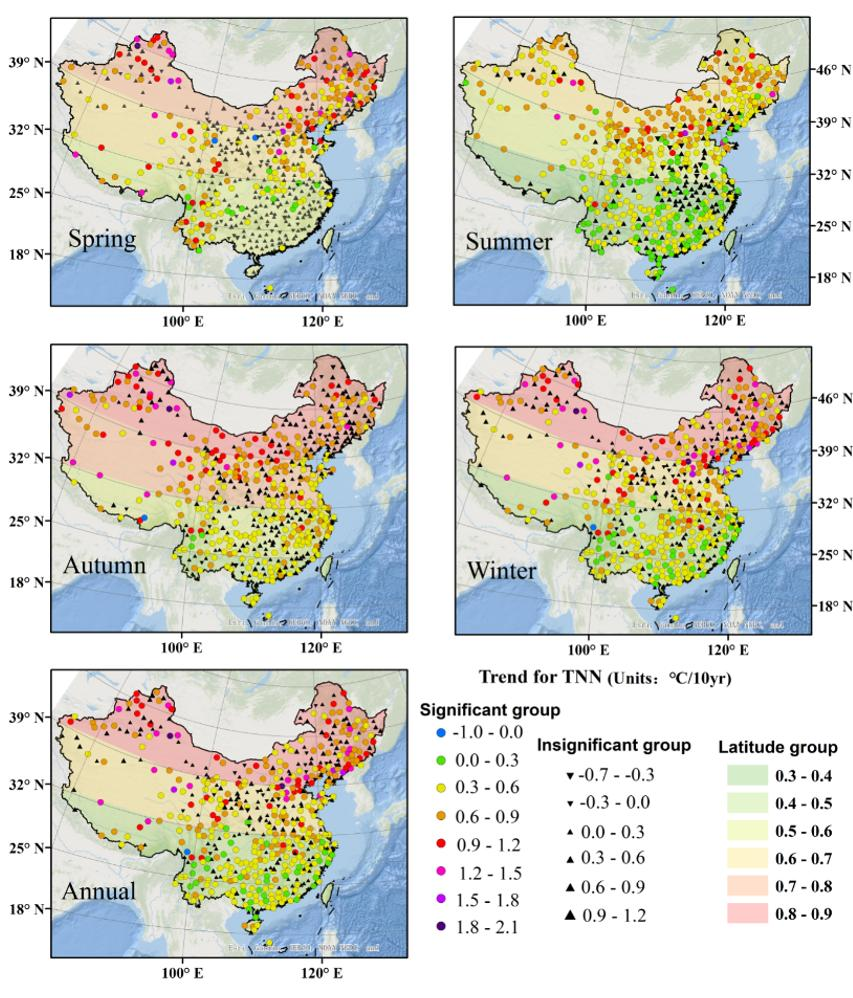
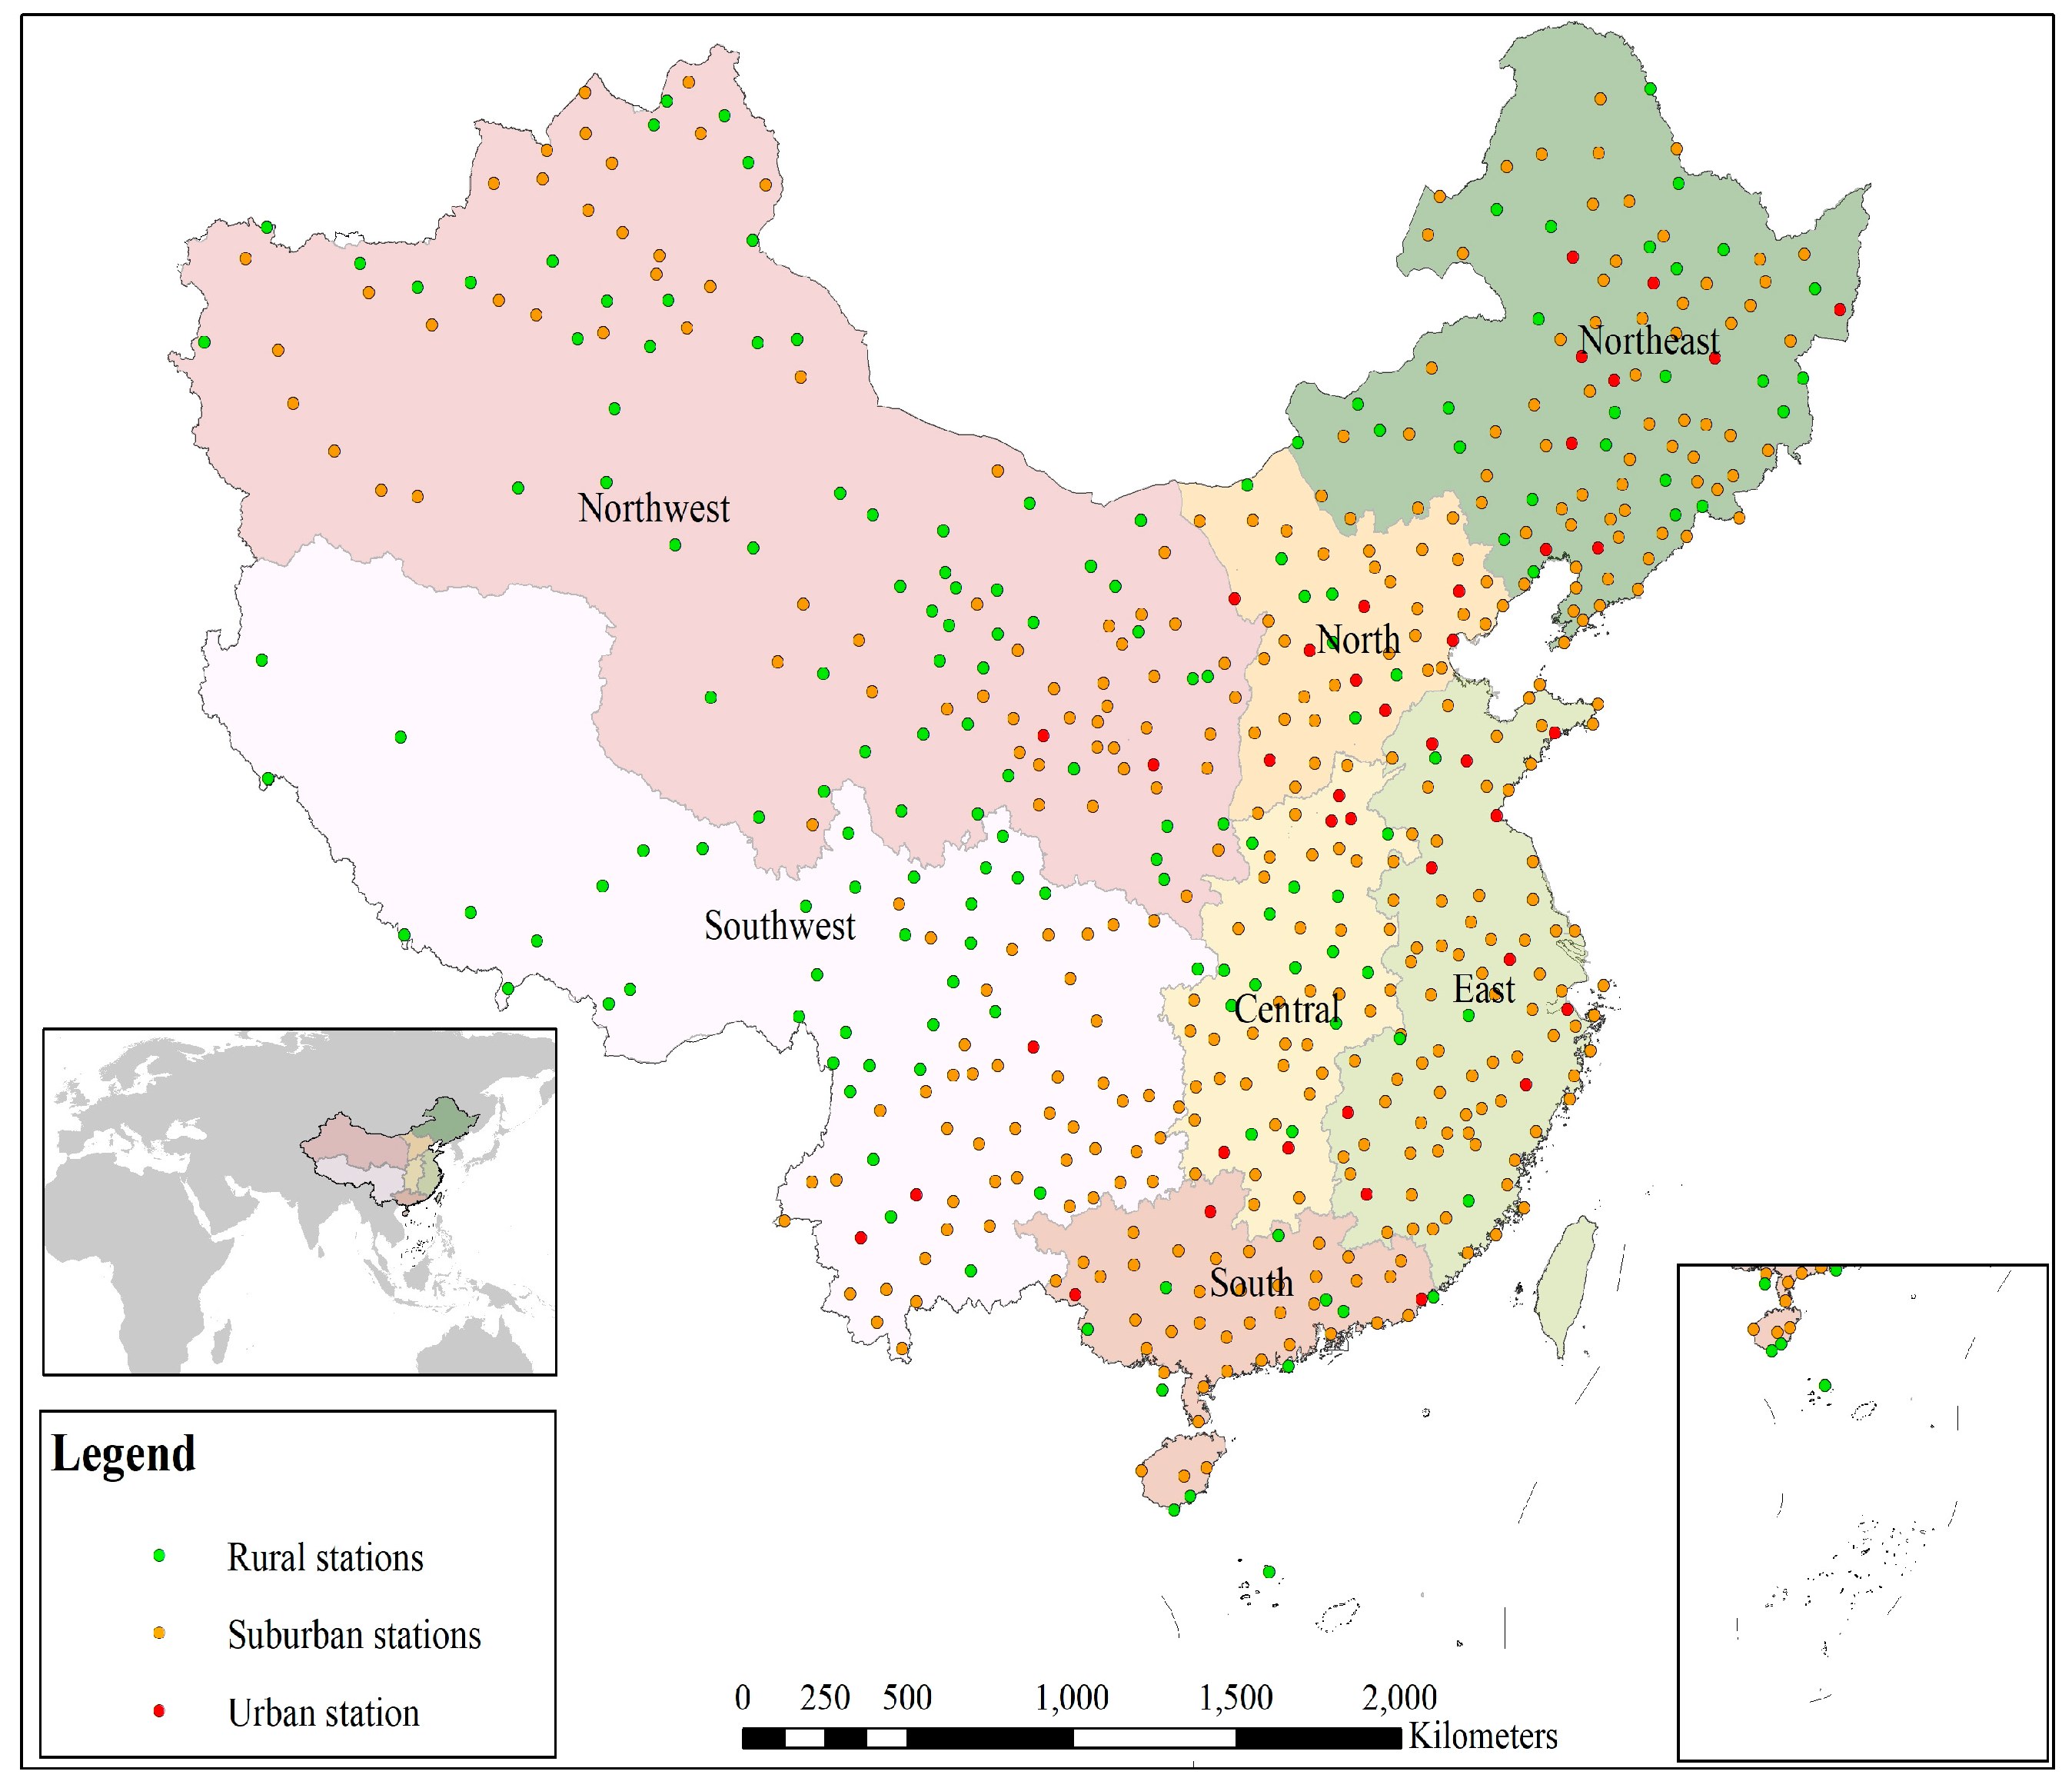
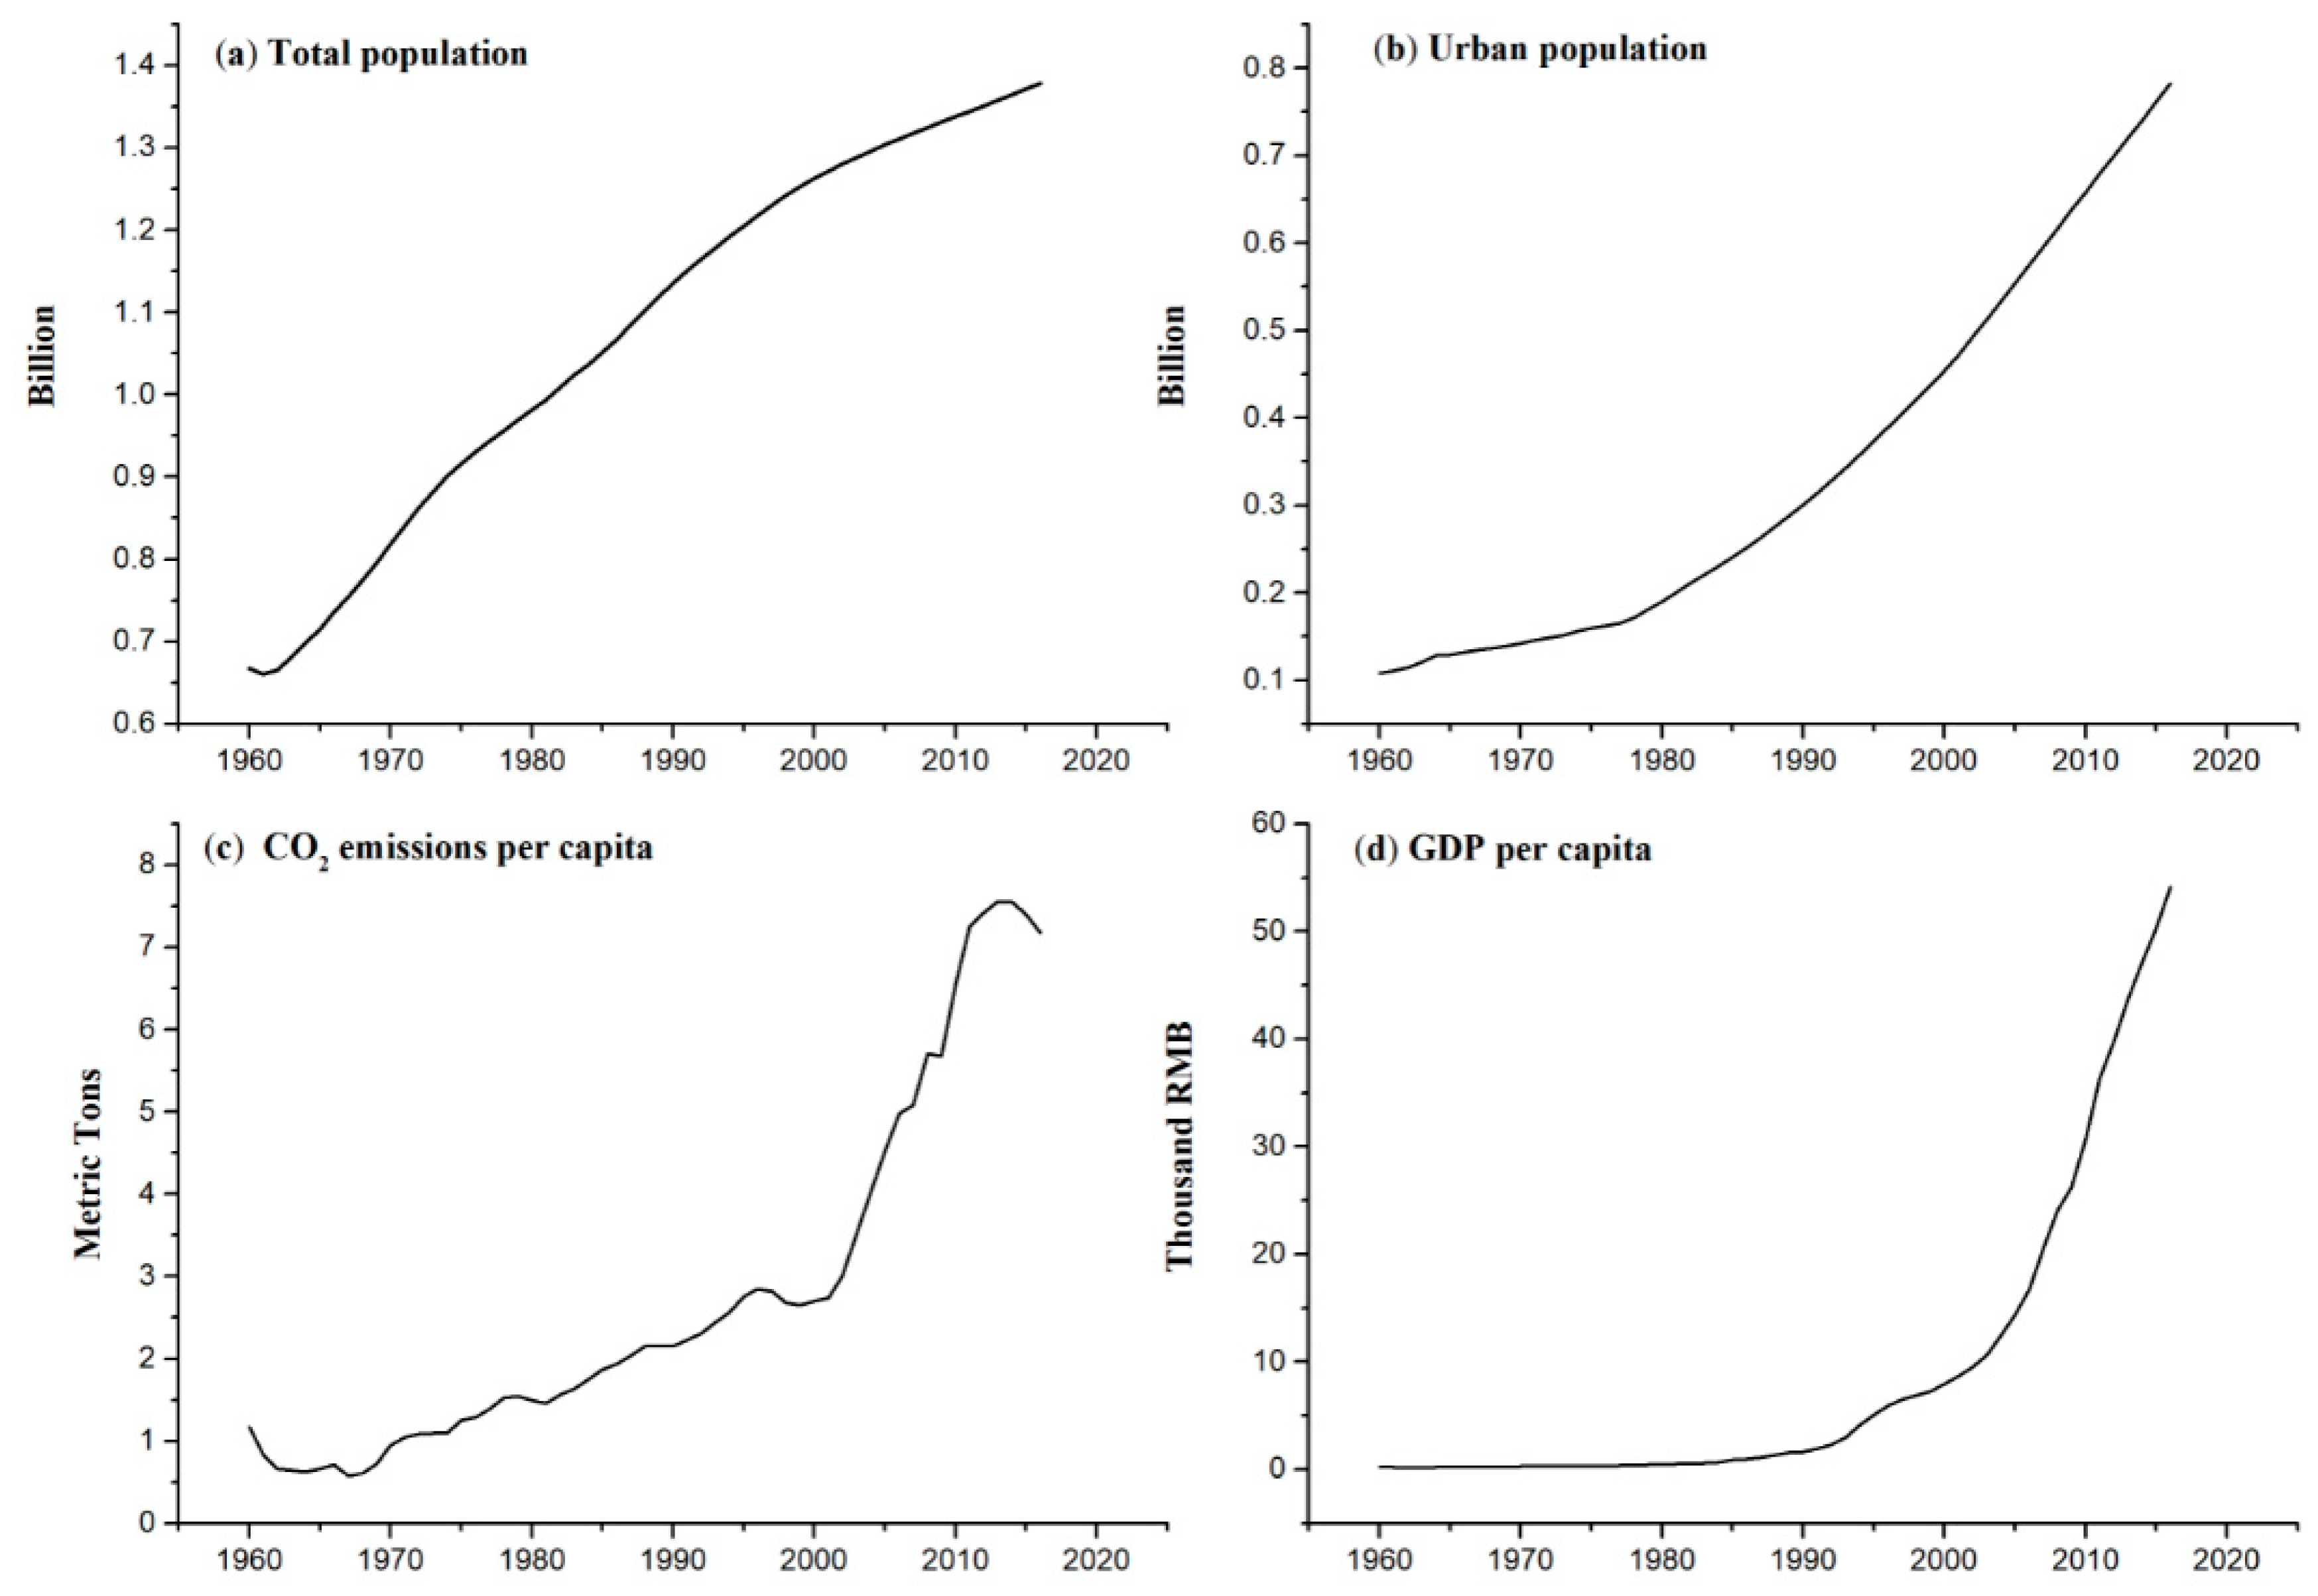
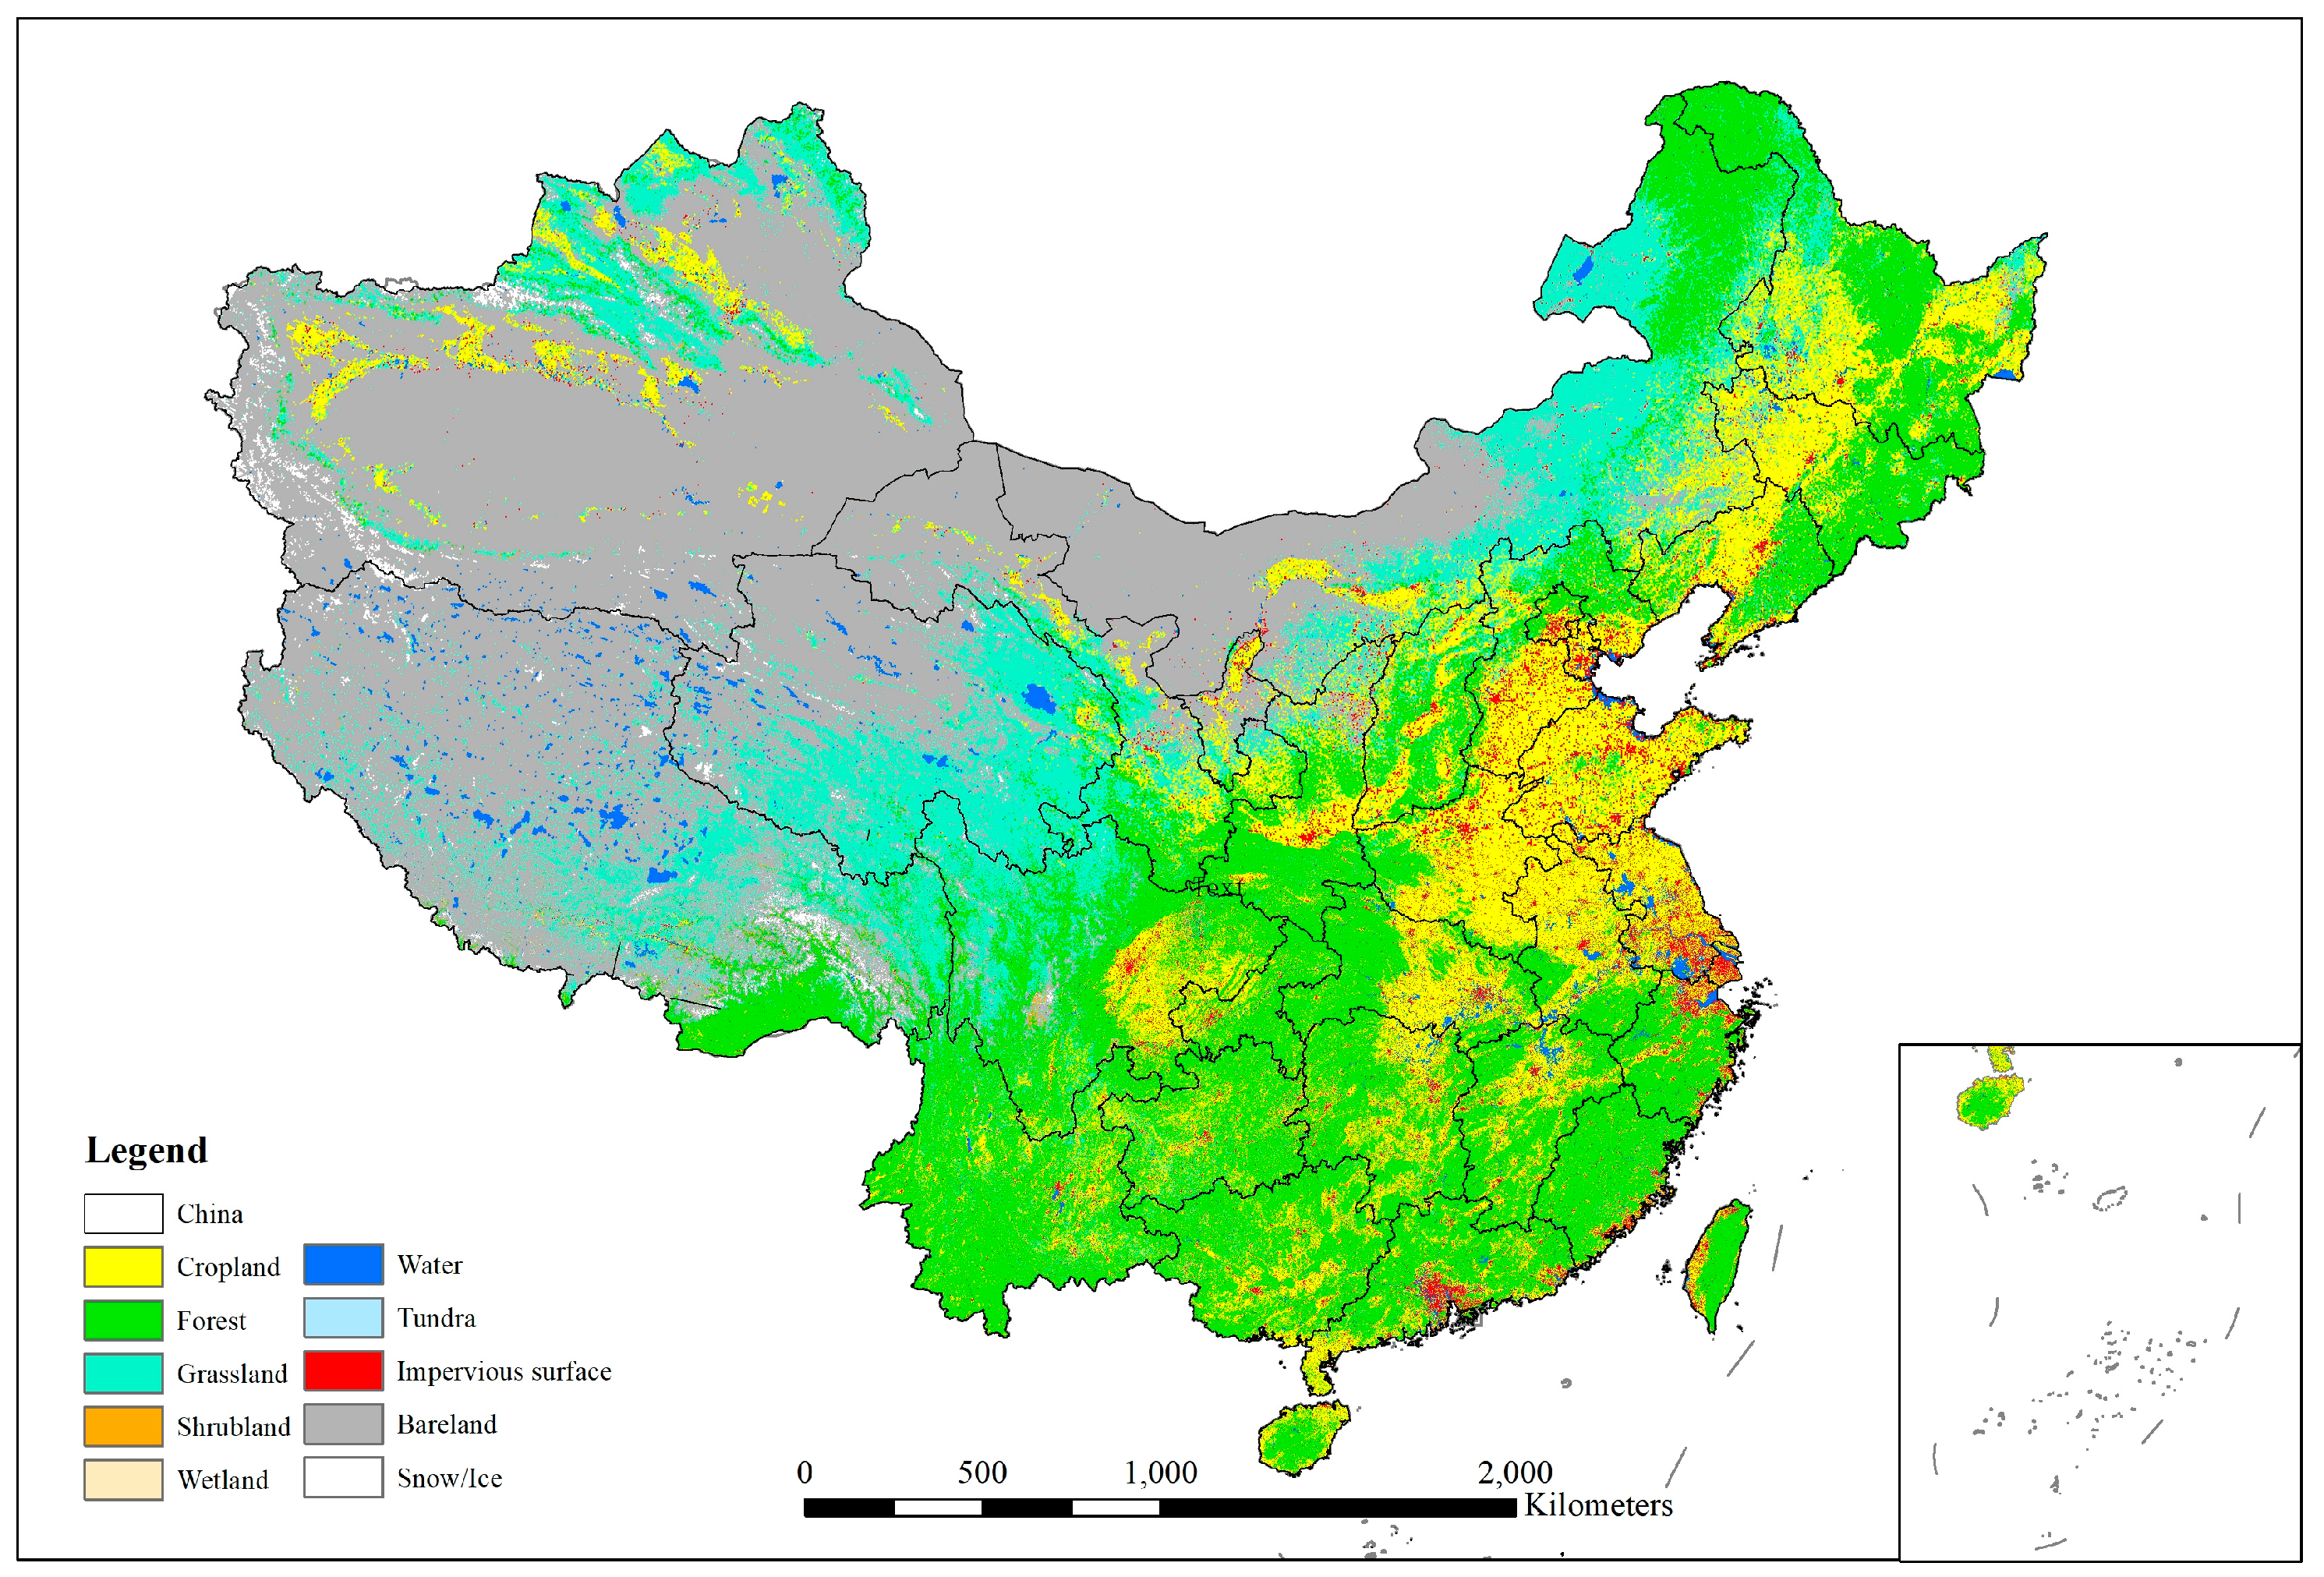
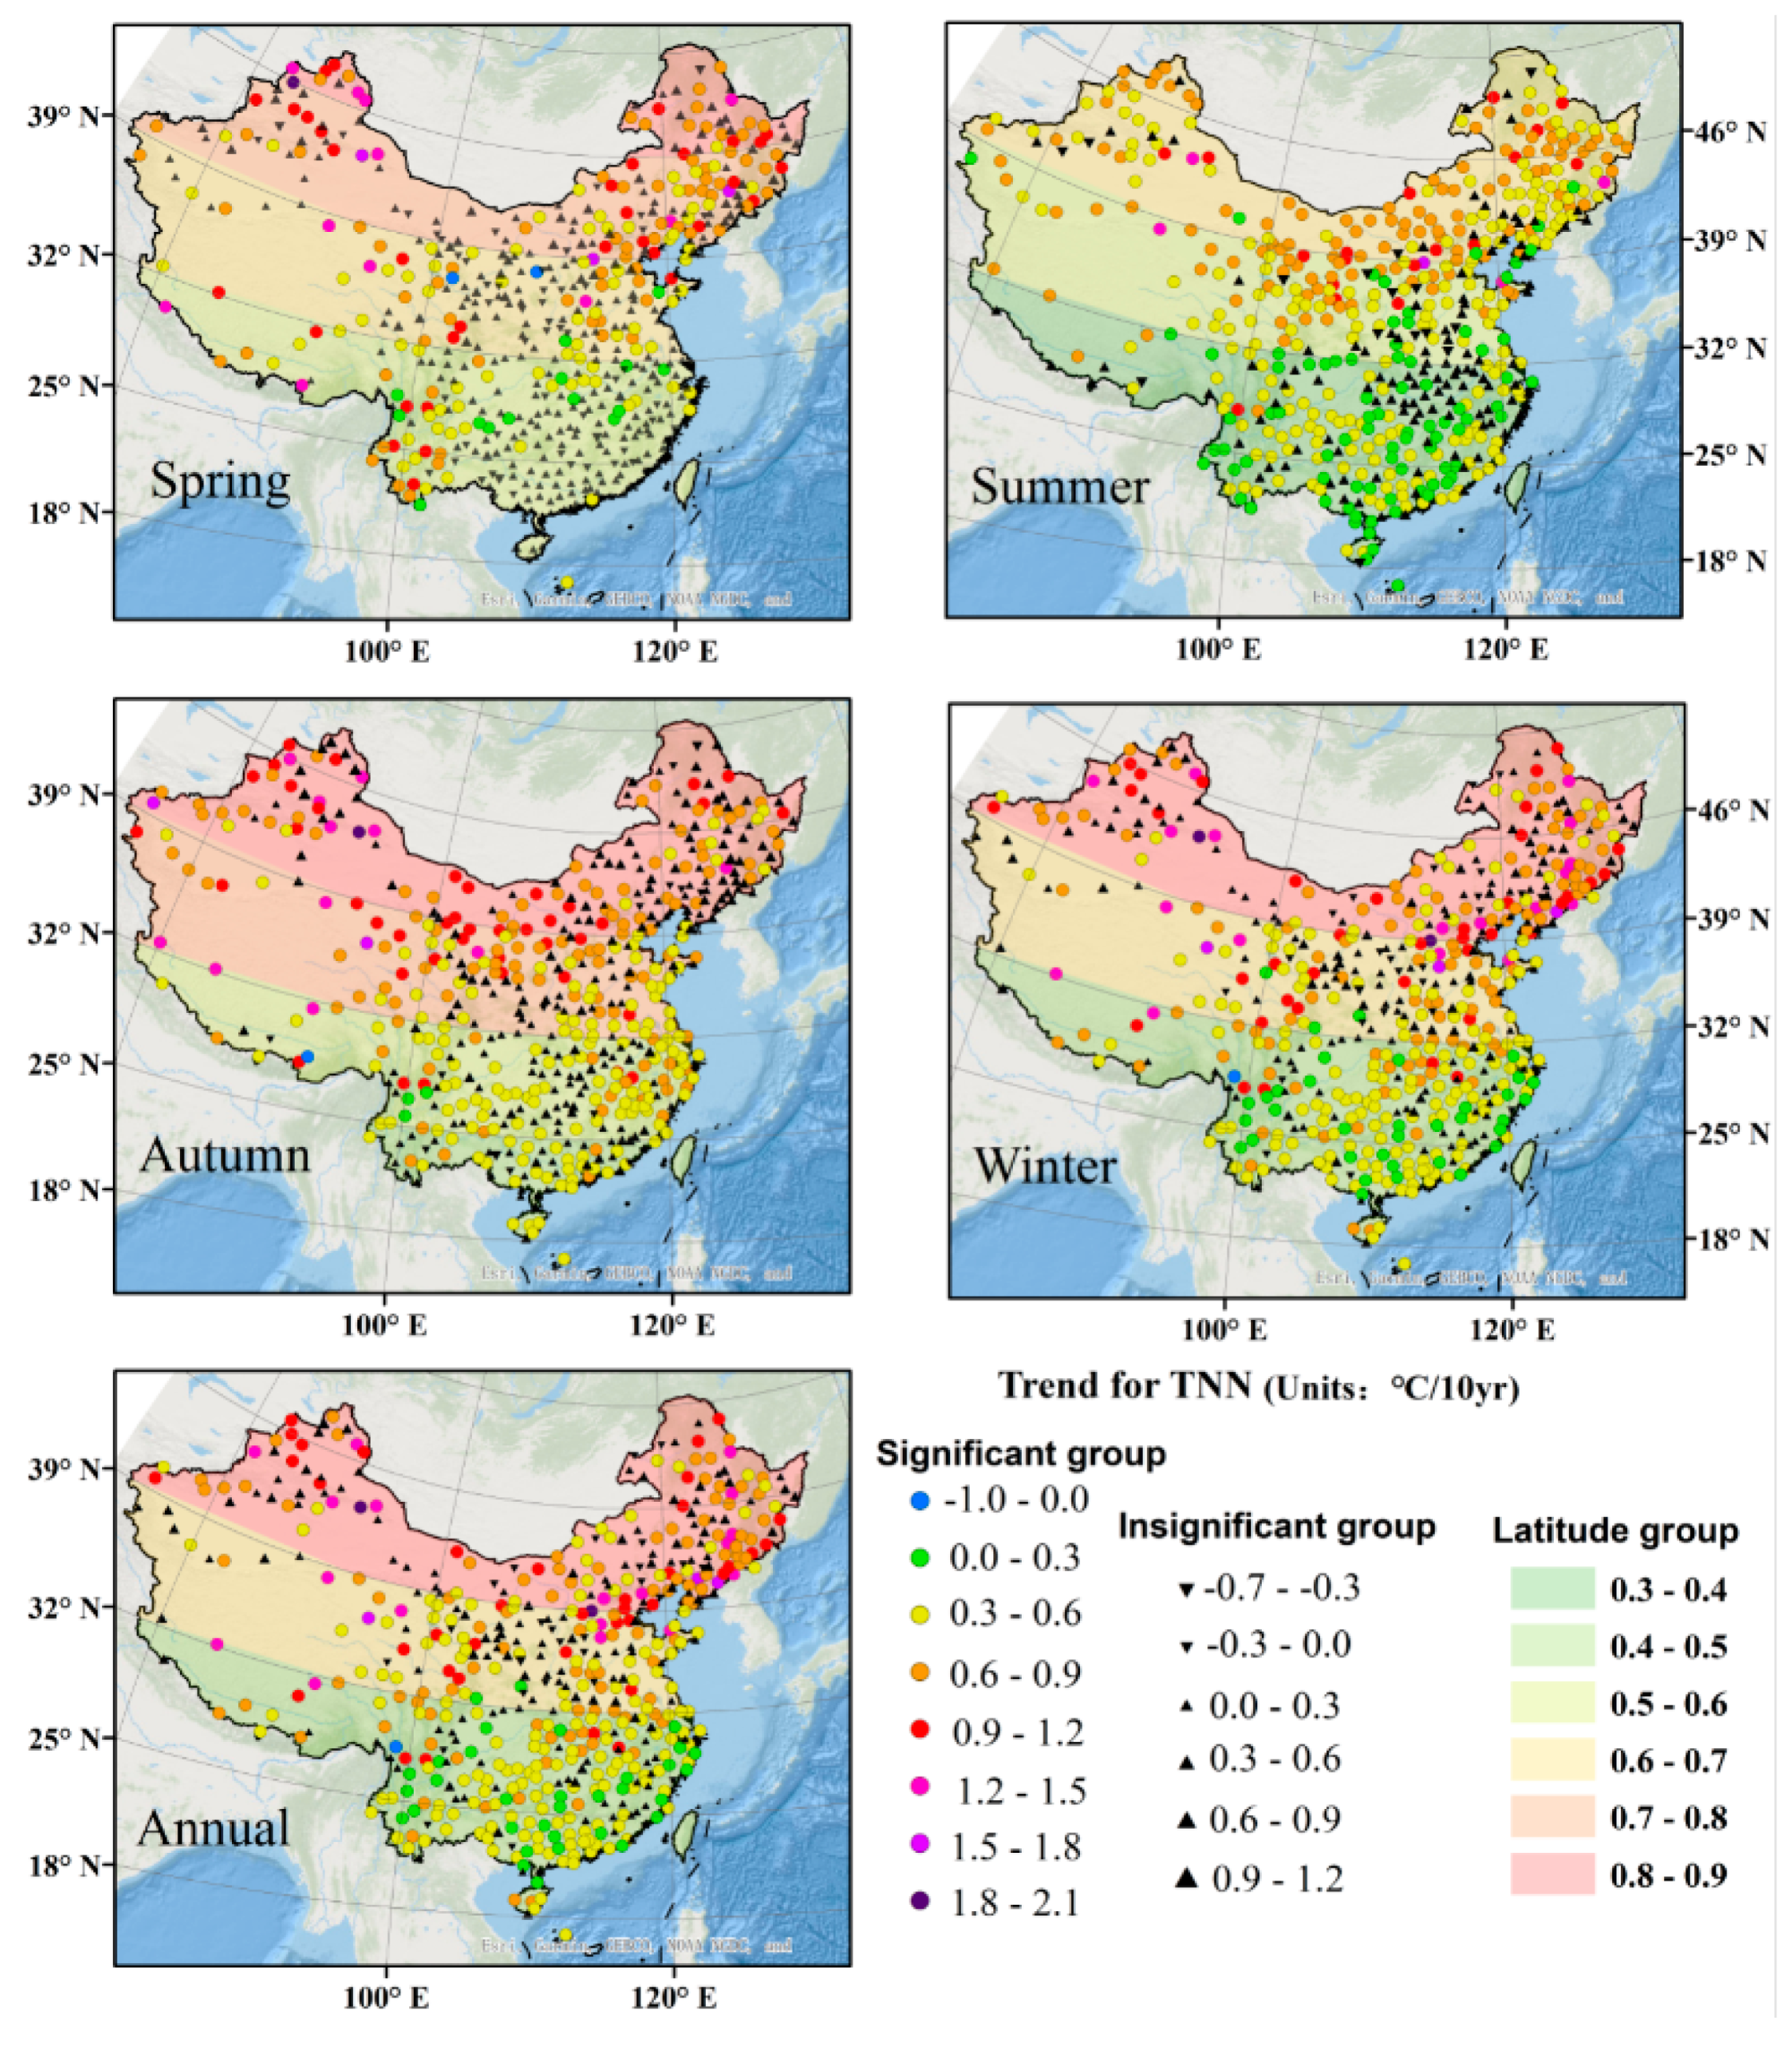
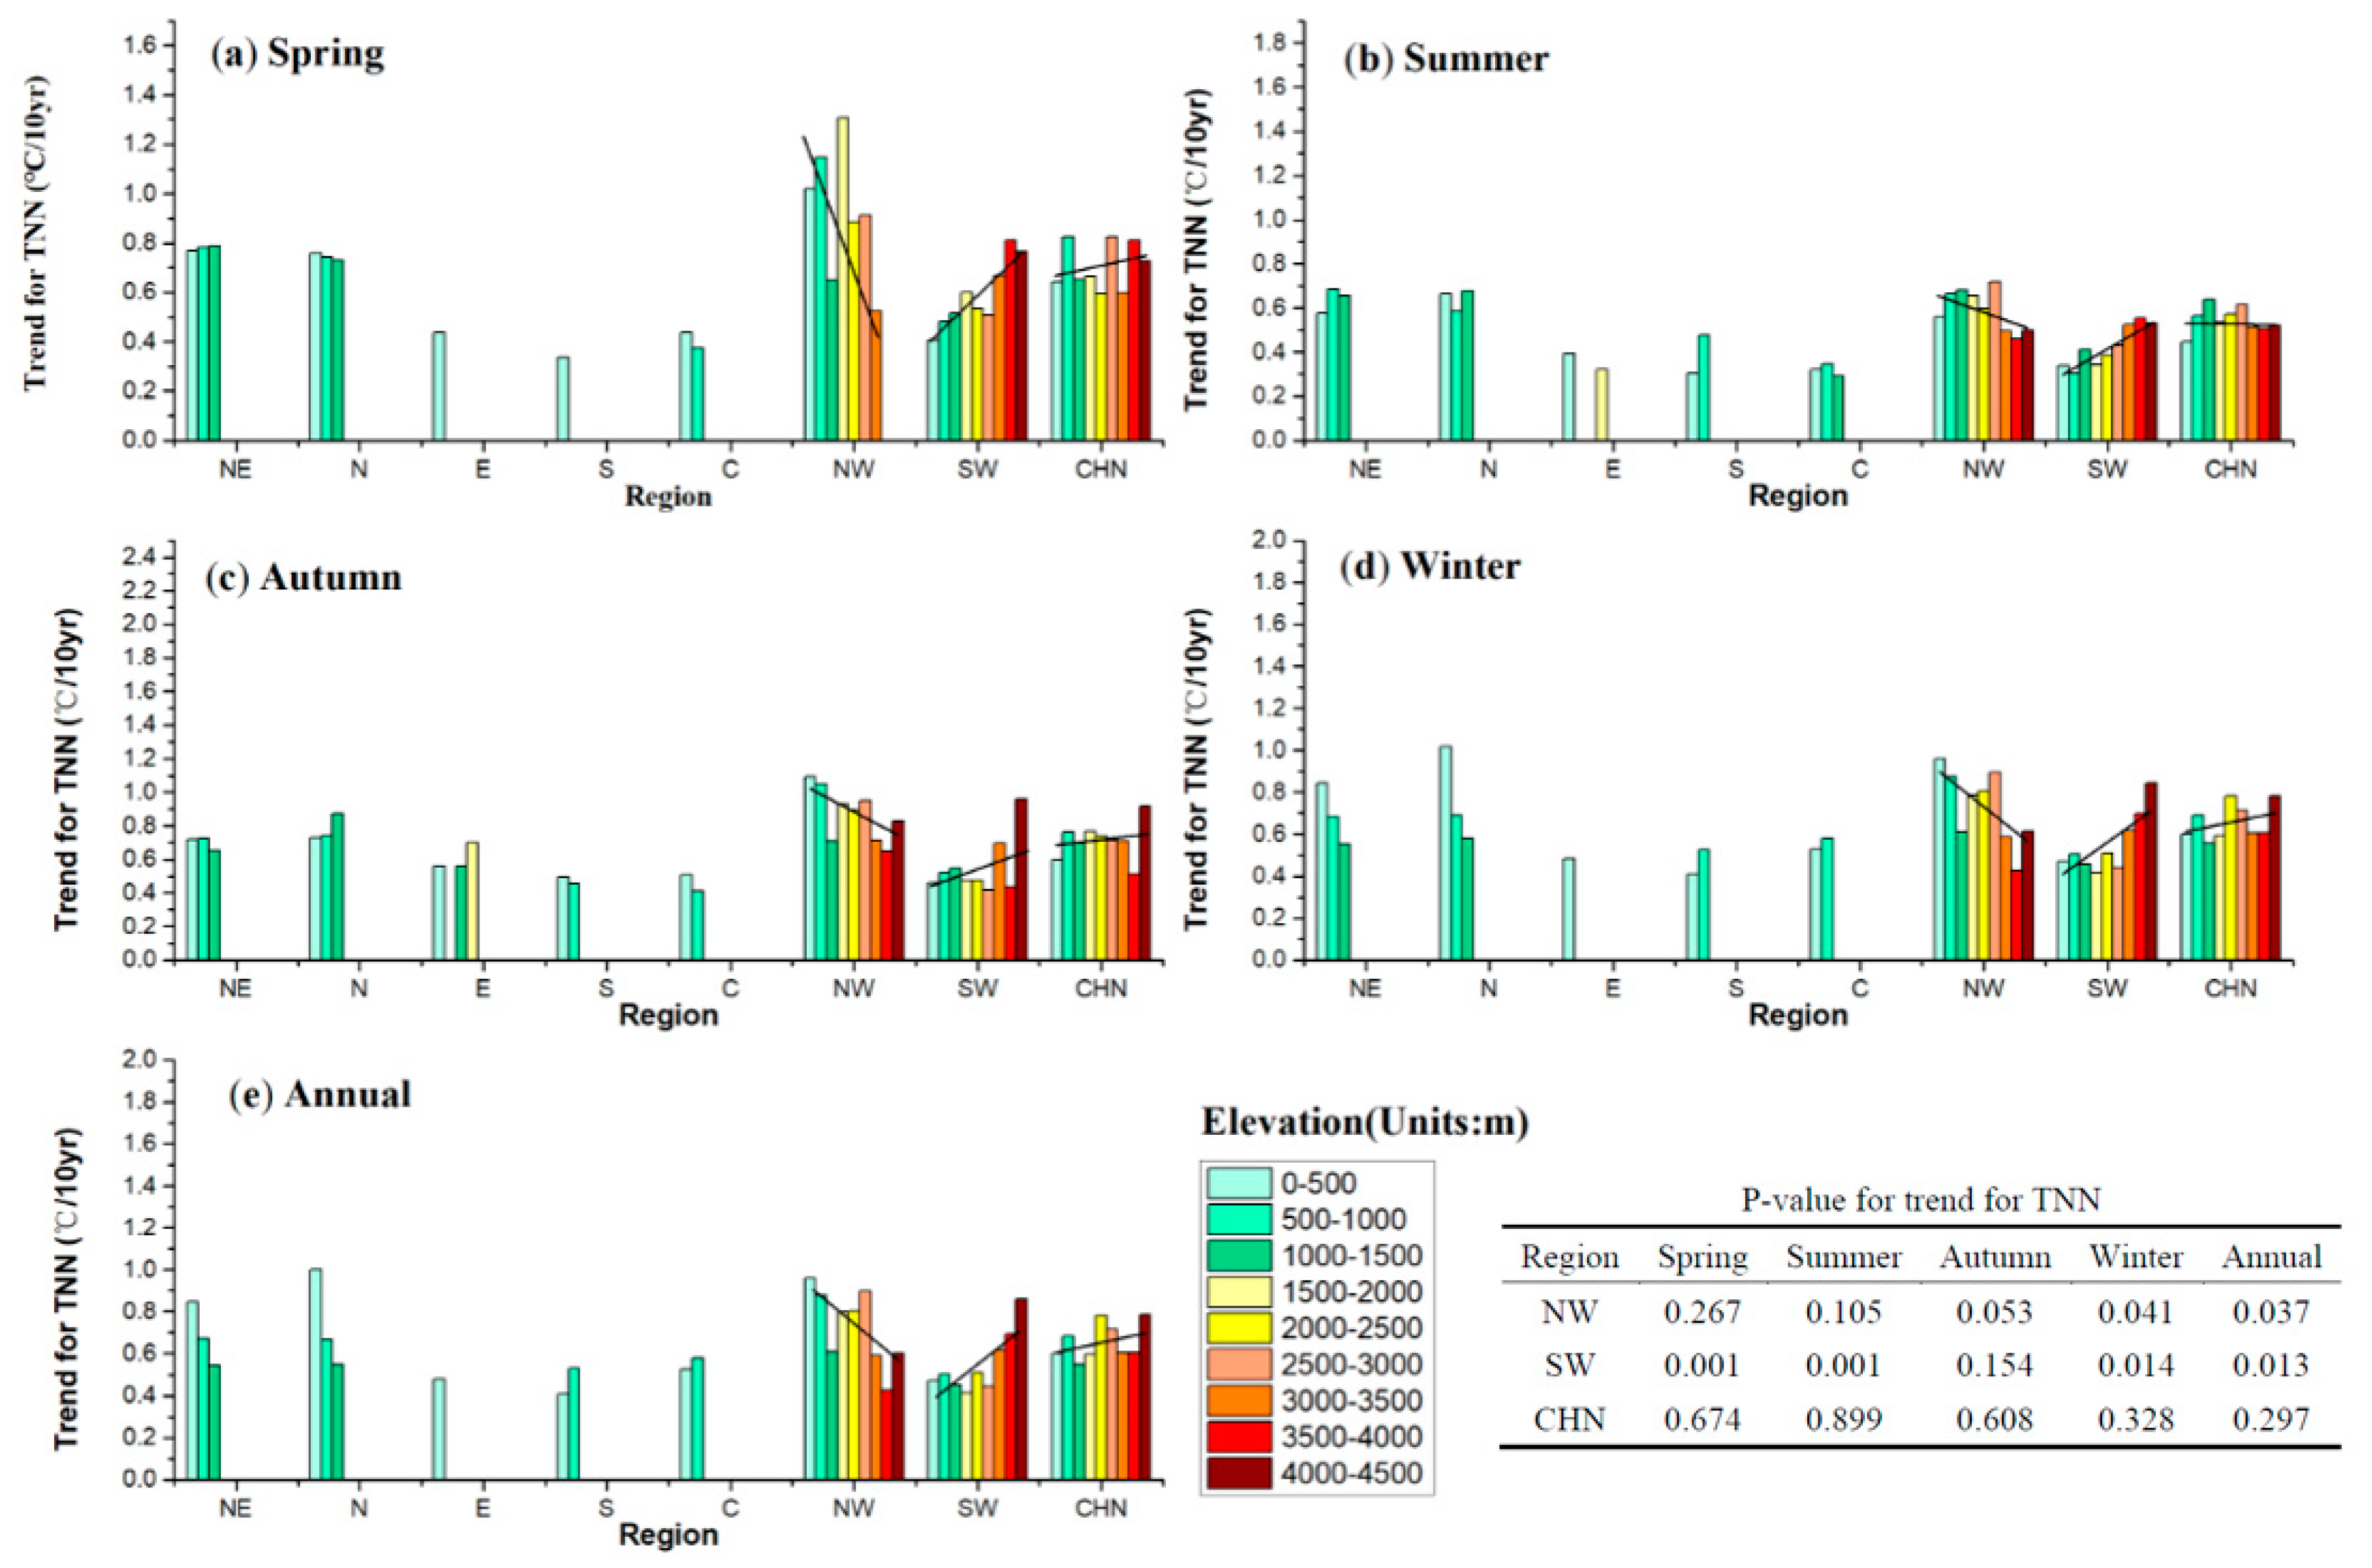
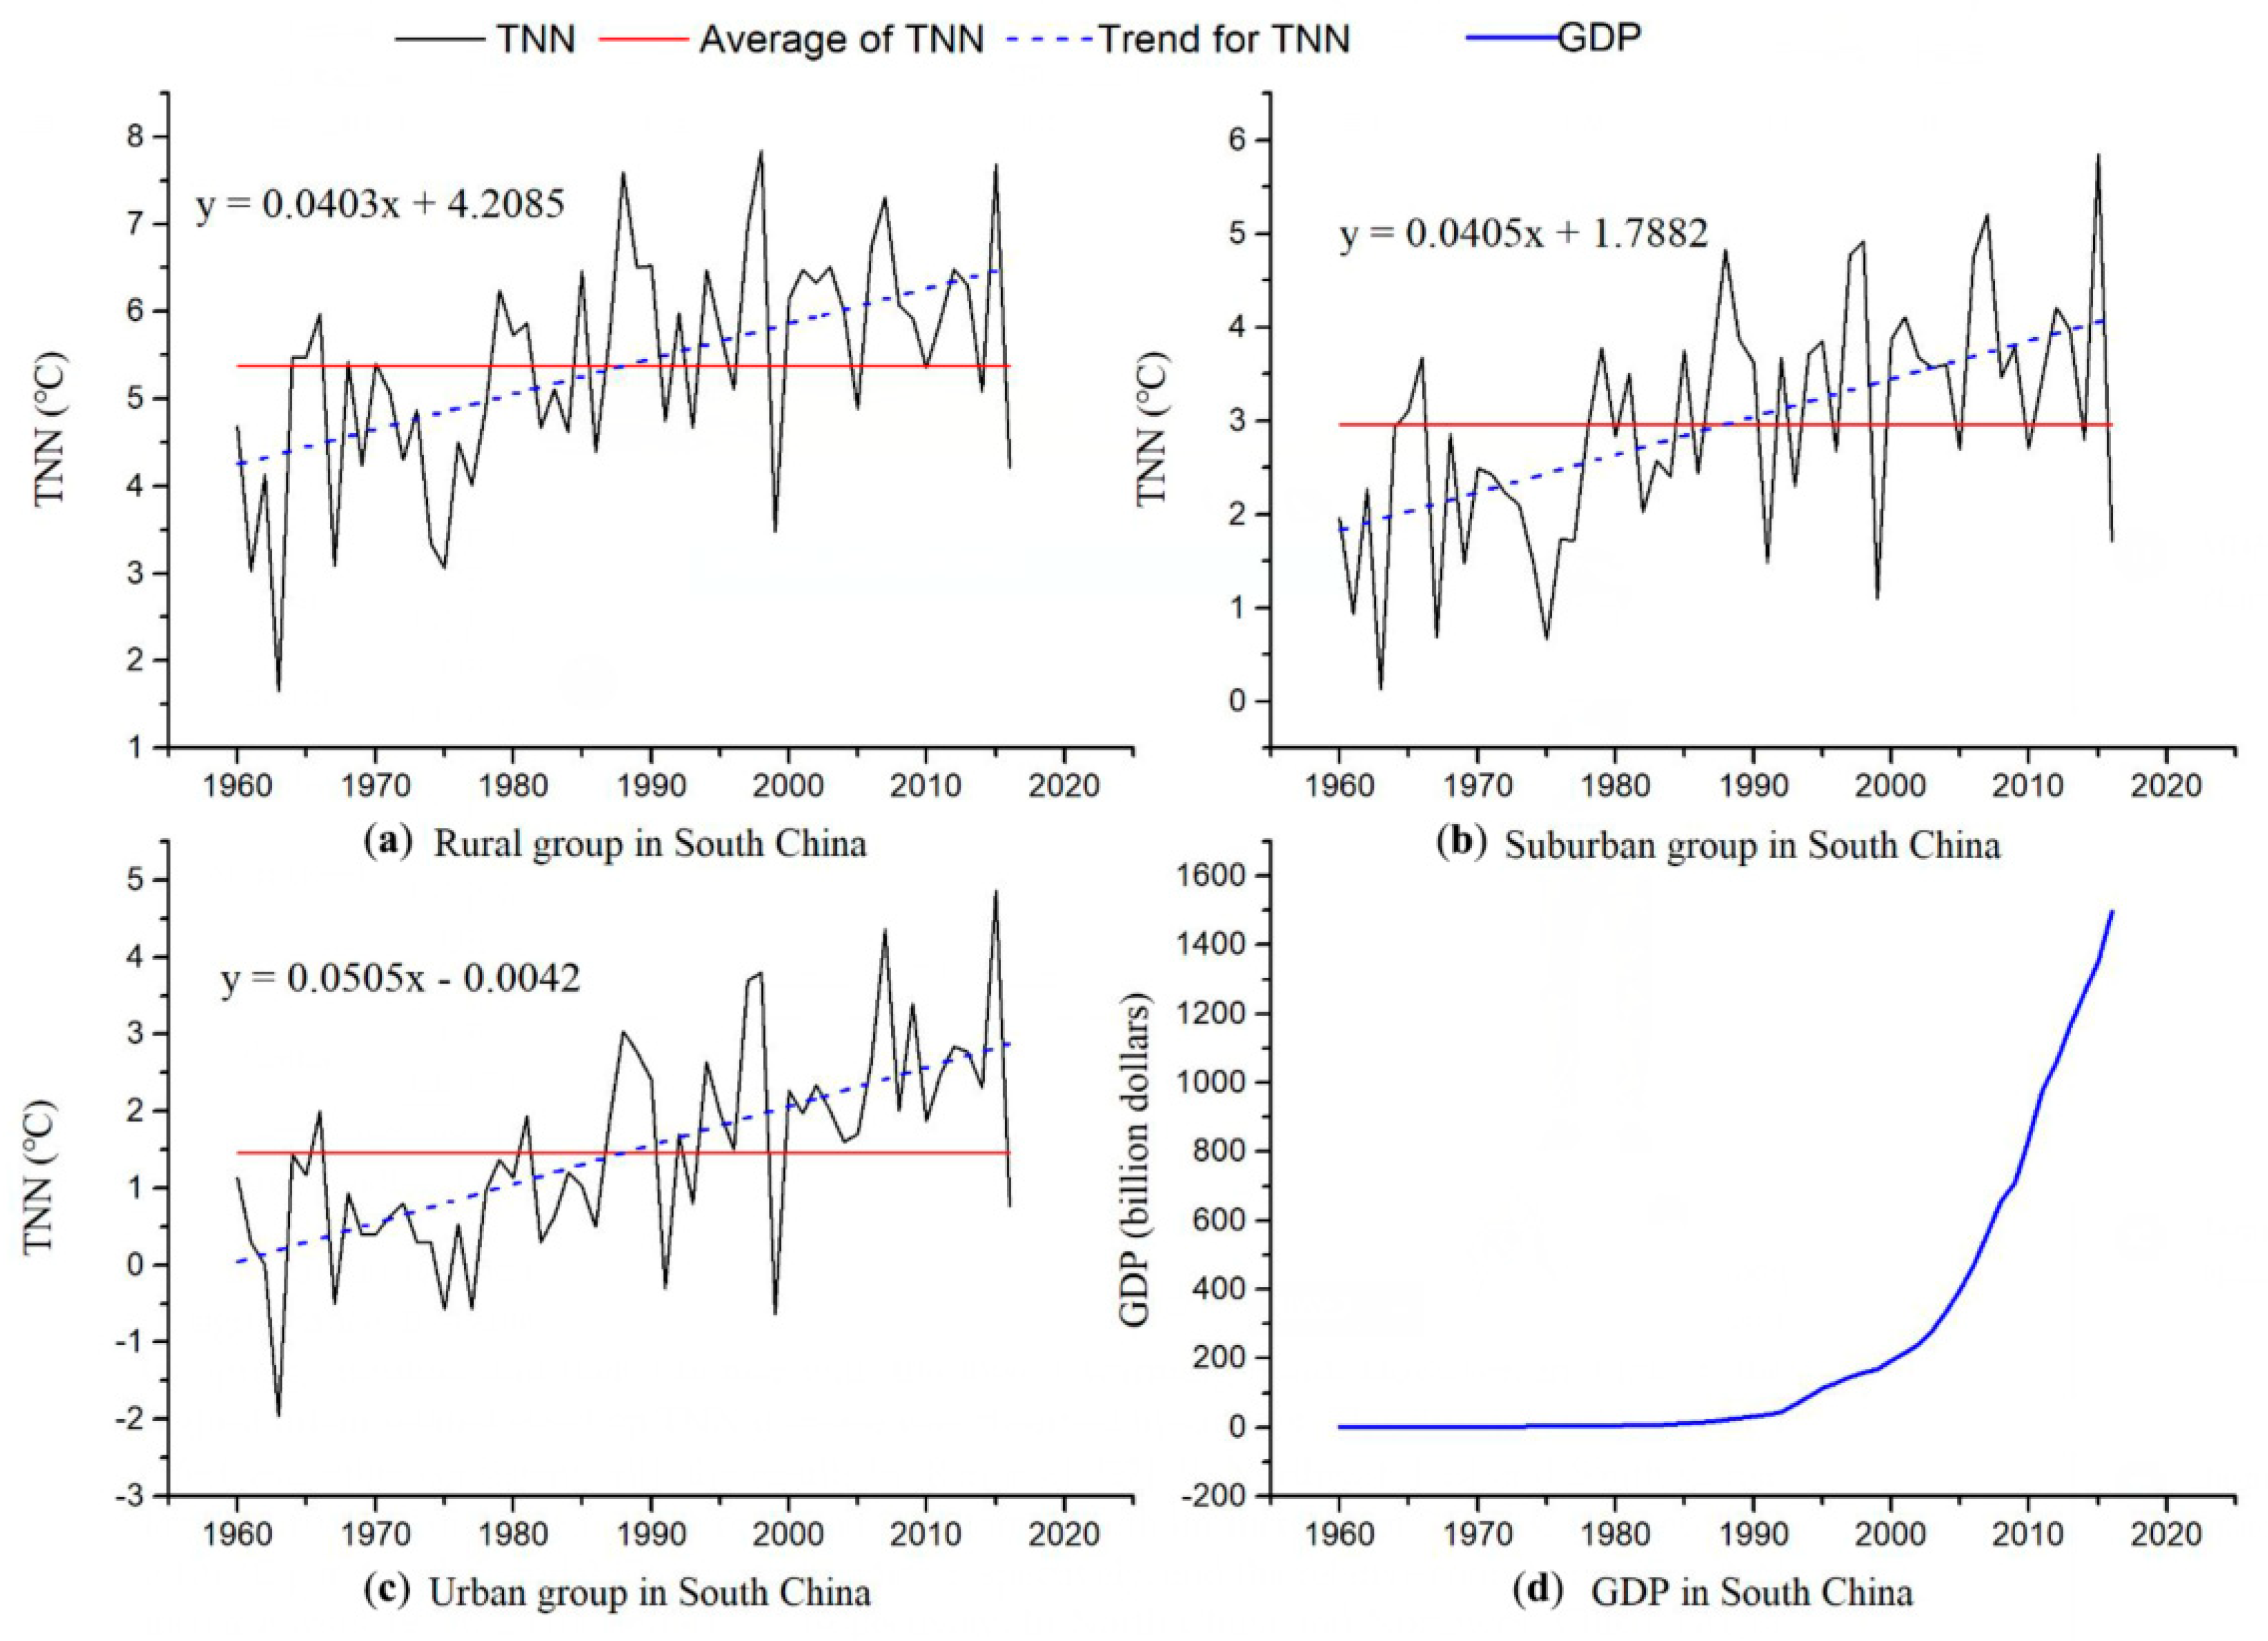
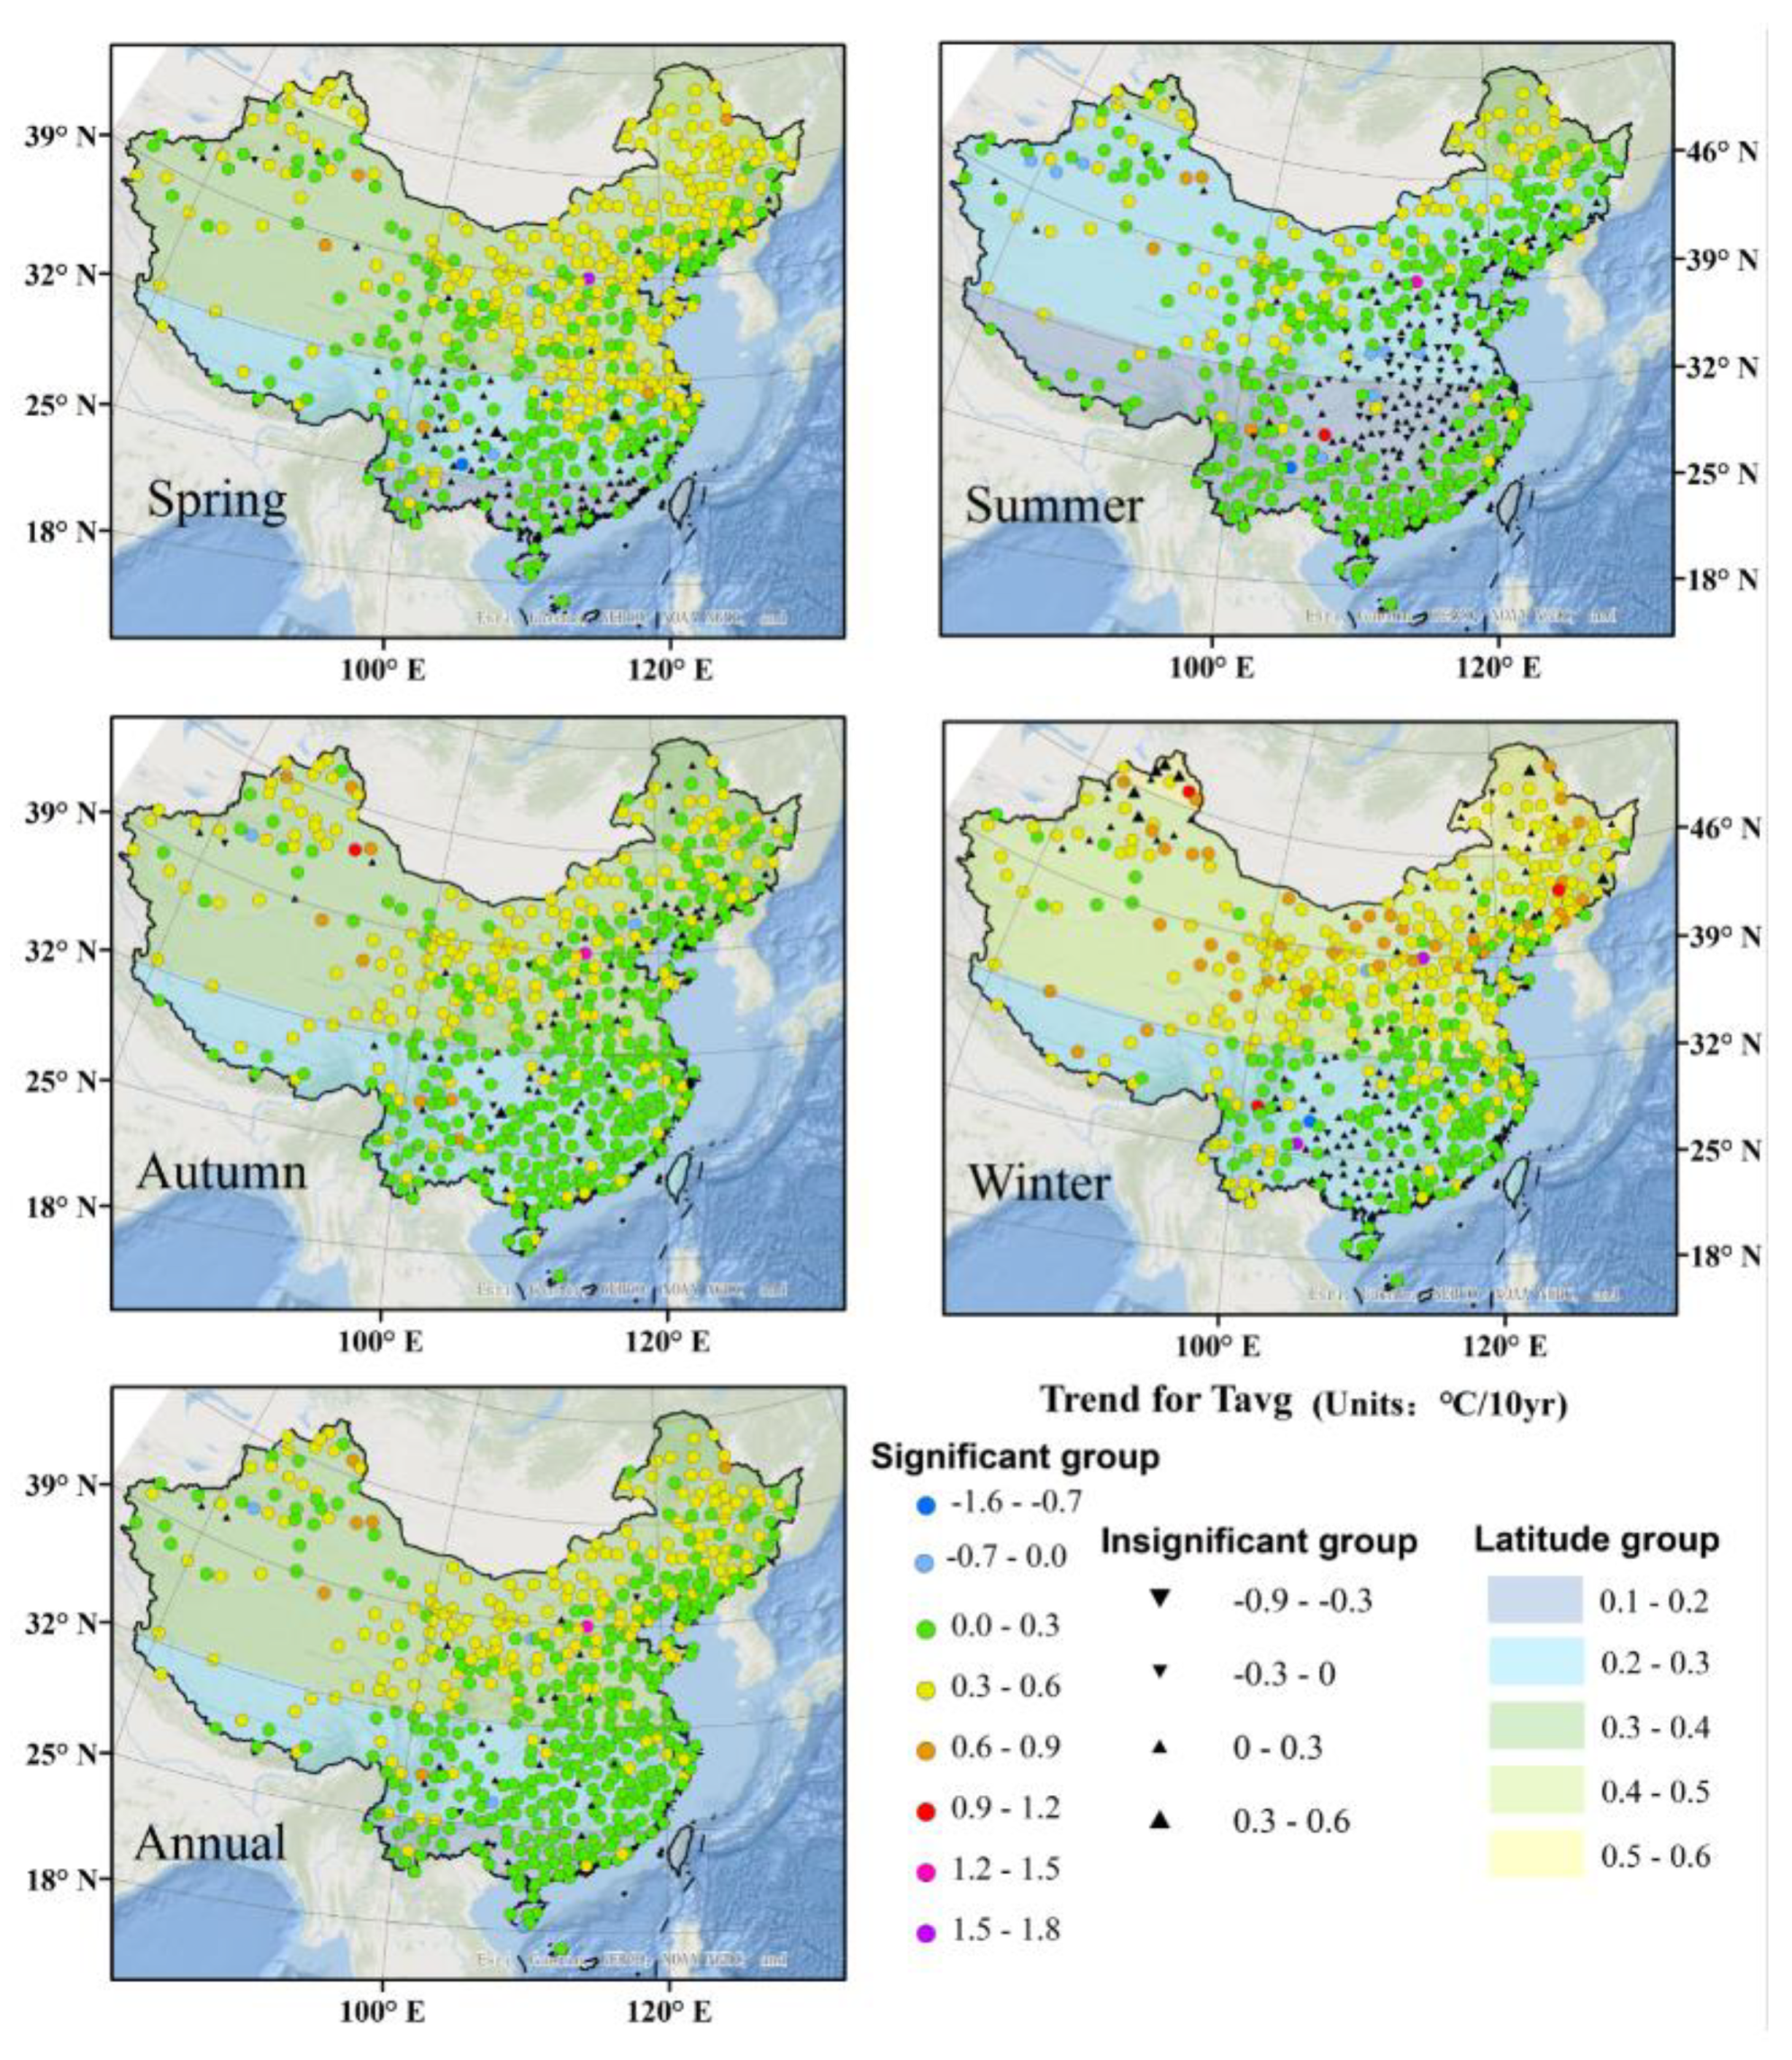
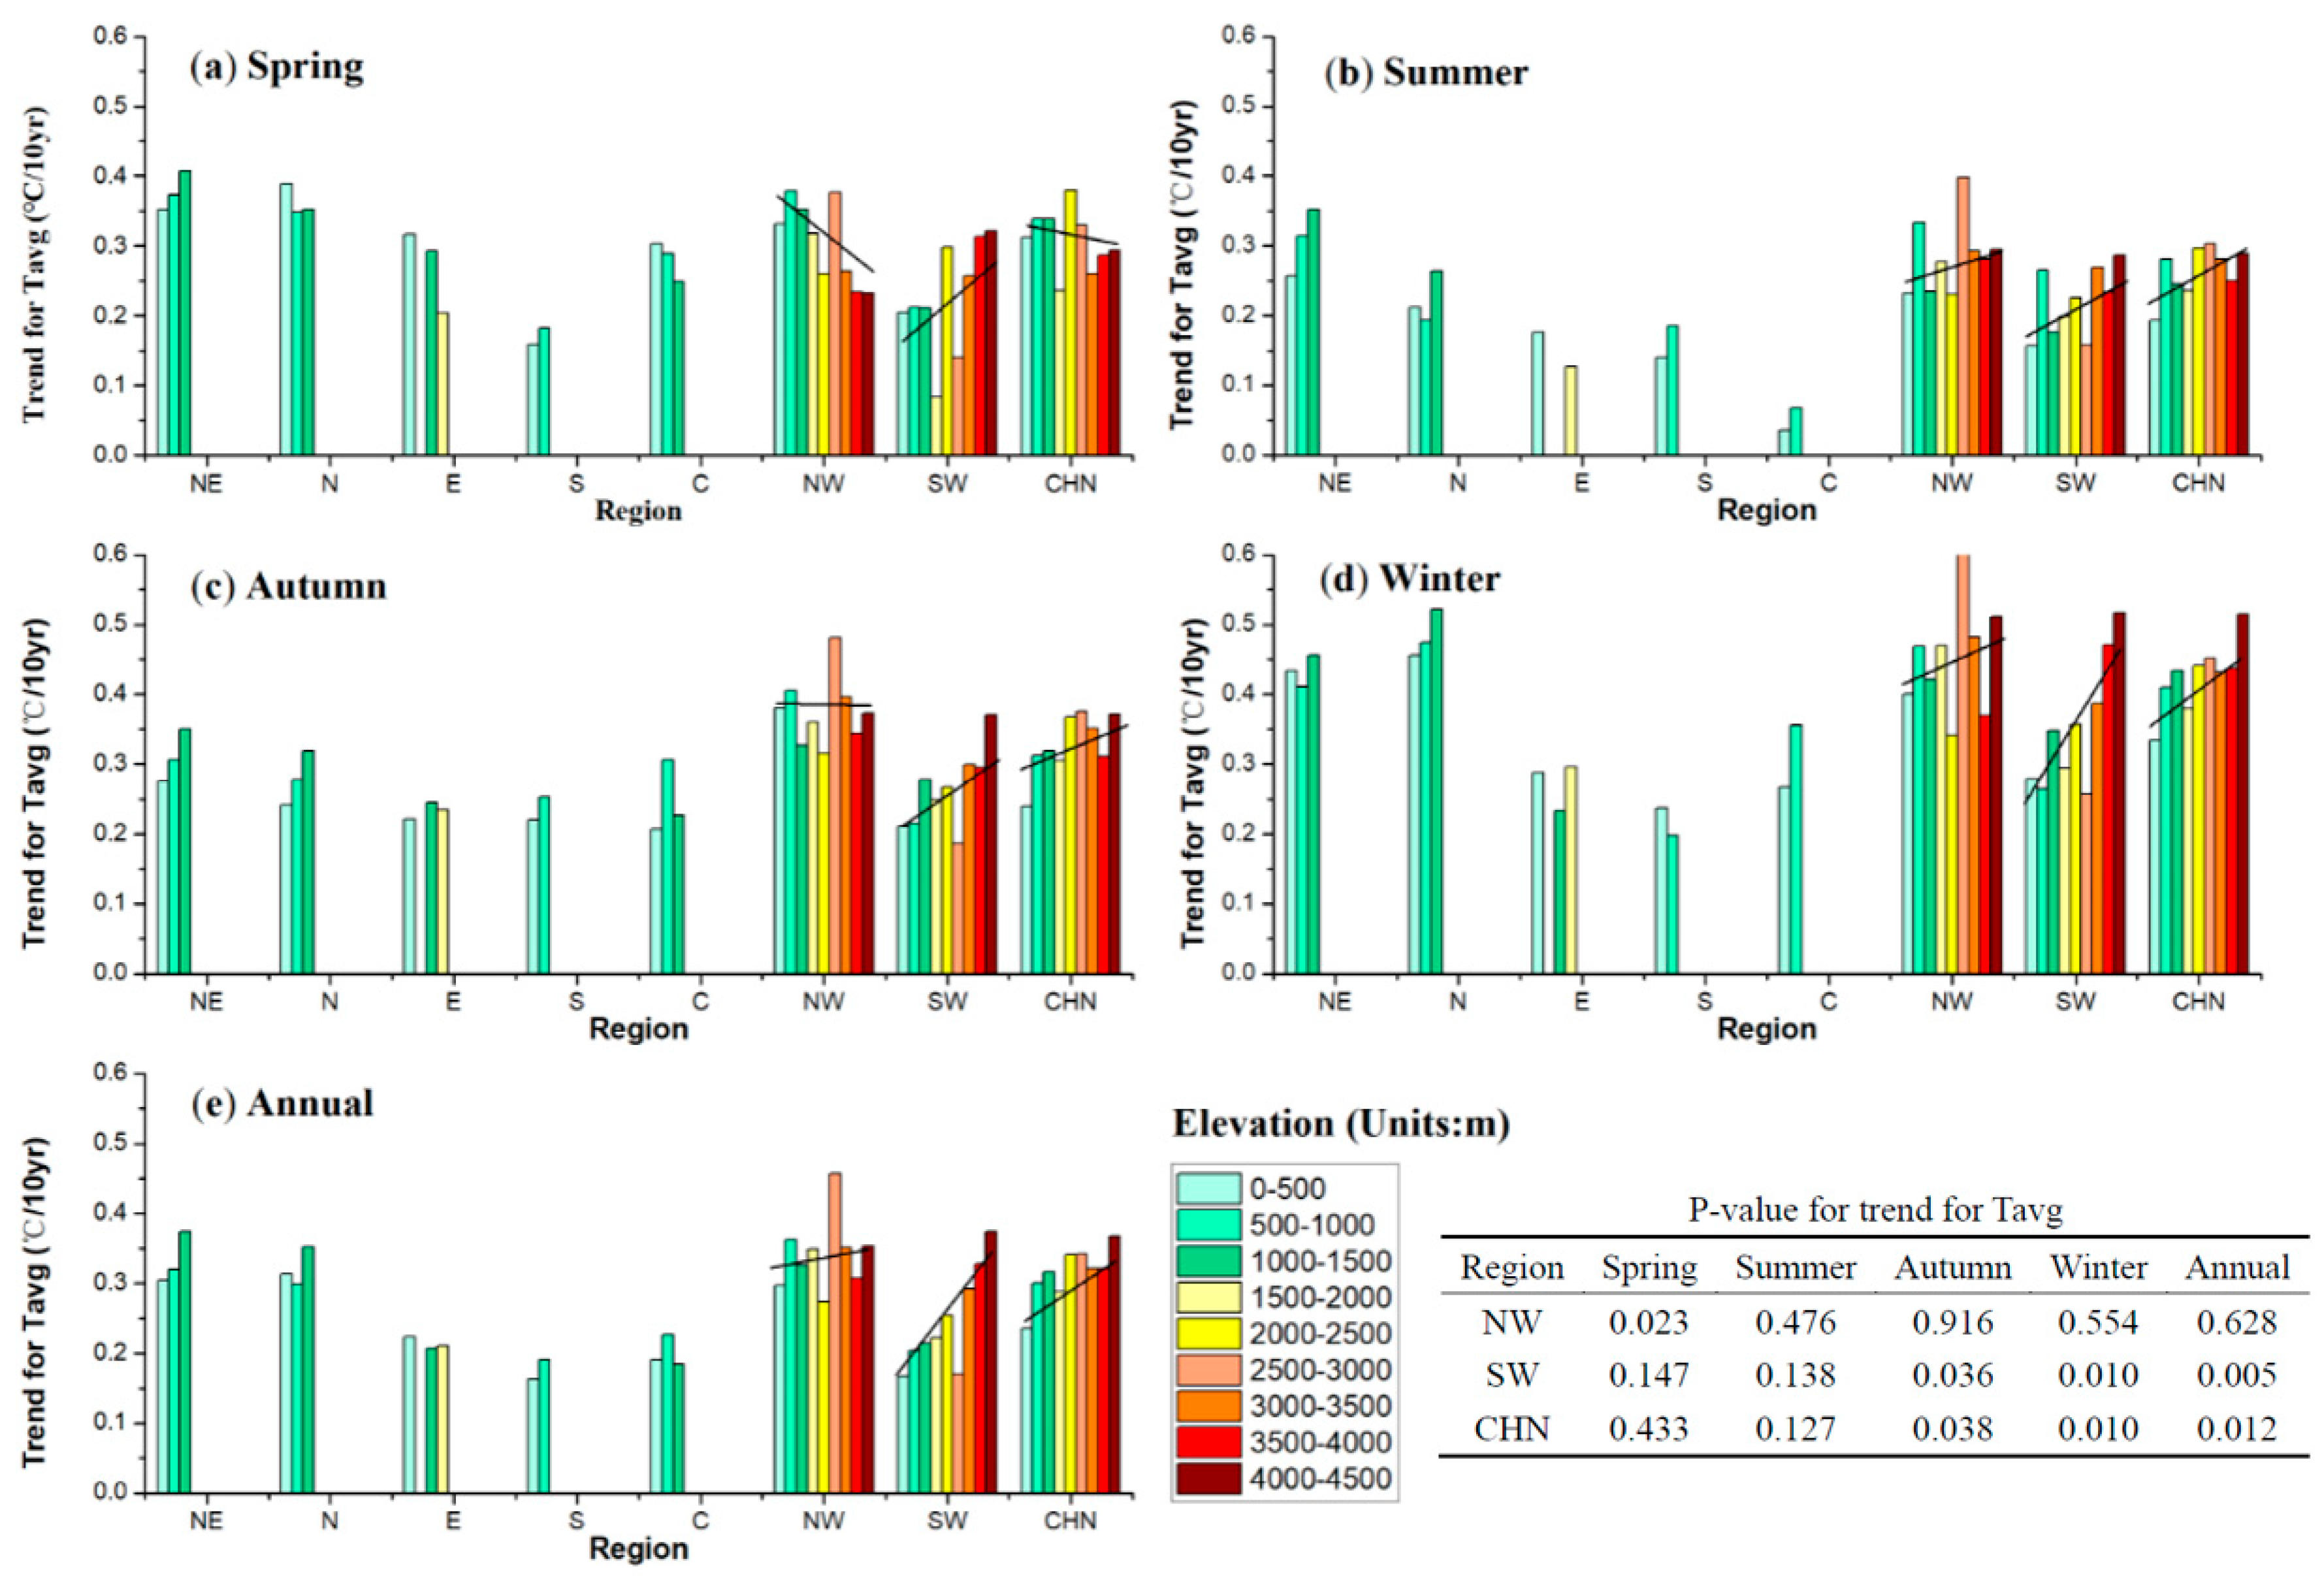
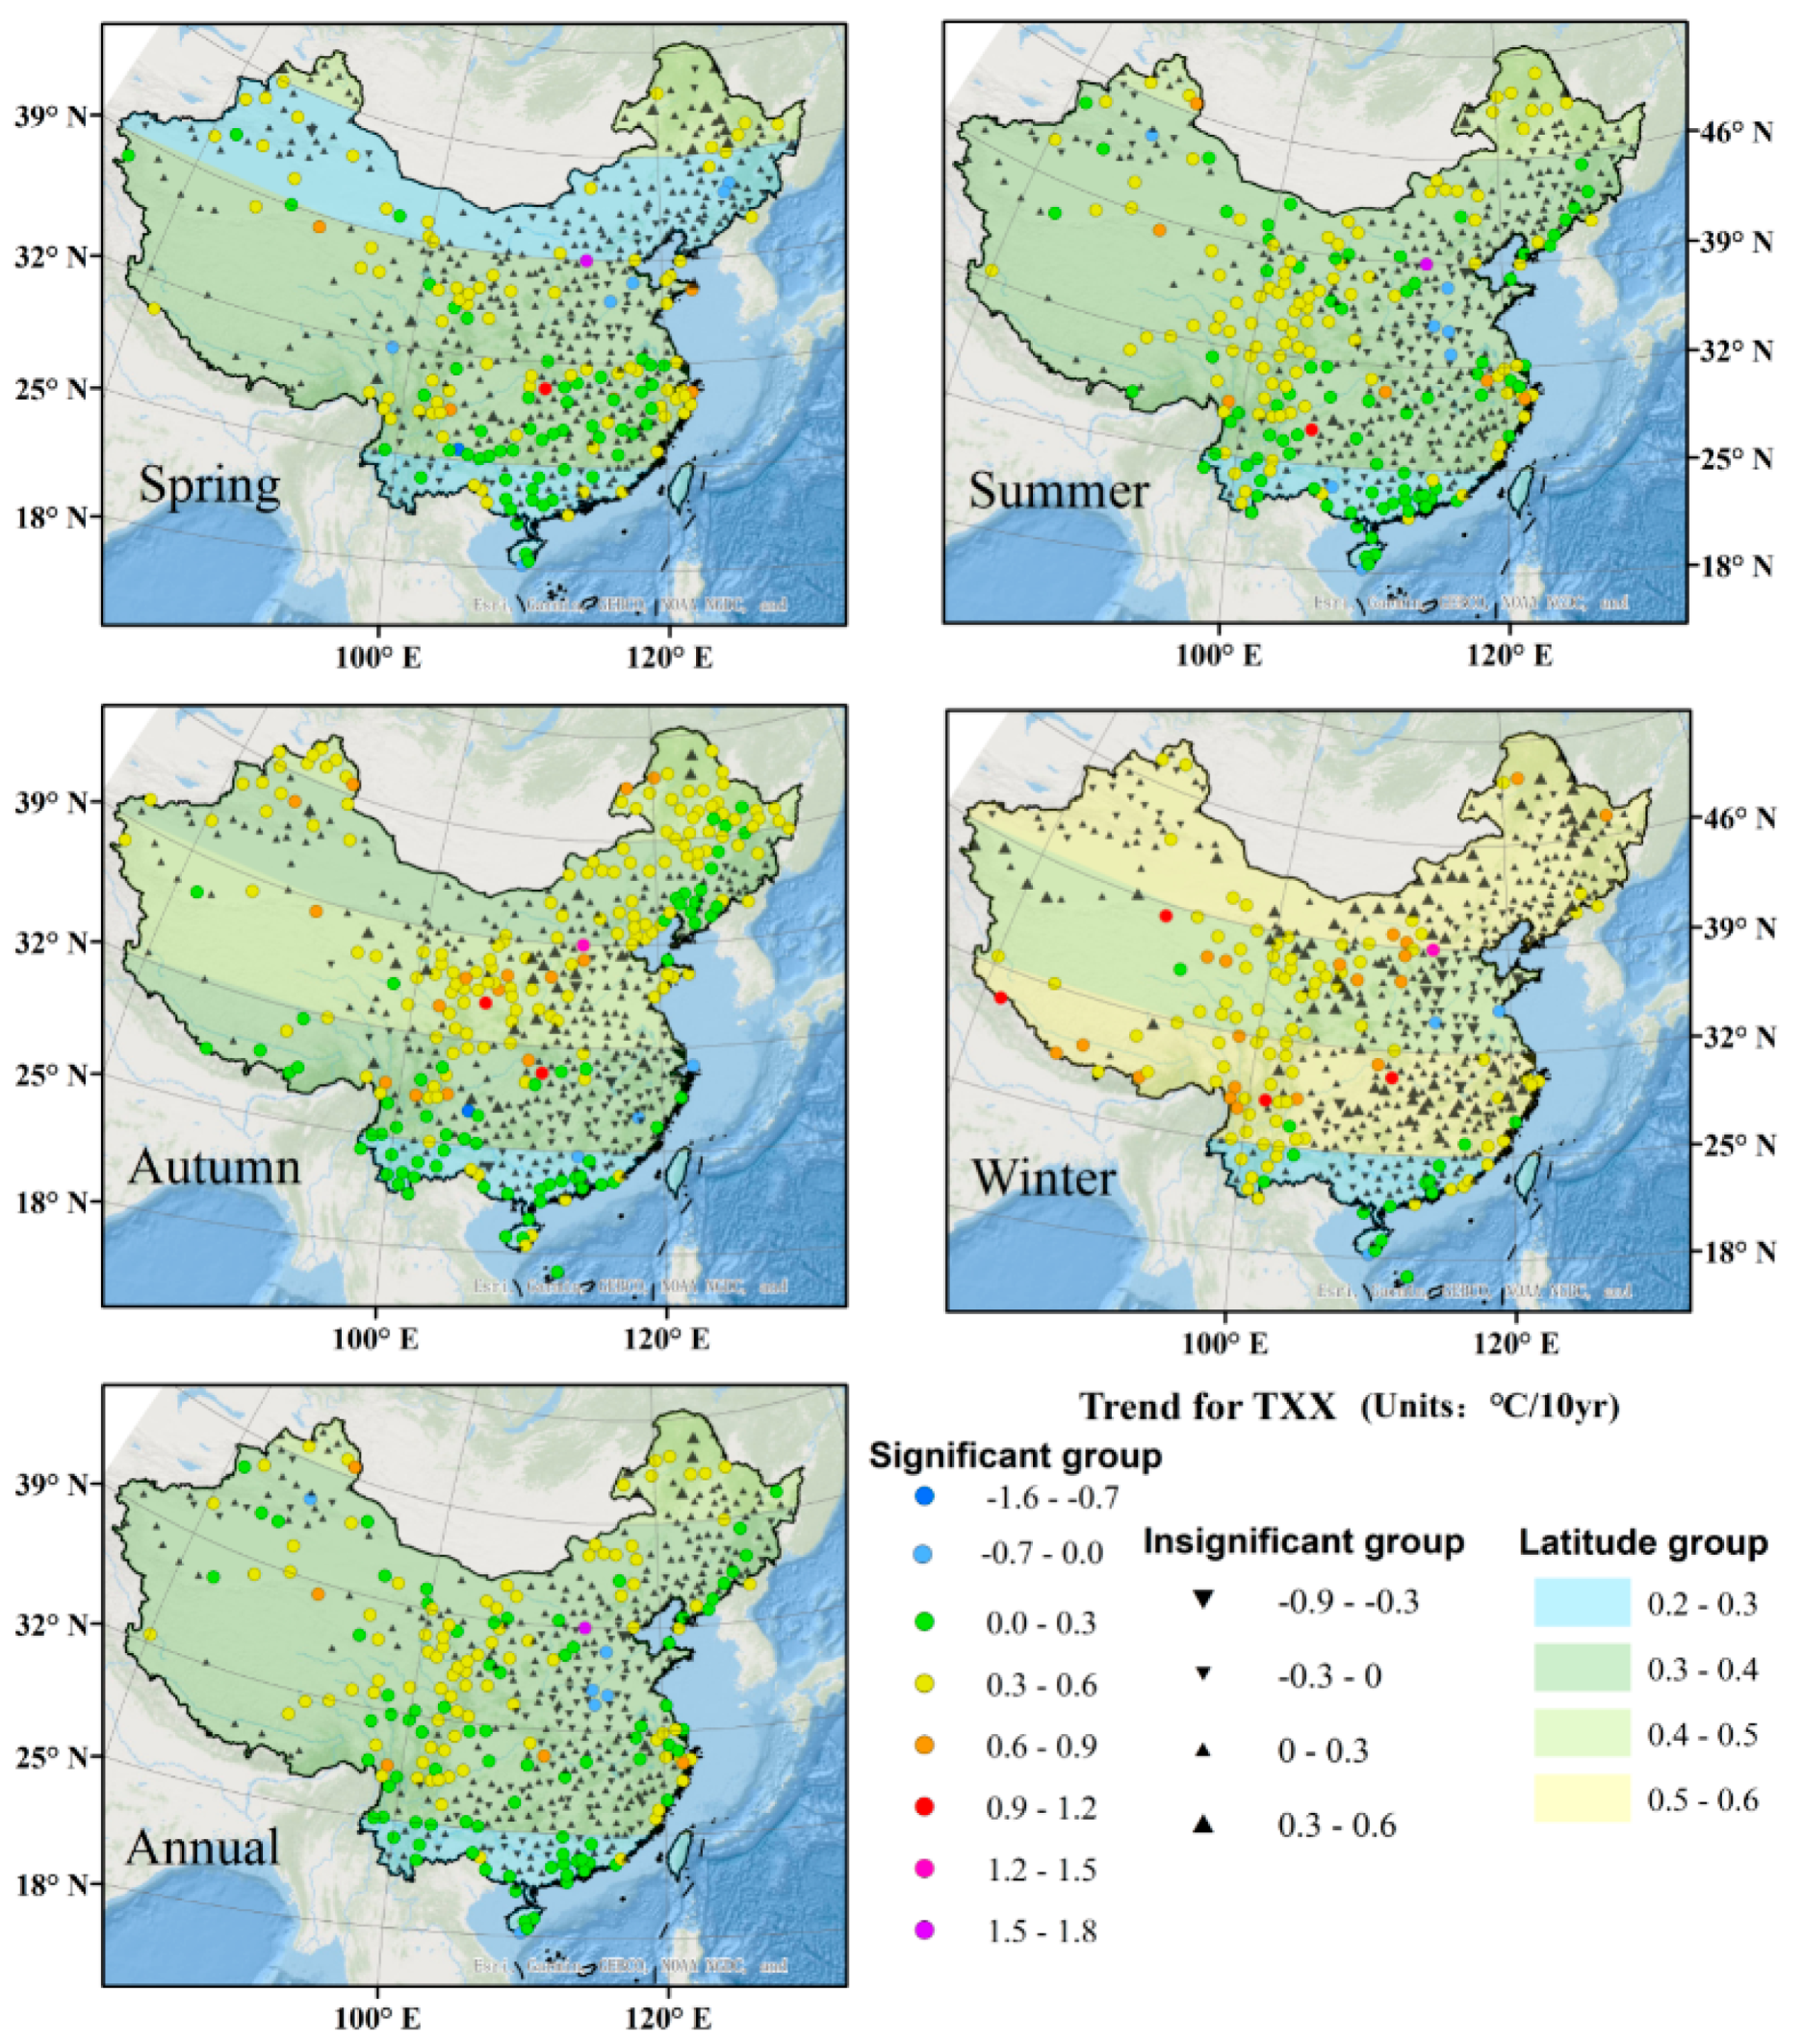
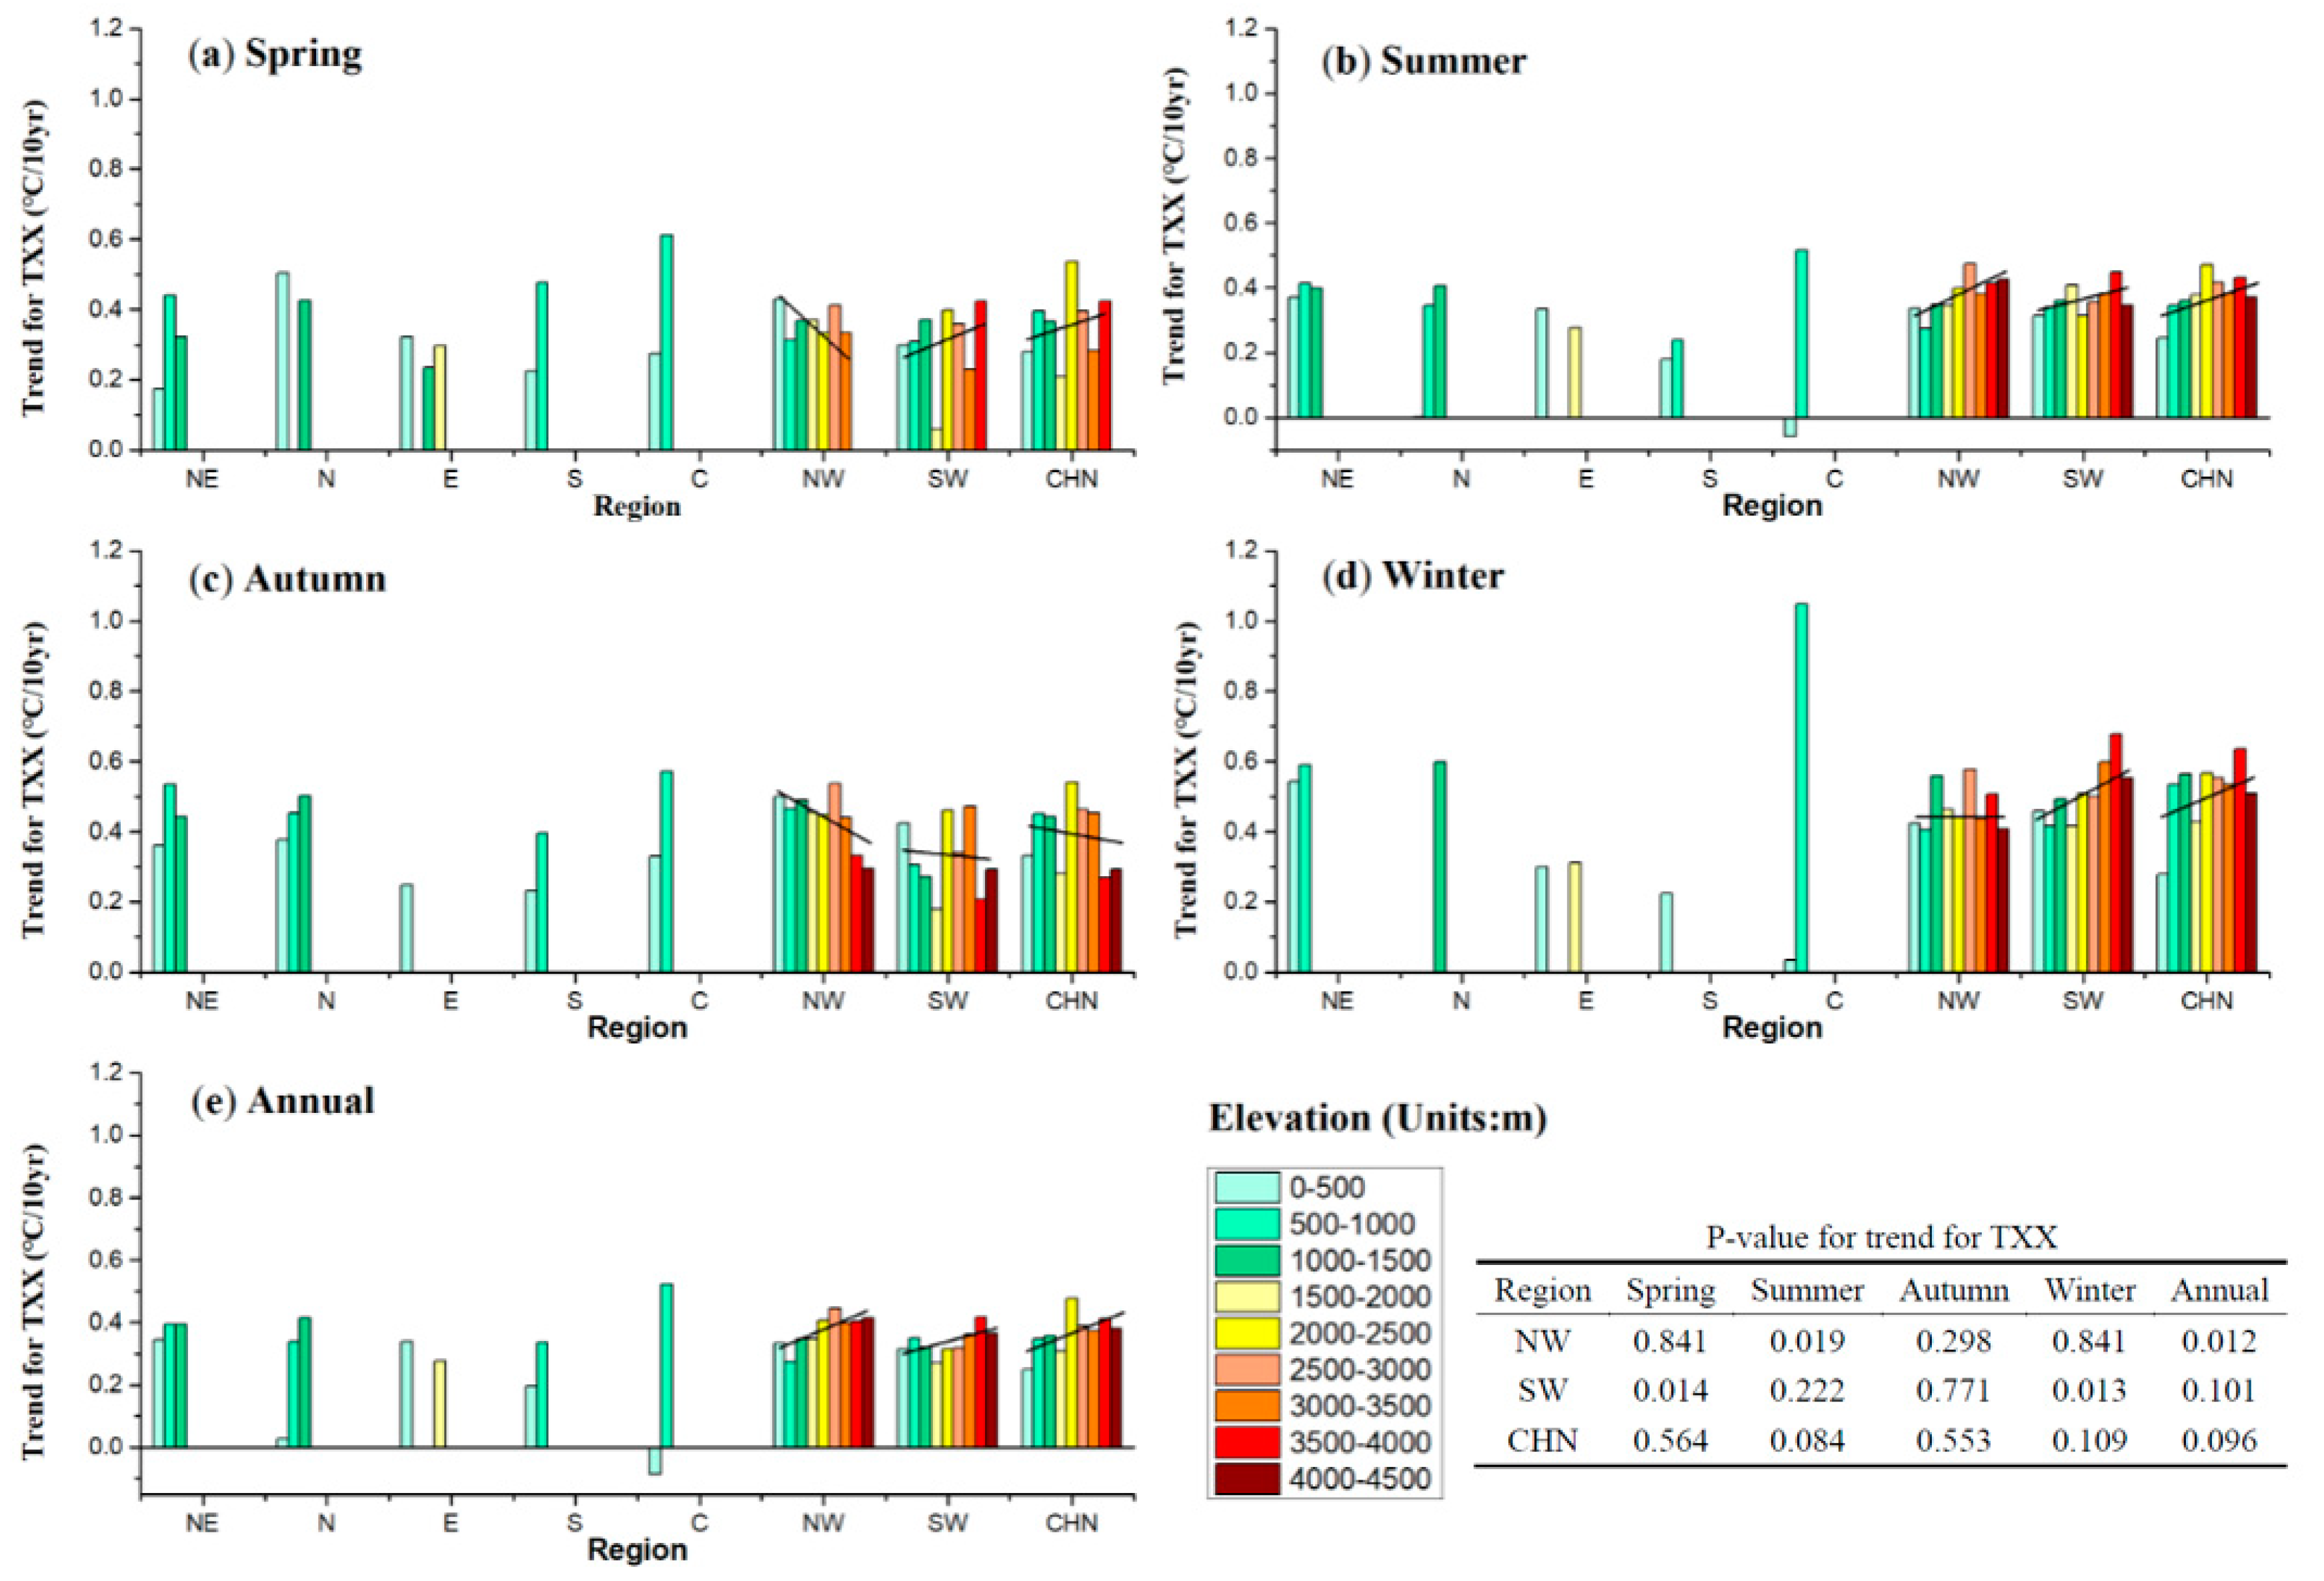
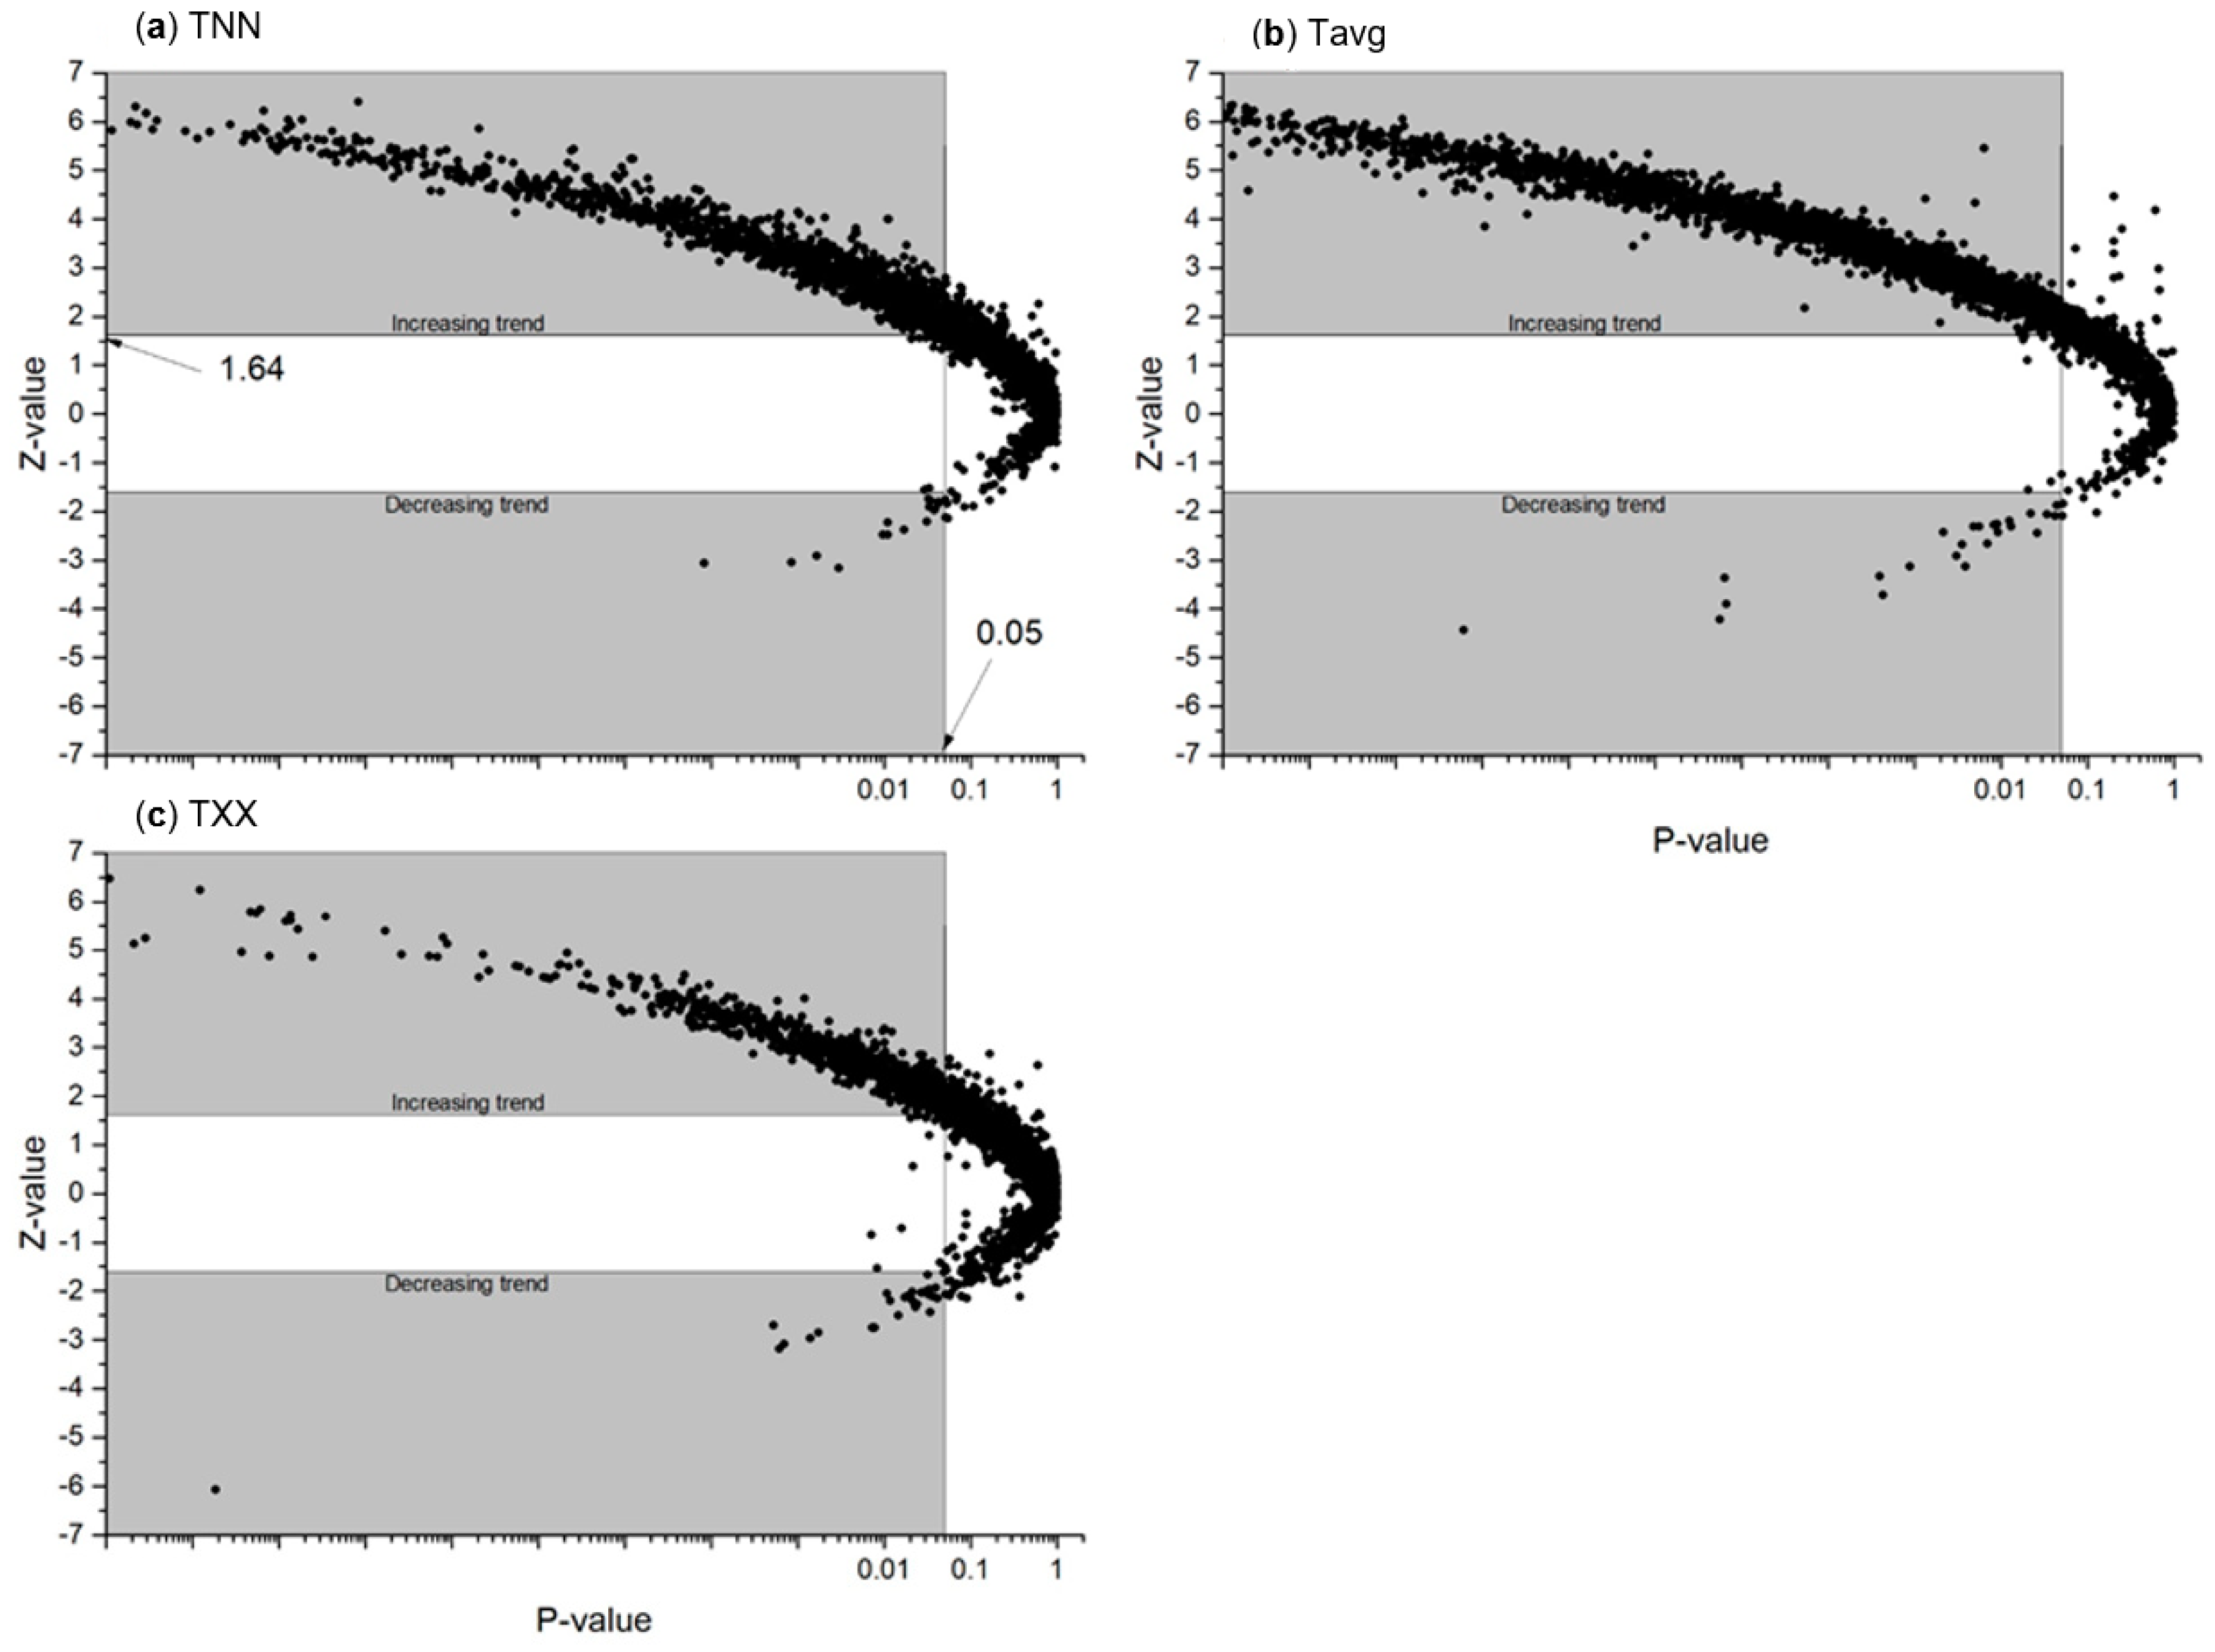
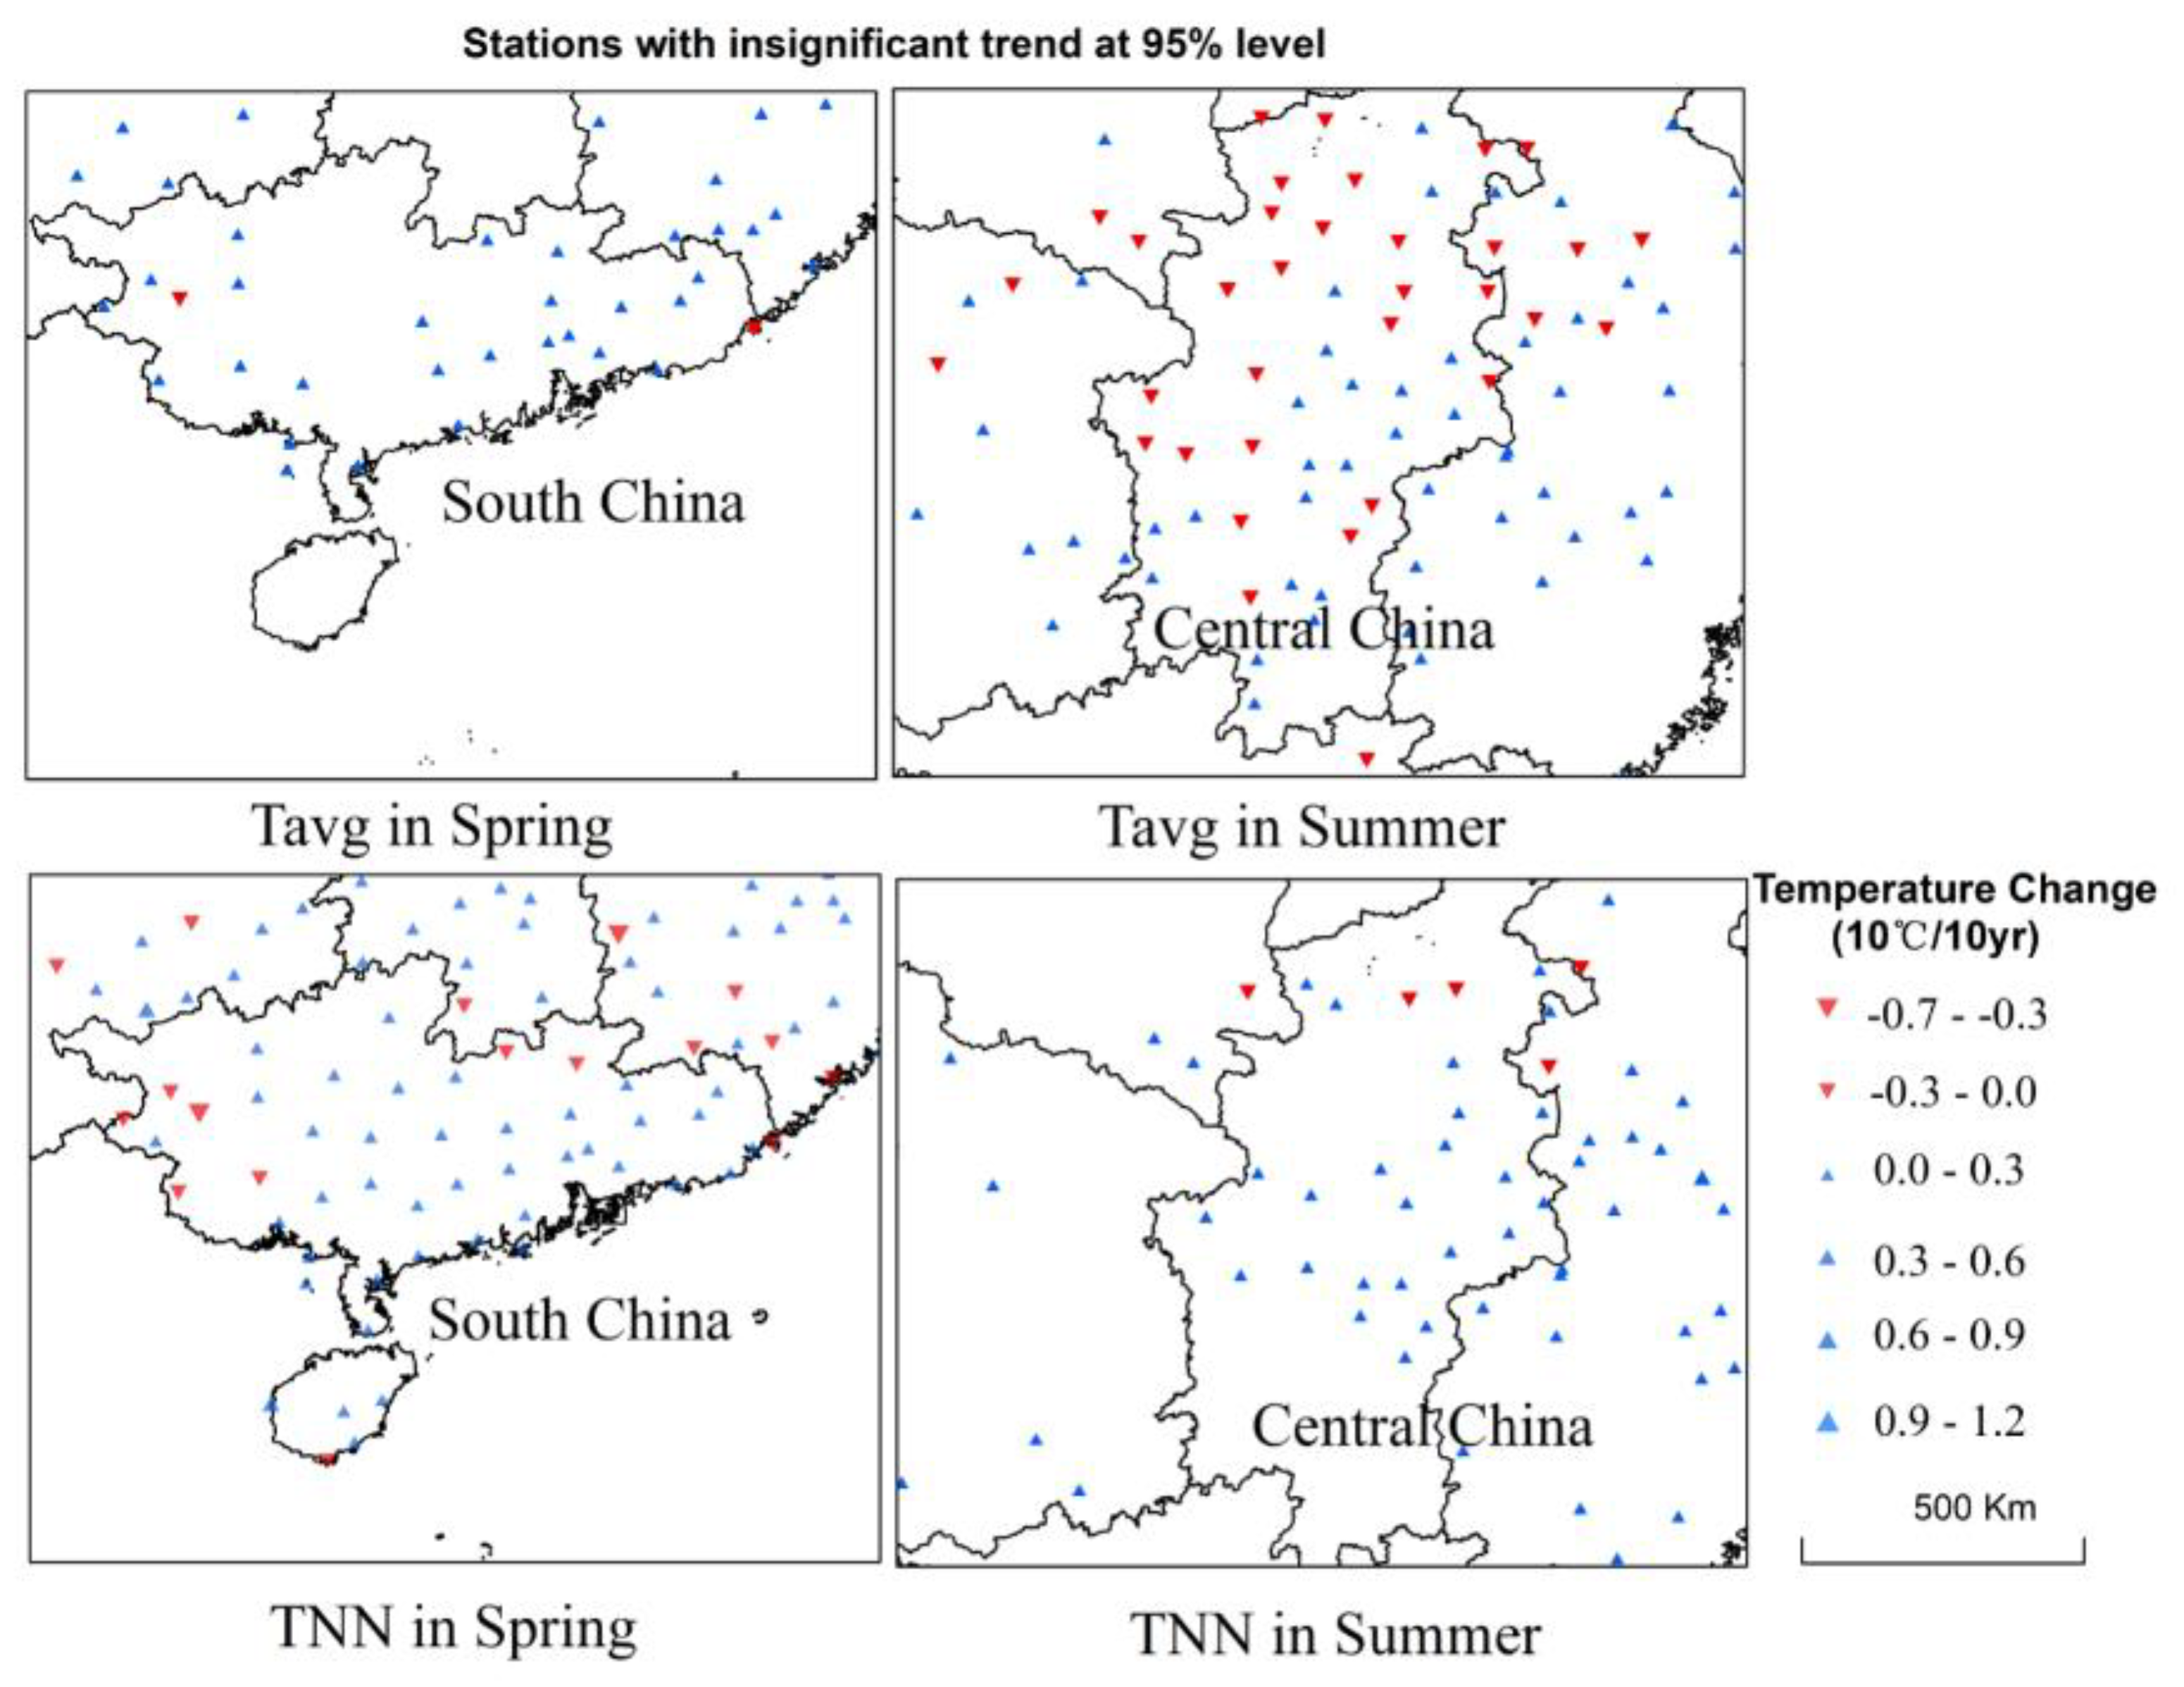
Table 1.
Definition of temperature indices.
| Index | Abbreviation | Definition (Unit) |
|---|---|---|
| Extreme minimum temperature | TNN | Monthly lowest temperature (°C) |
| Extreme maximum temperature | TXX | Monthly highest temperature (°C) |
| Mean temperature | Tavg | Monthly mean value of average of daily temperature (°C) |
Table 2.
Rate of the change of extreme minimum temperature (TNN) in each region in China, 1960–2016 (unit: °C per decade−1).
Table 2.
Rate of the change of extreme minimum temperature (TNN) in each region in China, 1960–2016 (unit: °C per decade−1).
| Region | Spring | Summer | Autumn | Winter | Annual |
|---|---|---|---|---|---|
| Northeast | 0.772 | 0.597 | 0.716 | 0.801 | 0.800 |
| North | 0.750 | 0.646 | 0.763 | 0.793 | 0.772 |
| Northwest | 0.782 | 0.638 | 0.838 | 0.756 | 0.759 |
| Southwest | 0.610 | 0.405 | 0.559 | 0.537 | 0.538 |
| Central | 0.432 | 0.321 | 0.502 | 0.531 | 0.528 |
| East | 0.437 | 0.390 | 0.564 | 0.482 | 0.480 |
| South | 0.334 | 0.313 | 0.489 | 0.415 | 0.411 |
| China | 0.677 | 0.513 | 0.666 | 0.621 | 0.618 |
Table 3.
Latitudinal zonality for the increasing trend for TNN (°C per decade−1) in China, 1960–2016.
Table 3.
Latitudinal zonality for the increasing trend for TNN (°C per decade−1) in China, 1960–2016.
| Latitude Zone | Spring | Summer | Autumn | Winter | Annual |
|---|---|---|---|---|---|
| 46–53° N | 0.947 | 0.677 | 0.817 | 0.843 | 0.842 |
| 39–46° N | 0.789 | 0.611 | 0.830 | 0.813 | 0.809 |
| 32–39° N | 0.607 | 0.577 | 0.704 | 0.675 | 0.671 |
| 25–32° N | 0.511 | 0.361 | 0.542 | 0.489 | 0.490 |
| 18–25° N | 0.527 | 0.315 | 0.494 | 0.417 | 0.415 |
Table 4.
The urban-related effect on trend of TNN (°C per decade−1).
| Region | Spring | Summer | Autumn | Winter | Annual | ||||||
|---|---|---|---|---|---|---|---|---|---|---|---|
| UE1 | UE2 | UE1 | UE2 | UE1 | UE2 | UE1 | UE2 | UE1 | UE2 | ||
| Northeast | UE | 0.051 | 0.016 | 0.137 | 0.116 | 0.005 | 0.05 | 0.092 | 0.031 | 0.101 | 0.030 |
| UC (%) | 6.5 | 2.0 | 19.7 | 16.7 | 1.1 | 6.7 | 11.0 | 3.7 | 12.0 | 3.6 | |
| North | UE | 0.076 | 0.061 | 0.058 | 0.224 | 0.16 | 0.209 | 0.294 | 0.431 | 0.265 | 0.404 |
| UC (%) | 9.6 | 9.8 | 7.3 | 28.1 | 17.8 | 23.2 | 27.6 | 40.5 | 26.0 | 39.4 | |
| East | UE | - | 0.069 | 0.101 | 0.037 | - | 0.049 | - | 0.105 | - | 0.099 |
| UC (%) | - | 14.0 | 24.0 | 8.8 | - | 8.1 | - | 18.2 | - | 17.4 | |
| South | UE | - | 0.028 | 0.176 | 0.101 | 0.079 | 0.024 | 0.107 | 0.094 | 0.102 | 0.100 |
| UC (%) | - | 8.0 | 41.7 | 24.0 | 15.6 | 5.0 | 21.2 | 18.7 | 20.1 | 19.8 | |
| Central | UE | 0.234 | 0.164 | 0.118 | 0.116 | 0.071 | 0.048 | 0.029 | 0.035 | 0.055 | 0.021 |
| UC (%) | 40.0 | 28.0 | 28.6 | 28.1 | 13.0 | 8.7 | 5.2 | 6.2 | 10.2 | 3.8 | |
| Northwest | UE | 0.137 | - | 0.194 | 0.123 | 0.143 | 0.076 | 0.243 | 0.019 | 0.244 | 0.016 |
| UC (%) | 16.1 | - | 24.4 | 25.5 | 15.9 | 8.4 | 27.8 | 2.0 | 28.0 | 1.9 | |
| Southwest | UE | 0.118 | 0.305 | −0.15 | 0.003 | 0.169 | 0.356 | −0.16 | −0.03 | −0.17 | −0.02 |
| UC (%) | 14.6 | 37.7 | −42.7 | 1.1 | 20.8 | 43.8 | −37.1 | −5.6 | −37.8 | −4.7 | |
| China | UE | 0.041 | 0.053 | 0.038 | 0.090 | 0.023 | 0.059 | 0.110 | 0.132 | 0.098 | 0.121 |
| UC (%) | 5.8 | 7.5 | 6.6 | 15.7 | 3.2 | 8.4 | 15.1 | 18.1 | 13.7 | 17.0 | |
Some regions do not have rural stations or suburban stations on certain time scales, the corresponding data are blank, indicated by “-”.
Table 5.
Rate of mean temperature (Tavg) change in each region in China, 1960–2016 (°C per decade−1).
Table 5.
Rate of mean temperature (Tavg) change in each region in China, 1960–2016 (°C per decade−1).
| Region | Spring | Summer | Autumn | Winter | Annual |
|---|---|---|---|---|---|
| Northeast | 0.360 | 0.277 | 0.287 | 0.432 | 0.312 |
| North | 0.365 | 0.227 | 0.277 | 0.483 | 0.323 |
| Northwest | 0.332 | 0.276 | 0.366 | 0.451 | 0.341 |
| Southwest | 0.227 | 0.221 | 0.263 | 0.352 | 0.243 |
| Central | 0.300 | 0.043 | 0.213 | 0.271 | 0.193 |
| East | 0.311 | 0.174 | 0.222 | 0.287 | 0.222 |
| South | 0.160 | 0.142 | 0.222 | 0.236 | 0.165 |
| China | 0.314 | 0.233 | 0.280 | 0.379 | 0.272 |
Table 6.
Latitudinal zonality for the increasing trend for Tavg in mainland China, 1960–2016 (°C per decade−1).
Table 6.
Latitudinal zonality for the increasing trend for Tavg in mainland China, 1960–2016 (°C per decade−1).
| Latitude Zone | Spring | Summer | Autumn | Winter | Annual |
|---|---|---|---|---|---|
| 46–35° N | 0.417 | 0.338 | 0.351 | 0.507 | 0.370 |
| 39–46° N | 0.345 | 0.248 | 0.310 | 0.437 | 0.313 |
| 32–39° N | 0.335 | 0.254 | 0.306 | 0.408 | 0.303 |
| 25–32° N | 0.260 | 0.197 | 0.235 | 0.298 | 0.216 |
| 18–25° N | 0.186 | 0.153 | 0.221 | 0.262 | 0.177 |
Table 7.
Urban-related effect on Tavg (°C per decade−1) change in China, 1960–2016.
| Region | Spring | Summer | Autumn | Winter | Annual | ||||||
|---|---|---|---|---|---|---|---|---|---|---|---|
| UE1 | UE2 | UE1 | UE2 | UE1 | UE2 | UE1 | UE2 | UE1 | UE2 | ||
| Northeast | UE | 0.046 | 0.047 | 0.035 | 0.015 | 0.050 | 0.041 | 0.006 | 0.02 | 0.061 | 0.049 |
| UC (%) | 11.6 | 11.8 | 12.1 | 5.2 | 15.6 | 12.8 | 1.4 | 4.7 | 17.2 | 13.8 | |
| North | UE | 0.119 | 0.107 | 0.006 | 0.026 | 0.016 | 0.076 | 0.106 | 0.107 | 0.088 | 0.088 |
| UC (%) | 26.3 | 23.6 | 2.5 | 10.7 | 4.9 | 23.1 | 18.8 | 19.0 | 22.4 | 22.4 | |
| East | UE | 0.101 | 0.013 | 0.049 | 0.000 | 0.016 | 0.037 | 0.084 | 0.070 | 0.054 | 0.037 |
| UC (%) | 30.9 | 4.0 | 28.0 | 0.0 | 6.3 | 14.6 | 24.1 | 20.1 | 21.1 | 14.5 | |
| South | UE | 0.123 | 0.056 | 0.108 | 0.063 | 0.129 | 0.103 | 0.062 | 0.038 | 0.135 | 0.088 |
| UC (%) | 55.2 | 25.1 | 50.9 | 29.7 | 40.0 | 31.9 | 22.6 | 13.9 | 52.3 | 34.1 | |
| Central | UE | 0.052 | 0.099 | - | 0.086 | 0.034 | 0.078 | 0.043 | 0.072 | 0.052 | 0.094 |
| UC (%) | 13.9 | 26.5 | - | 74.1 | 12.5 | 28.8 | 13.5 | 22.6 | 19.4 | 35.2 | |
| Northwest | UE | 0.158 | 0.120 | −0.01 | 0.040 | 0.092 | 0.085 | 0.303 | 0.240 | 0.153 | 0.134 |
| UC (%) | 33.7 | 25.6 | −4.5 | 13.8 | 20.3 | 18.8 | 42.3 | 33.5 | 31.7 | 27.8 | |
| Southwest | UE | −0.045 | 0.084 | −0.05 | 0.002 | −0.05 | 0.009 | −0.02 | 0.085 | −0.05 | 0.048 |
| UC (%) | −18.5 | 34.6 | −23.0 | 1.0 | −19.6 | 3.7 | −6.1 | 22.6 | −20.1 | 19.7 | |
| China | UE | 0.065 | 0.063 | −0.02 | 0.012 | 0.000 | 0.040 | 0.029 | 0.060 | 0.031 | 0.063 |
| UC (%) | 17.7 | 17.1 | −9.2 | 5.3 | 0.0 | 13.3 | 6.9 | 14.3 | 9.8 | 19.8 | |
Some regions do not have rural stations or suburban stations on certain time scales, the corresponding data are blank, indicated by “-”.
Table 8.
Extreme maximum temperature (TXX) changes in each region in China, 1960–2016 (unit: °C per decade−1).
Table 8.
Extreme maximum temperature (TXX) changes in each region in China, 1960–2016 (unit: °C per decade−1).
| Region | Spring | Summer | Autumn | Winter | Annual |
|---|---|---|---|---|---|
| Northeast | 0.230 | 0.391 | 0.392 | 0.574 | 0.371 |
| North | 0.452 | 0.264 | 0.430 | 0.597 | 0.280 |
| Northwest | 0.365 | 0.360 | 0.470 | 0.496 | 0.357 |
| Southwest | 0.278 | 0.364 | 0.297 | 0.514 | 0.330 |
| Central | 0.322 | 0.133 | 0.436 | 0.371 | 0.087 |
| East | 0.319 | 0.330 | 0.249 | 0.300 | 0.336 |
| South | 0.250 | 0.182 | 0.245 | 0.224 | 0.209 |
| China | 0.317 | 0.332 | 0.380 | 0.469 | 0.325 |
Table 9.
Latitudinal zonality for the increasing trend for TXX (°C per decade−1) in China, 1960–2016.
Table 9.
Latitudinal zonality for the increasing trend for TXX (°C per decade−1) in China, 1960–2016.
| Latitude Zone | Spring | Summer | Autumn | Winter | Annual |
|---|---|---|---|---|---|
| 46–53° N | 0.407 | 0.490 | 0.453 | 0.539 | 0.456 |
| 39–46° N | 0.284 | 0.315 | 0.370 | 0.511 | 0.316 |
| 32–39° N | 0.379 | 0.348 | 0.493 | 0.485 | 0.343 |
| 25–32° N | 0.315 | 0.378 | 0.307 | 0.538 | 0.346 |
| 18–25° N | 0.247 | 0.209 | 0.229 | 0.262 | 0.205 |
Table 10.
Urbanization aggrandizement effect on TXX (°C per decade−1) change in China, 1960–2016.
| Region | Spring | Summer | Autumn | Winter | Annual | ||||||
|---|---|---|---|---|---|---|---|---|---|---|---|
| UE1 | UE2 | UE1 | UE2 | UE1 | UE2 | UE1 | UE2 | UE1 | UE2 | ||
| Northeast | UE | - | - | −0.04 | −0.07 | −0.03 | −0.04 | 0.014 | −0.07 | −0.11 | −0.10 |
| UC (%) | - | - | −12.3 | −21.7 | −7.9 | −12.4 | 2.5 | −11.7 | −40.7 | −38.7 | |
| North | UE | - | 0.077 | 0.037 | - | −0.02 | 0.036 | 0.209 | 0.000 | - | 0.066 |
| UC (%) | - | 15.3 | 9.5 | - | −4.6 | 7.9 | 31.7 | 0.000 | - | 15.4 | |
| East | UE | 0.087 | 0.032 | 0.110 | 0.060 | - | 0.132 | 0.185 | 0.122 | 0.112 | 0.056 |
| UC (%) | 24.7 | 9.2 | 28.4 | 15.6 | - | 36.1 | 37.3 | 24.6 | 28.7 | 14.4 | |
| South | UE | 0.303 | 0.253 | 0.138 | 0.145 | 0.206 | 0.275 | 0.272 | 0.152 | 0.267 | 0.237 |
| UC (%) | 61.2 | 51.0 | 44.7 | 46.8 | 42.8 | 57.1 | 65.3 | 36.5 | 61.3 | 54.4 | |
| Central | UE | −0.005 | 0.036 | −0.06 | - | - | - | - | - | - | - |
| UC (%) | −1.7 | 12.4 | −35.6 | - | - | - | - | - | - | - | |
| Northwest | UE | 0.130 | 0.133 | −0.04 | 0.054 | 0.164 | 0.126 | 0.076 | 0.071 | −0.03 | 0.056 |
| UC (%) | 26.4 | 27.1 | −10.4 | 14.9 | 27.0 | 20.6 | 13.4 | 12.5 | −8.5 | 15.4 | |
| Southwest | UE | - | - | −0.06 | −0.05 | −0.11 | 0.015 | −0.24 | −0.09 | −0.11 | −0.06 |
| UC (%) | - | - | −18.3 | −14.8 | −45.6 | 6.1 | −71.9 | −27.5 | −44.9 | −22.3 | |
| China | UE | 0.064 | 0.131 | −0.11 | −0.08 | 0.013 | 0.056 | −0.03 | 0.028 | −0.01 | 0.032 |
| UC (%) | 15.4 | 31.5 | −45.3 | −31.6 | 3.3 | 13.7 | −5.6 | 6.1 | −2.1 | 9.5 | |
Some regions do not have rural stations or suburban stations on certain time scales, the corresponding data are blank, indicated by “-”.
Table 11.
Table with compilation of the number of station types in particular regions. The numbers outside the brackets represent stations with significant trends; the numbers inside the brackets represent the stations without significant trends.
Table 11.
Table with compilation of the number of station types in particular regions. The numbers outside the brackets represent stations with significant trends; the numbers inside the brackets represent the stations without significant trends.
| Region | Group | Spring | Summer | Autumn | Winter | Annual | ||||||||||
|---|---|---|---|---|---|---|---|---|---|---|---|---|---|---|---|---|
| TNN | Tavg | TXX | TNN | Tavg | TXX | TNN | Tavg | TXX | TNN | Tavg | TXX | TNN | Tavg | TXX | ||
| Northeast | Urban | 8 (1) | 9 (0) | 0 (9) | 9 (0) | 9 (0) | 2 (7) | 5 (4) | 9 (0) | 8 (1) | 2 (7) | 9 (0) | 0 (9) | 7 (2) | 9 (0) | 1 (8) |
| Suburban | 40 (30) | 68 (2) | 11 (59) | 58 (12) | 57 (13) | 16 (54) | 27 (43) | 57 (13) | 40 (30) | 30 (40) | 56 (14) | 6 (64) | 43 (27) | 69 (1) | 18 (52) | |
| Rural | 13 (13) | 24 (2) | 1 (25) | 22 (4) | 23 (3) | 6 (20) | 6 (20) | 22 (4) | 18 (8) | 15 (11) | 20 (6) | 0 (26) | 14 (12) | 26 (0) | 7 (19) | |
| North | Urban | 6 (2) | 8 (0) | 1 (7) | 8 (0) | 8 (0) | 2 (6) | 7 (1) | 8 (0) | 2 (6) | 1 (7) | 8 (0) | 1 (7) | 7 (1) | 8 (0) | 2 (6) |
| Suburban | 11 (18) | 28 (1) | 2 (27) | 22 (7) | 19 (10) | 5 (24) | 14 (15) | 23 (6) | 15 (14) | 17 (12) | 24 (5) | 4 (25) | 16 (13) | 26 (3) | 6 (23) | |
| Rural | 3 (4) | 7 (0) | 1 (6) | 6 (1) | 6 (1) | 1 (6) | 4 (3) | 5 (2) | 2 (5) | 1 (6) | 7 (0) | 3 (4) | 6 (1) | 7 (0) | 1 (6) | |
| East | Urban | 4 (6) | 10 (0) | 3 (7) | 9 (1) | 6 (4) | 2 (8) | 8 (2) | 9 (1) | 1 (9) | 5 (5) | 9 (1) | 1 (9) | 7 (3) | 10 (0) | 2 (8) |
| Suburban | 16 (59) | 62 (13) | 31 (44) | 42 (33) | 41 (34) | 17 (58) | 54 (21) | 68 (7) | 9 (66) | 54 (21) | 69 (6) | 6 (69) | 55 (20) | 73 (2) | 16 (59) | |
| Rural | 0 (4) | 4 (0) | 2 (2) | 1 (3) | 2 (2) | 1 (3) | 3 (1) | 4 (0) | 0 (4) | 4 (0) | 4 (0) | 1 (3) | 0 (4) | 4 (0) | 1 (3) | |
| South | Urban | 0 (3) | 3 (0) | 2 (1) | 3 (0) | 3 (0) | 3 (0) | 3 (0) | 3 (0) | 2 (1) | 1 (2) | 3 (0) | 1 (2) | 3 (0) | 3 (0) | 2 (1) |
| Suburban | 1 (36) | 17 (20) | 11 (26) | 29 (8) | 31 (6) | 17 (20) | 20 (17) | 33 (4) | 16 (21) | 27 (10) | 18 (19) | 7 (30) | 31 (6) | 33 (4) | 12 (25) | |
| Rural | 1 (10) | 5 (6) | 7 (4) | 8 (3) | 11 (0) | 8 (3) | 5 (6) | 10 (1) | 5 (6) | 10 (1) | 5 (6) | 6 (5) | 8 (3) | 11 (0) | 8 (3) | |
| Central | Urban | 3 (2) | 5 (0) | 1 (4) | 5 (0) | 3 (2) | 1 (4) | 3 (2) | 5 (0) | 0 (5) | 2 (3) | 5 (0) | 0 (5) | 5 (0) | 5 (0) | 1 (4) |
| Suburban | 8 (27) | 34 (1) | 8 (27) | 19 (16) | 3 (32) | 2 (33) | 12 (23) | 27 (8) | 5 (30) | 23 (12) | 23 (12) | 2 (33) | 25 (10) | 32 (3) | 3 (32) | |
| Rural | 5 (9) | 13 (1) | 5 (9) | 5 (9) | 3 (11) | 3 (11) | 5 (9) | 10 (4) | 4 (10) | 9 (5) | 9 (5) | 1 (13) | 8 (6) | 12 (2) | 3 (11) | |
| Northwest | Urban | 0 (2) | 2 (0) | 1 (1) | 2 (0) | 2 (0) | 1 (1) | 2 (0) | 2 (0) | 2 (0) | 0 (2) | 2 (0) | 1 (1) | 2 (0) | 2 (0) | 1 (1) |
| Suburban | 23 (41) | 59 (5) | 16 (48) | 55 (9) | 53 (11) | 25 (39) | 48 (16) | 59 (5) | 28 (36) | 33 (31) | 54 (10) | 19 (45) | 32 (32) | 60 (4) | 19 (45) | |
| Rural | 22 (35) | 54 (3) | 17 (40) | 53 (4) | 53 (4) | 31 (26) | 38 (19) | 55 (2) | 28 (29) | 40 (17) | 48 (9) | 18 (39) | 30 (27) | 57 (0) | 24 (33) | |
| Southwest | Urban | 2 (1) | 3 (0) | 0 (3) | 3 (0) | 3 (0) | 3 (0) | 1 (2) | 3 (0) | 1 (2) | 2 (1) | 2 (1) | 2 (1) | 3 (0) | 3 (0) | 2 (1) |
| Suburban | 23 (25) | 28 (20) | 17 (31) | 37 (11) | 36 (12) | 27 (21) | 26 (22) | 39 (9) | 25 (23) | 31 (17) | 30 (18) | 20 (28) | 34 (14) | 40 (8) | 17 (31) | |
| Rural | 25 (13) | 31 (7) | 12 (26) | 28 (10) | 35 (3) | 25 (13) | 29 (9) | 36 (2) | 22 (16) | 19 (19) | 37 (1) | 28 (10) | 30 (8) | 37 (1) | 21 (17) | |
| China | Urban | 23 (17) | 40 (0) | 8 (32) | 39 (1) | 33 (7) | 14 (26) | 29 (11) | 39 (1) | 16 (24) | 13 (27) | 38 (2) | 7 (33) | 34 (6) | 40 (0) | 12 (28) |
| Suburban | 122 (236) | 296 (62) | 96 (262) | 262 (96) | 240 (118) | 109 (249) | 201 (157) | 306 (52) | 138 (220) | 215 (143) | 274 (84) | 66 (292) | 236 (122) | 333 (25) | 99 (259) | |
| Rural | 69 (88) | 138 (19) | 45 (112) | 123 (34) | 133 (24) | 75 (82) | 90 (67) | 142 (15) | 79 (78) | 98 (59) | 130 (27) | 57 (100) | 96 (61) | 154 (3) | 74 (83) | |
Table 12.
Satellite-detected urban expansion in the Pearl River Delta from 1989 to 2017.
| City/County | Urban Area 1989 a (ha) | Urban Area 1997 a (ha) | Urban Area 2017 (ha) | 1989–1997 Change (%) | 1998–2017 Change (%) |
|---|---|---|---|---|---|
| Bao’an | 6403.32 | 21,344.4 | 36,735.66 | 233.3 | 72.1 |
| Dongguan | 18,676.3 | 42,155.2 | 121,326.48 | 125.7 | 187.8 |
| Doumen | 2134.44 | 3735.27 | 12,618.99 | 75.0 | 237.8 |
| Foshan | 6403.32 | 6936.93 | 12,075.03 | 8.3 | 74.1 |
| Guangzhou | 23,478.8 | 28,281.3 | 65,676.15 | 20.5 | 132.2 |
| Jiangmen | 1600.83 | 3735.27 | 72,820.17 | 133.3 | 1849.5 |
| Nanhai | 13,340.3 | 21,344.4 | 64,879.02 | 60.0 | 204.0 |
| Panyu | 7470.54 | 8537.76 | 51,421.68 | 14.3 | 502.3 |
| Sanshui | 2134.44 | 2134.44 | 28,346.67 | 0.0 | 1228.1 |
| Shenzhen | 1049.76 | 4268.88 | 37,476 | 306.7 | 777.9 |
| Shunde | 6403.32 | 10,138.6 | 46,668.71 | 58.3 | 360.3 |
| Xinhui | 5869.71 | 7470.54 | 23,119.74 | 27.3 | 209.5 |
| Zengcheng | 5869.71 | 5869.71 | 20,997.09 | 0.0 | 257.7 |
| Zhongshan | 13,340.3 | 16,541.9 | 69,787.26 | 24.0 | 321.9 |
| Zhuhai | 533.61 | 6403.32 | 27,066.24 | 1100.0 | 322.7 |
a The data for the years of 1989 and 1997 was collected from Weng’s study [63].
Table 13.
Comparison of annual and seasonal temperature trends based on different studies.
| Study Period | CRUTEM3v for East China a | |||||
|---|---|---|---|---|---|---|
| Annual | Spring | Summer | Autumn | Winter | ||
| Period 1951–2004 | 0.25 | 0.29 | 0.13 | 0.17 | 0.42 | |
| Period 1954–1983 | 0.15 | 0.21 | 0.02 | 0.09 | 0.27 | |
| Period 1981–2004 | 0.57 | 0.64 | 0.47 | 0.38 | 0.81 | |
| Li & Li-728 for East China b | ||||||
| Period 1951–2004 | 0.22 | 0.22 | 0.11 | 0.17 | 0.37 | |
| Period 1954–1983 | 0.12 | 0.16 | 0.05 | 0.06 | 0.20 | |
| Period 1981–2004 | 0.51 | 0.57 | 0.31 | 0.43 | 0.74 | |
| HadSST2 for East China a | ||||||
| Period 1951–2004 | 0.14 | 0.15 | 0.11 | 0.13 | 0.16 | |
| Period 1954–1983 | 0.02 | 0.03 | 0.00 | 0.11 | −0.03 | |
| Period 1981–2004 | 0.60 | 0.89 | 0.26 | 0.32 | 0.92 | |
| This study for entire mainland China | ||||||
| Period 1960–2016 | 0.27 | 0.31 | 0.23 | 0.28 | 0.38 | |
| urban–related effect for Period 1960–2016 based on Tavg | UE1 | 0.031 | 0.065 | −0.020 | 0.000 | 0.029 |
| UE2 | 0.063 | 0.063 | 0.012 | 0.040 | 0.060 | |
| Period 1996–2016 | 0.359 | 0.648 | 0.411 | 0.465 | 0.289 | |
| Urban–related effect for Period 1996–2016 based on Tavg | UE1 | 0.013 | 0.140 | 0.080 | 0.016 | / |
| UE2 | 0.16 | 0.09 | 0.15 | 0.20 | / | |
© 2020 by the authors. Licensee MDPI, Basel, Switzerland. This article is an open access article distributed under the terms and conditions of the Creative Commons Attribution (CC BY) license (http://creativecommons.org/licenses/by/4.0/).
Share and Cite
MDPI and ACS Style
Qiu, J.; Yang, X.; Cao, B.; Chen, Z.; Li, Y. Effects of Urbanization on Regional Extreme-Temperature Changes in China, 1960–2016. Sustainability 2020, 12, 6560. https://0-doi-org.brum.beds.ac.uk/10.3390/su12166560
AMA Style
Qiu J, Yang X, Cao B, Chen Z, Li Y. Effects of Urbanization on Regional Extreme-Temperature Changes in China, 1960–2016. Sustainability. 2020; 12(16):6560. https://0-doi-org.brum.beds.ac.uk/10.3390/su12166560
Chicago/Turabian StyleQiu, Junliang, Xiankun Yang, Bowen Cao, Zhilong Chen, and Yuxuan Li. 2020. "Effects of Urbanization on Regional Extreme-Temperature Changes in China, 1960–2016" Sustainability 12, no. 16: 6560. https://0-doi-org.brum.beds.ac.uk/10.3390/su12166560
Note that from the first issue of 2016, this journal uses article numbers instead of page numbers. See further details here.