Next Article in Journal
Quantifying Regulating Ecosystem Services with Increased Tree Densities on European Farmland
Next Article in Special Issue
Effect of Urbanization on Ecosystem Service Values in the Beijing-Tianjin-Hebei Urban Agglomeration of China from 2000 to 2014
Previous Article in Journal
A Comparative Automated Text Analysis of Airbnb Reviews in Hong Kong and Singapore Using Latent Dirichlet Allocation
Previous Article in Special Issue
Construction of the Ecological Security Pattern of Urban Agglomeration under the Framework of Supply and Demand of Ecosystem Services Using Bayesian Network Machine Learning: Case Study of the Changsha–Zhuzhou–Xiangtan Urban Agglomeration, China
 
 
Erratum published on 20 April 2021, see Sustainability 2021, 13(8), 4580.
Article

Urbanization Impacts on Natural Habitat and Ecosystem Services in the Guangdong-Hong Kong-Macao “Megacity”

1
State Key Laboratory of Urban and Regional Ecology, Research Center for Eco-Environmental Sciences, Chinese Academy of Sciences, Beijing 100085, China
2
College of Resources and Environment, University of Chinese Academy of Sciences, Beijing 100049, China
3
School of Resources and Environment, Henan University of Economics and Law, Zhengzhou 450046, China
*
Author to whom correspondence should be addressed.
Sustainability 2020, 12(16), 6675; https://0-doi-org.brum.beds.ac.uk/10.3390/su12166675
Submission received: 12 July 2020 / Revised: 15 August 2020 / Accepted: 15 August 2020 / Published: 18 August 2020

Abstract

:
The population aggregation and built-up area expansion caused by urbanization can have significant impacts on the supply and distribution of crucial ecosystem services. The correlation between urbanization and ecosystem services has been well-studied, but additional research is needed to better understand the spatiotemporal interactions between ecosystem services and urbanization processes in highly urbanized areas as well as surrounding rural areas. In this paper, the relationships of urbanization with natural habitat and three key regulating ecosystem services—water retention, soil conservation, and carbon sequestration, were quantified and mapped for the Guangdong-Hong Kong-Macao Greater Bay Area (GBA), a rapidly developing urban agglomeration of over 70 million people, for the period of 2000–2018. Our results showed that urbanization caused a general decline in ecosystem services, and urbanization and ecosystem services exhibited a negative spatial correlation. However, this relationship varied along urban-rural gradients and weak decoupling was the overall trend during the course of the study period, indicating a greater need for the protection and improvement of ecosystem services. Our results provide instructive insights for new urbanization planning to maintain regional ecosystem services and sustainable development in the GBA and other large, rapidly urbanized agglomerations.

1. Introduction

Urbanization is a major driver of environmental change, and socioeconomic development shows little indication of abatement [1]. Approximately 60% of China’s population would reside in urban areas in 2020, and the growth was expected to continue at a relatively rapid rate over the coming decades [2,3]. Overall, urban life enables higher material living standards and better access to education and other social opportunities [4]. However, it is also associated with population agglomeration and built-up land expansion, which has significant implications for environmental sustainability [5,6].Ecosystem services are an important bridge between human welfare and the environment, therefore providing an important framework within which to understand and manage urban sustainability [7,8,9,10]. The assessment and valuation of ecosystem services can be a useful tool for integrating ecosystems and biodiversity into policy-making [11,12]. Ecosystem services can be divided into four general categories: provisioning services, regulating services, cultural services, and supporting services [10]. Although urbanization is a major factor influencing ecosystem services, the exact mechanisms are still debated [13,14].
Many studies have shown that urbanization leads to a decline in ecosystem services, mainly because of the conversion of natural lands into impermeable surfaces [15,16]. However, some studies have found that the opposite may be true. For instance, a positive correlation between population density and agriculture-benefiting ecosystem services was found in China’s Guanzhong-Tianshui region [17]. Additionally, annual average normalized difference vegetation index (NDVI) and ecosystem services can increase during urbanization [18,19,20]. One reason that has been adduced for these results is that the urban heat island effect may accelerate the rate of photosynthesis and prolong the growing season, and artificial greening can promote vegetation activity [21]. Other studies have found that changes in ecosystem services vary with the degree of urbanization [17,22]. Indeed, an inverse ‘U’ shape was even found: ecosystem services increased in the early stage of urbanization and decreased in later stages [23]. The main explanation posited was the fact that natural vegetation growth can offset anthropogenic interference in the earlier stage of urbanization. Nonetheless, ecosystems are unlikely to sustain urbanization pressures over the long run, resulting in the decline of ecosystem services with natural habitat loss [14,24].
There may not be a universally valid conclusion, given the many context-dependent factors influencing the supply of ecosystem services. In particular, a greater understanding of the spatiotemporal interactions between ecosystem services and urbanization in regions and landscapes composed of both highly urbanized and rural areas is needed (that is a situation common in rapidly developing countries). Additionally, the impact of the increasing rate of urbanization on the rate of change in ecosystem services has not received sufficient attention in the literature.
The Guangdong-Hong Kong-Macao Greater Bay Area (henceforth GBA), is one of the world’s largest “megacities”. Officially founded in March 2015, it is compromised of the 11 major cities in the Pearl River Delta in southern China and has been a major engine of national economic growth. To build a sustainable human-dominated ecosystem in this region, it is of great importance to clarify the spatiotemporal relationship between ecosystem services and urbanization for land-use planning. This study seeks to answer the question: How has the rapid urbanization of the GBA altered the spatiotemporal dynamics of key ecosystem services? To do so, we: (1) estimate and map natural habitat, ecosystem services, and the patterns of urbanization; (2) quantify and analyze the spatiotemporal correlations of natural habitat and ecosystem services with urbanization processes in highly urbanized as well as rural areas; (3) analyze the impact of the increasing rate of urbanization on the rate of change of natural habitat and ecosystem services. Then, based on the results of these analyses, we discuss policy implications and provide suggestions for sustainable urban planning.

2. Materials and Methods

The aim of this study is to analysis the impact of urbanization on natural habitat and ecosystem services at the regional scale. First, natural habitat and ecosystem services were assessed through biophysical modeling; then population density and GDP density were mapped based on night-time lights (NTL) data as well as on census and land use and land cover (LULC) data. Second, the temporal and spatial variations of ecosystem services and urbanization were mapped and analyzed, and hot-spot analysis was used to identify urban-rural gradients. Finally, spatial correlation and Spearman correlation analysis were used to analyze the spatiotemporal interactions between urbanization and ecosystem services, and decoupling analysis was used to ascertain the relationship between the urbanization growth rate and the rate of change in ecosystem services (Figure 1).

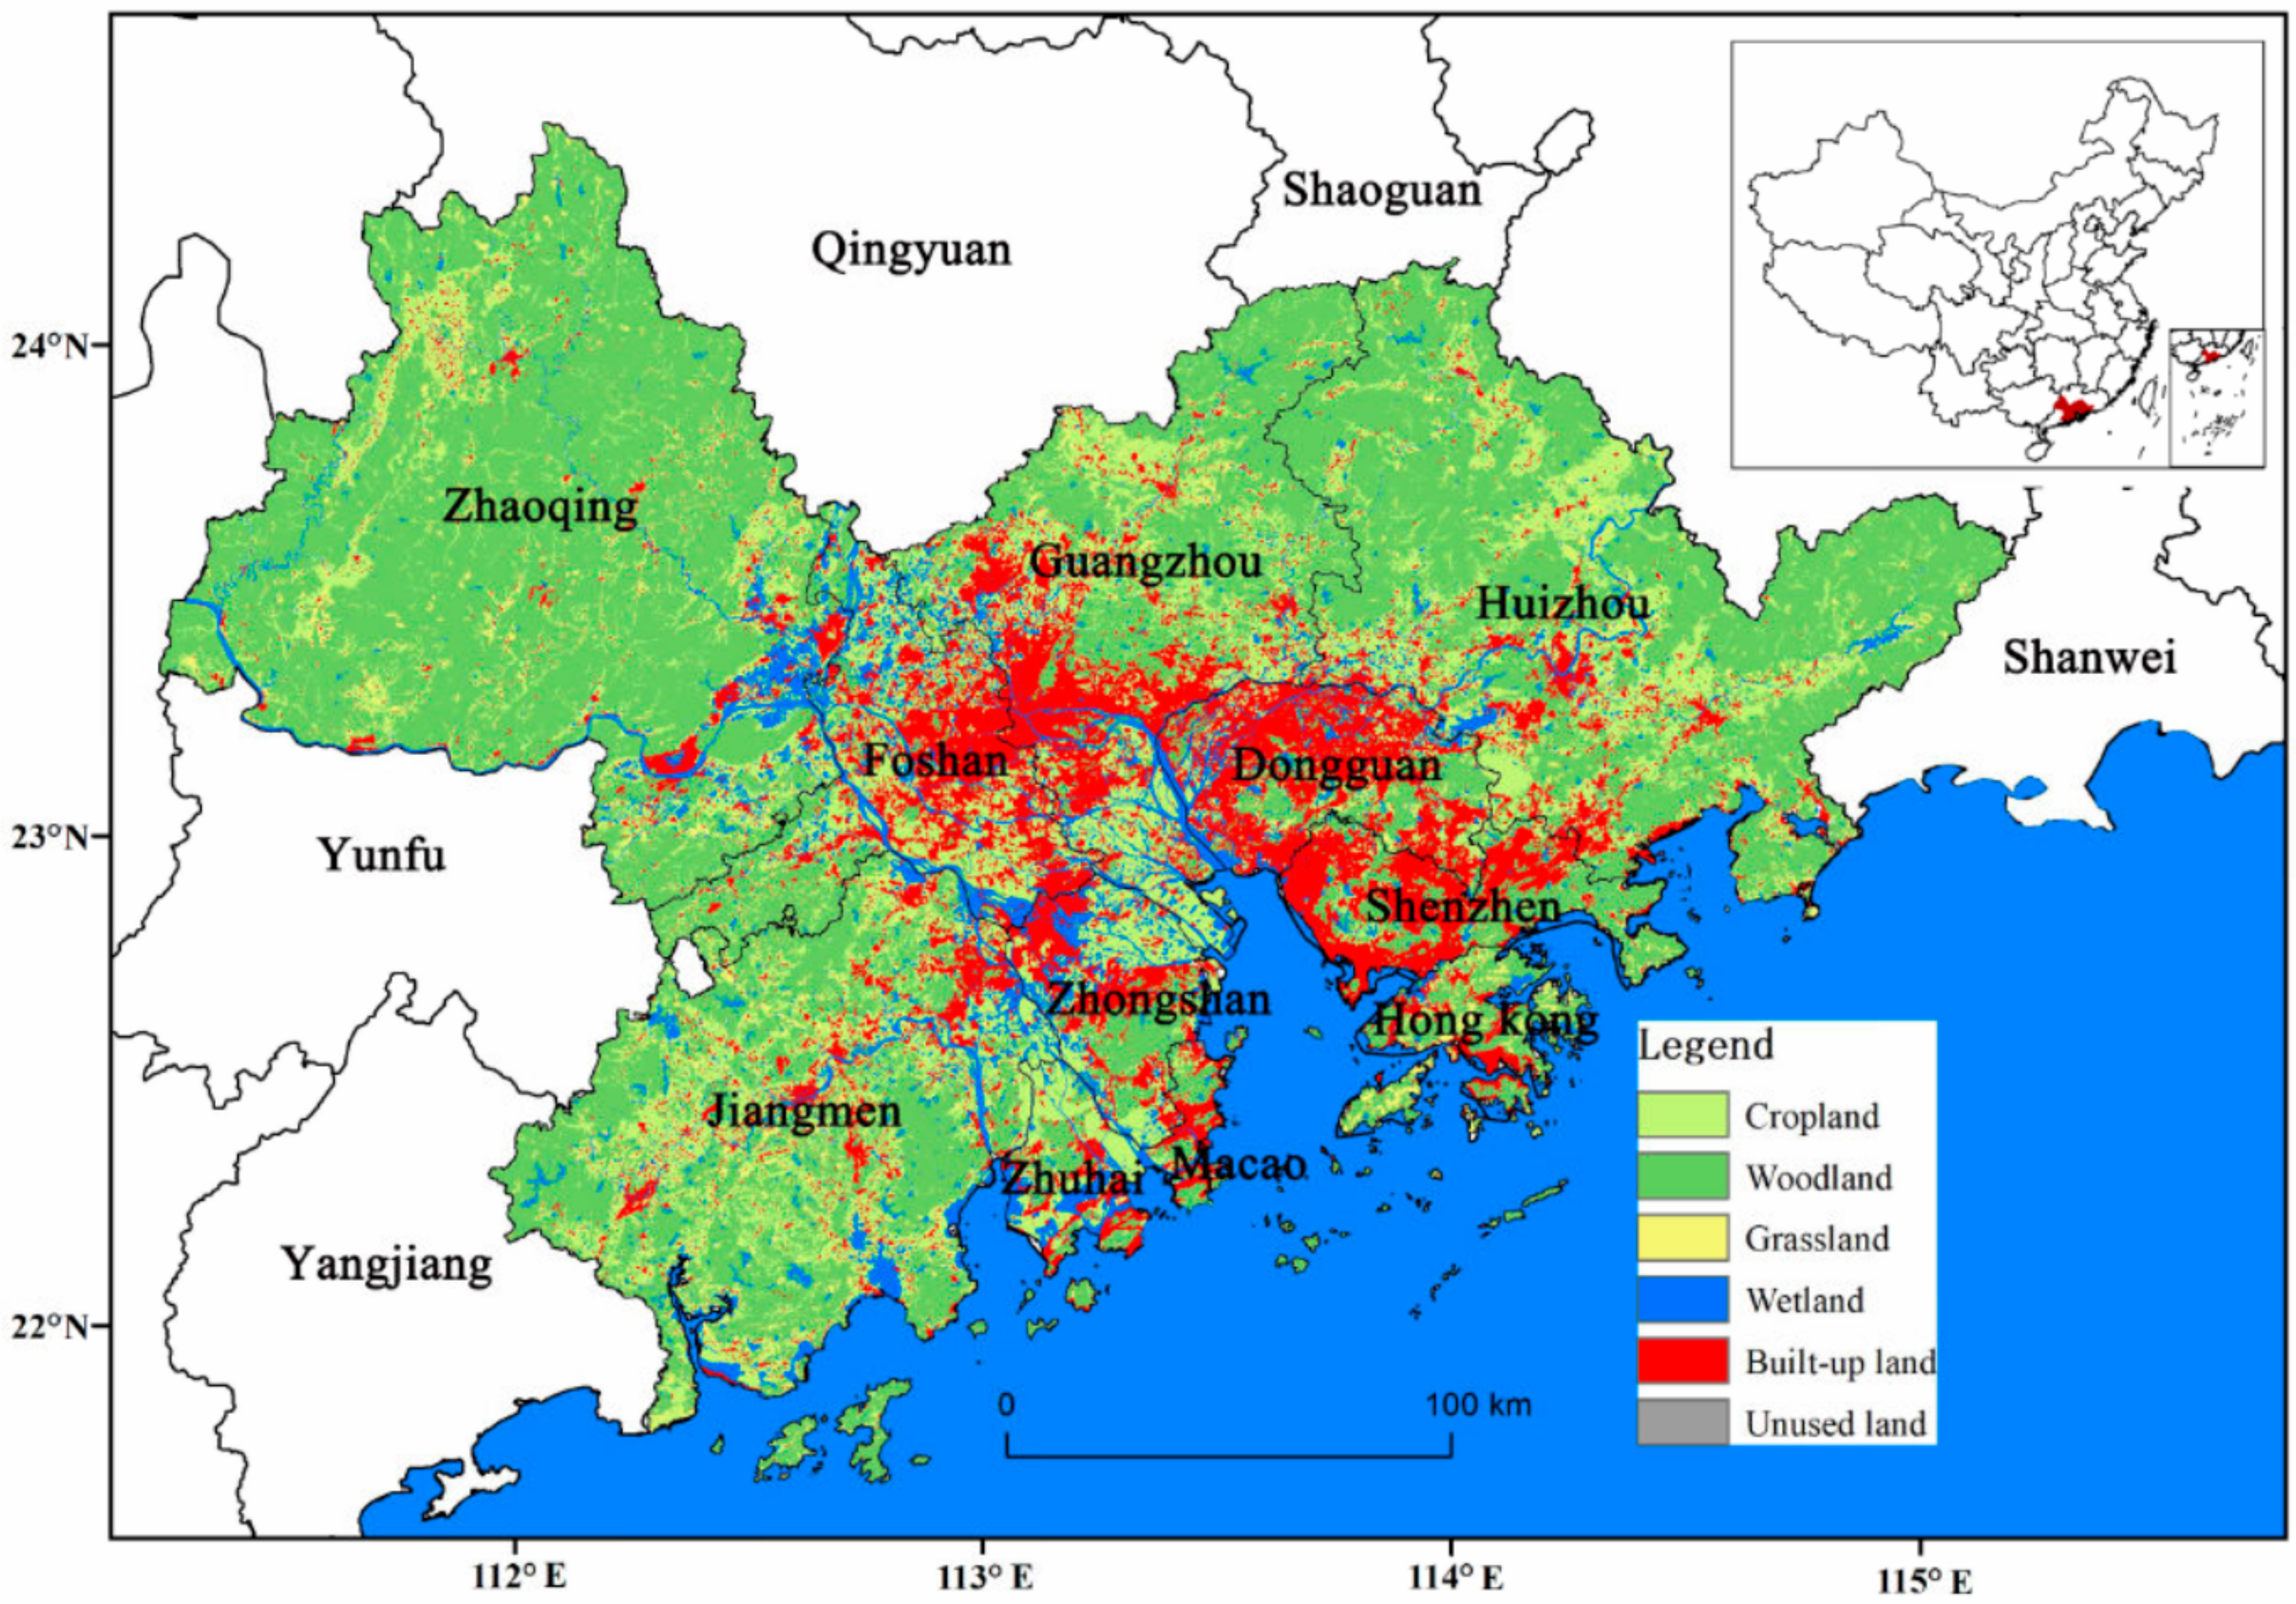
2.1. Study Area and Data Sources

The GBA consists of 11 cities: nine mainland (Chinese) cities (i.e., prefectures, which are the administrative units directly below the provincial level), namely Guangzhou, Shenzhen, Zhuhai, Foshan, Huizhou, Dongguan, Zhongshan, Jiangmen, and Zhaoqing; as well as two cities that are special administrative regions, which are Hong Kong and Macao. It covers 56,000 km2 and had a resident population of approximately 71 million people at the end of 2018. This urban agglomeration, despite only taking up 0.58% of China’s land area and hosting about 5% of China’s population, was responsible for 12.25% of national GDP in 2018 (China Statistical Yearbook, 2019), making it a focal point of national development strategy.
Environmentally, the GBA is formed from alluvial deposits, with flat plain terrain in the center and hills and ridges in the north and south [25]. The highest point is 1616 m, and higher elevations are covered by subtropical evergreen broad-leaved forest; on terrain that is lower than 100 m, farmland and built-up land predominate (Figure 2). The climate of GBA is humid subtropical with heavy rainfall during the rainy season (from April to September). The annual precipitation is 1300–2500 mm, but the distribution is heavier in the south than in the north [26].
Both geospatial and socioeconomic data were used in our study. Specifically, LULC data in the years 2000, 2010, and 2018 with spatial resolution of 30 m were collected from the Resources and Environmental Scientific Data Center (RESDC) of the Chinese Academy of Sciences (CAS) (http://www.resdc.cn/). Digital elevation model (DEM) data with spatial resolution of 30 m were acquired from the Geospatial Data Cloud (http://www.giscloud.cn/). NDVI data for 2000, 2010, and 2018 were derived from the Moderate Resolution Imaging Spectroradiometer (MODIS) dataset. Soil datasets with spatial resolution of 1 km, including for soil organic carbon and soil particle composition, were extracted from the China Soil Map Based Harmonized World Soil Database (v1.2) of the Cold and Arid Regions Sciences Data Center (http://westdc.westgis.ac.cn). The NTL images in 2000/2010/2018 were obtained from the National Oceanic and Atmospheric Administration’s National Centers for Environmental Information (https://ngdc.noaa.gov/eog/), including the yearly Operational Line-scan System of Defense Meteorology Satellite Program (DMSP-OLS) data and subsequent monthly Visible Infrared Imaging Radiometer Suite (VIIRS) of Suomi NPP satellite with about 0.5 km resolution data. Perennial meteorological data from 2000 to 2018, including daily precipitation, evapotranspiration, and solar radiation, were obtained from the China Meteorological Data Sharing Service System (http://data.cma.cn/site/index.html). Additionally, census and accounting statistics data in the years 2000, 2010, and 2018 were collected from the Guangdong Statistical Yearbook, Hong Kong Annual Digest of Statistics and Macau Statistical Yearbook.

2.2. Quantifying Regulatory Ecosystem Services and Natural Habitat

This study focused on three regulatory ecosystem services (water retention, soil conservation, and carbon sequestration) and natural habitat that are of particular importance for the GBA because of their strong relations to dwellers’ health and security, and are sensitive to changes in land use. There are several key reasons for selecting these abovementioned ecosystem services: (1) water is the basis of life, and water scarcity is a serious problem for high population density areas, leading to high consumption rates [27]; (2) soil erosion caused by storm-water runoff threatens city-dwellers’ security, thereby making soil conservation important to the GBA’s population [28]; (3) carbon dioxide (CO2) is the greenhouse gas most relevant to anthropogenic climate change, which has negative impacts on urban areas [29]; (4) extensive urbanization has resulted in a massive loss of natural habitat, threatening the GBA’s biodiversity and socioeconomic sustainability [30].
Water retention refers to the water retained in ecosystems within a certain period. The amount of water retention for each pixel on the landscape was obtained by the equation described as follows, and the required runoff coefficient values were derived from a previous study [31]:
W C = i = 1 j P i R i E T i × A i
R i = P i × a
where W C is the total amount of water retention, P i is the precipitation, R i is the storm runoff, E T i is evapotranspiration, A i is the area of the ecosystems as defined by land cover types, a is the runoff coefficient, i is the index for each ecosystem, and j is total number of ecosystems within the given pixel.
Soil erosion reduces soil fertility and aggravates flood problems [32]. The revised universal soil loss equation (RUSLE) was used to calculate soil conservation capacity [33]. The calculation formula of the RUSLE model is as follows:
S C = R × K × L S × 1 C P
where S C is the soil conservation capacity, R is the rainfall erosivity factor, K is the soil erodibility factor, L S is the topographic factor, C is the vegetation cover factor, and P is the conservation practice factor (the steps for the calculations are the same as in previous job [18]).
Carbon sequestration refers to the amount of carbon sequestered by terrestrial ecosystems, thereby slowing the rate of increase of atmospheric CO2 [34]. Net primary productivity (NPP) was applied as the key indicator for carbon sequestration, and the Carnegie-Ames-Stanford approach (CASA) terrestrial carbon model was used to estimate NPP [35]. The formula is as follows:
N P P x , t = A P A R x , t × ε x , t
where A P A R x , t is the absorbed photosynthetically active radiation in a given location and time, and ε x , t is the light use efficiency in a given location and time.
Human wellbeing can be enhanced and protected by biodiversity, and natural habitat is beneficial to people [36]. Forests, grasslands, and wetlands can provide the abovementioned ecosystem services as well as natural habitat for biodiversity [30], so, their areas were defined as natural habitat.

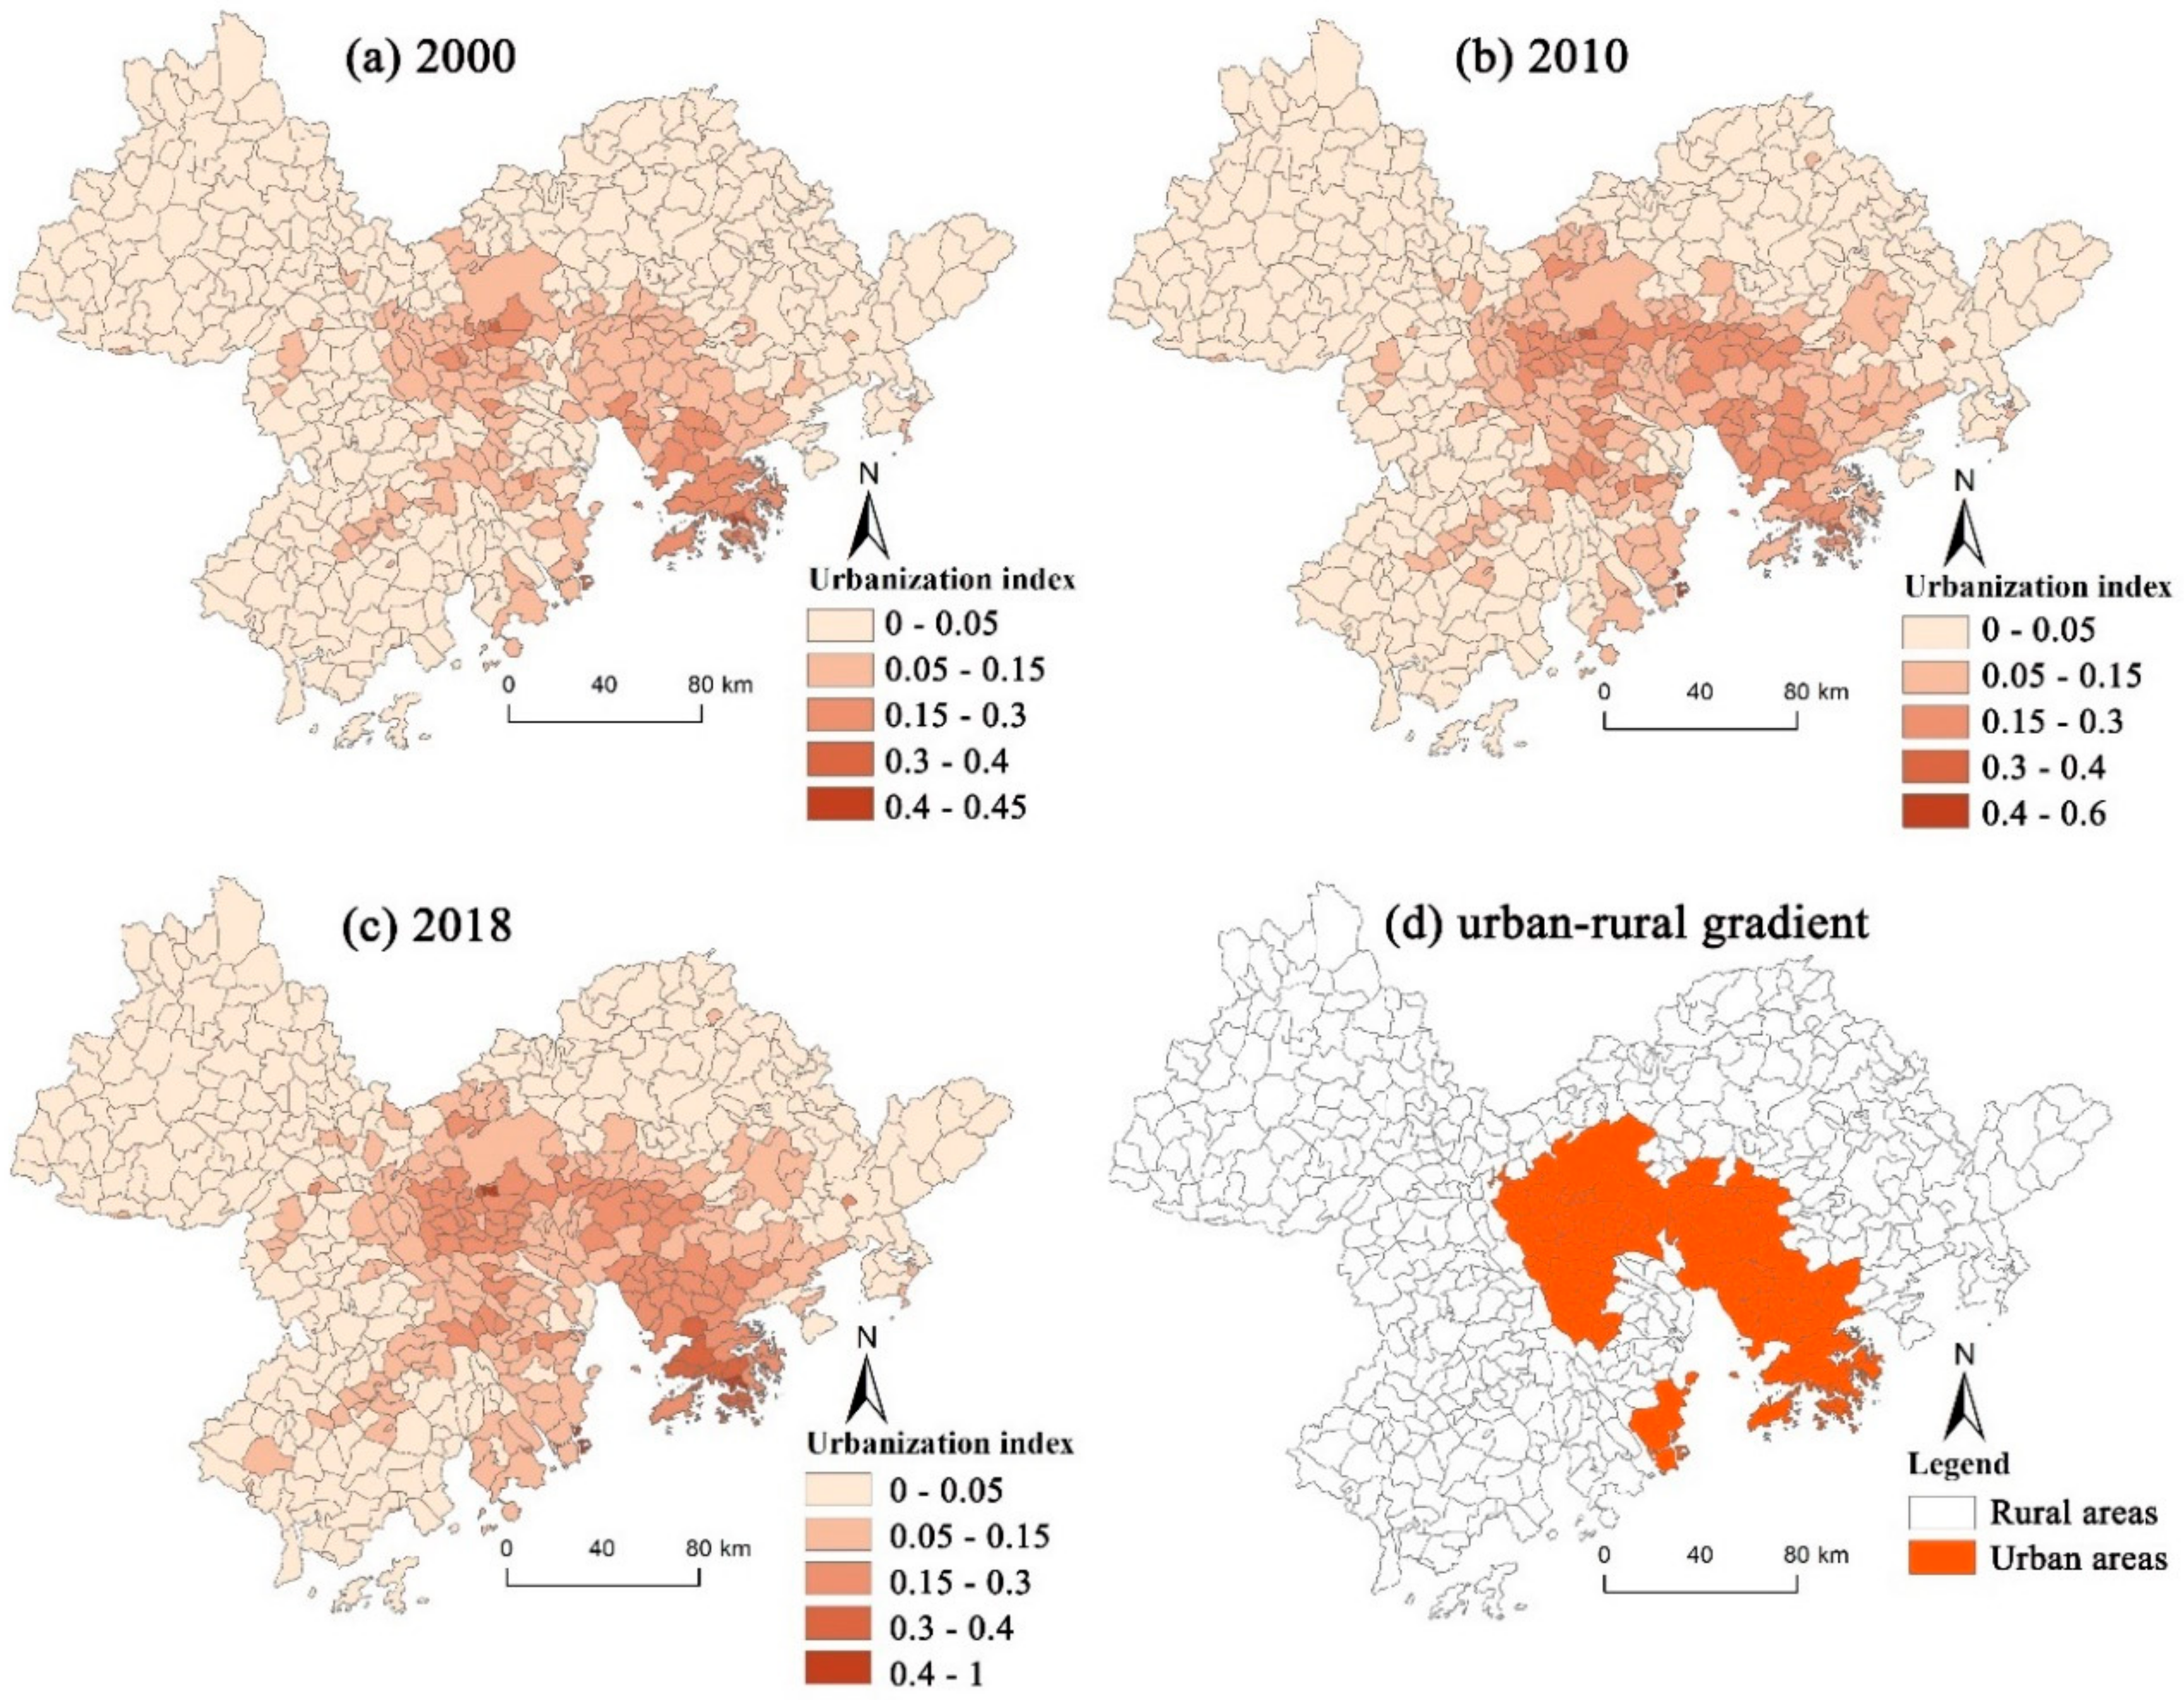
2.3. Mapping Urbanization Levels

Population growth, economic development, and built-up land expansion were used to indicate the extent, distribution, and intensity of urbanization [37]. This study proposed an urbanization index which synthesized population density, GDP density, and proportion of built-up land. The entropy-right method was used to determine the weight of three urbanization indexes.
Subdistrict is a relatively independent management unit. This study used 553 subdistricts and towns as evaluation units, and then calculated and standardized the value of those three urbanization indexes. The relative weights of population density, GDP density, and proportion of built-up land were 0.16, 0.59, and 0.25, respectively.
Population and GDP were primarily obtained from census data at the urban or district level, which is bigger than the subdistrict level. It is necessary to rasterize population and GDP to obtain data at the subdistrict and town levels. Many studies have shown that NTL data had a high correlation with population and GDP, and it has been widely used to estimate the spatial distribution of population and GDP [38,39]. Drawing on previous studies, a linear regression model was used in this study to rasterize population and GDP with two widely available datasets (NTL and urban land) for the years 2000, 2010, and 2018 [40,41]. The total NTL were found exhibit R2 values of 0.8699 and 0.68 with economy and population through the regression, respectively, which indicated that NTL has a significant linear correlation to GDP and population.
To understand the ecosystem services response to urbanization in a rural–urban gradient, 553 subdistricts and towns were classified into urban and rural areas. The hot-spot analysis (Getis-Ord Gi*) can identify statistically significant spatial clusters of high value [42]. The optimized hotspot tool in ArcGIS was used to evaluate the spatial variability in urbanization and identify urban areas (hot spots) and rural areas (cold spots and non-significant spots) in the GBA.

2.4. Quantifying the Spatiotemporal Relationship between Urbanization and Ecosystem Services

Spatial correlation analysis and Spearman correlation analysis were used to analyze the spatial and temporal interactions between urbanization and ecosystem services. Spatial correlation analysis was applied to explore the correlation between a cell and its surrounding cells. Global bivariate spatial correlation represents spatial features at the entire scale through Moran’s I [43], while local bivariate spatial correlation reflects the relationship between the value of ecosystem services at a given location and the average value of urbanization at neighboring locations through a LISA cluster diagram [44,45]. The GeoDa software (http://geodacenter.github.io/) was used to analyze the spatial correlation between urbanization and ecosystem services. The Spearman correlation analysis was used to reveal the relationship between ecosystem services and urbanization [46]. SPSS 17.0 software was used to calculate the Spearman correlation coefficient.
Decoupling refers to the severe diminution or disappearance of a given correlation, and the extent of decoupling reflects the extent of irrelevance occurring between given systems over time [47,48]. The OECD model [49] and the Tapio [50] model are the ones most frequently used in current scientific research. The OECD decoupling model can only roughly estimate the decoupling relationship, while the Tapio model can use incremental values to analyze the decoupling effect from dynamic data [51]. Therefore, we chose Tapio’s decoupling indicator to analyze the relationship between urbanization and ecosystem services from 2000 to 2018. The calculation of the decoupling elasticity index is:
E E S i , U = Δ E S i E S i 0 Δ U U 0
Δ E S i = E S i 0 E S i 1
Δ U = U 1 U 0
where E E S i , U represents decoupling relationship between urbanization and each ES type, E S 1 refers to habitat, E S 2 refers to water retention, E S 3 refers to soil conservation, E S 4 refers to carbon sequestration, Δ E S i denote changes in ecosystem services from year t to the base year 0, and Δ U denotes changes in urbanization from the base year 0 to year t. Negative values in the urbanization index growth were extremely rare for the GBA since 2000, so the relationship between urbanization and ecosystem services is likely to only exhibit strong decoupling, weak decoupling, expansive negative decoupling, and expansive coupling (Table 1). Strong decoupling is the best development state during the urbanization process, while strong negative decoupling is the worst state.

3. Results

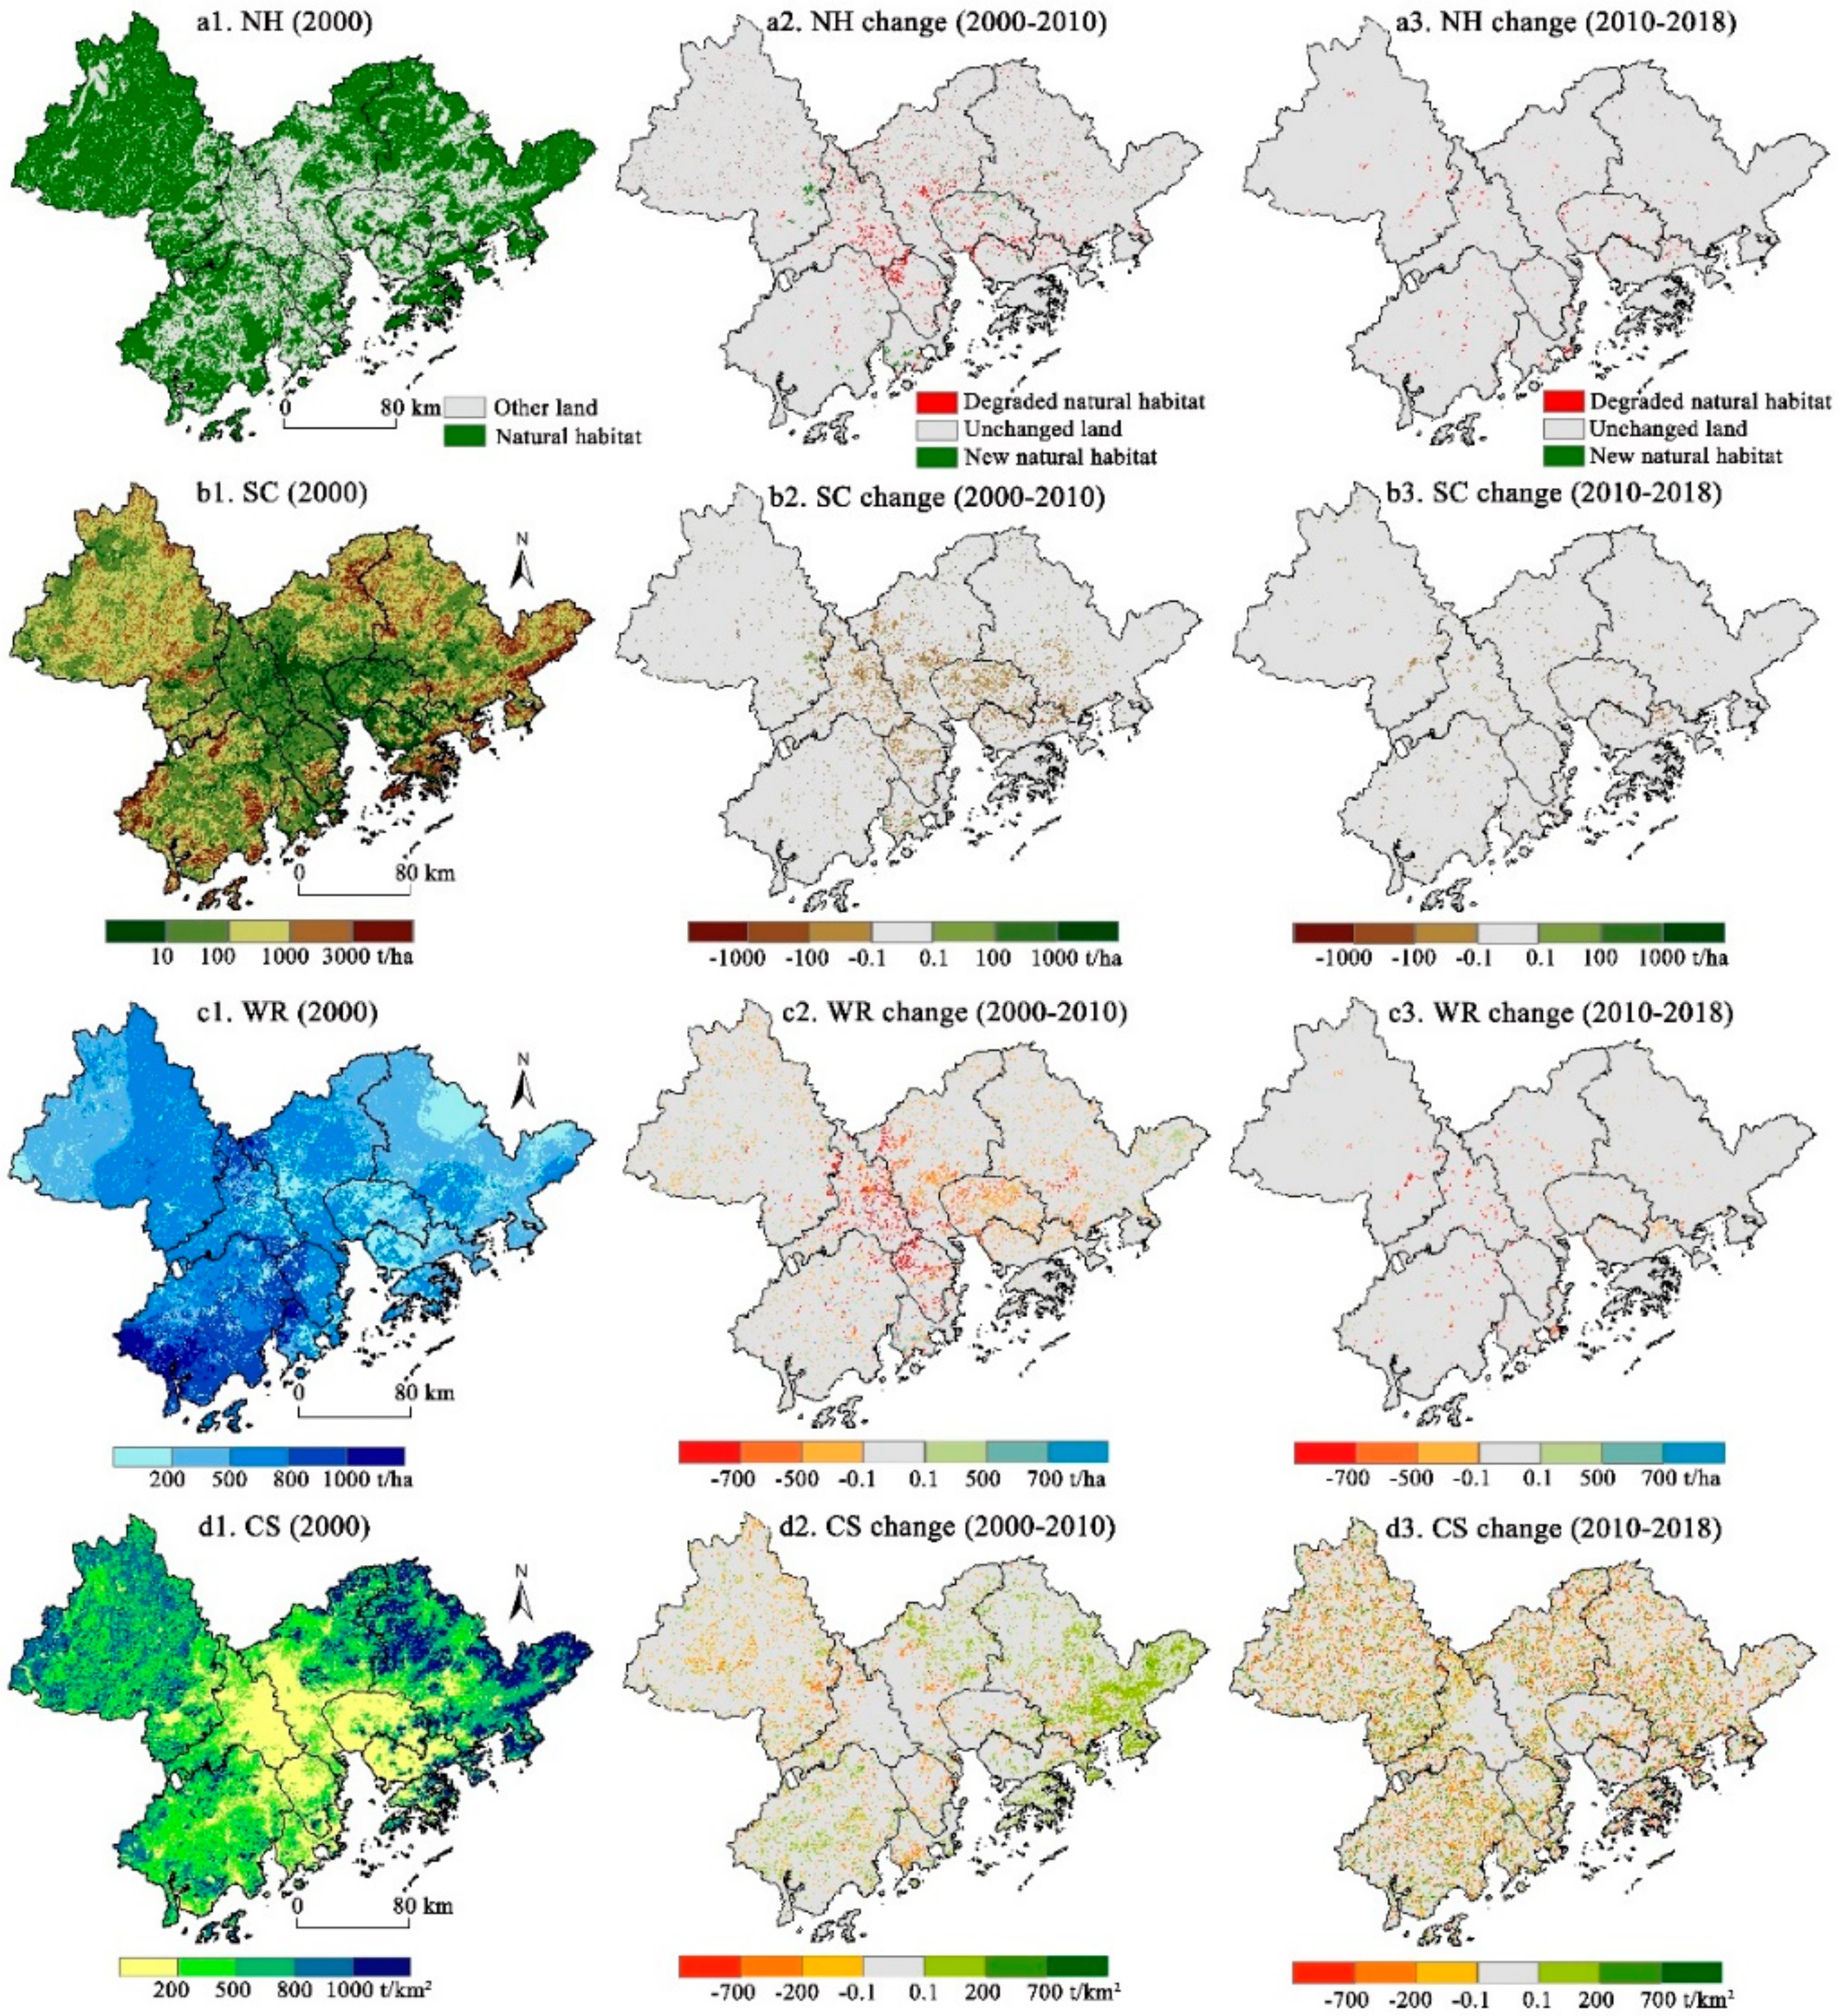
3.1. Spatial Patterns of Ecosystem Services and Urbanization Intensity

Considerable differences were found in the spatial distribution and change patterns of natural habitat, soil conservation, water retention, and carbon sequestration (Figure 3). Natural habitat decreased by 915 km2 from 2000 to 2018, 740 km2 in forest, 278 km2 in wetland, while grassland increased by 103 km2. The soil conservation service was mainly distributed in the surrounding mountainous area of GBA, with high vegetation cover and high slope, while it was low in the central plain area. With urban development occupying a growing amount of natural habitat, the average soil conservation decreased from 638.55 t/ha in 2000 to 631.41 t/ha in 2018. Average soil conservation decreased by approximately 5 t/ha from 2000 to 2010, and 2 t/ha from 2010 to 2018. The water retention service was mainly distributed across the southern GBA, which receives a much higher level of rainfall. It was at a low level in Zhaoqing and Huizhou (prefectures in northern GBA), which receive relatively low rainfall. The water retention service was also relatively low in Dongguan, Shenzhen, and Hong Kong because of the high proportion of impervious surface land cover. With the expansion of impervious surface, water retention declined from 2000 to 2018. The GBA’s average level of water retention in 2000, 2010, and 2018 were 5022.5 t/ha, 4793.2 t/ha, and 4721.7 t/ha, respectively. The carbon sequestration service decreased overall from 2000 to 2018. But it increased from 498 t/km2 to 513 t/km2 from 2000 to 2010 because the increased carbon sequestration was mainly distributed in the eastern GBA, while it decreased to 481 t/km2 in 2018.
Concurrently, built-up land increased rapidly, from 5083 km2 to 7979 km2 over our study’s 19-year period. It increased by 2238 km2 from 2000 to 2010 and by 657 km2 from 2010 to 2018. Growth in the cities of Guangzhou, Dongguan, and Foshan was particularly high from 2000 to 2018, with each seeing more than 500 km2 of new built-up land. GBA’s overall population grew from 50 million in 2000 to 71 million in 2018, while the region’s GDP grew from 0.3 trillion US$ in 2000 to 1.64 trillion US$ in 2018. The spatial patterns of population density and GDP were mapped based on linear regression with the NTL data [52,53,54] (Figure 4). Population density and GDP had similar spatial patterns, which both concentrated in the areas around Guangzhou, Shenzhen, and Hong Kong.
The urbanization index significantly increased in all areas from 2000 to 2018 (Figure 5). The highest values were concentrated in the central and southeast, and increased from 0.45 in 2000 to 1 in 2018. The urbanization index decreased from the center to the periphery, and showed an obvious urban-rural gradient. Hotspot analysis showed that urban areas consisted of 127 subdistricts clustered in the economically central cities of Guangzhou, Shenzhen, and Hong Kong, while rural areas consisted of 425 subdistricts or towns scattered across the rest of the region (Figure 5).

3.2. The Relationship between Urbanization and Ecosystem Services in GBA

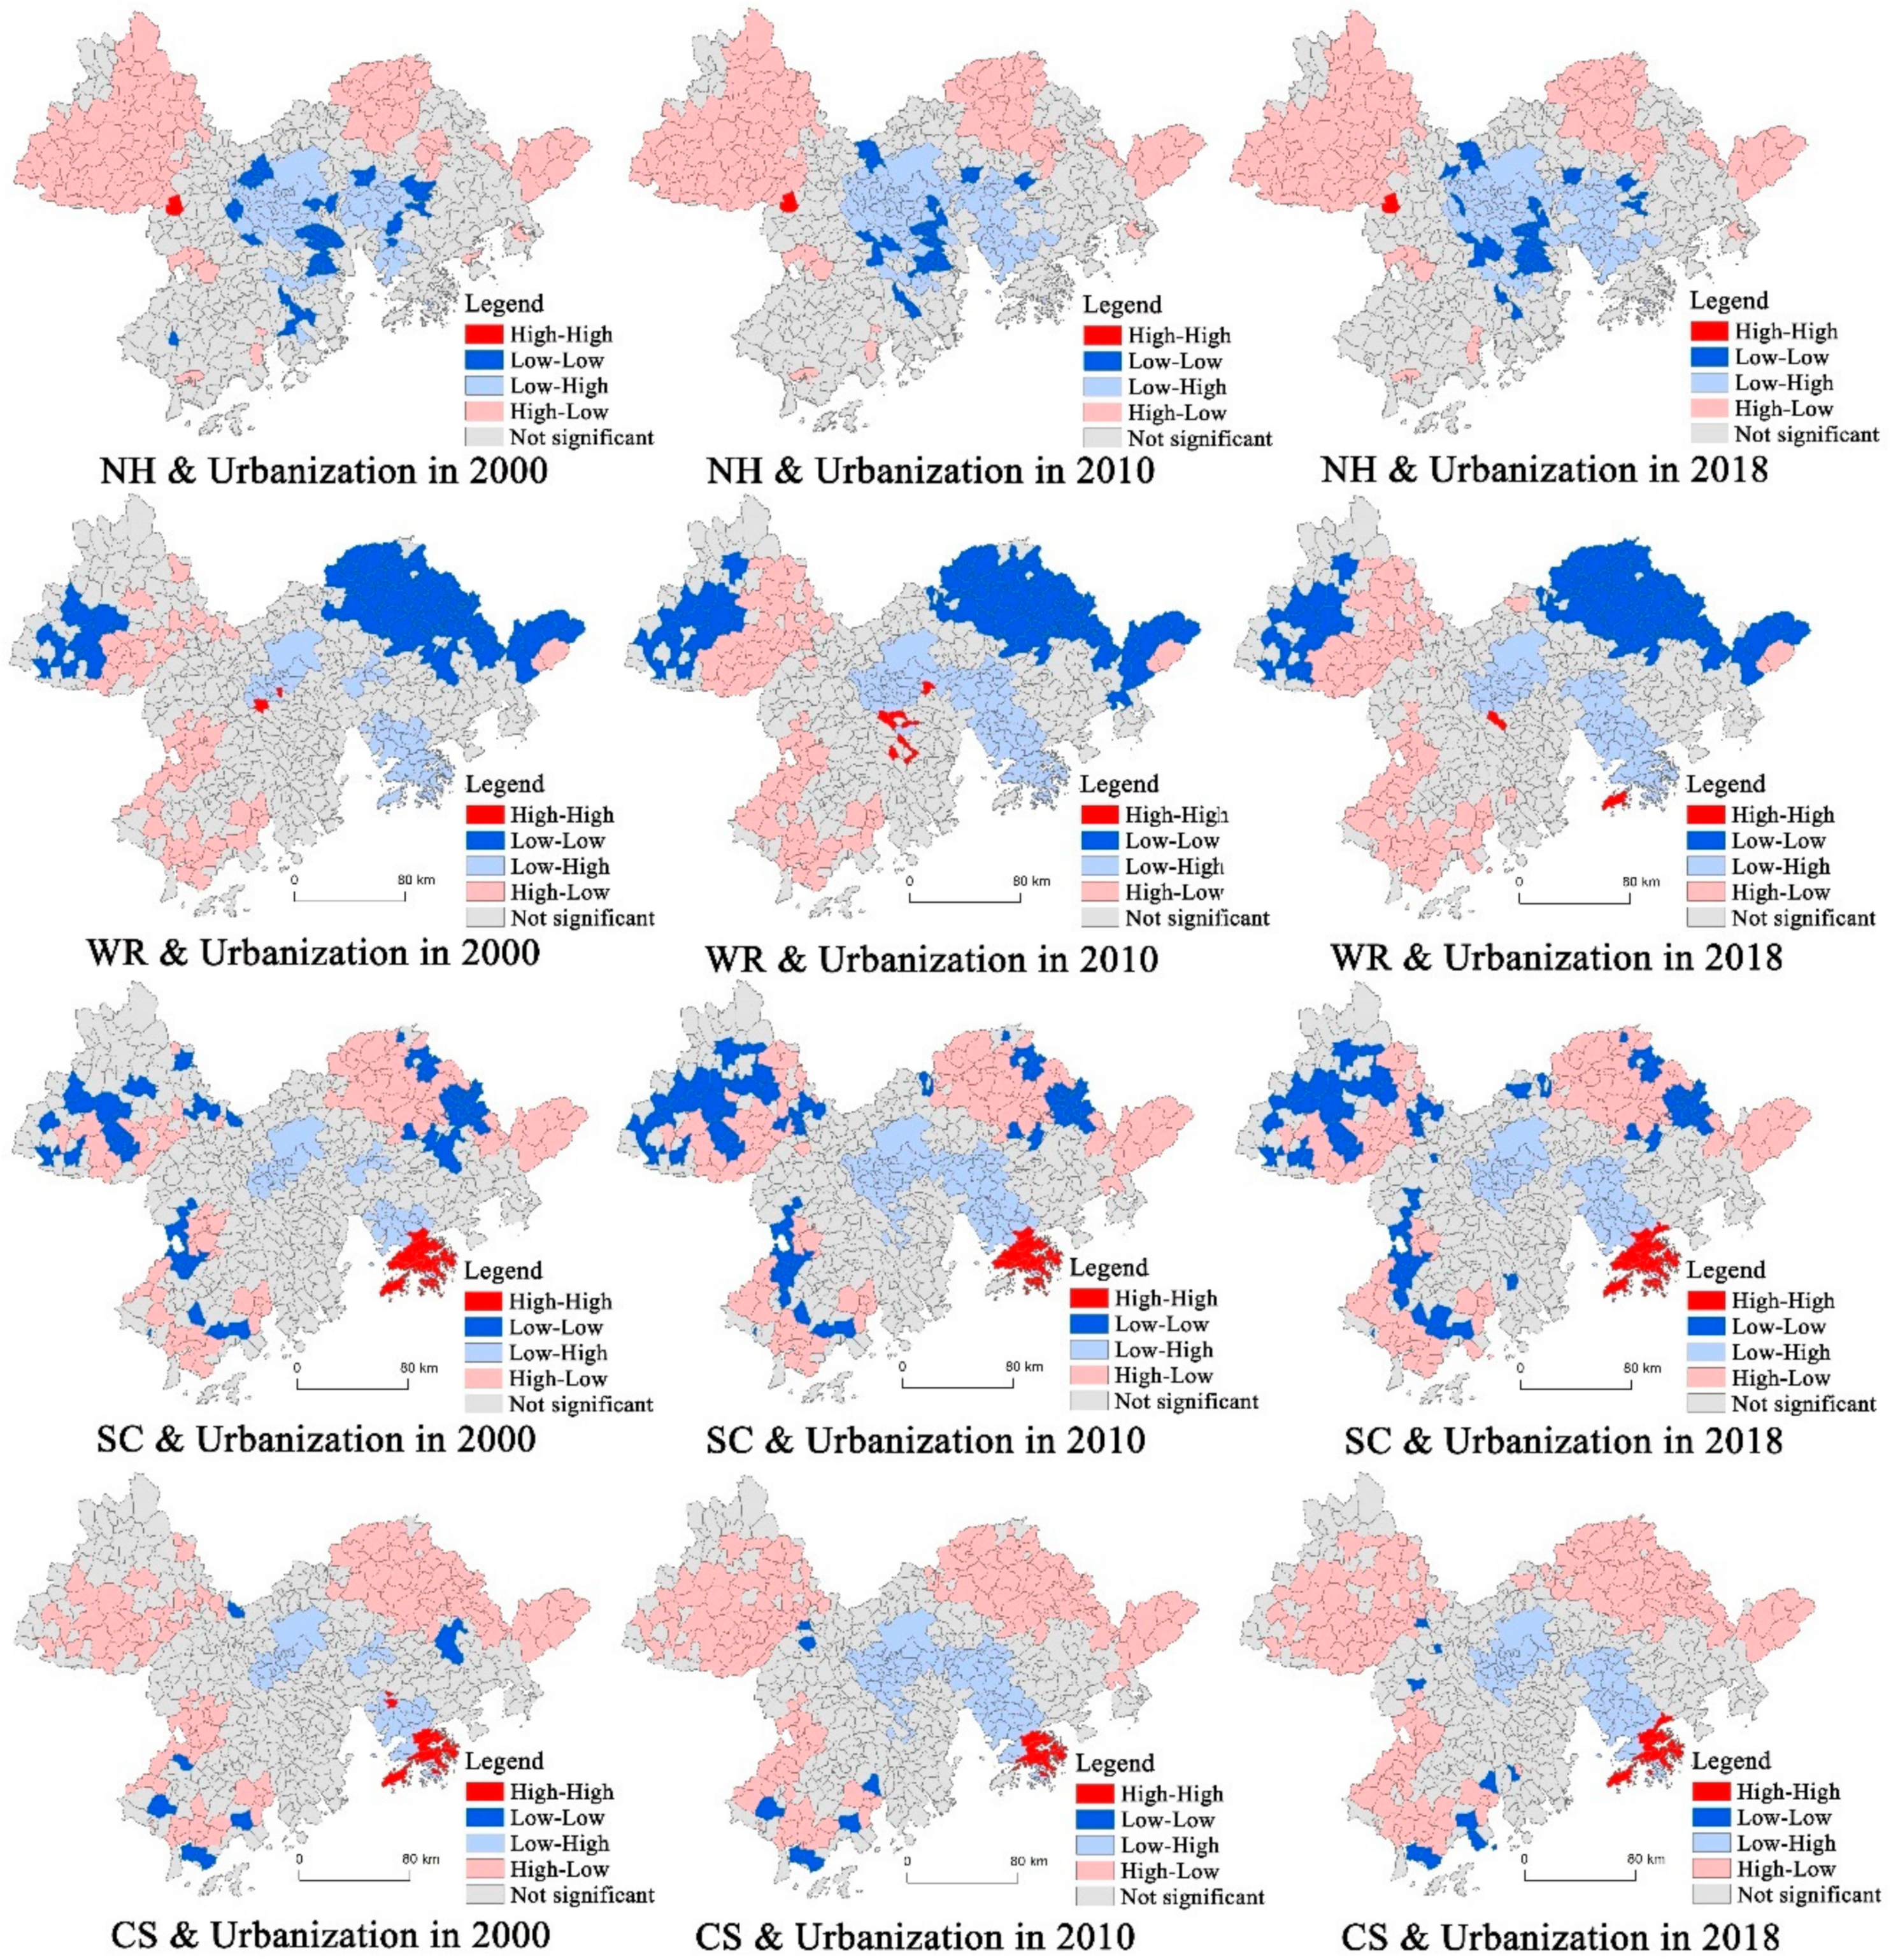
3.2.1. Spatial Correlations between Ecosystem Services and Urbanization

Natural habitat, water retention, soil conservation, and carbon sequestration were negatively correlated with urbanization across GBA (Figure 6 and Table 2). The degree of negative correlation between those services and urbanization increased from 2000 to 2010 and decreased from 2010 to 2018. Carbon sequestration had the highest degree of negative correlation, Moran’s I value reached −0.552 in 2010, while soil conservation had the lowest Moran’s I value at just −0.222 in the same year.
Two variables of the LISA cluster diagram were used to understand the spatial relationship between ecosystem services and urbanization. A high-high cluster represents a high urbanization unit corresponding to a high value of ecosystem services, while the low-low cluster represents the opposite. Low-high means a low value of ecosystem services adjacent to a high value urbanization unit, while high-low represents the opposite. The low-high relationship between ecosystem services and urbanization was mainly scattered in the middle and eastern parts of the GBA. The water retention service and urbanization showed a low-low relationship in Huizhou and parts of Zhaoqing, and a high-low relationship in Jiangmen and other parts of Zhaoqing (all in northern GBA). The spatial relationship between natural habitat, soil conservation, and carbon sequestration, on the one hand, and urbanization on the other, were similar. The high-high relationship was concentrated in Hong Kong, while the high-low areas were mainly located in Zhaoqing, Huizhou, and Jiangmen. With a high rate of urbanization and vegetation loss from 2000 to 2010, the low-low relationship of soil conservation and urbanization and water retention and urbanization increased by 12 and 7 villages and towns, respectively.

3.2.2. Spearman Correlation Analysis between Ecosystem Services and Urbanization

Natural habitat and ecosystem services were negatively correlated with urbanization in both urban and rural areas (Table 3). The relationship between habitat area and urbanization was negative in rural areas, while it was insignificant in urban areas with rare habitat area. There was significant negative correlation between water retention and urbanization in urban areas, given the extensiveness and continued growth of impervious surfaces. In rural areas, however, urbanization did not cause a significant decline in water retention for the year of 2000 and 2010. Soil conservation was not only affected by vegetation coverage, but also by slopes and their slope lengths. There was no significant correlation between soil conservation and urbanization in urban areas, which were mainly located in the GBA’s southern plains. In contrast, soil conservation and urbanization had significant negative correlation in rural areas. In rural areas with significant tree cover, the expansion of built-up land at the loss of forests caused urbanization to be negatively correlated with carbon sequestration. Additionally, carbon sequestration was low in urban areas, where vegetation cover was also in short supply. Given the saturation effect, the rate of decline in carbon sequestration was low in urban areas and the service had a lower negative correlation with urbanization here than in rural areas.

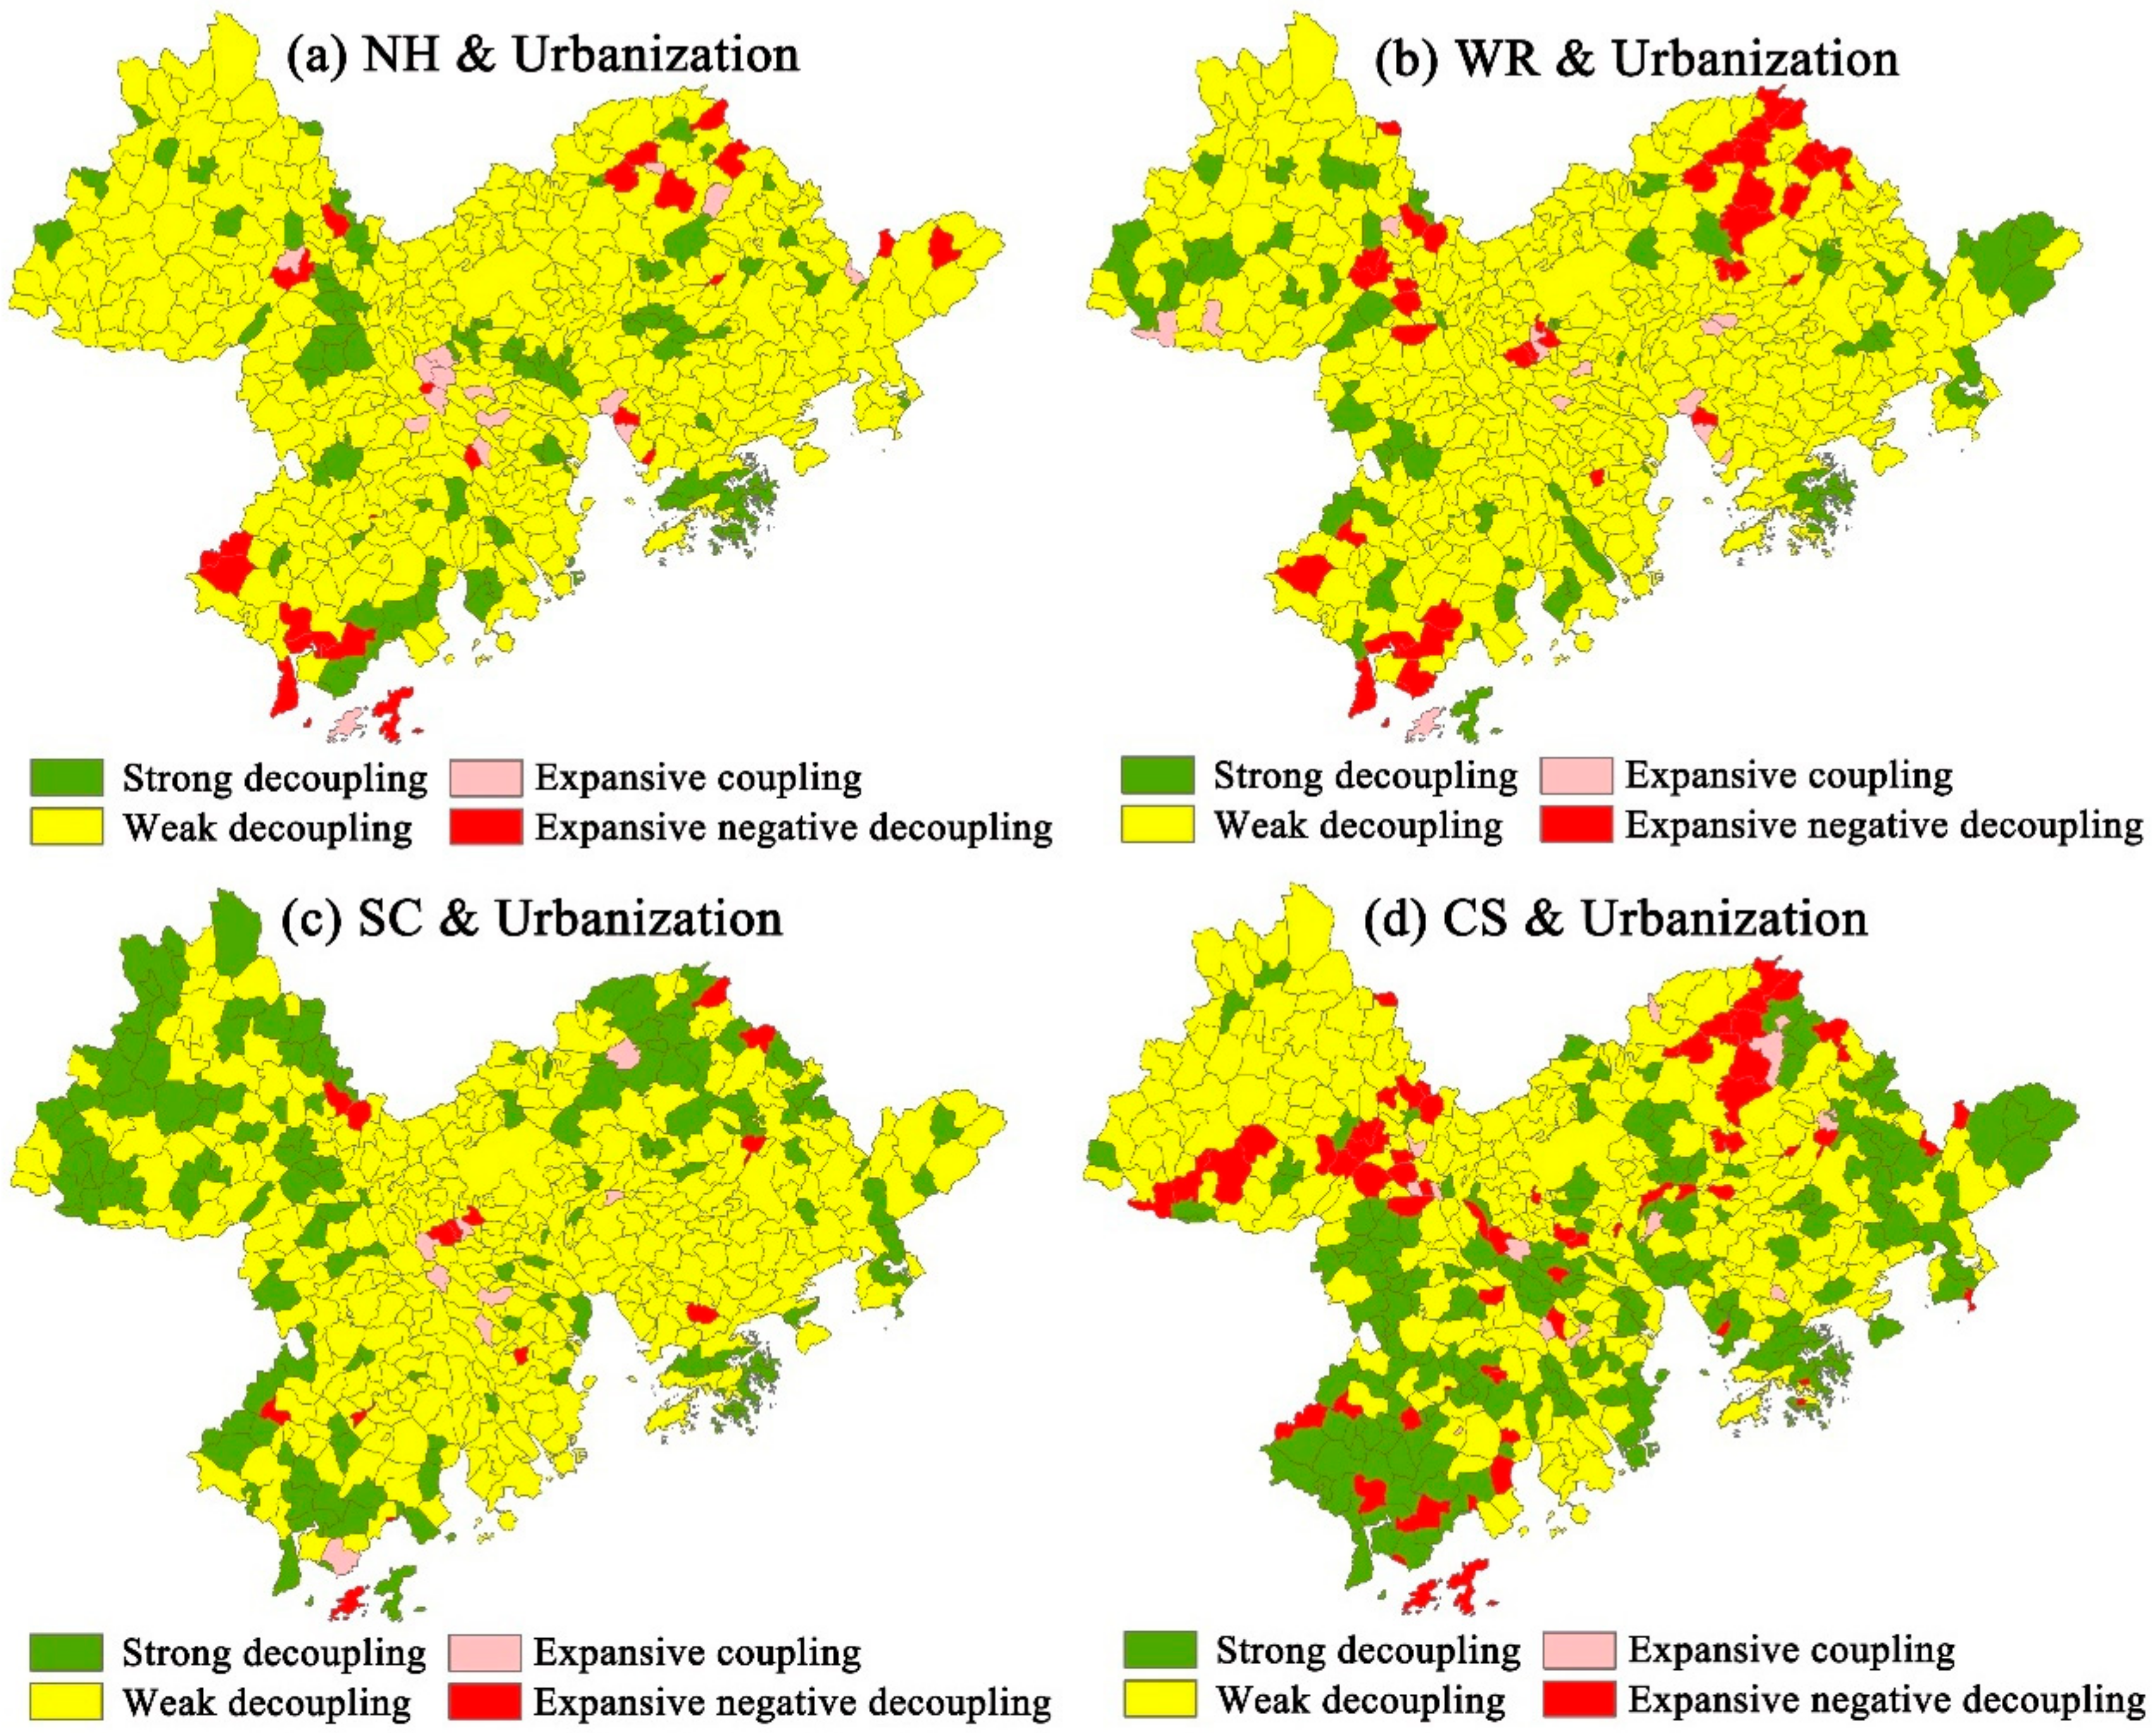
3.2.3. Decoupling Analysis of Ecosystem Services and Urbanization

In terms of decoupling, from 2000 to 2018, the decoupling state was mainly characterized by weak decoupling (i.e., the urbanization growth rate was higher than the decrease rate of ecosystem services and natural habitat), indicating that region-wide urbanization development and ecosystem services were still changing synchronously. However, the GBA also exhibited different decoupling states at the sub-regional level (Figure 7 and Table 4).
Weak decoupling characterized the urbanization-habitat, urbanization-water retention, and urbanization-soil conservation relationship in the study period, and covered more than 70% of villages and towns. However, the urbanization-carbon sequestration relationship experienced weak decoupling and strong decoupling (both urbanization and ecosystem services grew) from 2000 to 2018, accounting for 54% and 32%, respectively. The ideal decoupling state mainly appeared in urban areas and southern rural areas, where adequate rain and high temperatures promoted the natural growth of vegetation on the one hand, while ecological protection and ecological restoration protected the existing natural habitat on the other. Expansive coupling (the decrease rate of the ecosystem service approached the urbanization growth rate) and expansive negative decoupling (the ecosystem service decrease rate was higher than the urbanization growth rate) had a smaller share of the GBA.

4. Discussion

Natural habitat and ecosystem services generally declined with increasing urbanization in GBA from 2000 to 2018, and the relationship between urbanization and ecosystem services varied along urban-rural gradients. Among likely reasons for this, the primary cause of changes in the supply of ecosystem services was that population and economic growth were accompanied by the rapid expansion of built-up land [24]. Urbanization led to 13% (1887 km2) of farmlands, 2% (633 km2) of woodlands, and 12% (459 km2) of wetlands being converted to built-up land from 2000 to 2018—a significant increase in impermeable surface at the expense of natural habitat. Based on bivariate spatial correlation and Spearman correlation analysis, the urbanization index and ecosystem services had a negative correlation in GBA. Our results are consistent with previous studies and indicates that urbanization exerts significant influence on ecosystem services [45]. The spatial spillover effect suggests that one unit can incur benefits or costs from its neighbors, and it existed between ESs and urbanization (Figure 6). Globally, urbanization has a negative spatial spillover effect on ecosystem services (Table 2), which means the urbanization process may led to a decrease of ecosystem services. The main reason for this may be that urban expansion led to occupation of neighboring ecological land. However, this is not always the case at the local level or along urban-rural gradients. There are likely other factors contributing to the variation of the relationship between ecosystem services and urbanization, such as topography and precipitation. For example, water retention had a highly negative correlation with urbanization in urban areas, while it had no significant correlation with urbanization in rural areas. The three factors affecting water retention are rainfall, evaporation, and runoff [14]. Therefore, given the high runoff coefficient for built-up land and the spread of impervious surfaces, urban areas inevitably had a low water retention capacity. However, the distribution of rainfall has a high spatial heterogeneity in rural areas, while water retention capacity was not significantly correlated to areas of built-up land. What is more, the relationship between urbanization and soil conservation was negatively correlated in rural areas and show no significant correlation in urban areas. This is likely because urban areas are concentrated in the lower plains of the GBA, which have low slope and a high proportion of built-up land, leading to homogeneity in urban areas with little potential soil loss. As a whole, our study indicated that topography probably plays the key role between urbanization process and ecosystem service provision, which affect multiple ecosystem services through providing slopes and blocking ocean water vapor, while slopes also tend to block urbanization. Thus, the surrounding mountainous areas of the GBA should be delineated as its ecological defenses.
As a major focus of China’s current economic development strategy, the GBA is expected to become integrated as the world’s largest “megacity” [55,56]. According to central government plans first issued in February 2019, the GBA must focus on green development and ecological protection. In addition, a number of other planning directives, including the 11th and 12th Five-Year Plans, have stipulated a broader national need to protect cultivated and natural landscapes in urban settings [19]. Key to achieving these aims is the maintenance and improvement of regulatory ecosystem services [57]. However, according to our decoupling analysis, weak decoupling between urbanization and ecosystem services was the primary overall trend in the region. This indicates that urbanization plays a negative role in ecosystem services and the GBA’s development model has not been able to realize the sustainable urbanization stipulated by the planning directives. There are three other decoupling trends in the region, namely strong decoupling, expansive coupling, and expansive negative decoupling. The varied decoupling types mean that the effects of urbanization on ecosystem services are different and complex. Expansive negative decoupling is the worst state, and there were a number of the high-low clusters that underwent expansive negative decoupling, indicating that their natural habitat with high ecosystem services were severely degraded. The ecosystem service decrease in these areas was caused not only by land cover change, but also by intensive economic production (as measured by GDP growth). The areas with expansive negative decoupling require the most attention because those are the areas where urbanization is most seriously damaging ecosystem services. A decline in ecosystem services was inevitable due to social economic development, but strong decoupling state appeared in high-low clusters like Huizhou and Jiangmen. Strong decoupling is the more desirable development state, since it indicates that urbanization and ecosystem services can develop in harmony. One reason for this may be that local governments implemented some ecological conservation policies; another reason for this may be intensive land development in already limited natural habitat and the fact that woodlands were less affected by encroachment, so their natural growth counteracted the negative effects of urbanization. The GBA has entered a mature stage of urbanization, and the government has instituted more ecological protection measures to balance economic imperatives with environmental ones [19]. However, understanding interactions in local space between urbanization and ecosystem services allows policymakers to produce more reasonable suggestions for urban planning and management. Though forest ecosystems were of great significance in stabilizing the regional ecosystem services, this does not mean that land use policy should simply consist of increasing forest area and ignoring the loss of other ecologically important land. It is more important for land managers and policymakers to conserve the integrity of the original ecosystem and devise varied feasible policies for different development states. The high-high cluster and high-low cluster areas that exhibited strong decoupling included significant coverage of nature reserves and woodlands, and ecological conservation has been a primary policy goal in these areas [58]. In terms of planning and management, the high-low cluster areas with other decoupling states should also strengthen ecological management (particularly of forests), and the ecosystem services of these areas should be more strictly protected from continued urban expansion and enhanced through ecological restoration [59]. At the same time, a reasonable ecological compensation system should be established to institutionalize economic incentives for ecological protection and restoration, particularly in low-high clusters and low-low clusters [60]. The spatial correlation between natural habitat/soil conservation/carbon sequestration and urbanization in Hong Kong was different to that of the other urban areas in the GBA, which deserves special attention. The city was a typical high-high cluster, indicating that continued urbanization does not necessarily build upon the substantial loss of ecosystem services. It should also be noticed that such an achievement results from strict ecological protection and an increase of green infrastructure in an already highly-urbanized space [61]. In general, ecosystem service degradation caused by urban development mainly occurred in the early stage of urbanization, which deserves more attention in global urban planning for the GBA. The interactions between urbanization and ecosystem services were examined to provide analytical support for environmental management and urban planning. However, some uncertainties and limitations of the study need to be considered. Firstly, although the methods for evaluating ecosystem services and urbanization were widely used in many different regions, the resolution of data and ecological parameters used in this study could cause some uncertainties in the results. Second, this study focused on three regulatory ecosystem services and natural habitat due to actual situation and difficulties in data acquisition, which excluded provisioning services and cultural services. However, given practical constraints and difficulties in data acquisition, we focused on natural habitats and the three key ecosystem services as indicators. In future research, studies should be able to more systematically collect data, carefully treat parameters, and expand the methods shown here to provisioning services and cultural services to better reveal the response of ecosystem services to forms of urbanization in the GBA (and other large urbanizing regions).

5. Conclusions

This study has attempted to analyze the spatiotemporal relationship between urbanization and ecosystem services through correlation and decoupling analysis in the megacity of the GBA. The impact of urbanization processes on ecosystem services is complex in the region, both positively and negatively. Overall, urbanization led to a decline in natural habitat, water retention, soil conservation, and carbon sequestration by 2.6%, 1.1%, 6%, and 3.4%, respectively. The relationship between urbanization and ecosystem services was negatively correlated across the GBA; however, the relationship varied along urban-rural gradients, with the major part of ecosystem service degradation recorded in the early stage of urbanization. Urbanization was not significantly correlated with water retention in rural areas and soil conservation in urban areas. What is more, the global state of decoupling was mainly characterized by weak decoupling from 2000 to 2018, indicating that ecosystem services diminish with urbanization, although the decline rate is less than the growth rate of urbanization. Urban ecosystems play a vital role in maintaining the natural habitat of the region, and is therefore integral to its sustainability. However, the decline in ecosystem services demonstrated that large areas of natural habitat have been lost and the GBA’s development has not realized its sustainable development potential, though the surrounding mountainous areas of GBA were suggested to be delineated as the main ecological defenses.
Though ecosystem services in most parts of the GBA are in a state of degeneration, the situation can be improved by adjusting urban planning. The relationship between urbanization and ecosystem services can be assessed through spatial correlation analysis and the decoupling method; policies can be formulated on the basis of these results to better promote sustainable development. The areas with a strong decoupling state or high-high cluster are in the desirable development state, and should continue this development model. However, for low-low clusters with low levels of both ecosystem services and urbanization, the government should strengthen socioeconomic urbanization while at the same time controlling the expansion of built-up land. What is more, high-low cluster areas with other decoupling states should implement strict land management measures to limit the expansion of built-up land, and ecosystem services should be enhanced through ecological restoration. The aim of this case study has been to contribute to a better understanding of the spatiotemporal relationships between urbanization and ecosystem services, and the case study has provided potentially instructive suggestions for landscape and urban planning in rapidly growing regions.

Author Contributions

Conceptualization, W.W., T.W., and Z.O.; methodology, W.W., Y.L., and Z.O.; software, W.W.; writing—original draft preparation, W.W.; writing—review and editing, T.W., Y.L., S.X., B.H., H.Z., and Z.O.; supervision, Z.O.; project administration, Z.O. and B.H. All authors have read and agreed to the published version of the manuscript.

Funding

This study was funded by the National Natural Science Foundation of China Key Program, grant number 71533005; the National Natural Science Foundation of China Key Program, grant number 71804180; the Chinese Academy of Sciences Strategic Pilot Technology Program (Type A), grant number XDA230301.

Conflicts of Interest

The authors declare no conflict of interest.

References

  1. Allington, G.R.H.; Li, W.; Brown, D.G. Urbanization and environmental policy effects on the future availability of grazing resources on the Mongolian Plateau: Modeling socio-environmental system dynamics. Environ. Sci. Policy 2017, 68, 35–46. [Google Scholar] [CrossRef] [Green Version]
  2. Ye, Y.; Bryan, B.A.; Zhang, J.E.; Connor, J.D.; Chen, L.; Qin, Z.; He, M. Changes in land-use and ecosystem services in the Guangzhou-Foshan Metropolitan Area, China from 1990 to 2010: Implications for sustainability under rapid urbanization. Ecol. Indic. 2018, 93, 930–941. [Google Scholar] [CrossRef]
  3. Yang, S.; Shi, L. Prediction of long-term energy consumption trends under the New National Urbanization Plan in China. J. Clean. Prod. 2017, 166, 1144–1153. [Google Scholar] [CrossRef]
  4. Bloom, D.E.; Canning, D.; Fink, G. Urbanization and the wealth of nations. Science 2008, 319, 772–775. [Google Scholar] [CrossRef] [Green Version]
  5. Grimm, N.B.; Faeth, S.H.; Golubiewski, N.E.; Redman, C.L.; Wu, J.; Bai, X.; Briggs, J.M. Global change and the ecology of cities. Science 2008, 319, 756–760. [Google Scholar] [CrossRef] [Green Version]
  6. Estoque, R.C.; Murayama, Y. Landscape pattern and ecosystem service value changes: Implications for environmental sustainability planning for the rapidly urbanizing summer capital of the Philippines. Landsc. Urban Plan. 2013, 116, 60–72. [Google Scholar] [CrossRef]
  7. Daily, G.C.; Polasky, S.; Goldstein, J.; Kareiva, P.M.; Mooney, H.A.; Pejchar, L.; Ricketts, T.H.; Salzman, J.; Shallenberger, R. Ecosystem services in decision making: Time to deliver. Front. Ecol. Environ. 2009, 7, 21–28. [Google Scholar] [CrossRef] [Green Version]
  8. Wu, J. Landscape sustainability science: Ecosystem services and human well-being in changing landscapes. Landsc. Ecol. 2013, 28, 999–1023. [Google Scholar] [CrossRef]
  9. Costanza, R.; dArge, R.; de Groot, R.; Farber, S.; Grasso, M.; Hannon, B.; Limburg, K.; Naeem, S.; Oneill, R.V.; Paruelo, J.; et al. The value of the world’s ecosystem services and natural capital. Nature 1997, 387, 253–260. [Google Scholar] [CrossRef]
  10. Millennium Ecosystem Assessment. Ecosystems and Human Well-Being: Synthesis; Island Press: Washington, DC, USA, 2005. [Google Scholar]
  11. TEEB. The Economics of Ecosystems and Biodiversity: Ecological and Economic Foundations; Routledge: London, UK; Washington, DC, USA, 2010. [Google Scholar]
  12. Häyhä, T.; Franzese, P.P. Ecosystem services assessment: A review under an ecological-economic and systems perspective. Ecol. Model. 2014, 289, 124–132. [Google Scholar] [CrossRef]
  13. Paula Garcia-Nieto, A.; Geijzendorffer, I.R.; Baro, F.; Roche, P.K.; Bondeau, A.; Cramer, W. Impacts of urbanization around Mediterranean cities: Changes in ecosystem service supply. Ecol. Indic. 2018, 91, 589–606. [Google Scholar] [CrossRef] [Green Version]
  14. Wang, J.; Zhou, W.; Pickett, S.T.A.; Yu, W.; Li, W. A multiscale analysis of urbanization effects on ecosystem services supply in an urban megaregion. Sci. Total Environ. 2019, 662, 824–833. [Google Scholar] [CrossRef] [PubMed]
  15. Mach, M.E.; Martone, R.G.; Chan, K.M.A. Human impacts and ecosystem services: Insufficient research for trade-off evaluation. Ecosyst. Serv. 2015, 16, 112–120. [Google Scholar] [CrossRef]
  16. Amundson, R.; Berhe, A.A.; Hopmans, J.W.; Olson, C.; Sztein, A.E.; Sparks, D.L. Soil and human security in the 21st century. Science 2015, 348, 1261071. [Google Scholar] [CrossRef] [Green Version]
  17. Li, J.; Zhou, Z.X. Natural and human impacts on ecosystem services in Guanzhong–Tianshui economic region of China. Environ. Sci. Pollut. Res. 2016, 23, 6803–6815. [Google Scholar] [CrossRef]
  18. Du, J.; Fu, Q.; Fang, S.; Wu, J.; He, P.; Quan, Z. Effects of rapid urbanization on vegetation cover in the metropolises of China over the last four decades. Ecol. Indic. 2019, 107, 105458. [Google Scholar] [CrossRef]
  19. Fang, C.; Yu, D. China’s New Urbanization; Springer: Berlin, Germany, 2016. [Google Scholar] [CrossRef]
  20. Yu, X. Is environment ‘a city thing’ in China? Rural–urban differences in environmental attitudes. J. Environ. Psychol. 2014, 38, 39–48. [Google Scholar] [CrossRef]
  21. Li, C.; Li, J.; Wu, J. Quantifying the speed, growth modes, and landscape pattern changes of urbanization: A hierarchical patch dynamics approach. Landsc. Ecol. 2013, 28, 1875–1888. [Google Scholar] [CrossRef]
  22. Larondelle, N.; Haase, D. Urban ecosystem services assessment along a rural–urban gradient: A cross-analysis of European cities. Ecol. Indicat. 2013, 29, 179–190. [Google Scholar] [CrossRef]
  23. Wan, L.; Ye, X.; Lee, J.; Lu, X.; Zheng, L.; Wu, K. Effects of urbanization on ecosystem service values in a mineral resource-based city. Habitat Int. 2015, 46, 54–63. [Google Scholar] [CrossRef]
  24. Peng, J.; Liu, Y.; Liu, Z.; Yang, Y. Mapping spatial non-stationarity of human-natural factors associated with agricultural landscape multifunctionality in Beijing–Tianjin–Hebei region, China. Agric. Ecosyst. Environ. 2017, 246, 221–233. [Google Scholar] [CrossRef]
  25. Fang, X.; Fan, Q.; Liao, Z.; Xie, J.; Xu, X.; Fan, S. Spatial-temporal characteristics of the air quality in the Guangdong−Hong Kong−Macau Greater Bay Area of China during 2015–2017. Atmos. Environ. 2019, 210, 14–34. [Google Scholar] [CrossRef]
  26. Xu, Q.; Dong, Y.; Yang, R. Influence of different geographical factors on carbon sink functions in the Pearl River Delta. Sci. Rep. 2017, 7, 6426. [Google Scholar] [CrossRef] [PubMed] [Green Version]
  27. Huang, C.-L.; Vause, J.; Ma, H.-W.; Yu, C.-P. Urban water metabolism efficiency assessment: Integrated analysis of available and virtual water. Sci. Total Environ. 2013, 452–453, 19–27. [Google Scholar] [CrossRef]
  28. Peng, J.; Wang, X.; Liu, Y.; Zhao, Y.; Xu, Z.; Zhao, M.; Qiu, S.; Wu, J. Urbanization impact on the supply-demand budget of ecosystem services: Decoupling analysis. Ecosyst. Serv. 2020, 44, 101139. [Google Scholar] [CrossRef]
  29. Baur, A.H.; Lauf, S.; Förster, M.; Kleinschmit, B. Estimating greenhouse gas emissions of European cities—Modeling emissions with only one spatial and one socioeconomic variable. Sci. Total Environ. 2015, 520, 49–58. [Google Scholar] [CrossRef]
  30. He, C.Y.; Liu, Z.F.; Tian, J.; Ma, Q. Urban expansion dynamics and natural habitat loss in China: A multiscale landscape perspective. Glob. Chang. Biol. 2014, 20, 2886–2902. [Google Scholar] [CrossRef]
  31. Ouyang, Z.; Zheng, H.; Xiao, Y.; Polasky, S.; Liu, J.; Xu, W.; Wang, Q.; Zhang, L.; Xiao, Y.; Rao, E.M.; et al. Improvements in ecosystem services from investments in natural capital. Science 2016, 352, 1455–1459. [Google Scholar] [CrossRef]
  32. Pimentel, D. Soil Erosion: A Food and Environmental Threat. Environ. Dev. Sustain. 2006, 8, 119–137. [Google Scholar] [CrossRef]
  33. Wischmeier, W.H.; Smith, D.D. Predicting Rainfall Erosion Losses: A Guide to Conservation Planning; Department of Agriculture, Science and Education Administration: Washington, DC, USA, 1978.
  34. Piao, S.; Fang, J.; Ciais, P.; Peylin, P.; Huang, Y.; Sitch, S.; Wang, T. The carbon balance of terrestrial ecosystems in China. Nature 2009, 458, 1009–1013. [Google Scholar] [CrossRef]
  35. Potter, C.S.; Randerson, J.T.; Field, C.B.; Matson, P.A.; Vitousek, P.M.; Mooney, H.A.; Klooster, S.A. Terrestrial ecosystem production—A process model-based on global satellite and surface data. Glob. Biogeochem. Cycles 1993, 7, 811–841. [Google Scholar] [CrossRef]
  36. Myers, S.S.; Gaffikin, L.; Golden, C.D.; Ostfeld, R.S.; Redford, K.H.; Ricketts, T.H.; Turner, W.R.; Osofsky, S.A. Human health impacts of ecosystem alteration. Proc. Natl. Acad. Sci. USA 2013, 110, 18753–18760. [Google Scholar] [CrossRef] [PubMed] [Green Version]
  37. Su, S.L.; Xiao, R.; Jiang, Z.L.; Zhang, Y. Characterizing landscape pattern and ecosystem service value changes for urbanization impacts at an eco-regional scale. Appl. Geogr. 2012, 34, 295–305. [Google Scholar] [CrossRef]
  38. Zhou, Z.X.; Li, J.; Zhang, W. Coupled urbanization and agricultural ecosystem services in Guanzhong-Tianshui Economic Zone. Environ. Sci. Pollut. Res. 2016, 23, 15407–15417. [Google Scholar] [CrossRef] [PubMed]
  39. Ma, T. Quantitative responses of satellite-derived night-time light signals to urban depopulation during Chinese New Year. Remote Sens. Lett. 2019, 10, 139–148. [Google Scholar] [CrossRef]
  40. Li, X.; Xu, H.M.; Chen, X.L.; Li, C. Potential of NPP-VIIRS Nighttime Light Imagery for Modeling the Regional Economy of China. Remote Sens. 2013, 5, 3057–3081. [Google Scholar] [CrossRef] [Green Version]
  41. Zhang, Q.; Seto, K.C. Mapping urbanization dynamics at regional and global scales using multi-temporal DMSP/OLS nighttime light data. Remote Sens. Environ. 2011, 115, 2320–2329. [Google Scholar] [CrossRef]
  42. Reddy, C.S.; Manaswini, G.; Satish, K.V.; Singh, S.; Jha, C.S.; Dadhwal, V.K. Conservation priorities of forest ecosystems: Evaluation of deforestation and degradation hotspots using geospatial techniques. Ecol. Eng. 2016, 91, 333–342. [Google Scholar] [CrossRef]
  43. Moran, P.A.P. Notes on continuous stochastic phenomena. Biometrika 1950, 37, 17–23. [Google Scholar] [CrossRef]
  44. Anselin, L.; Rey, S.J. Modern Spatial Econometrics in Practice: A Guide to Geoda, Geodaspace and Pysal; GeoDa Press LLC: Chicago, IL, USA, 2014. [Google Scholar]
  45. Zhang, Y.; Liu, Y.; Zhang, Y.; Liu, Y.; Zhang, G.; Chen, Y. On the spatial relationship between ecosystem services and urbanization: A case study in Wuhan, China. Sci. Total Environ. 2018, 637–638, 780–790. [Google Scholar] [CrossRef]
  46. Hou, Y.; Zhou, S.; Burkhard, B.; Müller, F. Socioeconomic influences on biodiversity, ecosystem services and human well-being: A quantitative application of the DPSIR model in Jiangsu, China. Sci. Total Environ. 2014, 490, 1012–1028. [Google Scholar] [CrossRef] [PubMed]
  47. Macedo, M.N.; DeFries, R.S.; Morton, D.C.; Stickler, C.M.; Galford, G.L.; Shimabukuro, Y.E. Decoupling of deforestation and soy production in the southern Amazon during the late 2000s. Proc. Natl. Acad. Sci. USA 2012, 109, 1341–1346. [Google Scholar] [CrossRef] [Green Version]
  48. Zhou, X.; Zhang, M.; Zhou, M.; Zhou, M. A comparative study on decoupling relationship and influence factors between China’s regional economic development and industrial energy-related carbon emissions. J. Clean. Prod. 2017, 142, 783–800. [Google Scholar] [CrossRef]
  49. OECD. Sustainable Development: Indicators to Measure Decoupling of Environmental Pressure from Economic Growth. Sustain. Dev. SG SD 2002, 1, 2002. [Google Scholar]
  50. Tapio, P. Towards a theory of decoupling: Degrees of decoupling in the EU and the case of road traffic in Finland between 1970 and 2001. Transp. Policy 2005, 12, 137–151. [Google Scholar] [CrossRef] [Green Version]
  51. Du, Q.; Zhou, J.; Pan, T.; Sun, Q.; Wu, M. Relationship of carbon emissions and economic growth in China’s construction industry. J. Clean. Prod. 2019, 220, 99–109. [Google Scholar] [CrossRef]
  52. Chen, J.; Fan, W.; Li, K.; Liu, X.; Song, M. Fitting Chinese cities’ population distributions using remote sensing satellite data. Ecol. Indic. 2019, 98, 327–333. [Google Scholar] [CrossRef]
  53. Ma, T.; Zhou, C.; Pei, T.; Haynie, S.; Fan, J. Responses of Suomi- NPP VIIRS- derived nighttime lights to socioeconomic activity in China’s cities. Remote Sens. Lett. 2014, 5, 165–174. [Google Scholar] [CrossRef]
  54. Wang, L.; Wang, S.; Zhou, Y.; Liu, W.; Hou, Y.; Zhu, J.; Wang, F. Mapping population density in China between 1990 and 2010 using remote sensing. Remote Sens. Environ. 2018, 210, 269–281. [Google Scholar] [CrossRef]
  55. Zhou, Y.; Shan, Y.; Liu, G.; Guan, D. Emissions and low-carbon development in Guangdong-Hong Kong-Macao Greater Bay Area cities and their surroundings. Appl. Energy 2018, 228, 1683–1692. [Google Scholar] [CrossRef] [Green Version]
  56. Hui, E.C.M.; Li, X.; Chen, T.; Lang, W. Deciphering the spatial structure of China’s megacity region: A new bay area—The Guangdong-Hong Kong-Macao Greater Bay Area in the making. Cities 2018, 1, 102168. [Google Scholar] [CrossRef]
  57. Zhou, D.; Tian, Y.; Jiang, G. Spatio-temporal investigation of the interactive relationship between urbanization and ecosystem services: Case study of the Jingjinji urban agglomeration, China. Ecol. Indic. 2018, 95, 152–164. [Google Scholar] [CrossRef]
  58. Hu, M.; Li, Z.; Yuan, M.; Fan, C.; Xia, B. Spatial differentiation of ecological security and differentiated management of ecological conservation in the Pearl River Delta, China. Ecol. Indic. 2019, 104, 439–448. [Google Scholar] [CrossRef]
  59. Deal, R.L.; Cochran, B.; LaRocco, G. Bundling of ecosystem services to increase forestland value and enhance sustainable forest management. For. Policy Econom. 2012, 17, 69–76. [Google Scholar] [CrossRef]
  60. Ottelin, J.; Heinonen, J.; Junnila, S. Carbon and material footprints of a welfare state: Why and how governments should enhance green investments. Environ. Sci. Policy 2018, 86, 1–10. [Google Scholar] [CrossRef]
  61. Tian, Y.; Jim, C.Y.; Tao, Y.; Shi, T. Landscape ecological assessment of green space fragmentation in Hong Kong. Urban For. Urban Green. 2011, 10, 79–86. [Google Scholar] [CrossRef]
Figure 1. The conceptual and methodological framework for our analysis.
Sustainability 12 06675 g001
Figure 2. Land use and land cover types (LULC) of the Greater Bay Area (GBA) in 2018.
Sustainability 12 06675 g002
Figure 3. Spatial distribution and the difference between 1990 and 2015 of natural habitat (NH) (a), soil conservation (SC) (b), water retention (WR) (c), carbon sequestration (CS) (d) in the GBA.
Sustainability 12 06675 g003
Figure 4. Spatial distribution patterns of GDP and population (POP) intensity in GBA for the years 2000, 2010, and 2018.
Sustainability 12 06675 g004
Figure 5. Urbanization index of GBA in 2000 (a), 2010 (b), and 2018 (c), and the urban-rural gradient map (d).
Sustainability 12 06675 g005
Figure 6. Bivariate LISA cluster map results for natural habitat/three regulating ecosystem services and urbanization for the years 2000, 2010, and 2018.
Sustainability 12 06675 g006
Figure 7. The decoupling state between urbanization and ecosystem services in the GBA (including urbanization and natural habitat (a), urbanization and water retention (b), urbanization and soil conservation (c), urbanization and carbon sequestration (d).
Sustainability 12 06675 g007
Table 1. The classification of the decoupling states by the Tapio model.
StatesIndicators
Δ E S i E S i 0 Δ U U 0 Decoupling Elasticity
Strong decoupling<0>0DE < 0
Weak decoupling>0>00 < DE < 0.8
Expansive coupling>0>00.8 < DE <1.2
Expansive negative decoupling>0>0DE > 1.2
Table 2. Moran’s I values for the relationships of natural habitat and ecosystem services with urbanization in 2000, 2010, and 2018.
Ecosystem Services200020102018
Natural habitat−0.362−0.528−0.446
Water retention−0.28−0.352−0.341
Soil conservation−0.074−0.222−0.12
Carbon sequestration−0.429−0.552−0.475
Table 3. Spearman correlation coefficients of natural habitat and ecosystem services with urbanization in urban and rural areas for 2000, 2010, and 2018.
Ecosystem Services200020102018
UrbanRuralUrbanRuralUrbanRural
Natural habitat−0.093−0.647 **−0.413 **−0.708 **−0.071−0.689 **
Water retention−0.647 **0.046−0.855 **0.008−0.594 **−0.103 *
Soil conservation−0.007−0.439 **−0.299 **−0.501 **−0.024−0.486 **
Carbon sequestration−0.215 *−0.592 **−0.479 **−0.684 **−0.221 **−0.653 **
Note: * indicates significance at the 5% level, ** indicates significance at the 1% level.
Table 4. Decoupling results of natural habitat and ecosystem services with urbanization from 2000 to 2015.
StatesNatural HabitatWater RetentionSoil ConservationCarbon Sequestration
NumberProportionNumberProportionNumberProportionNumberProportion
Strong decoupling9918%6913%14226%17532%
Weak decoupling41675%43378%38870%29954%
Expansive coupling153%132%81%132%
Expansive negative decoupling224%377%143%6512%

